generational perspectives in teen and older drivers on ... · generational perspectives in teen and...
TRANSCRIPT

Generational Perspectives In Teen and Older Drivers On Traffic Safety In Rural And Urban Communities
Michael P. Manser, Ph.D.Director, HumanFIRST Program
ITS InstituteUniversity of Minnesota
Mick RakauskasNic Ward
Toward Zero DeathsQuarterly Meeting
July 8, 2009

US fatal crashes (2003) per capita as a function of age and sex (US DOT, 2003).

Background
● Data indicate that traffic safety is a major public health issue within the United States, especially for rural areas.
● The treatment of this public health issue must focus on the driver, given that most crashes are the result of driver impairment or high-risk driving behavior (Evans, 1991).
● By examining crash risk factors it may then be possible to develop human-centered and culturally sensitive programs to improve traffic safety in both urban and rural America.
● A first step in the process is to understand the attitudes and behaviors of age groups and residence groups
● Receptivity of urban and rural drivers to certain types of traffic safety intervention.

Purpose
…to explore the nature of beliefs and attitudes about● risky driving behavior and traffic safety interventions● between urban and rural drivers● as a function of age cohort.
It is expected that this research will further support decisions to guide the development of effective and acceptable safety programs in Minnesota.
General Findings● Crash risk and associated risk factors
are different for each age cohort and areas of residency.
● There are related differences in the perceived effectiveness and acceptance of traffic safety interventions.

Methods: Phase 1, Focus Group
● Qualitatively explore how Minnesota drivers defined what they saw as issues of importance related to driving safety
● Gather information regarding drivers’ views and experiences that could be used in making decisions related to accident reduction.
● Information was sought regarding teen driver, parent, and senior driver perceptions about the suitability and effectiveness of proposed driving safety interventions.
Group Date Location Number Attending Urban Teen 1 10/23/07 South High School, Minneapolis 9 (3 male) 2 10/24/07 South High School, Minneapolis 10 (3 male) Rural Teen 1 08/13/07 Mora High School 12 (8 male) 2 08/15/07 Mora High School 9 (4 male) Urban Parent 1 10/23/07 South High School, Minneapolis 9 (1 male) 2 10/24/07 South High School, Minneapolis 6 (1 male) Rural Parent 1 08/13/07 Mora High School 10 (3 male) 2 08/22/07 Mora High School 10 (1 male) Urban Senior 1 10/29/07 Waite House, Minneapolis 10 (4 male) 2 10/29/07 Waite House, Minneapolis 10 (5 male) Rural Senior 1 08/15/07 Mora High School 13 (5 male) 2 08/22/07 Mora High School 8 (5 male)

Methods: Phase 1 Focus Groups
● Conducted by the Minnesota Survey Research Center● FGs managed in relation to a set script to ensure that a comprehensive set of
information was solicited. ● Scripts covered standard questions and probes for each demographic group. ● Questions and probes related to the perception of each person about the crash
risk and the risk factors that predominate for themselves and their cohort. ● Speculate on types of intervention that may be applied to their cohort to reduce
traffic crashes. ● Interventions were relevant to Minnesota and representative of contemporary
intervention strategies for these demographic groups. ● Presentation on the background and purpose of several safety interventions specific
to their cohort.
Teens Mature Drivers- GDL - License Re-Testing- Smart Technology - Mobility Options

Results: Teen Drivers, General Suggestions
● Require more hours of training / practice● Increase difficulty of written and road tests● Limit number of passengers● Limit volume of radios● Limit nighttime driving (after 9 pm)
● So…teens do have a good sense of what would be good for them.

Results: Teen Drivers, Smart Technology
● Mixed support● Teens favoring this technology thought it:
● could reduce crashes by reducing speed,● increase parent trust,● develop better driving habits in new drivers.
● Negative attitudes included:● perception that technology implied distrust of teens and would restrict freedom.● Opinion that such technology should be applied early (novice phase) or applied
to all drivers.

Results: Teen Drivers, GDL Program
● Familiar with program – not name.● Felt it made them better drivers than without a program.
● However, not sure if any “safer” since only be driving a short period with provisional license.
● Passenger restriction● Teens felt it might result in more teens driving, thereby
increase crash exposure.● Nighttime restriction
● Impediment to working nights.● Uncertainty about extent of parent monitoring.● Classroom instruction perceived as not helpful (and some
instructors as not motivational).

Results: Senior Drivers, General Suggestions
● Educational safety classes● Encourage car pooling● Include testing (e.g., reaction time) in addition to road tests.● Impose restrictions (e.g., limit to certain areas or times) for some seniors.● Improve law enforcement to detect impairment as well as recommend license
testing.

Results: Senior Drivers, Testing
● State responsibility● trained staff
● Needs to be mandatory – not voluntary● Testing should be applied to any driver with difficulty driving – all ages.
● behavior based, not age dependent.● If age dependent, then 70 years.● Concern about prohibitive cost to state and individuals.

Results: Senior Drivers, Mobility
● Urban seniors familiar with services.● “I would quit driving if I had access to this”● Some concerns:
● availability of volunteers● screening of volunteers● setting affordable price● need coverage area larger than 15 miles (especially in
rural areas)

Results: Parents, Safety Intervention
● Teen Driver (Tech)● improve decision making and safe
habits● parent’s voice increase
awareness of mistakes● $300 reasonable● reduce accidents by decreasing
speed● greater awareness to parents of
child’s ability to drive● rural: increased safety by alerting
to crash
● Senior Driver (Mobility)● increase transportation options;
especially those not living on bus route
● provide assistance with carrying packages
● help keep seniors from getting lost● provide social contact (with
volunteer driver)● might encourage giving up license● donating own vehicle could cover
their cost of using program

Methods: Phase 2, Survey
To obtain more specific and quantitative data from drivers in the focus groups about their self-reported ● driving behavior (e.g., licensed years, age, area of residency),● crash risk (e.g., crashes and traffic violations ), ● driving behavior (e.g., DBQ, safety attitudes) ● perception of intervention usability.
● The analysis focused on differences between age cohorts in addition to rural and urban residency.
● Respondents completed the survey prior to participating in the focus groups.● All data were analyzed with a 2 (Age: young, old) x 2 (Residence: rural, urban)
ANOVA with Age and Residence as between-subject factors. Significant results are reported (p < .05).
Cou nt
2 2 2 1 4 3
2 1 2 0 4 1
4 3 4 1 8 4
Teen Dr iver
Elde r ly Drive r
Age
Tot a l
Rura lRes id ent
Urb anRes id ent
Res iden ce
Tot al

Results: Survey
Objective 1: Compare cohort specific perceptions of driving history, crash risk, driving behavior, and risk factors.
Driving History● Teen drivers reported having their license for fewer years than the elderly drivers. ● Rural cohorts reported a higher percentage of driving pickup trucks● The most common vehicle type for all cohorts was a passenger vehicle. ● The most common reported driving frequency for all cohorts was “every day”, with
the exception of the rural elderly drivers that reported less frequent driving (“most days”).
● All cohorts most often reported an annual mileage of 5,000 to 10,000 miles.
Crash Risk● There were no significant differences noted between groups. However, this self-
report measure of crashes could logically pertain only to non-fatal crashes.

Results: Survey
Driving BehaviorMeasured in terms of three driving characteristics (driver errors, driver lapses, driving violations).
● Driver Errors● Main effect for Residence [F(1,80) = 7.86, p = .006] with the urban drivers
reporting significantly more driver errors (M = 13.2) than the rural residents (M = 11.5).
● Driver Lapses● Main effect for Age [F(1,80) = 4.40, p = .039] with the teen drivers reporting
significantly more driver lapses (M = 12.4) than the elderly drivers (M = 11.1).● Age and Residence interaction [F(1,80) = 4.97, p = .028]. The more frequent
reported lapses amongst teen drivers were primarily evident amongst urban residents.

Results: Survey
● Driving Violations● Main effect for Age [F(1,80) = 7.65, p < .001] with the teen drivers reporting
significantly more driving violations (M = 20.2) than the elderly drivers (M = 16.4).
● Main effect for Residence [F(1,80) = 11.97, p = .002] with the urban residents reporting significantly more driving violations (M = 19.8) than the rural residents (M = 16.8).
Resid enc e
Urba n Re s ide n tRural Re siden t
1 4 .0
1 3 .5
1 3 .0
1 2 .5
1 2 .0
1 1 .5
1 1 .0
1 0 .5
1 0 .0
Ag e
T een Driver
Eld e rly Driver
1 0 .8
1 1 .3
1 3 .6
1 1 .2
Results: Survey
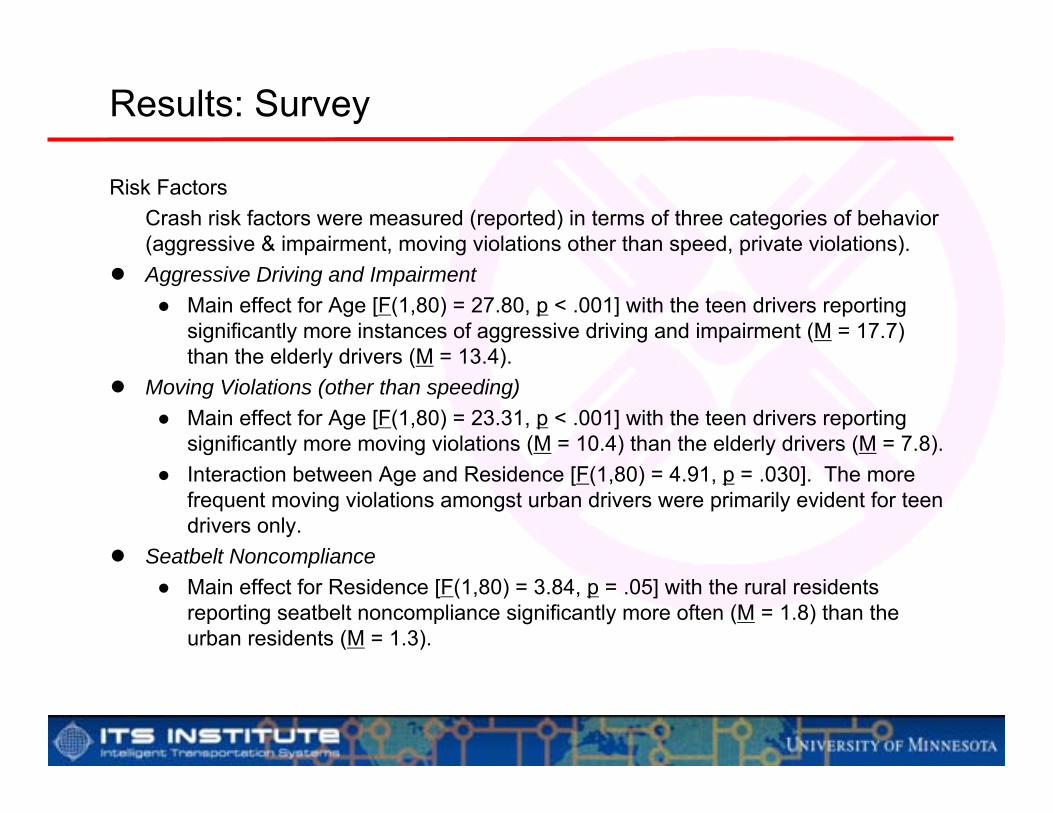
Risk FactorsCrash risk factors were measured (reported) in terms of three categories of behavior (aggressive & impairment, moving violations other than speed, private violations).
● Aggressive Driving and Impairment● Main effect for Age [F(1,80) = 27.80, p < .001] with the teen drivers reporting
significantly more instances of aggressive driving and impairment (M = 17.7) than the elderly drivers (M = 13.4).
● Moving Violations (other than speeding)● Main effect for Age [F(1,80) = 23.31, p < .001] with the teen drivers reporting
significantly more moving violations (M = 10.4) than the elderly drivers (M = 7.8).● Interaction between Age and Residence [F(1,80) = 4.91, p = .030]. The more
frequent moving violations amongst urban drivers were primarily evident for teen drivers only.
● Seatbelt Noncompliance● Main effect for Residence [F(1,80) = 3.84, p = .05] with the rural residents
reporting seatbelt noncompliance significantly more often (M = 1.8) than the urban residents (M = 1.3).

Results: Survey
Objective 2: Describe cohort perceptions of usability for cohort specific safety interventions (enforcement, education, engineering).
Enforcement (involving the instatement and application of laws to dictate safety )● There was a significant main effect for Age [F(1,80) = 21.1, p < .001] with the teen
drivers reporting perceiving enforcement interventions to be significantly less effective (M = 23.9) than the elderly drivers (M = 29.2).
Education (involving training and communication of safety relevant skills and information to develop safer drivers
● There were no significant effects of Age or Residence for the perceived effectiveness of educational safety interventions.
Engineering (the development of roadway infrastructure to guide behavior and minimize the consequences of a crash
● There were no significant effects of Age or Residence for the perceived effectiveness of engineering safety interventions.

Conclusions
A “One Size Fits All” approach may not target the appropriate populations or environments.
Safety interventions that are targeted to specific populations may be better received, result in changes in performance, and impact traffic safety.

We are going to need to think of new solutions