genesdev/2012/ 202184 gardner et al. 1projects.exeter.ac.uk/lampbrush/pdfs/78.pdf · with polysomes...
TRANSCRIPT
GENESDEV/2012/ 202184 Gardner et al. 1
Stable intronic sequence (sis) RNA, a new class of non-coding RNA from the oocyte
nucleus of Xenopus tropicalis
Eugene J. Gardner, 1 Zehra F. Nizami, 1 C. Conover Talbot Jr 2 and Joseph G. Gall 1
1Department of Embryology, Carnegie Institution for Science, Baltimore, MD 21218;
2Institute for Basic Biomedical Sciences, The Johns Hopkins University School of
Medicine, Baltimore, MD 21205.
Corresponding author:
Joseph G. Gall
Department of Embryology
Carnegie Institution for Science
3520 San Martin Drive
Baltimore, MD 21218
Phone: (410) 246-3017
e-mail: [email protected]
Running Title: Stable intronic sequence (sis) RNA
Key words: intron; lampbrush chromosome; non-coding RNA; oocyte; transcription;
Xenopus.
Abbreviations: FPKM, fragments per kilobase per million reads; GV, germinal vesicle;
RNAseq, high-throughput RNA sequencing; rRNA, ribosomal RNA; RT-PCR, reverse
transcription polymerase chain reaction; sis, stable intronic sequence; UTR,
untranslated region
GENESDEV/2012/ 202184 Gardner et al. 2
Abstract
To compare nuclear and cytoplasmic RNA from a single cell type, free of cross-
contamination, we studied the oocyte of the frog Xenopus tropicalis, a giant cell with an
equally giant nucleus. We isolated RNA from manually dissected nuclei and cytoplasm
of mature oocytes and subjected it to deep sequencing. Cytoplasmic mRNA consisted
primarily of spliced exons derived from approximately 6700 annotated genes. Nearly all
of these genes were represented in the nucleus by intronic sequences. However,
unspliced nascent transcripts were not detected. Inhibition of transcription or splicing for
1-2 days had little or no effect on the abundance of nuclear intronic sequences,
demonstrating that they are unusually stable. RT-PCR analysis showed that these
stable intronic sequences are transcribed from the coding strand and that a given intron
can be processed into more than one molecule. Stable intronic sequence RNA (sisRNA)
from the oocyte nucleus constitutes a new class of non-coding RNA. sisRNA is
detectable by RT-PCR in samples of total RNA from embryos up to the mid-blastula
stage, when zygotic transcription begins. Storage of sisRNA in the oocyte nucleus and
its transmission to the developing embryo suggests that it may play important regulatory
roles during oogenesis and/or early embryogenesis.

GENESDEV/2012/ 202184 Gardner et al. 3
Introduction
The majority of genes in higher eukaryotes have one or more introns interspersed within
the coding region. Either during transcription or shortly afterwards the intronic
sequences are removed from the transcript by the splicing machinery (Wahl et al. 2009;
Oesterreich et al. 2010; Vargas et al. 2011; Hoskins and Moore 2012). The majority of
spliced RNAs are rapidly transported to the cytoplasm, whereas the introns are
degraded while still in the nucleus. The primary intronic product of splicing is an intron
lariat, in which the 5’ end of the intron is covalently linked to the splice acceptor site, an
A near the 3’ end of the intron. The lariat can be converted to a linear molecule by the
debranching enzyme (dbr) (Ruskin and Green 1985). Intron degradation can be a rapid
process, requiring only seconds or minutes in the case of yeast and cultured cells
(Sharp et al. 1987; Clement et al. 1999; Oesterreich et al. 2010). Much less is known
about the lifetime of introns in tissues. A few cases of stable introns have been
described (Michaeli et al. 1988; Kopczynski and Muskavitch 1992; Qian et al. 1992;
Yang et al. 2011), although it is generally believed that most introns or intron fragments
are unstable. There are some exceptions, notably the small nucleolar (sno) RNAs,
which are derived by debranching of spliced lariats followed by trimming to produce the
mature molecule (Ooi et al. 1998; Petfalski et al. 1998).
In this study we examined RNA derived from oocytes of the frog Xenopus
tropicalis. We isolated RNA from manually dissected cytoplasmic and nuclear fractions
and subjected it to deep sequencing. Cytoplasmic mRNA consists primarily of spliced
exons, as expected. Surprisingly, the major nuclear RNA derived from these same
genes consists of stable introns or intron fragments. At the read depth of our

GENESDEV/2012/ 202184 Gardner et al. 4
experiments, we do not see reads that cross intron-exon boundaries, as would be
expected for nascent transcripts. The stable intronic sequences are transmitted to the
embryo and persist until at least the blastula stage, when zygotic transcription first
begins. We discuss these findings in relation to the special features of RNA transcription
and storage in the growing oocyte and early embryo.
Results
Pure cytoplasmic and nuclear RNA can be prepared from Xenopus oocytes
Amphibian oocytes offer a unique opportunity to analyze nuclear and cytoplasmic RNA
fractions with minimal cross-contamination. It is well known that the majority of
cytoplasmic RNA consists of the large and small ribosomal RNA (rRNA) subunits and
that much of the mRNA consists of stored polyadenylated sequences not associated
with polysomes (Radford et al. 2008; Richter and Lasko 2011; earlier studies reviewed
in Davidson, 1986). However, the nature of nuclear RNA has not been systematically
investigated. Xenopus laevis was the favored species for earlier studies on RNA, but X.
tropicalis has the advantage that its genome has been sequenced and annotated
(Bowes et al. 2010; Hellsten et al. 2010). Our studies began with mature oocytes of X.
tropicalis, which have a diameter of 800 µm and contain a single, slightly ovoid nucleus,
also called the germinal vesicle (GV), with dimensions of about 300 µm x 400 µm (Fig.
1A). In the ovary the oocytes are surrounded by several layers of follicle cells, the most
internal of which contains about 1000 cells and is tightly bound to the surface of the
oocyte. The follicle layers can be removed completely by treating oocytes with a
solution of collagenase (Simeoni et al. 2012). The GV can be isolated from the oocyte
by making a small tear in the animal hemisphere with jewelers’ forceps and pressing
GENESDEV/2012/ 202184 Gardner et al. 5
gently on the sides of the oocyte (Gall and Wu 2010). In many earlier studies, where the
major objective was to examine the oocyte lampbrush chromosomes, it was important
to prevent gelling of the nucleoplasmic actin (Gall 2006), so that the nuclear contents
could be spread in a single plane for microscopical examination (Fig. 1B-D). Here the
objective was just the opposite, to find an isolation medium in which the nuclear
contents would gel rapidly, but which still allowed clean separation of the GV from the
cytoplasm. By trial and error we found that the standard isolation medium adjusted to
pH 5.6 - 5.8 serves this purpose. In this medium the nuclear contents gel rapidly,
becoming opalescent as viewed by incident illumination, and equally importantly the
nuclear envelope swells away from the gelled nuclear contents (Fig. 1E-G). The
envelope can then be removed with jewelers’ forceps, either intact or in two or three
pieces.
The importance of removing the nuclear envelope first became apparent in the
course of microarray experiments in which we compared the relative abundance of RNA
sequences in cytoplasm and GV samples. In our original samples, prepared from GVs
with intact envelopes, there was essentially no difference between the GV and the
cytoplasm (Supplemental Fig. S1A). In subsequent experiments, in which the envelope
was removed, the GV and cytoplasmic RNA samples showed striking differences
(Supplemental Fig. S1B). The ratio of total cytoplasmic RNA to total GV RNA in an
oocyte is about 500:1 (1 µg vs. 2 ng, based on recovery). We presume that a small
amount of cytoplasm remains tightly associated with the nuclear envelope, even after
extensive washing of the isolated GV. Unless the envelope is removed, this cytoplasmic
contaminant completely overwhelms the genuine nuclear RNA. Preparation of pure

GENESDEV/2012/ 202184 Gardner et al. 6
cytoplasmic RNA presents no problem, because the GV can be removed intact from an
oocyte in a few seconds (Fig. 1A).
It has been known for a long time that the majority of newly transcribed RNA in
late-stage oocytes consists of pre-rRNA, as originally demonstrated by uridine
incorporation experiments (Gall 1966). Moreover, the GV must contain nascent
transcripts derived from numerous protein coding genes, as implied by studies on the
lampbrush chromosomes (Gall et al. 1983; Callan 1986). Nevertheless, it is not known
whether nuclear RNA is rapidly processed and exported, nor which sequences might be
stored. To be sure that we did not miss any sequence class, nuclear or cytoplasmic, we
did not select for poly (A)+ RNA, nor did we initially remove rRNA or its precursors. This
sequencing strategy was wasteful in the sense that most of the sequences were derived
from rRNA and its precursors, but we hoped that we would not lose sequences that had
unexpected characteristics. In our later analyses, we carried out preliminary selection
against rRNA, resulting in considerable increase in read depth, but no change in the
patterns for most genes.
Cytoplasmic mRNA consists primarily of spliced exons
The mature oocyte stores numerous polyadenylated mRNAs, most of which are not
loaded on polysomes and therefore are not being translated. Many of these mRNAs are
stored for later use during embryogenesis. A recent deep sequencing study of X.
tropicalis oocyte RNA identified transcripts from approximately 11,000 genes, differing
widely in relative abundance from only a few transcripts per oocyte to many thousands
(Simeoni et al. 2012). The read depth in our cytoplasmic samples was lower, primarily
GENESDEV/2012/ 202184 Gardner et al. 7
because rRNA was not removed before sequencing, and consequently we identified
somewhat fewer transcripts (5000 – 7000 depending on the read depth of the sample).
We examined the cytoplasmic expression profiles for many of the more highly
transcribed genes. Typical examples, nasp (histone H1-binding protein) and ccne1
(cyclin E1), are shown in Figs. 2 and 3 respectively. The most obvious feature is that the
transcript is represented almost entirely by exonic sequences. The exon-intron
boundaries are sharp because the sequence reads are continuous across the entire
mRNA, and the number of reads at the ends of the 5’ and 3’ untranslated regions
(UTRs) tapers off, because ends of molecules are systematically under-represented
when RNA is fragmented and size-selected before amplification and sequencing. The
number of reads within the exons of a given gene also varies, although the patterns are
similar between independent experiments. Such variation is commonly seen in deep
sequencing data and presumably represents systematic bias at various stages of library
production, sequencing, or sequence alignment.
For comparison of relative abundance between samples, we calculated the
number of fragments per kilobase of exonic sequence per million reads mapped
(FPKM)(Mortazavi et al. 2008). We use the designation FPKMexon to emphasize the
exonic origin of the sequences. We analyzed all genes for which there was an FPKMexon
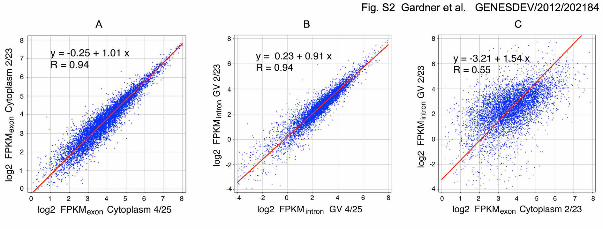
score greater than 0 (Supplemental information). Supplemental Fig. S2A compares
FPKMexon values for 6675 expressed genes from two samples of cytoplasmic RNA from
mature oocytes. FPKMexon values were highly correlated between the two samples (R =
0.94). These samples were prepared from different animals, and all steps of sample
preparation and sequencing were carried out independently.

GENESDEV/2012/ 202184 Gardner et al. 8
GV RNA contains intronic sequences derived from the majority of transcribed genes
The most striking feature of GV RNA is the presence of intronic sequences and the
nearly complete absence of exonic sequences. For many expressed genes, the nuclear
and cytoplasmic patterns are more or less complementary, the peaks in one
corresponding to valleys in the other. This pattern is obvious when one examines
randomly chosen genes with high cytoplasmic representation, such as nasp (Fig. 2) or
ccne1 (Fig. 3). Some introns are represented by single peaks that do not extend all the
way to the exon borders, whereas other introns display multiple independent peaks.
These patterns are less striking for genes with lower levels of transcription, but most
expressed genes have only exonic sequences in the cytoplasm and intronic in the
nucleus. It is noteworthy that the intronic sequences in the nucleus do not cross
intron/exon borders. Because the intronic sequences in the nucleus are not
accompanied by exonic sequences and do not overlap intron/exon junctions, they do
not represent parts of unspliced transcripts.
To make more quantitative comparisons of nuclear sequences, we could not use
FPKM as usually defined, because it is calculated relative to exonic sequence length.
Instead, we used a comparable normalization metric, FPKMintron to describe the
abundance of nuclear sequences. We first prepared an annotation file for all introns in
the genome, which allowed us to display introns in the genome browser (Fig. 2) and to
calculate the abundance of intronic sequence reads (details in Material and Methods).
FPKMintron is defined as fragments per kilobase of intronic sequence per million reads
mapped.

GENESDEV/2012/ 202184 Gardner et al. 9
For initial analysis, we examined all of the 6675 transcribed genes identified in
the cytoplasmic samples. Of these, 6166 (92.4%) have detectable intronic sequences in
the nuclear samples, allowing the calculation of FPKMintron values for almost all
transcribed genes. Just like FPKMexon values, FPKMintron values are highly correlated
between independent samples, attesting to the reproducibility of the sequencing results
(R = 0.94, Supplemental Fig. S2B). Because intronic nuclear sequences exist for almost
all transcribed genes, the most parsimonious hypothesis is that they result from
processing of primary transcripts. If this is true, then one might expect a correlation
between the abundance of intronic and exonic sequences for the same gene. This
correlation is shown in Supplemental Figure S2C for the transcribed genes that have
FPKMintron values in the nucleus. The correlation is positive with a slope of 1.54, but the
spread of values is high (R = 0.55).
Any factor that affects the relative stability of intronic and exonic sequences of
specific genes will tend to lower the overall correlation between nuclear and cytoplasmic
FPKMs. Later we demonstrate that intronic sequences in the oocyte nucleus are
unusually stable, but nevertheless are much less stable than exonic sequences from the
same genes. Variations in the relative stability of intronic and exonic sequences could
account for much of the scatter in Supplemental Figure S2C. In addition there are
computational artifacts that affect the determination of FPKMintron that do not affect
FPKMexon. For instance, some genes have one or more snoRNAs derived from their
introns; snoRNAs often reach very high levels in the nucleus, giving rise to an unusually
high FPKMintron / FPKMexon ratio. Short introns (< 200 bp) do not have mapped reads, at
least in part because the sequencing protocol used in these experiments did not include
GENESDEV/2012/ 202184 Gardner et al. 10
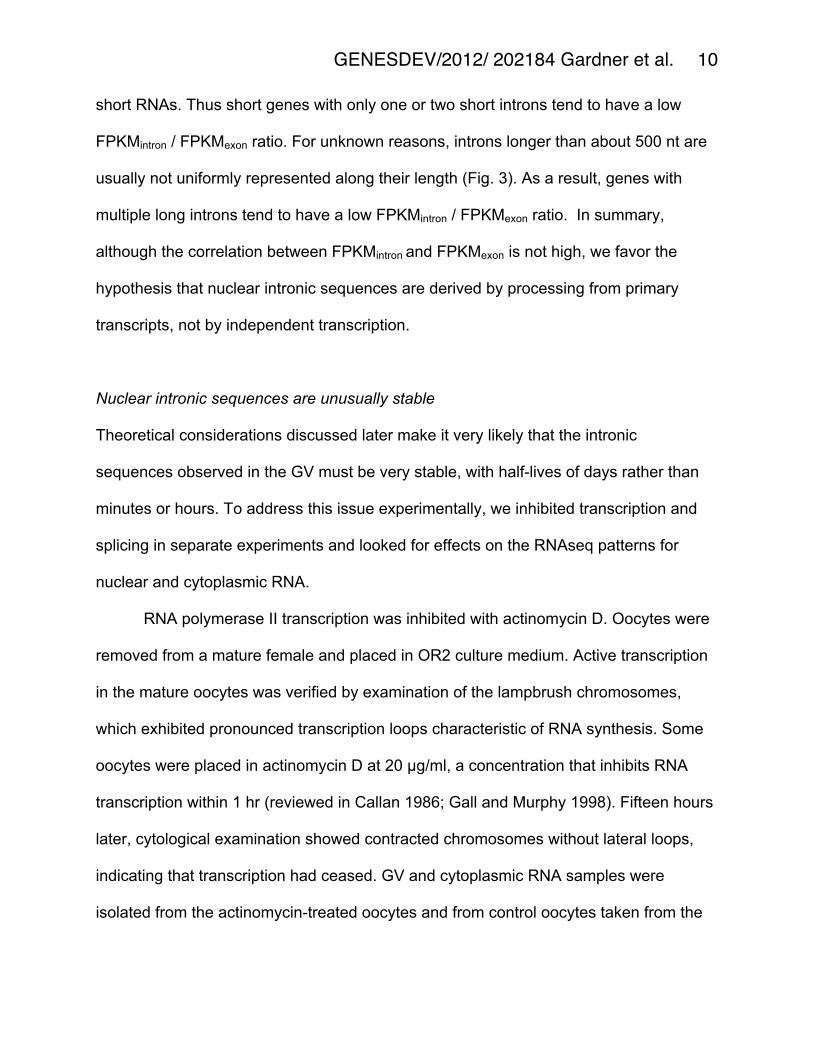
short RNAs. Thus short genes with only one or two short introns tend to have a low
FPKMintron / FPKMexon ratio. For unknown reasons, introns longer than about 500 nt are
usually not uniformly represented along their length (Fig. 3). As a result, genes with
multiple long introns tend to have a low FPKMintron / FPKMexon ratio. In summary,
although the correlation between FPKMintron and FPKMexon is not high, we favor the
hypothesis that nuclear intronic sequences are derived by processing from primary
transcripts, not by independent transcription.
Nuclear intronic sequences are unusually stable
Theoretical considerations discussed later make it very likely that the intronic
sequences observed in the GV must be very stable, with half-lives of days rather than
minutes or hours. To address this issue experimentally, we inhibited transcription and
splicing in separate experiments and looked for effects on the RNAseq patterns for
nuclear and cytoplasmic RNA.
RNA polymerase II transcription was inhibited with actinomycin D. Oocytes were
removed from a mature female and placed in OR2 culture medium. Active transcription
in the mature oocytes was verified by examination of the lampbrush chromosomes,
which exhibited pronounced transcription loops characteristic of RNA synthesis. Some
oocytes were placed in actinomycin D at 20 µg/ml, a concentration that inhibits RNA
transcription within 1 hr (reviewed in Callan 1986; Gall and Murphy 1998). Fifteen hours
later, cytological examination showed contracted chromosomes without lateral loops,
indicating that transcription had ceased. GV and cytoplasmic RNA samples were
isolated from the actinomycin-treated oocytes and from control oocytes taken from the

GENESDEV/2012/ 202184 Gardner et al. 11
same female. The RNAseq data sets obtained from actinomycin-treated oocytes were
very similar to those of the controls, both qualitatively (Fig. 3, top four rows) and
quantitatively (Supplemental Fig. S3A, B). We conclude, therefore, that transcripts seen
in the GV and cytoplasm are stable for a minimum of about 12-14 hrs.
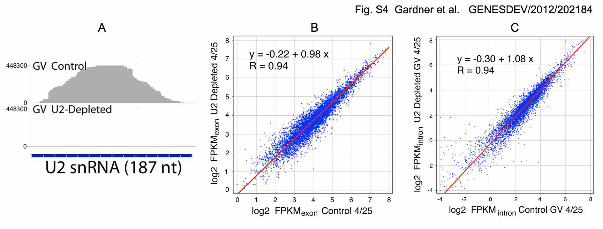
Splicing was examined by depleting oocytes of the essential splicing factor U2
snRNA. Earlier experiments showed that Xenopus oocytes can be depleted of U2 by
injecting a specific antisense deoxyoligonucleotide (Pan and Prives 1988). The snRNA
is reduced to less than 1% of its original amount within 10-30 min and remains at this
level for at least 48 hr (Tsvetkov et al. 1992). Under these conditions splicing does not
occur and the normally abundant U2 snRNA is not detectable on the lampbrush
chromosome loops by in situ hybridization. However, transcription continues for several
days (Tsvetkov et al. 1992).
We injected 250 oocytes with a deoxyoligonucleotide against U2 snRNA and a
comparable number with water. Approximately 36-48 hr later we isolated 150 GVs from
both the experimental and water-injected oocytes and prepared RNA for sequencing. At
the same time we isolated cytoplasmic RNA from both samples. After RNAseq we
compared the abundance of U2 snRNA in the two GV samples. In GVs from oligo-
injected oocytes, U2 snRNA was reduced to approximately 1% of its original value,
demonstrating that the treatment was successful (Supplemental Fig. S4A). Aside from
this specific effect of oligonucleotide injection on U2 snRNA, control and injected
samples were essentially identical. Individual genes showed the same patterns of GV
and cytoplasmic sequences as the controls (Fig. 3, bottom four rows). Furthermore, the
relative abundances of sequences in the experimental and control samples were very
GENESDEV/2012/ 202184 Gardner et al. 12
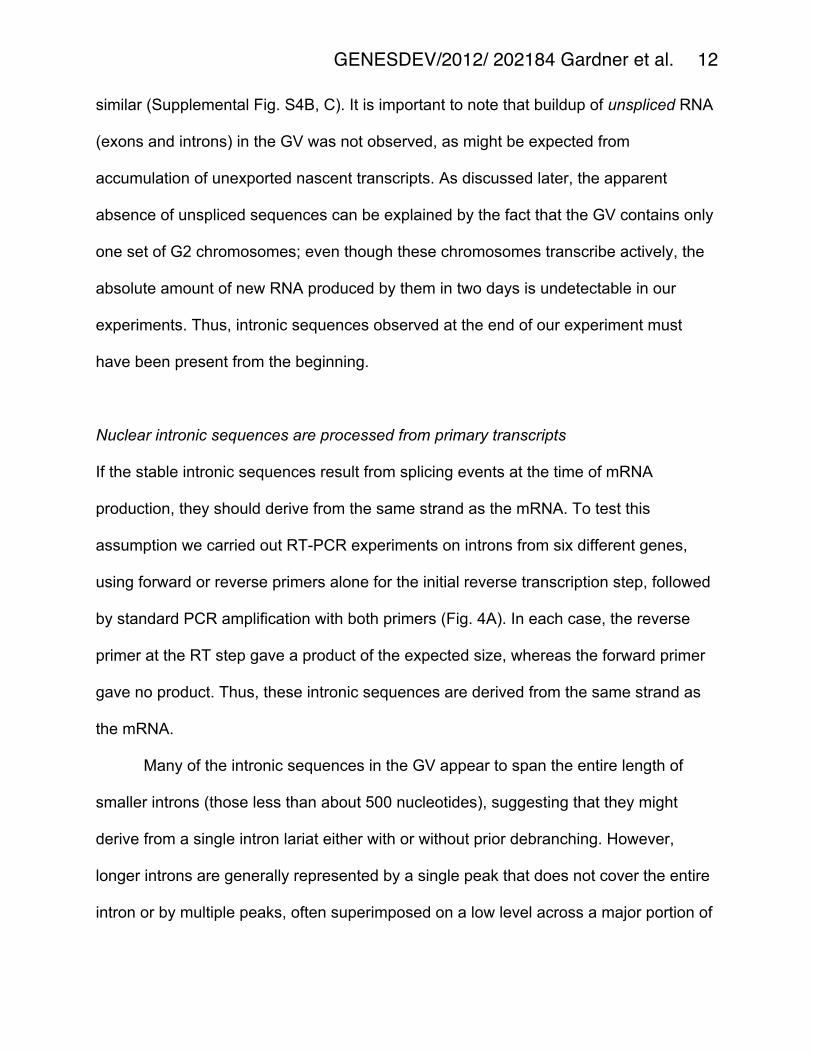
similar (Supplemental Fig. S4B, C). It is important to note that buildup of unspliced RNA
(exons and introns) in the GV was not observed, as might be expected from
accumulation of unexported nascent transcripts. As discussed later, the apparent
absence of unspliced sequences can be explained by the fact that the GV contains only
one set of G2 chromosomes; even though these chromosomes transcribe actively, the
absolute amount of new RNA produced by them in two days is undetectable in our
experiments. Thus, intronic sequences observed at the end of our experiment must
have been present from the beginning.
Nuclear intronic sequences are processed from primary transcripts
If the stable intronic sequences result from splicing events at the time of mRNA
production, they should derive from the same strand as the mRNA. To test this
assumption we carried out RT-PCR experiments on introns from six different genes,
using forward or reverse primers alone for the initial reverse transcription step, followed
by standard PCR amplification with both primers (Fig. 4A). In each case, the reverse
primer at the RT step gave a product of the expected size, whereas the forward primer
gave no product. Thus, these intronic sequences are derived from the same strand as
the mRNA.
Many of the intronic sequences in the GV appear to span the entire length of
smaller introns (those less than about 500 nucleotides), suggesting that they might
derive from a single intron lariat either with or without prior debranching. However,
longer introns are generally represented by a single peak that does not cover the entire
intron or by multiple peaks, often superimposed on a low level across a major portion of

GENESDEV/2012/ 202184 Gardner et al. 13
the intron (e.g., Figs. 3 - 5). We carried out RT-PCR experiments to examine the peaks
from a few selected genes. First, we examined four cases of single peaks that span
most of an intron (Fig. 4B). Although in these examples there are few or no reads that
map to the exon-intron junctions, it was important to verify experimentally that the stored
intronic sequences are not part of unspliced transcripts. In each case RT-PCR
demonstrates that the intronic sequences are not connected to adjacent exonic
sequences. Although these experiments do not formally demonstrate that the stable
intronic sequences are derived by splicing and subsequent processing of introns from
primary transcripts, the data are consistent with that hypothesis.
We also tested whether multiple peaks within an intron represent independent
molecules, as opposed to sequencing or mapping artifacts. First, we asked whether
peaks and valleys could result from the way repeated sequences are mapped by the
alignment program (Supplemental Information). Our analysis suggests that repeated
sequences do complicate interpretation of the regions in which they occur, but they do
not account for the majority of peaks and valleys (Supplemental Figure S5). We also
examined multiple peaks experimentally by asking whether two adjacent peaks in the
same intron were part of the same molecule or represented independent fragments
(Fig. 5). We could amplify sequences within a peak by RT-PCR, but could not amplify a
sequence that extended from one peak to the next. At least for the two examples that
we analyzed, the intronic sequences were derived by a process that leads to
independent fragments within a single intron.
Nuclear intronic sequences are less stable than cytoplasmic mRNA

GENESDEV/2012/ 202184 Gardner et al. 14
Because introns and exons are formed in equimolar amounts (and the oocyte is a
closed system), the relative abundance of introns and exons in whole oocytes should be
a measure of their relative stabilities. We first tried to determine relative abundance by
examining RNA derived from intact oocytes (cytoplasm + GV). However, when such
RNA was sequenced and displayed on the browser, it appeared almost identical to
cytoplasmic RNA (Fig. 6, top two rows). In other words, for a given gene the abundance
of intronic sequences in the GV is too low relative to the abundance of exonic
sequences in the cytoplasm to be detectable at the read depth of our experiments.
Fortunately, certain very abundant RNAs that are limited to the GV can be detected in
RNA from whole oocytes. These include various non-coding RNAs, such as snoRNAs,
7SK RNA, and RNase P RNA, as well as a number of unannotated sequences. In
principle, one can measure their abundance relative to exons in the whole oocyte
sample (Fig. 6, top row) and then measure their abundance relative to introns from the
same gene in the GV sample (Fig. 6, third and fourth rows). From these two estimates
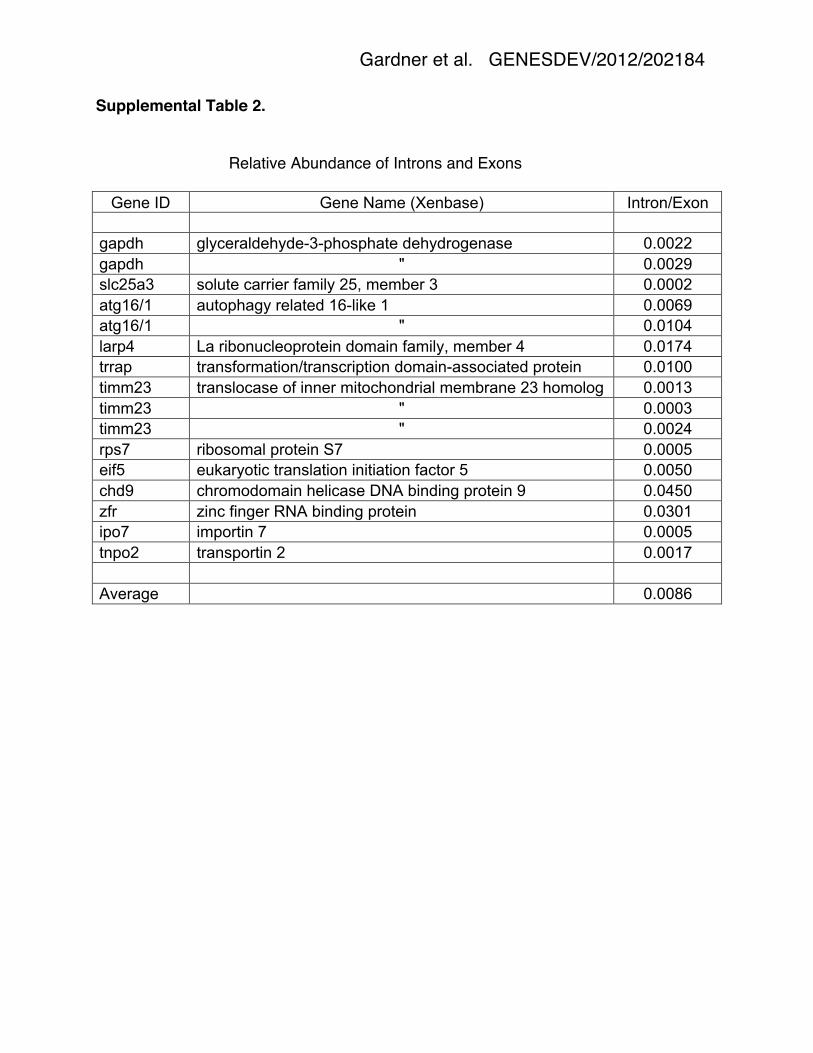
one can calculate the ratio of introns to exons for a given gene. The calculated molar
ratio of GV introns to cytoplasmic exons for 12 genes in the mature oocyte was 0.86%
(range: 0.02% – 4.50%) (Fig. 6 and Supplemental Table 2). Two features emerge from
these numbers. First, intronic sequences in the nucleus are roughly two orders of
magnitude less abundant and therefore less stable than their corresponding exons in
the cytoplasm. Exceptions include a few cases like the snoRNAs, which can be as
abundant as the exonic sequences of the genes in which they occur. Second, the
relative stability of introns to exons varies widely from gene to gene. Some of this
variability is due to the difficulty of measuring the abundance of intronic sequences for a

GENESDEV/2012/ 202184 Gardner et al. 15
given gene. In addition there are undoubtedly real differences in stability of various
mRNAs in the cytoplasm and their corresponding introns in the nucleus.
Intronic sequences are stable during maturation and early cleavage stages
To determine whether the intronic sequences detected in GVs from mature oocytes
persist through oocyte maturation and early development, we sequenced RNA from
three developmental stages: oocytes treated with progesterone to induce GV
breakdown, 4-8 cell embryos, and mid-blastulae (at which time zygotic transcription
begins in Xenopus). The RNA profiles from these three samples were essentially
identical to each other and to total RNA from mature oocytes (Supplemental Fig. S6).
As expected, intronic sequences were not in general detectable in these samples on the
genome browser, although snoRNAs and other highly abundant nuclear RNAs could be
seen. We therefore designed primers to look for individual introns by RT-PCR, choosing
genes whose transcripts are abundant in the mature oocyte. We could easily detect
introns in total RNA from progesterone treated oocytes (after GV breakdown), 4-8 cell
embryos, and blastulae (Fig. 7). Because there is no transcription during early cleavage
stages of Xenopus (reviewed in Davidson 1986), we conclude that introns detectable up
to the blastula stage must be derived from the stable introns produced by the oocyte.
Discussion
The major finding of this study is that the GV of X. tropicalis stores stable intronic
sequences derived from a majority of its transcribed genes. We refer to these as
“intronic sequences” rather than introns, because the stored sequences can be

GENESDEV/2012/ 202184 Gardner et al. 16
considerably shorter than the entire intron from which they are derived. A few specific
examples of stable intronic sequences have been described before (Michaeli et al.
1988; Kopczynski and Muskavitch 1992; Qian et al. 1992; Yang et al. 2011), but these
have been considered exceptional. To our knowledge, stable intronic sequences
derived from a majority of the transcribed genes in the genome have not been
previously described. These sequences from the oocyte nucleus constitute a previously
undetected class of non-coding RNA, for which we propose the name stable intronic
sequence (sis) RNA.
Stability of sisRNA in the GV was tested by treating oocytes with actinomycin D
to inhibit transcription, or with an antisense deoxyoligonucleotide to inhibit splicing.
Because both treatments prevent the generation of new introns by splicing, the
existence of intronic sequences at the end of the experiment implies that these
sequences are stable for at least one or two days. For technical reasons we could not
examine total nuclear RNA from developmental stages after GV breakdown.
Nevertheless, we could amplify intronic sequences from selected genes by RT-PCR in
RNA samples from progesterone treated oocytes (after GV breakdown), 4-8 cell
embryos, and blastulae. It is probable, therefore, that sisRNA from the mature oocyte
persists during the early stages of embryonic development, at least until zygotic
transcription begins at the blastula stage.
Although sisRNA sequences are almost certainly generated by processing from
primary transcripts, they occur at a low molar ratio compared to their cognate exons, on
the order of 1%. Experimentally this feature is evident from examination of RNA from
intact oocytes; that is, oocytes from which the GV has not been removed. An intact
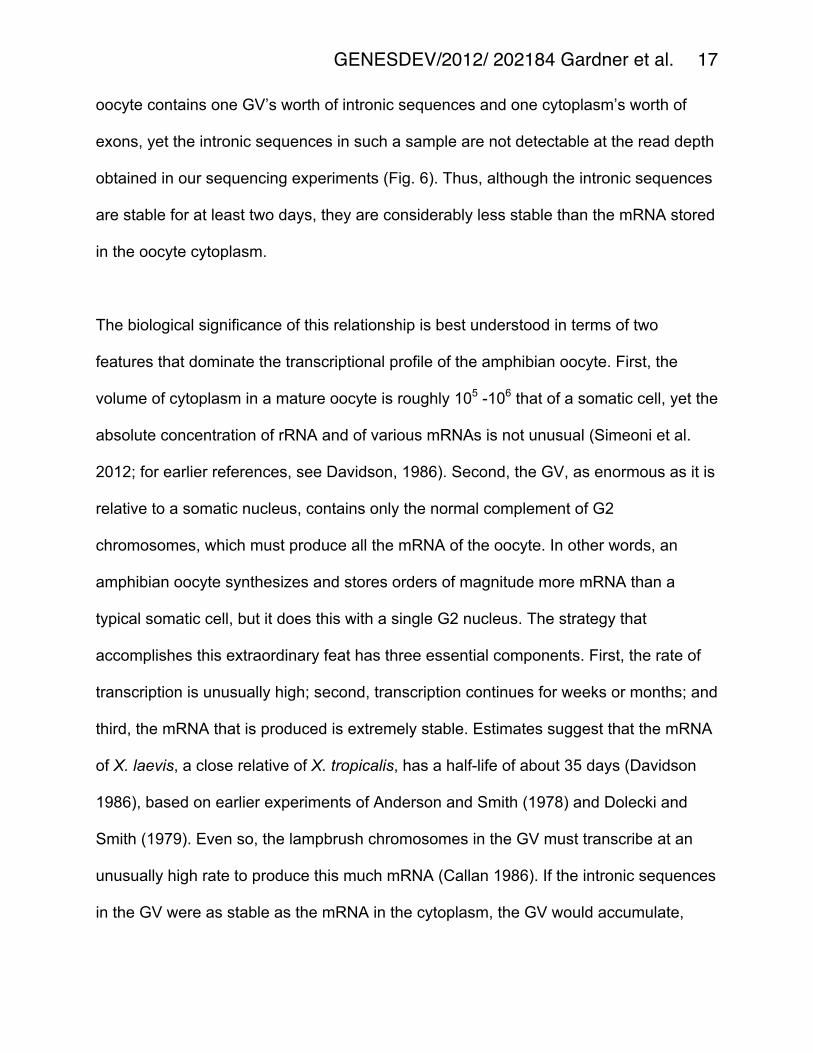
GENESDEV/2012/ 202184 Gardner et al. 17
oocyte contains one GV’s worth of intronic sequences and one cytoplasm’s worth of
exons, yet the intronic sequences in such a sample are not detectable at the read depth
obtained in our sequencing experiments (Fig. 6). Thus, although the intronic sequences
are stable for at least two days, they are considerably less stable than the mRNA stored
in the oocyte cytoplasm.
The biological significance of this relationship is best understood in terms of two
features that dominate the transcriptional profile of the amphibian oocyte. First, the
volume of cytoplasm in a mature oocyte is roughly 105 -106 that of a somatic cell, yet the
absolute concentration of rRNA and of various mRNAs is not unusual (Simeoni et al.
2012; for earlier references, see Davidson, 1986). Second, the GV, as enormous as it is
relative to a somatic nucleus, contains only the normal complement of G2
chromosomes, which must produce all the mRNA of the oocyte. In other words, an
amphibian oocyte synthesizes and stores orders of magnitude more mRNA than a
typical somatic cell, but it does this with a single G2 nucleus. The strategy that
accomplishes this extraordinary feat has three essential components. First, the rate of
transcription is unusually high; second, transcription continues for weeks or months; and
third, the mRNA that is produced is extremely stable. Estimates suggest that the mRNA
of X. laevis, a close relative of X. tropicalis, has a half-life of about 35 days (Davidson
1986), based on earlier experiments of Anderson and Smith (1978) and Dolecki and
Smith (1979). Even so, the lampbrush chromosomes in the GV must transcribe at an
unusually high rate to produce this much mRNA (Callan 1986). If the intronic sequences
in the GV were as stable as the mRNA in the cytoplasm, the GV would accumulate,

GENESDEV/2012/ 202184 Gardner et al. 18
over the long period of oogenesis, 105 to 106 more introns than exist at steady state in a
typical somatic nucleus. Thus, even though the molar ratio of nuclear intronic
sequences to cytoplasmic exons is only about 1%, the absolute number of intronic
sequences in the GV is very large.
Introns were discovered 35 years ago (Berget et al. 1977; Chow et al. 1977), and
since then much has been learned about the molecular biology of splicing (Hoskins and
Moore 2012) and the importance of introns for alternative splicing and the generation of
protein diversity (Black 2003). The evolutionary origin and significance of introns has
also been extensively studied (Rodriguez-Trelles et al. 2006; William Roy and Gilbert
2006). In addition, some introns are known to be precursors of specific molecules, of
which snoRNAs and scaRNA are well-studied examples (Maxwell and Fournier 1995;
Kiss et al. 2010). But intronic sequences in general are thought to degrade rapidly after
splicing from the primary transcript, and so there has been little reason to suppose that
they play significant biological roles. The discovery of sisRNA in the oocyte nucleus now
brings that assumption into question and raises a number of new issues. Certain
questions can be addressed fairly directly, based on existing techniques. How are
sisRNAs processed from the primary transcripts? Are they formed by a specific
trimming mechanism after conventional lariat formation and debranching? When and
where do these processes occur in the nucleus and where are the final sisRNAs
stored? Are sisRNAs associated with specific proteins? The Xenopus oocyte, with its
abundance of sisRNA, offers a useful system in which to examine these specific
molecular issues.

GENESDEV/2012/ 202184 Gardner et al. 19
A bigger challenge will be to determine the biological function(s) of sisRNAs. Do
they play a major role during oogenesis, or are they synthesized and stored in the GV
primarily for use during later embryogenesis? Do they occur in other cell types?
Although the ability to obtain pure nuclear and cytoplasmic RNA fractions makes the
Xenopus oocyte unique for molecular studies, the difficulty of doing genetics on frogs is
a serious drawback for functional analysis. We are currently trying to identify sisRNAs in
Drosophila, where the wealth of genetic tools would make the search for biological
function more feasible. Because the oocyte nucleus of Drosophila is transcriptionally
silent, sisRNAs, if they exist, are likely to be derived from the nurse cells. Despite the
technical challenges, it should be possible to enrich for RNA from nurse cell nuclei and
determine whether the Drosophila oocyte, like that of Xenopus, stores sisRNAs and
transmits them to the embryo.
Materials and Methods
Animals and oocytes
Adult female Xenopus tropicalis were purchased from Xenopus 1 (Dexter, MI). Animals
were anesthetized with 0.15 % tricaine methane sulfonate and one or both ovaries were
removed surgically. Pieces of ovary were placed in OR2 medium (Wallace et al. 1973)
at room temperature, where the oocytes maintain normal morphology and biochemical
properties for several days. For removal of follicle cells, oocytes were treated with
collagenase (Liberase, Roche Applied Science) with gentle swirling in plastic culture
dishes for 2-3 hours (Simeoni et al. 2012) . The absence of follicle cells was verified by
staining oocytes with DAPI (4',6-diamidino-2-phenylindole) at 1 µg/ml and examining at

GENESDEV/2012/ 202184 Gardner et al. 20
low magnification with a fluorescence microscope (10X objective). Transcription was
inhibited by incubating pieces of ovary in actinomycin D (20 µg/ml) in OR2 medium.
Splicing was inhibited by injecting individual oocytes with a single-stranded
deoxyoligonucleotide complementary to part of the U2 snRNA molecule (Tsvetkov et al.
1992).
Preparation of nuclear and cytoplasmic fractions
We routinely recover ~1 µg of total RNA per oocyte using standard RNA extraction
procedures on batches of 10-50 mature X. tropicalis oocytes (whole or enucleated).
Using similar conditions on batches of 200-1,000 isolated GVs, we recover 2.1 ng of
RNA per GV (average of ten experiments). Because the cytoplasm contains roughly
500 times as much RNA as the GV, even a small amount of cytoplasm adherent to the
nuclear envelope seriously compromises the purity of a nuclear RNA sample. For this
reason we developed a manual technique for removing the nuclear envelope without
losing the contents of the GV. Using jewelers’ forceps we isolate GVs in an isotonic
saline solution at pH 5.6-5.8 (83 mM KCl, 17 mM NaCl, 6.0 mM Na2HPO4, 4.0 mM
KH2PO4, 1 mM MgCl2, 1.0 mM dithiothreitol, adjusted to pH 5.6-5.8 with HCl). At this pH
the nuclear contents begin to gel within seconds after isolation from the oocyte.
Simultaneously, the nuclear envelope swells away from the gelled contents (Fig. 1E-G).
The envelope can be removed easily with jewelers’ forceps, especially because it
adheres to the tips of the forceps. GV contents are collected in batches of 10-20 and
transferred to a small vial containing 10 mM sodium citrate, 5 mM EDTA, pH 5.0 for
GENESDEV/2012/ 202184 Gardner et al. 21
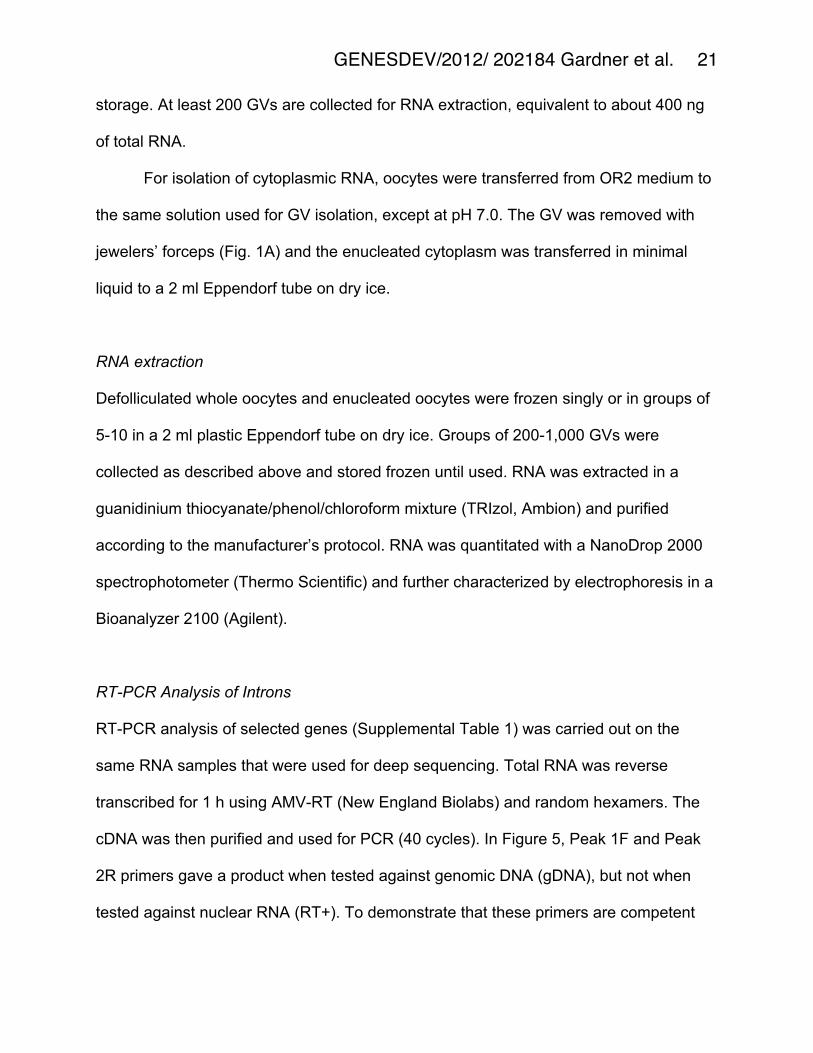
storage. At least 200 GVs are collected for RNA extraction, equivalent to about 400 ng
of total RNA.
For isolation of cytoplasmic RNA, oocytes were transferred from OR2 medium to
the same solution used for GV isolation, except at pH 7.0. The GV was removed with
jewelers’ forceps (Fig. 1A) and the enucleated cytoplasm was transferred in minimal
liquid to a 2 ml Eppendorf tube on dry ice.
RNA extraction
Defolliculated whole oocytes and enucleated oocytes were frozen singly or in groups of
5-10 in a 2 ml plastic Eppendorf tube on dry ice. Groups of 200-1,000 GVs were
collected as described above and stored frozen until used. RNA was extracted in a
guanidinium thiocyanate/phenol/chloroform mixture (TRIzol, Ambion) and purified
according to the manufacturer’s protocol. RNA was quantitated with a NanoDrop 2000
spectrophotometer (Thermo Scientific) and further characterized by electrophoresis in a
Bioanalyzer 2100 (Agilent).
RT-PCR Analysis of Introns
RT-PCR analysis of selected genes (Supplemental Table 1) was carried out on the
same RNA samples that were used for deep sequencing. Total RNA was reverse
transcribed for 1 h using AMV-RT (New England Biolabs) and random hexamers. The
cDNA was then purified and used for PCR (40 cycles). In Figure 5, Peak 1F and Peak
2R primers gave a product when tested against genomic DNA (gDNA), but not when
tested against nuclear RNA (RT+). To demonstrate that these primers are competent
GENESDEV/2012/ 202184 Gardner et al. 22
when tested on RNA, we cloned the region spanning Peak 1F through Peak 2R. We
then made an in vitro RNA transcript from this clone to use as a template in a one-step
RT-PCR reaction (Qiagen), which gave a positive PCR product (lanes marked RNA in
Fig. 5). For determining strand specificity of selected introns, one-step RT-PCR was
used (Qiagen) with a single primer for the reverse transcription step, followed by PCR
with both sets of primers (40 cycles). PCR products were visualized on 1% agarose
gels.
Sequencing and sequence analysis
The RNA was fragmented and a cDNA library was generated by random hexamer
priming following the protocol in the Illumina TruSeq RNA Sample Preparation Guide.
cDNA prepared from GV and cytoplasmic RNA was approximately 200-500 nt in length.
100 bases were read from one end using the Illumina HiSeq 2000 Sequencer. Reads
were aligned to the X. tropicalis genome (assembly version 4.1) using the TopHat
version 1.2.0 and Bowtie version 0.12.7 sequence alignment programs (Langmead et
al. 2009; Trapnell et al. 2009). The Cufflinks program version 0.9.3 (Trapnell et al. 2010)
was then used to generate FPKMexon values for the entire genome. To obtain
comparable data for introns, it was necessary to generate an intronic gene transfer
format (GTF) file for use with Cufflinks. We downloaded exon-intron junction information
from XenBase and generated a GTF file that listed the locations of introns rather than
exons (Figure 2). Since a typical annotation file lists only the exons of a gene, Cufflinks
uses that information to quantify the overall expression levels of the exonic regions
(FPKMexon). However, given an intronic annotation file, Cufflinks will calculate intronic
GENESDEV/2012/ 202184 Gardner et al. 23
expression levels (FPKMintron). We used these FPKMintron values to compare intronic
data from our various sequencing runs. Sequence alignments were examined in the
Integrative Genomics Viewer (IGV) from the Broad Institute (Robinson et al. 2011).
Other analyses, especially pair-wise comparisons of RNA from different samples, were
carried out with the Spotfire DecisionSite 9.1 analysis software (TIBCO).
Microarray analysis
RNA samples were amplified and biotin-labeled according to the Affymetrix
manufacturer’s 3’ IVT Express protocol, hybridized to the Affymetrix GeneChip Xenopus
tropicalis Genome Array, and scanned in the Affymetrix GeneChip Scanner 3000. Data
were extracted and normalized with the Robust Multi-array Average (RMA) in the Partek
Genomics Suite 6.5 (Partek, Inc) and analyzed with the Partek and Spotfire platforms.
Acknowledgments
We thank Nicholas Ingolia for invaluable help with RNA sequencing and computation,
Allison Pinder for extraordinary care in library production and sequencing, and Steven
Ching for technical assistance. Microarray analyses were performed by the Johns
Hopkins Medical Institutions Deep Sequencing & Microarray Core Facility. Research
reported in this publication was supported by the National Institute of General Medical
Sciences of the National Institutes of Health under award number R01 GM33397. The
content is solely the responsibility of the authors and does not necessarily represent the
official views of the National Institutes of Health. JGG is American Cancer Society
Professor of Developmental Genetics.

GENESDEV/2012/ 202184 Gardner et al. 24
References Anderson DM, Smith LD. 1978. Patterns of synthesis and accumulation of
heterogeneous RNA in lampbrush stage oocytes of Xenopus laevis (Daudin).
Dev Biol 67: 274-285.
Berget SM, Moore C, Sharp PA. 1977. Spliced segments at the 5' terminus of
adenovirus 2 late mRNA. Proc Natl Acad Sci USA 74: 3171-3175.
Black DL. 2003. Mechanisms of alternative pre-messenger RNA splicing. Annu Rev
Biochem 72: 291-336.
Bowes JB, Snyder KA, Segerdell E, Jarabek CJ, Azam K, Zorn AM, Vize PD. 2010.
Xenbase: gene expression and improved integration. Nucleic Acids Res 38:
D607-612.
Callan HG. 1986. Lampbrush Chromosomes. Springer-Verlag, Berlin.
Chow LT, Gelinas RE, Broker TR, Roberts RJ. 1977. An amazing sequence
arrangement at the 5' ends of adenovirus 2 messenger RNA. Cell 12: 1-8.
Clement JQ, Qian L, Kaplinsky N, Wilkinson MF. 1999. The stability and fate of a
spliced intron from vertebrate cells. RNA 5: 206-220.
Davidson EH. 1986. Gene Activity in Early Development. Academic Press, Orlando, FL.
Dolecki GJ, Smith LD. 1979. Poly(A)+ RNA metabolism during oogenesis in Xenopus
laevis. Dev Biol 69: 217-236.
Gall JG. 1966. Nuclear RNA of the salamander oocyte. In The Nucleolus - Its Structure
and Function National Cancer Institute Monograph 23 (eds. WS Vincent, OL
Miller, ME Drets, FA Saez), pp. 475-488. National Cancer Institute, Bethesda,
MD.

GENESDEV/2012/ 202184 Gardner et al. 25
Gall JG. 2006. Exporting actin. Nature Cell Biol 8: 205-207.
Gall JG, Diaz MO, Stephenson EC, Mahon KA. 1983. The transcription unit of
lampbrush chromosomes. In Gene Structure and Regulation in Development
(eds. S Subtelny, F Kafatos), pp. 137-146. Alan R. Liss, New York.
Gall JG, Murphy C. 1998. Assembly of lampbrush chromosomes from sperm chromatin.
Mol Biol Cell 9: 733-747.
Gall JG, Wu Z. 2010. Examining the contents of isolated Xenopus germinal vesicles.
Methods 51: 45-51.
Hellsten U, Harland RM, Gilchrist MJ, Hendrix D, Jurka J, Kapitonov V, Ovcharenko I,
Putnam NH, Shu S, Taher L et al. 2010. The genome of the Western clawed frog
Xenopus tropicalis. Science 328: 633-636.
Hoskins AA, Moore MJ. 2012. The spliceosome: a flexible, reversible macromolecular
machine. Trends Biochem Sci 37: 179-188.
Kiss T, Fayet-Lebaron E, Jady BE. 2010. Box H/ACA small ribonucleoproteins. Mol Cell
37: 597-606.
Kopczynski CC, Muskavitch MA. 1992. Introns excised from the Delta primary transcript
are localized near sites of Delta transcription. J Cell Biol 119: 503-512.
Langmead B, Trapnell C, Pop M, Salzberg SL. 2009. Ultrafast and memory-efficient
alignment of short DNA sequences to the human genome. Genome Biol 10: R25.
Macgregor HC. 1962. The behavior of isolated nuclei. Exp Cell Res 26: 520-525.
Maxwell ES, Fournier MJ. 1995. The small nucleolar RNAs. Annu Rev Biochem 35:
897-934.
GENESDEV/2012/ 202184 Gardner et al. 26
Michaeli T, Pan ZQ, Prives C. 1988. An excised SV40 intron accumulates and is stable
in Xenopus laevis oocytes. Genes Dev 2: 1012-1020.
Mortazavi A, Williams BA, McCue K, Schaeffer L, Wold B. 2008. Mapping and
quantifying mammalian transcriptomes by RNA-Seq. Nature Methods 5: 621-628.
Oesterreich FC, Preibisch S, Neugebauer KM. 2010. Global analysis of nascent RNA
reveals transcriptional pausing in terminal exons. Mol Cell 40: 571-581.
Ooi SL, Samarsky DA, Fournier MJ, Boeke JD. 1998. Intronic snoRNA biosynthesis in
Saccharomyces cerevisiae depends on the lariat-debranching enzyme: intron
length effects and activity of a precursor snoRNA. RNA 4: 1096-1110.
Pan Z-Q, Prives C. 1988. Assembly of functional U1 and U2 human-amphibian hybrid
snRNPs in Xenopus laevis oocytes. Science 241: 1328-1331.
Petfalski E, Dandekar T, Henry Y, Tollervey D. 1998. Processing of the precursors to
small nucleolar RNAs and rRNAs requires common components. Mol Cell Biol
18: 1181-1189.
Qian L, Vu MN, Carter M, Wilkinson MF. 1992. A spliced intron accumulates as a lariat
in the nucleus of T cells. Nucleic Acids Res 20: 5345-5350.
Radford HE, Meijer HA, de Moor CH. 2008. Translational control by cytoplasmic
polyadenylation in Xenopus oocytes. Biochim Biophys Acta 1779: 217-229.
Richter JD, Lasko P. 2011. Translational control in oocyte development. Cold Spring
Harbor Perspectives in Biology 3: a002758.
Robinson JT, Thorvaldsdottir H, Winckler W, Guttman M, Lander ES, Getz G, Mesirov
JP. 2011. Integrative genomics viewer. Nature Biotech 29: 24-26.

GENESDEV/2012/ 202184 Gardner et al. 27
Rodriguez-Trelles F, Tarrio R, Ayala FJ. 2006. Origins and evolution of spliceosomal
introns. Annu Rev Genet 40: 47-76.
Ruskin B, Green MR. 1985. An RNA processing activity that debranches RNA lariats.
Science 229: 135-140.
Sharp PA, Konarksa MM, Grabowski PJ, Lamond AI, Marciniak R, Seiler SR. 1987.
Splicing of messenger RNA precursors. Cold Spring Harbor Symp Quant Biol 52:
277-285.
Simeoni I, Gilchrist MJ, Garrett N, Armisen J, Gurdon JB. 2012. Widespread
transcription in an amphibian oocyte relates to its reprogramming activity on
transplanted somatic nuclei. Stem Cells Dev 21: 181-190.
Trapnell C, Pachter L, Salzberg SL. 2009. TopHat: discovering splice junctions with
RNA-Seq. Bioinformatics 25: 1105-1111.
Trapnell C, Williams BA, Pertea G, Mortazavi A, Kwan G, van Baren MJ, Salzberg SL,
Wold BJ, Pachter L. 2010. Transcript assembly and quantification by RNA-Seq
reveals unannotated transcripts and isoform switching during cell differentiation.
Nature Biotech 28: 511-515.
Tsvetkov A, Jantsch M, Wu Z, Murphy C, Gall JG. 1992. Transcription on lampbrush
chromosome loops in the absence of U2 snRNA. Mol Biol Cell 3: 249-261.
Vargas DY, Shah K, Batish M, Levandoski M, Sinha S, Marras SA, Schedl P, Tyagi S.
2011. Single-molecule imaging of transcriptionally coupled and uncoupled
splicing. Cell 147: 1054-1065.
Wahl MC, Will CL, Luhrmann R. 2009. The spliceosome: design principles of a dynamic
RNP machine. Cell 136: 701-718.
GENESDEV/2012/ 202184 Gardner et al. 28
Wallace RA, Jared DW, Dumont JN, Sega MW. 1973. Protein incorporation by isolated
amphibian oocytes: III. Optimum incubation conditions. J Exp Zool 184: 321-333.
William Roy S, Gilbert W. 2006. The evolution of spliceosomal introns: patterns, puzzles
and progress. Nat Rev Genet 7: 211-221.
Yang L, Duff MO, Graveley BR, Carmichael GG, Chen LL. 2011. Genomewide
characterization of non-polyadenylated RNAs. Genome Biol 12: R16.
Figure Legends
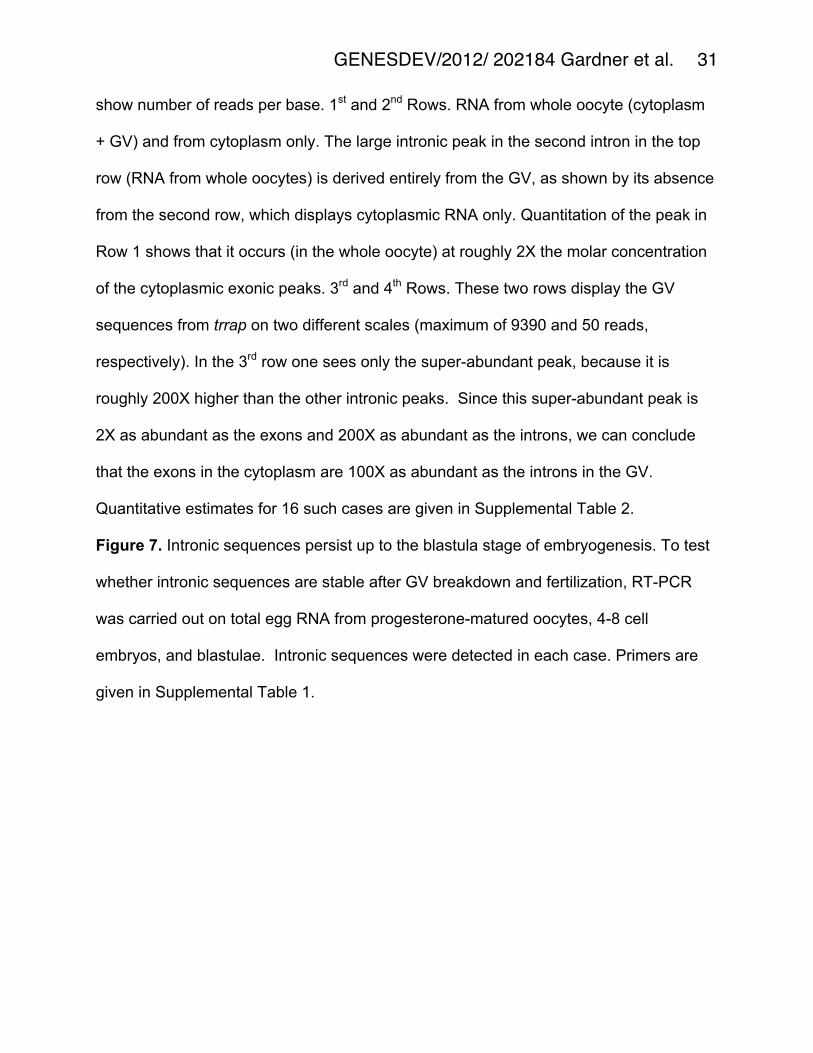
Figure 1. Isolation of nuclear and cytoplasmic fractions from oocytes of X. tropicalis.
(A) A single mature oocyte of X. tropicalis and the GV that was removed from it. (B-D)
Behavior of GVs isolated at pH 7.0. The nuclear contents form a weak gel after the GV
is removed from the oocyte. Such nuclei lose most of their mass, even though the
envelope remains intact (Macgregor 1962). The nuclear envelope can be removed
(arrow in D), but the isolated gel is soft and easily dispersed by pipetting. (E-G)
Behavior of GVs isolated at pH 5.8. Within a few seconds after isolation the GV
becomes opalescent under incident illumination. Then the envelope expands, leaving a
wide space between it and the gelled contents. Note that the GV contents do not
decrease appreciably in volume. After the envelope is removed (arrow in G), the firm
nuclear gel can be pipetted without damage. Bars = 500 µm.
Figure 2. Cytoplasmic and nuclear sequences from a highly expressed gene, nasp
(histone H1-binding protein). The predicted exonic and intronic sequences are shown
just above the gene name. Solid bars with connecting lines represent the annotated
exons (xenTro2). Unconnected solid bars represent introns (see Materials and Methods

GENESDEV/2012/ 202184 Gardner et al. 29
for construction of the intron map). The ordinate shows number of reads per base.
Cytoplasmic sequences in the lower panel appear as typical spliced mRNA. The exon
boundaries are sharp, except for the tapering 5’ and 3’ ends. The peaks and valleys
within the exons presumably reflect systematic biases in library production, sequencing,
or sequence alignments; they are more or less reproducible between independent
samples. Nuclear sequences in the upper panel are predominately intronic in origin.
Conspicuously absent are nascent transcripts, which would be represented by reads
along the entire length of the transcribed region. Note the peaks and valleys in the
introns, which are reproducible between samples. Some may be artifacts of
sequencing, as in the exons, but some of the more prominent peaks probably reflect
separate intronic molecules (see Figs 4 and 5).
Figure 3. Nuclear and cytoplasmic RNA sequences are stable for at least 2 days.
Shown here are patterns for a typical highly expressed gene, ccne1 (cyclin E1). The
ordinates show number of reads per base. (A) Actinomycin D Treatment (first four
rows). Oocytes were held for 15-16 h in control OR2 medium or in actinomycin D (20
µg/ml) to inhibit transcription. The patterns for GV RNA from control and treated oocytes
were essentially identical (1st and 2nd rows). The same was true for cytoplasmic RNA
(3rd and 4th rows). (B) U2 snRNA depletion (lower four rows). Oocytes were injected with
an antisense deoxyoligonucleotide that rapidly destroys U2 snRNA and therefore
inhibits splicing. Control oocytes were injected with water. 36-48 h later, RNA was
isolated from GVs and cytoplasm from injected and control oocytes. The patterns for GV
RNA were similar for control and U2-depleted oocytes (5th and 6th rows). The same was
true for cytoplasmic RNA from control and U2-depleted oocytes (7th and 8th rows).

GENESDEV/2012/ 202184 Gardner et al. 30
Figure 4. Stable intronic sequences are transcribed from the coding strand but are not
part of a nascent transcript. (A) Intronic sequences in GV RNA could be amplified by
RT-PCR only when the RT primer recognized the sense strand. Shown here are the
RT-PCR results from amplifying the sense and antisense strands for six genes (cropped
in each case from the same gel). (B) Intronic sequences could be amplified with two
primers within an intron, but not with one primer in an intron and one in an adjacent
exon. At the top of the figure is shown part of the gene model for calm1 (calmodulin 1)
and the primers used for RT-PCR. The ordinate shows number of reads per base. A
similar intronic peak was examined for three other genes, nasp (histone H1-binding
protein), pcna (proliferating cell nuclear antigen), and aldoc (aldolase C). (The primers
and corresponding introns are given in Supplemental Table 1).
Figure 5. Multiple peaks within a single intron are derived from separate molecules. RT-
PCR primers were designed as shown in the gene models for e2f3 (E2F transcription
factor 3) and gpbp1/1 (GC-rich promoter binding protein 1-like 1). Products were
obtained when both primers were within one intronic peak, but not when one was in one
peak and the other in an adjacent peak. The bands labeled “RNA” are controls to
demonstrate that Peak 1F and Peak 2R primers work when tested on in vitro
transcribed RNA (details in Materials and Methods). Primers are given in Supplemental
Table 1. The ordinates show number of reads per base.
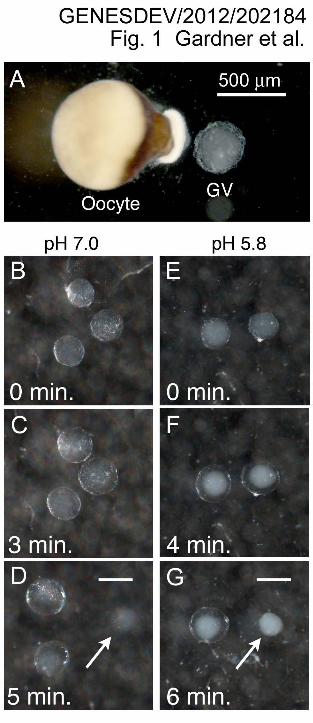
Figure 6. Estimating the relative abundance of cytoplasmic exonic and nuclear intronic
sequences from the same gene. The method depends on having a super-abundant,
strictly nuclear transcript derived from an intron, such as a snoRNA. Shown here is the
5’ end of trrap (transformation/transcription domain-associated protein). The ordinates
GENESDEV/2012/ 202184 Gardner et al. 31
show number of reads per base. 1st and 2nd Rows. RNA from whole oocyte (cytoplasm
+ GV) and from cytoplasm only. The large intronic peak in the second intron in the top
row (RNA from whole oocytes) is derived entirely from the GV, as shown by its absence
from the second row, which displays cytoplasmic RNA only. Quantitation of the peak in
Row 1 shows that it occurs (in the whole oocyte) at roughly 2X the molar concentration
of the cytoplasmic exonic peaks. 3rd and 4th Rows. These two rows display the GV
sequences from trrap on two different scales (maximum of 9390 and 50 reads,
respectively). In the 3rd row one sees only the super-abundant peak, because it is
roughly 200X higher than the other intronic peaks. Since this super-abundant peak is
2X as abundant as the exons and 200X as abundant as the introns, we can conclude
that the exons in the cytoplasm are 100X as abundant as the introns in the GV.
Quantitative estimates for 16 such cases are given in Supplemental Table 2.
Figure 7. Intronic sequences persist up to the blastula stage of embryogenesis. To test
whether intronic sequences are stable after GV breakdown and fertilization, RT-PCR
was carried out on total egg RNA from progesterone-matured oocytes, 4-8 cell
embryos, and blastulae. Intronic sequences were detected in each case. Primers are
given in Supplemental Table 1.


Gardner et al. GENESDEV/2012/202184
Supplemental Table 1
calm1 Intron Number 1
Exon-F GCT GAT CAA CTG ACA GAA GAG CAG
Exon-R TGA AGC TCA GCC TCT GTT GGG T
Intron-F GGC ATG GAA GTT TGT GTC CAG CG
Intron-R TGT AAG CAG CAC TGG AGC AGT GA
pcna Intron Number 1
Exon-F CGA GCG GCA TCA GCT TGC AG
Exon-R AGC ATT GTC TTC TGC CCT CAG AGT
Intron-F GCG CGC AAC CTG GCT TCC C
Intron-R GCC GCA CTG CTG AAG CTT GG
aldoc Intron Number 2
Exon-F AGG GTG ACG AGC GTA TGC AGG A
Exon-R TGG TGC CAG CAA GAG GGA CC
Intron-F ACT TGG ATG GTT GCT TAG CTC CCT
Intron-R CCC CCA GGA CTT TGC AAG CTG T
nasp Intron Number 11
Exon-F ACC CAG TCT GTT GGG GTG ATT GA
Exon-R TGT GGC AGT TGC ATT TTT CTG AGC C
Intron-F TGG TGG TCC TTG TGA TGG TTC CT
Intron-R GCC CAC ATC CCA AAG CTA GAG CA
nxf1 Intron Number 3
Intron-F TCA AGA ACA GGG ATT GCA CTG GGA
Intron-R TCC TGT CCT ACC TAC GCA TGA TGC
atp5a1 Intron Number 6
Intron-F GCT TGG TTC TTG GGT TTA TAA
Intron-R TGT GAA CAG GAC CTT AAA TTG TAA GC
gpbp1|1 Intron Number 4
Exon-F ACT GGG GCG CCT ACA GGA GT
Exon-R AGC TGC TGG TTT AGG GAC CAG A
Peak 1 Intron-F ACG GCG GGC AAA CCT TTC AGA
Peak 1 Intron-R GCC GTC GCA CCG AGT ATG AAG C
Peak 2 Intron-F GCC AAA GCT TTT CAG TGC CCC C
Peak 2 Intron-R AGT AGT CCA CAC ACA AGC CAA CCA
e2f3 Intron Number 3
Exon-F CCC GGT ATG ACA CCT CCC TTG GT
Exon-R TGC CAA GTT GCC TCC ATC ATC AGG
Peak 1 Intron-F TGC TGA TGC ACC ATG CTA ACC AGT G
Peak 1 Intron-R TCT TCA GGT ACA CTC TCC AGA TGG C
Peak 2 Intron-F AAG ATC CCT TAT CCG GAA AAC CCC A
Peak 2 Intron-R GAG GTG CTG GTA TAC CCA CAG GTT A
Gardner et al. GENESDEV/2012/202184
Supplemental Table 2.
Relative Abundance of Introns and Exons
Gene ID Gene Name (Xenbase) Intron/Exon
gapdh glyceraldehyde-3-phosphate dehydrogenase 0.0022 gapdh " 0.0029 slc25a3 solute carrier family 25, member 3 0.0002 atg16/1 autophagy related 16-like 1 0.0069 atg16/1 " 0.0104 larp4 La ribonucleoprotein domain family, member 4 0.0174 trrap transformation/transcription domain-associated protein 0.0100 timm23 translocase of inner mitochondrial membrane 23 homolog 0.0013 timm23 " 0.0003 timm23 " 0.0024 rps7 ribosomal protein S7 0.0005 eif5 eukaryotic translation initiation factor 5 0.0050 chd9 chromodomain helicase DNA binding protein 9 0.0450 zfr zinc finger RNA binding protein 0.0301 ipo7 importin 7 0.0005 tnpo2 transportin 2 0.0017 Average 0.0086

GENESDEV/2012/ 202184 Gardner et al. S
1
Supplemental Information
Criteria for selection of transcripts to be analyzed
For the pairwise comparisons of transcripts in Supplemental Figs. S2 – S4 we used the
following criteria. From the total set of annotated genes in Xenbase (14,554) we
generated a list of all genes in the cytoplasmic samples for which the Cufflinks 0.9.3
program returned an FPKMexon value. Depending on the read depth of the particular
sample, this list contained 5,000 – 7,000 genes (“expressed genes”). We then
compared two cytoplasmic samples against each other, plotting all genes that had
FPKMexon values in both samples (Supplemental Figs. S2A, S3A, and S4B). This
process eliminated only a few genes that had low FPKMexon values in one or the other
sample. For analysis of nuclear RNA samples, we chose the subset of all expressed
genes for which the Cufflinks program returned an FPKMintron value. In three separate
experiments this subset contained 92.4%, 94.1%, and 92.4% of the total expressed
genes. We did not carry out detailed analysis of “unexpressed” genes, even though this
class contained some genes with FPKMintron values.
Reads from repetitive sequences
Because of the way repeated sequences are mapped by the Bowtie program
(Langmead et al. 2009), repeats in the genome can give rise to spurious valleys in the
alignment profile. To test for this possibility we prepared an artificial “genome”
consisting of ten genes for which GV RNA showed prominent intronic peaks and
valleys. These included the eight genes that we used for RT-PCR analysis of intronic
peaks (Figs. 4 and 5; Supplemental Table 1) plus ctsl2 and ccna1. DNA sequences that
GENESDEV/2012/ 202184 Gardner et al. S
2
occur multiple times in the complete genome are likely to occur only once in such an
artificial array. Thus reads will be mapped onto the array that might not map onto the
entire genome. Three of the 10 genes in our array contained sequences to which highly
abundant GV transcripts mapped. A BLAT search for each of these sequences in the X.
tropicalis genome revealed that they ranged from 185 - 202 copies per genome.
Supplemental Fig. S5 shows the patterns for two genes: calm1 (calmodulin 1) that does
not contain repeated sequences and ctsl2 (cathepsin L2) that does. Although the
repeated sequences in ctsl2 clearly complicate the interpretation of the short region in
which they occur, the majority of the peaks and valleys throughout the introns of these
10 genes are not due to problems with alignment of repeated sequences.
Supplemental Figure Legends
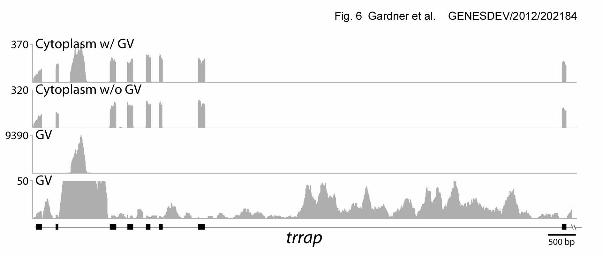
Supplemental Fig. S1. Microarray analysis of RNA from X. tropicalis GVs with and
without the nuclear envelope. The log2 value of the fluorescence signal is given on the
X and Y axes for individual transcripts. A. Comparison of RNA from oocyte cytoplasm
with RNA from GVs that were isolated with the nuclear envelope intact. The two
samples are essentially indistinguishable (R = 0.97). B. Comparison of RNA from oocyte
cytoplasm with RNA from GVs from which the nuclear envelope had been manually
removed. In this case the two samples differ dramatically in the relative abundance of
individual transcripts.
Supplemental Figure S2. Cytoplasmic and nuclear (GV) RNA from mature X. tropicalis
oocytes. (A) Comparison of log2 FPKMexon values for 6675 genes from two
independent samples of cytoplasmic RNA from defolliculated and enucleated oocytes

GENESDEV/2012/ 202184 Gardner et al. S
3
(800 µm diameter). Results are highly reproducible between independent experiments
(R = 0.94). This is the entire population of expressed genes detectable in our
experiments (B) Comparison of log2 FPKMintron values for 6166 genes from two
independent samples of nuclear (GV) RNA from mature oocytes (800 µm diameter). As
with the cytoplasm, results are highly reproducible between experiments (R = 0.94).
This is the subset of expressed genes that have detectable intronic sequences in the
nucleus. (C) Comparison of log2 FPKMexon values with log2 FPKMintron values for
expressed genes that have detectable intronic sequences in the nucleus. The
correlation between cytoplasmic and nuclear values is relatively low (R = 0.55).
Supplemental Figure S3. Inhibition of transcription with actinomycin D has little or no
detectable effect on transcripts in the cytoplasm and nucleus. Oocytes were held for 15-
16 h in control OR2 medium or in actinomycin D (20 µg/ml) to inhibit transcription.
Cytoplasmic and nuclear RNA was then isolated and sequenced. (A) Comparison of
log2 FPKMexon values for cytoplasmic RNA from control and actinomycin-treated
oocytes (R = 0.94). Values for 5549 expressed genes were plotted. (B) Comparison of
log2 FPKMintron values for nuclear (GV) RNA from control and actinomycin D-treated
oocytes for the same set of genes (R = 0.98). Values for 5220 genes were plotted. The
number of genes is lower than in A because not all genes had FPKMintron values in both
samples.
Supplemental Figure S4. Inhibition of splicing for 36-48 hr has little or no detectable
effect on transcripts in the cytoplasm and nucleus. Oocytes were injected with an
antisense deoxyoligonucleotide that causes RNase H-mediated degradation of U2
snRNA within minutes. Control oocytes were injected with water. Cytoplasmic and

GENESDEV/2012/ 202184 Gardner et al. S
4
nuclear RNA was isolated 36-48 hr later and sequenced. (A) Efficient depletion of U2
snRNA is shown by comparing sequence reads from control and oligo-treated oocytes.
U2 snRNA is a super-abundant nuclear transcript. (B) Comparison of log2 FPKMexon
values for cytoplasmic RNA from control and U2-depleted oocytes. Values for 5939
genes are plotted (R = 0.94). (C) Comparison of log2 FPKMintron values for nuclear (GV)
RNA from control and U2-depleted oocytes for the same set of genes. (R = 0.94). The
number of genes plotted (5485) is lower than in B because not all genes had FPKMintron
values in both samples.
Supplemental Figure S5. Mapping highly repeated sequences onto a small subset of
genes. (A) Top two rows. Alignment of GV RNA reads for calm1 (calmodulin 1) to an
artificial “genome” of 10 genes (repeats displayed) and to the entire Xentro2 genome
(repeats not displayed). The alignments are identical. (B) Bottom three rows.
Alignment of GV RNA reads for ctsl2 (cathepsin L2). In the first two rows the reads are
aligned to the artificial genome (repeats displayed) but are shown on two different
scales. In the bottom row the reads are aligned to the entire Xentro2 genome (repeats
not displayed). Repeated sequences that occur in the middle of the largest intron are
expressed in the GV, but not necessarily from this particular gene. See Supplemental
information for details.
Supplemental Figure S6. Transcripts from (A) progesterone-matured oocytes, (B) 4-8
cell embryos and (C) blastulae. In each case deep sequencing was carried out on total
cellular RNA. FPKMexon values were compared to values from whole oocyte RNA
(defolliculated but not enucleated oocytes). A total of 7267, 7629, and 6111 transcripts
were plotted in A, B, and C respectively. The overall similarity of the data for the three

GENESDEV/2012/ 202184 Gardner et al. S
5
time points is consistent with the known stability of mRNA during early developmental
stages of Xenopus (R = 0.93, 0.93, and 0.90 in A, B, and C respectively).
Supplemental Table 1. Eight genes whose intronic sequences were examined by RT-
PCR. The gene names are shown in the first column. The intron examined and specific
primers are given in the second and third columns.
Supplemental Table 2. Estimation of intron/exon ratio. As shown in Fig. 6, some
introns code for highly abundant, strictly nuclear RNAs. These sequences can be
detected in RNA derived from whole oocytes but not in RNA from enucleated oocytes.
They can also be detected in RNA from GVs. These high-abundance nuclear RNAs can
be used to compare the relative abundance of cytoplasmic and nuclear transcripts from
the gene in which they occur. The peak height of the special RNA (S) is first determined
relative to the peak height of adjacent cytoplasmic exons (E) in the whole oocyte
sample (Fig. 6, top row). The peak height of the special RNA (S) is then compared to
the peak height of adjacent intronic sequences (I) in the GV sample (Fig. 6, rows 3 and
4). Because the intronic sequences are variable in amount, the ten highest peaks next
to the special RNA were averaged to give the intronic peak height (I). The ratio of GV
intron to cytoplasmic exon (I/E) was then calculated by multiplying the two fractions (I/S
X S/E). Values of I/E for are given in the table. For gapdh, atg16/1, and timm23, there
were 2, 2, and 3 special RNAs in separate introns, allowing more than one estimate of
the intron/exon ratio.