genetic analysis of ancient human remains from the early
TRANSCRIPT

Grand Valley State UniversityScholarWorks@GVSU
Masters Theses Graduate Research and Creative Practice
8-2014
Genetic Analysis of Ancient Human Remains fromthe Early Bronze Age Cultures of the North PonticSteppe RegionJeff PashnickGrand Valley State University
Follow this and additional works at: http://scholarworks.gvsu.edu/theses
Part of the Biology Commons
This Thesis is brought to you for free and open access by the Graduate Research and Creative Practice at ScholarWorks@GVSU. It has been acceptedfor inclusion in Masters Theses by an authorized administrator of ScholarWorks@GVSU. For more information, please [email protected].
Recommended CitationPashnick, Jeff, "Genetic Analysis of Ancient Human Remains from the Early Bronze Age Cultures of the North Pontic Steppe Region"(2014). Masters Theses. 737.http://scholarworks.gvsu.edu/theses/737
GENETIC ANALYSIS OF ANCIENT HUMAN REMAINS FROM THE EARLY BRONZE
AGE CULTURES OF THE NORTH PONTIC STEPPE REGION
Jeff Pashnick
A Thesis Submitted to the Graduate Faculty of
GRAND VALLEY STATE UNIVERSITY
In
Partial Fulfillment of the Requirements
For the Degree of
Master of Science
Cell and Molecular Biology Department
August, 2014

3
Acknowledgements
I would like to thank anyone who has even remotely helped me during the time I spent
working on this thesis project. First, I would like to thank my graduate advisor, Dr. Alex Nikitin,
and thesis committee, Dr. Rod Morgan and Dr. Agniescka Szarecka, for their guidance and
thoughts through the completion of this degree. I cannot even begin to thank Dr. Ryan Thum,
Jeremy Newton, and Dustin Wcisel for the extensive amount of time they spent training me as a
scientist and on the use of molecular techniques. The next-generation sequencing portion of this
project would not be possible without the help of the University of Michigan sequencing core in
Dr. Bob Lyons and Dr. Jim Cavalcoli and for the learning and experience they both offered, I
extend my sincerest thanks. I would also like to thank David Baisch and Jessica Riley for their
training and help in the lab during the early stages of this project. Finally, a special thanks to
Kayla Joncas for her help in constructing figures and the many Thum lab members who offered
helpful comments on the many iterations of this thesis.

4
Abstract
During the Neolithic transition into the Early Bronze Age (EBA) in the North Pontic
steppe region (NPR), people, cultures, and technologies were rapidly changing. Farming was on
the decline and Indo-European languages were spreading through the region along with
pastoralist way of life. In this study we used mitochondrial DNA (mtDNA) haplotyping to study
the people living in the NPR during these times. Additionally, we used next-generation
sequencing (NGS) technologies in attempts to develop novel methods to assess the degradation
of ancient DNA (aDNA). We extracted ancient mtDNA from remains of 11 individuals
belonging to late Neolithic and EBA populations of the NPR. Using single nucleotide
polymorphisms (SNPs) as markers, we established mtDNA haplogroups of nine out of 11
individuals. Using our data, as well as mtDNA haplogroup frequencies from literature, we
visualized genetic relationships among various Eurasian populations spanning the Mesolithic
through EBA using principal component analysis (PCA). We then examined the changes in
haplogroup frequencies through time using an FST analysis, comparing representatives of the
Yamna (Pit Grave) and Catacomb groups, the main pastoralist EBA cultures of the NPR, and
modern European populations. We found genetic evidence through mtDNA haplogroup
frequencies and PCA linking the Catacomb people to hunter-gatherer populations from northern
Europe and Russia. On the other hand, data on mtDNA haplogroup frequencies of individuals
from the Yamna culture associated them with farming and pastoralist type populations from
southwest and central Europe. An FST analysis of mtDNA haplogroup frequency distribution
showed that the Yamna are most closely related to the Boyko group of ethnic Carpathian
highlanders than to other modern European groups used in the study. The Catacomb people
appeared genetically different from all other population groups in the FST analysis, including the

5
Yamna group, challenging the current understanding of the relationship between the Yamna and
Catacomb populations. Further statistical analysis using an exact test of population
differentiation confirmed genetic differences in mtDNA haplogroup frequencies between Yamna
and Catacomb. The exact test also revealed a lack of genetic differentiation between the Yamna
and the modern Ukrainian population, as well as Lemko, another group of Carpathian
highlanders. Data gathered from the NGS aspect of the study was not informative in its original
design. Modifications to the methods and techniques outlined in our NGS assay could provide
useful information in building a more comprehensive understanding of DNA damage through
time.

6
Table of Contents
Acknowledgements 3
Abstract 4
List of Tables 8
List of Figures 9
Introduction 10
Chapter 1: Mitochondrial DNA (mtDNA) 15
Human mtDNA Haplotypes 16
Methods for aDNA Studies- Single Locus and Multi-locus Studies 18
Population Characterization 20
Cultures of the North Pontic Steppe Region 24
Study Objectives 25
Methods-Haplotyping 26
Sample Collection and Preparation 26
Genetic Analysis 26
Statistics 29
Results 31
Genetics 31
PCA and Population Relatedness 33
FST with Modern European Populations 34
FST and Exact Test of Population Differentiation – Yamna and Catacomb 34
Discussion 35
Genetics of the Yamna and Catacomb Cultures 35
Chapter 2: Next Generation Sequencing 41
Sequencing Methodology 41
Building a Method- NGS for aDNA Authentication 43
Study Objectives 46
Methods- Next-generation Sequencing Technology 46
Results 49
Discussion 50
NGS Technology- Improving aDNA Authentication Protocols 50

7
Table of Contents Continued
Conclusions 53
Literature Cited 55
Table and Figure Captions 61

8
List of Tables
Table 1: Specimen data for individuals in this study 65
Table 2: List of primers used for PCR amplification of HV1 and coding regions of the
mitochondrial DNA 66
Table 3: Pairwise FST values comparing Yamna and Catacomb to modern European human
populations 67
Table 4: Exact Test of Population Differentiation for Yamna and Catacomb against modern
European human populations 66
Table 5: Source data and culture abbreviations for PCA 72

9
List of Figures
Figure 1: Schematic of Human mtDNA Haplogroups 63
Figure 2: Map of Europe with mtDNA Haplogroup Movement and the North Pontic Steppe
Region 64
Figure 3: PCA of Ancient Culture Haplogroup Frequencies 69
Figure 4: L8 Bioanalyzer Output 70
Figure 2: Schematic Example of an IGV and BWA alignment of next-generation sequencing
data to the Actinoplanes reference genome 71

10
Introduction
With the advent of modern molecular technologies for manipulation of DNA, population
genetics has been enhanced with powerful tools to study the human evolutionary past (Nikitin et
al., 2012, Brandt et al., 2013, and Lizaridis et al., 2013). Population genetic analyses, such as
phylogeography, can attempt to answer questions we are no longer able to directly observe.
Maternal DNA lineages, using mitochondrial DNA (mtDNA) single nucleotide polymorphisms
(SNPs) as markers, give insight into the relatedness of people as they populated the Earth
through time (Richards et al., 2006, van Oven and Kayser, 2009). In turn, this information can
help resolve questions about where certain people came from, or how they genetically admixed
with people from a different population. Cultures have already been attributed with the spread of
technologies, such as the spread of language and the domesticated horse, through archaeological
studies (Piazza et al., 1995). DNA sequencing now allows us to study the genetics of the cultures
of people linked to these technologies, learning about the relatedness of these cultures.
Moreover, we are now able to use molecular techniques to directly study the individuals that
lived many thousands of years ago.
While useful for directly studying the genomes of the ancient past, such as constructing
the sequence of a Neanderthal (Homo neanderthalensis), ancient DNA (aDNA) is not without its
difficulties (Green et al., 2010). Without the living cell’s DNA repair mechanisms, other
chemicals in the environment, such as water, have the ability to damage and change the structure
of the DNA (Lindhal, 1993). Ancient DNA is highly damaged and fragmented due to post-
mortem degradation through hydrolysis, existing in fragment sizes typically no larger than 250
base pairs (Adler et al., 2011 and Fu et al., 2013). Damage to aDNA can also occur at each
nucleotide as hydrolytic damage (deamination and fragmentation) and oxidative damage causing

11
cytosine to thymidine (CT) and adenine to guanine (AG) transitions in the DNA sequence
(Lindhal, 1993). This damage effectively changes the natural variation occurring from mutation
in the endogenous DNA sequence.
In addition to aDNA’s fragile state, specimens are almost always contaminated with
modern DNA from archaeologists, bacteria, animals, and many other sources. The presence of
inevitable modern contamination often obscures endogenous aDNA within samples. Thus, there
is a need for an effective method to discriminate between endogenous aDNA from modern
contamination. Conventional aDNA processing techniques have relied on the sequencing of
DNA fragments produced through multiple rounds of handling (amplification, cloning, etc.)
where the difference between contamination and genuine aDNA can become obscured or vanish
altogether.
One of the criteria to determine if an examined DNA molecule is genuine aDNA is to
look for the presence of deaminated cytosines (Skoglund et al., 2014). Deamination, a hydrolytic
reaction, chemically turns cytosine nucleotides into a uracil nucleotide. This modified nucleotide
is then interpreted by DNA polymerase as thymine during downstream DNA amplification and
sequencing. Current literature states that between 20-50% of cytosines in a genuine aDNA
sequence should be deaminated (Fu et al., 2013, Skoglund et al., 2014). To view deamination
rates in a particular aDNA sample, polymerase chain reaction (PCR) fragments are cloned into E.
coli and sequenced to determine where genuine mutation variation (consistent in all reads)
occurs and where deamination occurs (not consistent across all reads) in each of the amplified
fragments of aDNA.

12
The highly degraded state of aDNA requires further procedures outside of deamination
rate alone to authenticate endogenous ancient template DNA from modern contamination. Since
aDNA is also highly fragmented, high sensitivity DNA quality control instruments, such as a
Bioanalyzer (Agilent), can be used to determine the concentrations and fragment lengths of DNA
within a given extraction. Samples which do not contain the expected size range of endogenous
aDNA (<250bp) and are highly skewed to larger DNA fragment sizes may indicate more
contaminant molecules in an extraction. With aDNA samples being inevitably contaminated by
modern DNA, PCR bias also allows further authentication checks through fragment size as
smaller fragments are preferentially amplified in a PCR reaction. Primer design becomes
increasingly important for amplification of your locus of interest in an ancient sample. Due to the
high fragmentation and low concentration of endogenous DNA, small fragment regions (between
60-200bp) are typically targeted (Nikitin et al., 2012). When using primers targeting DNA
regions larger than 250bp, lower rates of successful amplification should be seen with genuine
aDNA template.
Beginning with DNA extraction, ancient samples are typically prepared in a UV
sterilized hood in a location separate from downstream DNA molecular biology to minimize the
risk of modern DNA contamination (Cooper and Poinar, 2000, Adler et al., 2011). In further
downstream applications, being able to replicate results over multiple DNA extractions,
amplification, and sequencing events becomes imperative to the authentication of genuine aDNA
(Cooper and Poinar, 2000). Low copy numbers of endogenous aDNA template molecules as well
as small fragment size existing in a typical aDNA extraction, should mean that a PCR reaction
may not amplify the target molecule in every reaction. Once successfully amplified, cloning is
then required to parse out damaged nucleotide sites from endogenous nucleotide variation in a

13
particular sample (Cooper and Poinar, 2000). Recently, statistical methods using likelihood
analyses have been used to combine authentication checks through post-mortem damage sites as
well as fragment size to parse out modern DNA contamination from endogenous aDNA
(Skoglund et al, 2014). To quantify authentication criteria including deamination rate, fragment
size and modern contamination ratios, aDNA samples are sequenced using DNA sequencing
technologies.
Currently within the field of archaeogenetics there exists two large overarching methods
for directly studying the genetics of our ancient past. With one method, the whole-genome next-
generation sequencing (NGS) approach, genetic studies have gained access to ever increasing
amounts of data in comparison to older DNA sequencing technologies. However, the whole-
genome NGS does not yet have the same power for population comparison across the field as the
older method, sequencing only mitochondrial DNA (mtDNA), does. NGS offers exceedingly
large amounts of data in comparison to older Sanger sequencing methods (Lazaridis et al., 2013,
Brotherton et al., 2013, and Fu et al., 2013). While older capillary methods are limited to one run
of ~800bp per sample, NGS technologies can retrieve DNA sequence from entire genomes with
data of up to 60 gigabases in size (McCormick et al., 2013). Another stark contrast in data
generation between these two technologies is the range across the genome that is possible to be
covered by NGS. Specific targeting of the mtDNA through NGS may be achieved; using NGS to
sequence only the targeted mtDNA genome negates the use for cloning in standard Sanger
sequencing runs. The large amount of sequencing reads for NGS allows all possible mtDNA
fragments to be sequenced in a single run. Furthermore, while Sanger sequencing runs are
limited to one locus at a time per sample run, while NGS on the other hand can obtain DNA
sequence for multiple loci or even the entire genome (Marguiles et al., 2005, McCormick et al.,

14
2013, Eid et al., 2008). Data from other loci across the genome can then be used in population
genetic analyses to more clearly depict gene flow and is not limited to one locus inherited in one
particular fashion. Specific areas within the genome may also be targeted and enriched for
increasing the coverage and amount of data received for a particular locus of interest (Brotherton
et al., 2013). In archaeogenetics, the mitochondria has been studied extensively for population
genetic analyses and a significant amount of data for population comparison through time has
been obtained (Brandt et al., 2013, Brotherton et al., 2013, Nikitin et al., 2012, Malmström et
al., 2009 Hääk et al., 2008).

15
Chapter 1
Mitochondrial DNA (mtDNA)
Due to the degradation of DNA in ancient specimens, mtDNA has been used regularly by
researchers in this field (Bramanti et al., 2009; Mälmstrom et al., 2009, Haak et al., 2005, 2010;
Nikitin et al., 2010, 2012, Brandt et al., 2013). While each cell only contains two copies of
nuclear DNA, each cell may carry multiple hundreds (100-1,000) of mitochondria each
containing an mtDNA genome (Robin and Wang, 1988). Due to these properties, copies of the
mitochondrial genome are more abundant in the cell than the nuclear genome. Human mtDNA is
a maternally inherited, non-recombining, circular DNA sequence 16,569 base pairs (bp) in length
and inherited separately from nuclear DNA (Andrews et al., 1999). Considering these properties
of mtDNA, it becomes a useful molecule for tracking human lineages due to not recombining,
meaning it is not greatly changed from generation to generation (Richards et al., 2000). Mutation
motifs that occur within certain diagnostic regions of the mitochondrial genome are used to
determine maternal lineages of ancient humans in population genetic studies (Richards et al.,
2000 and references therein).
Within the human mitochondria, geneticists use SNP variation to group each individual
into a haplogroup based on the mutation motif in each person’s mitochondrial genome (Andrews
et al., 1999). A combination of the SNPs located with the non-coding control region and the
coding region form the mutation motif of each designated haplogroup (Andrews et al., 1999).
The hypervariable region (HV1) is the non-coding region of the human mitochondrial genome
ranging from base pair 16,000 to base pair 16,569. In the HV1 region, diagnostic mutations are
noted and added to coding region mutations, together used to determine maternal lineage
(Bramanti et al., 2009, Andrews et al., 1999). Mutation motifs are grouped into haplogroups

16
which are used to describe a maternal kinship of the ancient humans tested. There are two
options when denoting mutation motifs for haplotyping when dealing with human genetic
information, the revised Cambridge Reference Sequence (rCRS), and the reconstructed Sapiens
Reference Sequence (rSRS) (Andrews et al., 1999 and Behar et al., 2012). The rCRS belongs to
haplogroup H2 and is more commonly used as the baseline for determining mutations for
haplogroup identification (Andrews et al., 1999). However, H2 is not the mtDNA sequence of
the mitochondrial most recent common ancestor (MRCA), and due to the way in which
mutations occur through time, researchers later constructed the rSRS (Behar et al., 2012). A
human mitochondrial reference genome created with data from 8,000+ genomes, the rSRS
provides increased resolution for haplogroup delimitation (Behar et al., 2012). Since the
haplogroup of the rCRS, H2, is not the ancestral mtDNA sequence of the human MRCA, the
rSRS was constructed to provide such a sequence allowing the quantity of mutations
accumulated through time to be determined from a true ancestral human mtDNA sequence
(Behar et al., 2012). To determine haplogroup calls, mutations are noted along the 16,569bp
human mitochondrial genome, including both control region and coding region mutations. These
mutations are then checked against the rCRS (or rSRS) with each mutation motif belonging to a
specific mitochondrial haplogroup. For example, mutations at base pairs 16224 and 16311 in the
HV1 segment of the mtDNA genome would give a haplogroup from the K clade when compared
using the rCRS (Figure1 and Phylotree.org, mtDNA tree build 16, Feb. 19th
2014).
Human mtDNA Haplotypes
For humans, the MCRA of all maternal lineages coalesces to a lineage in Africa around
200,000 years ago denoted haplogroup L (Walker et al., 1987, Gonder et al., 2006). The L clade
contains seven sub-clades, six of which stayed in Africa and one, L3, which migrated into the

17
Middle East around 70,000 years ago (Gonder et al., 2006). The L3 clade, through mutation and
genetic drift, became the base for all genetic variation in maternal lineage outside of Africa
(Richards et al., 1998). Once out of Africa, L3 split into two major clades, M and N, which, in
turn, branched into the major haplogroups that populated the rest of the world outside of Africa
(Maca-Meyer et al., 2001).
Once diverged from the L clade, carriers of haplogroup N moved into the Middle East
(Torroni et al., 2006). From the major N clade, two major sub-clades diverged in N* and R
(Andrews et al., 1999). In modern European populations, mitochondrial haplogroup H, a division
of the R sub-clade, is the most frequent at around 40% (Brandt et al., 2012 and Brotherton et al.,
2012). Haplogroup U, which also diverged from the R clade, is one of the oldest haplogroups in
Europe (Fu et al., 2013, van Oven and Kayser, 2009). However, while U was prevalent in ancient
Europe (before early Neolithic), modern European populations have a much lower frequency of
U at 11% (Brandt et al., 2012 and Brotherton et al., 2012).
Once diverged from haplogroup L3, the M clade migrated from the Middle East into
southern Asia (Gonzales et al., 2007). The M clade eventually gave raise to most of the Asian
specific lineages including the C, E, G, Q and Z clades (van Oven and Kayser, 2009).
Haplogroups C and Z share a common ancestor, with C originating around Lake Baikal in Russia
around 27,000 years ago (Derenko et al., 2010). While rare in studies concerning ancient
European populations, M clade individuals however have been identified previously in both
modern and ancient populations of eastern and southeastern Europe (Nikitin et al., 2009, 2012;
Newton, 2011; Guba et al., 2011).

18
Methods for aDNA Studies- Single Locus and Multi-locus Studies
While the study of mtDNA nucleotide variation can be essentially viewed as a single-
locus analysis, which limits its scope, not enough characterization has been done with nuclear
loci in aDNA to use for population comparison studies (Brandt et al., 2013, and Brotherton et al.,
2013). Due to copy number and the probability of mtDNA remaining salvageable after thousands
of years of chemical damage, mtDNA might be the only genetic information able to be retrieved
from the majority of ancient specimens (Brandt et al., 2013, Brotherton et al., 2013, Adler et al.,
2011, Cooper and Poinar, 2000). Tracking maternal lineage over paternal lineages (Y
chromosomal markers) is more effective for understanding the migration of populations, as
during ancient time periods maternal lineage movement is more likely associated to population
migration instead of movement associated with war or hunting. Outside of the sex
chromosomes, nuclear loci could give increased individual resolution at genes such as
pigmentation or lactose persistence (Wilde et al., 2014, Burger et al., 2007). However, nuclear
loci become less useful for population studies if insufficient ancient population data is available
to compare different allele frequencies. Nuclear loci in this case would be effective for asking
specific questions regarding an individual or specific population, such as determining if an
ancient pastoralist (shepherd) population exhibited high allele frequencies of lactose persistence.
In addition to its use for addressing different questions, nuclear loci are much less likely to
survive thousands of years of DNA damage. In turn, studies able to sequence the whole genome
of an ancient individual are severely limited (Fu et al. 2013, Keller et al., 2012, Green et al.,
2010). Studying only the maternal inheritance will help the migration resolution over nuclear
loci, directly showing maternal relatedness and movement through time. Genetic data outside of
the mitochondria for ancient populations suffer from a lack of characterization in comparison,

19
and therefore peopling events and sociocultural relatedness information is less likely to have the
same resolution through nuclear loci as it would currently through mtDNA (Brotherton et al.,
2013).
When studying ancient DNA, degradation, damage, and innate modern contamination of
the sample must be dealt with for accurate data analysis (Cooper and Poinar, 2000). Specifically
when working with ancient humans, every person processing the bones from archaeologists to
lab personnel, are possible contamination sources. Authenticating results for aDNA requires
multiple rounds of PCR amplification and cloning checks to determine consistency in the
determined SNP pattern such as haplogroup calls or damage sites (Cooper and Poinar, 2000,
Brandt et al., 2013). To efficiently determine haplogroup calls, an assay commonly used in
human haplogroup assignment, the GenCoRe22 assay (Hääk et al., 2010), checks for
mitochondrial DNA mutations at diagnostic SNPs within the coding region of the mitochondrial
genome (Brandt et al., 2013, Sarkissian, 2012). The combination of strict molecular methods to
determine haplogroup calls, repetitive sequencing and cloning events and molecular assays all
help determine the authenticity of aDNA (Brandt et al., 2013).
Once sufficient mitochondrial data is obtained and authenticated through aDNA
methodology, it can be analyzed to determine haplogroups and their frequencies within the group
studied (Cooper and Poinar, 2000, Brandt et al. 2013, Brotherton et al., 2013). Currently within
the field, there has been a large focus on genetic discontinuity in haplogroup frequencies
between the ancient peoples of Europe and the modern populations of Europe (Nikitin et al.,
2012, Brotherton et al., 2013, Brandt et al., 2013, Wilde et al., 2014). Haplogroup frequencies
can be used to compare among ancient populations and modern European populations as well,
learning the most likely modern ancestors of these directly studied ancient populations

20
(Brotherton et al., 2013, Brandt et al., 2013, Wilde et al., 2014). Multidimensional analyses such
as principal components analysis (PCA) can also use haplotype frequency information or allele
frequencies to determine genetic relatedness among populations or individuals (Brotherton et al.,
2013, Brandt et al., 2013). Using PCA can determine relationships among individuals or cultures
by showing the underlying patterns within the data on a multidimensional scale. Setting up this
analysis in a way to determine the relatedness of cultural groups during ancient time periods to
other cultures existing around the world, could give insight into the mechanisms for the peopling
of Europe across time (Brotherton et al., 2013, Brandt et al., 2013).
Population Characterization
Modern genetic diversity in European populations has shown discontinuity with ancient
populations studied (Brotherton et al., 2013, Brandt et al., 2013). To understand this discrepancy
in haplogroup frequencies between ancient human populations and modern human populations,
population genetic analyses have been used to study ancient populations directly. Population
dynamics of central and southwestern Europe have been characterized by other research in
regards to the cultures living within those regions beginning in the Mesolithic through the Early
Bronze Age (EBA) (Brotherton et al., 2013, Brandt et al., 2013). Prior to the Neolithic, hunter-
gatherer populations across Europe were dominated by haplogroup clade U and its sub-clades
(U4 and U5) (Brandt et al., 2013, Malmström, et al., 2009). However, beginning in the early
Neolithic genetic evidence shows a drastic shift in the frequency of the U haplogroup in
populations across Europe associated with the advancement of farming into central Europe, such
as the Mittelebe-Saale region (Brotherton et al., 2013, Brandt et al., 2013). The Mittelebe-Saale
region, and central Europe as a whole, has been primarily focused on for studies of maternal
lineage discontinuity due to its consistent occupation by people from the Mesolithic through the

21
EBA (Brandt et al., 2013). Important cultures living in the Mittelebe-Saale such as the Bell
Beaker, Linear Pottery, and Corded Ware cultures are associated with the spread of farming
during these time periods (Brandt et al., 2013). Mitochondrial haplogroup H exists in high
frequencies in modern European populations at ~40%, while prior archaeogenetic studies have
shown a much lower frequency of haplogroup H in ancient European populations (Brotherton et
al., 2013, Brandt et al., 2013) except for eastern and southeastern Europe (Nikitin et al. 2010,
2012). By using haplogroups as an indicator of genetic diversity changes across time, we may be
able to understand the mechanism for the large shift in haplogroup frequencies between ancient
populations and modern populations.
During the early Neolithic, cultures such as the Linear Pottery culture (LBK) and its
descendants begin to see a large influx of haplogroup H, a clade typically associated with the
expansion of farming during that time period (Brotherton et al., 2013). Due to genetic diversity
based on FST comparisons with modern European populations, it has been hypothesized that the
genetic variation existing in the modern H haplogroup is due to this influx of H during the
Neolithic (Brotherton et al., 2013). As farming expanded from Anatolia beginning around
12,000 years ago the high frequencies of haplogroup U begin to diminish during the early
Neolithic, transitioning into higher frequencies of N1a, T, and J clades also typically linked with
the expansion of farming from the Anatolia region (Guba et al., 2011, Brandt et al., 2013).
The middle Neolithic in central Europe was mostly comprised of the Funnel Beaker
culture and other smaller cultures associated with the Funnel Beakers in northern central Europe
(Brandt et al., 2013). With frequencies of the H haplogroup on the rise from the influx of farming
populations during the early Neolithic, hunter-gatherer populations are pushed to the outskirts of
suitable farming land (Brandt et al., 2013). Hunter-gatherer haplogroup frequencies, typically
22
high in U (U4, U5) clades, begin having their numbers diminish as farming becomes more
prevalent in central Europe (Brandt et al., 2013). Sub-H haplogroups from the early Neolithic
seem to have become extinct or are at very low frequencies in modern central European
populations (Brotherton et al., 2013). Middle to late Neolithic sub-H groups, however, are much
more common in modern European populations (Brotherton et al., 2013). This could mean that
the majority of the genetic diversity changes happened in the middle to late Neolithic and
possibly into the EBA depending on the region. Based on this change in the genetic variation of
the H haplogroup clade, other research has suggested that the main component in forming the
modern genetic variation of haplogroup H came from the middle to late Neolithic (Brotherton et
al., 2013).
During the late Neolithic and EBA, population dynamics begin to change rapidly across
Europe. The Corded Ware culture (CWC) and the Bell Beaker cultures (BBC) predominate in
central Europe with ever increasing frequencies of haplogroup H (H1 and H3) and other farming
associated haplogroups such as T and J (Brotherton et al., 2013, Brandt et al., 2013). During this
time, further influx of haplogroup H can be seen from the Iberian Peninsula in association with
the Unetice culture complex, a culture in which the CWC and BBC eventually combine to form
(Brotherton et al., 2013, Brandt et al., 2013). The presence of sub-H haplogroups, such as H1 and
H3, have been associated with this influx of people from the Iberian Peninsula into central
Europe during the middle to late Neolithic (Brotherton et al., 2013, Brandt et al., 2013).
Haplogroup frequencies in central Europe become much more similar to modern day European
populations during the Early Bronze Age, with differences in sub-clade frequencies being
attributed to genetic drift and population migrations (Brotherton et al., 2013). However, while
central and southwestern Europe have been extensively characterized through maternal lineages

23
and haplogroup frequencies, southeastern Europe remains understudied (Brotherton et al., 2013,
Brandt et al., 2013).
Two previous studies have researched mtDNA haplotypes of individuals living in
southeastern Europe during the Neolithic and into the Eneolithic, one studying the Neolithic
hunter-gatherer Dnieper-Donets (DD) culture from the North Pontic region (NPR) and the other
studying the Eneolithic farming Trypillian culture from eastern Carpathian Mountains (Nikitin et
al., 2012, Nikitin et al., 2010). The Neolithic DD culture exhibited a rather dissimilar pattern of
mtDNA haplogroup frequencies to central Europe. The DD culture had a higher frequency of
haplogroup H than their Neolithic farming counterparts from central and southwest Europe, but
lacking the H1 and H3 sub-clades commonly seen in central Europe (Brandt et al., 2013). The
high frequencies of H in the DD culture were also accompanied by hunter-gatherer associated U
clade haplotypes, as well as east Eurasian lineages of haplogroup C (Nikitin et al., 2012, Newton,
2011). The Eneolithic Trypillia culture from the region further northwest shows haplogroup H at
high frequency comparable to DD (no H1 or H3 sub-clades), as well as including individuals
with farming associated haplogroups belonging to T and J clades (Nikitin et al., 2010). Notably,
the H clade haplogroups in the Neolithic NPR and Eneolithic Trypillia were not characterized by
the same H1 and H3 sub-clades as were seen in southwestern and central Europe during this
time. Since it remains unclear if southeastern European haplogroup frequencies influenced those
of ancient central Europe, characterizing the populations of southeastern Europe can determine
genetic relationships between these regions. Fitting southeastern Europe into the larger picture of
haplogroup frequency distributions helps to clarify interpopulation genetic relationships as well
as determine the source for the large shift in major haplogroups during the late Neolithic into the
Early Bronze Age (Figure 2).

24
Cultures of the North Pontic Steppe Region
During the transition between the Neolithic (7,500-5,500 years before present (yBP)) and
EBA (EBA, 4,100-3,700 yBP) a cultural and technological shift was taking place throughout
Eurasia. The Holocene Climatic Optimum (HCO), beginning around 10,000 years ago shifted the
climate in Europe to be much warmer and wetter (Schroder et al., 2004). These climate
conditions made farming an effective way of life at areas much further north than previously
possible. At the end of the HCO at around 4,200yBP this unusually warm period began to end
returning climate to a cooler and drier environment (Schroder et al., 2004). Due to this shift in
climate, farming cultures had to move south and southeast from central and northern Europe to
find land that would sustain agriculture such as the North Pontic steppe region of Ukraine (NPR)
(Kalis et al., 2003).
The NPR, located in modern day southern Ukraine was home to an important pastoralist
culture, the Yamna, and to other pastoralist cultures during the Neolithic and EBA (Mallory,
1997). The Yamna (Pit Grave) culture is thought to have been a key component in the spread of
proto-Indo-European language across this steppe region of Ukraine (Piazza et al., 1995) and
beyond. Current archeological research suggests Yamna had been succeeded in the region by a
culture known as Catacomb, based on the burial type used by the culture. It is also becoming
increasingly clear that these cultures coexisted for an extended period of time (Wilde et al.,
2014). The Catacomb people are thought to have borrowed some of the technologies from the
Yamna culture, but it is unclear if they also exchanged genes. Studying the genetics of the people
inhabiting the NPR during the Neolithic and EBA we may be able to see genetic evidence
linking these cultures of the NPR to other cultures around Europe and Eurasia further clarifying
the genetic story of Europe.

25
The current genetic story of Europe excludes southeastern Europe, but is yet it is
hypothesized that Europe has been influenced by haplogroup frequencies from the North Pontic
Steppe region (Brandt et al., 2013, Figure 2). Previous studies into other cultures of the NPR
have shown haplogroup H occurring in individuals at relatively high frequency during the
Neolithic, which has not been seen in central Europe (Newton, 2011, Nikitin et al., 2012). This
previous characterization of the populations of the NPR also showed high frequencies of the
Asian associated haplogroup C (Newton, 2011, Nikitin et al., 2012). Previous research has both
hypothesized and shown evidence for genetic influence on central European populations through
maternal lineages by the cultures existing in southeastern Europe (Nikitin et al., 2012, Nikitin et
al., 2010, Brandt et al., 2013). Genetically characterizing NPR populations could further explain
genetic variation existing in modern European human populations and further refine the view of
the movement of people, cultures, and technologies during the late Neolithic and EBA.
Study Objectives
We extracted ancient human DNA from the Eneolithic and EBA people in the NPR to
better understand population dynamics during the Neolithic through EBA in the steppe region of
Ukraine. The objective of this part of the study was to use mtDNA haplogroups and their
frequencies within the NPR to understand how the late Neolithic and Bronze Age individuals fit
with other populations around Europe that have been studied to date. To analyze mtDNA data we
used principal components analysis (PCA) on haplogroup frequencies of populations within our
geographic area and that of the rest of ancient Europe and Eurasia ultimately showing maternal
lineages and relatedness of the cultures inhabiting the NPR. To understand changes in population
dynamics through time, we used FST and an exact test of population differentiation to test genetic

26
differentiation between our study cultures and between ancient individuals and modern European
populations.
Methods - Haplotyping
Sample Collection and Preparation
Human remains of 11 individuals were gathered from burial mounds (kurgans) in the
North Pontic Region of Ukraine, obtained courtesy of Dr. Svetlana Ivanova, Institute of
Archaeology, Odessa, Ukraine. The remains dated from 5,500yBP to 3,000yBP (Table 1). Of the
11 samples, three individuals belonged to the Catacomb culture, three were from unidentified
Eneolithic culture of the NPR region, three from the Yamna culture, and a final individual from
the KMK culture (Table 1). To minimize risk of contamination prior to DNA extraction, all
surfaces in the extraction lab were UV sterilized for up to 12 hours before extraction began. The
extraction lab is separately located from the rest of the analytical labs as is standard practice
when extracting DNA from ancient bones (Cooper and Poinar, 2000, Adler et al., 2011). Bones
themselves were washed with bleach and UV sterilized on each side for one hour. Bones were
then cut with a dremel tool to remove the outside layers of bone, which are the most exposed to
outside contaminants, inside a laminar flow hood (Adler et al., 2011). Prior to extraction bones
were ground with a sterile, bleached and autoclaved, mortar and pestle to obtain around 500mg
of bone power to use in extraction.
Genetic Analysis
DNA was extracted using a QIAGEN QIAmp DNA Investigator Kit (Qiagen). DNA
from the extract was then eluted in 20µl 18MΩ deionizedH2O. Keeping with aDNA
authentication procedures, each bone was extracted one to four times, depending on the amount

27
of starting tissue (Table 1).To obtain the HV1 region of the mtDNA for haplotyping of each
sample, primers for four overlapping fragments (Nikitin et al., 2012 and Newton, 2011) were
used and polymerase chain reaction (PCR) was run in replicates of three for each fragment to test
low copy number and distinguish ancient DNA from modern contamination (Cooper and Poinar,
2000) (Table 1, Table 2). To overcome small aDNA fragment size (<250bp) we have subdivided
the HV1 region into four fragments with a maximum size of 164bp for one set of primers and a
maximum size of 84bp for another set (Table 2) (Nikitin et al., 2012 and Newton, 2011). For
coding region SNPs, primers designed to flank restriction digest cut sites were used to check
diagnostic SNPs for major clades H (7025) and U/K (12308) (Table 2) (Santos et al., 2004). PCR
reactions to amplify the mtDNA coding and control regions were carried out using a QIAGEN
FastCycling Kit with reaction volumes of 9.1µl H2O, 10µl FastCycling Master Mix, 0.2µl of
10µM forward primer, 0.2 of 10µM reverse primer, and 0.5µL of template DNA. The
thermocycler program was carried out as described in the FastCycling protocol with 50 cycles
due to small amounts of template DNA (QIAGEN). After the original PCR, amplicons of the
HV1 region of the mitochondria were cloned into E. coli (QIAGEN EZ competent cells) for
further replication and damage determination. Much like obtaining DNA sequence for multiple
alleles, only one aDNA template molecule is transformed into a bacterial plasmid. Since only
one copy of the mtDNA template is present in each specimen, any discrepancies between
sequences (such as C in some with T in others) at the same base pair, but not across all sequence
reads from the same locus, can be identified. PCR was then carried out on successful clones,
using T7 and SP6 bacterial primer pairs to amplify target DNA inserted into the E. coli using 30
cycles in the thermocycler based on the Genscript Green Taq protocol. These PCR reactions
were done using 39.75µl H2O, 5µl 10x Green Taq Buffer, 1µl of 2µM DNTPs, 1µl of 10µM T7,

28
1µl of 10µM SP6, 0.25µL of Green Taq and 2µL of template DNA(Genscript). Coding region
SNP checks were directly sequenced, specifically to check for presence or absence of mutations
at site 7028 (diagnostic for haplogroup H) or 12308 (diagnostic for U/K) in the mitochondria.
PCR products were then cleaned using the ExoSap system to prepare for sequencing. Cleaned
PCR products were sequenced using a BigDye terminator sequencing PCR and run on an
ABI3130xl sequencer from Applied Biosystems (Life Technologies). Each sequence was then
base-called using software from Applied Biosystems that is coupled with the sequencer. This
base-calling software uses chromatogram quality information to determine the accuracy of each
base called in the output DNA sequence. Once base called, sequences were edited using the
program Sequencher (GeneCodes Corp. version 4.9).
To determine mutations and denote mtDNA haplogroups, sample sequences were aligned
against the Cambridge Reference Sequence (rCRS), a reference sequence of the entire human
mitochondrial genome, and mutations were determined using the program MEGA (version 5.2,
Tamura et al., 2011). Approximate nucleotide deamination rates and rates of successful
amplifications per fragment were used to determine authenticity of an ancient sample. Cytosine
to Thymidine and Guanine to Adenine deamination damage has been shown to exist in 50% of
the damaged sites of ancient DNA which can be seen through multiple amplification and cloning
events (Lamers et al., 2009, Gilbert et al., 2003). Samples were assigned haplogroups based on
nucleotide mutation motifs on phylotree.org (mtDNA tree build 16, Feb. 19th
2014). The entire
process was repeated three separate times per fragment from different amplifications of the HV1
region and diagnostic control region to determine accuracy of haplogroup determination (Cooper
and Poinar, 2000). In order to show low copy number of aDNA as well as distinguish
contamination from authentic aDNA repeated extractions and amplifications of each fragment is

29
necessary (Cooper and Poinar, 2000). In addition to the standard methods for aDNA
authentication, we also used a Bioanalyzer (Agilent) to determine DNA concentration and
distribution of fragment sizes within a given extraction. Bioanalyzer data was gathered for all
samples in this study excluding R3.7, R3.16 and the first extraction of K1.10. Due to typically
low concentrations of DNA in a genuine aDNA sample, the Bioanalyzer was run using a high
sensitivity assay to distinguish small changes in concentration and fragment size.
Statistics
To obtain genetic relationships among the individuals in this study when compared to the
rest of the ancient world during the Neolithic through EBA, a PCA was run using haplogroup
frequencies of cultures from various published datasets (Table 5). PCA, an Eigen vector based,
multivariate, and non-parametric test that works to show the variance of the individual data
points in an analysis by grouping them depending on the amount of variation explained by the
vectors. The advantage of a PCA in the case of determining relatedness among populations is
that none of the data on phylogenetic sense, geographic location, or relatedness of the individuals
comprising a population influence the analysis. PCAs are known to reveal trends within the data
without any prior knowledge of the data itself, making it an effective analysis for determining
relatedness through grouping in haplogroup frequency analysis of ancient European and Asian
populations (Brandt et al., 2013). Only haplogroup information from studies that followed strict
aDNA protocols with results that make phylogenetic sense were used in the haplogroup
frequencies dataset, such as we would not expect to see African specific lineages of the L clade
in European datasets (Brandt et al., 2013). For a substantial number of populations to compare
our data against, data of cultures haplogroup frequencies from around Europe and Asia from
Brandt et al.2013 were used as well as their PCA methodology (Brandt et al., 2013). Data in our

30
study was also combined with genetic information from the same cultures from Wilde et al.,
2014 as well as two individuals from the NPR Yamna population from Newton, 2011 to increase
sample size thus enhancing the statistical power required for haplogroup frequency analysis.
Combining the individuals studied here with other Yamna and Catacomb individuals from the
Wilde et al. study and Newton, 2011 allowed the exploration of population based analyses. Once
combined with Wilde et al. and Newton, 2011 data, the Yamna population was n=30 with the
Catacomb at n=28. With individuals combined from this study, Wilde et al., 2014 and Newton,
2011, the undetermined Eneolithic culture population had n=13 samples. PCA on population
haplogroup frequency data was performed with the R Statistics Package v3.0.2 with graphical
output generated using the ggplot2 package within R.
To determine genetic affinities with modern European populations, the combined dataset
containing Yamna and Catacomb haplogroup frequencies was compared with modern European
population haplogroup frequencies through a pairwise FST analysis using Arlequin v3.5
(Excoffier and Lischer, 2010). FST, a measure of genetic diversity between subpopulations and
the total population, provide a single number for characterizing genetic diversity to test the
similarity and differences among populations based on allele frequency data (heterozygosity).
The closer an FST value is to zero, the more genetically similar two subpopulations are, and a
value closer to one, the more genetically different those subpopulations are. FST calculations were
completed with 100 permutations to determine the significance of the differences between the
cultures. Modern European population haplogroup frequency data was obtained from the
literature for this comparison (Nikitin et al., 2009 and references therein) (Table 3). Data from
this thesis was combined with Yamna and Catacomb individuals from Wilde et al., 2014 as well
as, two individuals from the Yamna group included in Newton, 2011, for the ancient populations

31
in both the PCA and FST analyses. Modern European population data was gathered from the
literature (Nikitin et al., 2009 and references therein) (Table 3).
Following the pairwise FST, an exact test of population differentiation was run to correct
for the small sample size of the ancient population data. The exact test was run using the same
Yamna, Catacomb, and modern European population haplogroup frequencies data from the FST
analysis using Arlequin v3.5 (Excoffier and Lischer, 2010, Raymond and Roussett, 1995, Nikitin
et al., 2009 and references therein). An exact test of population differentiation was chosen to
more clearly interpret the genetic relatedness of the Yamna and Catacomb populations given
their small combined sample size from this study, Wilde et al. 2014, and Newton, 2011
(Raymond and Roussett, 1995 and Waples, 1998). The exact test of population differentiation
tests the hypothesis of panmixia, meaning that a significant p-value (<0.05) indicates population
differentiation (Raymond and Roussett, 1995). In the case of small sample size and populations
with high gene flow, the exact test of population differentiation can be an effective test for
determining population differentiation (Waples, 1998). The exact test was run through a Markov
chain method with 10,000 Markov chain permutations (Raymond and Roussett, 1995).
Results
Genetics
Of the eleven human remains tested for mtDNA haplogrouping, nine were able to be
repeated and verified in this study over multiple (1-4 repeat extractions, see Table 1) extractions
and sequencing events while meeting standard aDNA authentication criteria (Table 1). Due to
the strict criteria for establishing genuine aDNA, two samples were unable to be used in data
analysis, D1.10 and K2.1. Sequencing of D1.10 showed a consistent deamination pattern across

32
multiple extractions and sequencing attempts, but the SNP pattern showed some inconsistency in
amplicons from the two separate extractions performed. However, when run on the Bioanalyzer,
D1.10 showed the largest concentration of fragment sizes at greater than 1,000bp, again making
it suspicious for a high degree of bacterial contamination. K2.1 showed large amounts of high
fragment sizes (>10,000bp) on Bioanalyzer runs of all extractions performed for this specimen,
as well as an absence of low molecular weight DNA (small fragments, <250bp). Sequencing
attempts for K2.1 sample produced high numbers of chimeras composed of bacterial and human
DNA, indicating high amounts of bacterial contamination.
Haplotyping information for all individuals in this study and the culture in which each
individual belonged based on archaeological findings was used to characterize the Yamna,
Catacomb and Eneolithic populations (Table 1).Of the three Catacomb individuals tested, our
data included two individuals of the H clade and one belonging to U5. The three Yamna
individuals haplotyped in this study all belonged to haplogroup U5. Haplogroup frequencies for
the cultures tested with PCA were generated by combining relevant individual data into cultures
from our study and comparing to mtDNA haplogroup frequencies from corresponding
population groups of the same time period (Table 5). The Yamna (YAM) culture had high
frequencies of haplogroups T and H, but, also contained individuals of the C clade, a group
associated with cultures further east into Siberia and Asia. Catacomb (CAT) people had high
frequencies of individuals belonging to the U and H clades, while the Eneolithic NPR people had
highest frequencies of H among the three groups.

33
PCA and Population Relatedness
Axes 1 and 2 of the PCA explained a combined 31% of the total variance within the data.
The Yamna (YAM) culture groups out with people belonging to the Trypillia culture, Corded
Ware culture and other cultures belonging to farming as well as pastoralist populations in
southwest and central Europe during the Eneolithic EBA (Nikitin et al., 2010, Brandt et al,
2013, Brotherton et al., 2013). The cultures located in this area of the PCA are characterized by
haplogroups typically belonging to farming people during these time periods such as the H, T,
N1a and J clades (Figure 3). Catacomb culture people (CAT) grouped together with hunter-
gatherer type peoples from northern Russia and the Pitted Ware culture from Scandinavia.
Cultures within this region of the PCA are characterized by the high frequencies of hunter-
gatherer associated haplogroup clades such as U4 and U5 (Figure 3). The Eneolithic NPR
population (ENE) groups out in-between the hunter-gatherers and the farming populations.
Overall, the farming populations form two clusters in the top right quadrant of the PCA output.
The top most cluster being formed by older central European farming cultures, and the bottom
cluster consisting of younger central European farming populations as well as the Yamna culture
from this study. Only three cultures fall out in the top left quadrant of the PCA, Neolithic Siberia
(NSI), Bronze Age Siberia (SEBA), and the Alfold (ALF) populations. Populations here are
characterized by East Eurasian haplogroups such as the D, A, G and C clades. At the bottom of
the PCA chart, populations associated with hunter-gatherer type lifestyles and characterized by U
clades group together.

34
FST with Modern European Populations
When comparing Yamna mtDNA haplogroup frequencies to that of modern European
populations, we see non-significant p-values through pairwise comparison between Yamna and
an isolated highlander population of Eastern Europe known as the Boyko (p=0.90090±0.0236)
(Table 3). The Boyko are modern highlander population living in the Carpathian Mountains of
Ukraine and Poland. Together with Hutsul and Lemko people living in the Carpathian region, the
Boyko live in relative isolation from their lowland neighbors (Nikitin et al., 2009). Non-
significant p-values are based on low FST values (closer to zero) meaning the populations are
very similar. The remaining pairwise FST calculations between the Yamna and other modern
European populations all had significant p-values (p<0.05) implying population differentiation
given haplogroup frequencies. The Catacomb culture was significantly different from all other
cultures in this analysis (p-values <0.05).
FST and Exact Test of Population Differentiation- Yamna and Catacomb
When directly comparing the mtDNA haplogroup frequency distribution in the Yamna
and Catacomb populations, the FST value between them was 0.07882 implying little genetic
substructure (panmixia, or the same population). At the same time, a significant p-value for this
pairwise comparison was obtained (Table 3), implying genetic differentiation. To test the
influence of low sample size on FST calculations, an exact test of population differentiation was
run, correcting for the small sample size of the ancient population data through a Markov chain
method (Raymond and Roussett, 1995). A significant p-value of 0.003 was obtained after 10,000
Markov chain permutations confirming that the Yamna and Catacomb populations are different
in their mtDNA haplogroup composition (Table 4). The exact test also confirmed the lack of

35
differentiation between Yamna and Boyko, at the same time revealing a lack of genetic
substructure between Yamna and Lemko, as well as the modern Ukrainian population (Table 4,
respective p-values of 0.932, 0.243, and 0.051).
Discussion
Genetics of the Yamna and Catacomb Cultures
During the Neolithic and EBA important transitions were taking place in the people of
the NPR. New people bringing the proto Indo-European language and new subsistence
techologies were moving into the region (Mallory, 1997). Using maternal lineages and mtDNA
haplogroup frequencies of cultures around the rest of Europe and Asia, we can begin to
understand the population dynamics of the NPR during this critical time period for technological
advancements in Europe. While maternal lineages only tell one side of the story, obtaining Y-
chromosome or other autosomal marker information with aDNA is difficult due to preservation
quality and its degraded state (Adler et al., 2011, Lamers et al., 2009). Using genetic information
from other markers within the genome would increase the resolution for determining specific
questions at the individual level, and increase marker numbers for resolution into mechanisms
for cultural admixture during the Neolithic through EBA. For our study however, we focused on
mtDNA and therefore our conclusions are only based on maternal lineage analysis.
Nine of the 11 total individuals in this study were able to be accurately characterized and
haplotyped through mtDNA SNP markers (Wilde et al., 2014, Burger et al., 2007). Adhering to
the strict authentication procedures in aDNA studies, the samples that were excluded for analyses
(D1.10 and K2.1) were not able to be resolved accurately to a single haplotype through multiple
extraction and amplification events. The addition in the use of the Bioanalyzer to this study also

36
helped resolve the authenticity of the samples allowing those which contained large amounts of
high molecular weight DNA to be classified as at least mostly bacterial contaminant (fragment
sizes >1,000bp) while also showing samples with small amounts of low molecular weight DNA.
Within the nine individuals of this study, high numbers of the U and H clades are not
particularly surprising. Other research has shown that in central and southwestern European
farming populations, especially during the EBA, begin to show high frequencies of the H clade
and, in particular, haplogroups H1 and H3 (Brandt et al., 2013, Brotherton et al., 2013). At the
same time, no H1 of H3 clade individuals have been unequivocally identified in southeastern
European EBA specimens studied to date. The presence of the U clade haplogroups such as U4
and U5 are indicative of hunter-gatherer populations as typically seen in other studies as well,
though, with the highest frequencies occurring before the EBA (Malmström et al., 2009, Brandt
et al., 2013).
Comparing the Yamna in this study and Newton, 2011 (individuals from the NPR) to
individuals from Wilde et al. (2014), we see differences in their haplogroup composition. The
Yamna individuals haplotyped in this study all belonged to the U clade, which while present in
the Wilde et al. data, is much less frequent than haplogroup H. Likely due to small sample size,
the Yamna individuals haplotyped in this study also do not have individuals belonging to
haplogroups X, T, W or J which are all present in the Wilde data. Haplogroups typically
associated with farming in Anatolia such as N1a and I have been found in Yamna samples in the
Wilde et al. dataset, possibly showing a link between the farming cultures in Anatolia and the
influence of southeastern European haplogroups in central Europe (Wilde et al., 2014, Brandt et
al., 2013). At the same time, in Newton, 2011 two individuals with east Eurasian specific
haplogroup C were identified among representatives of the Yamna culture from the NPR. The C

37
lineage has not been found in EBA representatives studied elsewhere in southeast Europe (Wilde
et al., 2014). Haplogroup C likely originated in south Siberia (Derenko et al., 2010) and the
presence of this east Eurasian haplogroup in the NPR points at a genetic affinity of Yamna
people with east Eurasian population groups. At the same time, the presence of haplogroup C in
the Neolithic populations (Dnieper-Donets culture) of the NPR (Newton, 2011, Nikitin et al.,
2012) could mean that the Yamna could have actually picked up the C’s from the Neolithic NPR,
rather than somehow directly acquiring these from the source of haplogroup origin. This would
mean that Yamna may have local roots in the NPR.
Comparing the Catacomb people in our dataset to that of Wilde et al. we see similarities
in the haplogroup distribution. In our sample, two Catacomb individuals belong to the H clade,
and one belonging to the U clade (U5). Overall, the larger dataset in Wilde shows a higher
frequency of hunter-gatherer U4 and U5 clades, while still containing H clade individuals.
Based on the grouping of the PCA output of mtDNA haplogroup frequencies, the
Catacomb people seem to have a common origin with hunter-gatherer people from northern
Europe and Russia (Malmström et al., 2009). Other research has already shown archaeological
evidence in the similarity of burial practices found in the NPR to Scandinavian and northern
European cultures (Nikitin et al., 2012). This study however, adds evidence of a genetic
continuum between the hunter-gatherers of the north and the Catacomb people residing in the
NPR. The high frequencies of the U clades, U4 and U5, isolate the Catacomb people from
modern European cultures in the pairwise FST analysis. The lower frequencies of the U clade in
modern European populations indicate that it is unlikely that the Catacomb and its nortern
European hunter-gatherer counterparts were the main genetic contributors moving past the EBA
and into modern human populations.

38
The Yamna people on the other hand, group together with mainly farming cultures from
southwestern and central Europe (Nikitin et al., 2010, Brandt et al., 2013). Based on haplogroup
frequencies it appears that the Yamna people were influenced by the advancement of European
farmers into the NPR and admixing with the local population of the time. High prevalence of
lineages associated with farming cultures, such as T and J, while also showing hunter-gatherer
lineages such as U4 and U5 could be an admixture event in the NPR around 4,000 years ago as
farming cultures and pastoralist type cultures met (Brotherton et al., 2013). While the FST value
(0.07882) was low between the Yamna and Catacomb, humans overall are not highly genetically
diverse, with some of the most diverse populations only having an FST value of ~0.2 between
them (Nelis et al., 2009). Since human overall FST values are quite low between even the most
genetically distinct populations, and our sample size for the Yamna and Catacomb populations
was small, we ran an exact test of population differentiation to confirm the FST results. The
significant p-value obtained from the exact text using the Markov chain method, correcting for
small sample size, between the Yamna and Catacomb cultures from the EBA shows that these
two cultures were unlikely to have admixed (Table 4).
Other research has suggested that the Catacomb people grew out of the Yamna culture
and continued Yamna’s burial practices and pastoralist way of living (Wilde et al., 2014).
However, our data indicates the absence of demic introgression of Yamna into Catacomb, at least
based on maternal genetic lineage marker analysis. While both cultures lived in the NPR during
the same time period, it does not appear that they were genetically admixed to any great extent.
A low FST value of 0.07882 between the Yamna and Catacomb cultures indicates genetically
similar populations, however, significant p-values in both the FST and the exact test of population
differentiation analyses show that these populations are genetically differentiated. Based on

39
burial type alone, there seems to be cultural exchange between these people as both used kurgan
type burials with slight variation between them. Yamna using pit-graves dug straight into the
kurgan mound and Catacomb people using pits with more of an L shape, giving a catacomb type
burial in same kurgans erected by the Yamna people. Catacomb people seem to carry the same
genetic signature during the Neolithic through EBA, while the Yamna pick up higher frequencies
of farming maternal lineages such as T and J moving closer to the end of the EBA. In example,
six of the 25 Yamna individuals haplotyped in Wilde et al. study belonged to haplogroup T,
while Catacomb individuals in both this study and Wilde do not show any individuals belonging
to T (Wilde et al., 2014). Overall, this could suggest that the Catacomb people retained their
own distinct gene pool after being pushed to the outskirts of the steppe by farming type cultures,
only taking in cultural and technological aspects from the Yamna instead of admixing with them
genetically. The high frequencies of U4 and U5 in the Catacomb culture could also suggest that
while they co-existed with the Yamna culture in the NPR, the Catacomb culture comprised of
alleles from a different genetic pool than the Yamna. Statistical analyses presented in this report
support this hypothesis. The PCA analysis presented in this study utilized mtDNA haplogroup
frequencies from populations spanning a time period of thousands of years between the
Mesolithic and EBA, and since the Catacomb people group together with hunter-gatherer
cultures from five through ten thousand yBP (southern and northern European Mesolithic and
Neolithic hunter-gatherers) we can assume based on haplogroup composition that their origins
are similar. It is possible, since the Yamna origins exhibit different alleles than the Catacomb,
and have higher frequencies of H, T and J haplogroups, they were associated with an influx of
farming-associated gene lineages in the NPR.

40
While aDNA is typically difficult to work with, using it as a tool coupled with
archaeology can help researchers further understand human population dynamics during the
peopling of Europe and Asia. Since this study uses only maternal lineages to determine genetic
relatedness, further research into other markers within the genome could show different
population dynamics during the study period. Increasing the number of individuals studied from
these important populations may also further resolve genetic affinities with other populations
during this critical time period in the history of Europe.

41
Chapter 2 –Next Generation Sequencing
Sequencing Methodology
For archaeogenetic studies, the ultimate goal is to be able to sequence genuine aDNA and
to confirm its authenticity for use in downstream population genetic analyses. Overall, there are
three generations of sequencing technology that may be used to sequence the DNA in a
particular sample, and each has their own specific application and methodology. Capillary
sequencing using Sanger chemistry, is the oldest technology, next-generation sequencing was
developed after Sanger in 2005, and the third generation of sequencing (PacBio) having been
developed in 2009 (Sanger et al., 1977, Marguiles et al., 2005, Eid et al., 2009).
Sanger sequencing chemistry was developed in 1977 by Fred Sanger using DNA strand
termination to sequence the molecule (Sanger et al., 1977). 3’-dideoxy nucleotide triphosphates
(ddNTPs) are randomly incorporated into the growing DNA strand in place of standard
deoxynucleotide triphosphates (Sanger et al., 1977). The addition of the ddNTPs terminates the
newly synthesized DNA strand, theoretically creating DNA fragments of varying sizes and each
ending at a specific and different base pair in the targeted sequenced region (Sanger et al., 1977).
These different size fragments may in turn be separated through electrophoresis and visualized
through dye staining on a gel or fluorescently tagged ddNTPs excited by a laser (Sanger et al.,
1977, Lee et al., 1992). Each nucleotide in the sequence is then ordered by the size of the
terminated fragments and the ddNTP that terminated the sequence is determined. Sanger
sequencing chemistry using capillary electrophoresis produces one sequence read per reaction
and averages around 700 base pairs per sequence.

42
Next-generation sequencing (NGS), first developed in 2005 through the Roche 454
pyrosequencing application, drastically changed the through-put of DNA sequencing
technologies (Marguiles et al., 2005). Compared with the previous Sanger sequencing
technologies, NGS increased the sequence read number per sample from one with Sanger to
millions with NGS (Marguiles et al., 2005). Each run on a NGS machine typically contains
hundreds of thousands of reactions simultaneously, with each of those hundreds of thousands of
growing DNA strands visualized through the systematic addition of fluorescently labeled
nucleotides (Marguiles et al., 2005). When a nucleotide is added to the growing DNA strand, a
fluorescent tag is cleaved off the nucleotide, allowing the laser to pick up on the specific
nucleotide that was added to each specific DNA strand. DNA sequence is determined by the
systematic order in which each nucleotide is added to the reaction (Marguiles et al., 2005). The
amount of sequencing reads and nucleotides sequenced using NGS technologies far surpasses
Sanger methods allowing the sequencing of whole genomes within a single run on these
machines (Marguiles et al., 2005).
In 2009 Pacific Biosciences developed a third generation of sequencing technology
allowing the real-time visualization of polymerase kinetics as a sequence is being generated (Eid
et al., 2009). This technology uses a SMRT bell adapter to anchor a single DNA molecule to a
well in a micro-perforated chip with each well containing a DNA polymerase molecule (Eid et
al., 2009). The SMRT bell adapter, added during the preparation of the sample for sequencing,
creates a circular molecule using a bell shaped adapter on either side of the double stranded
template DNA molecule. Circular consensus and sequence validation is obtained through the
repeated circular replication of the DNA molecule in each of the micro-perforations (Eid et al.,
2009) Polymerase kinetic information during the real-time sequencing of each molecule can

43
show polymerase stops and stalls while it replicates the DNA molecule, leading to information
about methylation, DNA strand damage and secondary DNA structure (Eid et al., 2009). While
the resolution at each of the sequencing reads is increased through the addition of polymerase
kinetic information, the PacBio sequencer has very specific applications. The only limitation to
sequence read length on the PacBio machine is polymerase exhaustion, and due to that, read
lengths can be upwards of 15kB long far exceeding any other sequencing technology (Eid et al.,
2009). However, the longer the sequenced read, the less number of times circular consensus can
be achieved, lowering the quality score of each base pair in the sequence read.
Building a Method- NGS for aDNA Authentication
Taking aDNA authentication criteria into account, methodology and applications of NGS
technologies could drastically increase the ability to determine genuine aDNA apart from its
inevitable modern contamination in a sample. With the innate properties of endogenous aDNA
damage and degradation, studying humans for aDNA studies has a unique problem; the
researcher provides another possible source of contamination. While Sanger chemistries give one
read of a targeted DNA sequence, NGS can sequence a much larger number of DNA strands in a
sample. If a sample contained DNA sequence from multiple different species, as is common in
aDNA contamination, NGS would be able to sequence all of those molecules. In turn, NGS
technologies could have significantly increased resolution for studying aDNA and allow damage
sites and contamination rates to be characterized for all DNA within a sample.
NGS offers a large increase in the amount of data on a particular DNA sample in a much
shorter amount of time. Compared with a single read per run Sanger sequencing, NGS offers
sequencing reads in the range of hundreds of thousands to hundreds of millions from one run

44
(Marguiles et al., 2005, Eid et al., 2009). Concentrations of genuine aDNA in an extract are
likely to be small after thousands of years of degradation (Adler et al., 2011). However, since
NGS technologies offer sequencing reads from loci across the genome, it is likely to sequence all
of the aDNA in a sample as well as sequencing all of the contaminant molecules. When aligning
NGS data to a reference genome, the source of the contamination in a particular aDNA extract
becomes apparent. The determination of contamination ratios (aDNA:other), where sources of
contamination are, and what DNA a sample is contaminated with (bacteria, plant, modern
human, etc.) can all be pinpointed using NGS technologies.
Being able to view the rate of nucleotide damage (deamination and oxidation) is
imperative in distinguishing aDNA from modern contaminant (Skoglund et al., 2014). Paired-
end NGS applications offer the resolution to determine mutation variation from nucleotide
damage without the need of the time consuming process of cloning and Sanger sequencing one
clone at a time. Paired-end sequencing, while reducing overall genome coverage depth, increases
the resolution of a sequencing run to both strands of DNA. Determining the mismatching in
nucleotide pairing (T matched with G in the case of deamination) between paired-end reads from
the same locus gives an accurate characterization of the damage rates across the sequenced
portion of the genome (Skoglund et al., 2014). Recent research has used paired-end sequencing
of ancient humans and a likelihood statistical model to use deamination rates and paired-end
mismatches to pull genuine aDNA sequencing reads out of a pool of modern contaminants
(Skoglund et al., 2014).
PacBio sequencing technology, the most recent incarnation of NGS, could allow the
visualization of deamination and fragment size as they exist in un-amplified original DNA
template, while increasing resolution of damage sites to oxidative damage, or possibly damage

45
types not yet identified in aDNA (Eid et al., 2009). Increasing resolution to entire single
molecules of DNA in real time will allow studies of ancient genomes to have a more specific set
of authenticity criteria to tell genuine aDNA apart from modern contamination. The PacBio
sequencer uses polymerase kinetics to determine nucleotide modification in the template strand
(ex: methylation) and could also show the cytosine to uracil switch in a deamination reaction
(Eid et al., 2009, Fang et al., 2012). The circular consensus sequencing method for validation
innately built into PacBio sequencing technologies could also show direct mismatches in
nucleotides in real time on an unmodified (no library amplification) aDNA template molecule.
However, the current state of the PacBio technology has a difficult time dealing with nucleotide
damage sites as the DNA polymerase stalls or stops completely during replication (Eid et al.,
2009, Fang et al., 2012, personal communication, Bob Lyons).
Duplex consensus sequencing (DCS), a method for detecting rare mutations and
distinguishing them from PCR errors was developed for use in the medical field for cancer
research and tumor sequencing (Schmitt et al., 2012). DCS uses a modified method of paired-end
sequencing to determine the original template molecule from which an amplified cluster of
paired-end reads originated (Schmitt et al., 2012). Through tags consisting of 12 random
nucleotides and 5 static nucleotides as barcodes, called αβ tags, clusters of paired-end reads are
grouped with their initial template molecule in downstream bioinformatics analyses (Schmitt et
al., 2012). This allows determination of PCR error apart from natural sequence variation due to
mutation in a particular sequenced sample (Schmitt et al., 2014). For aDNA, this could be used
to distinguish deamination sites in the original template molecule and allow those deamination
modifications to be validated against PCR error incorporated during NGS library preparation and
amplification.

46
Using a combination of the different NGS technologies available today could allow the
visualization of deamination, fragment size and contamination rates as they exist in an aDNA
sample. Increasing resolution and understanding of endogenous aDNA in an ancient sample
could significantly impact authentication criteria in determination of genuine aDNA apart from
modern contamination. In a field where authentication of genuine aDNA is of utmost
importance, NGS technology may offer a quality of information this field does not yet utilize
(Paijmans et al., 2012).
Study Objectives
The second part of this study focused on the development of NGS technologies for use
with aDNA authenticity. Using NGS technologies and modified methods for NGS sequencing
runs, we sought to further understand aDNA damage patterns, contamination rates and types, and
preservation status. From this information we planned on using NGS sequence data obtained
from human aDNA samples in hopes to develop a method for more accurately identifying
genuine aDNA and improving authentication criteria. The ultimate goal of this portion of the
study was to quantify the extent and types of damage on a per molecule basis, linking that
damage to a specific preservation and burial type which has not yet been done in aDNA research.
Methods- NGS Technology
All samples for analysis with NGS technologies were extracted using the same
procedures as outlined above (p.26-27). Bones were processed and ground using a mortar and
pestle in a UV sterilized laminar flow hood. DNA was extracted using a QIAGEN QiaAmp
Investigator kit (Qiagen) and eluted in 20ul 18MΩ deionized H2O. NGS technology requires

47
strict DNA concentrations for the preparation of the sequencing library. To determine which of
our aDNA specimens were most appropriate for NGS analysis, the following criteria were used.
1) The sample must have detailed archaeological information such as burial environment.
2) The sample had to contain an appreciable concentration of DNA. NGS targets 1µg of
DNA in an extract for library preparation and sequencing. Since aDNA is highly
degraded and in small concentration, choosing an aDNA sample with the highest
concentration of DNA was required.
3) The sample had to show the above concentration of DNA mostly in the low molecular
weight region, increasing the chances for that DNA to be genuine ancient DNA existing
in fragment sizes less than 250bp (Adler et al., 2011).
To determine the concentration of DNA in our samples, we used an Agilent Bioanalyzer
running a high-sensitivity assay due to the known small concentrations of aDNA. This
instrument allowed the visualization of the distribution of all DNA within the sample,
specifically showing the concentration of DNA at each of the fragment sizes. Following the
Bioanalyzer analysis of possible NGS samples, L8 was chosen due to the high concentration
(1.6ng/µl, 40ng total DNA) of low molecular weight (small fragment size, median=311bp) DNA
(Figure 4) as well as detailed archaeological information including the skull being covered with a
red pigment. While this sample still had a relatively small concentration of DNA, out of all bones
tested using the Bioanalyzer L8 had the highest concentrations of low molecular weight DNA.
Since aDNA is very low in concentration and DNA damage and fragmentation is prevalent, a test
run using an artificially fragmented PhiX DNA to simulate aDNA was sequenced. Running an
artificially generated sample to mimic aDNA allowed us to test the DCS adapter tagging, low
concentration, and innate small DNA fragments that are typical for aDNA.

48
Following sample selection, the entirety of the L8 extract was sent to the University of
Michigan sequencing core for library preparation and sequencing on the Illumina HiSeq 2500
platform (Illumina). Library preparation for this sample was completed using Illumina TruSeq
adapter sequences as well as αβ tags from the DCS method following the Illumina TruSeq DNA
protocol (Illumina). The addition of αβ DCS tags were constructed into the library to allow
increased resolution in determining the original aDNA template molecule from which each
sequencing read came from. In turn, this method could allow us to specifically determine
deamination sites, SNP variation, and PCR errors from library amplification of this sample. The
Illumina HiSeq 2500 platform was chosen for this process due to the still small DNA
concentration in the L8 sample, as well as, for issues PacBio sequencers have when dealing with
highly damaged DNA molecules (personal communication, Bob Lyons).
After sequencing, raw NGS data was cleaned and then analyzed using bioinformatics
software. First, to clean raw sequence data, Illumina TruSeq adapter sequences were removed
from each of the sequencing reads and high quality sequencing reads were determined using the
web-based software FastQC (Bahbraham Bioinformatics). NGS raw sequence files include
quality based scores coupled with each base pair in a given sequence, much like Sanger based
methods. In this analysis, any sequence read with an average quality score of less than 30 was
removed from downstream analysis. Once sequence reads were cleaned, reads were separated
into two files, one file for single-end sequencing reads (not paired with opposite strand) and one
for paired-end sequencing reads (both strands paired back together). Single-end and paired-end
cleaned sequencing data files were constructed using the SAMtools v1.19 software package (Li
et al., 2009). Finally, both single-end and paired-end sequencing read files were aligned to the
human hg19 reference genome using the BWA v0.7.9 software package (Li and Durbin, 2009)

49
and visualized using the Integrative Genomics Viewer (IGV) v2.3 (Thorvaldsdóttir et al.,2012).
For alignment purposes, it was expected that genuine aDNA would have a higher number of
variable sites due to deamination. To be able align reads to the reference genome, up to 5
nucleotide differences were allowed for each sequencing read.
Results
Next Generation Sequencing
Once completed, the NGS run on the Illumina HiSeq 2500 for the L8 specimen had
198,000,000 sequencing reads. Once trimmed of Illumina TruSeq adapters as well as the created
DCS 12-nucleotide tags, the number of reads drops to 7 million containing a an insert of DNA
above 15bp (single-end reads). A total read length cutoff of 15bp for each sequence was used to
avoid random alignment of small DNA fragments to the reference genome in downstream
genome alignments. Overall the 7 million single-end reads had a tri-modal distribution of
fragment sizes with peaks at 15-25bp, 35-40bp, and finally at 90-100bp. Pairing those 7 million
reads back to their partner (αβ tag from DCS) the number of reads drops to around 2.5 million
paired end reads. Out of the original 7 million single end reads 40% mapped to the hg19
reference genome and all of the mapped reads were the 15-25 nucleotide insert reads.
Once fragments were mapped to the hg19 reference genome further checks were run to
determine if the mapped fragments were human specific. The 7 million single end reads were
also mapped to the mouse reference genome (Mus musculus). We chose to use another mammal
species to see if conserved areas of the genome were being sequenced and mapped to the same
regions in both humans and mice. We found that the same reads that mapped to humans, also
mapped to mice and again were only the 15-25bp insert reads. However, while these reads

50
mapped to both mouse and human, they did not map to conserved areas across the two genomes.
To examine the sequencing reads with 90-100bp inserts, a BLAST search was run on all 7
million sequencing reads using an in-house constructed program at the University of Michigan.
Sequence reads for Actinoplanes bacteria genome had BLAST hits from within our data.
Alignments for the 7 million single end sequence reads to the Actinoplanes genome (Accession
Number: NC_021191) produced 28,488 matches to the reference genome (Figure 5).
Discussion
Next-Generation Sequencing Methodology- Improving aDNA Authentication Protocols
Development of NGS technologies for use of aDNA authentication in this study was
unable to address the original question of aDNA damage characterization or contamination rates.
While this aspect of the study was unable to answer our questions, improving this method could
allow for increased ability to study aDNA in future studies using NGS technologies.
Concentrations of DNA become increasingly important for sequencing using NGS
machines. Typically, when the library is created for sequencing around 1µg of total DNA is
required. Due to the highly degraded state of aDNA it becomes difficult for one sample and one
extraction to obtain concentrations high enough for this step of the protocol. In attempts to
increase the concentration of DNA in the extractions used in this study, many of the bones were
re-extracted using the protocol outlined in the methods above and multiple extractions of the
same bone were combined to increase DNA amounts. However, when these samples were
analyzed using the BioAnalyzer there was a much larger concentration of high molecular weight
DNA, indicating a higher presence of bacterial contamination (Figure 4). While L8 was chosen
as our best sample, it only contained ~100ng of total DNA, much lower than the suggested 1µg
51
suggested for DNA sequencing on NGS machines. Research into the extraction method for
ancient specimens has shown that premade kits, such as the one used in this study, use lysis
buffers which may be too harsh for the already compromised cells and degraded DNA (Rohland
and Hofreiter, 2007). Using this silica-based extraction method may improve the starting
material and allow higher concentrations of genuine aDNA in an extraction (Rohland and
Hofreiter, 2007).
Paired-end sequencing and DCS provides an increased depth of coverage at each
sequenced locus in a NGS run. However, while providing increased depth and resolution, the use
of paired-end sequencing and DCS reduces overall genome coverage. The adapters and tags
added to each of the template DNA strands in a paired-end DCS library preparation significantly
reduces the number of base pairs between the adapters that are sample sequences. Due to the
smaller fragment size of the sample being sequenced, less of the overall genome retains the
coverage of sequencing reads. On top of that, due to the small fragment inserts between the
adapter sequences, sequencing into the adapter sequence commonly occurs in paired-end
sequencing runs. When cleaned of adapter sequences in this studies data, the number of
sequencing reads dropped from 198 million down to 7 million. The remaining sequence between
the two flanking adapter sequences in most cases was too small to accurately align to any
genome (below 15bp), significantly reducing the quality and coverage across the alignment to
the reference genome. In further studies, using a single-end sequencing run and using statistical
methods to parse out contamination and identify deamination could lead to better genome
coverage (Skoglund et al., 2014).
Modification to PacBio methodology could give increased information about aDNA
template molecules in real-time. Watching the DNA polymerase as it replicates the aDNA

52
template molecule could shed light on nucleotide damage sites not previously seen in aDNA
research. Currently, the polymerase stalls too frequently along highly damaged template
molecules during sequencing runs on the PacBio machine. In most studies this has been rectified
by using DNA repair enzymes such as using uracil-DNA glycosylase (UDG) repairing uracil
nucleotides in the template sequence (personal communication, Bob Lyons). However, this
defeats the purpose for aDNA applications as the presence of deaminated cytosine nucleotides
into uracil is a hallmark indication of genuine aDNA template (Skoglund et al., 2014).
While method development in this study was unable to address aDNA damage and
contamination rates, further research and method changes could provide an increased resolution
for distinguishing aDNA authenticity. Changes to the way DNA was extracted, library
preparation, sequencing run type, and possibly NGS platform type could have the impact needed
to improve this method.

53
Conclusions
In this study nine of eleven ancient individuals belonging to pastoralist cultures from the
North Pontic steppe region of southeast Europe during the late Neolithic and EBA were
accurately haplotyped using mtDNA. Relatedness analyses in the form of PCA of mtDNA
haplogroup frequencies of ancient cultures through time, FST with modern European populations
and an exact test of population differentiation showed the genetic affinities of the Yamna and
Catacomb cultures studied in this thesis. Haplogroup information based on the HV1 and coding
sequence of the human mtDNA genome revealed that the Yamna and the Catacomb people
living in the NPR during the EBA appear to have not been genetically admixed. The Yamna
people have shared east Eurasian maternal lineages with the Dnieper-Donets culture, who had
previously occupied the NPR during the Neolithic time period, likely indicating deep local roots
of the Yamna population in the NPR. After pulling our mtDNA data together with data from
literature, it became apparent that the Catacomb population, while also living in the NPR at the
same time as the Yamna (late Neolithic through EBA), do not share the same mtDNA
haplogroup frequencies as the Yamna. While the representatives of the Catacomb culture
featured predominantly mtDNA lineages of the H and U haplogroup, of which U is characteristic
of pre-farming hunter-gatherer populations of Europe, the Yamna representatives displayed a
greater variety of mtDNA lineages characteristic to the Anatolian demic influx typically
associated with the advancement of farming technologies. Unlike the Catacomb, the Yamna
culture was genetically similar to the modern day Ukrainian population, as well as to two
populations of Carpathian highlanders, Boyko and Lemko, showing that the gene pool of ancient
farming type cultures more significantly influenced the modern European population structure
than ancient hunter-gatherer populations. Catacomb people, on the other hand, seem to have been
54
more influenced by hunter-gatherer mtDNA lineages and their genes are not as significantly
represented in modern European populations.
In this thesis method development for the authentication of aDNA using NGS
technologies was also attempted. While this method produced data unable to answer the original
question of aDNA damage characterization during this study, important information was
gathered for the furthering of this method in future aDNA studies using NGS technologies.
Changes to the way aDNA is extracted as well as downstream sequencing methodology may
increase the ability for these new technologies to help understand ancient material.

55
Literature Cited
Andrews, R.M., Kubacka, I., Chinnery, P.F., Lightowlers, R.N., Turnbull, D.M., and
Howell, N. (1999). Reanalysis and revision of the Cambridge reference sequence for human
mitochondrial DNA. Nat. Genet. 23, 147.
Behar, D.M., van Oven, M., Rosset, S., Metspalu, M., Loogväli, E.-L., Silva, N.M.,
Kivisild, T., Torroni, A., and Villems, R. (2012). A “Copernican” reassessment of the human
mitochondrial DNA tree from its root. Am. J. Hum. Genet. 90, 675–684.
Bramanti, B., Thomas, M., and Haak, W. (2009). Genetic discontinuity between local
hunter-gatherers and central Europe’s first farmers. Science 80. 137.
Brandt, G., Haak, W., Adler, C.J., Roth, C., Szécsényi-Nagy, A., Karimnia, S., Möller-
Rieker, S., Meller, H., Ganslmeier, R., Friederich, S., et al. (2013). Ancient DNA reveals key
stages in the formation of central European mitochondrial genetic diversity. Science 342, 257–
261.
Brotherton, P., Haak, W., Templeton, J., Brandt, G., Soubrier, J., Jane Adler, C.,
Richards, S.M., Sarkissian, C. Der, Ganslmeier, R., Friederich, S., et al. (2013). Neolithic
mitochondrial haplogroup H genomes and the genetic origins of Europeans. Nat. Commun. 4,
1764-1774.
Burger, J., Kirchner, M., Bramanti, B., Haak, W., and Thomas, M.G. (2007). Absence of
the lactase-persistence-associated allele in early Neolithic Europeans. PNAS. U. S. A. 104,
3736–3741.
Cooper, A., and Poinar, H. (2000). Ancient DNA: do it right or not at all. Science 80.
289.
Derenko, M. V, Grzybowski, T., Malyarchuk, B. a, Dambueva, I.K., Denisova, G. a,
Czarny, J., Dorzhu, C.M., Kakpakov, V.T., Miścicka-Sliwka, D., Woźniak, M., et al. (2003).
Diversity of mitochondrial DNA lineages in South Siberia. Ann. Hum. Genet. 67, 391–411.
Derenko, M., Malyarchuk, B., Grzybowski, T., Denisova, G., Rogalla, U., Perkova, M.,
Dambueva, I., and Zakharov, I. (2010). Origin and post-glacial dispersal of mitochondrial DNA
haplogroups C and D in northern Asia. PLoS One 5, e15214.
Der Sarkissian, C. (2011).”Mitochondrial DNA in ancient human populations of
Europe”. PhD Diss. University of Adelaide Digital Library.
Eid, J., Fehr, A., Gray, J., Luong, K., Lyle, J., Otto, G., Peluso, P., Rank, D., Baybayan,
P., Bettman, B., et al. (2009). Real-time DNA sequencing from single polymerase molecules.
Science 323, 133–138.

56
Fang, G., Munera, D., Friedman, D.I., Mandlik, A., Chao, M.C., Banerjee, O., Feng, Z.,
Losic, B., Mahajan, M.C., Jabado, O.J., et al. (2012). Genome-wide mapping of methylated
adenine residues in pathogenic Escherichia coli using single-molecule real-time sequencing. Nat.
Biotechnol. 30, 1232–1239.
Fu, Q., Meyer, M., Gao, X., Stenzel, U., Burbano, H. a, Kelso, J., and Pääbo, S. (2013).
DNA analysis of an early modern human from Tianyuan Cave, China. PNAS. U. S. A. 110,
2223–2227.
Gilbert, M.T.P., Willerslev, E., Hansen, A.J., Barnes, I., Rudbeck, L., Lynnerup, N., and
Cooper, A. (2003). Distribution patterns of postmortem damage in human mitochondrial DNA.
Am. J. Hum. Genet. 72, 32–47.
Gonder, M.K., Mortensen, H.M., Reed, F. A, de Sousa, A., and Tishkoff, S. A (2007).
Whole-mtDNA genome sequence analysis of ancient African lineages. Mol. Biol. Evol. 24, 757–
768.
González, A.M., Larruga, J.M., Abu-Amero, K.K., Shi, Y., Pestano, J., and Cabrera,
V.M. (2007). Mitochondrial lineage M1 traces an early human backflow to Africa. BMC
Genomics 8, 223.
Green, R.E., Krause, J., Briggs, A.W., Maricic, T., Stenzel, U., Kircher, M., Patterson,
N., Li, H., Zhai, W., Fritz, M.H.-Y., et al. (2010). A draft sequence of the Neanderthal genome.
Science 328, 710–722.
Guba, Z., Hadadi, É., Major, Á., Furka, T., Juhász, E., Koós, J., Nagy, K., and Zeke, T.
(2011). HVS-I polymorphism screening of ancient human mitochondrial DNA provides evidence
for N9a discontinuity and East Asian haplogroups in the Neolithic Hungary. J. Hum. Genet. 56,
784–796.
Haak, W., Forster, P., Bramanti, B., Matsumura, S., Brandt, G., Tänzer, M., Villems, R.,
Renfrew, C., Gronenborn, D., Alt, K.W., et al. (2005). Ancient DNA from the first European
farmers in 7500-year-old Neolithic sites. Science 310, 1016–1018.
Haak, W., Balanovsky, O., Sanchez, J.J., Koshel, S., Zaporozhchenko, V., Adler, C.J.,
Der Sarkissian, C.S.I., Brandt, G., Schwarz, C., Nicklisch, N., et al. (2010). Ancient DNA from
European early neolithic farmers reveals their near eastern affinities. PLoS Biol. 8, e1000536.
Haak, W., Brandt, G., de Jong, H.N., Meyer, C., Ganslmeier, R., Heyd, V.,
Hawkesworth, C., Pike, A.W.G., Meller, H., and Alt, K.W. (2008). Ancient DNA, Strontium
isotopes, and osteological analyses shed light on social and kinship organization of the Later
Stone Age. PNAS. U. S. A. 105, 18226–18231.
Ivanova SV, Petrenko VG, Betchinnikova NE. 2005. Kurgans of ancient herdsmen from
the South Bug and Dnister interfluve. Odessa: KP OGT, 207 p.
57
Kalis, A., Merkt, J., and Wunderlich, J. (2003). Environmental changes during the
Holocene climatic optimum in central Europe-human impact and natural causes. Quat. Sci. Rev.
22, 33–79.
Keller, A., Graefen, A., Ball, M., Matzas, M., Boisguerin, V., Maixner, F., Leidinger, P.,
Backes, C., Khairat, R., Forster, M., et al. (2012). New insights into the Tyrolean Iceman’s origin
and phenotype as inferred by whole-genome sequencing. Nat. Commun. 3, 698.
Keyser, C., Bouakaze, C., Crubézy, E., Nikolaev, V.G., Montagnon, D., Reis, T., and
Ludes, B. (2009). Ancient DNA provides new insights into the history of south Siberian Kurgan
people. Hum. Genet. 126, 395–410.
Lamers, R., Hayter, S., and Matheson, C.D. (2009). Postmortem miscoding lesions in
sequence analysis of human ancient mitochondrial DNA. J. Mol. Evol. 68, 40–55.
Lazaridis, I., Patterson, N., Mittnik, a., Renaud, G., Mallick, S., Sudmant, P.H.,
Schraiber, J.G., Castellano, S., Kirsanow, K., Economou, C., et al. (2013). Ancient human
genomes suggest three ancestral populations for present-day Europeans. arXiv preprint
arXiv:1312.6639.
Lee, E.J., Makarewicz, C., Renneberg, R., Harder, M., Krause-Kyora, B., Müller, S.,
Ostritz, S., Fehren-Schmitz, L., Schreiber, S., Müller, J., et al. (2012). Emerging genetic patterns
of the european neolithic: Perspectives from a late neolithic bell beaker burial site in Germany.
Am. J. Phys. Anthropol. 148, 571–579.
Lee, L.G., Connell, C.R., Woo, S.L., Cheng, R.D., McArdle, B.F., Fuller, C.W.,
Halloran, N.D., and Wilson, R.K. (1992). DNA sequencing with dye-labeled terminators and T7
DNA polymerase: effect of dyes and dNTPs on incorporation of dye-terminators and probability
analysis of termination fragments. Nucleic Acids Res. 20, 2471–2483.
Li, H., and Durbin, R. (2009). Fast and accurate short read alignment with Burrows-
Wheeler transform. Bioinformatics 25, 1754–1760.
Li, H., Handsaker, B., Wysoker, A., Fennell, T., Ruan, J., Homer, N., Marth, G.,
Abecasis, G., and Durbin, R. (2009). The Sequence Alignment/Map format and SAMtools.
Bioinformatics 25, 2078–2079.
Lillie, M., Potekhina, I., Budd, C., and Nikitin, A.G. (2012) Prehistoric populations of
Ukraine: Migration at the later Mesolithic to Neolithic transition. In: J. Burger, E. Kaiser und W.
Schier (Eds.), Population dynamics in Pre- and Early History. New Approaches by using Stable
Isotopes and Genetics. Berlin: de Gruyter, pp. 79-94
Lindahl, T. (1993). Instability and decay of the primary structure of DNA. Nature. 362,
709-715.

58
Maca-Meyer, N., González, a M., Larruga, J.M., Flores, C., and Cabrera, V.M. (2001).
Major genomic mitochondrial lineages delineate early human expansions. BMC Genet. 2, 13.
Malyarchuk, B., Derenko, M., Grzybowski, T., Perkova, M., Rogalla, U., Vanecek, T.,
and Tsybovsky, I. (2010). The peopling of Europe from the mitochondrial haplogroup U5
perspective. PLoS One 5, e10285.
McCormack, J.E., Hird, S.M., Zellmer, A.J., Carstens, B.C., and Brumfield, R.T. (2013).
Applications of next-generation sequencing to phylogeography and phylogenetics. Mol.
Phylogenet. Evol. 66, 526–538.
Molodin, V.I., Pilipenko, A.S., Romaschenko, A.G., Zhuravlev, A.A., Trapezov, R.O.,
and Chikisheva, T.A. (2012) Human migrations in the southern region of the West Siberian Plain
during the Bronze Age in: J. Burger, E. Kaiser und W. Schier (Eds.), Population dynamics in
Pre- and Early History. New Approaches by using Stable Isotopes and Genetics. Berlin: de
Gruyter,. 93–112.
Mooder, K.P., Tia A. Thomson, Andrzej W. Weber, Vladimir I. Bazaliiskii, and Fiona
J.Bamforth., (2010). Uncovering the genetic landscape of prehistoric Cis-Baikal. In: Weber,
A.W., Katzenberg, M.A., Schurr, T.G. (Eds.), Prehistoric Hunter- Gatherers of the Baikal
Region, Siberia: Bioarchaeological Studies of Past Life Ways. University of Pennsylvania
Museum of Archaeology and Anthropology, Philadelphia.107-120.
Nelis, M., Esko, T., Mägi, R., Zimprich, F., Zimprich, A., Toncheva, D., Karachanak, S.,
Piskácková, T., Balascák, I., Peltonen, L., et al. (2009). Genetic structure of Europeans: a view
from the North-East. PLoS One 4, e5472.
Newton, Jeremy R. (2011) "Ancient Mitochondrial DNA From Pre-historic Southeastern
Europe: The Presence of East Eurasian Haplogroups Provides Evidence of Interactions with
South Siberians Across the Central Asian Steppe Belt". Masters Theses.Paper 5.
Nikitin, A.G., Sokhatsky, M., Kovaliukh, M., and Videiko, M. (2010). Comprehensive
site chronology and ancient mitochondrial DNA analysis from Verteba cave—a Trypillian
culture site of Eneolithic Ukraine. Interdiscip Archaeol I, 9–18.
Nikitin, A.G., Kochkin, I., June, C., and Willis, C. (2009). Mitochondrial DNA sequence
variation in the Boyko, Hutsul, and Lemko populations of the Carpathian Highlands. Hum. Biol.
81, 43-58.
Nikitin, A.G. (2011). Bioarchaeological analysis of Bronze Age human remains from the
Podillya region of Ukraine. Interdiscip. Archaeol. II, 9–14.
Nikitin, A.G., Newton, J.R., and Potekhina, I.D. (2012). Mitochondrial haplogroup C in
ancient mitochondrial DNA from Ukraine extends the presence of East Eurasian genetic lineages
in Neolithic Central and Eastern Europe. J. Hum. Genet. 00, 1–3.

59
Piazza, a, Rendine, S., Minch, E., Menozzi, P., Mountain, J., and Cavalli-Sforza, L.L.
(1995). Genetics and the origin of European languages. PNAS. U. S. A. 92, 5836–5840.
Richards, M.B., Macaulay, V. a, Bandelt, H.J., and Sykes, B.C. (1998). Phylogeography
of mitochondrial DNA in western Europe. Ann. Hum. Genet. 62, 241–260.
Richards, M., Macaulay, V., Hickey, E., Vega, E., Sykes, B., Guida, V., Rengo, C.,
Sellitto, D., Cruciani, F., Kivisild, T., et al. (2000). Tracing European founder lineages in the
Near Eastern mtDNA pool. Am. J. Hum. Genet. 67, 1251–1276.
Robin, E.D., and Wong, R. (1988). Mitochondrial DNA molecules and virtual number of
mitochondria per cell in mammalian cells. J. Cell. Physiol. 136, 507–513.
Rohland, N., and Hofreiter, M. (2007). Ancient DNA extraction from bones and teeth.
Nat. Protoc. 2, 1756–1762.
Santos, C., Montiel, R., Angle´s, N., Lima, M., Francalacci, P., Malgosa, A. et al. (2004).
Determination of human Caucasian mitochondrial DNA haplogroups by means of a
hierarchical approach. Hum. Biol. 76, 431–453.
Sanger, F. (1977). DNA sequencing with chain-terminating inhibitors. PNAS 74, 5463–
5467.
Schmitt, M.W., Kennedy, S.R., Salk, J.J., Fox, E.J., Hiatt, J.B., and Loeb, L.A. (2012).
Detection of ultra-rare mutations by next-generation sequencing. PNAS U.S.A. (109), 36, 14508-
14513.
Schrøder, N., Pedersen, L., and Bitsch, R. (2004). 10,000 Years of Climate Change and
Human Impact on the Environment in the Area Surrounding Lejre. JPES 3. 1-27.
Skoglund, P., Malmström, H., Raghavan, M., Storå, J., Hall, P., Willerslev, E., Gilbert,
M.T.P., Götherström, A., and Jakobsson, M. (2012). Origins and genetic legacy of Neolithic
farmers and hunter-gatherers in Europe. Science 336, 466–469.
Skoglund, P., Northoff, B.H., Shunkov, M. V, Derevianko, A.P., Pääbo, S., Krause, J.,
and Jakobsson, M. (2014). Separating endogenous ancient DNA from modern day contamination
in a Siberian Neanderthal. PNAS. U. S. A. 111, 2229–2234.
Tamura, K., Peterson, D., Peterson, N., Stecher, G., Nei, M., and Kumar, S.
(2011) MEGA5: Molecular Evolutionary Genetics Analysis using Maximum Likelihood,
Evolutionary Distance, and Maximum Parsimony Methods. Molecular Biology and
Evolution 28, 2731-2739.
60
Thorvaldsdóttir, H., Robinson, J.T., and Mesirov, J.P. (2013). Integrative Genomics
Viewer (IGV): high-performance genomics data visualization and exploration. Brief. Bioinform.
14, 178–192.
Walker, A., and Smith, S. (1987). Mitochondrial DNA and human evolution. Nature 17,
127–143.
Waples, R.S. (1998). Separating the wheat from the chaff: patterns of genetic
differentiation in high gene flow species. J. Hered. 89, 438–450.

61
Figure 1: A network representation of human mtDNA haplogroups from Newton, 2011. This
diagram shows the mutations separating the major clades of the human mtDNA haplogroups as
compared with the rCRS human reference mtDNA genome. Mutations, in red, starting with
16,000 are from the HV1 region of the mtDNA. Mutations marked with restriction enzymes
denote coding region mutations typically distinguished using restriction cut sites at that locus.
Figure 2: A modified map from Brandt et al., 2013 Supplementary Information. In this figure,
the movement of the H haplogroup clades from southwest Europe and the movement of U clades
are shown. The North Pontic Steppe Region, the location of this study, is circled in blue.
Table 1: All specimens tested for mitochondrial DNA haplotype in the North Pontic steppe
region of Ukraine in this study. Superscript numbers next to sample names designate the number
of repeat extractions from the same bone. Subscript β indicates samples checked on the
Bioanalyzer for further aDNA quantification. Coding region mutations based on RFLP checks
are in blue where information is available. Individuals are broken down into their corresponding
culture based on archaeological findings (Yamna, Catacomb or Eneolithic). Samples in red were
not able to be resolved over multiple replications and therefore not used in further analysis.
Table 2: Primer information for all primer sets used in mitochondrial DNA haplotyping of
people from the North Pontic steppe region in this study. Lower PCR product length primers
(<84) were used to check for amplified fragment lengths and ratios to find endogenous aDNA
template molecules. Primer sets H7025 and H12308 were used as mtDNA coding region checks
for haplogroups H and U respectively.
Table 3: Pairwise FST values for between modern European populations and the Yamna and
Catacomb ancient populations. FST values are listed below the diagonal. All FST calculations were
run using haplogroup frequencies for the cultures listed. Cells shaded green have a non-
significant p-value (>0.05) meaning those population pairs are statistically similar. Cells above
the diagonal are p-values reported for the FST.
Table 4: Exact test of population differentiation between the Yamna, Catacomb, and modern
European populations. Significant p-values (p-value <0.05), in white cells, indicate genetic
differentiation between population pairs. Green shaded cells indicate non-significant p-values
(>0.05) and show populations that are genetically similar or are panmictic.
Figure 3: Principal Component Analysis of haplogroup frequencies of various cultures of
different geographic regions during the Mesolithic through the Early Bronze Age. The Yamna
(YAM) and Catacomb (CAT) cultures are abbreviated in the figure itself. More information
about the specific cultures is presented and the studies from which the corresponding data
originate is shown in table 5. Polygons describing the clustering of the cultures focused on in this
study are labeled in blue.

62
Figure 4: An example Bioanalyzer output for the L8 sample. DNA concentrations are shown at
the bottom of the output. For this sample, a concentration of 1,594 picograms per microliter was
obtained. The total distribution and concentration of the varying DNA fragment sizes are shown
on the graphical output.
Figure 5: BWA and IGV genome alignment of the 7 million single-end sequencing reads
generated in the sequencing of the L8 specimen in this study. The top picture shows an area
where sequences are giving overlapping consensus coverage for a particular region of the
Actinoplanes reference genome. The bottom picture shows the BWA output of the number of
sequences aligned to the Actinoplanes reference genome. Colored dashes in the IGV alignment
show variants between the mapped reads and the reference genome.
Table 5: Culture haplogroup frequency data represented in the PCA analysis of Figure 1.
Cultures are identified, and the abbreviations used in the PCA graph are given. Since data from
the literature was combined for this analysis, the source of each cultures mtDNA haplogroup
data is also listed in this table.

63
Figure 1: Schematic of Human mtDNA Haplogroups
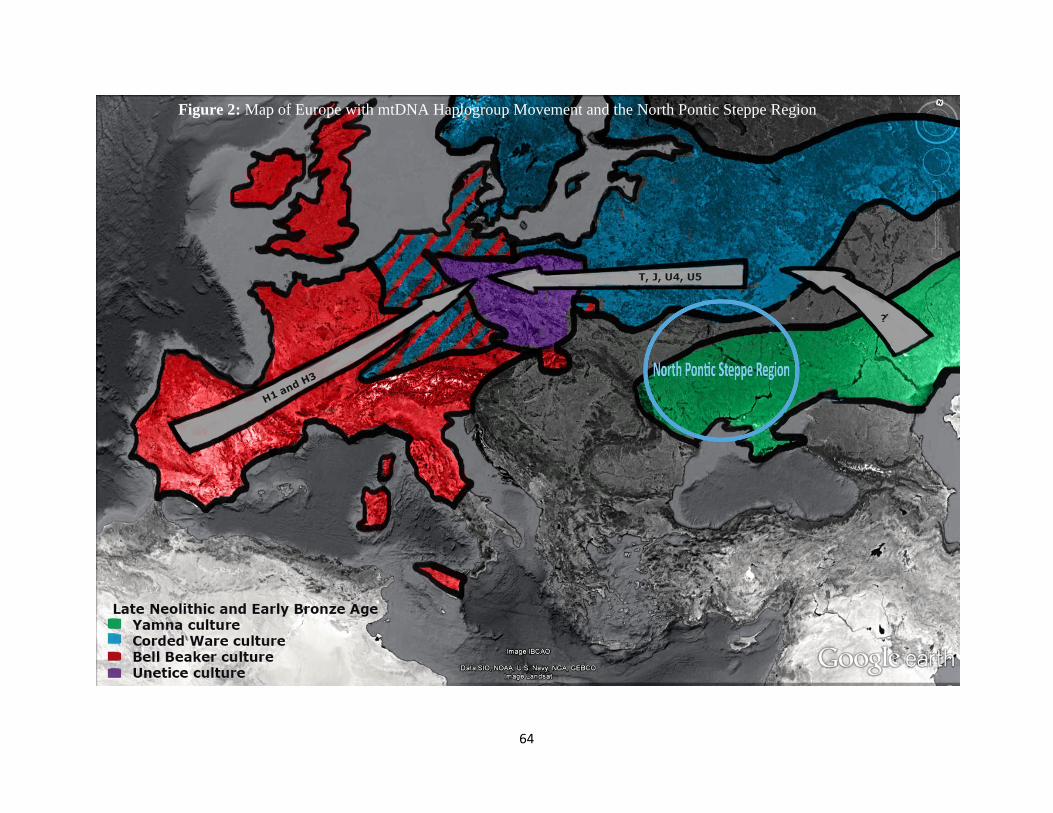
64
Figure 2: Map of Europe with mtDNA Haplogroup Movement and the North Pontic Steppe Region

65
Specimen ID Culture Age (BP) Coding and HV1 SNPs Halogroup
R3.133 Catacomb (Ingul) 3,940±60 16270T U5
D1.122 Catacomb 3,900±80 rCRS H
D1.112 Catacomb (Ingul) 3,720±70 rCRS, 7028C H
R3.193 Eneolithic (main burial) 5,450±80 16356C, 12308G U4
K1.102 Eneolithic (main burial) 4,950±70 rCRS H
L112 KMK 3,230±70 16067T, 16192T HV1a2
L191 Yamna 4,030±60 16241G, 16270T, 12308G U5
R3.72 Yamna 3,910±60 16192T, 16256T, 16270T U5a
R3.162 Yamna 4,135±60 16174C-A, 16311C,
12308G U (U5b1c?)
D1.102 Catacomb N/A 16179T, 16224C,
16265G, (16270T?),
16295Ains, 16311C
K / Contamination
K2.14 Eneolithic (main burial) 4,270±90 Inconsistent pattern Not Determined
Lab personnel 1 16134C-T, 16356T-C U4a1
Lab personnel 2 16134C(ins), 16224T-C,
16311T-C K
Lab personnel 3 16007A-G, 16134C-T,
16234C-T, 16356 T-C U4a1c
Lab personnel 4 16126T-C, 16163A-G,
16186C-T, 16189T-C,
294C-T
T1
Lab personnel 5 16068T-C, 16126T-C,
16235A-G, 16265A-C R*
Lab personnel 6 16304T-C H5a
Archeologist 1 rCRS H
Table 1: Specimen data for individuals in this study

66
Table 2: Primers used for mtDNA Haplotyping
Primer
Name
Primer Sequence Product
length
Region of Coverage
(mtDNA)
Primer Source
HV1-1F CAAGCAAGTACAGCAATCAACC 64 16201-16264 This Study
HV1-1R GAGGGGTGGCTTTGGAGT This Study
HV1-2F CACATCAACTGCAACTCCAAA 63 16234-16296 This Study
HV1-2R GGGTGGGTAGGTTTGTTGGT This Study
HV1-3F CCCTCACCCACTAGGATACC 73 19260-16333 This Study
HV1-3R TGTACGGTAAATGGCTTTATG This Study
HV1-4F CAAACCTACCCACCCTTAACA 84 16282-16365 This Study
HV1-4R GGGACGAGAAGGGATTTGAC This Study
L15993 ACTCCACCATTAGCACCCAA 142 15994–16092 Nikitin et al., 2012 and
Newton, 2011
H16093 GGTGGCTGGCAGTAATGTACGAA Nikitin et al., 2012 and
Newton, 2011
L16085 TGACTCACCCATCAACAACCGC 145 16086–16188 Nikitin et al., 2012 and
Newton, 2011
H16189 CTTGCTTGTAAGCATGGGGA Nikitin et al., 2012 and
Newton, 2011
L16163 ACTTGACCACCTGTAGTACATAA 161 16164–16277 Nikitin et al., 2012 and
Newton, 2011
L16265 GTTAAGGGTGGGTAGGTTTGTTGG Nikitin et al., 2012 and
Newton, 2011
H16278 GCAACTCCAAAGCCACCCCTCA 164 16266–16385 Nikitin et al., 2012 and
Newton, 2011
H16386 GATGGTGGTCAAGGGACCCCTA Nikitin et al., 2012 and
Newton, 2011
7025H-F CCGTAGGTGGCCTGACTGGC 123 6950–7051 Santos et al., 2004
7025H-R TGATGGCAAATACAGCTCCT Santos et al., 2004
12308U-F CACAAGAACTGCTAACTCATGC 123 12217–12308 Santos et al., 2004
12308U-R ATTACTTTTATTTGGAGTTGCACCAAGATT Santos et al., 2004

67
Boyko Hutsul Lemko Hungary Poland Romania Belorussia Croatia(M
ainland)
Czech Russia Ukraine Yamna
(Ancient)
Catacomb
(Ancient)
Boyko - 0.01802
+-0.0121
0.20721
+-0.0451
0.00901+
-0.0091
0.01802
+-0.0121
0.09910+
-0.0252
0.03604+-
0.0148
0.00901+-
0.0091
0.02703+-
0.0139
0.13514+-
0.0365
0.08108+-
0.0286
0.90090+-
0.0236
0.00000+-
0.0000
Hutsul 0.0758 - 0.05405
+-0.0201
0.59459+
-0.0364
0.34234
+-0.0354
0.54955+
-0.0417
0.17117+-
0.0316
0.81081+-
0.0304
0.62162+-
0.0438
0.18919+-
0.0344
0.56757+-
0.0651
0.00901+-
0.0091
0.00000+-
0.0000
Lemko 0.00921 0.01664 - 0.00901+-0.0091
0.00901+-0.0091
0.22523+-0.0244
0.04505+-0.0203
0.00901+-0.0091
0.13514+-0.0412
0.05405+-0.0201
0.17117+-0.0286
0.03604+-0.0148
0.00000+-0.0000
Hungary 0.08505 -0.0063 0.0336 - 0.12613
+-0.0278
0.13514+
-0.0339
0.12613+-
0.0278
0.29730+-
0.0490
0.09910+-
0.0252
0.07207+-
0.0297
0.26126+-
0.0394
0.00000+-
0.0000
0.00000+-
0.0000
Poland 0.04337 0.00039 0.01622 0.00394 - 0.09009+
-0.0235
0.13514+-
0.0244
0.09910+-
0.0212
0.55856+-
0.0425
0.65766+-
0.0385
0.67568+-
0.0668
0.00000+-
0.0000
0.00000+-
0.0000
Romania 0.03294 -0.0025 0.0028 0.00783 0.00271 - 0.00000+-
0.0000
0.19820+-
0.0379
0.57658+-
0.0609
0.25225+-
0.0402
0.48649+-
0.0364
0.00000+-
0.0000
0.00000+-
0.0000
Belorussia 0.04079 0.01196 0.02787 0.00839 0.00493 0.01589 - 0.07207+-
0.0227
0.10811+-
0.0227
0.27928+-
0.0438
0.45045+-
0.0407
0.03604+-
0.0148
0.00000+-
0.0000
Croatia(Mainland) 0.06247 -0.0086 0.02434 0.00145 0.00356 0.0042 0.01179 - 0.26126+-
0.0566
0.02703+-
0.0139
0.76577+-
0.0455
0.00000+-
0.0000
0.00000+-
0.0000
Czech 0.04085 -0.0047 0.00893 0.00539 -0.0015 -0.0024 0.01 0.00114 - 0.48649+-
0.0474
0.50450+-
0.0546
0.00000+-
0.0000
0.00000+-
0.0000
Russia 0.02968 0.00561 0.0113 0.00732 -0.0012 0.0013 0.0009 0.00672 -0.0004 - 0.64865+-
0.0446
0.00000+-
0.0000
0.00000+-
0.0000
Ukraine 0.03276 -0.0057 0.01691 0.00405 -0.0039 -0.0006 -0.0009 -0.00639 -0.0039 -0.0025 - 0.02703+-
0.0139
0.00000+-
0.0000
Yamna(Ancient) -0.0224 0.08078 0.02349 0.09219 0.05685 0.05068 0.03639 0.07202 0.05651 0.04203 0.03899 - 0.00000+-
0.0000
Catacomb
(Ancient)
0.13197 0.14082 0.13838 0.13538 0.13114 0.14026 0.07997 0.12288 0.13778 0.11885 0.10811 0.07882 -
Table 3: Pairwise FST with Yamna and Catacomb against modern European human populations.

68
Boyko Hutsul Lemko Hungary Poland Romania Belorussia
Croatia(M
ainland) Czech Russia Ukraine
Yamna
(Ancient)
Catacom
b (Ancient)
Boyko 0
Hutsul 0.01034+-0.0021
0
Lemko 0.31218+
-0.0086 0.26804+
-0.0101 0
Hungary 0.00019+-0.0002
0.06234+-0.0059
0.00016+-0.0002
0
Poland 0.00755+
-0.0019 0.06202+
-0.0047 0.00310+
-0.0007
0.05411+
-0.0048
0
Romania 0.10425+
-0.0075 0.51781+
-0.0121 0.07727+
-0.0063 0.01171+
-0.0012 0.00461+
-0.0014 0
Belorussia 0.02308+-0.0022
0.06305+-0.0056
0.00407+-0.0010
0.06405+-0.0086
0.38251+-0.0143
0.00991+-0.0019
0
Croatia(Mainland
)
0.00237+
-0.0007 0.46556+
-0.0077 0.00002+
-0.0000 0.00222+
-0.0007 0.00000+
-0.0000 0.00689+
-0.0019 0.00000+-
0.0000 0
Czech 0.00881+-0.0018
0.50363+-0.0129
0.05498+-0.0032
0.00658+-0.0018
0.36067+-0.0090
0.23781+-0.0153
0.11766+-0.0086
0.00343+-0.0007
0
Russia 0.01776+
-0.0029 0.04225+
-0.0057 0.00558+
-0.0015 0.02436+
-0.0032 0.54953+
-0.0139 0.06819+
-0.0077 0.57428+-
0.0115 0.00000+-
0.0000 0.20376+-
0.0154 0
Ukraine 0.08986+-0.0080
0.28263+-0.0100
0.02802+-0.0030
0.02189+-0.0018
0.11401+-0.0084
0.46261+-0.0092
0.09001+-0.0050
0.90393+-0.0047
0.20180+-0.0081
0.22343+-0.0139
0
Yamna(Ancient) 0.93196+
-0.0028 0.00615+
-0.0009 0.24317+
-0.0062 0.00000+
-0.0000 0.00673+
-0.0022 0.00806+
-0.0020 0.02977+-
0.0031 0.00013+-
0.0001 0.00674+-
0.0018 0.00606+
-0.0014 0.05061+
-0.0032 0
Catacomb (Ancient)
0.00198+-0.0005
0.00575+-0.0016
0.00024+-0.0002
0.00026+-0.0002
0.00000+-0.0000
0.00003+-0.0000
0.00811+-0.0015
0.00146+-0.0008
0.00000+-0.0000
0.00026+-0.0001
0.00326+-0.0011
0.00364+-0.0012
0
Sources of Population Data for FST and Exact Test of Population Differentiation: Boyko: Nikitin, A et al.. (2009). Hutsul: Nikitin, A et al.. (2009).
Lemko: Nikitin, A et al.. (2009).
Hungary:Semino et al (2000). Poland:Malyarchuk et al. (2002)
Romania:Bosch et al. (2005)
Belorussia:Belyaeva et al. (2003) Croatia (Mainland):Pericic et al. (2005)
Czech:Malyarchuk et al. (2006)
Russia:Malyarchuck and Derenko (2001) Ukraine: Malyarchuck and Derenko (2001)
Yamna (Ancient): This study, Wilde et al., 2014 and Newton, 2011.
Catacomb (Ancient): This study, Wilde et al., 2014.
Table 4: Exact Test of Population Differentiation for Yamna and Catacomb against modern European human populations.

69
BANR
LBK
RSC
SCG BAC SMC
BEC
CWC
BBC
UC FBC
PWC HGS
CAR
NPO
NBQ
TRE
MNR
YAM
CAT
ENE
TYP
NNPR
NSI
ALF
AND
SEBA
-4
-3
-2
-1
0
1
2
3
4
-7 -6 -5 -4 -3 -2 -1 0 1 2 3
PC
2-
11
.35
%
PC1- 19.82%
PCA of Ancient Culture Haplogroup Frequencies
BANR
LBK
RSC
SCG
BAC
SMC
BEC
CWC
BBC
UC
FBC
PWC
HGS
CAR
NPO
NBQ
TRE
MNR
YAM
CAT
ENE
TYP
NNPR
NSI
ALF
AND
SEBA
Figure 3:
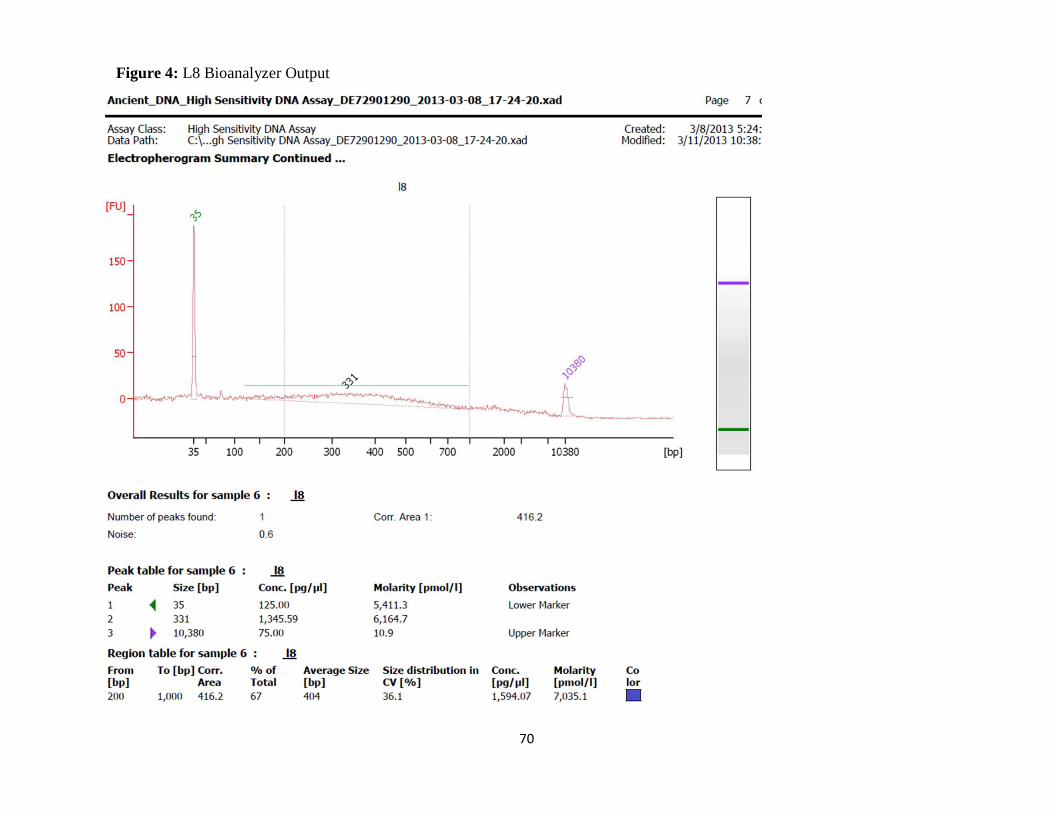
70
Figure 4: L8 Bioanalyzer Output

71
Aligned Reads
Variation from Reference Sequence
Figure 5: Example IVG and BWA Actinoplanes Alignment

72
Population abbr. Papers
Bronze Age Northern Russia BANR Der Sarkissian 2013 dissertation
Linear Pottery culture LBK Haak et al. 2005, Haak et al.
2010, Brandt et al. 2013
Rössen culture RSC Brandt et al. 2013
Schöningen group SCG Brandt et al. 2013
Baalberge culture BAC Brandt et al. 2013
Salzmönde culture SMC Brandt et al. 2013
Bernburg culture BEC Brandt et al. 2013
Corded Ware culture CWC Haak et al. 2008 , Brandt et al.
2013
Bell Beaker culture BBC Brandt et al. 2013
Unetice culture UC Brandt et al. 2013
Funnel Beaker culture FBC Malmström et al. 2009, Skoglund
et al. 2012 , Bramanti et al. 2009
Pitted Ware culture PWC Malmström et al. 2009, Skoglund
et al. 2012
Hunter-Gatherer south HGS Chandler 2003, Chandler et al.
2005 , Hervella 2010, Hervella et
al. 2012 , Snchez-Quinto et al.
2012
(Epi)Cardial CAR Gamba et al. 2011 , Lacan 2011,
Lacan et al. 2011b
Neolithic Portugal NPO Chandler 2003, Chandler et al.
2005
Neolithic Basque Country &
Navarre
NBQ Hervella 2010, Hervella et al.
2012
Treilles culture TRE Lacan 2011, Lacan et al. 2011a
Mesolithic Northern Russia MNR Der Sarkissian et al. 2013
Yamna YAM This Study, Wilde et al. 2014,
Newton 2011
Catacomb CAT This Study, Wilde et al. 2014,
Newton 2011
Eneolithic ENE This Study, Wilde et al. 2014,
Newton 2011
Trypillia TYP Nikitin 2010
Neolithic NPR NNPR Nikitin 2012
Neolithic Siberia NSI Mooder et al., 2010.
Alfold ALF Guba 2011, Burger 2007
Bronze Age Siberia- Androvo AND Molodin et al., 2012, Keyser et
al. 2009.
Siberia-Early Bronze Age SEBA Molodin et al. 2012, Mooder et
al., 2010.
Table 5: Source data and culture abbreviations for PCA.

73