genetic associations in four decades of multienvironment ... · 35806, **grain legume genetics and...
TRANSCRIPT

| INVESTIGATION
Genetic Associations in Four Decades ofMultienvironment Trials Reveal Agronomic Trait
Evolution in Common BeanAlice H. MacQueen,*,1 Jeffrey W. White,† Rian Lee,‡ Juan M. Osorno,‡ Jeremy Schmutz,§
Phillip N. Miklas,** Jim Myers,†† Phillip E. McClean,‡ and Thomas E. Juenger**Integrative Biology, The University of Texas at Austin, Texas 78712, †U.S. Arid Land Agricultural Research Center, U.S.
Department of Agriculture–Agricultural Research Service, Maricopa, Arizona 85239, ‡Genomics and Bioinformatics Program,North Dakota State University, Fargo, North Dakota 58102, §Hudson-Alpha Institute for Biotechnology, Huntsville, Alabama
35806, **Grain Legume Genetics and Physiology Research Unit, U.S. Department of Agriculture–Agricultural Research Service,Prosser, Washington 99350, and ††Department of Horticulture, Oregon State University, Corvallis, Oregon 97331
ORCID IDs: 0000-0002-4606-1832 (A.H.M.); 0000-0003-0905-3523 (J.M.O.); 0000-0001-8062-9172 (J.S.); 0000-0003-0976-144X (J.M.); 0000-0002-4809-0864 (P.E.M.); 0000-0001-9550-9288 (T.E.J.)
ABSTRACT Multienvironment trials (METs) are widely used to assess the performance of promising crop germplasm. Though seldomdesigned to elucidate genetic mechanisms, MET data sets are often much larger than could be duplicated for genetic research and,given proper interpretation, may offer valuable insights into the genetics of adaptation across time and space. The Cooperative DryBean Nursery (CDBN) is a MET for common bean (Phaseolus vulgaris) grown for. 70 years in the United States and Canada, consistingof 20–50 entries each year at 10–20 locations. The CDBN provides a rich source of phenotypic data across entries, years, and locationsthat is amenable to genetic analysis. To study stable genetic effects segregating in this MET, we conducted genome-wide associationstudies (GWAS) using best linear unbiased predictions derived across years and locations for 21 CDBN phenotypes and genotypic data(1.2 million SNPs) for 327 CDBN genotypes. The value of this approach was confirmed by the discovery of three candidate genes andgenomic regions previously identified in balanced GWAS. Multivariate adaptive shrinkage (mash) analysis, which increased our powerto detect significant correlated effects, found significant effects for all phenotypes. Mash found two large genomic regions with effectson multiple phenotypes, supporting a hypothesis of pleiotropic or linked effects that were likely selected on in pursuit of a cropideotype. Overall, our results demonstrate that statistical genomics approaches can be used on MET phenotypic data to discoversignificant genetic effects and to define genomic regions associated with crop improvement.
KEYWORDS multienvironment trial; genome-wide association; common bean (Phaseolus vulgaris); crop improvement; genetics of diversification
Almost every crop improvement program assesses theperformance of promising germplasm and breeding
material via multienvironment trials (METs). The pheno-typic data produced by these trials are extremely important
guides to growers, private seed companies, and public insti-tutions involved in crop improvement, because combiningtrial data from multiple years and locations increases theprobability of identifying genotypes that perform well, orshow especially desirable traits (Bowman 1998). Many co-operative testing networks conduct METs to enable cooper-ators and other interested parties to observe performanceover a wider range of environments than if they were onlytested locally (Annicchiarico 2002). This supports the iden-tification of advanced lines with stable, high performance inmultiple production environments. Among many others,crop testing networks that conduct METs include the U.S.cooperative regional performance testing program, the Uni-versity Crop Testing Alliance, and the Cooperative Dry BeanNursery (CDBN) (Singh 2000).
Copyright © 2020 MacQueen et al.doi: https://doi.org/10.1534/genetics.120.303038Manuscript received August 9, 2019; accepted for publication March 12, 2020;published Early Online March 23, 2020.Available freely online through the author-supported open access option.This is an open-access article distributed under the terms of the Creative CommonsAttribution 4.0 International License (http://creativecommons.org/licenses/by/4.0/),which permits unrestricted use, distribution, and reproduction in any medium,provided the original work is properly cited.Supplemental material available at: https://doi.org/10.18738/T8/KZFZ6K, Texas DataRepository Dataverse, V2.1Corresponding author: The University of Texas at Austin, 2415 Speedway, StopC0900, PAT 626, Austin, TX 78712-1208. E-mail: [email protected]
Genetics, Vol. 215, 267–284 May 2020 267
Longstanding METs such as the CDBN have often focusedon breeding for crop ideotypes, in addition to breeding toeliminate defects and to select for yield. Donald (1968) de-fined a crop ideotype as an idealized plant with trait combi-nations expected to produce a greater yield quantity orquality. In contrast, approaches that eliminate defects or se-lect for yield do not consider desirable combinations of traits;thus, these approaches only produce desirable combinationsby chance. Selection for an ideotype involves selection forcorrelated traits, and could lead to substantial pleiotropy,where a single gene affects multiple traits. METs like theCDBN, which were used to select for specific crop ideotypes,could provide insight into the genetics of trait correlations incrop genomes.
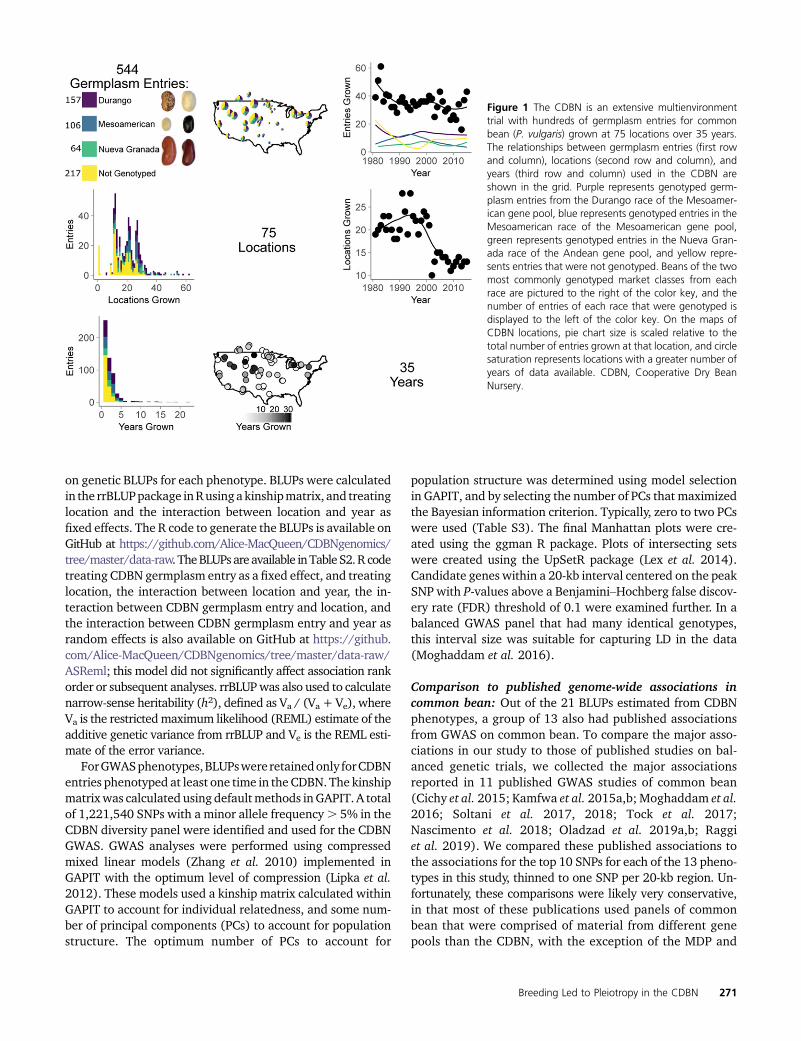
Though METs are often used to measure genetic gain overtime (Graybosch and Peterson 2010; Vandemark et al. 2014),the vast majority of METs are designed to measure pheno-typic responses to a broad set of targeted growing envi-ronments. The experimental designs of METs can posesubstantial analytical challenges to additional, unplanned ge-netic analyses. METs typically produce sparse data matricesof phenotypes across germplasm entries, locations, and years(Figure 1). The frequency of different germplasm entries mayvary as part of the normal selection process. Thus, entrieswith good performance are often tested in more locationsand years than those with poor performance. With the excep-tion of few standard checks, the set of genotypes tested eachyear typically varies, with most genotypes tested in only 1 or2 years. In addition, the total number of genotypes testedeach year can vary substantially, and this number is typicallytoo small for genome-wide association on any 1 year’s dataalone. Over the years, MET cooperators can also join or leavethe network, and add or drop MET sites or phenotypes due tochanges in research focus, personnel, or funding. All of thesevariations make METs into large unbalanced data sets thatneed to be handled properly for genetic work. Genetic anal-yses of MET germplasm can also be hampered by the diffi-culty of obtaining and genotyping previously evaluatedentries, particularly entries with poor trial performance thatwere not tested further. This difficulty may bias or preventstudies that require genetic diversity to explain phenotypicvariation, such as genome-wide association studies (GWAS).In contrast, field experiments designed for genetic studiesassess complete, balanced designs, and produce data matri-ces of phenotypes across genotypes and environments withfew or no missing cells. Ideally, the number of genotypes isidentical across all environments, and a minimum of a few hun-dred genotypes are tested in each environment. Each geno-type is also tested an equivalent number of times across sitesand years.
Despite these analytical issues, METs often produce de-cades of phenotypic data,which gives them substantial appealfor use in genetic analyses of phenotypic variation. Geneticanalyses of MET data sets have recently been implemented inseveral crop species (Hamblin et al. 2010; Rife et al. 2018;Sukumaran et al. 2018). Common bean has nutritional and
agronomic importance, a long history of METs, and manyemerging genomic tools, making it an outstanding speciesin which to assess METs that might support the genetic anal-ysis of phenotypic variation. Common bean is the most con-sumed plant protein source worldwide and is a particularlyimportant source of protein in the developing world (Jones1999). In North America, common bean improvement ef-forts remain mostly in the public sector, and over the past70 years, the CDBN has been a major testing platform forthese improvement efforts. The CDBN is the largest MET forcommon bean in the United States and Canada (Myers1988; Singh 2000), and CDBN cooperators have collectedphenotypic data on . 150 traits for hundreds of advancedbreeding lines and released cultivars (hereafter entries) ofcommon bean at. 70 locations (Figure 1), which producedup to 18,000 recorded data points per trait (Figure 2A). Thetraits are of economic and/or agronomic importance to beanproducers, and include seed yield, growth habit, seed size,phenology, and disease responses, among others (Figure 2A,Supplemental Material, Figure S1).
More than 500 CDBN entries have been grown since the1980s (Figure 1). These entries include released cultivarsand unreleased advanced breeding lines, which representmost bean types grown in North America. Entries include. 13 market classes of common bean that group into threemajor races from two independent domestication events(Mamidi et al. 2011) (Figure 1). Therefore, the CDBN canbe used as a representative sample of the genetic diversitybeing used by North American bean breeders in their pro-grams throughout the last 70 years. However, phenotypicdata from the CDBN are sparse and unevenly distributed:the average CDBN entry was grown at only 19 of the 70 lo-cations and in 2 of the 34 years, with substantial variation inthese numbers. CDBN cooperators grew between 16 and61 of the . 500 entries each year, and used 10–28 of the. 70 locations per year (Figure 1). Individual CDBN locationsgrew between 8 and 514 entries, with a median of 74 entries.Locations were used in the CDBN for as few as 1 to as many as34 years, with a median of 5 years of participation. Thoughgenotypes are present only intermittently over CDBN loca-tions and years, the vast phenotyping effort on this interre-lated set of bean germplasm, when combined with genomicdata, offers an excellent opportunity to identify genomicregions affecting phenotypic variation in this species.GWAShave elucidated candidate genes and genomic regions thataffect trait variation in many other crop species (Atwell et al.2010; Kirby et al. 2010; Mackay et al. 2012; Lin et al. 2014;McCouch et al. 2016; MacArthur et al. 2017; Xiao et al. 2017;Togninalli et al. 2018), and have recently been implemented incommon bean (Cichy et al. 2015; Kamfwa et al. 2015a,b;Moghaddam et al. 2016; Soltani et al. 2017, 2018; Tocket al. 2017; Nascimento et al. 2018; Oladzad et al. 2019a,b;Raggi et al. 2019). Combining sparse phenotypic data in agri-cultural data sets to look for pleiotropic or linked effects acrossconditions has parallels in human biomedical GWAS. In thesetrials, individual clinics can assess only a subset of human
268 A. H. MacQueen et al.

genotypes, and patients are evaluated using institution-specific criteria (Lotta et al. 2017; Visscher et al. 2017). HumanGWAS often look for common variants for common diseasesand correct phenotypes for effects of age, sex, and location(Schork et al. 2009; Mefford and Witte 2012; Zaitlen et al.2012). Analogously, we seek common, genetically stable var-iants for important phenotypes evaluated in a MET, correctedfor effects of location, year, kinship, and assessment criteria. Inhuman biomedical GWAS, pleiotropic effects of SNPs on mul-tiple diseases have frequently been observed (Sivakumaranet al. 2011). Selection for a common bean crop ideotype—witha long hypocotyl, many nodes carrying long pods, and withoutside branches, small leaves, and determinate growth (Adams1982; Kelly 2001)—is known to have led to pleiotropic orlinked effects on multiple traits, such as seed yield, biomass,lodging, and plant height (Soltani et al. 2016). To study thegenetic effects of this aspect of the CDBN selection framework,we used multivariate adaptive shrinkage (mash) to find geno-mic associations with significant effects on one or more CDBNphenotype (Urbut et al. 2019). Mash is a flexible, data-drivenmethod that shares information on patterns of effect size andsign in any data set where effects can be estimated on a con-dition-by-condition basis for many conditions (here, pheno-types) across many units (here, SNPs). It first learns patternsof covariance between SNPs and phenotypes from SNPs with-out strong effects, then combines these data-driven covari-ances with the original condition-by-condition results toproduce improved effect estimates. In this way, mash sharesinformation between conditions to increase the power to de-tect shared patterns of effects. Mash was originally used foranalyses of human biomedical data (Urbut et al. 2019) and hasyet to be used in an agricultural setting. This analysis methodcould be usedwith the rich phenotypic resources of cropMETsto understand genetic effects across multiple phenotypes oracross multiple locations and years.
Here, we demonstrate that the CDBNMET data set can beused tomake genetic discoveries, despite the sparse nature ofthedata, byusing best linear unbiasedpredictions (BLUPs) forentries phenotyped in the CDBN. We explore whether thisapproach can find genomic regions significantly associatedwith phenotypic variation, and compare associations foundwith this approach to published GWAS results obtained frommore balanced trials. We also explore patterns of genomicassociations with significant effects on more than one CDBNphenotype using mash. Our results demonstrate the value ofadding agenetic component todata sets suchas theCDBNandprovide a starting point for future work that explores thegenetics of phenotypes evaluated in METs.
Materials and Methods
Background principles: processing, digitization, andgenetic analysis of phenotypic data
METdata sets represent substantial phenotypic resources thatcan aid in the genetic study of important agronomic pheno-types. Several important steps in preparing the CDBN data for
analysis fall under the remit of data science, and specificallyinvolve the data processing steps outlined here. First, whenavailable only from printed reports, the data were renderedmachine-readable. Processing of the digitized data next in-volved cleaning the data to remove inconsistencies and spu-rious data, then filtering to retain only the relevant data. Thedata were stored in a consistent form where the semantics ofthe data setmatched theway itwas stored. Then, various datascales for individual traits such as growth habit were stan-dardized to create phenotypes that were more consistentacross locations and years. The phenotypic data were nextenriched with additional attributes that made subsequentanalyses more meaningful, such as germplasm, environment,and crop management information. Then, the data wereaggregated to create summary data by estimating BLUPs foreach phenotype.We next used aGWASmodeling approach todetermine the genomic regions associated with these datasummaries. Finally, we used mash to examine the patterns ofoverlap between genomic associations with significant effectson one or more phenotype (Urbut et al. 2019).
Phenotypic data processing
Phenotypic data for entries grown in the CDBNwere availablemainly as hard-copy reports providing plot averages at namedlocations. Some reports were available in the National Agri-cultural Library from the 1950s onward; however, reportsfrom 1981 onward had substantial additional available ge-netic material and were the focus for this analysis (Table S1).Reports from 1981 to 2015 were scanned if not in digitalformat, digitized using optical image recognition as required,and then reformatted using customSAS (SAS System, version9.4, SAS Institute, Cary, NC) scripts that also standardizednomenclature and units of measurement.
Much of the phenotypic data required additional processingto allow comparisons across locations and years. The long timespan and large number of testing locations led to the scoring of152 traits.Manyof these traits representeddistinctmethods forscoring similarphenotypes; for example, lodgingwas scoredona percent scale, a 1–5 scale, a 0–9 scale, and a 1–9 scale atdifferent locations and in different years; for this analysis,these lodging traits were standardized to one lodging pheno-type on a 1–5 scale. From 152 traits reported, 22 phenotypeswere standardized for use in GWAS, including 8 quantitativephenotypes and 14 qualitative phenotypes created from visualscores and/or specific measurements (Figure 2A). The outputfrom the R script used to standardize the phenotypes acrosslocations and years can be found online at http://rpubs.com/alice_macqueen/CDBN_Phenotype_Standardization.
We generated phenotypes associated with location code,year, and genotype information. A total of 70 location codeswere created as four-letter abbreviationswith theU.S. state orCanadian province abbreviation as the first two letters, andthe specific site abbreviation as the second two letters. Fivelocation codes ending in “2” corresponded to a second trialgrown at that location and year, usually with a treatmentsuch as drought or disease applied. Location codes were
Breeding Led to Pleiotropy in the CDBN 269
associated with latitude, longitude, elevation, and other lo-cation-specific metadata (Table S2), while genotypes wereassociated with market class and race, as well as the avail-ability of seed from the holdings of CDBN cooperators andSNP data, where available (Table S2).
In general, location by year (L*Y) combinations with out-lier phenotypic values [values above the third quartile orbelow the first quartile by 1.5 times the interquartile range(IQR)] were removed for every entry in that L*Y combina-tion. Removing outlier L*Y combinations prevented possiblebias from linear models using a biased sample of data pointsfor a L*Y, while still removing points that, by IQR measuresand by knowledge of reasonable ranges for common beanquantitative phenotypes, were likely due to mismeasurementor data entry errors. The specifics of phenotype standardiza-tion for all 22 phenotypes are given in the SupplementaryNote and the code is available on GitHub at https://github.com/Alice-MacQueen/CDBNgenomics/tree/master/analysis-paper.
Germplasm: CDBN breeding strategies, diversity panel,and SNP data set
CDBN selection framework: Selectionandbreedingstrategiesto generate new bean entries for the CDBN varied across yearsand among breeding programs. However, in general, newadvanced lineswereselected fromeither single, triple,ordoublecrosses among advanced breeding material and released culti-vars, which in most cases were already tested within the CDBNin previous years. These lines were bulked to increase seedsupply, then field tested to ensure consistency of phenotypicresponses in the advanced lines. Entries with favorable charac-teristics were often entered into the CDBN to be phenotyped inmultiple environments. Consequently, most CDBN entries weremembers of a complex pedigree that has had novel, favorablealleles recombined or introgressed into it over time.
It is clear that the CDBN is not a randomly mating, homo-geneous population, and the breeding and selection strategy inthe CDBN likely impacts GWAS on thismaterial in a number ofways. Presumably, breeders have increased the frequency ofalleles that favorablyaffectphenotypesover time,whichshouldaid in the detection of these genomic regions via GWAS. Themultiple generations of inbreeding should reduce allelic het-erogeneity, which should also aid GWAS. Indeed, we find fewheterozygous regions in our SNP data set and few examples ofmultiallelic loci. By the same token, the frequent inbreedingmay also increase the size of linkage disequilibrium(LD)blocksor cause spurious patterns of LD,whichmay cause nonsyntenicassociations and make candidate gene identification moredifficult. In addition, the infrequent crosses between the genepools from the two independent domestication events, and theassortative mating practiced as part of the breeding strategy,could lead to an inflated false-positive rate and create correla-tions between previously uncorrelated traits (Li et al. 2017).
Germplasm recovery and sequencing: To detect genomicregions associated with phenotypic variation in a GWAS
framework, it is particularly valuable to have a large amountof heritable phenotypic variation. Thus, it was equally impor-tant to include entries from the CDBN with poor seed yields ornonideal phenotypic traits as high-yielding, commercially re-leased varieties. Thus, wewent to considerable effort to obtainseed of unreleased, unarchived materials from the holdings ofCDBN cooperators. Germplasm from the entries grown in theCDBN was obtained from multiple sources, including the In-ternational Center for Tropical Agriculture, the National PlantGermplasm System, and three common bean diversity panels:the Mesoamerican Diversity Panel (MDP) (Moghaddam et al.2016), the Durango Diversity Panel (DDP) (Soltani et al.2016), and the Andean Diversity Panel (ADP) (Cichy et al.2015). Seed was also obtained from holdings of CDBN coop-erators, including Mark Brick (Colorado State University), JimKelly (Michigan State University), Phil McClean (North Da-kota State University), Phil Miklas (U.S. Department of Agri-culture–Agricultural Research Service), James Myers (OregonState University), Juan Osorno (North Dakota State Univer-sity), and Tom Smith (University of Guelph).
The SNP data set was created from this germplasm in twoways. First, raw sequence data were obtained from the ADP,DDP, and MDP (Cichy et al. 2015; Moghaddam et al. 2016) forCDBN entries and all parents of CDBN entries that had beensequenced as part of these panels. The remainder of the CDBNwas genotyped using identical methodology to these previousdiversity panels, dual-enzyme genotyping-by-sequencing(Schröder et al. 2016). Unfortunately, 39 of the older, unre-leased varieties would no longer germinate. For these varieties,we obtained DNA for sequencing by rehydrating sterilizedseeds on wetted Whatman paper in petri plates for 2–3 days,then dissecting the embryo from the seed and extracting DNAfrom the embryo. The DNA from the remaining entries wasextracted from young trifoliates. The enzymes MseI and TaqIwere used for digestion following the protocol from Schröderet al. (2016). SNPswere called from this raw sequence data usingthe pipeline found at https://github.com/Alice-MacQueen/SNP-calling-pipeline-GBS-ApeKI. Briefly, cutadapt was used to trimadapters and barcodes (Martin 2011), sickle adaptive trimmingwas used to remove ends of readswith quality scores, 20 (Joshiand Fass 2011), bwamemwas used to align reads to V2.0 of theG19833 reference genome found at https://phytozome.jgi.doe.-gov/pz/portal.html#!info?alias=Org_Pvulgaris (Li andDurbin2010; Schmutz et al. 2014), and NGSEP (Next Generation Se-quencing Experience Platform) was used to call SNPs for theentire set of CDBN entries and all parents in the CDBN ped-igrees (Duitama et al. 2014). SNPs were imputed using FIL-LIN in TASSEL. This resulted in the creation of a diversitypanel of 327 entries with MET data in the CDBN (TableS2), with aligned SNP data available on the University ofTexas Libraries data repository at DOI: https://doi.org/10.18738/T8/RTBTIR for use in the CDBNgenomics R pack-age at https://github.com/Alice-MacQueen/CDBNgenomics.
GWAS: To explore consistent genetic effects that could becompared to balanced genetic trials, analyseswere performed
270 A. H. MacQueen et al.
on genetic BLUPs for each phenotype. BLUPs were calculatedin the rrBLUPpackage inRusinga kinshipmatrix, and treatinglocation and the interaction between location and year asfixed effects. The R code to generate the BLUPs is available onGitHub at https://github.com/Alice-MacQueen/CDBNgenomics/tree/master/data-raw.TheBLUPs are available inTableS2.R codetreating CDBN germplasm entry as a fixed effect, and treatinglocation, the interaction between location and year, the in-teraction between CDBN germplasm entry and location, andthe interaction between CDBN germplasm entry and year asrandom effects is also available on GitHub at https://github.com/Alice-MacQueen/CDBNgenomics/tree/master/data-raw/ASReml; this model did not significantly affect association rankorder or subsequent analyses. rrBLUPwas also used to calculatenarrow-sense heritability (h2), defined as Va / (Va + Ve), whereVa is the restrictedmaximum likelihood (REML) estimate of theadditive genetic variance from rrBLUP and Ve is the REML esti-mate of the error variance.
ForGWASphenotypes,BLUPswere retainedonly forCDBNentries phenotyped at least one time in the CDBN. The kinshipmatrixwas calculated using defaultmethods inGAPIT. A totalof 1,221,540 SNPs with a minor allele frequency. 5% in theCDBN diversity panel were identified and used for the CDBNGWAS. GWAS analyses were performed using compressedmixed linear models (Zhang et al. 2010) implemented inGAPIT with the optimum level of compression (Lipka et al.2012). These models used a kinship matrix calculated withinGAPIT to account for individual relatedness, and some num-ber of principal components (PCs) to account for populationstructure. The optimum number of PCs to account for
population structure was determined using model selectionin GAPIT, and by selecting the number of PCs that maximizedthe Bayesian information criterion. Typically, zero to two PCswere used (Table S3). The final Manhattan plots were cre-ated using the ggman R package. Plots of intersecting setswere created using the UpSetR package (Lex et al. 2014).Candidate genes within a 20-kb interval centered on the peakSNP with P-values above a Benjamini–Hochberg false discov-ery rate (FDR) threshold of 0.1 were examined further. In abalanced GWAS panel that had many identical genotypes,this interval size was suitable for capturing LD in the data(Moghaddam et al. 2016).
Comparison to published genome-wide associations incommon bean: Out of the 21 BLUPs estimated from CDBNphenotypes, a group of 13 also had published associationsfrom GWAS on common bean. To compare the major asso-ciations in our study to those of published studies on bal-anced genetic trials, we collected the major associationsreported in 11 published GWAS studies of common bean(Cichy et al. 2015; Kamfwa et al. 2015a,b; Moghaddam et al.2016; Soltani et al. 2017, 2018; Tock et al. 2017;Nascimento et al. 2018; Oladzad et al. 2019a,b; Raggiet al. 2019). We compared these published associations tothe associations for the top 10 SNPs for each of the 13 pheno-types in this study, thinned to one SNP per 20-kb region. Un-fortunately, these comparisons were likely very conservative,in that most of these publications used panels of commonbean that were comprised of material from different genepools than the CDBN, with the exception of the MDP and
Figure 1 The CDBN is an extensive multienvironmenttrial with hundreds of germplasm entries for commonbean (P. vulgaris) grown at 75 locations over 35 years.The relationships between germplasm entries (first rowand column), locations (second row and column), andyears (third row and column) used in the CDBN areshown in the grid. Purple represents genotyped germ-plasm entries from the Durango race of the Mesoamer-ican gene pool, blue represents genotyped entries in theMesoamerican race of the Mesoamerican gene pool,green represents genotyped entries in the Nueva Gran-ada race of the Andean gene pool, and yellow repre-sents entries that were not genotyped. Beans of the twomost commonly genotyped market classes from eachrace are pictured to the right of the color key, and thenumber of entries of each race that were genotyped isdisplayed to the left of the color key. On the maps ofCDBN locations, pie chart size is scaled relative to thetotal number of entries grown at that location, and circlesaturation represents locations with a greater number ofyears of data available. CDBN, Cooperative Dry BeanNursery.
Breeding Led to Pleiotropy in the CDBN 271
DDP (Moghaddam et al. 2016; Soltani et al. 2016; Oladzadet al. 2019a,b). Both Andean and Middle-American genepools have been observed to have different SNPs underlyingdomestication traits (Schmutz et al. 2014). Eight of thesepublications used v1.0 of the Phaseolus vulgaris genomeannotation, while our associations were mapped to v2.0.We used the genome browser located at https://legumeinfo.org/genomes/gbrowse/phavu.G19833.gnm2 to convert associ-ations between these two versions of the genome annotation.We then determined the number of overlapping associationsmeeting two criteria: first, those within 200 kb of one another,and second, within 20 kb of one another and with the samecandidate gene. We determined these overlaps for the 80 asso-ciations from the 11 publishedGWAS tofind an expected rate ofoverlap, then compared this to the rate of overlap between thisstudy and the 11 balanced GWAS.
Analysis of pleiotropy or linked effects on multiplephenotypes: To increase our power to detect associationsabove an FDR, and to find genomic associations with signif-icant effects on one ormore CDBN phenotype, we used a two-step empirical Bayes procedure, mash, to estimate effects of�45,000 SNPs on 20 BLUPs determined from CDBN pheno-types (Urbut et al. 2019). Mash has been demonstrated toincrease power to detect effects in analyses of human data(Urbut et al. 2019), and while the methods are extensible to
any data set with many SNPs/markers and many pheno-types/conditions, it has not yet been used in an agriculturalsetting. It can be used for any data set where effects can beestimated for many conditions (here, phenotypes) acrossmany units (here, SNPs). Mash first learns patterns of covari-ance between SNPs and phenotypes from SNPs withoutstrong effects, then combines these data-driven covarianceswith the original condition-by-condition results to produceimproved effect estimates. In this way, mash shares informa-tion between conditions to increase the power to detectshared patterns of effects. Importantly, this method doesnot have restrictive assumptions about the patterns of effectsbetween markers or conditions. In addition, estimates withlittle uncertainty are not adversely affected by the inclusionof estimates with high uncertainty. Thus, we included 20phenotypes in the mash analysis, including 12 phenotypeswith no signal above the Benjamini–Hochberg FDR thresholdin individual GWAS. Two low-signal phenotypes related tobean common mosaic virus presence or absence were notincluded; inclusion of these phenotypes did not significantlyalter the mash results (data not shown). The procedure weused to generate input matrices for mash is captured in the Rpackage gapit2mashr, available at https://github.com/Alice-MacQueen/gapit2mashr. Briefly, the effect of the alternateallele relative to the reference allele was determined for eachSNP using GAPIT. To allow mash to converge effectively on
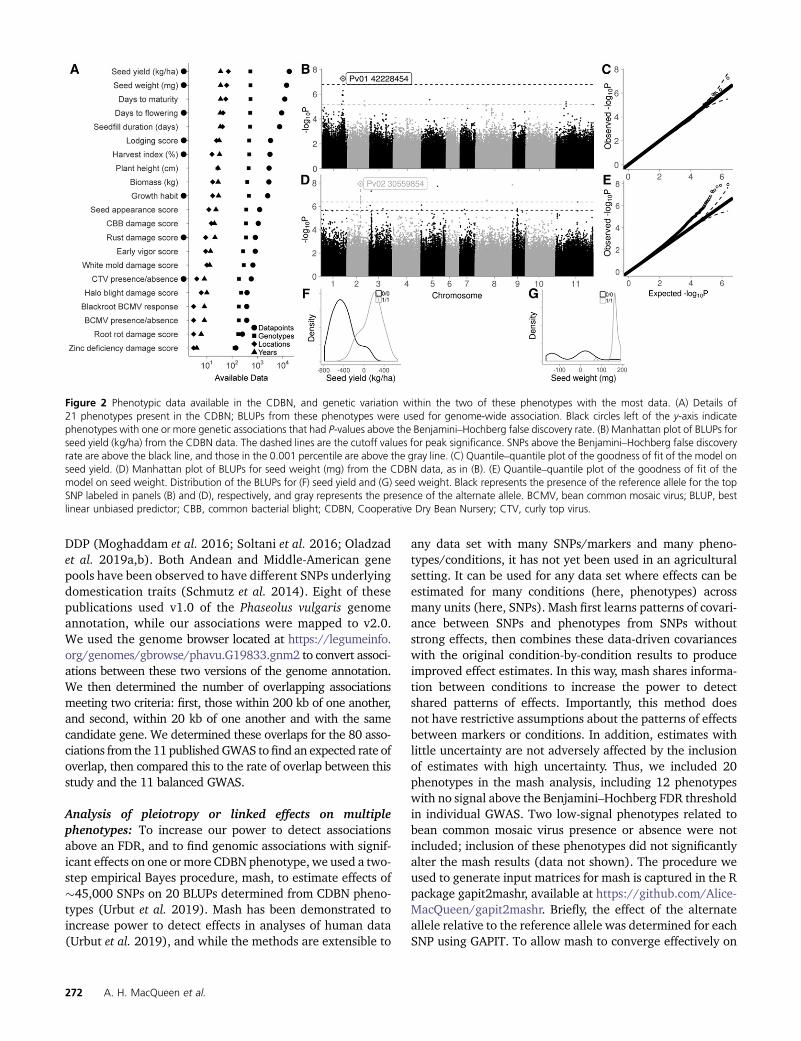
Figure 2 Phenotypic data available in the CDBN, and genetic variation within the two of these phenotypes with the most data. (A) Details of21 phenotypes present in the CDBN; BLUPs from these phenotypes were used for genome-wide association. Black circles left of the y-axis indicatephenotypes with one or more genetic associations that had P-values above the Benjamini–Hochberg false discovery rate. (B) Manhattan plot of BLUPs forseed yield (kg/ha) from the CDBN data. The dashed lines are the cutoff values for peak significance. SNPs above the Benjamini–Hochberg false discoveryrate are above the black line, and those in the 0.001 percentile are above the gray line. (C) Quantile–quantile plot of the goodness of fit of the model onseed yield. (D) Manhattan plot of BLUPs for seed weight (mg) from the CDBN data, as in (B). (E) Quantile–quantile plot of the goodness of fit of themodel on seed weight. Distribution of the BLUPs for (F) seed yield and (G) seed weight. Black represents the presence of the reference allele for the topSNP labeled in panels (B) and (D), respectively, and gray represents the presence of the alternate allele. BCMV, bean common mosaic virus; BLUP, bestlinear unbiased predictor; CBB, common bacterial blight; CDBN, Cooperative Dry Bean Nursery; CTV, curly top virus.
272 A. H. MacQueen et al.

effect estimates, the effects for each phenotype were standard-ized to fall between21 and 1, with amean of 0. Becausemashdoes not accept NA values, when GAPIT calculated SEfor # 95% of the SNPs in the GWAS, we instead calculated theSE for that phenotype usingHedges’G(Hedges andOlkin 1985).
Data-driven covariance matrices were estimated using45,000 randomly selected SNPs from the entire set of1,221,540 SNPs. These matrices were then used on the top4000 SNPs for each of the 20 traits, as determined by P-valuesin the individual GWAS, which produced a matrix of strongeffects for 45,000 SNPs. Then, we explored the patterns ofsignificant effects in the mash output. We first determinedwhich SNPs had evidence of significant phenotypic effects bydetermining SNPs with the largest Bayes factors. In this anal-ysis, the Bayes factor was the ratio of the likelihood of one ormore significant phenotypic effects at a SNP to the likelihoodthat the SNP had only null effects. Here, following Kass andRaftery (1995), a Bayes factor of. 102 is considered decisiveevidence in favor of the hypothesis that a SNP has one ormore significant phenotypic effects. We also compared thesize of significant phenotypic effects, as determined by SNPswith a local false-sign rate of # 0.05 for one or more pheno-type. The local false-sign rate is analogous to an FDR, but ismore conservative, in that it also reflects the uncertainty inthe estimation of the sign of the effect (Stephens 2017).
Data availability
Genotypic data are available at the Sequence Read Archive(SRA) under submission number SUB6162710. Code for SNPcalling is available at https://github.com/Alice-MacQueen/SNP-calling-pipeline-GBS-ApeKI.
Aligned SNP data are available at https://doi.org/10.18738/T8/RTBTIR. Raw phenotypic data are availablein the National Agricultural Library: https://www.nal.usda.gov/. Code used to generate data used in this analysisfrom the raw phenotypic data are available at Rpubs, foundat: http://rpubs.com/alice_macqueen/CDBN_Phenotype_Standardization. Code and data necessary to replicate thisanalysis are available as part of the R package CDBNgenomics,found at: https://github.com/Alice-MacQueen/CDBNgenomics.Supplemental material available at Texas Data Repository Data-verse: https://doi.org/10.18738/T8/KZFZ6K.
Results
Phenotypic correlations in the CDBN
The CDBN contains a wealth of data to study the genetics ofphenotypes and phenotypic correlations (Figure 1 and Figure2A). We were able to obtain and genotype 327 germplasmentries from the . 544 entries present in the CDBN trialsfrom 1981 to 2015, including 124 entries that were neitherreleased commercially nor submitted to the National PlantGermplasm System (National Plant Germplasm System2017), and 39 entries whose seed would not germinate. Mostof the remaining entries were grown in the CDBN before1990 and had seed stocks that, for reasons of practicality,
were no longer maintained by breeders (Figure 1). Genotyping-by-sequencing of the available genotypes generated 1.2 millionSNPs for analysis of stable effects in the CDBN.
BLUPs of phenotypes from the CDBN, conditioned onlocation, location by year, and the kinship matrix, are analo-gous to breeding values for the CDBN entries. These geneticvalues can be used to determine the narrow-sense heritability,h2, potentially explainable by GWAS. h2 varied between6 and 73% in the 21 phenotypic BLUPs (Table 1), reflectingthe substantial amount of environmental variation in the dataset. We then determined the correlations between the BLUPsof CDBN phenotypes or the genetic correlations. Correlationcoefficients between BLUPs of CDBN phenotypes variedbetween 20.75 and 0.81, and most phenotypes were signif-icantly correlated (Figure S1). Two major groups of pheno-types were positively correlated: biomass, days to flowering,plant height, zinc deficiency score, days tomaturity, blackrootpresence/absence, and early vigor were in the first of thesegroups, and white mold damage score, growth habit, seedyield, harvest index, lodging, rust damage score, bean com-mon mosaic virus damage score, and halo blight damagescore were in the second of these groups. These two groupshad negative phenotypic correlations with each other.
Eight CDBN phenotypes have genetic associationsabove the FDR
We conducted GWAS on 21 phenotypes using BLUPs calcu-lated using a kinship matrix, location, and an interactionbetween location and year as fixed effects (for details, seethe GWAS section in the Materials and Methods). To deter-mine if any SNP frequencies had changed over the duration ofthe CDBN, we also conducted GWAS on the earliest year thateach germplasm entry was present in the CDBN as a proxy forthe age of the entry. This GWAS was analogous to an envi-ronmental GWAS that uses climatic variables associated witha genotype’s location of origin (Hancock et al. 2011; Laskyet al. 2015), though this GWAS is fitted to a variable corre-lated with the age of the genotype rather than with its loca-tion of origin.
Given the analytical issues surrounding the use ofMETs forunplanned genetic analyses, it was unclearwhether GWASonCDBN phenotypes would find significant associations, or ifthese associations would be reduced or eliminated by envi-ronmental noise, or by experimental design biases. Thus, wedetermined if anyGWASonCDBNphenotypes had significantassociations after a Benjamini–Hochberg FDR correction of10%.With this criterion, significant associations were discov-ered for 8 of the 21 phenotypes. More than 33 peaks hadSNPs with P-values above the FDR, indicating the presenceof $ 30 distinct, significant associations with these eightCDBN-derived phenotypes. Phenotypes with associationsabove the FDR generally had more data points in the CDBN(6500 vs. 2400 data points, Wilcoxon rank sum test P =0.018; Figure 2A). Phenotypes with associations above theFDR also had significantly higher narrow-sense heritabilitiesestimated from the phenotypic data (h2 of 40.5 vs. 25%,
Breeding Led to Pleiotropy in the CDBN 273
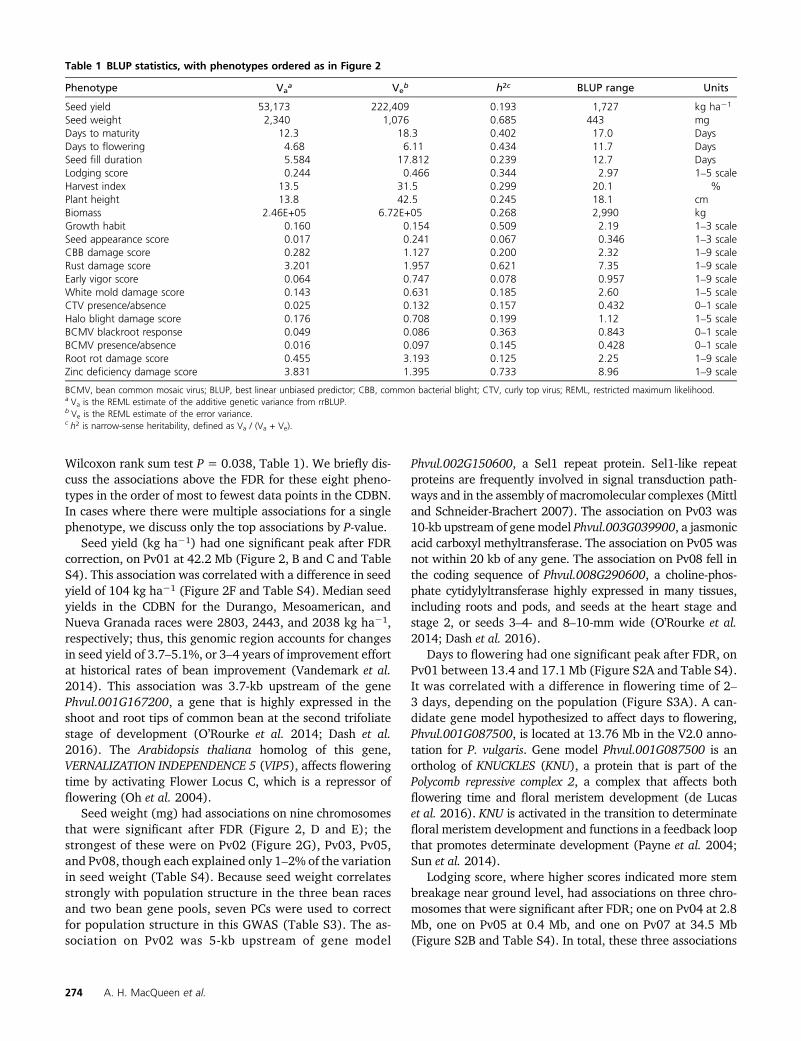
Wilcoxon rank sum test P = 0.038, Table 1). We briefly dis-cuss the associations above the FDR for these eight pheno-types in the order of most to fewest data points in the CDBN.In cases where there were multiple associations for a singlephenotype, we discuss only the top associations by P-value.
Seed yield (kg ha21) had one significant peak after FDRcorrection, on Pv01 at 42.2 Mb (Figure 2, B and C and TableS4). This association was correlated with a difference in seedyield of 104 kg ha21 (Figure 2F and Table S4). Median seedyields in the CDBN for the Durango, Mesoamerican, andNueva Granada races were 2803, 2443, and 2038 kg ha21,respectively; thus, this genomic region accounts for changesin seed yield of 3.7–5.1%, or 3–4 years of improvement effortat historical rates of bean improvement (Vandemark et al.2014). This association was 3.7-kb upstream of the genePhvul.001G167200, a gene that is highly expressed in theshoot and root tips of common bean at the second trifoliatestage of development (O’Rourke et al. 2014; Dash et al.2016). The Arabidopsis thaliana homolog of this gene,VERNALIZATION INDEPENDENCE 5 (VIP5), affects floweringtime by activating Flower Locus C, which is a repressor offlowering (Oh et al. 2004).
Seed weight (mg) had associations on nine chromosomesthat were significant after FDR (Figure 2, D and E); thestrongest of these were on Pv02 (Figure 2G), Pv03, Pv05,and Pv08, though each explained only 1–2% of the variationin seed weight (Table S4). Because seed weight correlatesstrongly with population structure in the three bean racesand two bean gene pools, seven PCs were used to correctfor population structure in this GWAS (Table S3). The as-sociation on Pv02 was 5-kb upstream of gene model
Phvul.002G150600, a Sel1 repeat protein. Sel1-like repeatproteins are frequently involved in signal transduction path-ways and in the assembly of macromolecular complexes (Mittland Schneider-Brachert 2007). The association on Pv03 was10-kb upstream of genemodel Phvul.003G039900, a jasmonicacid carboxyl methyltransferase. The association on Pv05 wasnot within 20 kb of any gene. The association on Pv08 fell inthe coding sequence of Phvul.008G290600, a choline-phos-phate cytidylyltransferase highly expressed in many tissues,including roots and pods, and seeds at the heart stage andstage 2, or seeds 3–4- and 8–10-mm wide (O’Rourke et al.2014; Dash et al. 2016).
Days to flowering had one significant peak after FDR, onPv01 between 13.4 and 17.1 Mb (Figure S2A and Table S4).It was correlated with a difference in flowering time of 2–3 days, depending on the population (Figure S3A). A can-didate gene model hypothesized to affect days to flowering,Phvul.001G087500, is located at 13.76 Mb in the V2.0 anno-tation for P. vulgaris. Gene model Phvul.001G087500 is anortholog of KNUCKLES (KNU), a protein that is part of thePolycomb repressive complex 2, a complex that affects bothflowering time and floral meristem development (de Lucaset al. 2016). KNU is activated in the transition to determinatefloral meristem development and functions in a feedback loopthat promotes determinate development (Payne et al. 2004;Sun et al. 2014).
Lodging score, where higher scores indicated more stembreakage near ground level, had associations on three chro-mosomes that were significant after FDR; one on Pv04 at 2.8Mb, one on Pv05 at 0.4 Mb, and one on Pv07 at 34.5 Mb(Figure S2B and Table S4). In total, these three associations
Table 1 BLUP statistics, with phenotypes ordered as in Figure 2
Phenotype Vaa Ve
b h2c BLUP range Units
Seed yield 53,173 222,409 0.193 1,727 kg ha21
Seed weight 2,340 1,076 0.685 443 mgDays to maturity 12.3 18.3 0.402 17.0 DaysDays to flowering 4.68 6.11 0.434 11.7 DaysSeed fill duration 5.584 17.812 0.239 12.7 DaysLodging score 0.244 0.466 0.344 2.97 1–5 scaleHarvest index 13.5 31.5 0.299 20.1 %Plant height 13.8 42.5 0.245 18.1 cmBiomass 2.46E+05 6.72E+05 0.268 2,990 kgGrowth habit 0.160 0.154 0.509 2.19 1–3 scaleSeed appearance score 0.017 0.241 0.067 0.346 1–3 scaleCBB damage score 0.282 1.127 0.200 2.32 1–9 scaleRust damage score 3.201 1.957 0.621 7.35 1–9 scaleEarly vigor score 0.064 0.747 0.078 0.957 1–9 scaleWhite mold damage score 0.143 0.631 0.185 2.60 1–5 scaleCTV presence/absence 0.025 0.132 0.157 0.432 0–1 scaleHalo blight damage score 0.176 0.708 0.199 1.12 1–5 scaleBCMV blackroot response 0.049 0.086 0.363 0.843 0–1 scaleBCMV presence/absence 0.016 0.097 0.145 0.428 0–1 scaleRoot rot damage score 0.455 3.193 0.125 2.25 1–9 scaleZinc deficiency damage score 3.831 1.395 0.733 8.96 1–9 scale
BCMV, bean common mosaic virus; BLUP, best linear unbiased predictor; CBB, common bacterial blight; CTV, curly top virus; REML, restricted maximum likelihood.a Va is the REML estimate of the additive genetic variance from rrBLUP.b Ve is the REML estimate of the error variance.c h2 is narrow-sense heritability, defined as Va / (Va + Ve).
274 A. H. MacQueen et al.

explained 8% of the variation in lodging (Figure S4). Thesignal on Pv04 fell within genemodel Phvul.004G025600; the A.thaliana homolog of this gene is involved in the biosynthesis ofinositol pyrophosphate, a cellular signaling molecule in-volved in metabolism and energy sensing (Desai et al.2014). The signal on Pv05 fell within gene modelPhvul.005G005400, a uridine diphosphate glycosyltrans-ferase superfamily protein (Dash et al. 2016). The stron-gest signal for lodging, explaining 3% of the variation, fellin the promoter region of gene model Phvul.007G221800,which is orthologous to SUPPRESSOR OF AUXIN RESIS-TANCE 1 (SAR1). In A. thaliana, SAR1 increases plantheight and internode distance, and appears to affect stemthickness (Cernac et al. 1997; Parry et al. 2006).
Harvest index, or the ratio of seed yield weight to totalabove ground biomass, had one significant association onPv03 at 2.1 Mb (Figure S2C and Table S4). The alternateallele was associated with an increase in harvest index of 1.5–3.5%, and associated with bean race (Figure S3B). This allelewas 20 kb from gene model Phvul.003G023000, a cellulosesynthase-like protein highly expressed in green mature pods,whole roots, and leaf tissue at the second trifoliate leaf stageof development (O’Rourke et al. 2014; Dash et al. 2016).
Growth habit encompasses both determinate and indeter-minate types (I and II/III), as well as upright and prostrateindeterminate types (II and III). Growth habit had significantassociationsoneverychromosomeafterFDR; thestrongest fourassociations were on Pv01 at 6.2 and 42.2Mb, on Pv09 at 30.9Mb, and Pv10 at 42.7Mb (Figure S2D andTable S4). There areknown to bemultiple determinacy loci segregating in differentgene pools of common bean (Kolkman and Kelly 2003; Kwaket al. 2012), which could complicate associations betweengrowth habit and genomic regions in the CDBN panel. Thesefour associations were associated with variation in determi-nacy in this panel; however, these four associations were notsufficient to explain all variation in determinacy, in that 13 ge-notypes had all alleles that were associated with determinacy,but were indeterminate, and one genotype had all alleles thatwere associatedwith indeterminacy, butwas determinate (Fig-ure S3C). The association at 6 Mb on Pv01 fell in the codingsequence of the gene model Phvul.001G055600, a RING-CH-type zinc finger protein expressed highly in roots and in steminternodes above the cotyledon at the second trifoliate stage(O’Rourke et al. 2014; Dash et al. 2016). The association at42.2 Mb was 3.7-kb upstream of the gene VIP5; as notedabove, this gene and genomic region were also candidate as-sociations for seed yield (kg ha21). The association on Pv09was 5-kb upstream of model Phvul.009G204100, which en-codes a signal peptide peptidase A highly expressed in podsassociatedwith stage-2 seeds and in stem internodes above thecotyledon at the second trifoliate stage (O’Rourke et al. 2014;Dash et al. 2016). The association on Pv10 was 1-kb upstreamof model Phvul.010G146500, a gene from an uncharacterizedprotein family highly expressed in roots, podswith seeds at theheart stage, and stem internodes above the cotyledon at thesecond trifoliate stage (O’Rourke et al. 2014; Dash et al. 2016).
Bean rust (Uromyces appendiculatus) causes leaf and podpustules, and leads to losses in vigor and seed yield. Higherplant damage caused by rust was indicated by a higher rustscore. Rust score had significant associations on 10 chromo-somes after FDR (Figure S2E and Table S4). However, thestrongest association was located on Pv11 at 50.6 Mb andoverlapped a major cluster of disease resistance genes con-taining the rust resistance genes Ur-3, Ur-6, Ur-7, and Ur-11(Hurtado-Gonzales et al. 2017). This signal fell just upstreamof the gene model Phvul.011G193100, which maps in theinterval suggested to contain the resistance gene Ur-3(Hurtado-Gonzales et al. 2017). The alternate allele was pre-sent in the early years of our CDBN data within the Mesoa-merican race, but was either absent or rare within theDurango race in the CDBN until 1988, when it was observedin the pinto Sierra and the great northern Starlight. The al-ternate allele was not widely distributed in the Durango raceuntil the mid-1990s (Figure S3D).
Finally, the presence or absence of curly top virus, a viruscharacterized by plant stunting anddeformation of leaves andfruit, had significant associations on seven chromosomes afterFDR; however, the strongest associationswere on Pv01, Pv05,Pv07, and Pv11 (Figure S2F andTable S4). The association onPv01 was 0.5-kb upstream of gene model Phvul.001221100,found to be associated with days to flowering (Kamfwa et al.2015b), and recently identified as the photoperiod sensitivitylocus Ppd, or PHYTOCHROME A3 (Kamfwa et al. 2015b;Weller et al. 2019). The association on Pv05 was within20 kb of genemodel Phvul.005G051400, a VQmotif-containingprotein highly expressed in leaf tissue. VQ motif-containingproteins are a class of plant-specific transcriptional regulatorsthat regulate photomorphogenesis, and responses to biotic andabiotic stresses (Jing and Lin 2015). The association on Pv07was 1-kb upstream of gene model Phvul.007G035300, apH-response regulator protein. The association on Pv11 was20-kb downstream of gene model Phvul.011G142800, a ter-pene synthase gene expressed in young trifoliates, flowers,and young pods (O’Rourke et al. 2014; Dash et al. 2016). Ter-penoids are a large class of secondary metabolite, which haveroles in plant defense against biotic and abiotic stresses (Singhand Sharma 2015).
Three CDBN genetic associations overlap geneticassociations from balanced genetic field trials
The presence of many associations above the FDR thresholdsupports using MET data for genetic analyses. However, theassortative mating employed purposefully by breeders ofentries in the CDBN could potentially lead to a high rate offalse positives (Li et al. 2017). Overall, it was unclear whetherGWAS using phenotypes derived from sparse MET data setswould yield similar genetic associations as published, bal-anced field trials. Thus, we compared the top associationsdiscovered here to associations from 11 published GWASpapers on common bean. This allowed us to compare associ-ation overlaps for 13 phenotypes, 7 of which had associationsabove the FDR, and gave 34 top associations from this study
Breeding Led to Pleiotropy in the CDBN 275
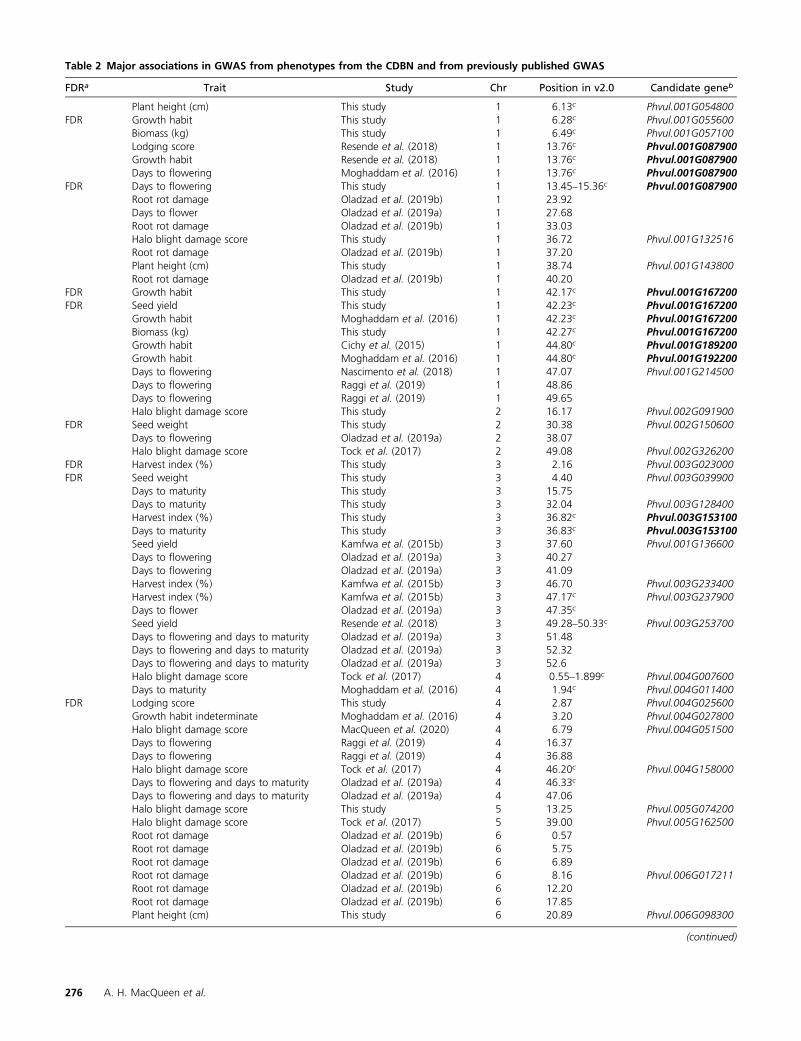
Table 2 Major associations in GWAS from phenotypes from the CDBN and from previously published GWAS
FDRa Trait Study Chr Position in v2.0 Candidate geneb
Plant height (cm) This study 1 6.13c Phvul.001G054800FDR Growth habit This study 1 6.28c Phvul.001G055600
Biomass (kg) This study 1 6.49c Phvul.001G057100Lodging score Resende et al. (2018) 1 13.76c Phvul.001G087900Growth habit Resende et al. (2018) 1 13.76c Phvul.001G087900Days to flowering Moghaddam et al. (2016) 1 13.76c Phvul.001G087900
FDR Days to flowering This study 1 13.45–15.36c Phvul.001G087900Root rot damage Oladzad et al. (2019b) 1 23.92Days to flower Oladzad et al. (2019a) 1 27.68Root rot damage Oladzad et al. (2019b) 1 33.03Halo blight damage score This study 1 36.72 Phvul.001G132516Root rot damage Oladzad et al. (2019b) 1 37.20Plant height (cm) This study 1 38.74 Phvul.001G143800Root rot damage Oladzad et al. (2019b) 1 40.20
FDR Growth habit This study 1 42.17c Phvul.001G167200FDR Seed yield This study 1 42.23c Phvul.001G167200
Growth habit Moghaddam et al. (2016) 1 42.23c Phvul.001G167200Biomass (kg) This study 1 42.27c Phvul.001G167200Growth habit Cichy et al. (2015) 1 44.80c Phvul.001G189200Growth habit Moghaddam et al. (2016) 1 44.80c Phvul.001G192200Days to flowering Nascimento et al. (2018) 1 47.07 Phvul.001G214500Days to flowering Raggi et al. (2019) 1 48.86Days to flowering Raggi et al. (2019) 1 49.65Halo blight damage score This study 2 16.17 Phvul.002G091900
FDR Seed weight This study 2 30.38 Phvul.002G150600Days to flowering Oladzad et al. (2019a) 2 38.07Halo blight damage score Tock et al. (2017) 2 49.08 Phvul.002G326200
FDR Harvest index (%) This study 3 2.16 Phvul.003G023000FDR Seed weight This study 3 4.40 Phvul.003G039900
Days to maturity This study 3 15.75Days to maturity This study 3 32.04 Phvul.003G128400Harvest index (%) This study 3 36.82c Phvul.003G153100Days to maturity This study 3 36.83c Phvul.003G153100Seed yield Kamfwa et al. (2015b) 3 37.60 Phvul.001G136600Days to flowering Oladzad et al. (2019a) 3 40.27Days to flowering Oladzad et al. (2019a) 3 41.09Harvest index (%) Kamfwa et al. (2015b) 3 46.70 Phvul.003G233400Harvest index (%) Kamfwa et al. (2015b) 3 47.17c Phvul.003G237900Days to flower Oladzad et al. (2019a) 3 47.35c
Seed yield Resende et al. (2018) 3 49.28–50.33c Phvul.003G253700Days to flowering and days to maturity Oladzad et al. (2019a) 3 51.48Days to flowering and days to maturity Oladzad et al. (2019a) 3 52.32Days to flowering and days to maturity Oladzad et al. (2019a) 3 52.6Halo blight damage score Tock et al. (2017) 4 0.55–1.899c Phvul.004G007600Days to maturity Moghaddam et al. (2016) 4 1.94c Phvul.004G011400
FDR Lodging score This study 4 2.87 Phvul.004G025600Growth habit indeterminate Moghaddam et al. (2016) 4 3.20 Phvul.004G027800Halo blight damage score MacQueen et al. (2020) 4 6.79 Phvul.004G051500Days to flowering Raggi et al. (2019) 4 16.37Days to flowering Raggi et al. (2019) 4 36.88Halo blight damage score Tock et al. (2017) 4 46.20c Phvul.004G158000Days to flowering and days to maturity Oladzad et al. (2019a) 4 46.33c
Days to flowering and days to maturity Oladzad et al. (2019a) 4 47.06Halo blight damage score This study 5 13.25 Phvul.005G074200Halo blight damage score Tock et al. (2017) 5 39.00 Phvul.005G162500Root rot damage Oladzad et al. (2019b) 6 0.57Root rot damage Oladzad et al. (2019b) 6 5.75Root rot damage Oladzad et al. (2019b) 6 6.89Root rot damage Oladzad et al. (2019b) 6 8.16 Phvul.006G017211Root rot damage Oladzad et al. (2019b) 6 12.20Root rot damage Oladzad et al. (2019b) 6 17.85Plant height (cm) This study 6 20.89 Phvul.006G098300
(continued)
276 A. H. MacQueen et al.
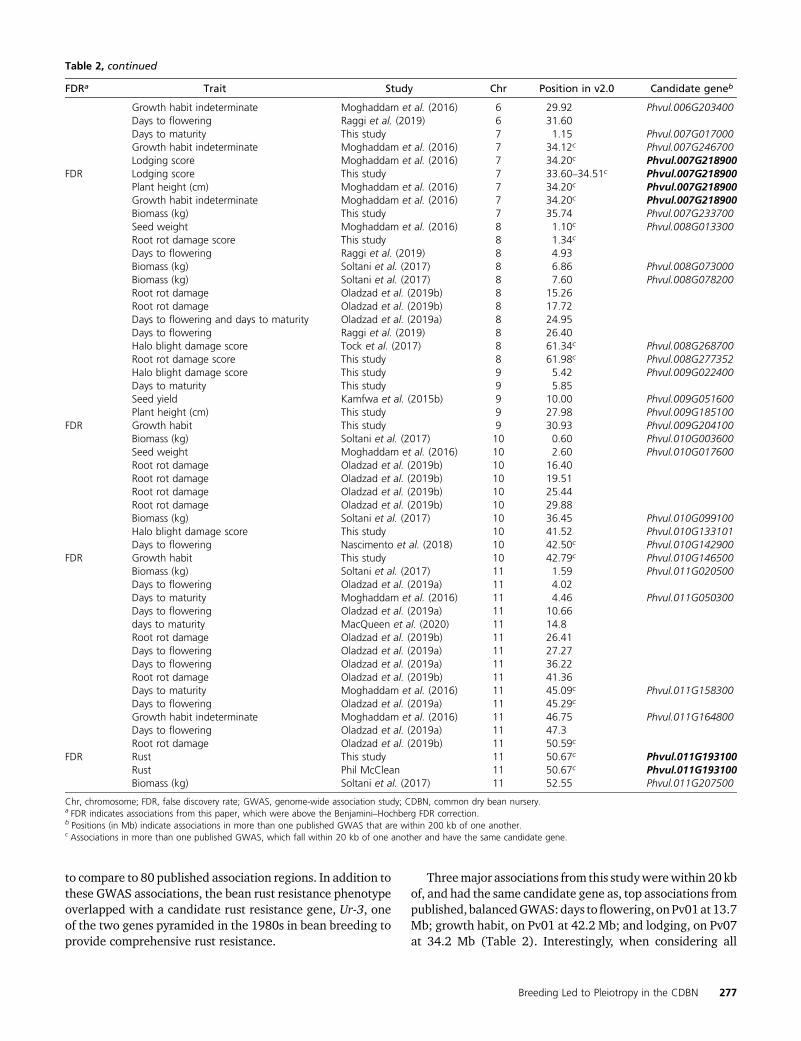
to compare to 80 published association regions. In addition tothese GWAS associations, the bean rust resistance phenotypeoverlapped with a candidate rust resistance gene, Ur-3, oneof the two genes pyramided in the 1980s in bean breeding toprovide comprehensive rust resistance.
Threemajor associations from this studywerewithin 20 kbof, and had the same candidate gene as, top associations frompublished, balancedGWAS:days toflowering, onPv01at13.7Mb; growth habit, on Pv01 at 42.2 Mb; and lodging, on Pv07at 34.2 Mb (Table 2). Interestingly, when considering all
Table 2, continued
FDRa Trait Study Chr Position in v2.0 Candidate geneb
Growth habit indeterminate Moghaddam et al. (2016) 6 29.92 Phvul.006G203400Days to flowering Raggi et al. (2019) 6 31.60Days to maturity This study 7 1.15 Phvul.007G017000Growth habit indeterminate Moghaddam et al. (2016) 7 34.12c Phvul.007G246700Lodging score Moghaddam et al. (2016) 7 34.20c Phvul.007G218900
FDR Lodging score This study 7 33.60–34.51c Phvul.007G218900Plant height (cm) Moghaddam et al. (2016) 7 34.20c Phvul.007G218900Growth habit indeterminate Moghaddam et al. (2016) 7 34.20c Phvul.007G218900Biomass (kg) This study 7 35.74 Phvul.007G233700Seed weight Moghaddam et al. (2016) 8 1.10c Phvul.008G013300Root rot damage score This study 8 1.34c
Days to flowering Raggi et al. (2019) 8 4.93Biomass (kg) Soltani et al. (2017) 8 6.86 Phvul.008G073000Biomass (kg) Soltani et al. (2017) 8 7.60 Phvul.008G078200Root rot damage Oladzad et al. (2019b) 8 15.26Root rot damage Oladzad et al. (2019b) 8 17.72Days to flowering and days to maturity Oladzad et al. (2019a) 8 24.95Days to flowering Raggi et al. (2019) 8 26.40Halo blight damage score Tock et al. (2017) 8 61.34c Phvul.008G268700Root rot damage score This study 8 61.98c Phvul.008G277352Halo blight damage score This study 9 5.42 Phvul.009G022400Days to maturity This study 9 5.85Seed yield Kamfwa et al. (2015b) 9 10.00 Phvul.009G051600Plant height (cm) This study 9 27.98 Phvul.009G185100
FDR Growth habit This study 9 30.93 Phvul.009G204100Biomass (kg) Soltani et al. (2017) 10 0.60 Phvul.010G003600Seed weight Moghaddam et al. (2016) 10 2.60 Phvul.010G017600Root rot damage Oladzad et al. (2019b) 10 16.40Root rot damage Oladzad et al. (2019b) 10 19.51Root rot damage Oladzad et al. (2019b) 10 25.44Root rot damage Oladzad et al. (2019b) 10 29.88Biomass (kg) Soltani et al. (2017) 10 36.45 Phvul.010G099100Halo blight damage score This study 10 41.52 Phvul.010G133101Days to flowering Nascimento et al. (2018) 10 42.50c Phvul.010G142900
FDR Growth habit This study 10 42.79c Phvul.010G146500Biomass (kg) Soltani et al. (2017) 11 1.59 Phvul.011G020500Days to flowering Oladzad et al. (2019a) 11 4.02Days to maturity Moghaddam et al. (2016) 11 4.46 Phvul.011G050300Days to flowering Oladzad et al. (2019a) 11 10.66days to maturity MacQueen et al. (2020) 11 14.8Root rot damage Oladzad et al. (2019b) 11 26.41Days to flowering Oladzad et al. (2019a) 11 27.27Days to flowering Oladzad et al. (2019a) 11 36.22Root rot damage Oladzad et al. (2019b) 11 41.36Days to maturity Moghaddam et al. (2016) 11 45.09c Phvul.011G158300Days to flowering Oladzad et al. (2019a) 11 45.29c
Growth habit indeterminate Moghaddam et al. (2016) 11 46.75 Phvul.011G164800Days to flowering Oladzad et al. (2019a) 11 47.3Root rot damage Oladzad et al. (2019b) 11 50.59c
FDR Rust This study 11 50.67c Phvul.011G193100Rust Phil McClean 11 50.67c Phvul.011G193100Biomass (kg) Soltani et al. (2017) 11 52.55 Phvul.011G207500
Chr, chromosome; FDR, false discovery rate; GWAS, genome-wide association study; CDBN, common dry bean nursery.a FDR indicates associations from this paper, which were above the Benjamini–Hochberg FDR correction.b Positions (in Mb) indicate associations in more than one published GWAS that are within 200 kb of one another.c Associations in more than one published GWAS, which fall within 20 kb of one another and have the same candidate gene.
Breeding Led to Pleiotropy in the CDBN 277
114 associations, each of these three regions had significanteffects for three phenotypes: lodging, growth habit, and daysto flowering on Pv01 at 13.7 Mb; growth habit, seed yield,and biomass on Pv01 at 42.2 Mb; and plant height, lodging,and growth habit on Pv07 at 34.2 Mb (Table 2). In this study,the top 10 SNPs for harvest index and days to maturity alsohad the same candidate gene on Pv03 at 36.8 Mb, the genemodel Phvul.003G153100. Phvul.003G153100 is an APE-TALA2-like ethylene-responsive transcription factor that ishighly expressed in root tissue and nodules (O’Rourke et al.2014; Dash et al. 2016). This region of Pv03 has also beenfound to have a genetically stable effect on seed yield (Kelly2018), though our GWAS on seed yield did not detect thisregion at a 10% FDR.
In comparisons involving only the 11 balanced studies, 9 of80 associations fell into three 20-kb regions, while 15 of the80 associations fell into six 200-kb regions. When this studywas added, seven additional associations fell into four 20-kbregions, while 12 additional associations fell into 14 overlap-ping 200-kb regions (Table 2). This study did not identifymany new overlaps at the 20-kb level, though it did findassociations in all three 20-kb overlapping regions found bycomparing the 11 balanced studies alone. However, it didfind many new overlaps with previously published studiesat the 200-kb level, twice as many as expected given the rateof overlap in the 11 balanced studies (x2 test P = 0.025).However, as the balanced studies often did not conductGWAS on similar phenotypes, our “expected” rate of overlapis likely to be biased. Thus, we consider the fact that thisstudy found the same three 20-kb regions that overlap inbalanced GWAS comparisons to be stronger evidence thanthe large number of overlaps at the 200-kb level of the con-clusion that this panel can yield similar associations to bal-anced GWAS of common bean diversity panels.
Extensive pleiotropy or linked effects within CDBNgenetic associations
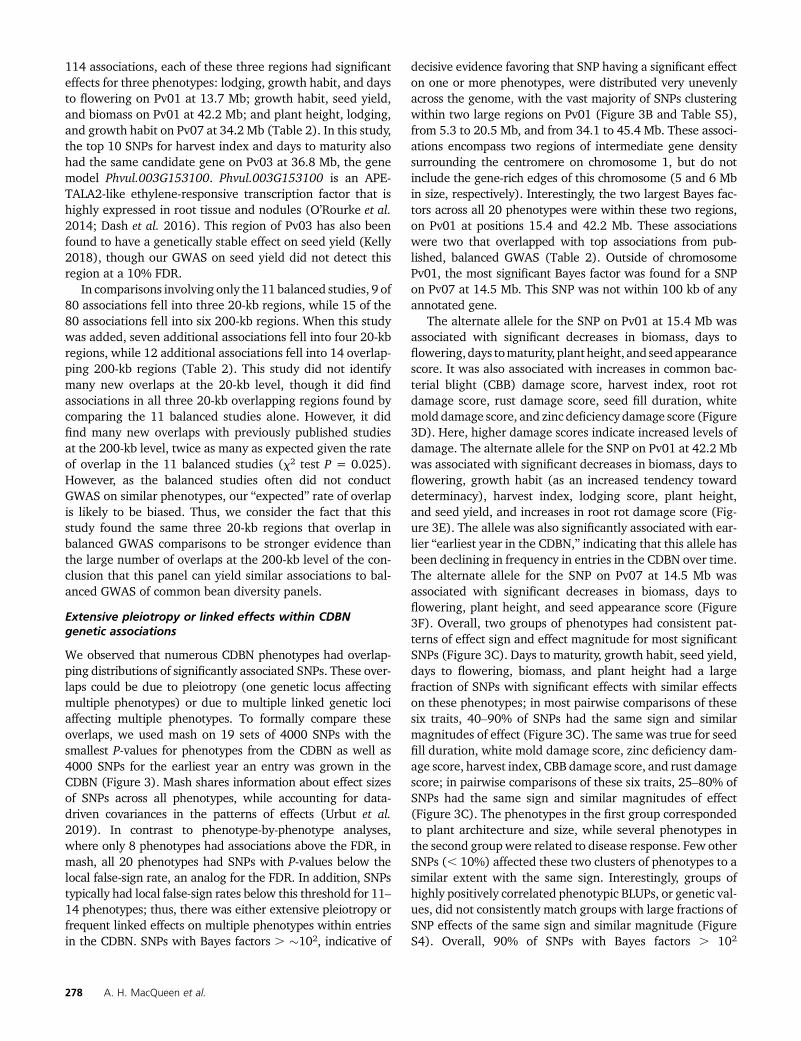
We observed that numerous CDBN phenotypes had overlap-ping distributions of significantly associated SNPs. These over-laps could be due to pleiotropy (one genetic locus affectingmultiple phenotypes) or due to multiple linked genetic lociaffecting multiple phenotypes. To formally compare theseoverlaps, we used mash on 19 sets of 4000 SNPs with thesmallest P-values for phenotypes from the CDBN as well as4000 SNPs for the earliest year an entry was grown in theCDBN (Figure 3). Mash shares information about effect sizesof SNPs across all phenotypes, while accounting for data-driven covariances in the patterns of effects (Urbut et al.2019). In contrast to phenotype-by-phenotype analyses,where only 8 phenotypes had associations above the FDR, inmash, all 20 phenotypes had SNPs with P-values below thelocal false-sign rate, an analog for the FDR. In addition, SNPstypically had local false-sign rates below this threshold for 11–14 phenotypes; thus, there was either extensive pleiotropy orfrequent linked effects on multiple phenotypes within entriesin the CDBN. SNPs with Bayes factors . �102, indicative of
decisive evidence favoring that SNP having a significant effecton one or more phenotypes, were distributed very unevenlyacross the genome, with the vast majority of SNPs clusteringwithin two large regions on Pv01 (Figure 3B and Table S5),from 5.3 to 20.5 Mb, and from 34.1 to 45.4 Mb. These associ-ations encompass two regions of intermediate gene densitysurrounding the centromere on chromosome 1, but do notinclude the gene-rich edges of this chromosome (5 and 6 Mbin size, respectively). Interestingly, the two largest Bayes fac-tors across all 20 phenotypes were within these two regions,on Pv01 at positions 15.4 and 42.2 Mb. These associationswere two that overlapped with top associations from pub-lished, balanced GWAS (Table 2). Outside of chromosomePv01, the most significant Bayes factor was found for a SNPon Pv07 at 14.5 Mb. This SNP was not within 100 kb of anyannotated gene.
The alternate allele for the SNP on Pv01 at 15.4 Mb wasassociated with significant decreases in biomass, days toflowering, days tomaturity, plant height, and seedappearancescore. It was also associated with increases in common bac-terial blight (CBB) damage score, harvest index, root rotdamage score, rust damage score, seed fill duration, whitemold damage score, and zinc deficiency damage score (Figure3D). Here, higher damage scores indicate increased levels ofdamage. The alternate allele for the SNP on Pv01 at 42.2 Mbwas associated with significant decreases in biomass, days toflowering, growth habit (as an increased tendency towarddeterminacy), harvest index, lodging score, plant height,and seed yield, and increases in root rot damage score (Fig-ure 3E). The allele was also significantly associated with ear-lier “earliest year in the CDBN,” indicating that this allele hasbeen declining in frequency in entries in the CDBN over time.The alternate allele for the SNP on Pv07 at 14.5 Mb wasassociated with significant decreases in biomass, days toflowering, plant height, and seed appearance score (Figure3F). Overall, two groups of phenotypes had consistent pat-terns of effect sign and effect magnitude for most significantSNPs (Figure 3C). Days to maturity, growth habit, seed yield,days to flowering, biomass, and plant height had a largefraction of SNPs with significant effects with similar effectson these phenotypes; in most pairwise comparisons of thesesix traits, 40–90% of SNPs had the same sign and similarmagnitudes of effect (Figure 3C). The same was true for seedfill duration, white mold damage score, zinc deficiency dam-age score, harvest index, CBB damage score, and rust damagescore; in pairwise comparisons of these six traits, 25–80% ofSNPs had the same sign and similar magnitudes of effect(Figure 3C). The phenotypes in the first group correspondedto plant architecture and size, while several phenotypes inthe second group were related to disease response. Few otherSNPs (, 10%) affected these two clusters of phenotypes to asimilar extent with the same sign. Interestingly, groups ofhighly positively correlated phenotypic BLUPs, or genetic val-ues, did not consistently match groups with large fractions ofSNP effects of the same sign and similar magnitude (FigureS4). Overall, 90% of SNPs with Bayes factors . 102
278 A. H. MacQueen et al.

affected $ 10 phenotypes (Table S5) and typically affectedphenotypes in the two groups in similar ways. However, a fewexceptions included Pv03 at 10.64 Mb, which affected onlyplant height; Pv04 at 17.77 Mb, which affected seed weightand varied with earliest year in the CDBN; Pv07 at 13.94 Mb,which affected biomass; and Pv08 at 33.18 Mb, which af-fected days to flowering, plant height, and seed appearance.
Discussion
Thegenes andgenomic regions affectingphenotypic variationin commonbeanarenowbeingnarroweddownwith theaidofa recently released high-quality reference genome (Schmutzet al. 2014). The use of previously generated phenotypic datafor genetic analysis could circumvent the “phenotypic bottle-neck” that has previously constrained our understanding ofthe genotype–phenotype map in this species. The CDBN of-fers a vast phenotypic data resource for common bean; how-ever, it was unclear whether the sparse phenotypic datamatrix from the CDBN, where only 20–30 entries were testedin each location and year, could be used for GWAS. Our re-sults provide evidence supporting the use ofMETs such as theCDBN for genetic analysis. First, 8 of the 22 phenotypes
created using the CDBN data had associations that fell abovethe Bonferroni–Hochberg FDR threshold, and 5 of these phe-notypes had multiple independent peaks that fell above thisthreshold. Given our FDR of 10%, there were $ 30 distinct,significant associations with these CDBN-derived BLUPs forphenotypes, and these associations tended to be found inphenotypes with higher heritabilities. However, it is still sur-prising that only 8 of the 22 phenotypes had significant as-sociations by the FDR criterion.
We hypothesized that noise caused by environmental orgene-by-environmental variation in phenotypes across yearsand locations reduced our ability to find significant associa-tions in a condition-by-condition analysis. Supporting thishypothesis, we found that phenotypes with more data pointsin the CDBN were more likely to have associations above theFDR.Weusedmash to increase our power to detect significanteffects for 20 of these phenotypes, and used an analog of theFDR, the local false-sign rate, to determine whether aneffect was significant. Mash has been demonstrated to havehigher power to detect significant shared effects in correlatedphenotypes by shrinking effect estimates toward covariancematrices informed by patterns in the data (Urbut et al. 2019).Withoutmash,we found significant associations for 8 phenotypes;
Figure 3 Patterns of phenotypic effects of genetic associations for 22 phenotypes from the CDBN, determined using multivariate adaptive shrinkage.(A) SNPs with significant effects on 1 or more of the 22 phenotypes in the CDBN. (B) Manhattan plot of the Bayes factor (log10) comparing the modellikelihood that the SNP has significant effects to the likelihood that it has no significant effects. Bayes factors of . 102 are considered decisive evidencein favor of the alternate model. Point color represents the number of phenotypes for which the SNP has a local false-sign rate, 0.05. Squares representeven chromosomes, while circles represent odd chromosomes. The top associations for three regions of the genome are highlighted. (C) Correlation inthe sign and magnitude of significant effects in all pairwise comparisons of the 22 CDBN phenotypes. Circle size and color indicate the fraction of allsignificant SNPs that have the same effect sign and similar effect magnitude. (D–F) Effect estimates and standard errors for 22 phenotypes for the topassociations from three regions of the genome, (D) P. vulgaris chromosome 1 (Pv01) at 15.4 Mb, (E) Pv01 at 42.2 Mb, and (F) Pv07 at 14.5 Mb. Genomiclocations are based on the P. vulgaris v2.1 genome annotation. Standard error bars are colored by the six groups present in (C). CBB, common bacterialblight; CDBN, Cooperative Dry Bean Nursery; CTV, curly top virus.
Breeding Led to Pleiotropy in the CDBN 279
using mash, we found significant associations for all 20 phe-notypes. Thus, phenotypes derived from CDBNMET data aresuitable for analysis using GWAS, and the additional pheno-typic data available in this MET can be analyzed in mash toboost the power to detect significant genetic effects for SNPsthat affect multiple phenotypes.
Second, associations found in our GWAS colocalized withresultsofpreviousGWASusingbalancedphenotypicdata sets.Threeassociations fromthis studyoverlapped topassociationsfrom published, balanced GWAS: Pv01 at 13.7 Mb, Pv01 at42.2 Mb, and Pv07 at 34.2 Mb (Table 2). The association at13.7 Mb fell near the candidate gene KNU, a gene that isactivated in, and later promotes, the transition to determi-nate floral meristem development. This peak falls within anassociation for days to flowering observed previously(Moghaddam et al. 2016). The association at 42.2 Mb fellnear the candidate gene VIP5, an important regulator of flow-ering time in A. thaliana and other species (Huang et al.2012). Other mapping studies have also colocated VIP5 withQTL for flowering time (Zhou et al. 2014). The association at34.2 Mb on Pv07 also overlapped the strongest associationfor the earliest year each entry was grown in the CDBN, aproxy for the age of the CDBN entry. This association fell nearthe candidate gene SAR1, which increases plant height andinternode distance in A. thaliana (Cernac et al. 1997; Parryand Estelle 2006). A genomic region affecting determinacy incommon bean has been confirmed on Pv07; a genomic regionaffecting determinacy, part of growth habit, would also affectthe traits that we find to be affected by this region: biomass,days to flowering, plant height, and seed appearance score.The alternate allele for the signal on Pv07 occurred in newerCDBN entries.
Third, our results are consistent with the recent history ofbreeding efforts in common bean, and provide a map of thegenomic regions that have been associatedwith improvementin the species. Using mash, we found two major genomicregions on Pv01 associated with many CDBN phenotypes(Figure 3B). Though SNPs for mash were chosen to havelow LD (r2 , 0.2), significant SNPs nonetheless highlighttwo, large linked regions on chromosome 1 that have effectson many phenotypes. Regions of this size (15 and 11 Mb)with evidence for significant effects almost certainly requirethe presence of multiple linked genes with effects onmultiplephenotypes. Linked effects do not preclude pleiotropic effectsoccurring at single loci within this large region, though mo-lecular confirmation of pleiotropy is still necessary. We sug-gest that the two major genomic regions on Pv01 associatedwith many CDBN phenotypes were major targets of selectionby breeders for entries that matched an “ideotype” for com-mon bean. The original ideotype had a long hypocotyl, manynodes carrying long pods and without side branches, smallleaves, and determinate growth (Adams 1982; Kelly 2001).The primary plant architecture change introduced into geno-types tested in the CDBN over the past 30 years was theadoption of upright indeterminate architecture (type II),which replaced upright determinate (type I) architecture in
the Mesoamerican race and was introduced into prostrateindeterminate (type III) germplasm (Kelly 2001; Soltaniet al. 2016). Generally, entries with type II architecture yieldedmore than determinate (type I) entries, due to the increasedpod set associated with indeterminate growth (Kelly 2001).Entries with type II architecture could yield more than type IIIentries under grower-preferred direct harvest (Eckert et al.2011). An association for growth habit on Pv01 at 42.2 Mbfell near the gene VIP5; this SNP and genewere also candidateassociations for seed yield in this study and days toflowering inMoghaddam et al. (2016). The Pv01, Pv09, and Pv10 associ-ations for growth habit alter determinacy and segregate indifferent genotypes, consistent with the known multiple ori-gins of determinacy segregating in this species (Figure S3C).However, these associations were not sufficient to explain allvariation in determinacy present in this panel, perhaps due tothe relative rarity of some variants controlling determinacywithin the CDBN panel.
Bean breeders in North America generally avoided mod-ifying days to flowering over the years of the CDBN, to protectmatching of phenology to specific production environments.However, when type II architecture was introduced fromMesoamerica race into the Durango/Jalisco race, the firstentries with this architecture showed delayed flowering,which prevented pod set on lower nodes (Vandemark et al.2014). Our strongest association for days to flowering wasnear the candidate gene KNU. This gene is a candidate for thegene Higher response (Hr) (Gu et al. 1998), which affectsflowering time. A basic local alignment search tool analysisof random amplified polymorphic DNA primers from previ-ous mapping analyses constrains the location of Hr between1.4 and 21Mb on Pv01 (Gu et al. 1998).Hr is thus a plausiblecandidate for the peak at 13Mb.Hr is known to be in LD withthe common bean gene terminal flower 1 (PvTFL1 or fin) onPv01, a major determinacy gene in common bean, (Repinskiet al. 2012). Thus, this gene could plausibly have been in-troduced during the introduction of type II architecture.
The primary disease resistance phenotype introduced intoentries in the CDBN over the past 30 years was bean rustresistance. Bean rust (U. appendiculatus) was a major diseasein North America in the 20th century (Zaumeyer 1947). Al-though the first rust-resistant varieties were released in the1940s (Zaumeyer 1947), rust was primarily controlled bychemicals prior to the concerted introduction of rust resis-tance genes in the mid-1980s (Kelly 2001). Our strongestassociation for rust damage score fell just upstream of thegene model Phvul.011G193100, which maps in the intervalsuggested to contain the resistance gene Ur-3 (Hurtado-Gonzales et al. 2017). Initially described by Ballantyne(1978), Ur-3 was the first gene aggressively used by USbreeders to address bean rust in the mid-1980s (Hurtado-Gonzales et al. 2017). Combining Ur-3 and Ur-11 providesresistance against all known rust races (Pastor-Corrales et al.2003), and the two genes formed the basis of breeding effortsto pyramid major bean rust resistance genes that led to therelease of pinto, great northern, and black bean germplasm
280 A. H. MacQueen et al.
currently used in breeding programs. The alternate allele waspresent in the early years of the CDBN data in the Mesoamer-ican race, but was either absent or rare in the Durango/Jaliscorace in the CDBN until 1988, when it was observed in the pintoSierra and the great northern variety Starlight. The alternateallele was not widely distributed in the Durango/Jalisco raceuntil themid-1990s (Figure S3D). These results agree with theknown timing of breeding for rust resistance.
Finally, this work allowed us to characterize the patterns ofsharingof genetic effects onphenotypes in theCDBN,using anexciting new method to determine if this data set could un-cover novel results. Selection for the commonbean ideotype isknown to have led to pleiotropic effects on other traits, such asseed yield, biomass, and plant height (Soltani et al. 2016).Previous work has indicated that genes responding to photo-period have a major influence on many traits, including bio-mass, harvest index, days to maturity, and plant architecturetraits such as the number of branches and nodes (Wallaceet al. 1993; Gu et al. 1994). Our associations also revealedsubstantial overlaps in the genomic regions affecting pheno-typic variation, suggesting the presence of substantial pleiot-ropy or linked genes of major effect. The genomic region onPv01 from 34 to 48 Mb has also been identified in previousQTL mapping studies as one that affects many traits, includ-ing seed yield, days to flowering, days to maturity, seed fillduration, seed weight, biomass, and pod wall ratio (Trappet al. 2015, 2016). Our mash analysis reveals two majorgroups of phenotypes with commonly shared SNP effects,one corresponding to plant architecture and size, and theother related to disease response. Very few SNPs had similareffects on both groups of traits (Figure 3C). This indicatespleiotropy or correlated effects within each group of pheno-types, and unlinked effects or antagonistic pleiotropy be-tween these groups of phenotypes. In addition, the twogroups of phenotypes that had similar genetic effects at theSNP level did not substantially overlap groups of phenotypesthat had highly correlated genetic values by BLUP estimation(Figure S4). Though many genomic regions affect multiplephenotypes in the CDBN, the large shared effects detected bymash do not always combine additively into the overall pat-terns of genetic correlation present in this data set. However,two sets of phenotypes did have shared SNP effects and sim-ilar patterns of phenotypic correlations: lodging, seed yield,and growth, and biomass, plant height, days to flowering,and days tomaturity.We suggest that these seven phenotypeswere the most important when breeders selected for pre-ferred common bean ideotypes. In contrast, many of theremaining phenotypes were related to disease damage; thesephenotypes might be more affected by epistatic interactionsbetween genomic regions or by tradeoffs across environments.
Overall, METs such as the CDBN offer a remarkable op-portunity to identify candidate genes underlying phenotypicvariation and phenotypic plasticity, and to identify how arti-ficial selection has affected crop phenotypes through time.Wenote that the genomic regions found with this approach arelikely to have consistent, stable phenotypic effects across a
large range of environments. These genomic regions are thuslikely to be generally useful to bean breeding. Detailed map-ping and cloning of the causative genes in these regions willprovide insight into molecular mechanisms that control thesecritical phenotypes important for high productivity of com-mon bean. In the future, we also believe that it would be ofgreat value to crop breeding and genetics to archiveDNA fromall material used in breeding programs and MET trials.
Many crops, both in the U.S. and worldwide, have publictrials that could be mined in a manner similar to our approach.This work will require collaborative efforts between cropbreeders and bioinformaticians to digitize, clean, and analyzephenotypicdata fromMETs, and toobtaingeneticmaterial fromsuccessful andunsuccessful trial entries. Phenotypic andgeneticdatacanbecombinedusinggenomicselectionapproaches,orbyGWASusingmodels thatadjustBLUPs foreffectsof kinship, triallocation, and trial year (Rife et al. 2018; Sukumaran et al.2018). If effect estimates for genetic markers can be obtainedand some effects are strong, the patterns of significant effectsacross markers and phenotypes can be determined using ametanalysis approach such as mash (Urbut et al. 2019). Abroader effort to collectively mine such extensive phenotypicdata could identify conserved genetic factors important forimproved productivity for many crops in major productionregions. We present the CDBNgenomics R package and anal-ysis as a resource for other researchers to use the CDBN dataset, and to apply these techniques to other MET data sets.
Acknowledgments
The authors thank An Hang, John Kolar, and Shree Singh forsubstantial contributions over the history of the CDBN;Melody Yeh for assistance in digitizing and harmonizing theCDBN reports; and thank the Joint Genome Institute forprepublication access and use of the P. vulgaris V2.1 genomeand annotation. The U.S. Department of Agriculture is anequal opportunity provider and employer. This research waspartially funded by support from the National Science Foun-dation, Plant Genomes Research Program (grant IOS-1612262 to A.H.M.).
Author contributions: A.H.M., J.M.O., J.W.W., P.E.M., andT.E.J. conceived of the analysis. P.E.M., J.M.O., P.N.M., andJ.M. provided seed for varieties in the CDBN. A.H.M., R.L.,P.E.M., and J.S. sequenced the CDBN. R.L. and P.E.M.provided sequence data from the ADP and MDP. J.W.W.compiled the phenotypic data from the annual CDBNreports. AHM conducted the analyses with input fromJ.W.W., P.E.M., and T.E.J. A.H.M. wrote the manuscriptwith contributions from all authors.
Literature Cited
Adams, M. W., 1982 Plant architecture and yield breeding inPhaseolus vulgaris L. Iowa State J. Res. 56: 225–254.
Annicchiarico, P., 2002 Genotype x Environment Interactions -Challenges and Opportunities for Plant Breeding and Cultivar
Breeding Led to Pleiotropy in the CDBN 281
Recommendations. Food and Agriculture Organization of theUnited Nations, Rome.
Atwell, S., Y. S. Huang, B. J. Vilhjalmsson, G. Willems, M. Hortonet al., 2010 Genome-wide association study of 107 phenotypesin Arabidopsis thaliana inbred lines. Nature 465: 627–631.https://doi.org/10.1038/nature08800
Ballantyne, B., 1978 The Genetic Bases of Resistance to Rust,Caused by Uromyces Appendiculatus in Beans (Phaseolus Vulga-ris). University of Sydney, Australia.
Bowman, D. T., 1998 Using crop performance data to select hy-brids and varieties. J. Prod. Agric. 11: 256–259. https://doi.org/10.2134/jpa1998.0256
Cernac, A., C. Lincoln, D. Lammer, and M. Estelle, 1997 The SAR1gene of Arabidopsis acts downstream of the AXR1 gene in auxinresponse. Development 124: 1583–1591.
Cichy, K. A., T. G. Porch, J. S. Beaver, P. Cregan, D. Fourie et al.,2015 A diversity panel for Andean bean improvement. CropSci. 55: 2149–2160. https://doi.org/10.2135/cropsci2014.09.0653
Dash, S., J. D. Campbell, E. K. Cannon, A. M. Cleary, W. Huanget al., 2016 Legume information system (LegumeInfo.org): akey component of a set of federated data resources for the le-gume family. Nucleic Acids Res. 44: D1181–D1188. https://doi.org/10.1093/nar/gkv1159
de Lucas, M., L. Pu, G. Turco, A. Gaudinier, A. K. Morao et al.,2016 Transcriptional regulation of Arabidopsis Polycomb re-pressive complex 2 coordinates cell-type proliferation and dif-ferentiation. Plant Cell 28: 2616–2631. https://doi.org/10.1105/tpc.15.00744
Desai, M., P. Rangarajan, J. L. Donahue, S. P. Williams, E. S. Landet al., 2014 Two inositol hexakisphosphate kinases drive ino-sitol pyrophosphate synthesis in plants. Plant J. 80: 642–653.https://doi.org/10.1111/tpj.12669
Donald, C., 1968 The breeding of crop ideotypes. Euphytica 17:385–403. https://doi.org/10.1007/BF00056241
Duitama, J., J. C. Quintero, D. F. Cruz, C. Quintero, G. Hubmannet al., 2014 An integrated framework for discovery and geno-typing of genomic variants from high-throughput sequencingexperiments. Nucleic Acids Res. 42: e44. https://doi.org/10.1093/nar/gkt1381
Eckert, F., H. Kandel, B. Johnson, G. Rojas-Cifuentes, C. Deplazeset al., 2011 Seed yield and loss of Dry bean cultivars underconventional and direct harvest. Agron. J. 103: 129–136.https://doi.org/10.2134/agronj2010.0199
Graybosch, R. A., and C. J. Peterson, 2010 Genetic improvementin winter wheat yields in the great plains of North America,1959–2008. Crop Sci. 50: 1882–1890. https://doi.org/10.2135/cropsci2009.11.0685
Gu, W., N. F. Weeden, J. Q. Zhu, and D. H. Wallace,1994 Identification of a DNA marker for Hr, a gene that inter-acts with Ppd to confer extreme photoperiod sensitivity in com-mon bean. Annu. Rep. Bean Improv. Coop. 37: 125–126.
Gu, W., J. Zhu, D. H. Wallace, S. P. Singh, and N. F. Weeden,1998 Analysis of genes controlling photoperiod sensitivity incommon bean using DNA markers. Euphytica 102: 125–132.https://doi.org/10.1023/A:1018340514388
Hamblin, M. T., T. J. Close, P. R. Bhat, S. Chao, J. G. Kling et al.,2010 Population structure and linkage disequilibrium in U.S.Barley germplasm: implications for association mapping. CropSci. 50: 556–566. https://doi.org/10.2135/cropsci2009.04.0198
Hancock, A. M., B. Brachi, N. Faure, M. W. Horton, L. B. Jarymo-wycz et al., 2011 Adaptation to climate across the Arabidopsisthaliana genome. Science 334: 83–86. https://doi.org/10.1126/science.1209244
Hedges, L. V., and I. Olkin, 1985 Chapter 5 - estimation of a singleeffect size: parametric and nonparametric methods, pp. 75–106in Statistical Methods for Meta-Analysis, edited by L. V. Hedges,
and I. Olkin. Academic Press, San Diego. https://doi.org/10.1016/B978-0-08-057065-5.50010-5
Huang, H.-R., P.-C. Yan, M. Lascoux, and X.-J. Ge,2012 Flowering time and transcriptome variation in Capsellabursa-pastoris (Brassicaceae). New Phytol. 194: 676–689.https://doi.org/10.1111/j.1469-8137.2012.04101.x
Hurtado-Gonzales, O. P., G. Valentini, T. A. S. Gilio, A. M. Martins,Q. Song et al., 2017 Fine mapping of Ur-3, a historically im-portant rust resistance locus in common bean. G3 (Bethesda) 7:557–569. https://doi.org/10.1534/g3.116.036061
Jing, Y., and R. Lin, 2015 The VQ motif-containing protein familyof plant-specific transcriptional regulators. Plant Physiol. 169:371–378. https://doi.org/10.1104/pp.15.00788
Jones, A. L., 1999 PHASEOLUS BEAN: Post-harvest Operations.FAOSTAT (Food and Agriculture Organization of the UnitedNations). Available at: http://www.fao.org/in-action/inpho/crop-compendium/legumes/en/
Joshi, N., and J. Fass, 2011 Sickle: a sliding-window, adaptive,quality-based trimming tool for FastQ files. (Version 1.33) [Soft-ware]. Available at: https://github.com/najoshi/sickle.
Kamfwa, K., K. A. Cichy, and J. D. Kelly, 2015a Genome-wideassociation analysis of symbiotic nitrogen fixation in commonbean. Theor. Appl. Genet. 128: 1999–2017. https://doi.org/10.1007/s00122-015-2562-5
Kamfwa, K., K. A. Cichy and J. D. Kelly, 2015b Genome-wide asso-ciation study of agronomic traits in common bean. Plant Genome8: 1–12. https://doi.org/10.3835/plantgenome2014.09.0059
Kass, R. E., and A. E. Raftery, 1995 Bayes factors. J. Am. Stat.Assoc. 90: 773–795. https://doi.org/10.1080/01621459.1995.10476572
Kelly, J. D., 2001 Remaking bean plant architecture for efficientproduction, pp. 109–143 in Advances in Agronomy. AcademicPress, New York.
Kelly, J. D., 2018 Developing improved varieties of common bean.pp. 3–17 in Achieving sustainable cultivation of grain legumes:Vol. 2. Burleigh Dodds Science Publishing Limited, Cambridge,UK. https://doi.org/10.19103/AS.2017.0023.18
Kirby, A., H. M. Kang, C. M. Wade, C. Cotsapas, E. Kostem et al.,2010 Fine mapping in 94 inbred mouse strains using a high-density haplotype resource. Genetics 185: 1081–1095. https://doi.org/10.1534/genetics.110.115014
Kolkman, J. M., and J. D. Kelly, 2003 QTL conferring resistanceand avoidance to white mold in common bean. Crop Sci. 43:539–548. https://doi.org/10.2135/cropsci2003.0539
Kwak, M., O. Toro, D. G. Debouck, and P. Gepts, 2012 Multipleorigins of the determinate growth habit in domesticated com-mon bean (Phaseolus vulgaris). Ann. Bot. 110: 1573–1580.https://doi.org/10.1093/aob/mcs207
Lasky, J. R., H. D. Upadhyaya, P. Ramu, S. Deshpande, C. T. Hashet al., 2015 Genome-environment associations in sorghumlandraces predict adaptive traits. Sci. Adv. 1: e1400218.https://doi.org/10.1126/sciadv.1400218
Lex, A., N. Gehlenborg, H. Strobelt, R. Vuillemot, and H. Pfister,2014 UpSet: visualization of intersecting sets. IEEE Trans. Vis.Comput. Graph. 20: 1983–1992. https://doi.org/10.1109/TVCG.2014.2346248
Li, H., and R. Durbin, 2010 Fast and accurate long-read alignmentwith Burrows-Wheeler transform. Bioinformatics 26: 589–595.https://doi.org/10.1093/bioinformatics/btp698
Li, X., S. Redline, X. Zhang, S. Williams, and X. Zhu, 2017 Heightassociated variants demonstrate assortative mating in humanpopulations. Sci. Rep. 7: 15689. https://doi.org/10.1038/s41598-017-15864-x
Lin, T., G. Zhu, J. Zhang, X. Xu, Q. Yu et al., 2014 Genomicanalyses provide insights into the history of tomato breeding.Nat. Genet. 46: 1220–1226. https://doi.org/10.1038/ng.3117
282 A. H. MacQueen et al.
Lipka, A. E., F. Tian, Q. Wang, J. Peiffer, M. Li et al., 2012 GAPIT:genome association and prediction integrated tool. Bioinfor-matics 28: 2397–2399. https://doi.org/10.1093/bioinformatics/bts444
Lotta, L. A., P. Gulati, F. R. Day, F. Payne, H. Ongen et al.,2017 Integrative genomic analysis implicates limited periph-eral adipose storage capacity in the pathogenesis of human in-sulin resistance. Nat. Genet. 49: 17–26. https://doi.org/10.1038/ng.3714
MacArthur, J., E. Bowler, M. Cerezo, L. Gil, P. Hall et al., 2017 Thenew NHGRI-EBI Catalog of published genome-wide associationstudies (GWAS Catalog). Nucleic Acids Res. 45: D896–D901.https://doi.org/10.1093/nar/gkw1133
Mackay, T. F., S. Richards, E. A. Stone, A. Barbadilla, J. F. Ayroleset al., 2012 The Drosophila melanogaster genetic referencepanel. Nature 482: 173–178. https://doi.org/10.1038/na-ture10811
Mamidi, S., M. Rossi, D. Annam, S. Moghaddam, R. Lee et al.,2011 Investigation of the domestication of common bean(Phaseolus vulgaris) using multilocus sequence data. Funct.Plant Biol. 38: 953. https://doi.org/10.1071/FP11124
Martin, M., 2011 Cutadapt removes adapter sequences from high-throughput sequencing reads. EMBnet J. 17: 10–12. https://doi.org/10.14806/ej.17.1.200
McCouch, S. R., M. H. Wright, C. W. Tung, L. G. Maron, K. L.McNally et al., 2016 Open access resources for genome-wideassociation mapping in rice. Nat. Commun. 7: 10532 (erratum:Nat. Commun. 7: 11346). https://doi.org/10.1038/ncomms10532
Mefford, J., and J. Witte, 2012 The covariate’s dilemma. PLoSGenet. 8: e1003096. https://doi.org/10.1371/journal.pgen.1003096
Mittl, P. R. E., and W. Schneider-Brachert, 2007 Sel1-like repeatproteins in signal transduction. Cell. Signal. 19: 20–31. https://doi.org/10.1016/j.cellsig.2006.05.034
Moghaddam, S. M., S. Mamidi, J. M. Osorno, R. Lee, M. Brick et al.,2016 Genome-wide association study identifies candidate lociunderlying agronomic traits in a Middle American diversitypanel of common bean. Plant Genome 9: 1–21. https://doi.org/10.3835/plantgenome2016.02.0012
Myers, J., 1988 The Cooperative Dry Bean Nursery. Reports of theBean Improvement Cooperative: 209–210.
Nascimento, M., A. C. C. Nascimento, F. F. e. Silva, L. D. Barili, N.M. Vale et al., 2018 Quantile regression for genome-wide as-sociation study of flowering time-related traits in common bean.PLoS One 13: e0190303. https://doi.org/10.1371/journal.pone.0190303
National Plant Germplasm System, 2017 The National PlantGermplasm System. U.S. Department of Agriculture–AgriculturalResearch Service, MA.
Oh, S., H. Zhang, P. Ludwig, and S. van Nocker, 2004 A mecha-nism related to the yeast transcriptional regulator Paf1c is re-quired for expression of the Arabidopsis FLC/MAF MADS boxgene family. Plant Cell 16: 2940–2953. https://doi.org/10.1105/tpc.104.026062
Oladzad, A., T. Porch, J. C. Rosas, S. M. Moghaddam, J. Beaveret al., 2019a Single and multi-trait GWAS identify genetic fac-tors associated with production traits in common bean underabiotic stress environments. G3 (Bethesda) 9: 1881–1892.https://doi.org/10.1534/g3.119.400072
Oladzad, A., K. Zitnick-Anderson, S. Jain, K. Simons, J. M. Osornoet al., 2019b Genotypes and genomic regions associated withRhizoctonia solani resistance in common bean. Front. Plant Sci.10: 956. https://doi.org/10.3389/fpls.2019.00956
O’Rourke, J. A., L. P. Iniguez, F. Fu, B. Bucciarelli, S. S. Miller et al.,2014 An RNA-Seq based gene expression atlas of the commonbean. BMC Genomics 15: 866. https://doi.org/10.1186/1471-2164-15-866
Parry, G., and M. Estelle, 2006 Auxin receptors: a new role forF-box proteins. Curr. Opin. Cell Biol. 18: 152–156. https://doi.org/10.1016/j.ceb.2006.02.001
Parry, G., S. Ward, A. Cernac, S. Dharmasiri, and M. Estelle,2006 The Arabidopsis SUPPRESSOR OF AUXIN RESISTANCEproteins are nucleoporins with an important role in hormonesignaling and development. Plant Cell 18: 1590–1603.https://doi.org/10.1105/tpc.106.041566
Pastor-Corrales, J., R. Steadman, and J. Kelly, 2003 Commonbean gene pool information provides guidance for effectivedeployment of disease resistance genes. Phytopathology 93:S70.
Payne, T., S. D. Johnson, and A. M. Koltunow, 2004 KNUCKLES(KNU) encodes a C2H2 zinc-finger protein that regulates devel-opment of basal pattern elements of the Arabidopsis gynoecium.Development 131: 3737–3749. https://doi.org/10.1242/dev.01216
Raggi, L., L. Caproni, A. Carboni, and V. Negri, 2019 Genome-wide association study reveals candidate genes for floweringtime variation in common bean (Phaseolus vulgaris L.). Front.Plant Sci. 10: 962. https://doi.org/10.3389/fpls.2019.00962
Repinski, S. L., M. Kwak, and P. Gepts, 2012 The common beangrowth habit gene PvTFL1y is a functional homolog of Arabi-dopsis TFL1. Theor. Appl. Genet. 124: 1539–1547. https://doi.org/10.1007/s00122-012-1808-8
Rife, T., R. Graybosch, and J. Poland, 2018 Genomic analysis andprediction within a US public collaborative winter wheat re-gional testing nursery. Plant Genome 11: 1–7. https://doi.org/10.3835/plantgenome2018.01.0004
Schmutz, J., P. E. McClean, S. Mamidi, G. A. Wu, S. B. Cannonet al., 2014 A reference genome for common bean and ge-nome-wide analysis of dual domestications. Nat. Genet. 46:707–713. https://doi.org/10.1038/ng.3008
Schork, N. J., S. S. Murray, K. A. Frazer, and E. J. Topol,2009 Common vs. rare allele hypotheses for complex diseases.Curr. Opin. Genet. Dev. 19: 212–219. https://doi.org/10.1016/j.gde.2009.04.010
Schröder, S., S. Mamidi, R. Lee, M. R. McKain, P. E. McClean et al.,2016 Optimization of genotyping by sequencing (GBS) data incommon bean (Phaseolus vulgaris L.). Mol. Breed. 36. Availableat: https://doi.org/10.1007/s11032-015-0431-1.
Singh, B., and R. A. Sharma, 2015 Plant terpenes: defense re-sponses, phylogenetic analysis, regulation and clinical applica-tions. 3 Biotech 5: 129–151. https://doi.org/10.1007/s13205-014-0220-2
Singh, S., 2000 50 years of the Cooperative Dry Bean Nursery.Reports of the Bean Improvement Cooperative: 110–111.
Sivakumaran, S., F. Agakov, E. Theodoratou, J. G. Prendergast, L.Zgaga et al., 2011 Abundant pleiotropy in human complexdiseases and traits. Am. J. Hum. Genet. 89: 607–618. https://doi.org/10.1016/j.ajhg.2011.10.004
Soltani, A., M. Bello, E. Mndolwa, S. Schroder, S. M. Moghaddamet al., 2016 Targeted analysis of Dry bean growth habit: in-terrelationship among architectural, phenological, and yieldcomponents. Crop Sci. 56: 3005–3015. https://doi.org/10.2135/cropsci2016.02.0119
Soltani, A., S. MafiMoghaddam, K. Walter, D. Restrepo-Montoya, S.Mamidi et al., 2017 Genetic architecture of flooding tolerancein the dry bean Middle-American diversity panel. Front. PlantSci. 8: 1183. https://doi.org/10.3389/fpls.2017.01183
Soltani, A., S. MafiMoghaddam, A. Oladzad-Abbasabadi, K. Walter,P. J. Kearns et al., 2018 Genetic analysis of flooding tolerancein an Andean diversity panel of Dry bean (Phaseolus vulgaris L.).Front. Plant Sci. 9: 767. https://doi.org/10.3389/fpls.2018.00767
Stephens, M., 2017 False discovery rates: a new deal. Biostatistics18: 275–294.
Breeding Led to Pleiotropy in the CDBN 283
Sukumaran, S., M. Lopes, S. Dreisigacker, and M. Reynolds,2018 Genetic analysis of multi-environmental spring wheattrials identifies genomic regions for locus-specific trade-offs forgrain weight and grain number. Theor. Appl. Genet. 131: 985–998. https://doi.org/10.1007/s00122-017-3037-7
Sun, B., L.-S. Looi, S. Guo, Z. He, E.-S. Gan et al., 2014 Timingmechanism dependent on cell division is invoked by Polycombeviction in plant stem cells. Science 343: 1248559. https://doi.org/10.1126/science.1248559
Tock, A. J., D. Fourie, P. G. Walley, E. B. Holub, A. Soler et al.,2017 Genome-wide linkage and association mapping of haloblight resistance in common bean to race 6 of the globally im-portant bacterial pathogen. Front. Plant Sci. 8: 1170. https://doi.org/10.3389/fpls.2017.01170
Togninalli, M., U. Seren, D. Meng, J. Fitz, M. Nordborg et al.,2018 The AraGWAS Catalog: a curated and standardizedArabidopsis thaliana GWAS catalog. Nucleic Acids Res. 46:D1150–D1156. https://doi.org/10.1093/nar/gkx954
Trapp, J. J., C. A. Urrea, P. B. Cregan, and P. N. Miklas,2015 Quantitative trait loci for yield under multiple stressand drought conditions in a Dry bean population. Crop Sci.55: 1596–1607. https://doi.org/10.2135/cropsci2014.11.0792
Trapp, J. J., C. A. Urrea, J. Zhou, L. R. Khot, S. Sankaran et al.,2016 Selective phenotyping traits related to multiple stressand drought response in Dry bean. Crop Sci. 56: 1460–1472.https://doi.org/10.2135/cropsci2015.05.0281
Urbut, S. M., G. Wang, P. Carbonetto, and M. Stephens,2019 Flexible statistical methods for estimating and testingeffects in genomic studies with multiple conditions. Nat. Genet.51: 187–195. https://doi.org/10.1038/s41588-018-0268-8
Vandemark, G. J., M. A. Brick, J. M. Osorno, J. D. Kelly, and C. A.Urrea et al., 2014 Edible Grain Legumes. Panhandle Research
and Extension Center, Scottsbluff. 10.2135/cssaspecpub33.c5https://doi.org/10.2135/cssaspecpub33.c5
Visscher, P. M., N. R. Wray, Q. Zhang, P. Sklar, M. I. McCarthy et al.,2017 10 Years of GWAS discovery: biology, function, andtranslation. Am. J. Hum. Genet. 101: 5–22. https://doi.org/10.1016/j.ajhg.2017.06.005
Wallace, D. H., K. S. Yourstone, P. N. Masaya and R. W. Zobel,1993 Photoperiod gene control over partitioning between re-productive and vegetative growth. Theor. Appl. Genet. 86: 6–16.https://doi.org/10.1007/BF00223803
Weller, J. L., J. K. Vander Schoor, E. C. Perez-Wright, V. Hecht, A.M. González et al., 2019 Parallel origins of photoperiod adap-tation following dual domestications of common bean. J. Exp.Bot. 70: 1209–1219. https://doi.org/10.1093/jxb/ery455
Xiao, Y., H. Liu, L. Wu, M. Warburton, and J. Yan, 2017 Genome-wide association studies in maize: praise and stargaze. Mol.Plant 10: 359–374. https://doi.org/10.1016/j.molp.2016.12.008
Zaitlen, N., S. Lindstrom, B. Pasaniuc, M. Cornelis, G. Genoveseet al., 2012 Informed conditioning on clinical covariates in-creases power in case-control association studies. PLoS Genet.8: e1003032. https://doi.org/10.1371/journal.pgen.1003032
Zaumeyer, W., 1947 Control of bean diseases. U. S. Dept. Agr.Yearbook 1943–47: 333–337
Zhang, Z., E. Ersoz, C.-Q. Lai, R. J. Todhunter, H. K. Tiwari et al.,2010 Mixed linear model approach adapted for genome-wideassociation studies. Nat. Genet. 42: 355–360. https://doi.org/10.1038/ng.546
Zhou, Q.-H., D. Fu, A. Mason, Y.-J. Zeng, C. Zhao et al., 2014 Insilico integration of quantitative trait loci for seed yield andyield-related traits in Brassica napus. Mol. Breeding 33: 881–894. https://doi.org/10.1007/s11032-013-0002-2
Communicating editor: H. Daetwyler
284 A. H. MacQueen et al.