genetic characterisation of colophospermum mopane (sensu lato
TRANSCRIPT

1
Genetic characterisation of Colophospermum mopane
(sensu lato) using RAPD analyses
By
MANKONE PRISCILLA LEGODI
Submitted in fulfilment of the requirements for the degree of
MASTER OF SCIENCE
in the
Department of Biodiversity
School of Molecular and Life Sciences
Faculty of Sciences and Agriculture University of Limpopo (Polokwane campus)
Sovenga
South Africa
2007
Supervisor: Prof. I. Ncube
Co-supervisors: Dr. M.J. Potgieter
Prof. D.C.J. Wessels

i
DECLARATION
I declare that this dissertation hereby submitted to the University of Limpopo for the
degree Master of Science has not been previously submitted by me for a degree at or any
other university, that is my own work in design and execution, and that all material
contained therein has been duly acknowledged.
Signed: __________________________
Date: ____________________________

ii
DEDICATION
This Dissertation is dedicated to my late father, Freddy Legodi; my mother, Pauline
Legodi; my son Matome; my nieces Refilwe, Khomotso, Matlou and Getse; my nephews
Freddy and Tumi; my sister Julia Sebola, and my brothers Charles, Jonas, Managa and
Lesley.

iii
ACKNOWLEDGEMENTS
Without the encouragement, the help and the support of many people this
Dissertation could not have been accomplished. Firstly, I would like to thank
God for being with me in sickness and pain. I am grateful to my family for their
love, support, courage and patience during my studies. Especially, to my mother
Pauline Legodi for her support and taking care of my son. I thank my son
Matome and my niece Refilwe for their understanding for not being with them for
the past seven years while I was studying.
I want to express my gratitude to my supervisor; Prof I Ncube and co-supervisors;
Dr MJ Potgieter and Prof DCJ Wessels for making this study possible and their
guidance. I am also thankful to Prof I Ncube for his patience while I was
struggling with laboratory work. Dr MJ Potgieter is thanked for taking
photographs of the ecotypes.
I thank Prof SM Dippenaar (Department of Biodiversity) for helping me with the
PAUP program and in the construction of dendogram trees.
The National Research Foundation is acknowledged for financial support.
I thank Mr Frank Nukeri for his constructive comments.
The Microscopy and Microanalysis unit (University of Limpopo) is thanked for
supplying me with liquid nitrogen.
Finally, I would like to thank the Departments of Biochemistry, Microbiology &
Biotechnology and Biodiversity for the use of their facilities.
iv
ABSTRACT
Colophospermum mopane (sensu lato) is currently recognised on morphological and
physiological characteristics. To add to the suite of taxonomic characters, the genetic
variability of C. mopane (sensu lato) was investigated using the RAPD technique. DNA
was extracted from young seedlings and mature leaves using the CTAB method.
Initially, the DNA extraction was problematic due to the presence of polysaccharides,
making PCR nearly impossible. An additional phenol precipitation step was introduced
to purify the DNA used to perform RAPD analyses. Twenty random primers were tested
for their suitability and reproducibility to reveal polymorphism in C. mopane (sensu lato).
Nine of the primers tested amplified the genomic DNA. Subsequently, three primers
(OPA 03, OPA 08 and OPA 09) were selected based on their reproducibility and
demonstration of polymorphism. OPA 03 amplified most of the samples tested whereas
OPA 08 and OPA 09 amplified 50% of the samples. RAPD bands ranged from 180 bp to
2000 bp. RAPD profiles of C. mopane (sensu lato) with three random primers showed
few polymorphisms. Individual trees of different ecotypes show similar RAPD banding
pattern, instances were found where trees of the same ecotype showed different bands.
The total character difference based on presence and absence of bands revealed both
variability and similarity of C. mopane (sensu lato). Phylogenetic trees from individual
primers and combined primers were constructed using Neighbour Joining and Parsimony
analysis. The phylogenetic tree from the combined primers of bootstrap parsimony
generated three clades with low and high parsimony bootstrap values. The first clade
receives weak support (61%) while the second and third clades receive support of 90%
and 70%, respectively. The other remaining entities collapsed resulting in basal
polytomy. The third clade shows some members of Alba (Alba 11 Phala, Alba 1 Phala
and Alba 7 Musina) grouped together. The overall results of C. mopane (sensu lato)
show high (84.1%) genetic similarity. No ecotypic marker was obtained. Most of the
ecotypes have not diverged genetically far from one another or from the parental material
(Mopane – sensu stricto). The genetic results partially support the perceived
morphological differences. In this study the RAPD technique has established its value as
an additional tool to express the genetic variability in C. mopane (sensu lato).

v
TABLE OF CONTENTS
List of Tables ......................................................................................................... viii
List of Figures .......................................................................................................... ix
List of abbreviations ................................................................................................ xi
Terms and designations........................................................................................... xii
Eponymy ................................................................................................................. xii
CHAPTER 1: INTRODUCTION
1.1 Rationale of the study .......................................................................................... 1
1.2 Aim and objectives .............................................................................................. 5
1.2.1 Aim ............................................................................................................... 5
1.2.2 Objectives ..................................................................................................... 5
CHAPTER 2: LITERATURE REVIEW
2.1 Taxonomy of mopane .......................................................................................... 6
2.2 Description of Colophospermum mopane (sensu stricto) .................................... 7
2.3 Distribution of Colophospermum mopane (sensu stricto) .................................. 8
2.4 Biotypes of Colophospermum mopane (sensu stricto) ........................................ 9
2.5 Description of Colophospermum mopane (sensu stricto) ecotypes ..................... 9
2.5.1 Ecotype Lesliei........................................................................................... 10
2.5.2 Ecotype Alba .............................................................................................. 11
2.5.3 Ecotype Acuminata .................................................................................... 11
2.5.4 Ecotype Laevigatum .................................................................................. 12
2.5.5 Ecotype Parvispermum .............................................................................. 13
2.6 Previous studies on genetic diversity of C. mopane (sensu stricto) ................. 18
2.7 Random Amplified Polymorphic DNA ............................................................. 18
2.8 RAPD as a tool for identification of plant species ............................................. 22
2.8.1 African trees .............................................................................................. 22

vi
2.8.2 Non African trees ...................................................................................... 22
2.8.2.1 Cultivated fruit trees .................................................................... 22
2.8.2.2 Wild woody trees ......................................................................... 22
CHAPTER 3: MATERIALS AND METHODS
3.1 Materials ............................................................................................................ 24
3.1.1 Plant material ............................................................................................. 24
3.1.2 Reagents ..................................................................................................... 24
3.2 Methods............................................................................................................... 26
3.2.1 Seed germination ........................................................................................ 26
3.2.2 DNA extraction .......................................................................................... 26
3.2.3 Quantification of DNA ............................................................................... 28
3.2.4 RAPD analyses ........................................................................................... 29
3.2.5 Agarose gel electrophoresis ........................................................................ 31
3.2.6 Data analysis .............................................................................................. 32
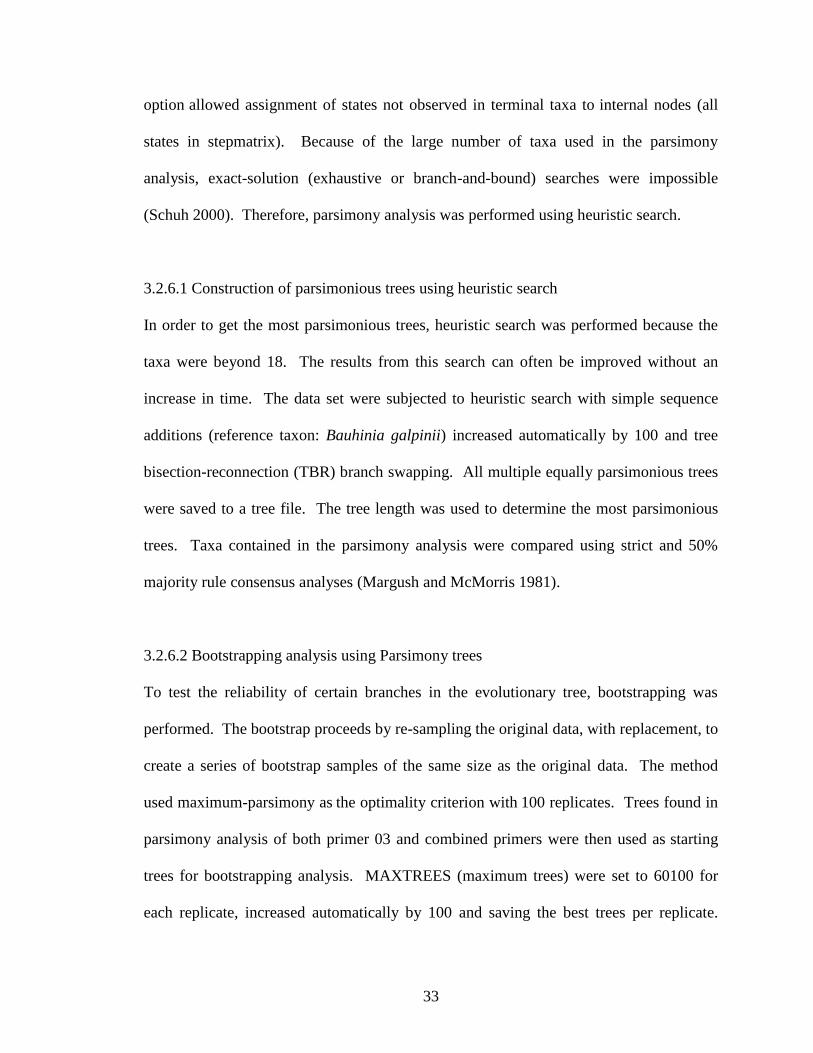
3.2.6.1 Construction of parsimonious trees using heuristic search ................... 33
3.2.6.2 Bootstrapping analysis using Parsimony trees ...................................... 33
3.2.6.3 Distance method.................................................................................... 34
CHAPTER 4: RESULTS
4.1 DNA yield and quality ....................................................................................... 35
4.2 RAPD analyses .................................................................................................. 39
4.2.1 Optimisation of RAPD conditions for amplification .................................... 39
4.2.2 Optimisation of RAPD primers for polymorphism ...................................... 42
4.2.3 RAPD analysis of Colophospermum mopane (sensu lato) ........................... 46
4.3 Phylogenetic analysis ......................................................................................... 51
4.3.1 Parsimony analysis with heuristic search ..................................................... 51
4.3.2 Bootstrapping using Parsimony tree ............................................................. 57
4.3.3 Genetic similarity and differences ................................................................ 60

vii
4.3.3.1 Total mean differences ......................................................................... 60
4.3.3.2 Neighbour Joining ................................................................................ 64
CHAPTER 5: DISCUSSION
5.1 DNA extraction and removal of contaminants .................................................. 67
5.2 Optimization of PCR products ........................................................................... 69
5.3 Genetic relatedness ............................................................................................ 70
5.4 Genetically differentiated species ...................................................................... 72
5.5 Comparison of RAPD data with morphological characteristics ........................ 73
5.5.1 Intra ecotypic variation ................................................................................... 73
5.5.1.1 Lesliei ........................................................................................................... 73
5.5.1.2 Alba .............................................................................................................. 73
5.5.1.3 Laevigatum and Parvispermum ................................................................... 73
5.5.1.4 Acuminata .................................................................................................... 74
5.5.1.5 Mopane (sensu stricto) ................................................................................. 74
5.5.2 Inter ecotypic relationship............................................................................... 75
5.5.2.1 Acuminata ................................................................................................... 75
5.5.2.2 Alba .............................................................................................................. 77
5.2.2.3 Lesliei ........................................................................................................... 78
5.5.2.4 Laevigatum .................................................................................................. 79
5.5.2.5 Parvispermum .............................................................................................. 80
5.6 Taxonomic recommendation ............................................................................. 80
5.7 Conclusions ........................................................................................................ 82
5.8 Recommendations for future research ............................................................... 82
CHAPTER 6: REFERENCES .............................................................................. 84
APPENDIX ............................................................................................................. 98

viii
LIST OF TABLES
Table 1: Distinguishing morphological characters of the ecotypes, the most
differentiating characters are underlineds ................................................................ 14
Table 2: The 20 primers screened for amplification and polymorphism ................ 29
Table 3: Composition of the PCR reaction mixture (25 l) ................................... 30
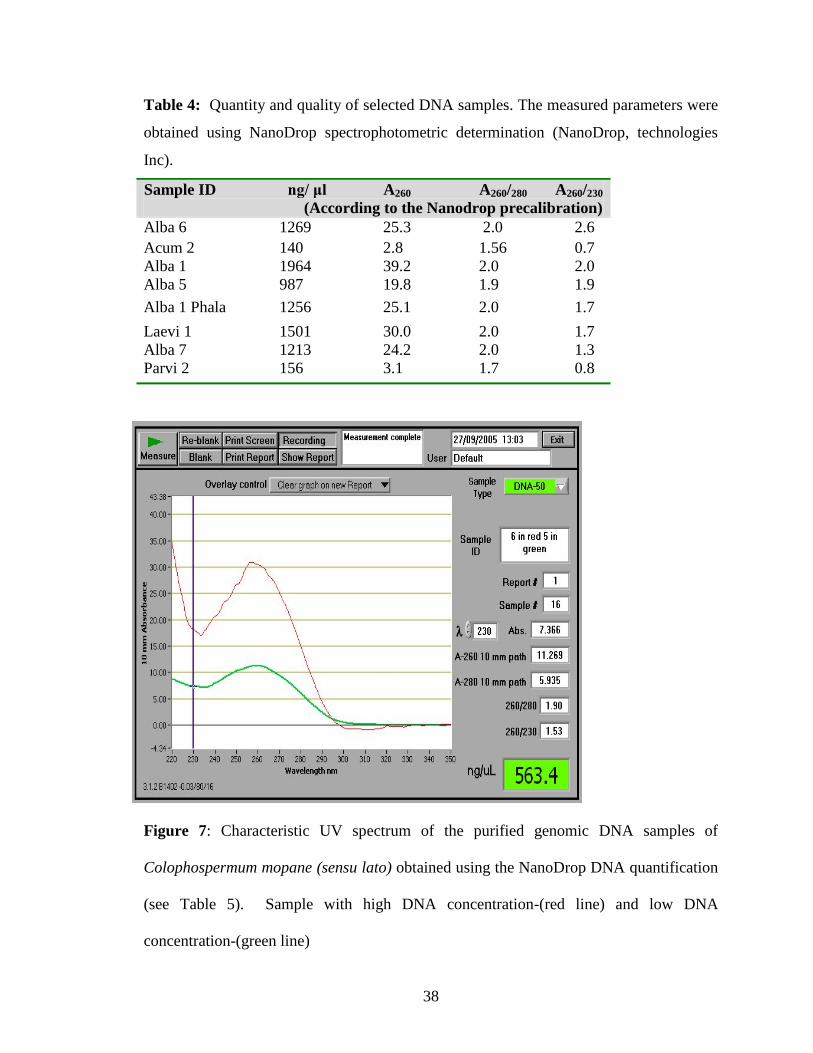
Table 4: Quantity and quality of selected DNA samples. The measured parameters
were obtained using NanoDrop spectrophotometric determination
(Nanodrop , technologies Inc) ................................................................. 38
Table 5 A: Pair-wise genetic distance matrix of C. mopane (sensu lato) based on
RAPD data of the combined primers used and computed using the
character mean difference calculated by the PAUP .............................. 61
Table 5 B: Pair-wise genetic distance matrix of C. mopane (sensu lato) based on
RAPD data of the OPA 03 used and computed using the character
mean difference calculated by the PAUP ............................................. 62
Table 6: Intra ecotypic similarity ............................................................................ 63
Table 7 A: Inter ecotypic percentage difference and similarity: Alba .................... 63
Table 7 B: Inter ecotypic percentage difference and similarity: Acuminata .......... 63
Table 7 C: Inter ecotypic percentage difference and similarity: Lesliei ................. 63
Table 7 D: Inter ecotypic percentage difference and similarity: C. mopane
(sensu stricto) ....................................................................................... 63
Table 7 E: Inter ecotypic percentage difference and similarity: Laevigatum ......... 64
Table 8: Character state data matrix for PAUP analysis of the combined data
with 24 individuals and 31 characters. ....................................................... 98

ix
LIST OF FIGURES
Figure 1: Habit of the ecotypes ................................................................................ 15
Figure 2: The bark of ecotypes ................................................................................ 16
Figure 3: The fruit of C. mopane (sensu lato) ......................................................... 17
Figure 4: The leaflets of C. mopane (sensu lato) ..................................................... 17
Figure 5: Localities of the samples used .................................................................. 25
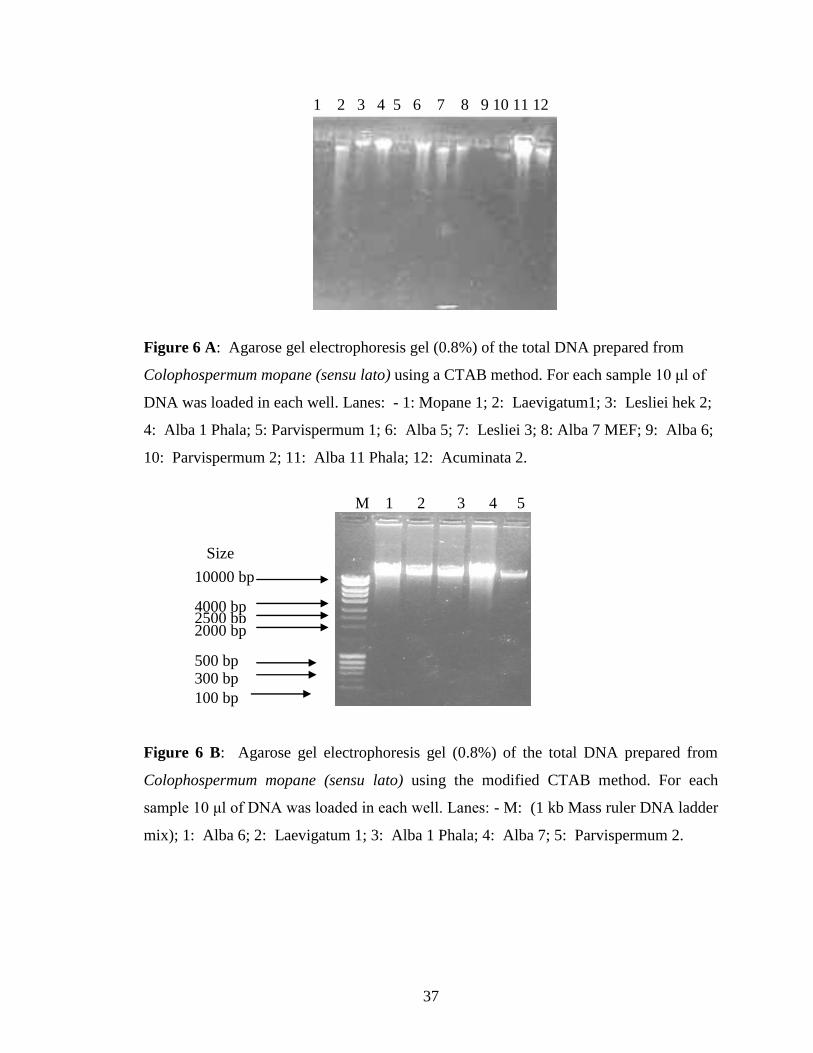
Figure 6A: Agarose gel electrophoresis gel (0.8 %) of the total DNA prepared from
C. mopane (sensu lato) using just a CTAB method................................. 37
Figure 6B: Agarose gel electrophoresis gel (0.8 %) of the total DNA prepared from
C. mopane (sensu lato) using the modified CTAB method ..................... 37
Figure 7: Characteristic UV spectrum of the purified genomic DNA samples
of Colophospermum mopane (sensu lato) ................................................. 38
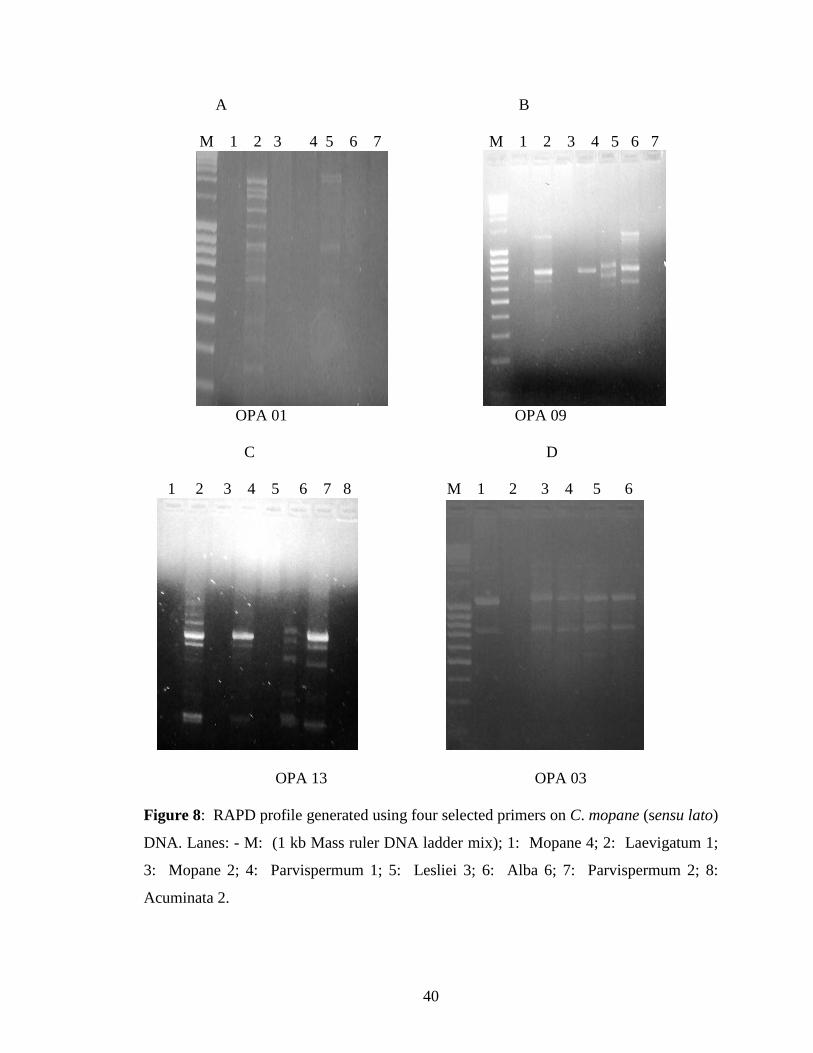
Figure 8: RAPD profiles generated from four selected primers (OPA 01, 03, 09 and
13) tested for amplification ...................................................................... 40
Figure 9: RAPD profiles generated from five selected primers (OPA 02, 08, 10, 18
and 20) tested for amplification .............................................................. .41
Figure 10: RAPD profile generated from the OPA 03 with 20 μM of primers ....... 42
Figure 11: RAPD profile generated from OPA 08 tested during analysis for
polymorphism ......................................................................................... 43
Figure 12: RAPD profile generated from OPA 03 tested during analysis for
polymorphism ......................................................................................... 43
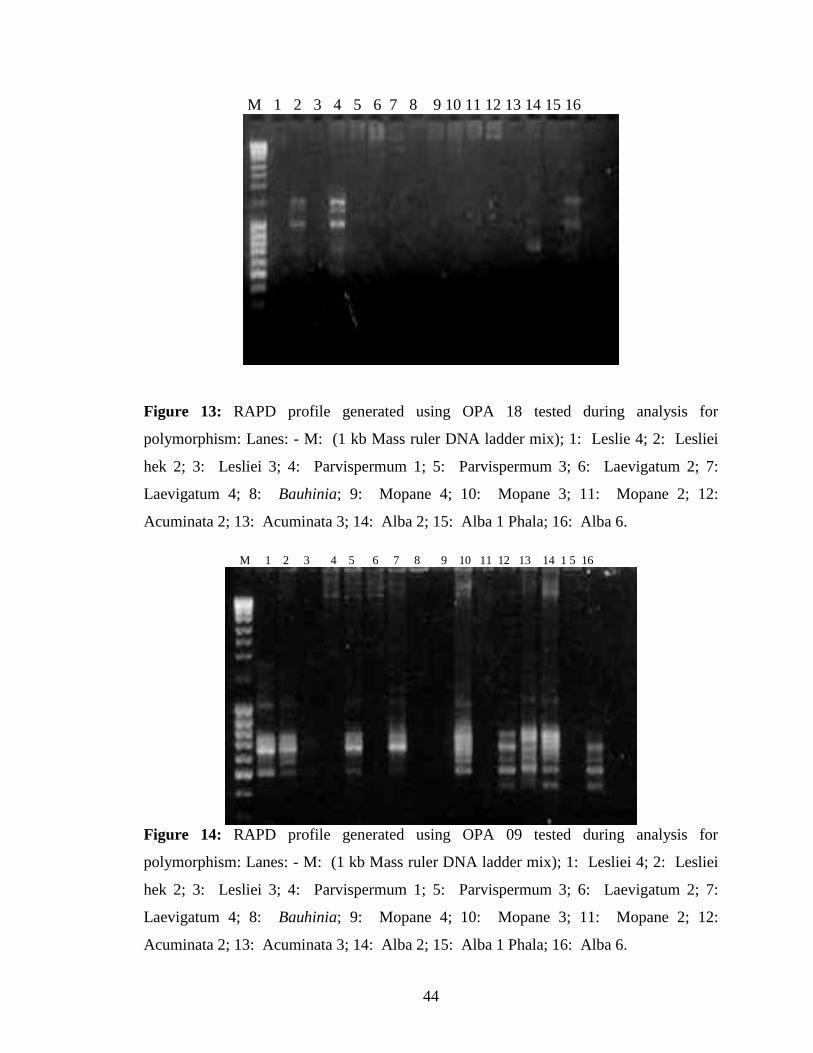
Figure 13: RAPD profile generated from OPA 18 tested during analysis for
polymorphism ......................................................................................... 44
Figure 14: RAPD profile generated from OPA 09 tested during analysis for
polymorphism ......................................................................................... 44
Figure15: RAPD profile generated from OPA 02 tested during analysis for
polymorphism ......................................................................................... 45
Figure 16: RAPD profile generated from OPA 13 tested during analysis for
polymorphism .......................................................................................... 45
x
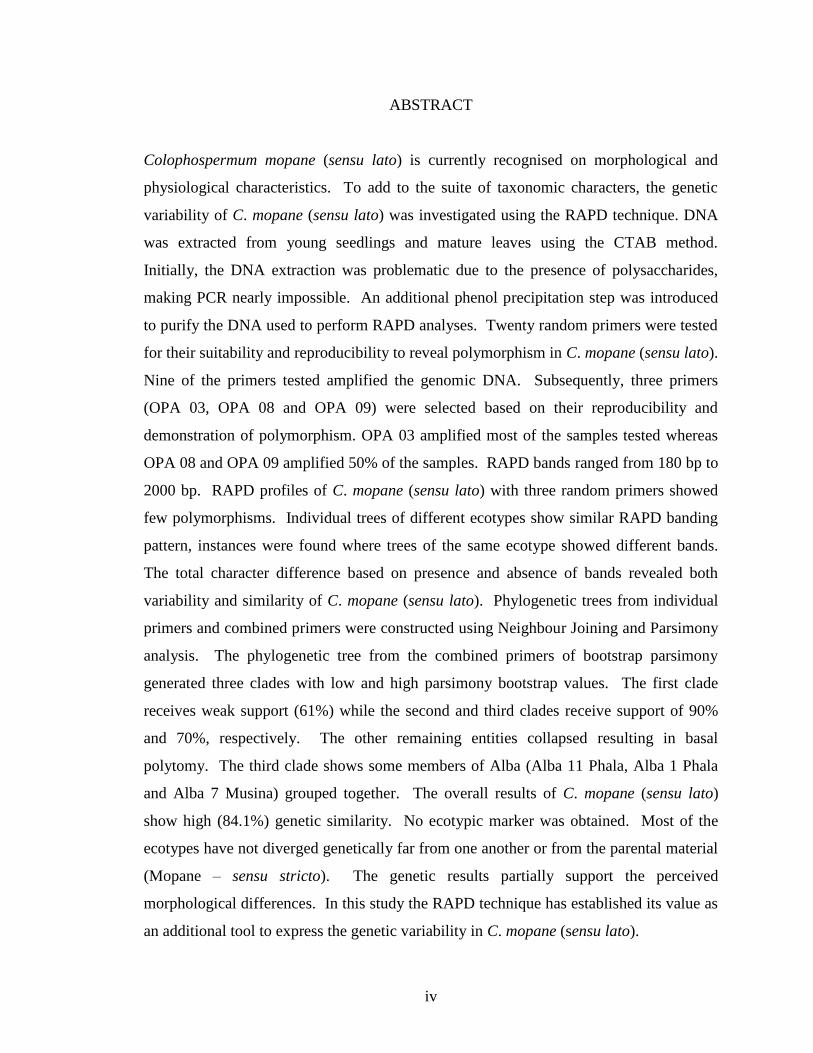
Figure 17: RAPD profiles generated from C. mopane (sensu lato)
using OPA 09 .......................................................................................... 48
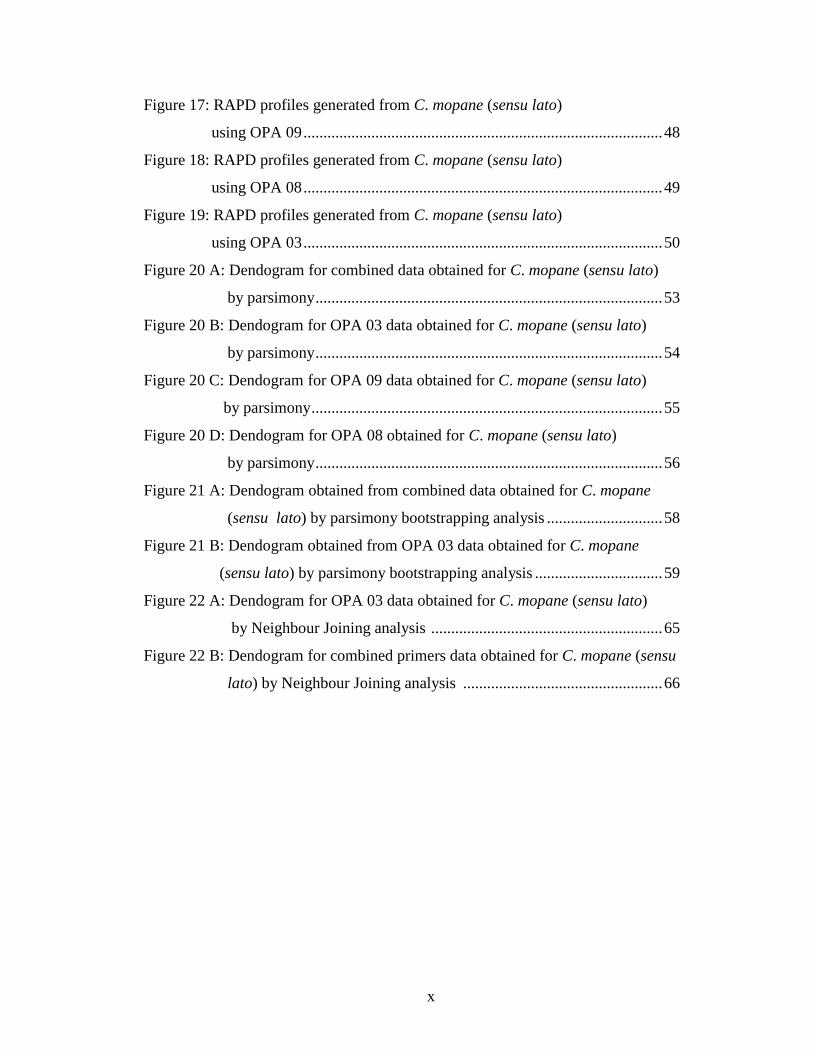
Figure 18: RAPD profiles generated from C. mopane (sensu lato)
using OPA 08 .......................................................................................... 49
Figure 19: RAPD profiles generated from C. mopane (sensu lato)
using OPA 03 .......................................................................................... 50
Figure 20 A: Dendogram for combined data obtained for C. mopane (sensu lato)
by parsimony ....................................................................................... 53
Figure 20 B: Dendogram for OPA 03 data obtained for C. mopane (sensu lato)
by parsimony ....................................................................................... 54
Figure 20 C: Dendogram for OPA 09 data obtained for C. mopane (sensu lato)
by parsimony ........................................................................................ 55
Figure 20 D: Dendogram for OPA 08 obtained for C. mopane (sensu lato)
by parsimony ....................................................................................... 56
Figure 21 A: Dendogram obtained from combined data obtained for C. mopane
(sensu lato) by parsimony bootstrapping analysis ............................. 58
Figure 21 B: Dendogram obtained from OPA 03 data obtained for C. mopane
(sensu lato) by parsimony bootstrapping analysis ................................ 59
Figure 22 A: Dendogram for OPA 03 data obtained for C. mopane (sensu lato)
by Neighbour Joining analysis .......................................................... 65
Figure 22 B: Dendogram for combined primers data obtained for C. mopane (sensu
lato) by Neighbour Joining analysis .................................................. 66
xi
LIST OF ABBREVIATIONS
bp: base pairs
cm: centimetre
CTAB: Cetyltrimetylammonium bromide
DNA: Deoxyribose Nucleic Acid
dNTPs: deoxynucleotide 5’ triphosphates
EDTA-Ethylene Diamine Tetra Acetic acid
kb: kilobases
m: metre
M: molar
MgCl2: Magnesium Chloride
ml: millimetres
mM: millimolar
NaCl: Sodium Chloride
ng: nanogram
PAUP: Phylogenetic Analysis Using Parsimony
PCR: Polymerase Chain Reaction
PVP: Polyvinylpopyrrolidone
RNAse: Ribonuclease
TAE: Tris Acetic EDTA buffer
TE: Tris EDTA buffer
TRIS: Tris hydroxymethyl amino methane
μl: microlitre
μM: micromolar

xii
EPONYMY
The following working names are chosen to distinguish the ecotypes from each other:
Alba was chosen as a name to emphasise the whitish seed pods.
Acuminata highlight the pointed shape of the leaflets.
Lesliei, named after Leslie Wessels for sharing responsibility in typification of the
ecotypes.
Laevigatum was assigned to an ecotype with smooth bark and small seeds.
Parvispermum was assigned to an ecotype with rough bark and small seeds.
TERMS AND DESIGNATIONS
For the purpose of this dissertation, the following designations will be applied to
distinguish between C. mopane and its ecotypes.
C. mopane (sensu lato) refers to C. mopane (sensu stricto) and its ecotypes
Mopane (Mop) refers to C. mopane (sensu stricto)
Alba refers to an ecotype of C. mopane (sensu lato)
Acuminata (Acum) refers to an ecotype of C. mopane (sensu lato)
Lesliei (Les) refers to an ecotype of C. mopane (sensu lato)
Parvispermum (Parvi) refers to an ecotype of C. mopane (sensu lato)
Laevigatum (Laevi) refers to an ecotype of C. mopane (sensu lato)

1
CHAPTER 1
INTRODUCTION
1.1 Rationale for the study
Colophospermum mopane (J. Kirk ex Benth.) J. Kirk ex J. Léonard is one of the most
valuable tree species indigenous to southern Africa (Léonard 1999). The tree provides a
valuable timber and is widely used as construction material (Madzibane and Potgieter
1999), for medicinal purposes (Mashabane et al., 2000) and by browsers as a source of
food (Styles and Skinner 1997). Ecological variants exist within C. mopane (sensu
stricto) indicating a degree of phenotypic plasticity (Madams 1990). Wessels et al.
(1998) informally described three ecotypes of C. mopane (Acuminata, Alba and Lesliei)
based on differences in their morphology, physiology (e.g. tolerance to cold and drought)
and habitat. Later, two additional ecotypes, with the working names; Laevigatum and
Parvispermum, were distinguished. The latter two ecotypes have not yet been informally
described.
From the observed morphological characteristics of ecotypes it is not clear as to whether
the morphological differences observed in the Zambian biotypes (Madams 1990) and
different ecotypes of C. mopane (sensu stricto) are the result of environmental factors
(e.g. water availability, irradiance, edaphic conditions) or the result of a genetic
disposition (Wöhrmann 1990). However, during summer, Alba and Parvispermum are
not distinguishable from C. mopane (sensu stricto). Further evidence from DNA analysis
could possibly support the morphological classification.

2
Plant taxonomic studies have been conducted for several years based on morphological
and cytological analysis. As the current identification methods rely on morphological
characteristics whose expression may be affected by developmental and environmental
factors (light, humidity etc.), a morphological character as a marker, therefore, can be
ambiguous (Liu and Furnier 1993).
Biochemical analysis such as allozyme and protein analysis have also been used in plant
identification studies. However, the tissue specific expression of proteins has limited the
use of protein analyses in identification of many crops (Claros et al., 2000). Proteins are
also limited by the small number of discriminating loci providing limited coverage of the
genome (Guasmi et al., 2006). Protein expression is often dependant on the
environmental conditions of plant tissue used for protein extraction (Winter and Kahl
1995).
Villoen (2003) investigated the allozyme variation in five populations of
Colophospermum mopane (sensu stricto) using isozyme techniques. Villoen (2003)
could not observe heterozygote deficiencies as all loci conformed to Hardy-Weinberg
expectations. The genetic differentiation among populations of C. mopane (sensu stricto)
did not reflect geographical separation by genetic distance.
DNA fingerprinting markers (Restriction Fragments Length Polymorphism (RFLP),
Random Amplified Polymorphic DNA (RAPD), Amplified Fragment Length
Polymorphism (AFLP) and Microsatellites) are appropriate methods for studying the
3
genetic variation in plants (Avise 1994). These techniques have a broad application in
familial relationship analyses, (Kirby 1992; Claros et al., 2000), genetic differentiation
and plant species identification (William et al., 1990; Rajaseger et al., 1997). The use of
DNA fingerprinting markers in plant taxonomy provides an opportunity to determine
relationships more precisely than morphological and biochemical markers, as they are
potentially unlimited in number, are not affected by environmental conditions, and can be
organized into linkage maps (Niehuis et al., 1995).
DNA-based markers have largely overcome the disadvantages of morphological and
isozyme analyses and have been successfully applied to discriminate among genotypes in
a wide range of agricultural crops (Weising et al., 1991; Jain et al., 1994; Nynbom 1994;
Rath et al., 1998; Rajaseger et al., 1999; Brenna 2004). An example is the lines Azucena
and PR 304 rice cultivars that have been classified as indicas using morphological
characters, whereas they behave like japonicas in crossing. These two samples were,
however, clearly revealed to be japonicas after being analysed by molecular markers
(Virk et al., 1997). It is hypothesised that DNA fingerprinting can be applicable on C.
mopane (sensu lato), thereby providing evidence of morphological differences.
DNA-based marker techniques, such as Random Amplified Polymorphic DNA (RAPD),
have been widely adopted as a convenient and powerful technique in detecting
differences among closely-related organisms (Welsh and McClelland 1990; Williams et
al., 1990). RAPD markers are considered as a useful tool in species identification
4
(Demeke et al., 1992). RAPD has been found to aid in distinguishing between major
taxonomic sections and varieties (Adams and Demeke 1993).
RAPD analyses can be used effectively for initial assessment of levels and partitioning
of genetic variation within plant species, particularly in species with limited genetic
diversity information (Lowe et al., 2000). RAPD analyses also categorise plants that
cannot be classified by morphological characters (Melchinger et al., 1994). In addition, it
reveals a large amount of genetic variation with good coverage of the entire genome
(Rajaseger et al., 1997).
If RAPD analyses support morphological differences, the ecotypes could be published as
new specific or infra-specific entities of C. mopane (sensu stricto). This typification is of
importance to game farmers, as they could plant the ecotypes selectively in suitable
habitats on their farms ensuring improved/prolonged availability of browse during the dry
winter months.
Value also lies in investigating the ecotypes in terms of ecological and even
ecophysiological studies. It is only once the identity of the ecotypes has been established
that meaningful ecological/ ecophysiological research can be undertaken. Such studies
will provide answers as to the complex interaction between the ecotypes and C. mopane
(sensu stricto) as well as between the ecotypes and other woodland species.

5
The results can also be helpful in reforestation projects especially in rural communities,
as C. mopane (sensu stricto) has become threatened through indiscriminate use around
local villages of Lubango and Namibe (Neto 2000). Care must, however, be taken not to
contaminate the gene pool in areas where the ecotypes do not occur. This study aims to
provide answers as to the genetic distance between the commonly found C. mopane
(sensu stricto) and its ecotypes, and hence it’s interbreeding potential.
1.2 Aim and specific objectives
1.2.1 Aim
To elucidate the use of DNA fingerprinting techniques in understanding the genetic
variation of Colophospermum mopane (sensu lato).
1.2.2 Objectives
The objectives of this research were:
1.2.2.1 To ascertain by means of RAPD the genetic variation between and within:
The different ecotypes.
Different individuals of C. mopane (sensu stricto) trees.
Different trees of the same ecotype.
Two different populations of the same ecotype.
1.2.2.2. To investigation the genetic variation of various ecotypes and C. mopane (sensu
stricto) trees
1.2.2.3. To construct a phylogenetic tree of C. mopane (sensu lato).
6
CHAPTER 2
LITERATURE REVIEW
2.1 Taxonomy of mopane
Colophospermum Kirk ex J. Léonard is a monospecific genus first described by Léonard
in 1949, and is classified as belonging to the Tribe Detarieae (Lock 1989) of the
subfamily Caesalpinioideae, family Fabaceae (Leguminosae). Dr John Kirk who
collected the two type specimens (s.n.) (Chrimaba specimen = holotype and Lupata
specimen = isotype as per designation) during April 1860 in Shiramba and Lupata in
Mozambique, suggested the name Colophospermum (colloquially known as mopane).
Previously (1865), C. mopane was placed by Bentham in the genus Copaifera L.
(Copaifera mopane Kirk ex Benth.), along with Copaifera conjugata (Bolle) Milne-
Redh. (now Guibortia conjugata Bolle J. Léonard) and Copaifera coleosperma Benth.
(now Guibortia coleosperma (Benth.) J. Léonard), to which it is closely related (Bentham
1865). Colophospermum mopane was also placed in the genus Copaiba (Copaiba
mopane (Kirk ex Benth.) O. Kuntze around the turn of the 19th
century (1891) (Kuntze
1891).
Breteler et al. suggested in 1997 that Colophospermum be sunk under the Indian genus
Hardwickia Roxburgh (previously also monotypic with the species H. binnata Roxb.) on
the grounds of comparative anatomy, pollen morphology and wood anatomy. Breteler et
al. (1997) argue that Léonard (1949) described Colophospermum to accommodate the
aberrant Copaifera mopane. These authors further state that most characters which are

7
mentioned by Léonard to distinguish Colophospermum from Copaifera are in fact
characters that characterize Hardwickia. In their 1997 article, these authors, however,
omitted mentioning the fruit characters, which differ substantially. Colophospermum
mopane then changed to Hardwickia mopane (Kirk ex Benth.) Breteler.
In response, Smith et al. (1998) proposed the retention of the name Colophospermum
mopane based on the major economic importance of the species in southern Africa and
the confusion that the name change would cause to users.
However, in 1999 Léonard provided a convincing argument, based on taxonomic
grounds, for not accepting the name change proposed by Breteler and co-workers.
Léonard (1999) mentions, amongst other, that several characters cited as common to the
two genera are not exclusive to them, but are also found in other genera of the tribe.
Léonard (1999) also stated that it is noted that numerous distinctive characters between
these two genera are not mentioned by Breteler et al. (1997). Léonard concluded that
Breteler and his colleagues, unconsciously no doubt, worked in a subjective manner.
Considering Léonard’s conclusive article, it is clear that Smiths 1998 article is
superfluous.
2.2 Description of Colophospermum mopane (sensu stricto)
Colophospermum mopane (sensu stricto) ranges from a small shrub of 1 to 2 m, to a tree
of 4 to 18 m, in height. Cathedral forms are predominately very tall (up to 18 to 20 m
high) and single-stemmed, while dwarf and shrub forms of C. mopane (sensu stricto) are

8
commonly short and multi-stemmed (Timberlake 1995). The tree has an erect narrow
crown, a dark grey to brown, rough and longitudinally-fissured bark. Leaves are
alternate, with a single pair of nearly triangular leaflets. Colophospermum mopane
(sensu stricto) trees are deciduous with leaves sometimes remaining on the tree well into
the dry season (Fanshawe 1962; Palmer and Pitman 1972). The secondary root system is
generally shallow, around 30 to 120 cm in depth (Thompson 1960), although in deep
soils these roots can reach a depth of 2 m (Timberlake and Calvert 1993). The flowers
are small, greenish-white or greenish-yellow, and in Zimbabwe and South Africa appear
irregularly from December to March. Fruit pods are indehiscent, compressed and
yellowish–brown, light and papery, and are dispersed by wind and rainwash. The seeds
are large and compressed, usually kidney-shaped and corrugated, with numerous small,
sticky, reddish glands (Timberlake 1995).
2.3 Distribution of Colophospermum mopane (sensu stricto)
Colophospermum mopane (sensu stricto) occurs in Angola, Namibia, Zambia, Botswana,
Malawi, Zimbabwe, Mozambique and South Africa. This xerophytic tree species occurs
in a 571 500 km² area of southern Africa. In the northern parts of South Africa, C.
mopane (sensu stricto) extends over an area of about 23 000 km² (Mapaure 1994),
ranging from north of the Soutpansberg in the Limpopo Province, to just south of the
Olifants River in Mpumalanga. The distribution of C. mopane (sensu stricto) is
determined by various ecological factors such as minimum rainfall, frost incidences and
minimum temperatures (Timberlake 1995). Generally, mopane occurs on clay-rich soils,

9
in areas with a mean annual rainfall of 100 to 800 mm, and at altitudes ranging from 200
to 1 200 m above sea level (Timberlake 1995).
2.4 Biotypes of Colophospermum mopane (sensu stricto)
Inhabitants of mopani veld in Zambia recognise two distinct types of C. mopane (sensu
stricto), based on bark morphology. According to Madams (1990), these biotypes are
known by their Kunda names of “Mmkwelambulu” (trees with longitudinally fissured
bark) and “Kapalamamba” (trees with bark fissured longitudinally and horizontally).
2.5 Description of Colophospermum mopane (sensu stricto) ecotypes
Turresson (1992) coined the term ‘ecotype’ to define an ecological subunit that arises as a
result of a genotypic response to a particular habitat. An ecotype can also be defined as a
community of individuals of the same species, differentiating according to the substrate
in which it grows, in other words phenotypic plasticity (Tootill 1984). Ecotypes adapt to
tolerant conditions such as temperature or light intensities which the others members of
the same species are not exposed to. These adaptations may result in morphological or
physiological changes within the species. However, interbreeding with other ecotypes
does occur and fertile progeny is produced. Ecotypes may sometimes be sufficiently
distinct to be given infra-specific names and are then termed ecospecies (Tootill 1984).
According to Williamson (1996) an ecotype is an invasive capacity of species that
depends at least partly on the ability to adapt to new habitats.
10
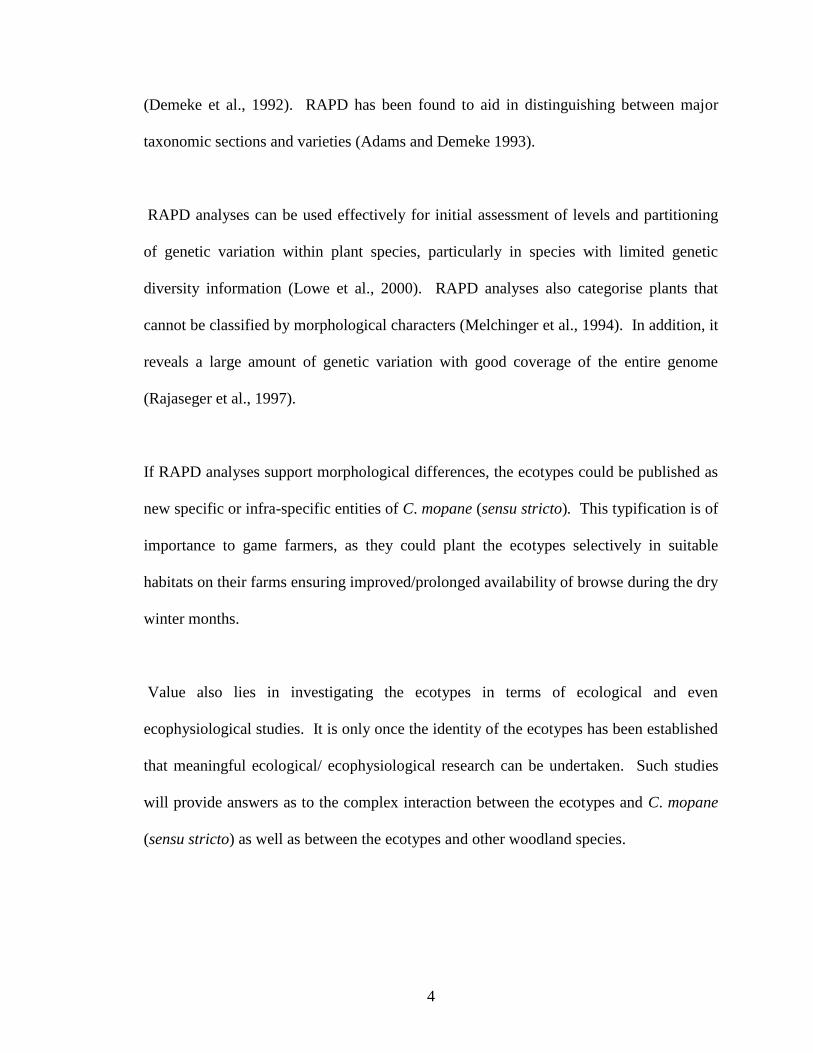
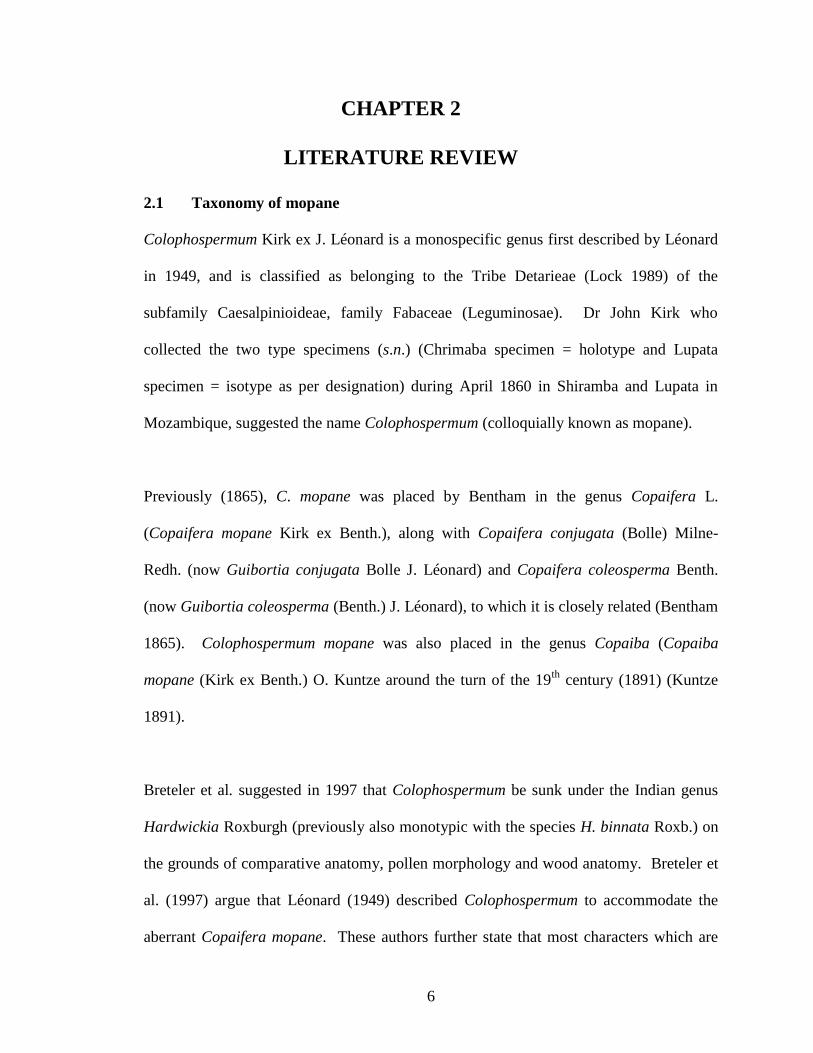
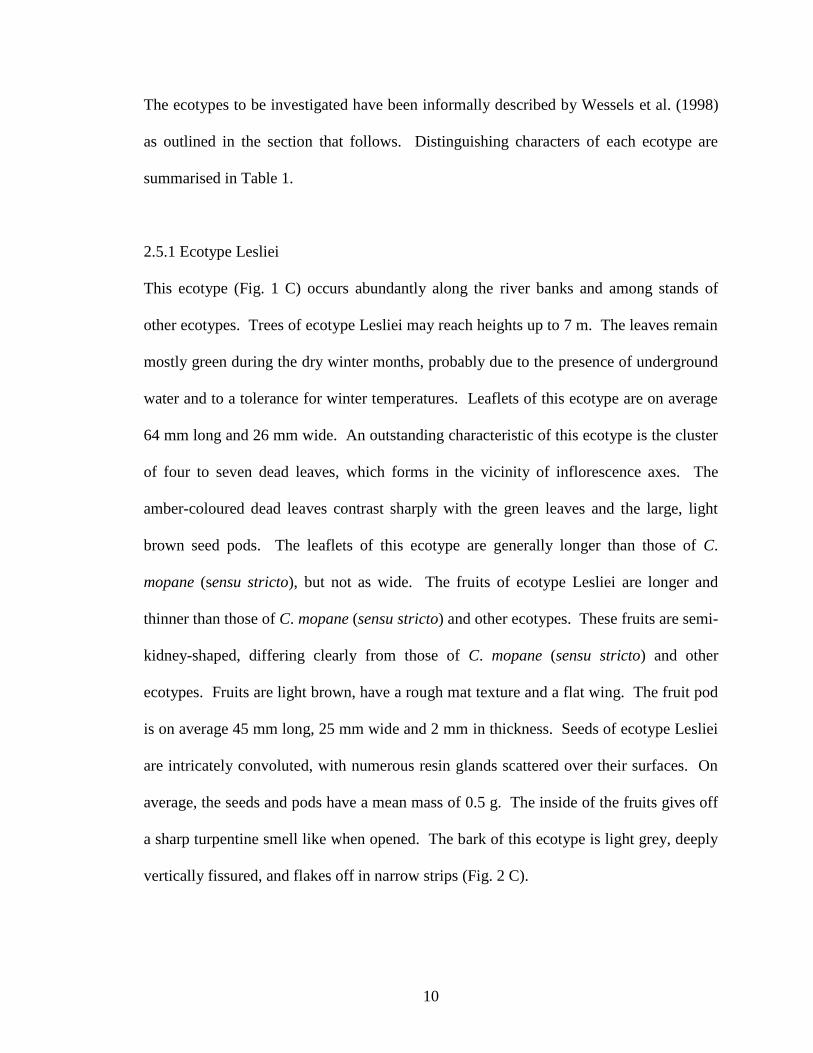
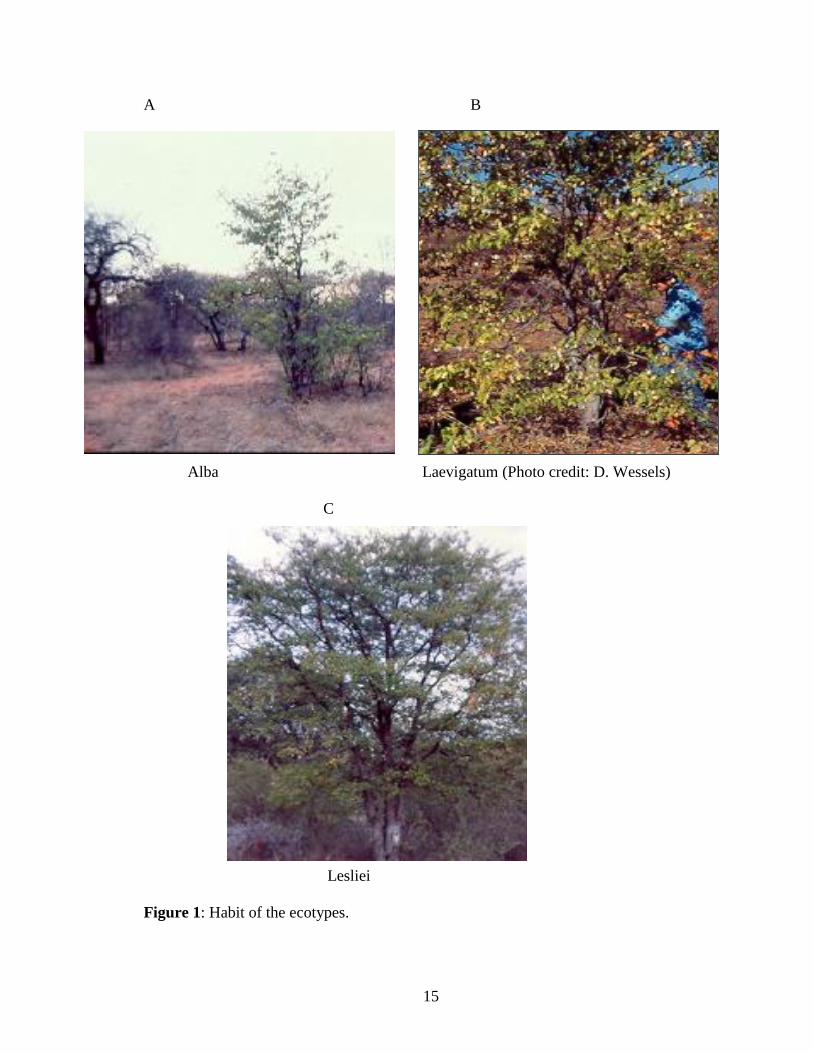
The ecotypes to be investigated have been informally described by Wessels et al. (1998)
as outlined in the section that follows. Distinguishing characters of each ecotype are
summarised in Table 1.
2.5.1 Ecotype Lesliei
This ecotype (Fig. 1 C) occurs abundantly along the river banks and among stands of
other ecotypes. Trees of ecotype Lesliei may reach heights up to 7 m. The leaves remain
mostly green during the dry winter months, probably due to the presence of underground
water and to a tolerance for winter temperatures. Leaflets of this ecotype are on average
64 mm long and 26 mm wide. An outstanding characteristic of this ecotype is the cluster
of four to seven dead leaves, which forms in the vicinity of inflorescence axes. The
amber-coloured dead leaves contrast sharply with the green leaves and the large, light
brown seed pods. The leaflets of this ecotype are generally longer than those of C.
mopane (sensu stricto), but not as wide. The fruits of ecotype Lesliei are longer and
thinner than those of C. mopane (sensu stricto) and other ecotypes. These fruits are semi-
kidney-shaped, differing clearly from those of C. mopane (sensu stricto) and other
ecotypes. Fruits are light brown, have a rough mat texture and a flat wing. The fruit pod
is on average 45 mm long, 25 mm wide and 2 mm in thickness. Seeds of ecotype Lesliei
are intricately convoluted, with numerous resin glands scattered over their surfaces. On
average, the seeds and pods have a mean mass of 0.5 g. The inside of the fruits gives off
a sharp turpentine smell like when opened. The bark of this ecotype is light grey, deeply
vertically fissured, and flakes off in narrow strips (Fig. 2 C).

11
2.5.2 Ecotype Alba
Ecotype Alba individuals are found in stands of C. mopane (sensu stricto) trees (Fig. 1
A). During winter individuals of ecotype Alba stand out amongst the brown- leaved or
leafless C. mopane (sensu stricto) individuals and remain mostly green during the dry
winter months. Individuals of this ecotype reach heights of up to 4.5 m. These
dissimilarities as opposed to C. mopane (sensu stricto) are in all probability due to
differences in cold tolerance and/or physiological, anatomical and morphological
characteristics. This ecotype generally has a more compact growth form compared to C.
mopane (sensu stricto) trees. The leaflets of ecotype Alba are wider than those of C.
mopane (sensu stricto) and other ecotypes. Leaflets are on average 60 mm long and 27
mm wide. The production of light brown (whitish) fruits is an outstanding characteristic
of this ecotype (Fig. 3 A). The fruit of ecotype Alba is longer, wider and thicker than
those of the other ecotypes and C. mopane (sensu stricto). The fruit pod are on average
39 mm long, 22 mm wide and 3 mm thick. On average, the seeds and pods have a mean
mass 0.4 g. The fruits are also lighter in weight than the fruits of the other ecotypes and
C. mopane (sensu stricto). This may be due to the small-sized seed of ecotype Alba. The
bark of this ecotype is light grey, with deep vertical and lateral fissures, and flakes as
scales (Fig. 2 D).
2.5.3 Ecotype Acuminata
Individuals of ecotype Acuminata occur among C. mopane (sensu stricto) trees in the
veld, but also along the courses of drainage systems. Ecotype Acuminata is less tolerant
to cold than the other ecotypes. Ecotype Acuminata has longer and narrower leaflets than

12
those of C. mopane (sensu stricto) and the other ecotypes (Fig. 4). Leaflets are on
average 74 mm long and 25 mm wide. The fruits are light brown and have a rough matt
texture. They are often slightly sun-bleached on the side exposed to the sun. The fruits
of ecotype Acuminata are deeply incised and kidney-shaped. The fruit pods are of
average 38 mm long, 21 mm wide and 3 mm thick. The seeds and pods have a mean
mass of 0.5 g. Ecotype Acuminata has the shortest fruits and are thinner but wider than
the fruits of C. mopane (sensu stricto). This ecotype has dark grey to blackish bark,
deeply fissured vertically and horizontally (Fig. 2 B). This gives the bark a “blocked”
appearance.
2.5.4 Ecotype Laevigatum
Ecotype Laevigatum is not abundant and only concentrated to the west of Musina, where
they grow on sandy soil, which originated from Clarens sandstone (Fig. 1 B). Trees of
this ecotype appear intermixed with the C. mopane (sensu stricto) forms. The trees are
medium-sized, 2-5 m high, but can also obtain heights of 15-20 m under wet conditions
where regular water supplies exist such as on river banks. Bark of this ecotype is grey
and smoother than the bark of C. mopane (sensu stricto) and other ecotypes, even for
mature trees (Fig. 2 A). Unlike other ecotypes, no reddish exudates appear (between the
wood and periderm) when the bark is removed. Also, the periderm appears late during
twig development, so that lenticels are visible over large parts of young stems of 3 to 4
growth periods.

13
Leaves of ecotype Laevigatum remain green during the dry winter months. Leaflets of
this ecotype are on average 44 mm long and 21 mm wide. The petiole is generally 19
mm long. The fruits of Laevigatum are light brown with a rough matt texture and flat
wing (Fig. 3 A). Fruit pods are on average 31 mm long and 17 mm wide. This ecotype
has the smallest fruits of all the ecotypes and C. mopane (sensu stricto). Seeds are on
average heavier than those of the other ecotypes, with a mean mass of 0.8 g.
It is assumed that the distribution of this ecotype continues into Botswana (Wessels and
Potgieter, personal communication). The precise northern and western distribution range
of this ecotype is yet to be established. Presumed hybrids have been observed that
morphologically resemble both C. mopane (sensu stricto) and Laevigatum. These trees
have the smooth bark of Laevigatum and the larger fruits of C. mopane (sensu stricto).
2.5.5 Ecotype Parvispermum
Ecotype parvispermum grows on calcareous soils. Trees of this ecotype occur
intermingled with C. mopane (sensu stricto) and attain heights of 5 - 7 m. Leaflets of this
ecotype are on average 43 mm long and 16 mm wide. The petiole is generally 21 mm
long. The fruits of ecotype Parvispermum are light brown with a rough matt texture.
Fruit pods are on average 29 mm long, 12 mm wide and 2mm in thickness. On average,
the fruit has a mean mass of 0.46 g and the seed has a mean mass of 0.25 g. The bark of
ecotype Parvispermum is rough, dark grey.

14
Table 1: Distinguishing morphological characters of the ecotypes, the most
differentiating characters are underlined
Alba Lesliei Acuminata Laevigatum Parvispermum
Bark colour
and texture
Light grey
Rough
Light grey,
Rough
Dark grey–
Black, Rough
Dark grey,
Smooth
Dark grey,
Rough
Leaflet
shapes
Narrowest
leaflet
Sharpest leaflet
apex
Pulvinus on
upper 1/3 of
leaflets
No unique
characters
No unique
characters
Fruit colour
and mean
mass
Whitish
brown,
0.4 g
Light brown,
0.5 g
Light brown
0.5 g
Brown,
0.8 g
Brown,
0.46 g
15
A B
Alba Laevigatum (Photo credit: D. Wessels)
C
Lesliei
Figure 1: Habit of the ecotypes.

16
A B
Laevigatum Acuminata
C D
Lesliei Alba
Figure 2 : Bark characteristics of the ecotypes.

17
A B
Alba C. mopane (sensu stricto) and other
ecotypes
Figure 3: The fruits of C. mopane (sensu lato)
A B
Acuminata C. mopane (sensu stricto) and other
ecotypes (Photos credit: D. Wessels)
Figure 4: The leaflets of C. mopane (sensu lato).
18
2.6 Previous studies on genetic diversity of C. mopane (sensu stricto)
Villoen et al. (2003) studied allozyme variation in five populations of Colophospermum
mopane using isoenzyme techniques. The study was done to determine if ecological
variants exist within C. mopane (sensu stricto) populations and to screen for genetic
variation. The results show that no heterozygote deficiencies were observed as all loci
conformed to Hardy-Weinberg expectations. Villoen et al. (2003) concluded that the
genetic differentiation among populations of C. mopane (sensu stricto) did not reflect
geographical separation by distance and the genetic variation within C. mopane (sensu
stricto) was sufficient to ensure adaptability of the species. The study suggested that
further DNA analysis should be done on ecotypes to prove their existence.
2.7 Random Amplified Polymorphic DNA (RAPD)
RAPD is a molecular tool for measuring genetic relationship among plants and plant
cultivars described by Williams et al. (1990). RAPD is based on PCR procedure and a
small amount of DNA is necessary in the reaction (Achenbach et al., 1996). The
amplification protocol differs from standard PCR conditions in that only a single random
oligonucleotide is employed. The PCR reaction involves repeated cycles, each consisting
of a denaturation, a primer annealing and an elongation step. In the first cycle the DNA
is made a single strand by raising the temperature to 94°C (denaturation step). In the
second cycle, lowering of the temperature to between 40°C and 65°C results in annealing
of the primer to their target sequences on the template DNA (annealing step). In the third
cycle, a temperature is chosen where the activity of the thermostable Taq DNA
polymerase is optimal, usually 72°C (elongation step).
19
Amplification products are separated by gel electrophoresis and visualised by ethidium
bromide staining (Williams et al., 1990). The most crucial factors that need to be
optimized in a RAPD reaction are the magnesium concentration, enzyme concentration,
DNA concentration and annealing temperature of the primer. The Guanine and Cytosine
(GC) content of the primers should be 40% to 60% and care should be taken to avoid
sequences that produce internal secondary structures. The annealing temperature for a
PCR cycle is generally 3°C to 5°C below the melting temperature of the primer
(Williams et al., 1990).
The use of a single 10-mer oligonucleotide promotes generation of several discrete DNA
products which are considered to originate from different genetic loci. The amplification
products are resolved on agarose gel (Williams et al., 1990). This new technique
received a high recognition as a powerful and efficient tool with application to ecology,
systematic, evolution studies, and especially to population biology (Welsh and
McClelland 1990). RAPD technology has quickly gained widespread acceptance and
application because it has provided a tool for genetic analysis in biological systems that
have not previously benefited from the use of molecular markers (Hadrys et al., 1992).
RAPD markers have been used for the development of genetic maps, for targeting genetic
markers and in population genetics (Hadrys et al., 1992). The area of research that has
shown the most growth with respect to the use of RAPD technology is that of population
genetics (Hadrys et al., 1992).

20
RAPD markers have been used to create fingerprints for the study of individual identity
and taxonomic relationship in both eukaryotic and prokaryotic organisms. RAPD
markers are being used effectively to assess the amount of genetic diversity in germplasm
collections. RAPD markers show to discriminate between individuals in a germplasm
collection and to distinguish between closely related individuals was simply a function of
the number of RAPD bands that were observed. This technique can also be used to
determine taxonomic identity, assess kinship relationship, detect interspecific gene flow,
analyse hybrid speciation, and create specific probes (Hadrys et al., 1992).
The absence and presence of bands can be scored and the data converted into similarity
matrices for calculating genetic distances (Ellsworth et al., 1993; Karp et al., 1996). The
use of such techniques for germplasm characterisation facilitates conservation and
utilization of plant genetic resources, permitting the identification of unique accessions or
sources of genetically diverse germplasm. The ability of this method to distinguish
between taxa also has useful implications in botanical quality analysis (Soltis et al., 1992;
He et al., 1995).
RAPDs are suitable for studies on anonymous genomes (Hadrys et al., 1992). RAPD
requires no DNA probes, and no prior knowledge of sequence information is required for
the design of specific primers. The procedure involves no blotting or hybridisation. The
technique is simple, quick and efficient. RAPD require only a small amount of DNA
(Williams et al., 1990).
21
RAPD is a Yes or No test, either that a specific sequence of code matches other samples
or it does not. If it does not, then that sequences is “polymorphic” (many forms) meaning
the two plants are not of the same genotype. Sets of short primers (usually 10-mers)
suitable for RAPD amplification are available commercially or can easily be synthesized
and, apart from a thermocycler and an agarose gel assembly, no special equipment is
required (Hadrys et al., 1992).
RAPD does not require special staining procedures to visualise polymorphisms. RAPD
have been reported to detect higher levels of polymorphism compared to RFLP in cases
where the two have been employed together (Williams et al., 1990; Lu et al., 1996). The
data derived from RAPD have their strength in being able to distinguish individuals,
cultivars and accessions (Karp et al., 1996).
Limitations of RAPD are that it is a dominant marker, hence it is impossible to
distinguish homozygous individuals from heterozygous individuals in the absence of a
pedigree analysis. In addition, the identity of individuals in the multi-profile is not
known and there can be uncertainties in assigning markers to specific loci. Single bands
on the gel can sometimes consist of several co-migrating amplification products (Karp et
al., 1996). RAPD techniques lack reproducibility. This is because RAPD analysis
provides only a medium level of polymorphism, being less suitable to distinguish very
close genomes (i.e. different clones from the same cultivars or siblings) where similar
banding patterns are expected (Oliveira et al., 1999).

22
2.8 RAPD as a tool for identification of plant species
2.8.1 African tree species
RAPDs have been applied to assess genetic variation and relationships in African tree
species. These includes the following; Prunus africana (Dawson and Powell 1999),
Prunus mahaleb (Jordano and Godoy 2000), Irvingia species (Lowe et al., 2000), Musa
species (Pillay et al., 2001), Vitellaria paradoxa (Bouvet et al., 2004), Vitex fischeri
(Lengkeek et al., 2006), and Manihot esculenta (Zacarias et al., 2006).
2.8.2 Non African trees
2.8.2.1 Cultivated fruit trees
Many cultivated fruit trees have been differentiated using RAPD due to difficulty in
observing morphological traits after grafting, help in identifying accessions and also in
avoiding duplications or mislabeling of genotypes at gene banks. Some of the cultivated
fruit trees include, Prunus persica cultivars (Lu et al., 1996), Ixora species (Rajaseger et
al., 1997), Pyrus species (Oliveira et al., 1999), Citrus reticulata accessions (Coletta
Filho et al., 2000), Feijoa sellowiana (Dettori and Palombi 2000), Lansium domesticum
accessions (Song et al., 2000), Lithocerasus species (Shimada et al., 2001), Pistacia
species (Kafkas 2002), Vitis species (Kim et al., 2002), Asimina triloba (Huang et al.,
2003), Prunus dulcis (MirAli and Nabulsi 2003), Fragaria species (Zebrowska and
Tyrka 2003), Diospyros taitoensis (Yamagishi et al., 2005).
2.8.2.2 Wild woody trees
Most wild trees vary with age and sometimes with the habitat. Therefore, RAPD has
been used to differentiate species and to ascertain the taxonomic status of a population.

23
Wild woody tree species include the following: Gliricidia species (Chalmers et al., 1992),
Theobroma cocoa clones (Wilde et al., 1992), Picea abies (Bucci and Menozzi 1995),
Populus tremuloides (Yeh et al., 1995), Picea species (Perron et al., 1995), Pinus species
(Nkongolo et al., 2002), Avicemia species (Parami et al., 1997), Cedrela odorata. (Gillies
et al., 1997), Fagus sylvatica (Gallois et al., 1998), Dipterocarps species (Rath et al.,
1998), Eucalyptus globulus (Skabo et al., 1998), Eugenia dysenterica (Trindade and
Chaves 2005).

24
CHAPTER 3
MATERIALS AND METHODS
3.1 Materials
3.1.1 Plant material
Mature leaves and seeds of C. mopane (sensu lato) were randomly collected from the
populations in the Musina and Phalaborwa districts. One individual of Bauhinia galpinii
N.E. Baker, used as an outgroup, was sampled from the grounds of Polokwane Campus,
University of Limpopo. A total of 30 leaf samples were collected each in the Musina and
Phalaborwa districts (Figure 5). After collection, the leaf and its petiole were
immediately frozen in liquid nitrogen, to maintain DNA stability. The samples were
stored at –80°C in a freezer for subsequent genomic DNA isolation.
3.1.2 Reagents
Acetic acid glacial, Chloroform, Ethanol, Ether, Glycerol were obtained from Saarchem,
Johannesburg, South Africa; Agarose Bromophenol blue, CTAB, βmecarptoethanol,
EDTA, Ethidium Bromide, Isoamylalcohol, NaCl, Phenol, PVP, TRIS were obtained
from Sigma, Johannesburg, South Africa; Liquid nitrogen was obtained from the
Microscopy and Microanalysis unit, University of Limpopo; Primers were obtained from
Qiagen Operon, Germany; RNaseA, PCR components (MgCl2, 5 U Taq DNA
polymerase, 1×PCR buffer and 2 mM dNTPs) were obtained from Fermentas, Pretoria,
South Africa.

25
Mopane 40 km south of Musina
Doreen 15 km south of Musina
Ndzhelele 14 km north of Makhado
MEF
Figure 5: Localities of the samples used. Pink stars indicate collection sites.

26
3.2 Methods
3.2.1 Seed germination
Four replicates of seeds from each ecotype and C. mopane (sensu stricto) were
germinated in pots with the soil from the collected districts (Musina and Phalaborwa) in
the glasshouse of the University of Limpopo for at least six weeks. Leaflets collection
was completed after six weeks when the seedlings were at the three to six leaflet stages.
A total of 23 leaflets were extracted, two for Alba (Phalaborwa) and five for Alba
(Musina), two for Parvispermum, three each for Laevigatum and Acuminata, and four
each for Lesliei and Mopane (sensu stricto). The leaflets were first washed with sterile
autoclaved distilled water and then frozen in liquid nitrogen.
3.2.2 DNA extraction
A modified CTAB procedure described by Doyle and Doyle (1990) was used for the
extraction of DNA from the young seedlings and mature leaves of C. mopane (sensu
lato). The CTAB method is relatively simple and is the method of choice for obtaining
good quality total DNA from many plant species. The method is applicable to both fresh
and dehydrated plant material and was tested on plants with polyphenols and
polysaccharides. The procedure uses polyvinylpyrrolidone (PVP) and NaCl to remove
contaminations e.g. polyphenols and polysaccharides (Sharma et al., 2002).
In this procedure, between 0.3 to 0.5 g of the leaf samples were weighed and ground into
powder while in liquid nitrogen using a pestle and mortar. To the ground leaves, 5 ml of
extraction buffer (100 mM Tris-HCl, 1.42 M NaCl, 20 mM EDTA and 2% CTAB, with
2% β-mecaptoethanol) was added. The resulting slurry was poured into a 50 ml

27
polypropylene centrifuge tube, followed by rinsing of the pestle and mortar with 1 ml of
extraction buffer and adding the rinsings (wash off) to the initial extract.
To the leaf slurry 50 mg of PVP was added and then mixed by inverting the tube several
times. The tubes were incubated at 60°C for 25 minutes and thereafter left to cool to
room temperature. To the tubes, 6 ml of chloroform: isoamylalcohol (24:1) was added
and mixed gently by inverting the tubes to form an emulsion. The mixture was
centrifuged at 6000 rpm on a MISTRAL 1000 centrifuge fitted with a MSE 935 rotor for
15 minutes at room temperature. A second chloroform: isoamylalcohol extraction was
performed on supernatants that were cloudy due to the presence of PVP. The supernatant
was collected, and half volume of 5 M NaCl and two volumes of cold (20°C) 95%
ethanol were added to precipitate DNA. The precipitated mixture was then centrifuged at
3000 rpm for three minutes followed by 5000 rpm for another three minutes to sediment
the DNA pellet on the bottom of the tube. Because CTAB and NaCl sometimes
precipitate with DNA, the CTAB/ NaCl residual was removed by a three-time wash with
70% ethanol followed by a short centrifugation run. The supernatant was discarded,
followed by washing the pellet with 76% ethanol. The pellet was dried by leaving the
tubes uncovered in a water bath at 37°C for 30 minutes.
The dried pellet was resuspended in 300 l TE buffer (1 mM EDTA and 10 mM Tris, pH
8). In order to remove RNA and protein contamination, the solution was treated with 5
l RNaseA (10mg/ml) and incubated at 37°C for 1hr. The RNaseA treatment was
followed by addition of 300 l phenol/chloroform/ isoamylalcohol (25:24:1) precipitation
28
(Cheng et al., 2003) and centrifugation for 15 minutes at 10000 rpm in a Joan microfuge
centrifuge. To the supernatant, 100 l of 5 M NaCl and 400 l water-saturated ether
were added followed by centrifugation for 10 minutes at 10000 rpm. The bottom phase
was collected and two volumes of pre-chilled 95% ethanol were added followed by
incubation at 4°C until the DNA strand appeared. The precipitated mixture was
centrifuged at 5000rpm for three minutes and the formed pellet was washed with 70%
ethanol until a colourless pellet was obtained. The pellet was dried by speed vacuum
(SC110, New York) and then resuspended in 100 l of TE buffer. The DNA was kept at
-20°C until used.
3.2.3 Quantification of DNA
The determination of DNA quantity and quality was undertaken utilising two methods,
spectrophotometric measurements (CARY 1E UV-visible and NanoDrop
spectrophotometer, Fermentas) and agarose gel electrophoresis. Using the CARY 1E
UV-visible spectrophotometer for each sample, 5 µl of DNA was pipetted and mixed
with 995 µl of TE buffer in a 1cm or 1ml quartz microcuvette. The mixture was read at
260 and 280 nm against a TE buffer blank. The actual quantity of the DNA was
calculated by converting optical density (OD) readings to µg/ml (reading of 1.0 at OD260
is equivalent to 50 µg of DNA/ml). In the NanoDrop method, 2 µl of each DNA sample
was pipetted onto the cell of the NanoDrop spectrophotometer. The mixture was
precalibrated at A260 nm: A280 and A260 nm: A230 nm against TE buffer blank. The DNA
sample was run on 0.8% agarose gel electrophoresis to further check the quality of DNA.

29
3.2.4 RAPD Analyses
For RAPD amplification, 20 arbitrary nucleotide primers (Table 2) were initially
screened for amplification and polymorphism, those that gave reproducible and distinct
banding patterns were selected. All the primers used were random sequence primers with
GC contents of 60 and 70%.
Table 2: The 20 primers screened for amplification and polymorphism.
RAPD analyses were carried out with varying concentrations of MgCl2 (1.5 mM, 2 mM
and 4 mM), Taq DNA polymerase (1 U, 1.25 U and 2 U) and DNA template (1 l, 2 l, 4
l and 5 l) to optimise PCR conditions. Different brands of Taq were used. These
Primer code Nucleotides Sequence
(5’ to 3’)
%G+C Melting/ annealing temperature
(Tm)
Tm= 4(G+C) +2(A+T)
OPA 01 CAGGCCCTTC 70 34
OPA 02 TGCCGAGCTG 70 34
OPA 03 AGTCAGCCAC 60 32
OPA 04 AATCGGGCTG 60 32
OPA 05 AGGGGTCTTG 60 32
OPA 06 GGTCCCTGAC 70 34
OPA 07 GAAACGGGTG 60 32
OPA 08 GTGACGTAGG 60 32
OPA 09 GGGTAACGCC 70 34
OPA 10 GTGATCGCAG 60 32
OPA 11 CAATCGCCGT 60 32
OPA 12 TCGGCGATAG 60 32
OPA 13 CAGCACCCAC 70 34
OPA 14 TCTGTGCTGG 60 32
OPA 15 TTCCGAACCC 60 32
OPA 16 AGCCAGCGAA 60 32
OPA 17 GACCGCTTGT 60 32
OPA 18 AGGTGACCGT 60 32
OPA 19 CAAACGTCGG 60 32
OPA 20 GTTGCGATCC 60 32

30
included Ex Taq, Takara; Ampli gold Taq, Applied Biosystems; and Recombinant Taq
polymerase, Fermentas. In the optimised PCR, RAPD reactions were performed in a
total volume of 25 l in sterile 0.2 ml eppendorf tubes containing 10×PCR buffer (10
mM Tris-HCl, pH 8.0), 2 mM dNTPs, 5 U Taq polymerase, (Fermentas), 0.5 µM primers
and 2 l of template DNA. For the initial primer screening, a reaction mixture contained
1 buffer, 1.5 mM, 0.2 mM dNTPs, 0.5 M primer, 2 U Taq and DNA template (Table
3). The negative control mixture (reaction containing all reagents except DNA template
whereby the DNA is replaced by sterile water) was included to check for contamination.
To reduce the PCR artifact or possibility of cross contamination and pipetting errors for
each primer, a reaction master mixture (Table 3) of all the reagents except the genomic
DNA was always used and then aliquoted. The manipulation of RAPD reaction was
always done on ice.
Table 3: Composition of the PCR reaction mixture (25 l).
Components Stock concentration Final concentration Volume per reaction
PCR buffer 10× 1× 2.5
MgCl2 25 mM 4 mM 4
Taq polymerase 5 U/ l 2 U 0.4
dNTPs 2 mM 0.2 mM 2.5
Primer 20 M 0.5 M 1
Water 12.6
DNA 50-200 ng 2

31
The best concentrations of MgCl2 for further analyses were selected based on the number,
sharpness and the intensity of bands. Different annealing temperatures (30°C, 37°C,
40°C and 50°C) and alternations of the program were made until both amplification and
polymorphism were obtained. The following program was used on a Gene Ampli PCR
systems 9700 thermocycler (Applied biosystems, USA): An initial predenaturation step
at 94°C for 120 sec, followed by 5 cycles at 94°C for 25 sec, 40°C for 30 sec and 72°C
for 90 sec, this was followed by 30 cycles denaturation (94°C for 15 sec), annealing
(40°C for 30 sec) and extension (72°C for 80 sec) with final extension (72°C for 420 sec).
After completion of the amplification cycles, the reactions were held at 4°C until the
products were used. The reaction was repeated at least once to ensure reproducible
banding patterns.
3.2.5 Agarose gel electrophoresis
The first step in agarose gel electrophoresis was to combine 12.5 l of amplified DNA
sample with 3 l of loading buffer (30% glycerol and 0.25% bromophenol blue). The
amplification products were separated on 2% (w/v) agarose gel submerged in 1×TAE
buffer (100 mM Tris- Acetic Acid and 0.5 M EDTA, pH 8). Ethidium bromide
(10mg/ml) was added to the gel for visualisation of DNA bands. A 1kb mass ruler DNA
ladder was used to estimate the size of RAPD band. Electrophoresis was conducted at a
voltage of 77V for two hours. A photograph of the gel was taken with a Polaroid camera
under Ultraviolet (UV) light on a UV transilluminator.

32
3.2.6 Data analysis
The polymorphism was analysed using RAPD bands. The reproducible, polymorphic and
monomorphic bands were visually scored as present (1) or absent (0). Faint reproducible
RAPD bands were also scored. The absence and presence of bands were entered in a
computer file as a binary matrix. The resulting binary matrix was analysed using the
parsimony optimality criterion of the software package PAUP* (Phylogenetic Analysis
Using Parsimony) version 4.0b10 for Macintosh computer (Swofford 2002). Genotypic
relationships based on RAPD data, with respect to Bauhinia galpinii selected as outgroup
were analysed using both distance and parsimony methods. The database included all
RAPD bands obtained. Individual data obtained from the three selected primers and
combined data of primers were analysed, to obtain a dendogram that depicts the likely
relationships within C. mopane (sensu lato). The matrix had 24 taxa and 31 characters,
formatted as a NEXUS file with RAPD bands represented as 1's and 0's. Question marks
were entered for missing data.
Parsimony settings were as follows: the trees were unrooted at the midpoint. All
characters were weighted equally, and reversal and convergences were considered
equally probable transformations. Character coding was treated as unordered to give rate
to any possible transformation between two states (Fitch parsimony, Fitch 1971).
MULPARS (Multiple parsimony) and steepest descent options were not in effect. The
branches having a maximum length of zero were collapsed to yield polytomies. A
topological constraint was not enforced. Branch lengths for trees were calculated using
the ACCTRAN (accelerated
transformation) character-state optimization, stepmatrix
33
option allowed assignment of states not observed in terminal taxa to
internal nodes (all
states in stepmatrix). Because of the large number of taxa used in the parsimony
analysis, exact-solution (exhaustive or branch-and-bound) searches were impossible
(Schuh 2000). Therefore, parsimony analysis was performed using heuristic search.
3.2.6.1 Construction of parsimonious trees using heuristic search
In order to get the most parsimonious trees, heuristic search was performed because the
taxa were beyond 18. The results from this search can often be improved without an
increase in time. The data set were subjected to heuristic search with simple sequence
additions (reference taxon: Bauhinia galpinii) increased automatically by 100 and tree
bisection-reconnection (TBR) branch swapping. All multiple equally parsimonious trees
were saved to a tree file. The tree length was used to determine the most parsimonious
trees. Taxa contained in the parsimony analysis were compared using strict and 50%
majority rule consensus analyses (Margush and McMorris 1981).
3.2.6.2 Bootstrapping analysis using Parsimony trees
To test the reliability of certain branches in the evolutionary tree, bootstrapping was
performed. The bootstrap proceeds by re-sampling the original data, with replacement, to
create a series of bootstrap samples of the same size as the original data. The method
used maximum-parsimony as the optimality criterion with
100 replicates. Trees found in
parsimony analysis of both primer 03 and combined primers were then used as starting
trees for bootstrapping analysis. MAXTREES (maximum trees) were set to 60100 for
each replicate, increased automatically by 100 and saving the best trees per replicate.
34
The tree-bisection-reconnection (TBR) as branch-swapping algorithm was used to test the
support of individual clades, starting trees obtained via stepwise addition (a process
whereby taxa are added to a developing tree), and one tree held at each step during
stepwise addition. To minimize the time spent searching large numbers
of trees, a
random addition sequence with one replicate was applied for each bootstrapping iterion.
This effectively randomized the seed for each bootstrap replicate. The respective
dendograms shown in the results section derived from the enforcement of the 50%
majority-rule consensus and only those groups of more than 50% frequency were
reported. The bootstrap value of a node is the percentage of times that a node is present
in the set of trees that is constructed from the new data sets.
3.2.6.3 Distance method
The relationship among individuals was determined using a distance matrix method. In
addition, total mean character differences between all pair-wise combinations of the C.
mopane (sensu lato) were calculated using PAUP. Such values (total mean character
differences) represents the proportion of different bands between all the possible pairs of
the ecotypes. The values were then converted into percentage by taking the total mean
value divided by the total number of samples times 100%. Neighbour Joining analyses
(Saitou and Nei 1987) were computed from total character mean values using a heuristic
search run in PAUP with the settings ADDSEQ (additional sequence) = random, NREPS
(Number of replicates) = 1000, and TBR branch swapping.

35
CHAPTER 4
RESULTS
4.1 DNA yield and quality
The DNA isolated using the CTAB method from the young seedling and mature leaves
of C. mopane (sensu lato) was found to be contaminated with polysaccharides and other
contaminants as shown by the spectrophotometer readings which gave A260 nm/A280 nm
ratio of 0.35 to 1.35. These values indicate the levels of contaminants. The DNA sample
was also viscous, with some samples concentrating on the wells and not moving into the
gel, this being an indication of the presence of polysaccharides (Fig. 6 A). The quantity
of DNA obtained from seedlings was generally higher compared to that of mature leaves.
Poor and inconsistent PCR amplifications were obtained from DNA extracted using only
the CTAB method.
To remove the polysaccharides observed during CTAB extraction, phenol precipitation
was introduced as an additional extraction step. This improved the quality of DNA and
removed impurities that interfered with the PCR. The DNA obtained was pure white and
easily solubilised in TE buffer. Unlike the DNA isolated using the CTAB method, the
DNA following electrophoresis migrated into the gel (Fig. 6 B). This DNA was
quantified using the NanoDrop spectrophotometer (Fig. 7 and Table 4). The quantity of
DNA obtained using phenol precipitation varied from 140.8 ng to 1964 ng per 1 μl. The
A260 nm/A280 nm ratio ranged from 1.56 to 2.58. The ratio of OD260 to OD280 and OD260
to OD230 provides some information about the purity of the DNA sample as well as

36
amount of contamination by proteins and carbohydrates. Pure DNA preparation shows
an OD260 to OD280 ratio of between 1.8 and 2.0. The ratio below 1.8 shows
contamination with protein. In a few samples with extremely low contents of DNA, the
absorbance ratio was lower than 1.8. These samples were not used for RAPD analyses.
The DNA with higher quantities and qualities was used to perform all RAPD analysis,
resulting in consistent results.
37
1 2 3 4 5 6 7 8 9 10 11 12
Figure 6 A: Agarose gel electrophoresis gel (0.8%) of the total DNA prepared from
Colophospermum mopane (sensu lato) using a CTAB method. For each sample 10 μl of
DNA was loaded in each well. Lanes: - 1: Mopane 1; 2: Laevigatum1; 3: Lesliei hek 2;
4: Alba 1 Phala; 5: Parvispermum 1; 6: Alba 5; 7: Lesliei 3; 8: Alba 7 MEF; 9: Alba 6;
10: Parvispermum 2; 11: Alba 11 Phala; 12: Acuminata 2.
M 1 2 3 4 5
Figure 6 B: Agarose gel electrophoresis gel (0.8%) of the total DNA prepared from
Colophospermum mopane (sensu lato) using the modified CTAB method. For each
sample 10 μl of DNA was loaded in each well. Lanes: - M: (1 kb Mass ruler DNA ladder
mix); 1: Alba 6; 2: Laevigatum 1; 3: Alba 1 Phala; 4: Alba 7; 5: Parvispermum 2.
100 bp
300 bp 500 bp
2000 bp
10000 bp
2500 bp 4000 bp
Size
38
Table 4: Quantity and quality of selected DNA samples. The measured parameters were
obtained using NanoDrop spectrophotometric determination (NanoDrop, technologies
Inc).
Sample ID ng/ μl A260 A260/280 A260/230
(According to the Nanodrop precalibration)
Alba 6 1269 25.3 2.0 2.6
Acum 2 140 2.8 1.56 0.7
Alba 1 1964 39.2 2.0 2.0
Alba 5 987 19.8 1.9 1.9
Alba 1 Phala 1256 25.1 2.0 1.7
Laevi 1 1501 30.0 2.0 1.7
Alba 7 1213 24.2 2.0 1.3
Parvi 2 156 3.1 1.7 0.8
Figure 7: Characteristic UV spectrum of the purified genomic DNA samples of
Colophospermum mopane (sensu lato) obtained using the NanoDrop DNA quantification
(see Table 5). Sample with high DNA concentration-(red line) and low DNA
concentration-(green line)

39
4.2 RAPD analyses
4.2.1 Optimisation of RAPD conditions for amplification
A total of 20 random primers were initially screened for amplification of DNA from C.
mopane (sensu lato). The effect of MgCl2, type and amount of Taq polymerase, and
annealing temperature were examined. Amplifications were obtained using 2 U of
recombinant Taq DNA polymerase (Fermentas brand). The nucleotide primers amplified
at 40°C annealing temperature. Of the 20 primers screened, only nine primers (OPA 01,
OPA 02, OPA 03, OPA 08, OPA 09, OPA 10, OPA 13, OPA 18 and OPA 20) produced
RAPD amplifications (Figs 8 and 9). The best MgCl2 concentration with OPA 13 was 2
mM, with higher MgCl2 concentrations resulting in several bands that were not easily
scorable. For the remaining primers 4 mM MgCl2 was found to be most suitable. The
intensity of the fragments produced by OPA 03 (Fig. 8 D) under optimised PCR
conditions was low. The primer concentration for this primer was increased from 10 μM
to 20 μM with a resultant increase in band intensity (Fig. 10).
40
A B
M 1 2 3 4 5 6 7 M 1 2 3 4 5 6 7
OPA 01 OPA 09
C D
1 2 3 4 5 6 7 8 M 1 2 3 4 5 6
OPA 13 OPA 03
Figure 8: RAPD profile generated using four selected primers on C. mopane (sensu lato)
DNA. Lanes: - M: (1 kb Mass ruler DNA ladder mix); 1: Mopane 4; 2: Laevigatum 1;
3: Mopane 2; 4: Parvispermum 1; 5: Lesliei 3; 6: Alba 6; 7: Parvispermum 2; 8:
Acuminata 2.

41
A B
M 1 2 3 4 5 6 7 1 2 1 2 3 1 2 3
OPA 18 OPA 10 OPA 02 OPA 20
C
M 1 2 3 4 5 6
OPA 08
Figure 9: RAPD profile generated using five selected primers on C. mopane (sensu lato)
DNA. Lanes: - M: (1 kb Mass ruler DNA ladder mix); 1: Mopane 4; 2: Laevigatum 1;
3: Mopane 2; 4: Parvispermum 1; 5: Lesliei 3; 6: Alba 6; 7: Parvispermum 2; 8:
Acuminata 2.

42
M 1 2 3 4 5 6 7 8
Figure 10: RAPD profile generated using OPA 03 with 20 μM primer concentrations on
C. mopane (sensu lato) DNA. Lanes: - M: (1 kb Mass ruler DNA ladder mix); 1:
Mopane 4; 2: Laevigatum 1; 3: Mopane 2; 4: Parvispermum 1; 5: Lesliei 3; 6: Alba 6;
7: Parvispermum 2; 8: Acuminata 2.
4.2.2 Optimisation of RAPD primers for polymorphism
Further screening of the primers for polymorphisms was performed using the primers that
amplified most DNA samples. Six primers (OPA 02, OPA 03, OPA 08, OPA 10, OPA
13 and OPA 18) were chosen. The primers that showed differentiation were used for
RAPD analyses with all the DNA samples (Figs 11-16).

43
M 1 2 3 4 5 6 7 8 9 10 11 12 13 14 15 16
Figure 11: RAPD profile generated using OPA 08 tested during analysis for
polymorphism: Lanes: - M: (1 kb Mass ruler DNA ladder mix); 1: Lesliei 4; 2: Lesliei
hek 2; 3: Lesliei 3; 4: Parvispermum 1; 5: Parvispermum 3; 6: Laevigatum 2; 7:
Laevigatum 4; 8: Bauhinia; 9: Mopane 4; 10: Mopane 3; 11: Mopane 2; 12:
Acuminata 2; 13: Acuminata 3; 14: Alba 2; 15: Alba 1 Phala; 16: Alba 6.
M 1 2 3 4 5 6 7 8 9 10 11 12 1314 15 16
Figure 12: RAPD profile generated using OPA 03 tested during analysis for
polymorphism: Lanes: - M: (1 kb Mass ruler DNA ladder mix); 1: Lesliei 4; 2: Lesliei
hek 2; 3: Lesliei 3; 4: Parvispermum 1; 5: Parvispermum 3; 6: Laevigatum 2; 7:
Laevigatum 4; 8: Bauhinia; 9: Mopane 4; 10: Mopane 3; 11: Mopane 2; 12:
Acuminata 2; 13: Acuminata 3; 14: Alba 2; 15: Alba 1 Phala; 16: Alba 6.
44
M 1 2 3 4 5 6 7 8 9 10 11 12 13 14 15 16
Figure 13: RAPD profile generated using OPA 18 tested during analysis for
polymorphism: Lanes: - M: (1 kb Mass ruler DNA ladder mix); 1: Leslie 4; 2: Lesliei
hek 2; 3: Lesliei 3; 4: Parvispermum 1; 5: Parvispermum 3; 6: Laevigatum 2; 7:
Laevigatum 4; 8: Bauhinia; 9: Mopane 4; 10: Mopane 3; 11: Mopane 2; 12:
Acuminata 2; 13: Acuminata 3; 14: Alba 2; 15: Alba 1 Phala; 16: Alba 6.
M 1 2 3 4 5 6 7 8 9 10 11 12 13 14 1 5 16
Figure 14: RAPD profile generated using OPA 09 tested during analysis for
polymorphism: Lanes: - M: (1 kb Mass ruler DNA ladder mix); 1: Lesliei 4; 2: Lesliei
hek 2; 3: Lesliei 3; 4: Parvispermum 1; 5: Parvispermum 3; 6: Laevigatum 2; 7:
Laevigatum 4; 8: Bauhinia; 9: Mopane 4; 10: Mopane 3; 11: Mopane 2; 12:
Acuminata 2; 13: Acuminata 3; 14: Alba 2; 15: Alba 1 Phala; 16: Alba 6.
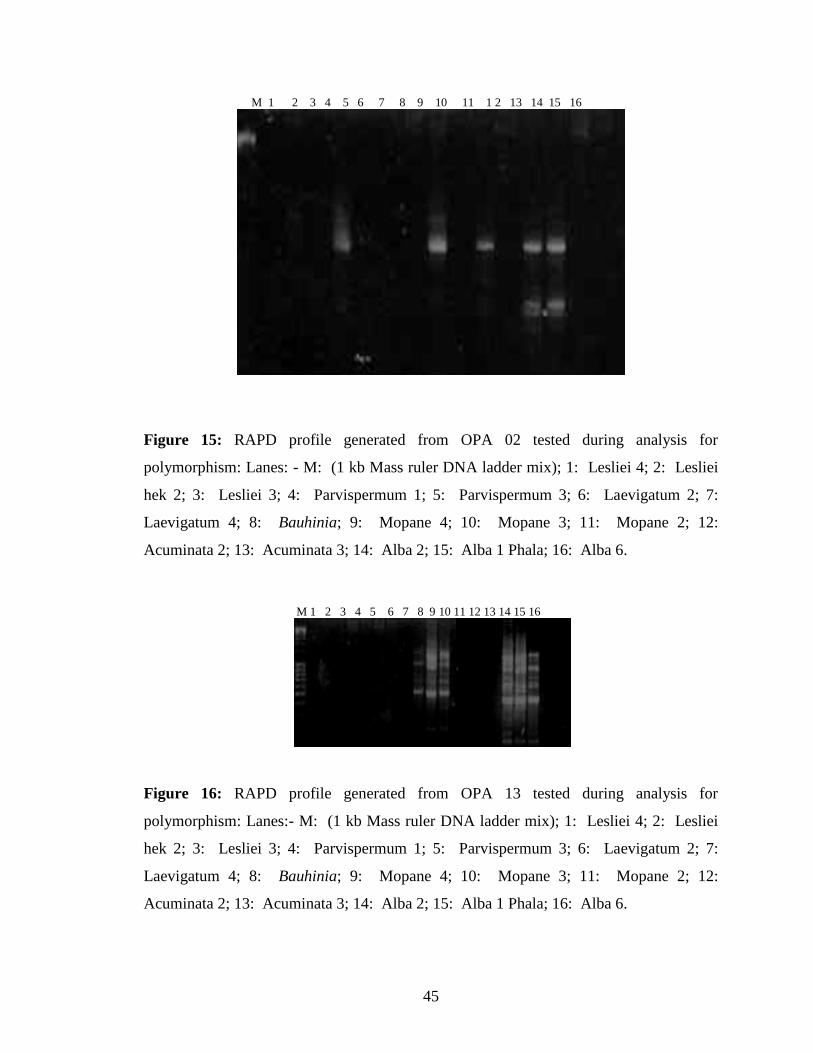
45
M 1 2 3 4 5 6 7 8 9 10 11 1 2 13 14 15 16
Figure 15: RAPD profile generated from OPA 02 tested during analysis for
polymorphism: Lanes: - M: (1 kb Mass ruler DNA ladder mix); 1: Lesliei 4; 2: Lesliei
hek 2; 3: Lesliei 3; 4: Parvispermum 1; 5: Parvispermum 3; 6: Laevigatum 2; 7:
Laevigatum 4; 8: Bauhinia; 9: Mopane 4; 10: Mopane 3; 11: Mopane 2; 12:
Acuminata 2; 13: Acuminata 3; 14: Alba 2; 15: Alba 1 Phala; 16: Alba 6.
M 1 2 3 4 5 6 7 8 9 10 11 12 13 14 15 16
Figure 16: RAPD profile generated from OPA 13 tested during analysis for
polymorphism: Lanes:- M: (1 kb Mass ruler DNA ladder mix); 1: Lesliei 4; 2: Lesliei
hek 2; 3: Lesliei 3; 4: Parvispermum 1; 5: Parvispermum 3; 6: Laevigatum 2; 7:
Laevigatum 4; 8: Bauhinia; 9: Mopane 4; 10: Mopane 3; 11: Mopane 2; 12:
Acuminata 2; 13: Acuminata 3; 14: Alba 2; 15: Alba 1 Phala; 16: Alba 6.

46
4.2.3 RAPD analysis of Colophospermum mopane (sensu lato)
Based on results for polymorphism, three primers (OPA 03, OPA 08 and OPA 09) were
chosen for RAPD analysis of C. mopane (sensu lato) (Figs 11-16). The replication
reactions showed reproducible banding patterns for these primers. The three
polymorphic primers produced DNA band ranged from 180 bp to 2000 bp (Figs 17-19).
The amplified fragments generated from the each amplified primer varied between seven
(OPA 09) and thirteen (OPA 03). OPA 03 amplified most of the samples tested whereas
OPA 08 and OPA 09 amplified 50% of samples.
Mopane 2 had a fragment of 1300 bp and 1500 bp when using primer 09. The fragments
of 500 and 600 bp were the most prevalent in all taxa except Lesliei hek 2 and Bauhinia
(Fig. 17). Primer 08 produced monomorphic bands of 600 bp and 280 bp in addition to
polymorphic bands (Fig. 18). Fragments of 1500 and 1300 bp differentiate Lesliei 4 from
the other ecotypes and Mopane. Mopane 3 was the only taxon which had a 180 bp band.
The 600 bp band was amplified in Laevigatum 4 (Fig. 18).
RAPD profile obtained from OPA 03 yielded several common bands and a few
polymorphic bands. The fragment of 700 bp was produced in all samples except
Bauhinia and Acuminata 4. Bauhinia was the only sample that produced 1500 and 690
bp fragments (Fig. 19). The 2000 bp fragments were present in Bauhinia and Lesliei 4
which clearly separates them from the other ecotypes and Mopane (Fig. 19).

47
Accordingly, all samples isolated from C. mopane (sensu lato) yielded several common
RAPD bands, and when the unique bands for each primer were considered, it was
observed that there were two distinct bands, namely 180 bp (OPA 08); 1900 (OPA 03).
Although the primers produced some polymorphic bands, there was not a single primer
that could clearly distinguish C. mopane (sensu lato). RAPD banding pattern when using
all the primers on C. mopane (sensu lato) is similar for most samples (Figs 17-19).
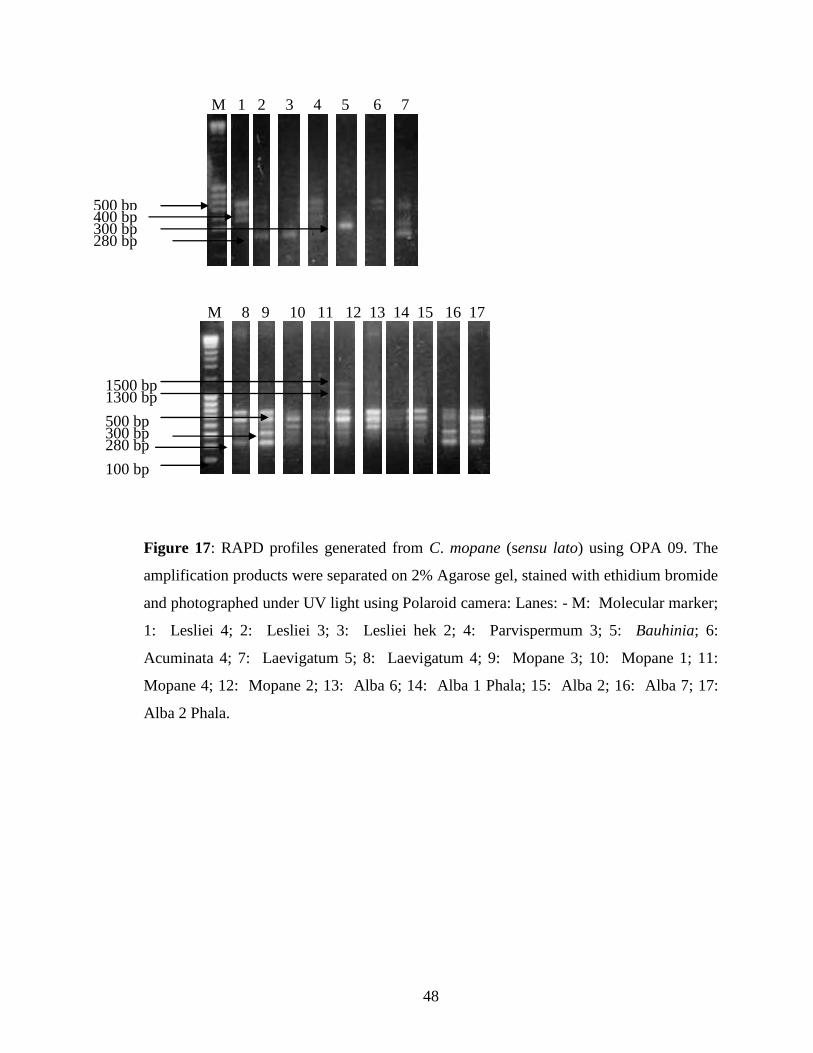
48
M 1 2 3 4 5 6 7
M 8 9 10 11 12 13 14 15 16 17
Figure 17: RAPD profiles generated from C. mopane (sensu lato) using OPA 09. The
amplification products were separated on 2% Agarose gel, stained with ethidium bromide
and photographed under UV light using Polaroid camera: Lanes: - M: Molecular marker;
1: Lesliei 4; 2: Lesliei 3; 3: Lesliei hek 2; 4: Parvispermum 3; 5: Bauhinia; 6:
Acuminata 4; 7: Laevigatum 5; 8: Laevigatum 4; 9: Mopane 3; 10: Mopane 1; 11:
Mopane 4; 12: Mopane 2; 13: Alba 6; 14: Alba 1 Phala; 15: Alba 2; 16: Alba 7; 17:
Alba 2 Phala.
280 bp
500 bp
1300 bp 1500 bp
280 bp
500 bp 300 bp
100 bp
400 bp 300 bp

49
M 1 2 3 4 5
M 6 7 8 9 10 11 12 13 14 15
M 16 17 18 19 20
Figure 18: RAPD profiles generated from C. mopane (sensu lato) using OPA 08. Lanes:
- M: Molecular marker; 1: Lesliei hek 2; 2: Parvispermum 1; 3: Acuminata 4; 4:
Acuminata 3; 5: Laevigatum 5; 6: Laevigatum 2; 7: Mopane 1; 8: Mopane 3; 9:
Mopane 2; 10: Alba 6; 11: Alba 2; 12: Alba 7; 13: Alba 2 Phala; 14: Alba 4; 15:
Alba; 16: Lesliei 4; 17: Lesliei 3; 18: Bauhinia; 19: Laevigatum 4; 20: Mopane 3.
180 bp
600 bp
280 bp
280 bp
600 bp
2000 bp 1500 bp 1300 bp
100 bp
600 bp

50
M 1 2 3 4 5 6 7 8 9 10 11
M 12 13 14 15 16 17 18 19 20 21 22 23
Figure 19: RAPD profiles generated from C. mopane (sensu lato) using OPA 03. The
amplification products were separated on 2% Agarose gel, stained with ethidium bromide
and photographed under UV light using Polaroid film: Lanes:- M: Molecular marker, 1:
Lesliei 4; 2: Lesliei 3; 3: Lesliei turn 2; 4: Lesliei hek 2; 5: Parvispermum 3; 6:
Parvispermum 1; 7: Bauhinia; 8: Acuminata 1; 9: Acuminata 4; 10: Acuminata 3; 11:
Laevigatum 5; 12: Laevigatum 4; 13: Mopane 3; 14: Mopane 4; 15: Mopane 3; 16:
Mopane 2; 17: Alba 6; 18: Alba 1 Phala; 19: Alba 2; 20: Alba 7; 21: Alba 2 Phala; 22:
Alba 4; 23: Alba 1.
700 bp
100 bp
2000 bp 1500 bp
700 bp
500 bp
1300 bp
300 bp
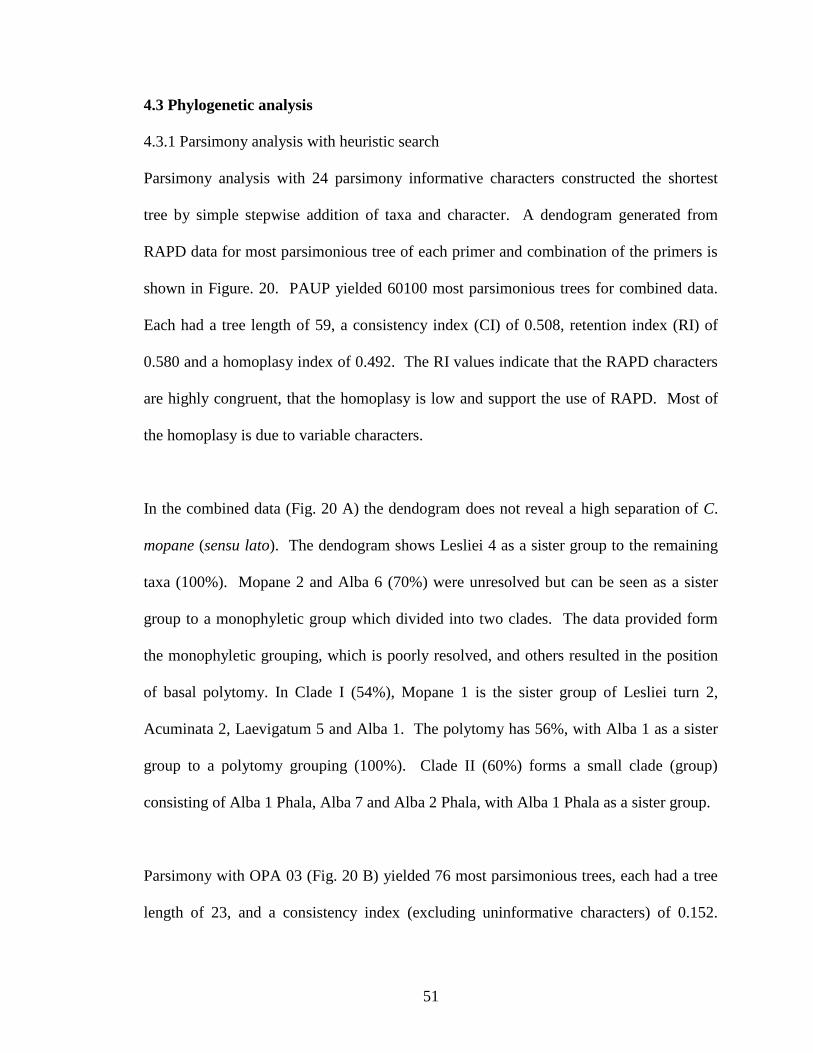
51
4.3 Phylogenetic analysis
4.3.1 Parsimony analysis with heuristic search
Parsimony analysis with 24 parsimony informative characters constructed the shortest
tree by simple stepwise addition of taxa and character. A dendogram generated from
RAPD data for most parsimonious tree of each primer and combination of the primers is
shown in Figure. 20. PAUP yielded 60100 most parsimonious trees for combined data.
Each had a tree length of 59, a consistency index (CI) of 0.508, retention index (RI) of
0.580 and a homoplasy index of 0.492. The RI values indicate that the RAPD characters
are highly congruent, that the homoplasy is low and support the use of RAPD. Most of
the homoplasy is due to variable characters.
In the combined data (Fig. 20 A) the dendogram does not reveal a high separation of C.
mopane (sensu lato). The dendogram shows Lesliei 4 as a sister group to the remaining
taxa (100%). Mopane 2 and Alba 6 (70%) were unresolved but can be seen as a sister
group to a monophyletic group which divided into two clades. The data provided form
the monophyletic grouping, which is poorly resolved, and others resulted in the position
of basal polytomy. In Clade I (54%), Mopane 1 is the sister group of Lesliei turn 2,
Acuminata 2, Laevigatum 5 and Alba 1. The polytomy has 56%, with Alba 1 as a sister
group to a polytomy grouping (100%). Clade II (60%) forms a small clade (group)
consisting of Alba 1 Phala, Alba 7 and Alba 2 Phala, with Alba 1 Phala as a sister group.
Parsimony with OPA 03 (Fig. 20 B) yielded 76 most parsimonious trees, each had a tree
length of 23, and a consistency index (excluding uninformative characters) of 0.152.
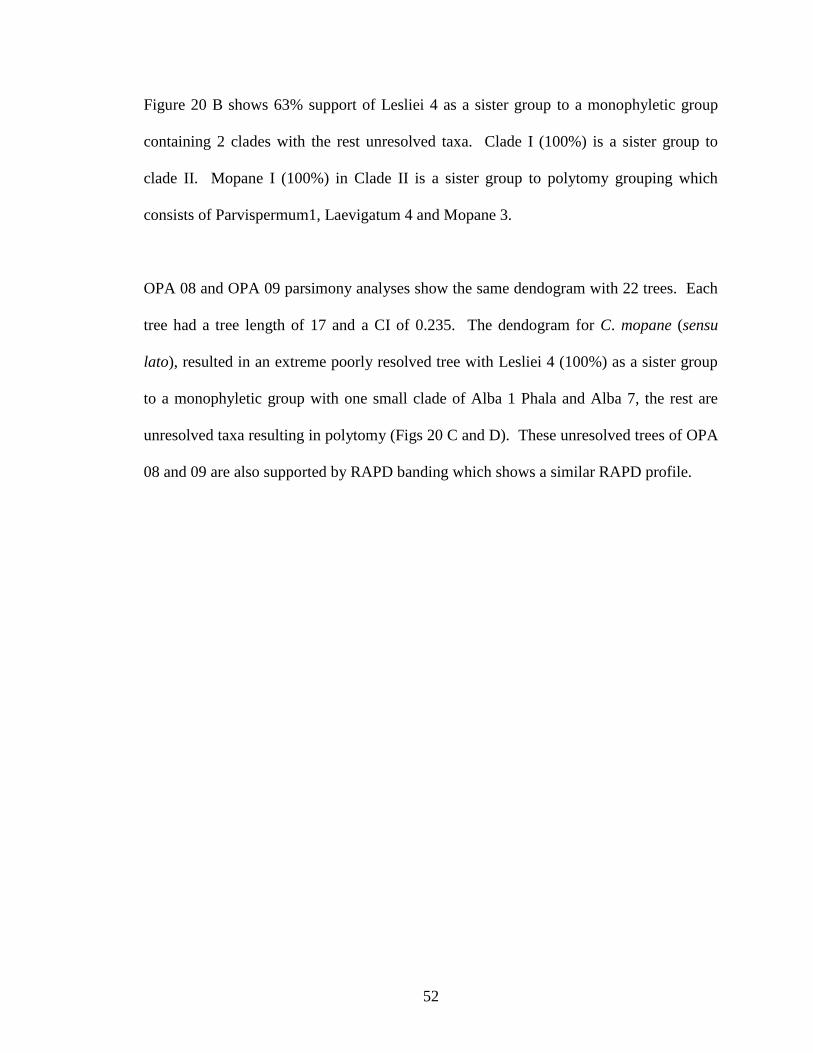
52
Figure 20 B shows 63% support of Lesliei 4 as a sister group to a monophyletic group
containing 2 clades with the rest unresolved taxa. Clade I (100%) is a sister group to
clade II. Mopane I (100%) in Clade II is a sister group to polytomy grouping which
consists of Parvispermum1, Laevigatum 4 and Mopane 3.
OPA 08 and OPA 09 parsimony analyses show the same dendogram with 22 trees. Each
tree had a tree length of 17 and a CI of 0.235. The dendogram for C. mopane (sensu
lato), resulted in an extreme poorly resolved tree with Lesliei 4 (100%) as a sister group
to a monophyletic group with one small clade of Alba 1 Phala and Alba 7, the rest are
unresolved taxa resulting in polytomy (Figs 20 C and D). These unresolved trees of OPA
08 and 09 are also supported by RAPD banding which shows a similar RAPD profile.
53
Figure 20 A: Dendogram obtained from RAPD data obtained for C. mopane (sensu lato)
by parsimony analysis of combined primers.
Bauhinia
Lesliei 4
Lesliei 3 Lesliei turn 2
Acuminata 2
Laevigatum 5
Alba 1
Mopane 1
Lesliei hek 2
Parvispermum 1
Parvispermum 3
Acuminata 4
Acuminata 3
Laevigatum 4
Mopane 3
Mopane 4
Alba 1 Phala
Alba 7
Alba 2 Phala
Alba 2
Alba 4
Laevigatum 2
Mopane 2
Alba 6
59
100
54
70
100
60 60 Clade II
(60)
Clade I
(54)
Subclade
I (59)
Subclade
I
Subclade
II (60)

54
Figure 20 B: Dendogram obtained from RAPD data for C. mopane (sensu lato) by
parsimony analysis of primer 03.
Bauhinia
Lesliei 4
Lesliei 3
Acuminata 2
Laevigatum 5
Lesliei hek 2
Parvispermum 1
Parvispermum 3
Acuminata 4
Acuminata 3
Laevigatum 4
Mopane 3
Mopane 4
Alba 1
Alba 7
Alba 2 Phala
Alba 2
Mopane 2
Alba 4
Alba 1 Phala
Mopane 1
Lesliei turn 2
63
100
100
100
100
Alba 6
Clade I
(100)
Subclade
II (100)
Subclade
I (100)
Clade II
(100)
55
Figure 20 C: Dendogram obtained from RAPD data obtained for C. mopane (sensu lato)
by parsimony analysis of primer 09. Numbers indicate the percentage values of a 50%
majority consensus tree.
Bauhinia
Lesliei 4
Acuminata 4
Laevigatum 5
Lesliei 3
Parvispermum 3
Parvispermum 3
Acuminata 4
Acuminata 3
Laevigatum 1
Mopane 3
Mopane 2
Alba 1
Alba 6
Alba 2 Phala
Laevigatum 4
Alba 4
Alba 7
Alba 1 Phala
Mopane 1
Lesliei hek 2
100
100 Clade I (100)

56
Figure 20 D: Dendogram obtained from RAPD data obtained for C. mopane (sensu lato)
by parsimony analysis of primer 08. Numbers indicate the percentage values of a 50%
majority consensus tree.
Bauhinia
Lesliei 4
Acuminata 4
Lesliei 3
Parvispermum 3
Parvispermum 3
Acuminata 4
Acuminata 3
Laevigatum 2
Mopane 3
Mopane 2
Alba 1
Alba 6
Alba 2 Phala
Alba 2
Alba 4
Alba 1 Phala
Mopane 1
Lesliei hek 2
100
100
Alba 7
Clade I
(100)

57
4.3.2 Bootstrapping using Parsimony tree
When the RAPD data was subjected to a bootstrap test, 5990 trees were produced (Fig.
21 A). Bootstrap analysis of the data set indicates a wide range of support values,
revealing strong support (> 70%) and weak support (<70%) for most nodes. A branch of
90% separates Alba 4 from the remaining taxa on the tree. A branch of 56% show
Lesliei 3 and Lesliei hek 2 poorly resolved which is a sister group to monophyletic group
that also form a three clades which further divides into subclades. Clade I (56%), the
position of Parvispermum 1, Mopane 3 and Laevigatum 4 were unresolved, at branch
81%. Mopane 1 was a sister group to the polytomy group of branch 87%. In clade II
(90%), Acuminata 4 was a sister group of Mopane 4. The three representatives of Alba
(Alba 1 Phala, Alba 7 and Alba 2 Phala) were grouped together at a branch 70%, with
Alba 1 Phala as a sister group to Alba 7 and Alba 2 Phala (77%). Figure 21 B shows one
small clade with a support of 61% and the remaining of the taxa poorly resolved and not
supported resulting in a basal polytomy.

58
Figure 21 A: Dendogram for RAPD data obtained for C. mopane (sensu lato) by
parsimony bootstrapping analysis of combined primers data. Numbers on each node
indicate the percentage values of a 50% majority consensus tree obtained from 100
bootstrap replicates.
Bauhinia Lesliei 4
Lesliei 3
Acuminata 2
Laevigatum 5
Lesliei hek 2
Parvispermum 1
Parvispermum 3
Acuminata 4
Acuminata 3
Laevigatum 4
Mopane 3
Mopane 4
Alba 1
Alba 7
Alba 2 Phala
Alba 2
Mopane 2
Alba 6
Alba 4
Alba 1 Phala
Mopane 1
Lesliei turn 2
Laevigatum 2
81
87
56
90
70
77
90
56
Subclade I
(87)
Subclade
II (81)
Clade II
(90)
Clade
III
(70)
Clade I
(56)
Subclade
II (77)
Subclade I
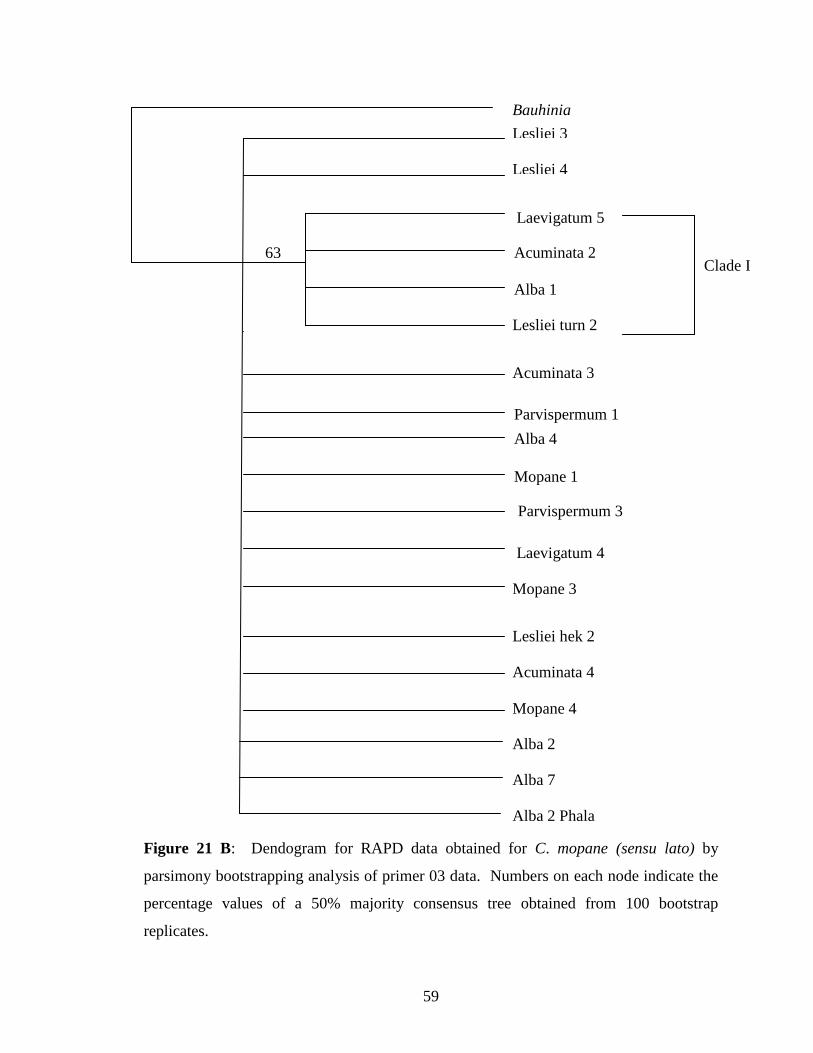
59
Figure 21 B: Dendogram for RAPD data obtained for C. mopane (sensu lato) by
parsimony bootstrapping analysis of primer 03 data. Numbers on each node indicate the
percentage values of a 50% majority consensus tree obtained from 100 bootstrap
replicates.
Bauhinia
Lesliei 4
Acuminata 2
Laevigatum 5
Lesliei hek 2
Parvispermum 1
Parvispermum 3
Acuminata 4
Acuminata 3
Laevigatum 4
Mopane 3
Mopane 4
Alba 1
Alba 7
Alba 2 Phala
Alba 2
Alba 4
Mopane 1
Lesliei turn 2
Lesliei 3
63 Clade I
60
4.3.3 Genetic similarity and differences
4.3.3.1 Total mean differences
RAPD binary data was converted into a total mean character difference matrix (Tables 5
A and B). The total mean character difference matrix was used to generate the Neighbour
Joining dendogram consisting of the combined data and OPA 03 (Fig. 22). The genetic
distance between 24 individuals of C. mopane (sensu lato) were calculated from the total
mean character difference values (Table 6A) and converted into percentages. The highest
intra ecotypic similarity (95.5%) was observed for Alba (Phalaborwa), while the lowest
intra ecotypic similarity (72.2 %) occurred in Lesliei (Table 6). For C. mopane (sensu
lato) a similarity percentage value of 84.1% was obtained.
Alba has a high (91.3%) genetic similarity with Parvispermum and a low (74.4%)
similarity with Lesliei (Table 7 A). Acuminata exhibit its highest (86.1%) genetic
similarity with Parvispermum and its lowest (76.1%) similarity with Lesliei (Table 7 B).
Lesliei show its highest (79.7%) genetic similarity with Parvispermum and its lowest
(64.9%) similarity with Mopane (Table 7 C). Colophospermum mopane (sensu stricto)
has an 86.5% genetic similarity with Parvispermum (its highest similarity to any other
ecotype) and a 64.9% genetic similarity with Lesliei (its lowest similarity to any other
ecotype) (Table 7 D). Laevigatum has its highest (90%) genetic similarity with
Parvispermum and its lowest (73.7%) similarity with Acuminata (Table 7 E).
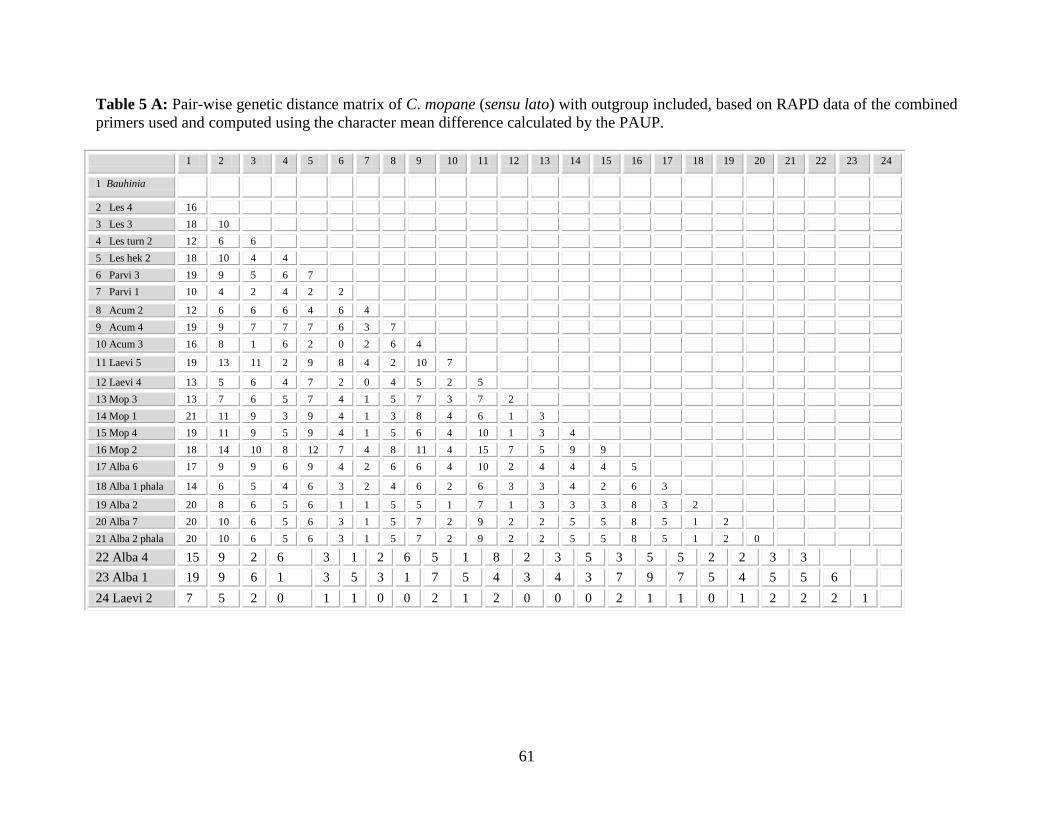
61
Table 5 A: Pair-wise genetic distance matrix of C. mopane (sensu lato) with outgroup included, based on RAPD data of the combined
primers used and computed using the character mean difference calculated by the PAUP.
1 2 3 4 5 6 7 8 9 10 11 12 13 14 15 16 17 18 19 20 21 22 23 24
1 Bauhinia
2 Les 4 16
3 Les 3 18 10
4 Les turn 2 12 6 6
5 Les hek 2 18 10 4 4
6 Parvi 3 19 9 5 6 7
7 Parvi 1 10 4 2 4 2 2
8 Acum 2 12 6 6 6 4 6 4
9 Acum 4 19 9 7 7 7 6 3 7
10 Acum 3 16 8 1 6 2 0 2 6 4
11 Laevi 5 19 13 11 2 9 8 4 2 10 7
12 Laevi 4 13 5 6 4 7 2 0 4 5 2 5
13 Mop 3 13 7 6 5 7 4 1 5 7 3 7 2
14 Mop 1 21 11 9 3 9 4 1 3 8 4 6 1 3
15 Mop 4 19 11 9 5 9 4 1 5 6 4 10 1 3 4
16 Mop 2 18 14 10 8 12 7 4 8 11 4 15 7 5 9 9
17 Alba 6 17 9 9 6 9 4 2 6 6 4 10 2 4 4 4 5
18 Alba 1 phala 14 6 5 4 6 3 2 4 6 2 6 3 3 4 2 6 3
19 Alba 2 20 8 6 5 6 1 1 5 5 1 7 1 3 3 3 8 3 2
20 Alba 7 20 10 6 5 6 3 1 5 7 2 9 2 2 5 5 8 5 1 2
21 Alba 2 phala 20 10 6 5 6 3 1 5 7 2 9 2 2 5 5 8 5 1 2 0
22 Alba 4 15 9 2 6 3 1 2 6 5 1 8 2 3 5 3 5 5 2 2 3 3
23 Alba 1 19 9 6 1 3 5 3 1 7 5 4 3 4 3 7 9 7 5 4 5 5 6
24 Laevi 2 7 5 2 0 1 1 0 0 2 1 2 0 0 0 2 1 1 0 1 2 2 2 1
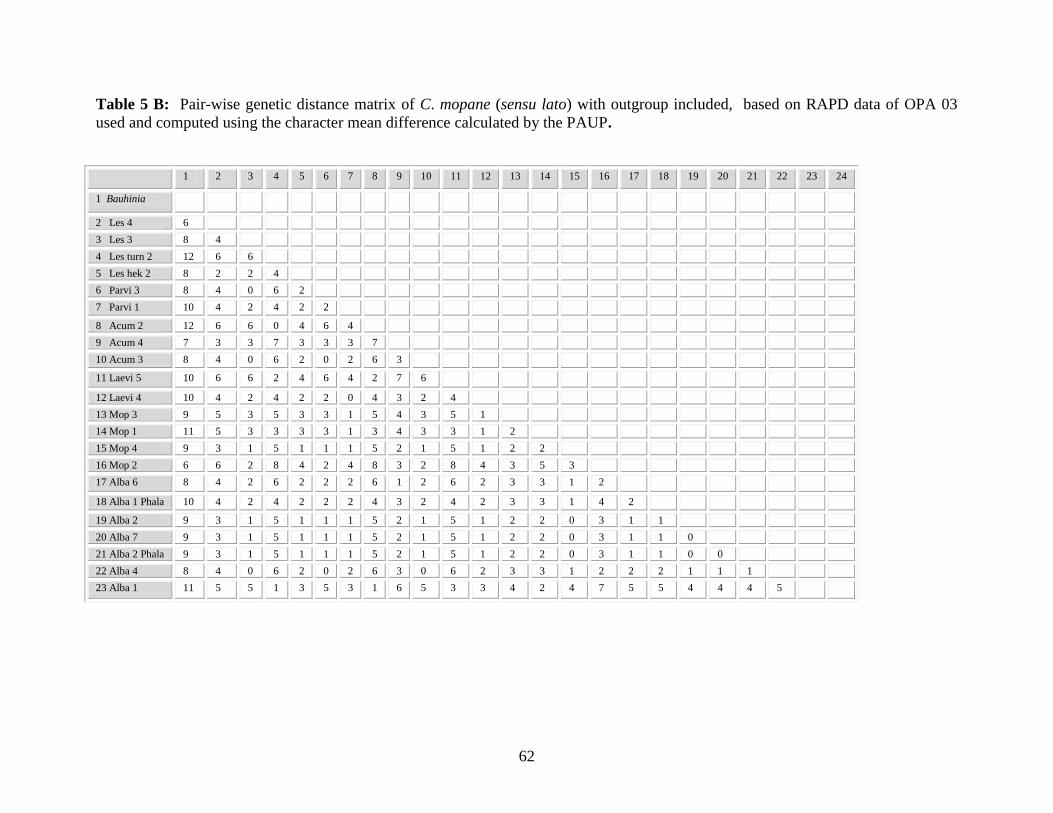
62
Table 5 B: Pair-wise genetic distance matrix of C. mopane (sensu lato) with outgroup included, based on RAPD data of OPA 03
used and computed using the character mean difference calculated by the PAUP.
1 2 3 4 5 6 7 8 9 10 11 12 13 14 15 16 17 18 19 20 21 22 23 24
1 Bauhinia
2 Les 4 6
3 Les 3 8 4
4 Les turn 2 12 6 6
5 Les hek 2 8 2 2 4
6 Parvi 3 8 4 0 6 2
7 Parvi 1 10 4 2 4 2 2
8 Acum 2 12 6 6 0 4 6 4
9 Acum 4 7 3 3 7 3 3 3 7
10 Acum 3 8 4 0 6 2 0 2 6 3
11 Laevi 5 10 6 6 2 4 6 4 2 7 6
12 Laevi 4 10 4 2 4 2 2 0 4 3 2 4
13 Mop 3 9 5 3 5 3 3 1 5 4 3 5 1
14 Mop 1 11 5 3 3 3 3 1 3 4 3 3 1 2
15 Mop 4 9 3 1 5 1 1 1 5 2 1 5 1 2 2
16 Mop 2 6 6 2 8 4 2 4 8 3 2 8 4 3 5 3
17 Alba 6 8 4 2 6 2 2 2 6 1 2 6 2 3 3 1 2
18 Alba 1 Phala 10 4 2 4 2 2 2 4 3 2 4 2 3 3 1 4 2
19 Alba 2 9 3 1 5 1 1 1 5 2 1 5 1 2 2 0 3 1 1
20 Alba 7 9 3 1 5 1 1 1 5 2 1 5 1 2 2 0 3 1 1 0
21 Alba 2 Phala 9 3 1 5 1 1 1 5 2 1 5 1 2 2 0 3 1 1 0 0
22 Alba 4 8 4 0 6 2 0 2 6 3 0 6 2 3 3 1 2 2 2 1 1 1
23 Alba 1 11 5 5 1 3 5 3 1 6 5 3 3 4 2 4 7 5 5 4 4 4 5

63
Table 6: Intra ecotypic similarity.
Ecotype Similarity percentage
Alba (Phalaborwa)* 95.5%
Parvispermum* 91.7%
Laevigatum 90.3%
Alba (Phalaborwa and Musina) 85.9%
Mopane (sensu stricto) 77.1%
Acuminata 76.4%
Lesliei 72.2% *Note: These values are based on only two individuals each. For other values see Materials and Methods, section
3.2.1.
Table 7 A: Inter ecotypic percentage difference and similarity: Alba.
Alba vs: Difference Similarity
Lesliei 25.6 74.4
Laevigatum 20.0 80.0
Mopane (sensu stricto) 19.1 80.9
Acuminata 18.2 81.8
Parvispermum 8.7 91.3
Table 7 B: Inter ecotypic percentage difference and similarity: Acuminata.
Acuminata vs: Difference Similarity
Lesliei 23.9 76.1
Mopane (sensu stricto) 23.6 76.4
Alba 18.2 81.8
Laevigatum 15.2 84.8
Parvispermum 13.9 86.1
Table 7 C: Inter ecotypic percentage difference and similarity: Lesliei.
Lesliei vs: Difference Similarity
Mopane (sensu stricto) 32.1 64.9
Alba 25.6 74.4
Acuminata 23.9 76.1
Laevigatum 22.5 77.5
Parvispermum 20.3 79.7
Table 7 D: Inter ecotypic percentage difference and similarity: C. mopane (sensu stricto).
C. mopane (sensu stricto) vs: Difference Similarity
Lesliei 32.1 64.9
Acuminata 23.6 76.4
Alba 19.1 80.9
Laevigatum 18.0 82.0
Parvispermum 13.5 86.5

64
Table 7 E: Inter ecotypic percentage difference and similarity: Laevigatum.
Laevigatum vs: Difference Similarity
Acuminata 26.3 73.7
Lesliei 22.5 77.5
Alba 20.0 80.0
Mopane (sensu stricto) 18.0 82.0
Parvispermum 10.0 90.0
4.3.3.2 Neighbour Joining
Laevigatum 2 was the sister group to all other taxa, making Lesliei 4 a sister group to the
remaining taxa except Laevigatum 2. Parvispermum was also a sister group to remaining taxa
except for Laevigatum 2 and Lesliei 4. Acuminata 2 was a sister group to a monophyletic group,
that clustered into three large clades which further divided into subclades. Clade I was a sister
group to Clade II and clade III and vice versa. Subclade I was a sister group to subclade II, with
subclade III a sister group to subclade IV (Fig. 22 A)
Lesliei 4 was a sister group to all other taxa, with Acuminata 4 a sister group to the remaining
taxa. Mopane 2 was a sister group to all other taxa, except Acuminata 4 and Lesliei 4. Mopane 2
was a sister group to a monophyletic group that divided into two clades and three subclades.
However, the remaining taxa of subclade II are unresolved. Clade I was a sister group to clade II
and III. Clade II is divided into three subclades (Fig. 22 B).

65
Figure 22 A: Dendogram for RAPD data obtained for C. mopane (sensu lato) by Neighbour
Joining trees of combined primers based on the total character difference matrix. The branch
length indicates relative similarity and difference of the taxa, the closer the cluster, the more
similarity.
Bauhinia
Lesliei 4
Lesliei 3
Lesliei turn 2
Acuminata 2
Laevigatum 5
Alba 2
Mopane 1
Lesliei hek 2
Parvispermum 1
Parvispermum 3
Acuminata 3
Acuminata 4
Mopane 3
Mopane 2
Alba 6
Alba 1 Phala
Alba 4
Alba 2 Phala
Alba 7
Alba 1
Laevigatum 2
Mopane 4
Laevigatum 4
Clade
I
Clade II
Subclade
I
Subclade
II
Clade
III
Subclade
IV
Subclade
III

66
Figure 22 B: Dendogram for RAPD data obtained for C. mopane (sensu lato) by Neighbour
Joining trees of OPA 03 based on the total character difference matrix. The branch length
indicates relative similarity and difference of the taxa. The closer the cluster, the more similarity.
Bauhinia
Lesliei 4
Acuminata
3
Mopane 1
Acuminata 4
Mopane 4
Alba 4
Alba 7
Alba 2 Phala
Alba 2
Mopane 2
Alba 6
Alba 1
Phala
Parvispermum 3
Lesliei 3
Lesliei turn 2
Acuminata 2
Alba 1
Laevigatum 4
Parvispermum 1
Laevigatum 4
Mopane 3
Lesliei hek 2
Clade I
C
l
a
d
e
I
Subclade
III
S
u
b
c
l
a
d
e
I
Subclade II
67
CHAPTER 5
DISCUSSION
5.1 DNA extraction method and removal of contaminants
Extracting genomic DNA from mature leaves of C. mopane (sensu lato) presented a number of
difficulties, due to high levels of polysaccharides and phenolics, which interfered with DNA
isolation. A previous study, by Legodi and Mahlo (2003) using DNA extraction method
described by Edwards et al. (1991), showed the presence of polyphenolics in DNA samples. In
an attempt to genotype the present study of C. mopane (sensu lato), a few published nuclear
isolation protocols (Murray and Thompson 1980; Dellaporta et al., 1983; Doyle and Doyle 1990;
Rogers and Benedich 1994) were investigated for the isolation of pure, PCR-ready DNA from
the leaves. The CTAB method by Doyle and Doyle 1990 was found to be the most appropriate.
This method is known to avoid the problem of DNA degradation, contamination and low yield
due to binding or co-precipitation with starches and polysaccharides from both young seedlings
and mature leaves (Sharma et al., 2002). However, for C. mopane (sensu lato), the DNA
extracted with the CTAB method was of low yield, quality and viscous, possibly due to the
presence of polysaccharides.
It was found that the DNA yield from young seedling leaves was higher than from mature
leaves. This is because using young seedlings reduce nucleic acid plant metabolites that
interfere with the solubility of precipitated DNA as compared to mature leaves (Scott and
Playford 1996). However, notable amounts of polysaccharides were still present.

68
Polysaccharides are visually evident in DNA extracted by their viscous, glue-like texture,
making the DNA unmanageable during pipetting. Polysaccharides are also known to affect
manipulation and inhibit enzyme reactions (Schlink and Reski 2002). Fang et al. (1992) found
that more than 1 M of NaCl can facilitate the removal of polysaccharides, using its solubility in
ethanol, thereby preventing co-precipitation with DNA. Sodium chloride at a concentration of
more than 0.5 M together with CTAB is also known to remove polysaccharides (Paterson et
al., 1993). The concentration of NaCl ranges mentioned in the literature varies between 0.7 M
(Clark 1997) and 6 M (Aljanabi et al., 1999). NaCl can be replaced by KCl (Thompson and
Henry 1995).
It is assumed that using a higher concentration of NaCl (5 M) can result in a more efficient
removal of polysaccharides in plant leaves, but the removal of polysaccharides in mature and
seedling leaves of C. mopane (sensu lato) did not improve. Extraction of high quality DNA from
plants with high phenol and polysaccharides levels such as apples, grapes, pears and conifers
species are known to be difficult. This is because there is no described extraction method for
obtaining large quantities of high quality of DNA from plants with a high phenolic and
polysaccharide content (Kim et al., 1997; Porebski et al., 1997). However, a modification of the
various different extraction methods could conceivably solve this problem. For this study phenol
precipitation and water-saturated ether steps was introduced to the extraction procedure to reduce
the levels of polysaccharides in the DNA extracted samples. These steps ultimately solved the
problem of polysaccharide contamination in the DNA extracted sample.

69
5.2 Optimisation of PCR conditions
The amplification profile for nucleotide primers are largely dependent on specific conditions of
reactions, with banding patterns varying extensively due to inconsistencies in a number of
reaction parameters (Williams et al., 1993). A necessary precondition for any RAPD analysis is
the establishment of PCR conditions that ensure reliable and reproducible results (Ramser et al.,
1996). This refers mainly to the choice of appropriate MgCl2 concentrations, which differ among
primers and plant species (Bousquet et al., 1990), Taq polymerase units (Barcaccia 1994),
reproducible primers and the correct cycles (Carlson et al., 1991).
To obtain good results for each primer, MgCl2 concentration were chosen from the results where
the bands were clear, easy to read and suitable for data analysis. The MgCl2 concentration used
in this study (4mM) was higher than 1.5 mM and 2.0 mM used by authors such as Claros et al.,
(2000) and Kafkas (2002). Choosing the appropriate MgCl2 concentrations minimized errors
caused by Taq polymerase in the PCR. However, amplicons from a too high concentration of
MgCl2 may appear as streaks. This results from fragments of DNA with differences in length
which are too small to permit their separations during electrophoresis. In this investigation, this
phenomenon has been observed with OPA 13 where the resulting bands were not easily scorable
using 4 mM MgCl2. According to Bousquet et al. (1990), a too low concentration of MgCl2 (1.0
mM to 1.5 mM) may result in absence of amplification in the gel.
70
Other problems that can be associated with RAPD markers include the appearance and
disappearance of minor bands with different runs and variability between thermocycler and Taq
polymerase obtained from different manufactures (Ellsworth et al., 1993). This has been shown
with OPA 02, which did not give consistent amplification during optimization.
Variation in fragment intensity and number are also problematic with RAPD analyses. The
variation in intensity of some fragments observed in OPA 03 with 10 M and 20 M
concentrations of primer might be due to a more efficient amplification at some target sites, or to
a greater complementary action between the primer and the DNA. Variation in fragments
intensity and number of fragments produced with 10 m of primer concentration could be due to
a low amount of primer concentration, which becomes limiting and results in few amplification
products. Variation of fragments may appear in keeping with target sites present at highly
repetitive sequences (Tyler et al., 1997).
5.3 Genetic relatedness
The dendograms were constructed using the PAUP program with combined and individual data
using parsimony and Neighbour Joining analysis. Combination of primer data normally results
in finding the most parsimonious tree, enhancing the resolution, and increasing the internal
support for clades (Olmstead and Sweere 1994). Combining of data sets also increases the rate
of resolution among species (Soltis et al., 1998). Conflict between individual data sets indicates
that there are evolutionary processes that results in different patterns of relationships (Wiens
1998).
71
Nei (1991) has shown Neighbour Joining as the most efficient method in establishing the correct
topology as proposed by Saitou and Nei (1987). Distance methods are less stringent than
parsimony methods, but have the advantage of being less demanding computationally
for the
analysis of large data sets (Dagenbach and Endow 2004). The Neighbour Joining trees (Figs 22
A and B) showed the same two clades, as the maximum parsimony trees, but some
groups
include ecotypes that were previously not classified as members of the same group. For
example, Mopane 4 and Laevigatum 4 did not fall into one group in the parsimony (Fig. 20 A),
but was included in the group in the Neighbour Joining trees. However, the parsimony trees
were not as well resolved as compared to Neighbour Joining trees. Therefore, the discussion will
focus mainly on the parsimony data as this is considered as the most representative of the
evolutionary relationships, and the best estimate of phylogeny of C. mopane (sensu lato). The
other parsimony dendogram trees were used as additional information (Figs 20B-D).
Bootstrapping of parsimony trees (Figs 21A and B) was done as support of the data set for the
clades of each node on the parsimony analysis tree is necessary, to determine if the phylogenetic
relationship within and between ecotypes is supported from (100-1000) bootstrap replicates. The
higher the bootstrap value the more likely the relationship in the parsimony tree is true.
Conversely, low bootstrap values suggest less confidence in the various relationships. Bootstrap
values of 70-100% are generally considered to be highly supportive of the designated clades, as
opposed to values of 50-69% that shows weak support.
72
The combined primer data (Fig. 21 A) shows unexpected high support (90%) for C. mopane
(sensu lato) to be monophyletic. Lesliei 4 is shown to be a sister group to the monophyletic
group. The topology of the dendogram in the first and second clades in Figure 21A was
unexpected, as those ecotypes are morphologically different. Individuals of the same ecotypes
are expected to cluster together because of their similar genetic make-up. A possible reason for
first and second clades in Figure 21A might be that some of the ecotypes, thought to be different,
were in fact not.
The remaining individuals in Figure 21A also show no support and collapse in basal polytomy.
Trees that have polytomy are poorly resolved, indicating uncertainties or lack of resolution. A
polytomy in a dendogram indicates that all taxa connected to that node have the same degree of
similarity. Figure 21A did not clearly show the relationships of the ecotypes with one another.
More studies should be done on these ecotypes in order to classify them (see recommendation
for future research, section 5.7).
5.4 Genetically differentiated species
Genetic species is a group of genetically compatible interbreeding natural populations that is
genetically isolated from other such groups. The focus on genetic isolation rather than
reproductive isolation distinguishes the Genetic Species Concept from the Biological Species
Concept (Baker and Bradley 2006). Morsolais et al. (1993) suggest that for a species to be
similar, the genetic similarity should range between 61 to 99% (same entity).

73
5.5 Comparison of RAPD data with morphological characteristics
5.5.1 Intra ecotypic variation
5.5.1.1 Lesliei
Lesliei shows the lowest genetic similarity (72.2%) between its four sampled trees of all the
ecotypes. This similarity value is very close to the similarity value of 74.15% obtained by
Potgieter (2006), based on 40 characters derived from the leaves, seeds, fruits, flower and pollen
from five Lesliei trees. Thus it would seem that the genetics of this ecotype strongly supports the
morphology exhibited in the field. A possible reason for this close correlation between the
genetics and morphology might be that Lesliei is a very coherent group or taxon that could
eventually lead it to speciation.
5.5.1.2 Alba
Alba shows a very high (85.5%) genetic similarity between its seven sampled trees. This
similarity value is, however, not close to the similarity value of 53.25% obtained by Potgieter
(2006), based on 40 characters derived from the leaves, seeds, fruits, flower and pollen from five
trees. This shows that the genetics of Alba do not strongly support the morphologically
differences exhibited in the field. A possible reason might be that the phenotypes are governed
by a relatively small number of genes which were not detected by RAPD analyses, due to the use
of random sampling of genes.
5.5.1.3 Laevigatum and Parvispermum
Laevigatum and Parvispermum exhibit very high (90.3% and 91.7%, respectively) genetic
similarity between the sampled trees. These high similarities should, however, be viewed with
74
caution as it was derived from only three trees in the case of Laevigatum and two tree in the case
of Parvispermum. Although no morphological similarity value is available for these ecotypes, it
is postulated that the genetics will strongly support the morphology exhibited in the field. To
this end it is recommended that a full morphological investigation be conducted on these two
ecotypes.
5.5.1.4 Acuminata
Acuminata show high (76.4%) genetic similarity between the three sampled trees. This
similarity value lies fairly close to the 66% similarity value obtained by Potgieter (2006), based
on five trees. This means that the genetics partially support the morphology of this ecotype.
5.5.1.5 Mopane (sensu stricto)
Mopane (sensu stricto) has a fairly high genetic similarity value of 77.1%. This genetic value do
not support the morphological similarity value of 55.8% obtained by Potgieter (2006), based on
five trees. This might be indicative that the taxon is not a coherent entity and as such could lend
itself to ecotypic speciation. Thus, it would seem that Mopane (sensu stricto) can change
morphologically and remain unchanged genetically.
75
5.5.2 Inter ecotypic relationship
5.5.2.1 Acuminata
Acuminata vs Mopane (sensu stricto) (parental material)
Potgieter (2006) found a very low correlation (35% difference, 65% similarity) between
Acuminata and Mopane (sensu stricto), based on the morphology. This low correlation is
corroborated by the genetics, where a difference of 23.6% was found (Table 7B). Thus the
genetics and morphology indicate a fairly high similarity between Acuminata and Mopane (sensu
stricto). This would imply that Acuminata has not genetically drifted far from the parental
material.
Acuminata vs Lesliei
The most distant relative (lowest similarity) of Acuminata was found to be Lesliei. Potgieter
(2006) found a 50.0% difference/similarity between Acuminata and Lesliei, based on the
morphology of the fruit, seed, leaves and pollen. This morphological difference does not agree
to a large extent with the genetics, where a 23.9% difference was obtained (Table 7B) between
Acuminata and Lesliei. This indicates that a closer genetic relationship (i.e. a higher similarity),
in terms of the genetics, exists between Acuminata and Lesliei than is the case for their
morphology.
Smith and Smith (1989) suggest that the use of phenotypic traits is not always the best way to
evaluate genetic distance. This is because of the degree of divergences between genotype at the
phenotypic level is not necessarily correlated with a similar degree of genetic differences.
76
Molecular markers provide better coverage of the genome, resulting in a better determination of
relationships (Hamrick and Godt 1989).
The discrepancies between RAPD and morphological data have been reported in various taxa
such as Eriastrum densifolium (Brunell and Whitkus 1997), Fragaria species. (Harrison et al.,
1997), Hordeum vulgare (Papa et al., 1998), Rhenum species (Persson et al., 2000), Anacardium
occidentale (Samal et al., 2003), and Alpinia species (Saritnum and Sriuamsiri 2003).
Acuminata vs Parvispermum
The lowest genetic difference (13.9%) was found between Acuminata and Parvispermum (Table
7B). This high correlation indicates that Acuminata has not genetically diverged far from
Parvispermum. This was not expected since these two taxa grow in different habitats.
Acuminata is usually found on the banks of non permanent streams, in sandy soils. In contrast,
Parvispermum is found far from water bodies on calcareous soils. It would therefore seem that
this close relationship between Acuminata and Parvispermum is not the result of habitat, but an
inherent genetic condition. A low diversity could exist in terms of the available alleles which
would lead to a situation where the lack of enough alleles would lead to a potential lack of
expression. Potgieter (2006) did not include Parvispermum in his study, and as such no
correlation can be drawn between the genetics and the morphology of these two ecotypes.

77
5.5.2.2 Alba
Alba vs Mopane (sensu stricto) (parental material)
Potgieter (2006) found a high difference (55.0%) between Alba and Mopane, based on the
morphology. This high difference is not supported by the genetics, where it was found to have a
difference of only 19.1% (Table 7A). Thus the genetics does not support morphology, indicating
a fairly genetic high similarity between Alba and Mopane. This would imply that Alba has not
genetically drifted far from the parental material. A possible reason for this could be that the two
entities grow in the same environmental parameters.
Alba vs Lesliei (highest)
Based on the morphology, Potgieter (2006) found a high difference (77.5% difference) between
Alba and Lesliei. This high morphological difference is not in agreement with the genetical
difference of 25.6% (Table 7A). Thus the genetics indicate a fairly high similarity between Alba
and Lesliei. This would mean that Alba is isolated from Lesliei, but the distance is not far.
Alba vs Parvispermum
The lowest genetic difference (13.9%, 86.1% similarity) was found between Alba and
Parvispermum (Table 7A). This low difference indicates that Alba has not genetically diverged
far from Parvispermum. This is unexpected since these two taxa have different fruit size and
colour. Alba has whitish brown fruits and a small mean weight of 0.4g, as opposed to
Parvispermum having a brown fruit and a mean weight of 0.5g. In addition, Alba is generally
found on sandy soils as opposed to the calcareous soils on which Parvispermum is found. This
78
dichotomy has been illustrated in two Acer species (saccharum and nigrum) that were very
distinctive morphologically and genetically not isolated (Skepner and Krane 1998).
Potgieter (2006) did not include Parvispermum in his study, and as such no correlation can be
drawn between the genetics and the morphology of these two ecotypes.
5.5.2.3 Lesliei
Lesliei vs Mopane (sensu stricto) (parental material)
Potgieter (2006) found a high (62.16%) difference (37.84 % similarity) between Lesliei and
Mopane (sensu stricto), based on the morphology. This high difference does not compare very
well with genetics, where these two entities were found to have a difference of 32.1% (Table
7C). This indicates that a closer relationship, in terms of the genetics, exists between Lesliei and
Mopane (sensu stricto) than is the case for their morphology. See Smith and Smith (1989)
explaination in Acuminata vs Lesliei for the discussion on the difference between morphology
and genetics.
Lesliei vs Mopane
Lesliei also shows the highest difference (32.1%) with Mopane, compared to all the other
ecotypes (Table 7A-7E). See paragraph above for discussion on the relationship between Lesliei
and Mopane (sensu stricto).

79
Lesliei vs Parvispermum
The lowest genetic difference (13.9%) was found between Lesliei and Parvispermum (Table 7C).
This low correlation indicates that Lesliei has not genetically diverged far from Parvispermum.
This is unusual since these two taxa do not occur in the same habitat. Lesliei is generally found
along the banks or short distances away from non-permanent streams and rivers, as opposed to
Parvispermum which is found in dry habitats. In addition, Lesliei is generally found on sandy
soils as opposed to the calcareous soils on which Parvispermum is found. It would therefore
seem that this close relationship between Lesliei and Parvispermum is not the result of habitat,
but an inherent genetic condition.
5.5.2.4 Laevigatum
Laevigatum vs Mopane (sensu stricto) (parental material)
The data shows that Laevigatum has a low (18.0%) genetic difference with Mopane (Table 7E).
Thus indicate that Laevigatum has not genetically drifted from Mopane. Potgieter (2006) did not
investigate these ecotypes, and therefore no comparison can be drawn between the genetics and
the morphology of these ecotypes.
Laevigatum vs Acuminata
Laevigatum reveals its highest (26.3%) genetic difference with Acuminata (Table 7E).
However, this difference genetically indicates that Acuminata has not diverged far from
Laevigatum.
80
Laevigatum vs Parvispermum
Laevigatum shows its lowest (10.0%) genetic difference with Parvispermum (Table 7E).
However, this difference genetically indicates that Parvispermum has not diverged far from
Laevigatum. This indicates that the genetics support the morphological characters exhibited in
the field, as these two taxa do not differ morphologically very much, except the smooth bark
texture of Laevigatum, and the rough texture of Parvispermum.
5.5.2.5 Parvispermum
Parvispermum vs Mopane (sensu stricto) (parental material)
Parvispermum reveals low (13.5%) genetic difference with Mopane (Table 7A). Genetically,
thus indicate that Parvispermum has not genetically drifted far from the parental material.
5.6 Taxonomic recommendation
It is well documented from the study of Potgieter (2006) that C. mopane (sensu lato) exhibits a
mosaic of variation. Within this mosaic of variation some entities exist with unique characters -
the ecotypes. Potgieter (2006) therefore postulates that value exists to recognize C. mopane
(sensu lato) as a taxonomical complex that can and should be subdivided into subunits (e.g.,
subspecies, varieties etc.).
According to Potgieter (2006), Acuminata (7 trees) has the highest intra ecotypic variation of
Alba and Lesliei and Mopane (sensu stricto) in terms of the 40 investigated morphological
characters and the lowest mean separation (48%) from Alba and Lesliei and Mopane (sensu
stricto). In view of the proposed “statistical classification” by Potgieter (2006), it is clear that the

81
statistical data assign Acuminata to the rank of variety.
Potgieter (2006) state that Alba and Lesliei show high levels of morphological separation, with
means of 64% and 63%, respectively, from the other types (Alba vs Acuminata, Lesliei and
Mopane – sensu stricto; Lesliei vs Acuminata, Lesliei and mopane – sensu stricto). Potgieter
(2006) thus recommend that these two types (Alba and Lesliei) be formally recognized as
subspecies. The wide geographical range of Alba (from the Musina area to the Phalaborwa area)
is indicative that this type is more than a local variant occurring in and around the Musina area
where it was first noticed (Potgieter 2006). Lesliei has not been reported from outside the
Messina Experimental Farm. However, this does not mean that it is just a local variant as this
type is not easily spotted among the cluster of C. mopane (sensu lato). This type may be more
widespread than is currently known, an aspect that needs investigation before a formal
classification can commence (Potgieter 2006).
More studies should be done on the ecotypes as they are not genetically isolated. No formal
classification based on the genetics of Alba, Acuminata, Lesliei, Laevigatum and Parvispermum
can be proposed. A possible reason for the perceived close relationship between Mopane (sensu
stricto) and the other ecotypes, as well as between the various ecotypes is that the primers used
highlighted similarities more than differences. It is thus proposed that future studies use primers
that showcase differences.

82
5.7 Conclusions
The overall results of C. mopane (sensu lato) show high (84.1%) genetic similarity. No ecotypic
marker was obtained. Most of the ecotypes have not diverged genetically far from one another
or from the parental material (Mopane (sensu stricto). The genetic results partially support the
perceived morphological differences. In this study the RAPD technique has established its value
as an additional tool to express the genetic variability in C. mopane (sensu lato). No formal
classification can be drawn from the genetic results since the ecotypes did not genetically diverge
far from each other. More studies should be done on the ecotypes.
5.8 Recommendations for future research
a. Higher yields of DNA were obtained from seedlings as opposed to mature leaves and it is
recommended for future work that young plants should be used when DNA from C.
mopane (sensu lato) is required.
b. Overall, the ecotypes show high similarity from each other and from Mopane (sensu
stricto) and a formal classification of the ecotypes cannot be done as the results are not
conclusive. Therefore, the following recommendations:
An additional RAPD marker which would probably be enough to permit a more
precise way to differentiate the ecotypes by using more primers.
Further extensively studies are needed to determine if more sensitive methods like
AFLP and RFLP can be used to study the genetic diversity and genetic
relationship of C. mopane (sensu lato).

83
c. In terms of taxonomy of C. mopane (sensu lato), it is suggested that:
Both phenotypic and DNA analyses be used. This will also establish an
identification key of C. mopane and its ecotypes.
Finally, more research is necessary to determine the genetic differentiation of
C. mopane (sensu stricto) from populations in countries neighbouring South
Africa where this species occur. This includes enlargement of the number of
markers used by other molecular techniques in order to have a deeper insight
into molecular polymorphisms.
84
CHAPTER 6
REFERENCES
Achenbach, L.A., Patric, J., Gray, L., 1996. Use of RAPD marker as a diagnostic tool for identification of
Fusarium solani isolates that cause soybean sudden death syndrome. Plant Disease 80, 1228 –
1232.
Adams, R.P., Demeke, T., 1993. Systematic relationships in Juniperus based on Random Amplified
Polymorphic DNAs (RAPDs). Taxon 42, 553 – 571.
Adams, R.P., Turyspekov, Y., 1998. Taxonomic reassessment of some Central Asian and Himalayan
scale-leaved taxa of Juniperus (Cupressaceae) supported by Random Amplified Polymorphic
DNA. Taxon 47, 75 – 84.
Aljanabi, S.M., Forget L., Dookun, A., 1999. An improved rapid protocol for the isolation of
polysaccharides and polyphenol-free sugarcane DNA. Plant Molecular Biology Reporter 17, 1–
8.
Avise, J.C., 1994. Molecular markers, Natural History and Evolution. Chapman & Hall, New York, USA.
511 pp.
Baker, R. J., Bradley, R.D., 2006. Speciation in mammals and the genetic species concept. Journal of
Mammalogy 87(4), 643 – 662.
Barcaccia, G., 1994. Development - comparability and potential applications of RAPD [Random
Amplified Polymorphic DNAs] markers in the genus Medicago. Journal of Genetics and
Breeding 48, 161– 168.
Bentham, G., 1865. Leguminosae. In: Bentham, G., Hooker, F. (Eds). Genera Plantarum 1, 434 – 600.
85
Bousquet, J., Simon, L., Lalonde, M., 1990. DNA amplification from vegetative and sexual tissues of
trees using Polymerase Chain Reaction. Canadian Journal of Forest Research 20, 254 – 257.
Bouvet, J.M., Fontaine, C., Sanou, H., Cardi, C., 2004. An analysis of the pattern of genetic variation in
Vitellaria paradoxa using RAPD markers. Agroforestry Systems 60, 61 – 69.
Brenna, W., 2004. DNA fingerprinting of Potato varieties. Science Foundary 2, 1– 7.
Breteler, F., Ferguson, I., Gasson, P., Ter Welle, B., 1997. Colophospermum reduced to Hardwickia
(Leguminosae-Caesalpinioideae). Adansonia, ser 3, 19, 279 – 291.
Brunell, M.S., Whitkus, J., 1997. RAPD marker variation in Euriastrum densifolium (Polemoniaceae):
Implications for subspecific delimination and conservation. Systematic Botany 22, 543 – 553.
Bucci, G., Menozzi, P., 1995. Genetic variation of RAPD markers in a Picea abies Karst population.
Heredity 75, 188 – 197.
Carlson, J.E., Tulsieram, L.K., Glaubitz, J.C., Luk, V.W.K., Kauffeldt, C., Rutledge, R., 1991.
Segregation of random amplified DNA markers in F1 progeny of conifers. Theoretical and
Applied Genetics 83(2), 194 – 200.
Chalmers, K.J., Waugh, R., Sprent, J.I., Simons A.J., Powell, W., 1992. Detection of genetic variation
between and within populations of Gliricidia sepium and G. maculata using RAPD markers.
Heredity 69, 465 – 472.
Cheng, Y-J., Guo, W-W., Yi, L.Y., Pang, X-M., Deng, X., 2003. An efficient protocol for genomic DNA
extraction from citrus species. Plant Molecular Biology Reporter 21, 177a – 177g.
Clark, M.S., 1997. Plant Molecular Biology- A laboratory manual. Springer-Verlag. 529 pp.
Claros, M.G., Crespillo, R., Aguilar, M.L., Ca’novas, F.M., 2000. DNA fingerprinting and classification
of geographically related genotypes of olive-tree (Olea europea L.). Euphytica 116, 131– 142.
86
Coletta Filho, H.D., Machado, M.A., Targon, M.L.P.N., Pompeu, J.J., 2000. The use of Random
Amplified Polymorphic DNA to evaluate the genetic variability of ponkan mandarin (Citrus
reticulata Blanco) accessions. Genetics and Molecular Biology 23, 169 – 172.
Dagenbach, E.M., Endow, S.A., 2004. A new kinesin tree. Journal of Cell Science 117, 3 – 7.
Dawson, I.K., Powell, W., 1999. Genetic variation in the Afromontane tree Prunus africana, an
endangered medicinal species. Molecular Ecology 8, 151 – 156.
Dellaporta, S.L.,Wood, J., Hicks, J.B., 1983. A plant minipreparation. Version II. Plant Molecular
Biology Reporter 1, 19 – 21.
Demeke, T., Adams, R.P., Chibbar, R., 1992. Potential taxonomic use of Random Amplified Polymorphic
DNA (RAPD): A case study in Brassica. Theoretical and Applied Genetics 84, 990 – 994.
Dettori, M.T., Palombi, M.A., 2000. Identification of Feijoa sellowiana Berg accessions by RAPD
markers. Scientia Horticulture 86, 279 – 290.
Doyle, J.J., Doyle, J.L., 1990. Isolation of plant DNA from fresh tissue. Focus 12, 13 – 15.
Edwards, K., Johnson, C., Thompson, C., 1991. A simple and rapid method for the preparation of plant
genomic DNA for PCR analysis. Nucleic Acids Research 19, 1349.
Ellsworth, D.L., Rittenhouse, K.D., Honeycutt, R.L., 1993. Artificial variations in randomly amplified
polymorphic DNA banding patterns. BioTechniques 14, 214 – 217.
Fang, G., Hammers, S., Groumet, R., 1992. A quick and inexpensive method for removing
polysaccharides from genomic DNA. BioTechniques 13, 52 – 56.
Fanshawe, D.B., 1962. Fifty Common Trees of Northern Rhodesia. Natural Resources Board and Forest
Department, Lusaka, Zambia. Pp 42 – 43.
Felsenstein, J., 1985. Confidence limits on phylogenies: An approach using bootstrapping. Evolution 39,
783 – 791.

87
Fitch, W.M., 1971. Towards defining the course of evolution: a minimum change for a specified tree
topology. Systematics 20, 406 – 416.
Gallois, A., Audran, J.C., Burrus, M., 1998. Assessment of genetic relationship and population
discrimination among Fagus sylvatica L. by RAPD. Theoretical and Applied Genetics 97, 211–
219.
Gillies, A.C.M., Cornelius, J.P., Newton, A.C., Navarro, C., Hernández, M., 1997. Genetic variation in
Costa Rican populations of the tropical timber species Cedrela odorata L. assessed using
RAPDs. Molecular Ecology 6, 1133 – 1145.
Guasmi, F., Ferchichi, A., Fares, K., Touil, L., 2006. Identification and differentiation of Ficus carica
cultivars using inter simple sequence repeat markers. African Journal of Biotechnology 5, 1370-
1374
Hadrys, H., Balick, M., Schierwater, B., 1992. Application of Random Amplified Polymorphic DNA
(RAPD) in molecular ecology. Molecular Ecology 1, 55 – 65.
Hamrick, J.L., Godt, M.J., 1989. Allozyme diversity in plant species. In: Brown, A.D.H., Clegg, M.T.,
Kahler, A.l., Weir, B.S. (Eds), Plant population genetics, breeding and genetic resources.
Sinauer Association, Sunderland, Mass. Pp 43 – 63.
Harrison, R.F., Luby, J.J., Furnier, G.R., Hancork, H., 1997. Morphological and molecular variation
among populations of octaploid Fragaria virginiana and F. chloronum (Rosaceae) from North
America. American Journal of Botany 84, 612 – 620.
He, G., Prakach, C.S., Jarret, R.L., 1995. Analysis of genetic diversity in sweet potato (Ipomoea batatas)
germplasm collections using DNA amplification fingerprinting. Genome 38, 938 – 945.

88
Huang, H., Layne, D.R., Kubisiak, T.L., 2003. Molecular characterization of cultivated
pawpaw (Asimina triloba L.) using RAPD markers. Journal of the American Society for
Horticultural Science 128, 85 – 93.
Jain, A., Bhatia, S., Banga, S.S., Prakash, S., 1994. Potential use of Random Amplified Polymorphic
DNA (RAPD) technique to study the genetic diversity in Indian mustard (Brassica juncea) and
its relationships to heterosis. Theoretical and Applied Genetics 88, 116 – 122.
Jordano, P., Godoy, J.A., 2000. RAPD variation and population genetic structure in Prunus mahaleb
(Rosaceae), an animal-dispersed tree. Molecular Ecology 9, 1293 – 1305.
Kafkas, S., 2002. Interspecific relationships in Pastacia based on RAPD fingerprinting. HortScience 37,
168 – 171.
Kaga, A., Tomooka, N., Egawa, Y., Hosaka, K., Kamijima, O., 1996. Species relationships in the
subgenus Ceratotropis (genus Vigna) as revealed by RAPD analysis. Euphytica 88, 17 – 24.
Karp, A., Seberg, O., Buiatti, M., 1996. Molecular techniques in the assessment of botanical diversity.
Annals of Botany 78, 143 – 149.
Kim, C.S., Lee, C.H., Shin, J.S., Chung, Y.S., Hyung, N.I., 1997. A simple and rapid method for isolation
of high quality genomic DNA from fruit trees and conifers using PVP. Nucleic Acids Research
25, 1085 – 1086.
Kim, S-H., Jeong, J-H., Kim, S-K., Paek, K-Y., 2002. Parentage identification of ‘Daebong’ grape (Vitis
spp) using RAPD analysis. Journal of Plant Biotechnology 4, 67 – 70.
Kirby, L.T., 1992. DNA Fingerprinting. W.H.M. Freeman & Company, New York. 365 pp.
Kuntze, O., 1891. Copaiba mopane. Review Genera Plantarum I: 172.
Legodi, M.P., Mahlo, S.M., 2003. Genetic variation in Mopane and its ecotypes. Honours Mini-
Dissertation. University of the North, Sovenga.

89
Lengkeek, A.G., Mwangi, A.M., Agufa, C.A.C., Ahenda, J.O., Dawson, I.K., 2006. Comparing genetic
diversity in agroforestry systems with natural forest: a case study of the important timber tree Vitex
fischeri in central Kenya. Agroforestry Systems 67, 293 – 300.
Léonard, J., 1949. Colophospermum. In: Notulae Systematicae IV (Caesalpiniaceae-Amherstieae
africanae americanaeque). Bulletin du Jardin Botanique de L état (Bruxelles) 19, 388 – 391.
Léonard, J., 1999. Colophospermum n'est pas synonume d' Hardwickia (Caesalpiniaceae). Conclusion
d'une méthode objective de travail. Bulletin du Jardin Botanique. National de Belgique,
Brussels 67, 21– 43.
Lim, S-H., Teng, P.C-P., Lee, Y-H., Goh, C-J., 1999. RAPD analysis of some species in the genus Vanda
(Orchidaceae). Annals of Botany 83, 193 – 196.
Liu, Z., Furnier, G.R., 1993. Comparison of allozyme, RFLP and RAPD markers for revealing genetic
variation within and between trembling aspen and bigtooth aspen. Theoretical and Applied
Genetics 87, 97 – 105.
Lock, J.M., 1989. Legumes of Africa: a checklist. Royal Botanic Gardens, Kew. 619 pp.
Lowe, A.J., Gillies, A.C.M., Wilson, J., Dawson, I.K., 2000. Conservation genetics of bush mango from
central/west Africa: implications from RAPD analysis. Molecular Ecology 9, 831– 841.
Lu, Z.H., Reighard, G.L., Baird, W.V., Abbot, A.G., Rajapakse, S., 1996. Identification of peach
rootstock cultivars by RAPD markers. HortScience 31, 127 – 129.
Madams, R.W., 1990. The biogeography of Colophospermum Mopane (Kirk ex Benth.) Kirk ex J.
Léonard at its distribution limit in Eastern Botswana. Unpublished Ph.D. thesis, University of
London. 252 pp.
Madzibane, J., Potgieter, M.J., 1999. Uses of Colophospermum mopane (Leguminosae: Caesalpinioideae)
by the Vhavenda. South African Journal of Botany 65, 440 – 443.

90
Mapaure, I., 1994. The distribution of Colophospermum mopane (Leguminosae-Caesalpinioideae) in
Africa. Kirkia 15(1), 1 – 5.
Margush, T., McMorris, F.R., 1981. Consensus n-trees. Bulletin of Mathematical Biology 43, 239 – 244.
Mashabane, L.G., Madzibane, J., Potgieter, M.J., 2000. A comparative analysis of mopane’s uses
between Vatsonga and Vhavenda. Southern African Ethnobotany 1, 9 – 11.
MirAli, N., Nabulsi, I., 2003. Genetic diversity of Almonds (Prunus dulas) using RAPD technique.
Scientia Horticulturae 98, 461– 471.
Marsolais, J.V., Pringle, J.S.,White, B.N., 1993. Assessment of random amplified polymorphic DNA
(RAPD) as genetic markers for determining the origin of interspecific lilac hybrids. Taxon 42,
531 – 537.
Murray, M.G., Thompson, W.F., 1980. Rapid isolation of high molecular weight DNA. Nucleic Acids
Research 8, 4321 – 4335.
Nei, M., 1991. Relative efficiencies of different tree making methods for molecular data. In: Miyamoto,
M.M., Cracraft, J.L. (Eds.), Recent Advances in Phylogenetic studies of DNA Sequences.
Oxford University Press, Oxford. pp. 90 – 128.
Neto, G.A., 2000. What’s happening in Mopane and miombo vegetation in Lubango and Nambie.
SABONET News 5(1), 66 – 67.
Niehuis, J., Tivang, J., Skroch, P., Dos Santos, J.B., 1995. Genetic relationship among cultivars and
landrace of Lima Bean (Phaseolus lanatus L.) measured by RAPD markers. Journal of
American Society for Horticultural Science 120, 300 – 306.
Nkongolo, K.K., Michael, P., Gratton, W.S., 2002. Identification and characterization of RAPD markers
inferring genetic relationships among pine species. Genome 45, 51 – 58.
Nybom, H., 1994. DNA fingerprinting: A useful tool in fruit breeding. Euphytica 77, 59 – 64.
91
Oliveira, C.M., Mota, M., Monte-Corvo, L., Goulao, L., Silva, D.M., 1999. Molecular typing of Pyrus
based on RAPD markers. Scientia Horticulturae 79, 163 – 174.
Olmstead, R.G., Sweere, J.A. 1994. Combining data in phylogenetic systematics: An empirical approach
using three molecular data sets in the Solanaceae. Systematic Biology 43, 467 – 481.
Palmer, E., Pitman, N., 1972. Trees of Southern Africa. Vol. 2. A.A. Balkema, Cape Town.
Papa, R., Attene, S., Barcaccia, G., Ohgata, A., Konishi, T., 1998. Genetic diversity in landrace
populations of Hordeum vulgare L. from Sardiana, Italy as revealed by RAPDs, Isozymes and
morphological traits. Plant Breeders 117, 523 – 530.
Parami, M., Lakshmi, M., Elango, S., Nilvedita, R., Anuratha, C.S., Parida, A., 1997. Molecular
phylogeny of mangrove II. Intra and Inter-specific variation in Avicemia revealed by RAPD and
RFLP markers. Genome 40, 487 – 495.
Paterson, A.H., Brubaker, C.L., Wendel, J.F., 1993. A rapid method for extraction of cotton (Gossypium
spp) genome DNA suitable for RFLP or PCR analysis. Plant Molecular Biology Reporter 11,
122 – 127.
Perron, M., Gordon, A.G., Bousquet, J., 1995. Species-specific RAPD fingerprinting for the closely-
related Picea mariana and P. rubens. Theoretical and Applied Genetics 91, 142 – 149.
Persson, H.A., Rumpunel, K., Mollerstedt, L.K., 2000. Identification of culinary rhuarb (Rheum spp)
cultivars using morphological characterisation and RAPD markers. Journal of Horticultural
Science and Biotechnology 75, 684 – 689.
Pillay, M., Ogundiwin, E., Nwakanma, D.C., Ude, G., Tenkouano, A., 2001. Analysis of genetic diversity
and relationships in East African banana germplasm. Theoretical and Applied Genetics 102, 965 –
970.

92
Plant, K.S., Canon, R.E., Scandalios, J.G., 1993. Concentration of primer and template qualitatively
affects products in random amplified polymorphic DNA PCR. BioTechniques 14, 362 – 364.
Porebski, S., Bailey, L.G., Baum, B.R., 1997. Modification of a CTAB DNA extraction protocol for
plants containing high polysaccharides and polyphenol components. Plant Molecular Biology
Reporter 15, 8 – 15.
Potgieter, M.J., 2006. A morphometric analysis of selected characteristics of Colophospermum mopane
(sensu lato). Ph.D. thesis, University of Limpopo, Mankweng.
Rajaseger, G., Tan, T.W.H., Turner, I.M., Kumar, P.P., 1997. Analysis of genetic diversity among Ixora
cultivars (Rubiaceae) using Random Amplified Polymorphic DNA. Annals of Botany 80, 355 –
361.
Rajaseger, G., Tan, H.T.W., Turner, L.M., Saw, L.G., Kumar, P.P., 1999. Random Amplified
Polymorphic DNA Variation among and within selected Ixora (Rubiaceae) populations and
mutants. Annals of Botany 84, 253 – 257.
Ramser, J., Peralta, C.L., Wetzel, R., Weising, K., Kahl, G., 1996. Genomic variation and relationships in
aerial yam detected by RAPD. Genome 39, 17 – 25.
Rath, P., Rajaseger, G., Goh, C.H., Kumar, P.P., 1998. Phylogenetic analysis of Dipterocarpaceae using
Random Amplified Polymorphic DNA markers. Annals of Botany 82, 61– 65.
Rogers, S.O., Benedich, A.J., 1985. Extraction of DNA from milligram amounts of fresh, herbarium and
mummified plant tissues. Plant Molecular Biology Reporter 5: 69 – 76.
Saitou, N., Nei, M., 1987. The Neighbour Joining method: A new method for reconstructing phylogenetic
trees. Molecular Biology Evolution 4, 406 – 425.

93
Samal, S., Rout, G.R., Lenka, P.C., 2003. Analysis of genetic relationships between populations of
cashew (Anacardium occidentale L.) by using morphological characterization and RAPD
markers. Plant Soil Environment 49, 176 – 182.
Saritnum, O., Sriuamsiri, P., 2003. Random Amplified Polymorphic DNA Analysis of Galanga (Alpinia
spp) Accessions. Chiang Mai University Journal 2, 159 – 164.
Schlink, K., Reski, R., 2002. Preparing high-quality DNA from moss (Physcomitrella patens). Plant
Molecular Biology Reporter 20, 423a – 423f.
Schuh, R.T., 2000. Biological Systematics, Principles and Applications. Cornell University Press,
London.
Scott, K.D., Playford, J., 1996. DNA extraction technique for PCR in rain forest plant species.
Biotechniques 20, 974 – 978.
Sharma, A.D., Gill, P.K., Singh, P., 2002. DNA isolation from dry and fresh samples of polysaccharide-
rich plants. Plant Molecular Biology Reporter 20, 415a – 415f.
Shimada, T., Hamaya, H., Nishimura, K., Yanaguchi, M., Yoshida, M., 2001. The genetic diversities of 4
species of subg. Lithocerasus (Prunus, Rosaceae) revealed by RAPD analysis. Euphytica 117,
85 – 90.
Skabo, S., Vaillancourt, R.E., Potts, B.M., 1998. Fine-scale genetic structure of Eucalyptus globulus
forest revealed by RAPDs. Australian Journal of Botany 46, 583 – 594.
Skepner, A.P., Krane, D.E., 1998. RAPD reveals genetic similarity of Acer saccharum and Acer nigrum.
Heredity 80, 422 – 428.
Smith, J.S.C., Smith, O.S., 1989. The description and assessment of distance between inbred lines of
maize. II. The utility of morphological, biochemical and genetic description and a scheme for the
testing of distinctiveness between inbred lines. Maydica 34, 161– 161.

94
Smith, P.P., Timberlake, J.R., van Wyk, A.E., 1998. Proposal to conserve the name Colophospermum
against Hardwickia (Leguminosae, Caesalpinioideae). Taxon 47, 751 – 752.
Soltis, D.E., Soltis, P.S., Mort, M.E., Chase, M.W., Savolainen, V., Hoot, S.B., Morton, C.M., 1998.
Inferring Complex Phylogenies Using Parsimony: An Empirical Approach Using Three Large
DNA Data Sets for Angiosperms. Systematic Biology 47, 32 – 42.
Soltis, P.S., Soltis, D.E., Doyle, J.J., 1992. Molecular data and polyploidy evolution in plants. In: Soltis
D.E., Doyle, J.J. (Eds), Molecular systematics of plants. Chapman and Hall, New York. Pp 177
– 201.
Song, B.K., Clyde, M. M., Wickneswari, R., Normah, M.N., 2000. Genetic relatedness among Lansium
domesticum accessions using RAPD markers. Annals of Botany 86, 299 – 307.
Styles, C.V., Skinner, J.D., 1997. Seasonal variations in the quality of mopane leaves a source of browse
mammalian herbivores. African Journal of Ecology 35, 254 – 265.
Swofford, D.L., 2002. PAUP*: Phylogenetic analysis using parsimony (* and other methods), version
4.0b 10. Sinauer Associates, Sunderland, Massachusetts.
Swofford, D.L., Olsen, G.T., Waddell, P.J., Hillis, D.M., 1996. Phylogenetic Inference: In: Hillis, D.M.,
Moritz, C., Mable, B.I.C. (Eds), Molecular systematics. 2nd
edition. Sinauer Associates,
Sunderland, Massachusetts. Pp 407 – 519.
Thompson, D., Henry, R.J., 1995. Single step protocol for preparation of plant tissue analysis by PCR.
Biotechniques 19, 394 – 397.
Thompson, J.G., 1960. A description of the growth habits of mopani in relation to soil and climatic
conditions. Proceedings of the First Federal Science Congress. Rhodesia Scientific Association
1. Pp 181– 186.

95
Timberlake, J.R., 1995. Colophospermum mopane: Annotated bibliography and review. Zimbabwe Forest
Research Bulletin 11. Zimbabwe Forestry Commission, Harare, Zimbabwe. P 49.
Timberlake, J.R., Calvert, G.M., 1993. Preliminary root atlas for Zimbabwe and Zambia. Forest Research
Bulletin 10. Zimbabwe Forestry Commission, Harare, Zimbabwe. P 96.
Tootill, E. (Ed.), 1984. The Penguin Dictionary of Botany. Penguin books, England. 400 pp.
Trindade, M.G., Chaves, L.J., 2005. Genetic structure of natural Eugenia dysenterica DC (Myrtaceae)
populations in North-Eastern Goiás, Brazil, accessed by morphological traits and RAPD
markers. Genetics and Molecular Biology 28, 407 – 413.
Turresson, G. 1992. The species and the variety as ecological units. Hereditas 3, 100 – 113.
Tyler, K.D., Wang, G., Tyler, S.D., Johnson, W.M., 1997. Factors affecting reliability and reproducibility
of amplification-based DNA fingerprinting of representative bacterial pathogens. Journal of
Clinical Microbiology 35, 339 – 346.
Villoen, L., Van der Bank, F.H., Van der Bank, M., Grobler, J.P., Wessels, D., 2003. Allozyme variation
in five populations of Mopane, Colophospermum mopane (Fabaceae). South African Journal of
Botany 69, 282 – 286.
Virk, P.S., Newbury, H.J., Jackson, M.T., Ford-Loyd, B.V., 1997. In: Callow, J. A., Newbury, H.J. (Eds),
Biotechnology and Plant Genetic Resources: Conservation and Use.
Weising, K., Kaemmer, D., Epplen, J.T., Weigand, F., Saxena, M., Kahl, G., 1991. DNA fingerprinting of
Asocochyta rabiei with synthetic oligodeoxynucleotides. Current Genetics 19, 483 – 489.
Welsh, J., McClelland, T., 1990. Fingerprinting genome using PCR with arbitrary primers. Nucleic Acids
Research 8, 7213 – 7219.

96
Welsh, J., Honeycutt, R.J., McClelland, M., Sobral, B.W.S., 1991. Parentage determination in maize
hybrids using the Arbitrarily Primed Polymerase Chain Reaction (AP-PCR). Theoretical and
Applied Genetics 82, 473 – 476.
Wessels, D.C.J., Potgieter, M.J., Jordaan, A., 1998. Miraculous mopane for wood, worms and wealth.
Recently recognised ecotypes are potentially of great value to farmers. Farmer's Weekly. 25
Dec. Pp 51– 53.
Wiens, J.J., 1998. Combining data with different phylogenetic histories. Systematic Biology 47, 56 –
581.
Wilde, J., Waugh, R., Powell, W., 1992. Genetic fingerprinting of Theobroma clones using Randomly
Amplified Polymorphic DNA markers. Theoretical and Applied Genetics 88, 871– 877.
Williams, J.G.K., Kubelik, A.R., Livak, K.J., Rafalski, J.A., Tingey, S.V., 1990. DNA polymorphisms
amplified by arbitrary primers are useful as genetic markers. Nucleic Acids Research 18, 6531–
6535.
Williams, J.G.K., Hanafey, M.K., Rafalski, J.A., Tingey, S.V., 1993. Genetic analysis using random
amplified polymorphic DNA markers. Methods of Enzymology 218, 704 –740.
Williamson, M., 1997. Biological Invasions. Chapman and Hall, London. 244 pp.
Winter, P., Kahl, G., 1995. Molecular marker technologies for plant improvement. World Journal of
Microbiology and Biotechnology 11, 438 – 448.
Wöhrmann, K., 1990. Genetic Variation: Prerequisite and Consequences of Evolution. In: Wöhrmann,
K., Jain, S.K. (Eds.), Population Biology, Ecological and Evolutionary Viewpoints. Springer-
Verlag. Pp 219 – 230.
97
Yamagishi, M., Matsumoto, S., Nakatsuka, A., Itamura, H., 2005. Identification of Persimmon
(Diospyros kaki) cultivars and phenetic relationships between Diospyros species by more
effective RAPD analysis. Scientia Horticulturae 105, 283 – 290.
Yeh, F.C., Chong, K.X., Yang, R.C., 1995. RAPD variation within and among natural populations of
trembling aspen (Populus tremuloides) from Alberta. Journal of Heredity 86, 454 – 460.
Zacarias, A.M., Botha, A.M., Labuschagne, M.T., Benesi, I.R.M., 2006. Characterisation and genetic
distance analysis of cassava (Manihot esculenta Crantz) germplasm from Mozambique using
RAPD fingerprinting. Euphytica 138, 49 – 53.
Zebrowska, J.I., Tyrka, M., 2003. The use of RAPD markers for strawberry identification and genetic
studies. Food, Agriculture and Environment 1, 115 – 117.

98
APPENDIX
Table 8: Character state data matrix for PAUP analysis of the combined data with 24 taxa and 31
characters.
1 2 3 4 5 6 7 8 9 10 11 12 13 14 15 16 17 18 19 20 21 22 23 24 25 26 27 28 29 30 31
1 Bauhinia 1 1 1 1 1 1 1 0 1 1 0 1 0 1 1 1 0 1 1 1 1 1 1 1 0 0 0 0 0 1 0
2 Les 4 0 0 0 0 1 1 1 1 0 1 0 0 1 0 0 0 0 1 0 1 0 1 0 0 0 0 0 1 0 0 1
3 Les 3 0 0 0 0 0 0 0 1 0 0 1 0 0 ? ? ? ? ? ? ? ? ? ? ? ? ? ? ? ? ? ?
4 Les turn 2 0 0 0 0 1 1 1 1 0 1 1 0 0 0 0 0 0 0 0 1 0 1 0 0 0 0 0 0 0 0 1
5 Les hek 2 0 0 0 0 1 1 1 1 0 1 0 0 1 0 0 0 0 0 0 1 0 1 0 0 0 0 1 1 1 1 0
6 Parvi 3 0 0 0 0 1 0 1 1 0 1 1 0 1 ? ? ? ? ? ? ? ? ? ? ? ? ? ? ? ? ? ?
7 Parvi 1 1 1 0 0 1 1 1 1 0 1 1 0 0 1 1 0 1 1 0 1 0 1 0 0 0 0 1 1 1 0 0
8 Acum 2 0 0 0 0 0 0 0 1 0 0 1 0 0 ? ? ? ? ? ? ? ? ? ? ? ? ? ? ? ? ? ?
9 Acum 4 0 1 0 1 1 1 1 1 0 1 1 0 1 0 0 0 0 0 0 1 0 0 0 0 0 0 1 1 0 0 0
10 Acum 3 0 0 0 0 1 1 1 1 0 1 0 0 1 0 0 0 0 0 0 1 0 1 0 0 ? ? ? ? ? ? ?
11 Laevi 5 0 0 0 0 0 0 0 0 0 1 1 0 0 0 0 0 0 0 0 1 1 1 0 0 0 0 1 1 0 1 0
12 Laevi 4 0 0 0 0 1 0 1 1 0 1 1 0 1 ? ? ? ? ? ? ? ? ? ? ? 0 0 1 1 1 1 0
13 Mop 3 0 0 0 0 1 0 1 1 0 1 1 1 1 ? ? ? ? ? ? ? ? ? ? ? 0 0 1 1 1 1 1
14 Mop 1 0 0 0 0 1 0 0 1 0 1 1 0 1 0 0 1 0 0 0 1 0 1 0 0 0 0 1 1 1 1 0
15 Mop 4 0 0 0 0 1 1 1 1 0 1 1 0 1 0 0 1 0 0 0 1 0 0 0 1 0 0 1 1 1 1 0
16 Mop 2 0 0 0 1 1 1 1 1 0 1 0 1 1 1 0 1 0 0 0 1 0 1 0 0 1 1 1 1 1 1 1
17 Alba 6 0 0 0 1 1 1 1 1 0 1 1 0 1 1 0 1 0 0 0 1 0 1 0 0 0 0 1 1 1 1 0
18 Alba 1 Phala 0 0 0 0 0 1 1 1 0 1 1 0 1 ? ? ? ? ? ? ? ? ? ? ? ? ? ? ? ? ? ?
19 Alba 2 0 0 0 0 1 1 1 1 0 1 1 0 1 0 0 0 0 0 0 1 0 1 0 0 0 0 1 1 1 1 0
20 Alba 7 0 0 0 0 1 1 1 1 0 1 1 0 1 0 0 0 0 0 0 1 0 1 1 0 0 0 1 1 1 1 1
21 Alba 2 Phala 0 0 0 0 1 1 1 1 0 1 1 0 1 0 0 0 0 0 0 1 0 1 1 0 0 0 1 1 1 1 1
22 Alba 4 0 0 0 0 1 1 1 1 0 1 0 0 1 0 0 0 0 0 0 1 0 1 0 1 ? ? ? ? ? ? ?
23 Alba 1 0 0 0 0 1 0 0 1 0 0 1 0 0 0 0 0 0 0 0 1 0 1 0 0 ? ? ? ? ? ? ?
24 Laevi 2 ? ? ? ? ? ? ? ? ? ? ? ? ? 0 0 1 0 0 0 1 0 1 0 0 ? ? ? ? ? ? ?
0: absence of data
1: presence of data
?: missing data