genetic characterization of cynodon
TRANSCRIPT
GENETIC CHARACTERIZATION OF CYNODON
ACCESSIONS BY MORPHOLOGY, FLOW
CYTOMETRY AND DNA PROFILING
By
YANQIWU
Bachelor of Agricultural Science Ningxia University Yingchuan, China
1985
Master of Agricultural Science Sichuan Agricultural University
Yaan, China 1988
Submitted to the Faculty of the Graduate College of the
Oklahoma State University in partial fulfillment of
the requirements for The Degree of
DOCTOR OF PHILOSOPHY May,2004
GENETIC CHARACTERIZATION OF CYNODON
ACCESSIONS BY MORPHOLOGY, FLOW
CYTOMETRY AND DNA PROFILING
Thesis Approved:
11
ACKNOWLEDGEMENTS
I extend my most sincere appreciation to my major professor and advisor,
Dr. Charles M. Taliaferro, for his knowledgeable and patient guidance and intelligent
supervision, his trust, encouragement and assistance in the course of my study, research
and writing the manuscripts. I express my sincere gratitude to my committee professors,
Drs. Guihua Bai, Mike P. Anderson, and Dennis Martin for their all kind help and advice
enabling me to accomplish this research project and for their critical review of my thesis.
My sincere thanks to the colleagues and co-workers of the Grass Genetics and
Breeding Team: Mrs. Rose Edwards, Mr. Gary Williams, Mrs. Sharon Williams, Kevin
Kenworthy, Arnold Parco, Veronica Tudor-Allen, Louis Rose and Binu Sheresta for their
nice help and efforts to my research project in many aspects and friendships during my
study. I sincerely thank Dr. Carla Goad for help in data analysis, Drs. Xiangyang Xu,
Modan K. Das, Nathan Walker, Mr. Marza Felix and Mr. Terry Colberg for sharing their
expertise during the conduct of my experiments. I also thank Mrs. Jackie Nidiffer, Mrs.
Vickie Brake, and Mrs. Carol Coe for their kind assistance.
Finally, I express my special appreciation to my wife, Pu and our son, Chenxi, for
their love, encouragement and understanding throughout the whole process.
111

I dedicate this humble piece of work to my wife, Pu and our son, Chenxi, to my
mother and my family relatives, who all encourage me to pursue my dreams.
lV
TABLE OF CONTENTS
Chapter Page
I. GENERAL INTRODUCTION
Taxonomy and distribution ............................................................................. 1 Use and importance ........................................................................................ 2 Chromosome number and ploidy levels ....................................................... .4 Germplasm collection and characterization ................................................... 6 Molecular markers in genetic studies ............................................................. 7 Objectives of the study .................................................................................... 9 References ..................................................................................................... 11
II. PLOIDY DETERMINATION OF CHINESE CYNODON ACCESSIONS BY FLOW CYTOMETRY
Abstract ......................................................................................................... 17 Introduction ................................................................................................... 19 Materials and Methods .................................................................................. 22 Results and Discussion ................................................................................. 25 References ................................................................................................ 29
III. AFLP DIVERSITY OF CHINESE CYNODON ACCESSIONS
Abstract ....................... ; ................................................................................. 37 Introduction ................................................................................................... 39 Materials and Methods .................................................................................. 41 Results and Discussion ................................................................................. 44 References ..................................................................................................... 51
IV. AFLP ANALYSIS OF CYNODON DACTYLON (L.) PERS.VAR. DACTYLON GENETIC VARIATION
Abstract ......................................................................................................... 62 Introduction ................................................................................................... 63 Materials and Methods .................................................................................. 65 Results and Discussion ................................................................................. 67 References ..................................................................................................... 73
V
V. GENETIC DIVERSITY OF CYNODON TRANSV AALENSIS BURTT-DAVY AND ITS RELATEDNESS TO HEXAPLOID C. DACTYLON (L.) PERS. AS INDICATED BY AFLP MARKERS
Abstract ......................................................................................................... 84 Introduction .................................................................................................. 85 Materials and Methods .................................................................................. 88 Results and Discussion ................................................................................. 91 References ..................................................................................................... 96
VI. GENETIC CHARACTERIZATION OF CYNODON ACCESSIONS BY FIELD EXPERIMENTATIONS: I. GENETIC VARIABILITY IN SEED YIELD AND ITS COMPONENTS
Abstract ....................................................................................................... 106 Introduction ................................................................................................. 108 Materials and Methods ................................................................................ 111 Results and Discussion ............................................................................... 115 References ................................................................................................... 121
VII. GENETIC CHARACTERIZATION OF CYNODON ACCESSIONS BY FIELD EXPERIMENTATIONS: II. GENETIC VARIABILITY IN TRAITS RELATED TO TURF
Abstract ....................................................................................................... 136 Introduction ................................................................................................. 138 Materials and Methods ................................................................................ 140 Results and Discussion ............................................................................... 142 References ................................................................................................... 14 7
VIII. GENETIC CHARACTERIZATION OF CYNODON ACCESSIONS BY FIELD EXPERIMENTATIONS: III. GENETIC VARIABILITY IN BIOMASS AND TRAIT RELATIONSHIPS
Abstract ....................................................................................................... 161 Introduction ................................................................................................. 163 Materials and Methods ................................................................................ 165 Results and Discussion ............................................................................... 167 References .......................................................................................... _. ........ 172
VI
LIST OF TABLES
Table Page
Chapter II
1. Identification, source and nuclear DNA content of 127 Chinese Cynodon accessions and three commercial cultivars .................................... 34
2. Cytologically observed chromosome number of nine unpredicted and four predicted Chinese Cynodon plants ................................................. 36
Chapter III
1. Chinese Cynodon plants and three commercial cultivars used in this study ................................................................................................... 54
2. Selective primer pairs, scored total and polymorphic bands in Chinese Cynodon AFLP profiling ................................................................ 56
3. Genetic similarity coefficients within and among three ploidy levels of Chinese Cynodon accessions ...................... ~ ................................... 57
Chapter IV
1. Cynodon dactylon var. dactylon accessions analyzed for amplified fragment length polymorphisms .................................................................... 76
2. Primer combinations for pre- and selective-amplification, and total and polymorphic bands scored in Cynodon dactylon var. dactylon AFLP profiling ......................................................................... 77
3. Similarity coefficients for Cynodon dactylon var. dactylon accessions based on amplified fragment length polymorphism ................... 78
ChapterV
1. Cynodon accessions used for AFLP analysis ................................................. 99
Vll
2. Total number of bands and number of polymorphic bands scored for each of 13 AFLP selective primer combinations ........................ 100
3. Genetic dissimilarity coefficients calculated for 19 Cynodon accessions encompassing 14 C. transvaalensis (Ctr), two hexaploid C. dactylon var. dactylon (Cdd), and three C. dactylon by C. transvaalensis Fl hybrids (Hyb) combining data by using AFLP ..................................................................................... 101
Chapter VI
1. Identification and origin of 120 Chinese Cynodon accessions and four commercial cultivars ..................................................................... 124
2. Analyses of variance for seed yield (kg ha-1) and five yield components of bermudagrass genotypes in experiment A ............................................... 126
3. Mean and range of seed yield and its components for experiment A in 2002 and 2003 ................................................................... 127
4. Analyses of variance for seed yield (kg ha-1) and five yield components ofbermudagrass half-sib families in experiment B ..................................... 128
5. Means and ranges of seed yield and its components for experiment B in 2002 and 2003 ................................................................... 129
6. Estimates of variance components and their associated standard errors for seed yield and its components for 120 clonal accessions ............ 130
7. Estimates of variance components and their associated standard errors for seed yield and its components for 56 half-sib families and four cul ti vars in experiment B. .............................................................. 131
8. Phenotypic correlation coefficients among seed yield and seed yield components for 120 Chinese C. dactylon accessions in experiment A ( above diagonal) and half-sib families in experiment B (below diagonal ..................................................................... 132
9. Path coefficients of seed yield components indicating direct and indirect effects on seed yield for Chinese C. dactylon accessions of experiment A in 2002 and 2003 .............................................................. 133
10. Path coefficients of seed yield components indicating direct and indirect effects on seed yield for 56 C. dactylon half-sib families of experiment Bin 2002 and 2003 .................................... 134
Vlll
Chapter VII
1. Year and date of data or sample collection, and evaluation methods of traits related to turf performance of Chinese Cynodon accessions and half-sib families ................................. 149
2. Analyses of variance for 23 turf related traits of Chinese Cynodon accessions in experiment A .......................................................................... 150
3. Means and ranges for the 23 turfrelated traits in experiment A ................. 151
4. Estimates of variance components and their associated standard errors for the 23 turfrelated traits in experiment A ...................... 152
5. Means and ranges for traits ofTifsport and Tifway by combining data from experiment A and B by year ...................................... 153
6. Analyses of variance for 23 turf related traits of 54 Chinese Cynodon half-sib families in experiment B ................................... 154
7. Means and ranges for traits related to turf performance of the 54 half-sib families in experiment B ............................................................ 155
8. Estimates of variance components and their associated standard errors for traits related to turf performance for the 54 Chinese Cynodon half-sib families in experiment B ................................... 156
9. Number of Chinese Cynodon accessions from 11 provinces and their ploidy levels that comprising each of 7 phenotypic clusters based on distance less than 1.28 within a cluster ......................................... 157
10. Accessions in a core sub-collection of Chinese C. dacrylon ...................... .158
Chapter VIII
1. Analyses of variance for biomass of the Chinese Cynodon accessions in experiment A and 54 half-sib families in experiment B .......................... 17 4
2. Mean dry biomass yield (tons ha-1) and relative rank for 117 Chinese Cynodon accessions and four cultivars in experiment A ............................................................................. 175
3. Estimates of variance components and their associated standard errors for biomass for the Cynodon accessions ............................. 178
4. Phenotypic correlation coefficients among 25 morphological, adaptive and agronomic traits for Chinese C. dacrylon accessions in experiment A ............................................................................................ 179
lX
5. Stepwise selection of dry weight components by a regression model at the significant level of0.05 ........................................................... 181
6. Path coefficients of biomass dry weight components indicating direct and indirect effects on biomass dry weight for the Chinese Cynodon accessions of experiment A .......................................................... 182
X
LIST OF FIGURES
Figure Page
Chapter II
1. Photomicrographs of the four observed ploidy levels in Chinese Cynodon accessions. a:A12260, 2n=3x=27 b:A12257,2n=4x=36 c:A12348, 2n=5x=45 d:A12319, 2n=6x=54 ..................................................................................... 33
Chapter III
1. Replicated AFLP DNA patterns generated using primer-pair eACT/mCAG for 8 genotypes ....................................................................... 58
2. Cluster analysis tree and similarity coefficients of 122 . Cynodon genotypes by AFLP DNA profiling ............................................... 59
3. Principal coordinate plot indicating variation pattern and geographic origin for the 122 accessions using 466 AFLP markers ......................................................................................... 60
Chapter IV
1. AFLP fingerprints generated using primer combination e-ACT/m-CAG for 28 Cynodon dactylon var. dactylon accessions ....................................................................................................... 80
2. UPGMA dendrogram depicting patterns of genetic diversity for 28 Cynodon dactylon var. dactylon accessions estimated by 443 AFLP markers among 28 accessions from 11 countries ......................... 81
3. Principal coordinate map for the first and second coordinates estimated for 443 AFLP using the genetic similarity matrix for 28 Cynodon dactylon var. dactylon accessions .............................................. 82
xi
ChapterV
1. AFLP :fingerprints generated using primer combination e-ACT/m-CAA ............................................................................................ 103
2. UPGMA tree of similarity coefficients derived from phenetic analysis of AFLP data .................................................................................. 104
3. Principal coordinate analysis ofbermudagrass accessions · based on AFLP ............................................................................................. 105
Chapter VI
1. A path diagram showing cause and effect relationships of five seed yield components and seed yield in bermudagrass .............................. 13 5
Chapter VII
1. A phenotypic dendrogram for the Chinese Cynodon accessions and four cultivars ......................................................................................... 159
Chapter VIII
1. A path diagram showing cause and effect relationships ofbiomass and seven biomass components in bermudagrass ..................... 183
Xll
CHAPTER I
GENERAL INTRODUCTION
Cynodon L.C. Rich. species originated in the old world where centers of diversity
are found distributed in parts of Africa and Eurasia (Harlan, 1970a). The genus contains
perennial and sod-forming grasses of significant importance based on their use as
livestock feed, recreational turf, and soil stabilization. Beginning near the start of the 20th
century and continuing until the present, research has been conducted with Cynodon in
the areas of germplasm collection and characterization, breeding improvement,
taxonomic classification, chromosome number determination, and molecular marker
genetics (Taliaferro, 2003).
Taxonomy and distribution
Cynodon L. C. Rich., a genus of the tribe Cynodonteae, subfamily Choridoideae,
and family Gramineae (Poaceae), comprises nine species and ten varieties in a
taxonomically revised classification by J. R. Harlan and colleagues (Harlan et al. 1970a;
de Wet and Harlan, 1970). The taxonomic revision was based on evidence from
extensive bio-systematic studies of some 900 Cynodon accessions collected from many
parts of the world where the plants were found, but not including China. Their studies
encompassed plant morphology, geographical distribution, cytogenetic characteristics,
and hybridization potential. Their classification is the same as that of the Kew Royal
1
Botanic gardens (Kew, 1999) except that C. X magennisii is omitted by Kew. There are
six botanical varieties in C. dactylon (L.) Pers (Harlan and de Wet, 1969). C. dactylon
var. dactylon is cosmopolitan and distributed across all continents and islands between
about 45° N and 45° S latitudes, even penetrating to 53° Nin Europe, while C. dactylon
var. afghanicus Harlan et de Wet, var. aridus Harlan et de Wet, var. coursii (A. Camus)
Harlan et de Wet, var. elegans Rendle and var. polevansii (Stent) de Wet et Harlan are
endemic or have restricted distributions (Harlan and de Wet, 1969). The other eight
species of Cynodon fall clearly into three groups according to geographical distribution:
South Asia and Indian Ocean-South Pacific Islands (C. arcuatus J.S.Presl. ex C.B.Presl.,
C. barberi Rang. et Tad.); East Africa (C. plectostachyus (K.Schum.) Pilger, C.
aethiopicus Clayton et Harlan, C. nlemfuensis Vanderyst var. nlemfuensis, var. robustus
Clayton et Harlan); South Africa (C. incompletus Nees var. incompletus, var. hirsutus
(Stent) de Wet et Harlan, C. transvaalensis Burtt-Davy, C X magennisii Hurcombe)
(Harlan et al. 1970b).
Use and importance
These warm-season, sod-forming grasses are important and widely used in
tropical and warmer temperate regions of the world for turf, livestock herbage, soil
stabilization and spoil site remediation (Taliaferro et al. 2004; Taliaferro, 1995). The taxa
of predominant turf importance are C. dactylon (L.) Pers. var. dactylon and C.
transvaalensis Burtt-Davy. Most of the turfbermudagrasses of economic importance
emanate from these two taxa. Forms of the narrowly endemic C. X magennisii Hurcombe
and C. incompletus Nees var. hirsutus (Stent) de Wet et Harlan have had fairly wide use
as turfgrasses. Taxa of minor turf importance are C. arcuatus J.S.Presl. ex C.B.Presl. C.
2
barberi Rang.et Tad. and C. dactylon var. polevansii (Stent) de Wet et Harlan. Other taxa
have little, or no, value as turf, but in some cases will hybridize with the turf species,
thereby representing potentially important contributors of genes for the breeding
improvement ofturfbermudagrass (Taliaferro, 2003). Bermudagrass turf is used on home
and institutional lawns, parks, athletic fields, and golf course fairways, tees, putting
greens and roughs, cemetery grounds, road-side right of ways, and other similar areas
(Beard, 1973).
Among the Cynodon species, C. arcuatus, C. barberi, C. transvaalensis, C.
incompletus var. incompletus and var. hirsutus, and C. X magennissi are of minor value
as herbages for grazing and hay, because of very small size, little yield or endemic or
limited distribution (Taliaferro et al. 2004; Harlan, 1970c ). The robust East African
species, C. aethiopicus, C. plectostachyus, C. nlemfuensis var. nlemfuensis and var.
robustus are rather widely used as forage grasses because of their natural abundance and
apparent productivity (Harlan, 1970c). These are called stargrasses and are used in the
USA chiefly in tropical Florida. They are extensively used in Central and South America,
the Caribbean and tropical Africa (Taliaferro et al. 2004). Cynodon dactylon is
enormously variable and extremely valuable for grazing and hay production, while four
of six varieties are endemic and of relatively minor value compared with other two.
According to Harlan (1970c), C. dactylon var. afghanicus is a robust form that provides
some pasture for livestock near irrigation projects in the lowland steppes, but it can
hardly be considered a major fodder even in the local areas. Cynodon dactylon var.
coursii is a robust, non-rhizomatous form endemic to Madagascar with a moderately
important grazing resource on the island but of no significance elsewhere. The var.
3
polevansii is known from only one site near Baberspan, South Africa. The var. elegans
provides considerable grazing in South Africa. The var. aridus as a fodder grass has not
been characterized widely. Cynodon dactylon var. dactylon, the most widely distributed,
provides an important forage resource for grazing, and the most important genetic
resource for breeding improved hay and pasture grass cultivars suitable for intensive
management(Burton and Hanna, 1995; Harlan,1970c).
Chromosome number and ploidy levels
Several ploidy levels and two base chromosome numbers have been reported in
Cynodon. Hurcombe (1947) reported the basic chromosome number of the genus as 10
and that C. transvaalensis is the diploid form, C. magennisii the triploid, and C. dactylon
the tetraploid form. She reported 2n=18 chromosomes for C. bradleyi (C. incompletus),
but assumed it to be an aneuploid number. Moffett and Hurcombe (1949) reported base
chromosome numbers ofx=9 and x=lO, C. dactylon with 36 somatic chromosomes, and
C. plectostachyum plants with 18 or 54 chromosomes. Nine was later confirmed as the
correct base chromosome number in Cynodon (Forbes and Burton, 1963; Harlan et al.,
1970d).
The diploid (2n= 18) species are C. barberi, C. dactyl on var. aridus, C.
incompletus var. incompletus, C. plectostachyus and C. transvaalensis. The tetraploid
(2n=36) species are C. arcuatus, C. dactylon var. dactylon, C. dactylon var. coursii, C.
dactylon var. elegans and C. dactylon var. polevansii, while C. aethiopicus, C. dactylon
var. afghanicus, C. incompletus var. hirsutus, C. nlemfuensis var. nlemfuensis and C.
nlemfuensis var. robustus have both tetraploid and diploid chromosome numbers (Harlan
4
et al. 1970d). Hexaploid (2n=6x=54) Cynodon plants occur rarely. Powell et al. (1968)
reported a hexaploid plant among putative progeny of a cross between tetraploid C.
dactylon var. dactylon by diploid C. transvaalensis. C. dactylon var. dactylon cv. 'Tifton
10' is a natural hexaploid plant (Burton,1991; Hanna et al. 1990). A released cultivar
'Tifton 85 ', a bermudagrass by stargrass ( C. nlemfuensis) interspecific Fl hybrid, is a
pentaploid (Burton et al. 1993). de Silva and Snaydon (1995) reported in Sri Lanka
Cynodon populations from arid, dry and intermediate regions, and those from roadsides,
lawns and grasslands in the hill country (pH>6.5), consisted entirely oftetraploid plants
and all populations from roadsides and lawns in the wet region, and from forests in the
hill country (pH<5.0), consisted entirely of diploid plants, while mixtures of diploids and
tetraploids occurred only in areas with a soil pH between 6.0 and 6.5.
Nuclear DNA content is a characteristic of a species (Brown, 1999). Knowledge
of genome size of a species is very useful to estimate ploidy levels and essential for
assessing the coverage of a genomic library, estimating the copy number of a gene in the
genome, and developing strategies for gene cloning based on genome mapping. Flow
cytometry has proven to be a fast reliable means of estimating ploidy in bermudagrass.
Taliaferro et al. (1997) developed a flow cytometry protocol for estimating nuclear DNA
content in Cynodon, and reported mean nuclear DNA contents of 2X, 3X, 4X and 6X
cytotypes were l.11±0.04pg, l.60±0.04pg, 2.25±0.13pg and 2.80±0.14pg, respectively.
Arumuganathan et al. (1999) reported 2C nuclear DNA contents for one diploid African
bermudagrass 'DTC 95' was 1.03±0.0lpg, triploid 'Tifgreen' 1.61±0.00pg and 'Tifway'
1.37±0.0lpg, tetraploid cv. 'Savannah' 1.95±0.0lpg.
5
Germplasm collection and characterization
Collection of Cynodon germplasm for culture and scientific use began around the
start of the 20th century in South Africa and the United States of America (Taliaferro,
2003). These germplasm pools were enlarged during the 20th century and provided
genetic variations for selection and breeding. The utility and value of a germplasm
collection depend largely on how well the accessions in the collection have been
characterized for trait descriptors. Characterization of accessions for cytogenetic,
morphological, physiological and agronomic traits increases the utility and importance of
the germplasm. For Cynodon, characterization of accessions for traits related to
turfgrass quality is especially important. Such traits include sod density and uniformity,
plant texture, color, growth habit, and smoothness (Turgeon, 1996; Beard, 1973), traits
that are generally visually assessed. Seed yield is very important for seed-propagated
cultivars. Percent seed set and number of seed stalks are the major components
determining seed yield in bermudagrass (Ahring et al. 1974; Kenna et al., 1983). Wofford
and Baltensperger (1985), Coffey and Baltensperger (1989), and Cluff and Baltensperger
(1991) reported heritability estimates for turfgrass characteristics in field conditions and
under shade, and seed yield and seed yield components in bermudagrass, and indicated
the performance of all characteristics evaluated should be improved using traditional
breeding methods. The major abiotic factors are temperature extremes in which low
temperature is particularly important, edaphic conditions including soil type and fertility,
and precipitation, and light. The wide diversity in bermudagrass for freeze tolerance has
been well documented (Beard et al., 1980; Anderson et al., 1988 and 1993). Major biotic
influences include disease, nematodes and insects. Martin et al. (2001a,b) showed spring
6
dead spot resistance variations exist in inter-specific hybri~s and among seed-propagated
cul ti vars.
Molecular markers in genetic studies
In recent years, a number of DNA molecular techniques based on the analysis of
information-rich nucleic acid molecules have been used in studying genetic diversity,
relatedness, phylogeny and to identify off-types of cultivars in Cynodons (Caetano
Anolles, 1998a). Caetano-Anolles et al. (1995) used DNA amplification fingerprinting
(DAF) analysis, in conjunction with parsimony (PAUP) and un-weighted pair group
cluster analysis using arithmetic means (UPGMA) to study the genetic variation of 13
bermudagrass cultivars by grouping them into several clusters and separating 'Tifway'
from the irradiation-induced mutant 'Tifway II'. The DAF analyses readily distinguished
18 Cynodon cultivars available in Australia (Ho et al. 1997). The cultivars separated into
two distinct groups comprising respectively C. dactylon x C. transvaalensis hybrids and
the Australian bermudagrasses. The DNA profiling generally has detected substantial
variation within C. dactylon var. dactylon (Caetano-Anolles et al. 1995; Ho et al. 1997;
Assefa et al. 1998), a result consistent with the great adaptive and morphological
diversity found in this cosmopolitan species (Taliaferro, 1995). Caetano-Anolles et al.
(1997) characterized the origin ofbermudagrass off-types using DAF. They showed that
Tifway was genetically stable and that off-types in Tifway plantings resulted from sod
contamination and not from somatic mutation (Caetano-Anolles et al. 1997). Genetic
instability ofTifgreen and Tifdwarfwas detected by the DAF and arbitrary signatures
from amplification profiles (ASAP) (Caetano-Anolles, 1998b ). The DNA fingerprinting,
chromosome number and morphology combined were successfully used to distinguish
7
off-types in Tifway and Tifdwarfbermudagrass (Busey et al. 1996). Assefa et al. (1998)
assessed genetic relatedness among 62 Cynodon accessions, representing eight species,
using the DAF technique, UPGMA and principal coordinate analysis. The strongest
species similarities were between C. aethiopicus and C. arcuatus, C. transvaalensis and
C. plectostachyus, and C. incompletes and C. nlemfaensis. Intraspecific variation was
least for C. aethiopicus, C. arcuatus, and C. transvaalensis. Accessions oflike taxonomic
classification were generally clustered, indicating good correlation between groupings
based on DAF profiles and traditional morphological traits used in classification (Harlan,
1970a), except the cosmopolitan C. dactylon var. dactylon and C. dactylon var.
afghanicus. Within tax.a, accessions differing in chromosome number clustered in all
instances indicating the 2x and 4x forms to be closely related (Assefa et al., 1998).
Anderson et al. (2001) used the DAF technique to compare genetically putative 'U-3'
bermudagrass ( C. dactylon) with bermudagrass currently produced in Oklahoma and sold
as 'U-3 '. Phenetic analyses using both the UPGMA algorithm and principal coordinate
analysis revealed a wide separation between the putative 'U-3' and Oklahoma 'U-3 ',
which likely resulted from mechanical contamination (Anderson et al., 2001). Random
amplified polymorphic DNA (RAPD) analyses were used to distinguish among some
well-known Cynodon cultivars used in South Africa, such as 'Bayview', 'Cape Royal',
'Florida', 'Harrismith', 'Silverton Blue', 'Skaaplaas', Tifdwarf, and 10 new cultivars, as
well as to determine the genetic variation between them by calculating genetic distances
(Roodt, et al. 2002). The amplified fragment length polymorphism (AFLP) technique
(Vos et al., 1995), combining the reliability of the RFLP (restriction fragment length
polymorphism) with the power and ease of the PCR (polymerase chain reaction)
8
technique, detected enough polymorphisms to differentiate all 27 bermudagrass
genotypes, even the closely related ones. The 27 genotypes were grouped into three
major clusters, many of which were in agreement with known pedigrees (Zhang et al.,
1999).
Objectives of the study
China is the center of origin for several important agronomic crops, notably rice
(Oryza sativa L.) and soybean (Glycine max (L.) Merr.). China also is well known for its
wealth of botanical diversity. Several important turfgrasses including Zoysiajaponica
Stend., Z. tenufolia Willd. Ex Trin., Z. matrella (L.) Merr., and Eremochloa ophiuroides
(Munro.) Hack. originated in China (Brede and Sun, 1995). There are two Cynodon
species, C. dactylon and C. arcuatus, and two botanical varieties, var. dactylon and var.
biflorus Merino in C. dactylon, taxonomically recognized in China (Editorial committee
of China Floral Acta of Chinese Academy, 1990). The diagnostic character of C. dactylon
var. biflorus, which is not included in the Harlan' classification, is two (2) florets in one
spikelet. In China, C. dactylon var. dactylon plants are widely distributed over a broad
range of environments including tropical, subtropical and warm temperate climate
regions south of the Yell ow River, and are also scattered sparsely in Xingjiang province
(Abulaiti et al., 1998), Hebei province and Beijing city. G. W. Burton surveyed turf sites
in Shanghai in 197 4 and collected a clonal plant from an old lawn that later was released
as 'Tifton 10' (Hanna, 1990). Abulaiti et al. (1998) reported that native bermudagrasses
ofXingjiang survived under -32°C in a field trial. Native bermudagrass accessions
collected in east China showed great variation in morphological traits and were used in a
breeding program (Liu et al., 1996).
9
The proposed research will focus on the characterization of a diverse group of
Cynodon accessions for selected cytogenetic, genetic, morphological, and agronomic
descriptor traits. The accessions were collected from a wide geographic expanse in
China.
Specific objectives of the investigation were:
1) To characterize the Chinese accessions for important descriptor traits
including chromosome number, fertility (seed production traits),
morphology, and DNA profiles.
2) To assess magnitude and kind of genetic variation among the Chinese
Cynodon germplasm accessions for the various descriptor traits and compare
with Cynodon germplasm standards.
10
References
Abulaiti, D.S. Shi, G. Yang. 1998. A preliminary survey of native Xingjiang
bermudagrass. Journal ofXingjiang Agricultural University. 21:124-127. (in
Chinese).
Ahring, R.M., C.M.Taliaferro, and RD.Morrison. 1974. Seed production of several
strains and hybrids of bermudagrass, Cynodon dactyl on (L.) Pers. Crop Sci.
14:93-95.
Anderson, J. A., M. P. Kenna, and C. M. Taliaferro.1988. Cold hardiness of 'Midiron'
and 'Tifgreen' bermudagrass. HortSci. 23:748-750.
Anderson, J. A., C.M. Taliaferro, and D.L. Martin.1993. Evaluating freeze tolerance of
bermudagrass in a controlled enviroment. HortSci. 28:955.
Anderson, M.P., C.M. Taliaferro, D.L. Martin, and C. S. Anderson. 2001. Comparative
DNA profiling ofU-3 turfbermudagrass strains. Crop Sci. 41:1184-1189.
Arumuganathan, K., S.P. Tallury, M.L. Fraser, A.H. Bruneau, and R. Qu. 1999. Nuclear
DNA content of thirteen turfgrass species by flow cytometry. Crop Sci. 39:1518-
1521.
Assefa S., C.M. Taliaferro, M.P. Anderson, B.G. de los Reyes, and R.M. Edwards. 1998.
Diversity among Cynodon accessions and taxa based on DNA amplification
fingerprinting. Genome. 42:465-474.
Beard, J.B. 1973. Turfgrass Science and Culture. P9-15 and P658. Prentice-Hall, Inc.,
Englewood Cliffs, N.J.
Beard, J.B., S. M. Batten, and G.M. Pittman. 1980. The comparative low temperature
hardiness of 19 bermudagrasses. Texas Agri. Expt. Stn. Progr. RPT.3835.
11
Brede, A. D., and S. Sun. 1995. Diversity ofturfgrass germplasm in the Asian Pacific rim
countries and potential for reducing genetic vulnerability. Crop Sci. 35:317-321.
Brown, T. A. 1999. Genomes. Pl-13. Bio- Scientific Publishers Ltd.
Burton G. W. 1991. A history of turfresearch at Tifton. USGA Green Section Record.
29(3): 12-14.
Burton, G. W., R. N. Gates, and G. M. Hill. 1993. Registration of 'Tifton 85'
bermudagrass. Crop Science. 33:644-645.
Burton, G.W., and W.W. Hanna. 1995. Bermudagrass.P421-430. In Barnes R.F. et al.
(ed.) Forages. Iowa state University Press, Iowa, USA.
Busey, P., A. Dudeck, C. Guy, and N. Harrison. 1996. The Florida Green, Summer: 50-
53.
Caetano-Anolles, G., L.M.Callahan, P.E. Williams, K.R.Weaver, and P.M. Gresshoff.
1995. DNA amplification fingerprinting analysis ofbermudagrass (Cynodon):
genetic relationships between species and interspecific crosses. Theor. Appl.
Genetics. 91 :228-235.
Caetano-Anolles, G., L. M. Callahan, and P.M. Gresshoff. 1997. The origin of
bermudagrass ( Cynodon) off-types inferred by DNA amplification fingerprinting.
Crop Sci .. 37: 81-87.
Caetano-Anolles, G. 1998a. DNA analysis ofturfgrass genetic diversity. Crop sci.
38:1415-1424.
Caetano-Anolles, G.1998b. Genetic instability ofbermudagrass (Cynodon) cultivars
'Tifgreen'and 'Tifdwarf detected by DAF and ASAP analysis of accessions and
off-types. Euphytica. 101:165-173.
12
Cluff, G.J. and A.A. Baltensperger. 1991. Heritability estimates for seed yield and seed
yield components in bermudagrass. NM Agri. Exp. Stn. Bulletin 759.
Coffey, B.N. and A.A. Baltensperger. 1989. Heritability estimates for selected turfgrass
characteristics ofbermudagrass evaluated under shade. Pl 17-119.
The 6th International Research Conference, Tokyo.
de Silva, P.H.A.U., and R.W. Snayton. 1995. Chromosome number in Cynodon dactylon
in relation to ecological conditions. Annals of Botany. 76:535-537.
de Wet, J.M.J., and J.R. Harlan. 1970. Biosystematics of Cynodon L.C.Rich.
(Gramineae). Taxon. 19:565-569.
Editorial committee of Chinese Academy. 1990. Chinese Floral Acta. Science Press,
Beijing. 10:82-85. (in Chinese).
Forbes, I. and G.W. Burton. 1963. Chromosome number and meiosis in some Cynodon
species and hybrids. Crop Science. 3:75-79.
Hanna, W.W., G.W. Burton, and AW. Johnson. 1990. Registration of 'Tifton 10' turf
bermudagrass. Crop Sci. 30:1355-1356.
Harlan, J.R., and J.M.J. de Wet. 1969. Sources of variation in Cynodon dactylon (L.)
Pers. Crop Sci. 9:774-778.
Harlan, J.R., J.M.J. de Wet, W.W. Huffine, and J.R. Deakin. 1970a. A guide to the
species of Cynodon ( Gramineae ). Okla. Agric. Exp. Stn. Bulletin B-673.
Harlan, J.R., J.M.J. de Wet, and K.M. Rawal. 1970b. Geographic distribution of the
species of Cynodon L.C. Rich (Gramineae). East Afri. Agric. For. J. 36:220-226.
Harlan, J.R. 1970c. Cynodon species and their value for grazing and hay. Herbage
Abstracts. 40 (3):233-238.
13
Harlan, J.R., J.M.J. de Wet, K.M. Rawal, M. R. Felder, and W. L. Richardson. 1970d.
Cytogenetic studies in Cynodon L. C. Rich (Gramineae). Crop Sci. 10:288-291.
Ho, C.Y., S.J. McMaugh, A.N. Wilton, I.J. McFarlane, and A.G. Mackinlay. 1997. DNA
amplification variation within cultivars of turf-type couch grasses (Cynodon spp.).
Plant Cell Reports. 16:797-801.
Hurcombe, R. 1947. A cytological and morphological study of cultivated Cynodon
species. J. So. Afr. Bot. 13:107-116.
Kenna, M.P., C.M. Taliaferro, and W.L. Richardson. 1983. Comparative fertility and
seed yields of parental bermudagrass clones and their singlecross Fl and F2
populations. Crop Sci. 23:1133-1135.
Liu, J., S. He, Y. Liu, and S. Chen. 1996. Morphological traits and turf value of
bermudagrass from east China. Plant Resources and Enviroment. 5:18-22.( in
Chinese).
Martin, D.L., D.E. Bell, J.H. Baird, C.M. Taliaferro, N. A. Tisserat, R. M. Kuzmic, and
D.D. Dobson. 2001a. Spring dead spot resistance and quality of seeded
bermudagrasses under different mowing heights. Crop Sci. 41 :451-456.
Martin, D.L., D.E. Bell, J.H. Baird, C.M. Taliaferro, N. A. Tisserat, and D.D. Dobson.
2001b. Spring dead spot resistance of inter-specific hybrid bermudagrasses.
International Turfgrass Society Research Journal. 9:685-688.
Moffett A.A., and R. Hurcombe. 1949. Chromosome number of South African grasses.
Heredity. 3:369-373.
Powell, J.B., G.W. Burton and C.M. Taliaferro. 1968. A hexaploid clone from a
tetraploid X diploid cross in Cynodon. Crop Science. 8:184-185.
14
Roodt, R., J.J. Spies and T.H. Burger. 2002. Preliminary DNA fingerprinting of the turf
grass Cynodon dactylon (Poaceae: Chloridoideae). Bothalia. 32: 117-122.
Royal Botanic Gardens, Kew. 1999. World grasses database. Published on the internet;
http://www.rbgkew.org.uk/herbarium/gramineae/wrldgr.htm (accessed Dec. 22,
2001).
Taliaferro, C.M. 1995. Diversity and vulnerability of Bermuda turfgrass species. Crop
Sci. 35:327-332.
Taliaferro, C.M., A. A. Hopkins, J. C. Henthorn, C. D. Murphy, and R. M. Edwards.
1997. Use of flow cytometry to estimate ploidy level in Cynodon species.
Intematonal Turfgrass Society Research Journal. 8:385-392.
Taliaferro, C.M. 2003. Bermudagrass (Cynodon (L.) Rich). P. 235-256. In Casler, M.D.
and R. Duncan (ed.) Turfgrass Biology, Genetics, and Cytotaxonomy. Sleeping
Bear Press.
Taliaferro, C.M., F.M. Rouquette, Jr., and P. Mislevy. 2004. Bermudagrass and Stargrass.
In Moser L., L. Sollenberger, and B. Burson. (ed.) Warm-Season Grasses. Am.
Soc. Agron. Monograph. (in press).
Turgeon, A.J. 1996. Turfgrass Management. P 4-12.Prentice-Hall, Inc.
Vos, P., R. Rogers, M. Bleeker, M. Reijans, T. van de Lee, M. Homes, A. Frijters, J. Pot,
J. Peleman, m. Kuiper and M. Zabeau. 1995. AFLP: a new technique for DNA
fingerprinting. Nucleic acids research. 23:4407-4414.
Wofford, D.S. and A.A. Baltensperger. 1985. Heritability estimates for turfgrass
characteristics in bermudagrass. Crop Sci. 25: 133-136.
Zhang, L.-H., P. Ozias-Akins, G. Kochert, S. Kresovich, R. Dean and W. Hanna. 1999.
15
Differentiation ofbennudagrass (Cynodon spp.) genotypes by AFLP analyses.
Theor. Appl. Genet. 98:895-902.
16
CHAPTER II
PLOIDY DETERMINATION OF CHINESE CYNODON ACCESSIONS BY FLOW CYTOMETRY
ABSTRACT
Chromosome numbers varying from 2n=2x=l8 to 2n=6x=54 have been
reported in, bermudagrass, Cynodon dactylon (L.) Pers. Bermudagrass is distributed
over much of the southern two-thirds of China but no information is available on
chromosome number variations within this germplasm pool. Accordingly, this research
was conducted to determine the ploidy level of 127 bermudagrass accessions collected
over a wide geographic expanse of China. Ploidy was estimated by measuring the
nuclear DNA content (pg 2C-1 nucleus) using flow cytometry. For cases where ploidy
level was not definitive, somatic chromosome number was determined using a
conventional cell squash technique. Four ploidy cytotypes were found among the 127
accessions, triploid (2n=3x=27), tetraploid (2n=4x=36), pentaploid (2n=5x=45) and
hexaploid (2n=6x=54). The hexaploid cytotype was most prevalent (89%), had nuclear
genome sizes ranging from 1.96 to 2.30 pg 2C-1 nucleus, and were distributed over the
geographic range of collection. Six hexaploid and three pentaploid accessions from
southeast China had respective nuclear genome size of2.37 to 2.49 pg/2C and 2.90
to3.13 pg/2C. Three triploid (2n=3x=27) accessions with genome sizes of 1.55 to 1.65
17
pg/ 2C nucleus-1 were collected in Sichuan province, and they probably were
introductions from abroad.
18
INTRODUCTION
Cynodon L. C. Rich. is a small genus containing nine species and ten varieties
taxonomically classified by Harlan et al. (1970a), in tribe Cynodonteae and family
Gramineae (Poaceae). While most species and varieties have restricted distributions, C.
dactylon (L.) Pers. var. dactylon is cosmopolitan. It is distributed across all continents
and islands between about 45° N and 45° S latitudes, even penetrating to 53° Nin Europe
(Harlan and de Wet, 1969; Harlan et al., 1970c). The ubiquitous and cosmopolitan
species economically is the most important in the genus and because of its wide use for
forage, turf, soil stabilization and remediation of spoil site in tropical and warmer
temperate regions of the world (Burton, 1947; Harlan, 1970b; Taliaferro, 1995;
Taliaferro, 2003).
Two basic chromosome numbers have been reported in Cynodon. Earlier
reports indicated the basic chromosome number of Cynodon to be 10 (Hurcombe, 1947;
Moffett and Hurcombe, 1949). However, more research results firmly established the
correct basic number of Cynodon to be nine (Forbes and Burton, 1963; de Wet and
Harlan, 1971; Harlan et al. 1970d; de Silva and Snaydon, 1995). The small size of
Cynodon chromosomes, frequent fragments found in cell squash preparations, and
chromosome satellites easily interpreted as whole chromosome may have contributed to
the erroneous determination of 10 as the basic number (Forbes and Burton, 1963; de
Silva and Snaydon, 1995).
Diploid (2n=2x=18), triploid (2n=3x=27), tetraploid (2n=4x=36), pentaploid
(2n=5x=45), and hexaploid (2n=6x=54) have been reported in Cynodon (Hurcombe,
19
1947; Moffett and Hurcombe, 1949; Forbes and Burton, 1963; de Wet and Harlan, 1971;
Harlan et al. 1970d; de Silva and Snaydon, 1995; Hanna et al., 1990). Diploid and
tetraploid are the predominant cytotypes found in nature. Most of the triploid, pentaploid
and hexaploid cytotypes have been discovered among the progeny of intraspecific and
interspecific artificial hybridizations. Powell et al. (1968a) reported a hexaploid progeny
in a cross of C. dactylon (2n=4x=36) by C. transvaalensis (2n=2x=18). Johnston (1975)
observed pentaploid (2n=5x=45) hybrids in crosses oftetraploid C. dactylon and a
hexaploid from a cross of C. barberi (2n=2x=18) and C. dactylon (2n=4x=36).
'Tifton85', an Fl hybrid of C. dactylon by C. nlemfuensis, is a pentaploid (Burton et al.,
1993). Triploid hybrid cytotypes have been commonly produced via inter- and intra
specific crosses of diploid and tetraploid parents, which could belong to same
taxonomical species or different species (Harlan et al. 1970d). Interspecific crosses
involving tetraploid C. dactylon and diploid C. transvaalensis have been the principal
breeding method for producing superior turf cultivars (Burton, 1991 ).
Flow cytometry has been successfully used to estimate ploidy levels by
measuring the nuclear DNA content in many grass species (Keeler et al., 1987; Hopkins
et al., 1996; Taliaferro et al., 1997; Huff and Palazzo, 1998; Arumuganathan et al., 1999;
Johnson et al. 1998, 2001). Taliaferro et al. (1997) developed a flow cytometric protocol
for estimating nuclear DNA content in Cynodon. Arumuganathan et al. (1999) used flow
cytometry to determine ploidy in thirteen turfgrass species including three Cynodon
cytotypes. Once a certain correlation between ploidy level and nuclear DNA content of a
species has been established, flow cytometry is an easy way to help estimate ploidy level
in a particular turfgrass species (Riordan et al., 1998)
20
There are two Cynodon species, C. dactylon and C. arcuatus, taxonomically
recognized in China (Anonymous, 1990). In China, Cynodon plants are indigenous and
widely distributed over a broad geographic range encompassing tropical, subtropical, and
warm temperate climate regions in south of the Yellow River and east of the Tibet
highlands (Anonymous, 1990; Liu et al., 1996; Wu et al. 2001). Cynodon is sparsely
distributed in more temperate regions including Xingjiang, Hebai and Beijing (Abulaiti et
al., 1998). G. W. Burton collected a clonal plant in 1974 from a Shanghai lawn that was
subsequently determined to be a hexaploid and released as 'Tifton 1 O' (Hanna et al.,
1990). No additional information on ploidy level has been reported for Cynodon of
Chinese origin. This research was conducted to determine ploidy of 127 Cynodon
accessions collected from aver a wide geographic range in China.
21
MATERIALS AND METHODS
Plant materials
Plant materials consisted of 130 Cynodon accessions including 127 accessions
collected in China and three U.S. commercial cultivars with known chromosome number
and nuclear DNA content (Table 1 ). The Chinese Cynodon accessions were collected
from eleven provinces ranging from tropical Hainan Island to the temperate climate
region around Beijing.
The plants were grown in a greenhouse at the Agronomy Research Station,
Oklahoma State University, Stillwater, OK, in 15 cm diameter pots containing Metro
Mix 250 growing medium (Scotts-Sierra Horticultural Products Co., Marysville, OH).
They were watered daily and fertilized biweekly with M-77 Peat-lite Special water
soluble fertilizer (Scotts-Sierra Horticultural Products Co., Marysville, OH). All plants
were actively growing and healthy at the time of the sampling.
Flow cytometry
Flow cytometry procedures described by Taliaferro et al. (1997) were used to
measure nuclear DNA content. Flow cytometry analyses of prepared materials were
conducted on a Becton-Dickinson FACSCalibur Flow Cytometer (Becton Dickinson,
CA) with an argon laser emitting at 488 nm for excitation of propidium iodide (PI) at
Flow Cytometry Laboratory of Oklahoma State University.
Tissue samples were prepared for flow cytometry by collecting 20-25 young
shoots and excising the meristematic regions from just beyond the last visible node. The
excised tissue was placed in a 60 by 15 mm plastic petri dish on ice. The leaf tissue was
22
then chopped into chips as thin as possible with a razor blade in about 0.4 ml of ice-cold
buffer solution (10 mM Tris buffer pH 7.6, 1 mM dihydrate sodium citrate, 2 mM
anhydrous MgCL2). Approximately 200 µ1 of nuclei extraction solution was then passed
through a 35 µm nylon mesh filter. The extracted samples were then injected with 6 µl of
PI (Sigma, St. Louis, Missouri) stain solution (2.4 mg PI /ml) and 2 µl of a 9: 1 dilution of
RNAase (R-4642; Sigma, St. Louis, Missouri). Deionised water was used as the solvent
for the PI stain and the diluent for RNAase. Samples were then kept in an ice chest at
least 15 min before flow cytometric measurement. The mean nuclear DNA content of
each plant sample, measured in picograms (pg), was based on 5000 scanned nuclei.
Channel catfish (Ictalurus punctatus) or domestic swine (Sus scrofa) blood cells were
used as internal standards. Nuclear DNA contents of blood cells of channel catfish and
domestic swine were 2.0 and 5.67 pg/2C, respectively (Taliaferro et al. 1997). For every
plant sample at least three measurements (replicates) were obtained in three or more
different runs (dates). Sample DNA content was calculated with dividing the mean value
of the sample channel by mean value of the internal standard channel, then multiplying
the result by DNA content of internal standard used.
Cytology
Somatic chromosome number was determined for all accessions having DNA
content outside the reported range for respective ploidy levels (Taliaferro et al., 1997;
Arumuganathan et al., 1999). Additionally, somatic chromosome number was determined
for selected accessions having DNA content within the reported range to confirm the
accuracy of the flow cytometry data. Somatic chromosome numbers were determined
using conventional squashes of shoot tip somatic cells under a light microscope equipped
23
with a digital camera system. The somatic cell squashes were prepared from shoot apical
meristem tissues as described by Powell (1968b) with minor modifications. Briefly,
actively growing shoot tips were stripped, and the stripped shoot tips were cut
longitudinally to expose the apical meristem. As a pretreatment to soften tissues, the split
shoot tips were placed into a saturated solution of monobromonaphthalene for 2 hours.
Then the pretreated shoot tips were fixed in 3: 1 ethanol: acetic acid solution for 24 hours
at room temperature. The fixed shoot tips were digested in cytolase (PCLS, DSM Food
Specialties, Charlotte, NC) solution at 37°C for 40, 60, and 70 min for triploid, tetraploid
and pentaploid, and hexaploid samples, respectively. Chromosomes were stained with
acetocarmine.
24
RESULTS AND DISCUSSION
The nuclear DNA contents of the 127 Chinese Cynodon accessions and three
commercial cultivars are presented in Table 1. The standard deviations of DNA content
measurements ranged from 0.01 to 0.08, demonstrating that flow cytometry was very
precise. These results are consistent with previous reports regarding the precision of flow
cytometry in Cynodon plants (Taliaferro et al., 1997; Arumuganathan et al., 1999). The
DNA contents of the Tifton 10, Tifgreen and Uganda used as external standards highly
agreed with the previous reported results by Taliaferro et al. (1997) and Arumuganathan
et al. (1999).
Nuclear genome size among the 127 Chinese accessions ranged from 1.55 pg
/2C to 3.13 pg /2C nucleus (Table 1 ). Based on previously reported data (Taliaferro et al.,
1997; Arumuganathan et al., 1999), diploid, triploid, tetraploid, and hexaploid cytotypes
were indicated by respective nuclear genome sizes of 1.03 to 1.14, 1.37 to 1.62, 1.95 to
2.36, and 2.64 to 2.93 pg DNA 2C-1 nucleusBased on these ranges two accessions were
classified as triploid, 116 accessions as tetraploid, and one accessions as hexaploid (see
Inferred ploidy in Table 1 ).
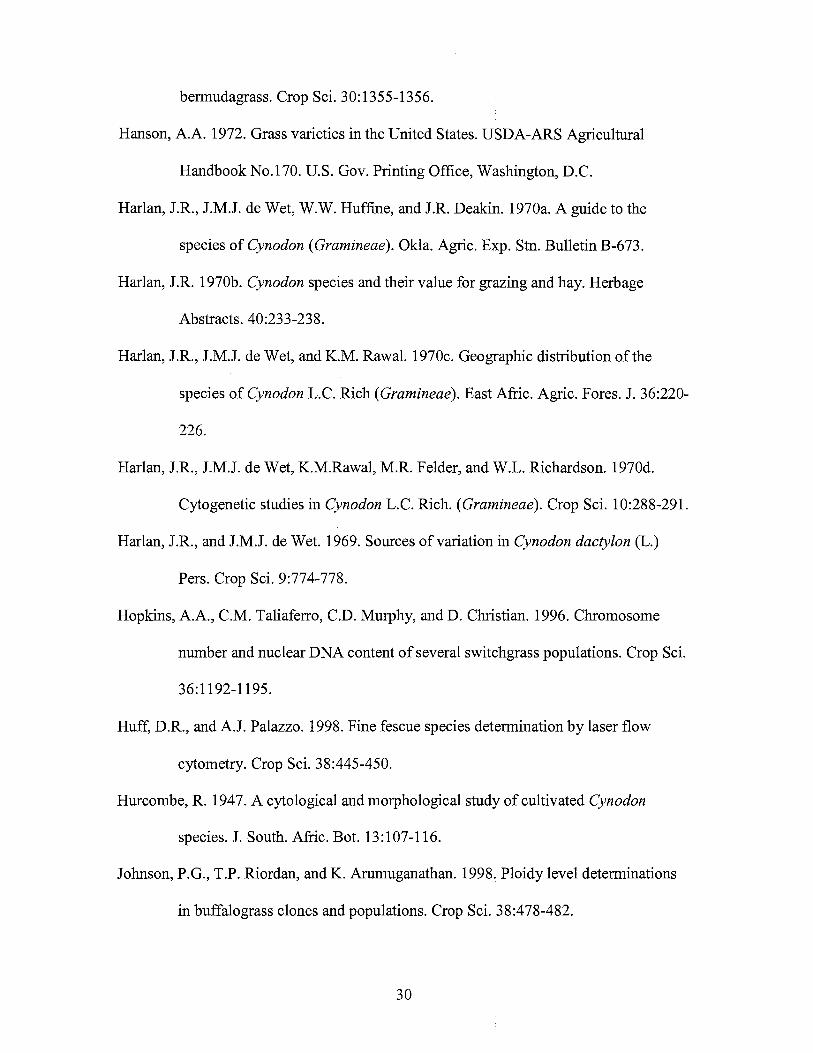
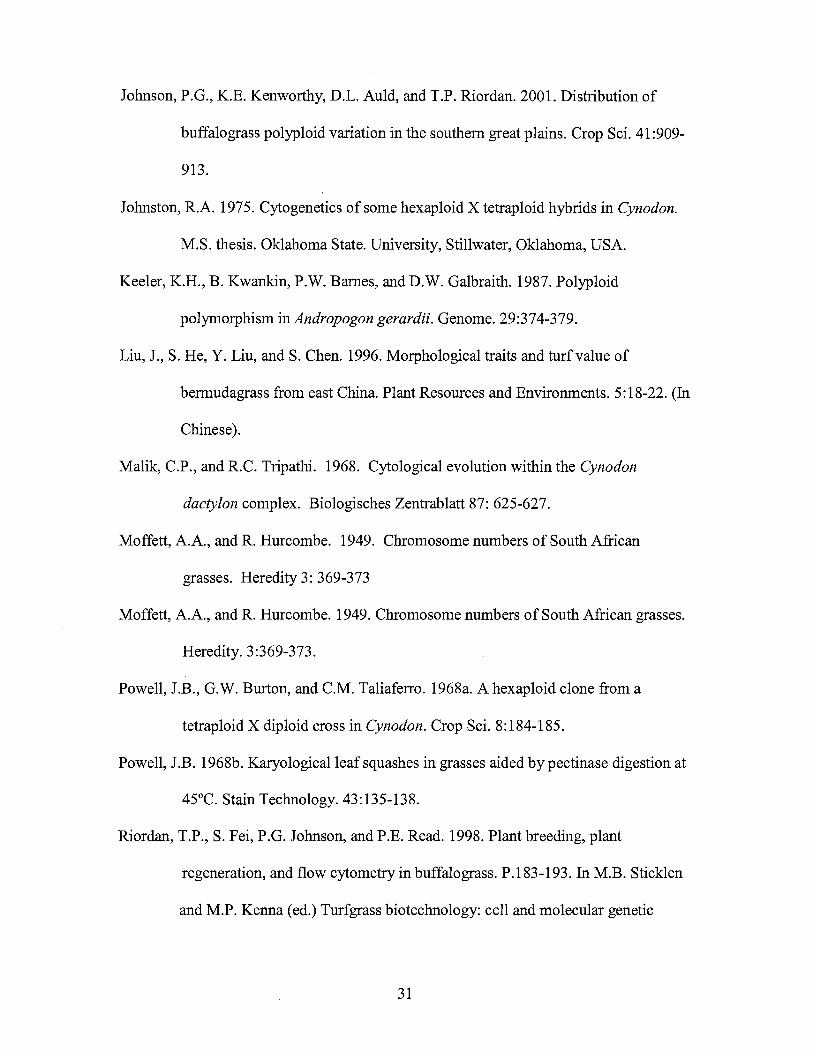
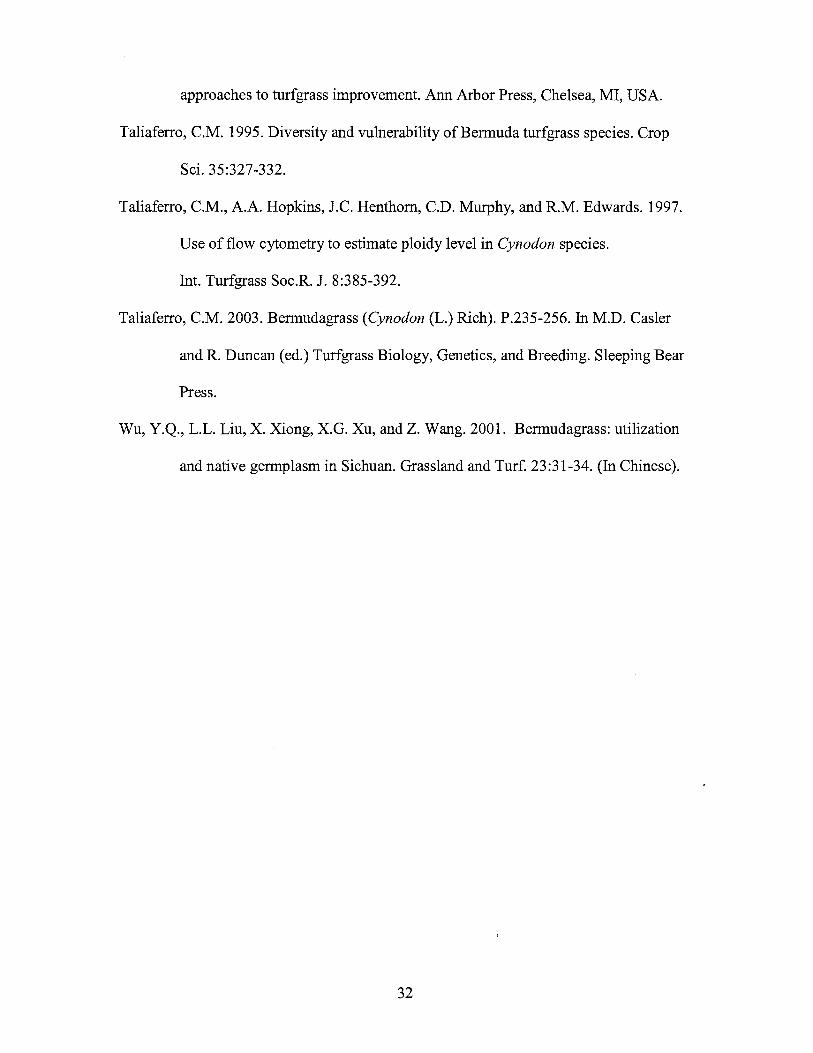
Nine accessions had genome sizes outside the previously reported ranges.
Somatic chromosome counts determined for these nine accessions indicated one triploid
(A12260), three pentaploids (A12348, A12352 and A12365), and five hexaploids
(A12317, A12318, A12319, A12356 and A12358) (Table 2; Fig. 1). Somatic
chromosome counts for A12272, A12282, A12257 and A12360 confirmed that the three
inferred ploidy levels based on nuclear DNA contents were correct (Table 2).
25
Chinese literature indicates only two species of Cynodon, namely C. dactylon
and C. arcuatus taxonomically recognized in China (Anonymous, 1990). All but three of
the 127 accessions are considered to belong to the taxon C. dactylon var. dactylon as
described by Harlan et al. (1969, 1970a). Pentaploid and hexaploid accessions are
included in this group based on similarity of morphological features compared to
tetraploid accessions. The descriptions of C. dactylon var. dactylon by Harlan et al.
(1969, 1970a) do not indicate it to contain other than tetraploid cytotypes, but this may
have resulted from absence of such plants in the collection on which studies were
conducted leading to the revision of the genus by Harlan and colleagues. The three
triploid accessions were collected in Sichuan province and are morphologically similar to
hybrids from C. dactylon var. dactylon by C. transvaalensis crosses. Triploid turf-type
Cynodon cultivars have been widely commercially imported into this region (Wu et al.,
2001).
The 116 tetraploid Cynodon accessions (89.23%) originated from 11 provincial
regions clearly indicating this to be the predominant cytotype over the geographic
expanse represented by the collection. In three western provinces (Sichuan, Yunnan and
Chongqing) 95 of 98 accessions collected were tetraploids. In the other eight eastern and
southern provincial regions 20 of the 29 accessions collected samples were tetraploids.
Obviously, tetraploids were the dominant ploidy level in China. The wide distribution of
the tetraploid cytotype in China is consistent with previous reports (Harlan and de Wet,
1969; Harlan et al. 1970a) that tetraploid C. dactylon var. dactylon is truly cosmopolitan
being distributed over a wide geographic expanse.
26
Six of 14 accessions (43%) collected from Shanghai, Jiangsu and Zhejiang
provinces were hexaploids. Tifton 10 is a hexaploid and was collected as a clonal plant
in Shanghai in 1974 by G.W. Burton (Hanna et al., 1990). The hexaploid cytotype may
therefore be relatively more prevalent in this geographic region than in the other regions,
though a larger sampling of plants is needed to accurately assess its relative prevalence.
The fact that only 6 of the 127 accessions (4.72%) were hexaploids indicates that the
cytotype is sparsely distributed over the entire geographic region of collection relative to
the tetraploid cytotype. Only a few hexaploid plants have previously been reported in
Cynodon (Moffett and Hurcombe, 1949; Powell et al., 1968; Felder, 1967; Johnston,
1975; Malik and Tripathi, 1968).
This is the first report of pentaploid Cynodon plants occurring naturally. The
pentaploids were collected in subtropical environments, two from Hannan Island and the
third from Fujian province. All three pentaploid accessions had poor winter survival in
Stillwater, Oklahoma ( data not shown). The only previous report of pentaploid Cynodon
plants was by Johnston (1975) who found three pentaploid plants among progeny from a
hexaploid plant (derived from interspecific hybridization of C. barberi and C. dactylon)
crossed with a tetraploid C. dactylon plant.
Polyploid polymorphism in grass is not unusual. However Harlan et al. (1970)
considered C. dactylon var. dactylon to be exclusively of the tetraploid cytotype based on
the absence ofhexaploid cytotypes in their Cynodon collection. The degree ofpolyploid
polymorphism found in this study provides new information relative to the extent of
polyploidy polymorphism in Cynodon dactylon var. dactylon. Additional systematic
27
collections and cytogenetic studies of the polyploids may provide insight in the species
evolution.
28
REFERENCES
Abulaiti, D.S. Shi, and G. Yang. 1998. A preliminary survey of native Xingjiang
bermudagrass. J. Xingjiang Agric. Univ. 21:124-127. (In Chinese).
Anonymous. 1990. Chinese Floral Acta. Science Press.Beijing. 10:82-85. (In Chinese).
Arumuganathan, K., S.P. Tallury, M.L. Fraser, A.H. Bruneau, and R. Qu. 1999. Nuclear
DNA content of thirteen turfgrass species by flow cytometry. Crop Sci.
39:1518-1521.
Burton, G.W. 1947. Breeding bermudagrass for the southeastern United States. Agron. J.
39:551-569.
Burton, G.W. 1991. A history ofturfresearch at Tifton. USGA Green Section Record.
29: 12-14.
Burton, G.W., R.N. Gates, and G.M. Hill. 1993. Registration of 'Tifton 85'
bermudagrass. Crop Sci. 33:644-645.
De Silva, P.H.A.U., and R.W. Snaydon. 1995. Chromosome number in Cynodon
dactylon in relation to ecological conditions. Annals of Botany. 76:535-537.
de Wet, J .M.J ., and J .R. Harlan. 1971. South African species of Cynodon (gramineae ).
J. S. Afric. Bot. 37:53-56).
Felder, M.R. 1967. Chromosome associations in triploid Cynodon hybrids. M.S. Thesis.
Oklahoma State. Univ., Stillwater.
Forbes, I., and G.W. Burton. 1963. Chromosome numbers and meiosis in some Cynodon
species and hybrids. Crop Sci. 3:75-79.
Hanna, W.W., G.W. Burton, and A.W. Johnson. 1990. Registration of 'Tifton 10' turf
29
bermudagrass. Crop Sci. 30:1355-1356.
Hanson, A.A. 1972. Grass varieties in the United States. USDA-ARS Agricultural
Handbook No.170. U.S. Gov. Printing Office, Washington, D.C.
Harlan, J.R., J.M.J. de Wet, W.W. Huffine, and J.R. Deakin. 1970a. A guide to the
species of Cynodon (Gramineae). Okla. Agric. Exp. Stn. Bulletin B-673.
Harlan, J.R. 1970b. Cynodon species and their value for grazing and hay. Herbage
Abstracts. 40:233-238.
Harlan, J.R., J.M.J. de Wet, and K.M. Rawal. 1970c. Geographic distribution of the
species of Cynodon L.C. Rich (Gramineae). East Afric. Agric. Fores. J. 36:220-
226.
Harlan, J.R., J.M.J. de Wet, K.M.Rawal, M.R. Felder, and W.L. Richardson. 1970d.
Cytogenetic studies in Cynodon L.C. Rich. (Gramineae). Crop Sci. 10:288-291.
Harlan, J.R., and J.M.J. de Wet. 1969. Sources of variation in Cynodon dactylon (L.)
Pers. Crop Sci. 9:774-778.
Hopkins, A.A., C.M. Taliaferro, C.D. Murphy, and D. Christian. 1996. Chromosome
number and nuclear DNA content of several switchgrass populations. Crop Sci.
36:1192-1195.
Huff, D.R., and A.J. Palazzo. 1998. Fine fescue species determination by laser flow
cytometry. Crop Sci. 38:445-450.
Hurcombe, R. 1947. A cytological and morphological study of cultivated Cynodon
species. J. South. Afric. Bot. 13:107-116.
Johnson, P.G., T.P. Riordan, and K. Arumuganathan. 1998. Ploidy level determinations
in buffalograss clones and populations. Crop Sci. 38:478-482.
30
Johnson, P.G., K.E. Kenworthy, D.L. Auld, and T.P. Riordan. 2001. Distribution of
buffalograss polyploid variation in the southern great plains. Crop Sci. 41 :909-
913.
Johnston, R.A. 197 5. Cytogenetics of some hexaploid X tetraploid hybrids in Cynodon.
M.S. thesis. Oklahoma State. University, Stillwater, Oklahoma, USA.
Keeler, K.H., B. Kwankin, P.W. Barnes, and D.W. Galbraith. 1987. Polyploid
polymorphism inAndropogon gerardii. Genome. 29:374-379.
Liu, J., S. He, Y. Liu, and S. Chen. 1996. Morphological traits and turf value of
bermudagrass from east China. Plant Resources and Environments. 5:18-22. (In
Chinese).
Malik, C.P., and R.C. Tripathi. 1968. Cytological evolution within the Cynodon
dactylon complex. Biologisches Zentrablatt 87: 625-627.
Moffett, A.A., and R. Hurcombe. 1949. Chromosome numbers of South African
grasses. Heredity 3: 369-373
Moffett, A.A., and R. Hurcombe. 1949. Chromosome numbers of South African grasses.
Heredity. 3:369-373.
Powell, J.B., G.W. Burton, and C.M. Taliaferro. 1968a. A hexaploid clone from a
tetraploid X diploid cross in Cynodon. Crop Sci. 8:184-185.
Powell, J.B. 1968b. Karyological leaf squashes in grasses aided by pectinase digestion at
45°C. Stain Technology. 43:135-138.
Riordan, T.P., S. Fei, P.G. Johnson, and P.E. Read. 1998. Plant breeding, plant
regeneration, and flow cytometry in buffalograss. P.183-193. In M.B. Sticklen
and M.P. Kenna (ed.) Turfgrass biotechnology: cell and molecular genetic
31
approaches to turfgrass improvement. Ann Arbor Press, Chelsea, MI, USA.
Taliaferro, C.M. 1995. Diversity and vulnerability of Bermuda turfgrass species. Crop
Sci. 35:327-332.
Taliaferro, C.M., A.A. Hopkins, J.C. Henthorn, C.D. Murphy, and R.M. Edwards. 1997.
Use of flow cytometry to estimate ploidy level in Cynodon species.
Int. Turfgrass Soc.R. J. 8:385-392.
Taliaferro, C.M. 2003. Bermudagrass (Cynodon (L.) Rich). P.235-256. In M.D. Casler
and R. Duncan (ed.) Turfgrass Biology, Genetics, and Breeding. Sleeping Bear
Press.
Wu, Y.Q., L.L. Liu, X. Xiong, X.G. Xu, and Z. Wang. 2001. Bermudagrass: utilization
and native germplasm in Sichuan. Grassland and Turf. 23:31-34. (In Chinese).
32
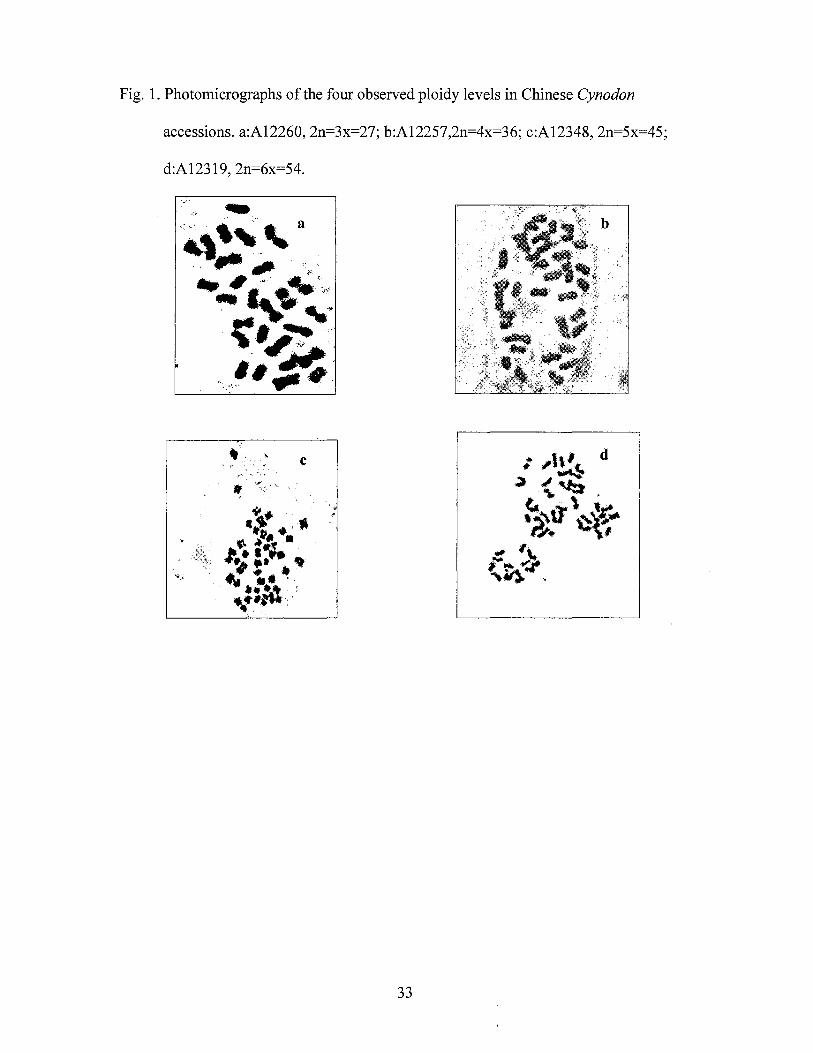
Fig. 1. Photomicrographs of the four observed ploidy levels in Chinese Cynodon
accessions. a:A12260, 2n=3x=27; b:A12257,2n=4x=36; c:A12348, 2n=5x=45;
d:A12319, 2n=6x=54.
33
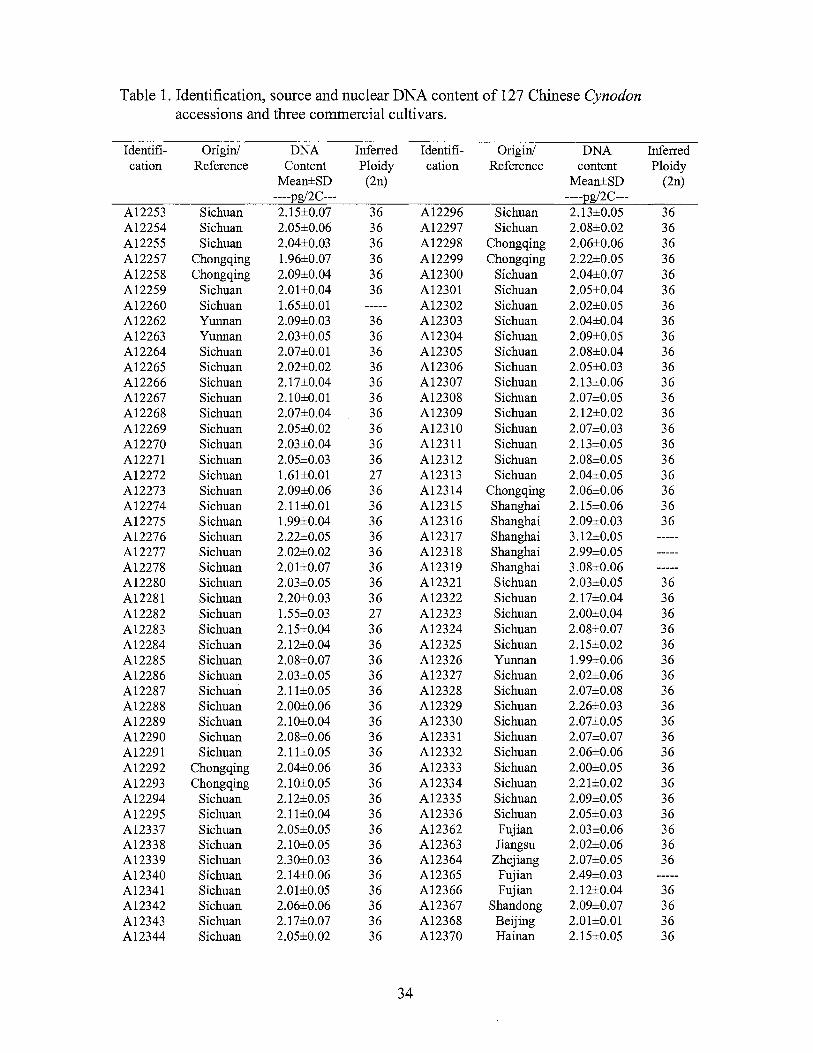
Table 1. Identification, source and nuclear DNA content of 127 Chinese Cynodon accessions and three commercial cultivars.
Identifi- Origin/ DNA Inferred Identifi- Origin/ DNA Inferred cation Reference Content Ploidy cation Reference content Ploidy
Mean±SD (2n) Mean±SD (2n) ----_eg/2C--- ----_eg/2C---
A12253 Sichuan 2.15±0.07 36 A12296 Sichuan 2.13±0.05 36 A12254 Sichuan 2.05±0.06 36 A12297 Sichuan 2.08±0.02 36 A12255 Sichuan 2.04±0.03 36 A12298 Chongqing 2.06±0.06 36 A12257 Chongqing 1.96±0.07 36 A12299 Chongqing 2.22±0.05 36 A12258 Chongqing 2.09±0.04 36 A12300 Sichuan 2.04±0.07 36 A12259 Sichuan 2.01±0.04 36 A12301 Sichuan 2.05±0.04 36 A12260 Sichuan 1.65±0.01 A12302 Sichuan 2.02±0.05 36 A12262 Yunnan 2.09±0.03 36 A12303 Sichuan 2.04±0.04 36 A12263 Yunnan 2.03±0.05 36 A12304 Sichuan 2.09±0.05 36 A12264 Sichuan 2.07±0.01 36 A12305 Sichuan 2.08±0.04 36 A12265 Sichuan 2.02±0.02 36 Al2306 Sichuan 2.05±0.03 36 A12266 Sichuan 2.17±0.04 36 A12307 Sichuan 2.13±0.06 36 Al2267 Sichuan 2.10±0.01 36 A12308 Sichuan 2.07±0.05 36 A12268 Sichuan 2.07±0.04 36 A12309 Sichuan 2.12±0.02 36 A12269 Sichuan 2.05±0.02 36 A12310 Sichuan 2.07±0.03 36 A12270 Sichuan 2.03±0.04 36 A12311 Sichuan 2.13±0.05 36 A12271 Sichuan 2.05±0.03 36 A12312 Sichuan 2.08±0.05 36 A12272 Sichuan 1.61±0.01 27 A12313 Sichuan 2.04±0.05 36 A12273 Sichuan 2.09±0.06 36 Al2314 Chongqing 2.06±0.06 36 A12274 Sichuan 2.11±0.01 36 A12315 Shanghai 2.15±0.06 36 A12275 Sichuan 1.99±0.04 36 A12316 Shanghai 2.09±0.03 36 A12276 Sichuan 2.22±0.05 36 A12317 Shanghai 3.12±0.05 A12277 Sichuan 2.02±0.02 36 A12318 Shanghai 2.99±0.05 A12278 Sichuan 2.01±0.07 36 A12319 Shanghai 3.08±0.06 A12280 Sichuan 2.03±0.05 36 A12321 Sichuan 2.03±0.05 36 A12281 Sichuan 2.20±0.03 36 A12322 Sichuan 2.17±0.04 36 A12282 Sichuan 1.55±0.03 27 A12323 Sichuan 2.00±0.04 36 A12283 Sichuan 2.15±0.04 36 A12324 Sichuan 2.08±0.07 36 A12284 Sichuan 2.12±0.04 36 A12325 Sichuan 2.15±0.02 36 A12285 Sichuan 2.08±0.07 36 A12326 Yunnan 1.99±0.06 36 A12286 Sichuan 2.03±0.05 36 Al2327 Sichuan 2.02±0.06 36 A12287 Sichuan 2.11±0.05 36 A12328 Sichuan 2.07±0.08 36 A12288 Sichuan 2.00±0.06 36 A12329 Sichuan 2.26±0.03 36 A12289 Sichuan 2.10±0.04 36 A12330 Sichuan 2.07±0.05 36 A12290 Sichuan 2.08±0.06 36 A12331 Sichuan 2.07±0.07 36 A12291 Sichuan 2.11±0.05 36 A12332 Sichuan 2.06±0.06 36 A12292 Chongqing 2.04±0.06 36 A12333 Sichuan 2.00±0.05 36 A12293 Chongqing 2.10±0.05 36 A12334 Sichuan 2.21±0.02 36 A12294 Sichuan 2.12±0.05 36 A12335 Sichuan 2.09±0.05 36 A12295 Sichuan 2.11±0.04 36 A12336 Sichuan 2.05±0.03 36 A12337 Sichuan 2.05±0.05 36 Al2362 Fujian 2.03±0.06 36 A12338 Sichuan 2.10±0.05 36 A12363 Jiangsu 2.02±0.06 36 A12339 Sichuan 2.30±0.03 36 A12364 Zhejiang 2.07±0.05 36 Al2340 Sichuan 2.14±0.06 36 Al2365 Fujian 2.49±0.03 A12341 Sichuan 2.01±0.05 36 A12366 Fujian 2.12±0.04 36 A12342 Sichuan 2.06±0.06 36 A12367 Shandong 2.09±0.07 36 A12343 Sichuan 2.17±0.07 36 A12368 Beijing 2.01±0.01 36 A12344 Sichuan 2.05±0.02 36 A12370 Hainan 2.15±0.05 36
34
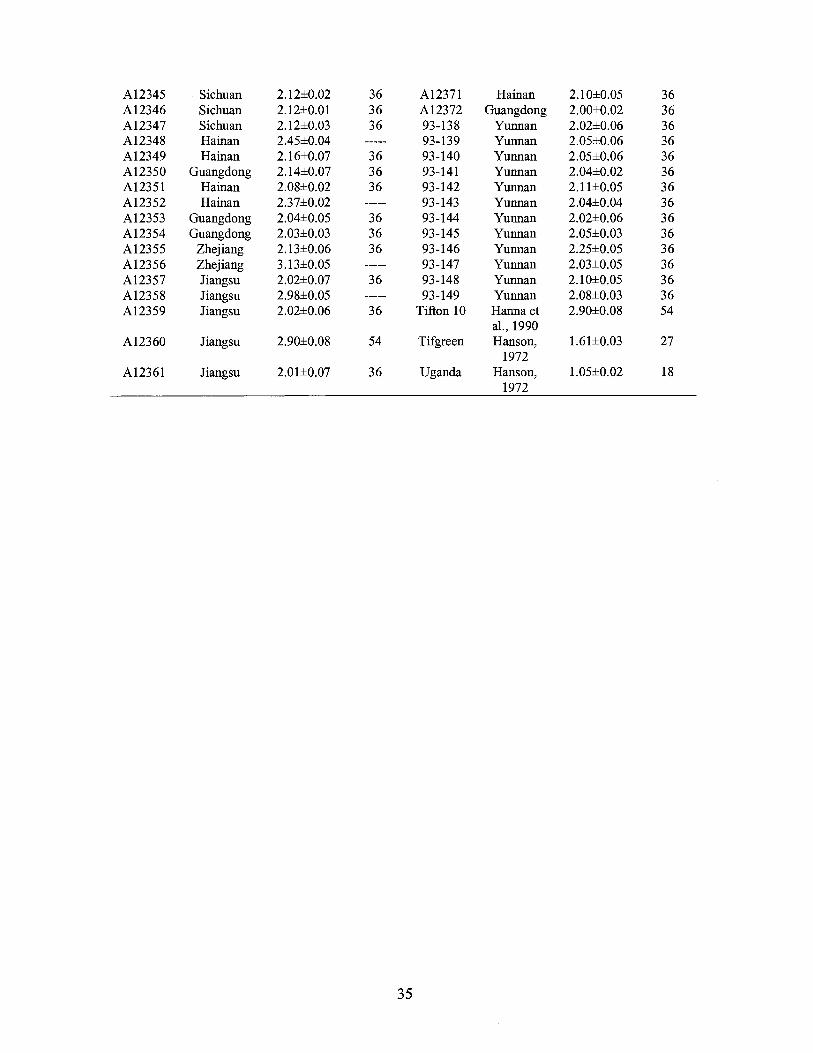
A12345 Sichuan 2.12±0.02 36 A12371 Hainan 2.10±0.05 36 A12346 Sichuan 2.12±0.01 36 A12372 Guangdong 2.00±0.02 36 A12347 Sichuan 2.12±0.03 36 93-138 Yunnan 2.02±0.06 36 Al2348 Hainan 2.45±0.04 93-139 Yunnan 2.05±0.06 36 A12349 Hainan 2.16±0.07 36 93-140 Yunnan 2.05±0.06 36 A12350 Guangdong 2.14±0.07 36 93-141 Yunnan 2.04±0.02 36 A12351 Hainan 2.08±0.02 36 93-142 Yunnan 2.11±0.05 36 A12352 Hainan 2.37±0.02 93-143 Yunnan 2.04±0.04 36 A12353 Guangdong 2.04±0.05 36 93-144 Yunnan 2.02±0.06 36 A12354 Guangdong 2.03±0.03 36 93-145 Yunnan 2.05±0.03 36 A12355 Zhejiang 2.13±0.06 36 93-146 Yunnan 2.25±0.05 36 Al2356 Zhejiang 3.13±0.05 93-147 Yunnan 2.03±0.05 36 A12357 Jiangsu 2.02±0.07 36 93-148 Yunnan 2.10±0.05 36 A12358 Jiangsu 2.98±0.05 93-149 Yunnan 2.08±0.03 36 A12359 Jiangsu 2.02±0.06 36 Tifton 10 Hanna et 2.90±0.08 54
al., 1990 A12360 Jiangsu 2.90±0.08 54 Tifgreen Hanson, 1.61±0.03 27
1972 A12361 Jiangsu 2.01±0.07 36 Uganda Hanson, 1.05±0.02 18
1972
35
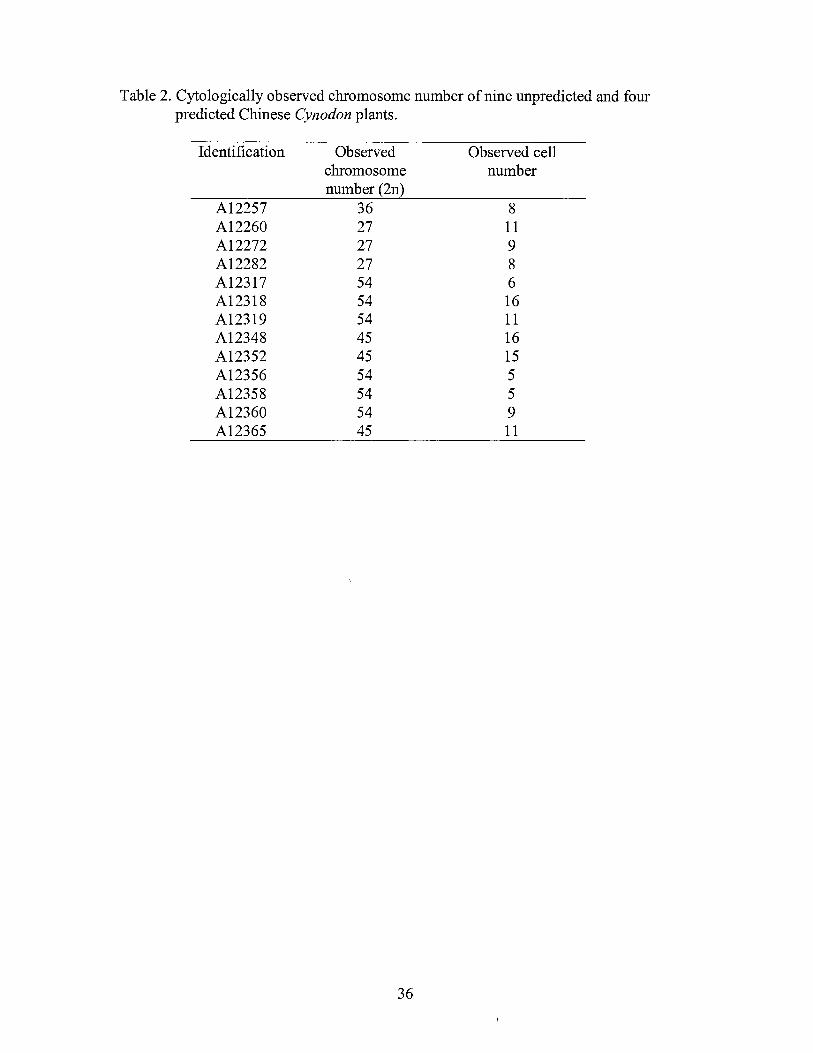
Table 2. Cytologically observed chromosome number of nine unpredicted and four predicted Chinese Cynodon plants.
Identification
A12257 A12260 Al2272 A12282 A12317 A12318 A12319 A12348 A12352 A12356 A12358 A12360 A12365
Observed chromosome number(2n)
36 27 27 27 54 54 54 45 45 54 54 54 45
36
Observed cell number
8 11 9 8 6 16 11 16 15 5 5 9 11
CHAPTER III
AFLP DIVERSITY OF CHINESE CYNODON ACCESSIONS
ABSTRACT
Cynodon dactylon (L.) Pers. is indigenous and widely distributed in China.
However, very little is known of the genetic diversity of the Chinese Cynodon germ.plasm
pool. Accordingly, this study was conducted to quantify the genetic variation and to
characterize the variation pattern and the genetic relatedness of 119 C. dactylon
accessions collected from eleven provinces in China using a fluorescence-labeled
amplified fragment length polymorphism (AFLP) DNA profiling procedure. Based on the
466 polymorphic AFLP bands produced with thirteen selective amplification primer
combinations, the accessions were grouped into five clusters. Genetic similarity
coefficients of two clusters containing cv. 'Tifway' and 'Tifgreen' ranged from 0.97 to
0.99, suggesting the triploid plants most probably were introduced cultivars from the US.
Within Chinese indigenous accessions, genetic similarity coefficients (SC) ranged from
0.65 to 0.99. Genetic variation pattern and groupings for the Chinese accessions were
associated with their geographic origin and ploidy level. Tetraploid genotypes had the
greatest genetic variation with genetic similarity coefficients ranging from 0.69 to 0.99,
while pentaploids had the least with SC values ranging from 0.95 to 0.98. The pentaploid,
hexaploid, and tetraploid accessions of similar geographic origin were grouped together
37
both by cluster and principal coordinate analysis, suggesting a common ancestry among
the cytotypes. Fully sampling the genetic diversity of Cynodon in China will require more
comprehensive collection throughout its distribution.
38
INTRODUCTION
Cynodon L. C. Rich., a genus of the tribe Cynodonteae, subfamily Choridoideae,
and family Gramineae (Poaceae), comprises nine species and ten varieties in a
taxonomically revised classification by J. R. Harlan and colleagues (Harlan et al. 1970;
de Wet and Harlan, 1970). Harlan and de Wet (1969) indicated that Cynodon dactylon
(L.) Pers var. dactylon, the most widely distributed taxon, is enomously variable and
found across all continents and islands between about 45° N and 45° S latitudes, even
penetrating to 53° Nin Europe. As an economically important and widely used warm
season grass, C. dactylon var. dactylon is extremely valuable as a pasture, turf, and soil
conservation grass (Harlan, 1970; Burton and Hanna, 1995; Taliaferro, 1995).
There are two taxonomically recognized Cynodon species, C. dactylon and C.
arcuatus, and two botanical varieties, var. dactylon and var. biflorus Merino in C.
dactylon in China (Anonymous, 1990). The diagnostic character of C. dactylon var.
biflorus, which is not included in Harlan's classification, is two (2) florets in one spik:elet.
In China, C. dactylon var. dactylon plants are widely distributed in a broad range
including tropical, subtropical and warmtemperate climate regions south of the Yellow
River, and are also scattered sparsely in Xingjiang (Abulaiti et al., 1998), Hebei and
Beijing. Glenn W. Burton surveyed turf sites in Shanghai in 1974 and collected a clonal
plant from an old lawn that later was released as 'Tifton 10' (Hanna, 1990).
The PCR-based DNA fingerprinting techniques based on the analysis of
information-rich nucleic acid molecules used in studying genetic diversity, relatedness,
phylogeny and in identifying off-types of cultivars in Cynodon (Caetano-Anoles, 1998a)
are the randomly amplified polymorphic DNA (RAPD) (Roodt, et al. 2002) and DNA
39
amplified fingerprinting (DAF) (Caetano-Anolle et al. 1995; Caetano-Anolle et al. 1997;
Ho et al. 1997; Assefa et al., 1998; Anderson et al. 2001). Recently, the amplified
fragment length polymorphism (AFLP) (Vos et al., 1995) has been used in Cynodon, to
differentiate bermudagrass genotypes (Zhang et al., 1999) and to detect the genetic
diversity among forage bermudagrass cultivars (Karaca et al., 2002).
Cynodon grasses are indigenous in China. However, very little is known of the
genetic diversity of Chinese Cynodon or of its genetic relationship to Cynodon from other
regions of the world. Quantification of this variation will provide invaluable information
regarding the potential for improvement of C. dactylon var. dactylon and related taxa.
The objectives of the study are to quantify the genetic variation within and genetic
relatedness among the Chinese Cynodon accessions based on AFLP markers. Selected
standard commercial Cynodon cultivars used in the U.S. were included for comparison.
40
MATERIALS AND METHODS
Plant materials and DNA isolation
The Chinese Cynodon germplasm collection consisted of 119 clonal accessions
collected from eleven provinces ranging from tropical Hainan Island to the temperate
climate region around Beijing (Table 1 ). 'Tifway', 'Tifgreen', and 'Tiftonl O' standard
U.S. commercial cultivars were included to determine their relatedness to the Chinese
accessions. The Chinese Cynodon collection included six triploid (2n=3x=27), 103
tetraploid (2n=4x=36), three pentaploid (2n=5x=45) and seven hexaploid (2n=6x=54)
plants (Table 1 ). The Cynodon clonal plants were grown in the greenhouse at Oklahoma
State University in 15 cm diameter pots containing a standard soil mix (Scotts-Sierra
Horticultural Products Co., Marysville, OH). The plants were maintained in a healthy
condition by daily watering and biweekly fertilization with M-77 Peatlite Special water
soluble fertilizer (Setts-Sierra Horticultural Products Co., Marysville, OH). DNA
samples were isolated from fresh leaf tissues of the experimental potted plants with
DNeasyplant mini kit from QIAGEN Inc. (Valencia, CA 91355).
AFLP procedures
The AFLP analysis was performed as described by Vos et al. (1995) with a few
minor modifications (Bai et al., 1999). Before the AFLP analysis of 122 experimental
Cynodon DNA samples, DNA from eight accessions were used to test the reproducibility
of the optimized AFLP procedures described below. Two sets of DNA samples were
isolated separately from each of the eight plant accessions. One set of the DNA samples
was used to produce one set of selectively amplified PCR products using the AFLP
procedures. The second set of DNA samples was used for three separate PCR reactions.
41
The resultant four sets of selectively amplified PCR products from the two sets of DNA
samples were run in adjacent lanes on the same gel to evaluate reproducibility.
The AFLP procedures are mainly comprised of DNA sample preparation,
digestion, ligation, pre-amplification, selective amplification and electrophoresis.
Genomic DNA was diluted to a final concentration of 100 ng I µl for AFLP analysis. The
diluted genomic DNA (approximately 300 ng) was double digested with EcoRI and Msel
restriction enzymes at 37°C for two hours. AFLP adapters for both enzymes were then
ligated to restriction fragments at 20 °C overnight. The ligated DNA was pre-amplified
. using a primer combination based on the sequences of the adapters. Pre-amplification
was performed for 30 cycles of 30s at 94°C, 1 min at 65°C, and 1 min at 72 °C and PCR
products of pre-amplification were checked in a 1 % agarose gel. A total of 13 AFLP
selective primer combinations (Table 2) with EcoRI primers being labeled with either
IRD-700 or IRD-800 infrared fluorescence dye were used for selective amplification. The
following touchdown thermal profile was used in all selective amplifications: 2 min at
94°C; 13 touchdown cycles at 94°C for 30s, 65°C for 30s (-0.7°C per cycle), and 72°C for
60s; 23 cycles at 94°C for 30s, 56°C for 30s, and 72°C for 60s. All PCR reactions were
conducted on a MJ PTC-100 thermocycler. Approximate one µl of the selective
amplification PCR products and 1.0 µl of DNA size standard were loaded onto a 6.5%
denaturing Long Ranger gel (BMA, Rockland, ME) and run in lX TBE buffer at 1500V
and 40 W for 3.5 h in a Li-Cor's m.2-4200 DNA Analyzer (Li-Cor Inc. Lincoln, NE).
42
Data profiling and analysis
Electrophoresis bands were visually scored twice as present (1 ), absent (0) or
ambiguous (9) for each accession. Data of polymorphic bands were compiled for each
replicated experiment in a data matrix and analyzed by using the NTSYS (Numerical
Taxonomy System) version 2.0 (Exeter Software, New York, NY). Similarity
coefficients of pair-wise comparisons among the experimental Cynodon accessions were
computed with the SIMQUAL module. Cluster analysis was performed according to the
un-weighted pair-group mean algorithm (UPGMA) within the SAHN module of the
NTSYS program. A principal coordinate analysis to construct a two-dimensional array
of eigenvectors was performed using the DCENTER module of the NTSYS program.
43
RESULTS AND DISCUSSION
Reproducibility of AFLP procedures
Eight accessions (Tiftonl 0, 12317, 12364, 12355, Tifgreen, 12349, 12259 and
12326) were used to evaluate the reproducibility of the AFLP procedures by employing
two selective primer combinations: eACT/mCAG (Fig. 1) and eAAC/mCAG. In 62 of
the 64 replicated gel lanes, DNA banding patterns of the replicated PCR products were
identical. 1.2% of total bands evaluated were different between replicates. The
differences of replicated banding patterns were in level of intensity and present mainly in
the bands of size larger than 450 bp. This high reproducibility (98.8%) agrees with the
reproducibility previously reported (Zhang et al. 1999) further confirming the AFLP
procedure to be highly reliable for DNA profiling of bermudagrass.
DNA profiling
Thirteen AFLP selective amplification primer combinations totally produced 763
bands among the 122 Cynodon genotypes (Table 1), with an average of 58.7±11.4 bands
per primer combination (Table 2). Of the 763 bands scored, 466 were polymorphic
accounting for 61.1 %, averaging 35.9±12.4 bands per primer combination. The primer
combinations eAGT/mCAC and eGCT/mCAG amplified the largest and smallest
numbers of total bands and polymorphic bands per gel, respectively (Table 2).
Genetic diversity and relatedness
The genetic diversity was relatively high among the accessions in this study. The
genetic similarity coefficients among the 122 accessions ranged from 0.55 to 0.99. The
lowest similarity coefficient (0.55) was between Tifgreen and 12351, and Tifgreen and
44
12261. Tifgreen is a triploid hybrid between tetraploid C. dactylon and diploid C.
transvaalensis accessions from Africa (Juska and Hanson, 1964). Accessions12351 and
12261 are from China. The highest similarity coefficient was 0.99 detected between
accessions 12279 and 12280. The two accessions were collected from very close sites in
Aha, Sichuan Province of China.
Cluster analysis based on the genetic similarity coefficient clearly separated the
122 Cynodon accessions into five distinct major groups: A, B, C, D and E (Fig.2.). The
variation patterns and groupings of the Cynodon accessions appear to be associated with
their ploidy level and geographic origin. Cluster A contains Tifgreen and two triploid
accessions (Fig. 2.). The genetic similarity coefficients among the three genotypes ranged
from 0.97 to 0.99 indicating that they are genetically very similar. The morphological
traits of accessions 12256 and 12369 grown in greenhouse and field plots were very
similar, but different from Tifgreen in leaflength and sod density. Accessions 12256 and
12369 probably were cultivars introduced to China and possibly mutational variants of
Tifgreen or 'Tifdwarf. Caetano-Anolles (1998b) reported the genetic instability of
Tifgreen and Tifdwarf detected by DAF and ASAP analysis. Off-types of Tifgreen were
phenotypically distinct from the wild type, but genetically close to each other.
Cluster B consists ofTifway, 12260, 12272 and 12282. The four accessions
genetically are very similar with SC ranging from 0.97 to 0.99 and averaging 0.98±0.01.
Accessions 12260, 12272 and 12282 were morphologically uniform, but distinct from
Tifway in foliage color and developmental characteristics, particularly in the late growing
season. The Tifway tended to have darker green color and fewer inflorescences than the
other three accessions in the fall. Caetano-Anolles et al. (1997) indicated that Tifway
45
was genetically stable, thus, it is less likely that the three Chinese accessions are
mutational variants ofTifway. However, the three triploids were collected at three
locations in Sichuan province where triploid Cynodon cultivars have been introduced and
widely used (Wu et al., 2001).
Cluster C in Fig. 2 contains only two accessions 12261 and 12257. Interestingly,
Accession 12261 is a triploid collected from Neijiang, Sichuan. Accession 12257 is a
tetraploid from Tongjiaxi, Chongqing. The genetic similarity of pair-wise comparison
between the two accessions is 0.92. Morphological traits (color, leaf texture, intemode
length, plant height) of the triploid genotype are similar to those oftetraploid common
bermudagrass. However, seed Set data of a replicated field experiment in 2002 indicated
that averaged seed set rate of 12261 was 0.07%, much lower than those of common
bermudagrass genotypes.
Cluster D contained 109 accessions making it the largest group. The cluster
contained the majority of the tetraploid cytotypes and all of the hexaploid cytotypes of
the Chinese accessions (Fig. 2). Similarity coefficients in the cluster averaged 0.82±0.05,
and ranged from 0.69 to 0.99. The eight hexaploid cytotypes were separated into three
subgroups. One subgroup contained 12317, 12318, 12320, 12356 and 12358. Accessions
12317 and 12318 were collected from Shanghai, and 12356 and 12358 from Zhejiang and
Jiangsu, respectively. Field notes indicated that accession 12320 was a fine textured plant
from Hongya, Sichuan, but the plant used in this study had relatively coarse texture
suggesting that it was not the true 12320 accession. Mechanical mixture of the two
accessions may have occurred because the original nursery plots in China of the two
accessions were adjacent to each other. The similarity coefficient between 12318 and
46
12320 was 0.99 further suggesting that the accession identified as 12320 in this study was
a contaminant. The other three Hexaploid genotypes (TiftonlO, 12319 and 12360)
clustered into two subgroups. TiftonlO and 12319 were from Shanghai, and 12360 from
Jiangsu. In cluster D, 101 of the tetraploid genotypes scattered into various sub
groupings (Fig. 2). Collectively, the accessions from the same geographic locations or
nearby regions tended to have higher genetic similarity and to cluster into same
subgroups or neighbor subgroups. As shown in Fig. 1, most accessions that originated in
the western provinces of Sichuan, Chongqing and Yunnan were included in the same sub
groupings or in neighboring sub-groupings, and most accessions from eastern and
southern provinces including Shanghai, Jiangsu, Zhejiang, Fujian, Guangdong and
Hainan, tended to group into the same or adjacent groupings. However, seven accessions
(12364, 12357, 12361, 12363, 12354, 12367 and 12359) from eastern and southern
regions formed sub-groupings with accessions from west regions, while two accessions
(12344 and 12258) from western regions formed sub-groupings closer to groupings
containing predominantly eastern and southern origin accessions.
Cluster E contains one tetraploid and three pentaploid accessions (Fig. 2). Two
pentaploid accessions 12348 and 12352 and the tetraploid accession 12351 were
collected from Xinlong, W anquanhe and Haikou in Hainan Island. Another pentaploid
accession, 12365, originated in Minghou, Fujian. Among the pentaploid genotypes,
genetic similarity coefficients averaged 0.96±0.01, ranging from 0.95 to 0.98, indicating
very low genetic diversity among the pentaploid accessions.
Principal coordinate analysis clearly indicated that Tifgreen and Tifway and the
accessions respectively clustering with them were widely separated from the Chinese
47
accessions (Fig. 3). Both Tifgreen and Tifway are interspecific F1 hybrids from
tetraploid C. dactylon by diploid C. transvaalensis crosses with parents of African origin.
Among the Chinese accessions, the pentaploid genotypes separated from tetraploid and
hexaploid accessions (Fig. 3). However, the hexaploid accessions were grouped together
\
with the tetraploid accessions from closer geographic regions. Genetic similarity analyses
{Table 3) among the ploidy levels also demonstrated that genetic distance between
tetraploids and hexaploids is somewhat closer (0. 78) than the distance (0. 71) between
tetraploids and pentaploids. Within the ploidy levels, the range of similarity coefficients
and the average similarity coefficient of tetraploids was larger than those of the
hexaploids and pentaploids, showing that the Chinese tetraploid Cynodon contained
much wider genetic diversity compared to the pentaploid and hexaploid cytotypes.
A dendrogram from the cluster analysis (Fig. 2) showed that hexaploid accessions
and pentaploid accessions formed clusters or sub-clusters in mixture with tetraploid
accessions that originated in the same geographic region as the pentaploids and
hexaploids. The spread oftetraploid, pentaploid and hexaploid forms in 2-dimensional
plot of principal coordinate analysis (Fig. 3) in which PCl and PC2 accounted for 10.4%
and 7.2% of total variation, respectively, is basically consistent with the indication of the
dendrogram. The close genetic relatedness of the three different ploidy forms indicated
they have a common ancestry. Harlan and de Wet (1969) pointed out that C. dactylon var.
dactylon is the only truly cosmopolitan taxon in Cynodon, and in their revised
classification of genus Cynodon, only the tetraploid cytotype is indicated for C. dactylon
var. dactylon (Harlan, 1970; Harlan et al. 1970; de Wet and Harlan, 1970). Hexaploidy
and pentaploidy are rare in Cynodon. Powell et al. (1968) reported a hexaploid clone
48
from a cross oftetraploid x diploid parents, and speculated that the doubling of
chromosome number at an early zygote stage probably accounted for its occurrence.
Another hexaploid plant was identified in the progeny of a self-pollinated plant of
tetraploid C. dactylon (Felder, 1967). He hypothesized that the autohexaploid plant
resulted from the union of an unreduced female gamete and a reduced male gamete.
Accordingly, the origin of the Chinese hexaploid forms most likely resulted from either
chromosome doubling in a young zygote or from the union of reduced and unreduced
gametes oftetraploid parents. The pentaploid forms probably originated from the union
of one normal gamete from a tetraploid parent with another normal gamete from a
hexaploid parent.
It is evident that the AFLP differentiation of the Chinese Cynodon genotypes in
cluster analysis corresponds well with their geographical patterns. Obviously geographic
origin plays a significant role in their genetic differentiation. This is because adaptation
and evolution of Cynodon plants is a function of natural selection under local
environmental factors, which include abiotic and biotic conditions. Harlan and de Wet
(1969) indicate that there are reasonably consistent variation patterns, which can be
discerned on the basis of appearance, adaptation, and geographic distribution. The finding
of geographic variation patterns has significance in collection of the full range of genetic
diversity, which must cover the different geographic regions.
Although the Cynodon accessions in this study were collected from two distinct
geographic regions in China, discrete genetic differentiation within a region is not
observed and overlap existed between the two separate regions in the dendrogram (Fig.2)
and principal coordinate plot (Fig.3). This might be explained by the open pollination
49
behavior of Cynodon plants. The predominant mode of sexual reproduction in C.
dactylon is outcrossing due to cross-pollination and self-incompatibility (Burton, 1947;
1965; Taliaferro and Lamie, 1997). The high probability of cross-pollination results in
frequent gene flows between natural populations in close geographic regions, which
probably prevent formation of differentiated genetic groups within a region. Presumably,
as the geographic distance between natural Cynodon populations increases the frequency ·
of gene flow would decrease. Harlan and de Wet ( 1969) observed that crossing of C.
dactylon var. dactylon plants of close geographic origins resulted in hybrids with higher
fertility than crosses of parents of disparate geographic origins. We believe that genetic
variation and differentiation pattern of Chinese Cynodon germplasm pool in the main
distribution regions is of a gradual mode for tetraploid form without apparent genetic
barrier. It will be interesting to examine agronomic and adaptive traits of the Chinese
accessions to compare the AFLP diversity with the variation on the traits.
50
REFERENCES
Abulaiti, D.-S. Shi, G. Yang. 1998. A preliminary survey of native Xingjiang
bermudagrass. J. Xingjiang Agric.Uni. 21: 124-127. (in Chinese).
Anderson M.P., C.M. Taliaferro, D.L. Martin, and C. S. Anderson. 2001.Comparative
DNA profiling ofU-3 turfbermudagrass strains. Crop Sci. 41: 1184-1189.
Anonymous.1990. Chinese Floral Acta. Sci Press, Beijing. 10: 82-85. (in Chinese).
Assefa S., C.M. Taliaferro, M.P.Anderson, B.G. de los Reyes, and R.M. Edwards. 1998.
Diversity among Cynodon accessions and taxa based on DNA amplification
fingerprinting. Genome. 42: 465-474.
Bai, G-H., H. Tefera, M. Ayele, and H. Nguyen. 1999. AFLP analysis oftef and its
relatives. Crop Sci. 39: 819-824.
Burton, G.W. 1947. Breeding Bermuda grass for the southeastern United States.
Agron. J. 3.9:551-569.
Burton, G.W. 1965. Breeding better bermudagrass. P 93-96. In Proc. IX Intl. Grassl.
Cong., Sao Paulo, Brazil.
Burton, G.W., and W.W.Hanna. 1995. Bermudagrass. P421-430 in Forages edited by
Barnes R.F. et al. Iowa state University Press, Iowa, USA.
Caetano-Anolles, G. 1998a. DNA analysis ofturfgrass genetic diversity. Crop Sci.
38: 1415-1424.
Caetano-Anolle, G.1998b. Genetic instability ofbermudagrass (Cynodon) cultivars
'Tifgreen'and 'Tifdwarr detected by DAF and ASAP analysis of accessions and
off-types. Euphytica. 101: 165-173.
Caetano-Anolle, G., L. M. Callahan, and P.M.Gresshoff. 1997. The origin of
51
bermudagrass ( Cynodon) off-types inferred by DNA amplification fingerprinting.
Crop Sci. 37: 81-87.
Caetano-Anolles, G., L.M.Callahan, P.E. Williams, K.R.Weaver, and P.M. Gresshoff.
1995. DNA amplification fingerprinting analysis ofbermudagrass (Cynodon):
genetic relationships between species and interspecific crosses. Theor. Appl.
Genet. 91: 228-235.
de Wet, J.M.J., and J.R. Harlan. 1970. Biosystematics of Cynodon LC.Rich.
(Gramineae). Taxon. 19: 565-569.
Felder, M.R. 1967. Chromosome associations in triploid Cynodon hybrids. M.S. thesis.
Oklahoma State Univ., Stillwater.
Hanna, W.W., G.W. Burton, and A.W. Johnson. 1990. Registration of 'Tifton 10' turf
bermudagrass. Crop Sci. 30: 1355-1356.
Harlan, J.R., and J.M.J. de Wet. 1969. Sources of variation in Cynodon dactylon (L.)
Pers. Crop Sci. 9: 774-778.
Harlan, J.R., J.M.J. de Wet, and K.M. Rawal. 1970. Geographic distribution of the
species of Cynodon L.C. Rich (Gramineae). East Afri. Agric. For. J. 36: 220-226.
Harlan, J.R. 1970. Cynodon species and their value for grazing and hay. Herbage
abstracts. 40: 233-238.
Harlan, J.R., J.M.J. de Wet, W.W. Huffine, and J.R. Deakin. 1970. A guide to the species
of Cynodon (Gramineae). Okla. Agric. Exp. Stn. Bulletin B-673.
Ho, C.Y., S.J. McMaugh, AN.Wilton, I.J.McFarlane, and A.G. Mackinlay. 1997. DNA
amplification variation within cultivars of turf-type couch grasses (Cynodon spp.).
Plant Cell Reports. 16: 797-801.
52
Juska, F.V. and A.A. Hanson. 1964. Evaluation ofbermudagrass varieties for general
purpose turf. USDA-ARS, Agric. Handbook No. 270.
Karaca, M., S. Saha, A. Zipf, J.N. Jenkins, and D. J. Lang. 2002. Genetic diversity among
forage bermudagrass (Cynodon spp.): evidence from chloroplast and nuclear
DNA fingerprinting. Crop Sci. 42: 2118-2127.
Powell, J.B., G.W. burton and C.M. taliaferro. 1968. A hexaploid clone from a tetraploid
X diploid cross in Cynodon. Crop Sci. 8: 184-185.
Roodt, R., J.J. Spies and T.H. Burger. 2002. Preliminary DNA fingerprinting of the turf
grass Cynodon dactylon (Poaceae: Chloridoideae). Bothalia. 32: 117-122.
Taliaferro, C.M. 1995. Diversity and vulnerability of Bermuda turfgrass species. Crop
Sci. 35: 327-332.
Taliaferro, C.M., and J.T. Lamie. 1997. Cytological analysis of self-incompatibility in
Cynodon dactylon (L.) Pers. Int. Turfgrass Society Res. J. 8: 393-400.
Vos, P., R. Rogers, M. Bleeker, M. Reijans, T. van de Lee, M. Homes, A. Frijters, J. Pot,
J. Peleman, m. Kuiper and M. Zabeau. 1995. AFLP: a new technique for DNA
fingerprinting. Nucleic acids research. 23: 4407-4414.
Wu, Y.Q., L.L. Liu, X. Xiong, X.G. Xu, and Z. Wang. 2001. Bermudagrass: utilization
and native germplasm in Sichuan. Grassland and Turf. 23: 31-34. ( In Chinese).
Zhang, L.-H., P. Ozias-Akins, G. Kochert, S. Kresovich, R. Dean and W. Hanna. 1999.
Differentiation ofbermudagrass (Cynodon spp.) genotypes by AFLP analyses.
Theor. Appl. Genet. 98: 895-902.
53
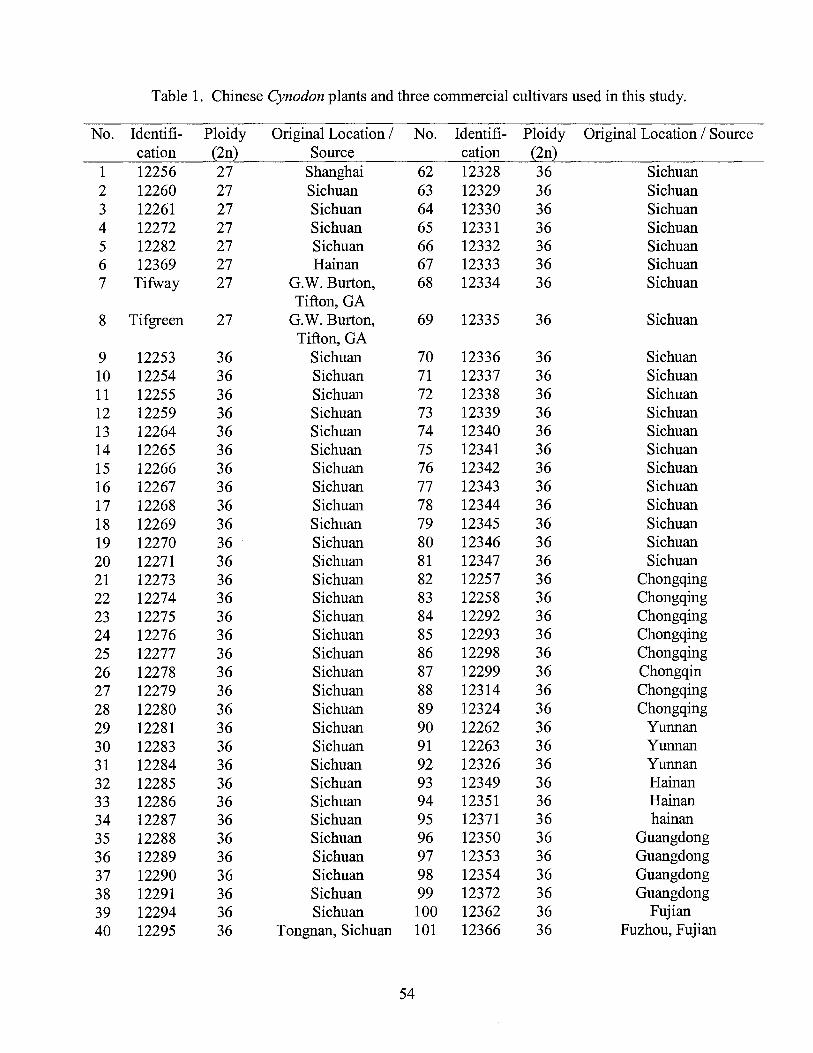
Table 1. Chinese Cynodon plants and three commercial cultivars used in this study.
No. Identifi- Ploidy Original Location I No. Identifi- Ploidy Original Location I Source cation (2n) Source cation (2n)
1 12256 27 Shanghai 62 12328 36 Sichuan 2 12260 27 Sichuan 63 12329 36 Sichuan 3 12261 27 Sichuan 64 12330 36 Sichuan 4 12272 27 Sichuan 65 12331 36 Sichuan 5 12282 27 Sichuan 66 12332 36 Sichuan 6 12369 27 Hainan 67 12333 36 Sichuan 7 Tifway 27 G.W. Burton, 68 12334 36 Sichuan
Tifton, GA 8 Tifgreen 27 G.W. Burton, 69 12335 36 Sichuan
Tifton, GA 9 12253 36 Sichuan 70 12336 36 Sichuan 10 12254 36 Sichuan 71 12337 36 Sichuan 11 12255 36 Sichuan 72 12338 36 Sichuan 12 12259 36 Sichuan 73 12339 36 Sichuan 13 12264 36 Sichuan 74 12340 36 Sichuan 14 12265 36 Sichuan 75 12341 36 Sichuan 15 12266 36 Sichuan 76 12342 36 Sichuan 16 12267 36 Sichuan 77 12343 36 Sichuan 17 12268 36 Sichuan 78 12344 36 Sichuan 18 12269 36 Sichuan 79 12345 36 Sichuan 19 12270 36 Sichuan 80 12346 36 Sichuan 20 12271 36 Sichuan 81 12347 36 Sichuan 21 12273 36 Sichuan 82 12257 36 Chongqing 22 12274 36 Sichuan 83 12258 36 Chongqing 23 12275 36 Sichuan 84 12292 36 Chongqing 24 12276 36 Sichuan 85 12293 36 Chongqing 25 12277 36 Sichuan 86 12298 36 Chongqing 26 12278 36 Sichuan 87 12299 36 Chongqin 27 12279 36 Sichuan 88 12314 36 Chongqing 28 12280 36 Sichuan 89 12324 36 Chongqing 29 12281 36 Sichuan 90 12262 36 Yunnan 30 12283 36 Sichuan 91 12263 36 Yunnan 31 12284 36 Sichuan 92 12326 36 Yunnan 32 12285 36 Sichuan 93 12349 36 Hainan 33 12286 36 Sichuan 94 12351 36 Hain an 34 12287 36 Sichuan 95 12371 36 hainan 35 12288 36 Sichuan 96 12350 36 Guangdong 36 12289 36 Sichuan 97 12353 36 Guangdong 37 12290 36 Sichuan 98 12354 36 Guangdong 38 12291 36 Sichuan 99 12372 36 Guangdong 39 12294 36 Sichuan 100 12362 36 Fujian 40 12295 36 Tongnan, Sichuan 101 12366 36 Fuzhou, Fujian
54
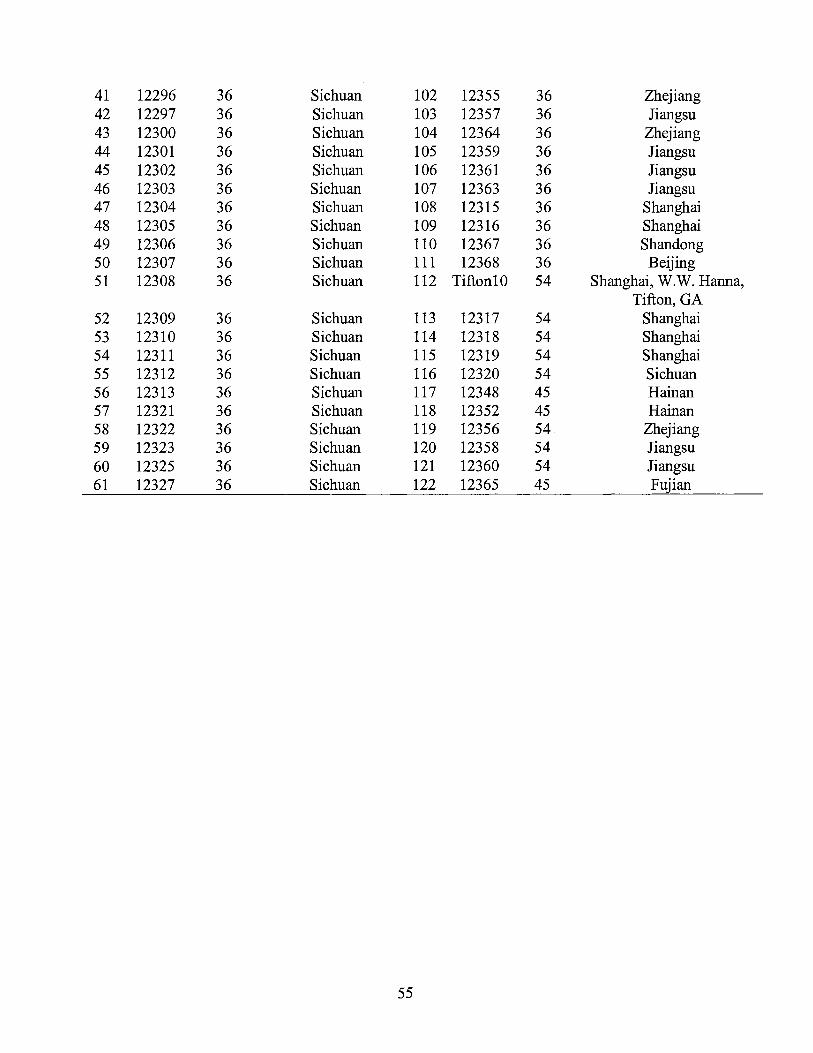
41 12296 36 Sichuan 102 12355 36 Zhejiang 42 12297 36 Sichuan 103 12357 36 Jiangsu 43 12300 36 Sichuan 104 12364 36 Zhejiang 44 12301 36 Sichuan 105 12359 36 Jiangsu 45 12302 36 Sichuan 106 12361 36 Jiangsu 46 12303 36 Sichuan 107 12363 36 Jiangsu 47 12304 36 Sichuan 108 12315 36 Shanghai 48 12305 36 Sichuan 109 12316 36 Shanghai 49 12306 36 Sichuan 110 12367 36 Shandong 50 12307 36 Sichuan 111 12368 36 Beijing 51 12308 36 Sichuan 112 TiftonlO 54 Shanghai, W.W. Hanna,
Tifton, GA 52 12309 36 Sichuan 113 12317 54 Shanghai 53 12310 36 Sichuan 114 12318 54 Shanghai 54 12311 36 Sichuan 115 12319 54 Shanghai 55 12312 36 Sichuan 116 12320 54 Sichuan 56 12313 36 Sichuan 117 12348 45 Hainan 57 12321 36 Sichuan 118 12352 45 Hainan 58 12322 36 Sichuan 119 12356 54 Zhejiang 59 12323 36 Sichuan 120 12358 54 Jiangsu 60 12325 36 Sichuan 121 12360 54 Jiangsu 61 12327 36 Sichuan 122 12365 45 Fujian
55
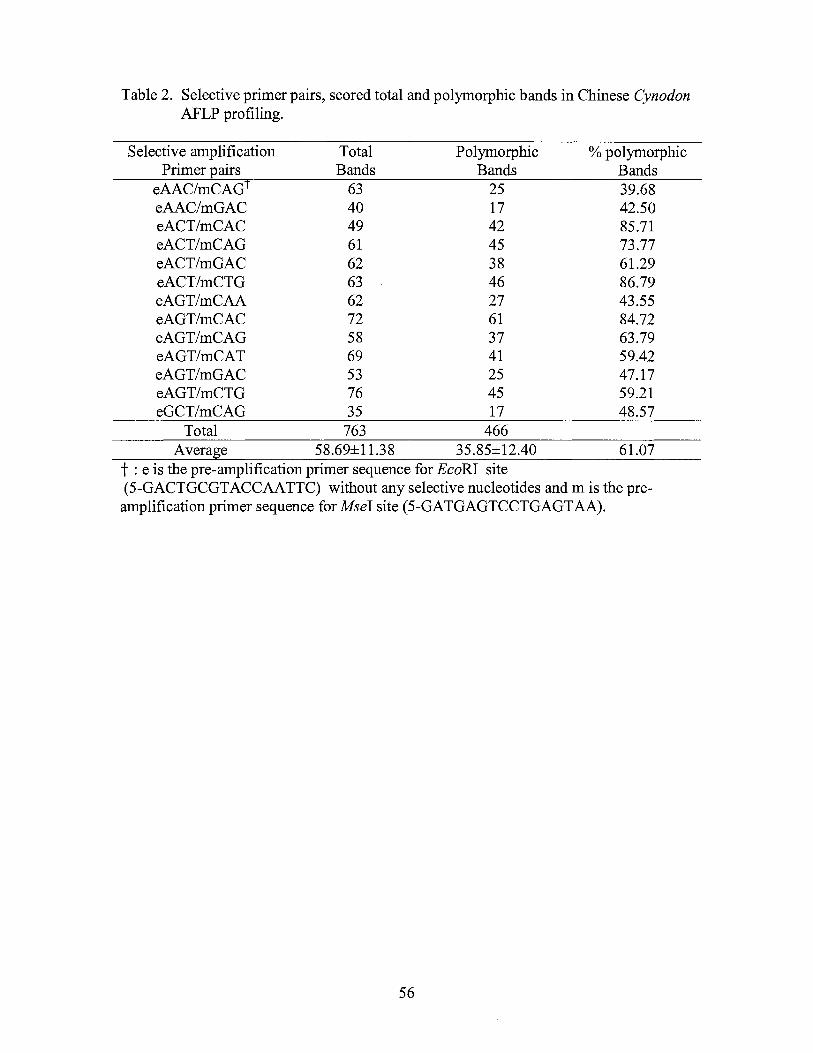
Table 2. Selective primer pairs, scored total and polymorphic bands in Chinese Cynodon AFLP profiling.
Selective amplification Primer pairs
eAAC/mCAGt eAAC/mGAC eACT/mCAC eACT/mCAG eACT/mGAC eACT/mCTG eAGT/mCAA eAGT/mCAC eAGT/mCAG eAGT/mCAT eAGT/mGAC eAGT/mCTG eGCT/mCAG
Total
Total Bands
63 40 49 61 62 63 62 72 58 69 53 76 35
763
Polymorphic Bands
25 17 42 45 38 46 27 61 37 41 25 45 17
466
% polymorphic Bands 39.68 42.50 85.71 73.77 61.29 86.79 43.55 84.72 63.79 59.42 47.17 59.21 48.57
Average 58.69±11.38 35.85±12.40 61.07 t : e is the pre-amplification primer sequence for EcoRI site (5-GACTGCGTACCAATTC) without any selective nucleotides and mis the preamplification primer sequence for Msel site (5-GATGAGTCCTGAGTAA).
56
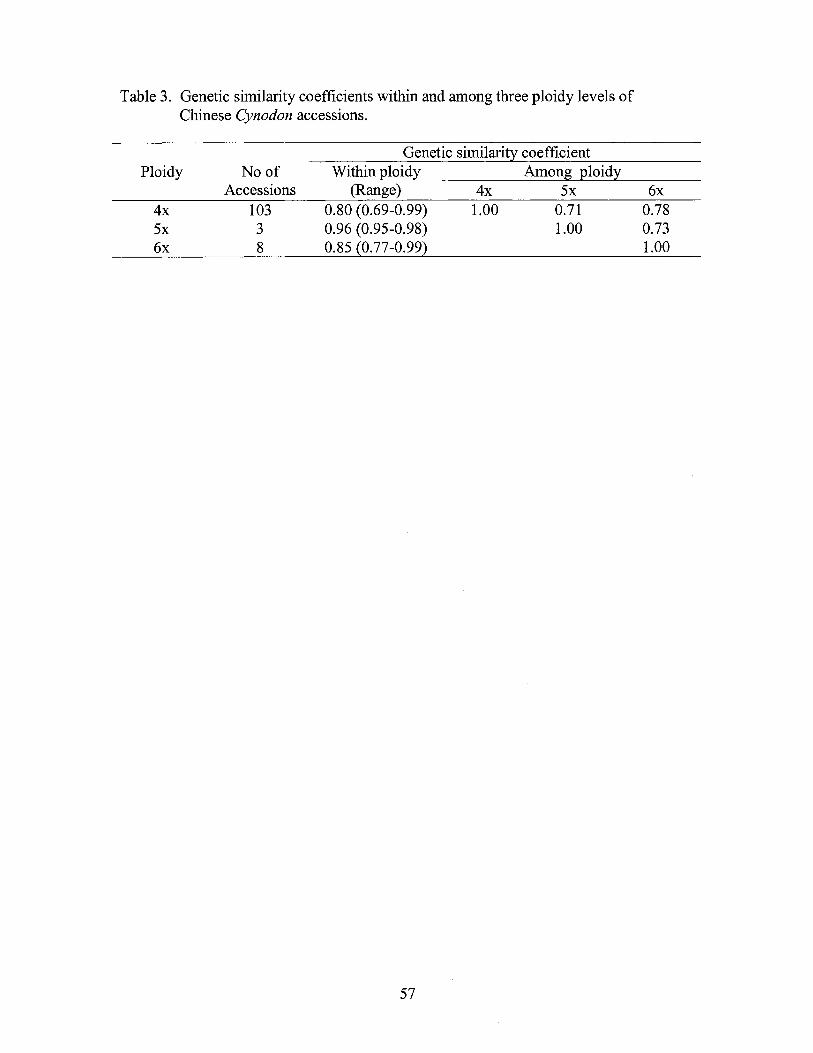
Table 3. Genetic similarity coefficients within and among three ploidy levels of Chinese Cynodon accessions.
Ploidy
4x 5x 6x
Noof Accessions
103 3 8
Genetic similarity coefficient Within ploidy Among ploidy
(Range) 4x 5x 6x 0.80 (0.69-0.99) 1.00 0.71 0.78 0.96 (0.95-0.98) 1.00 0.73 0.85 (0.77-0.99) 1.00
57
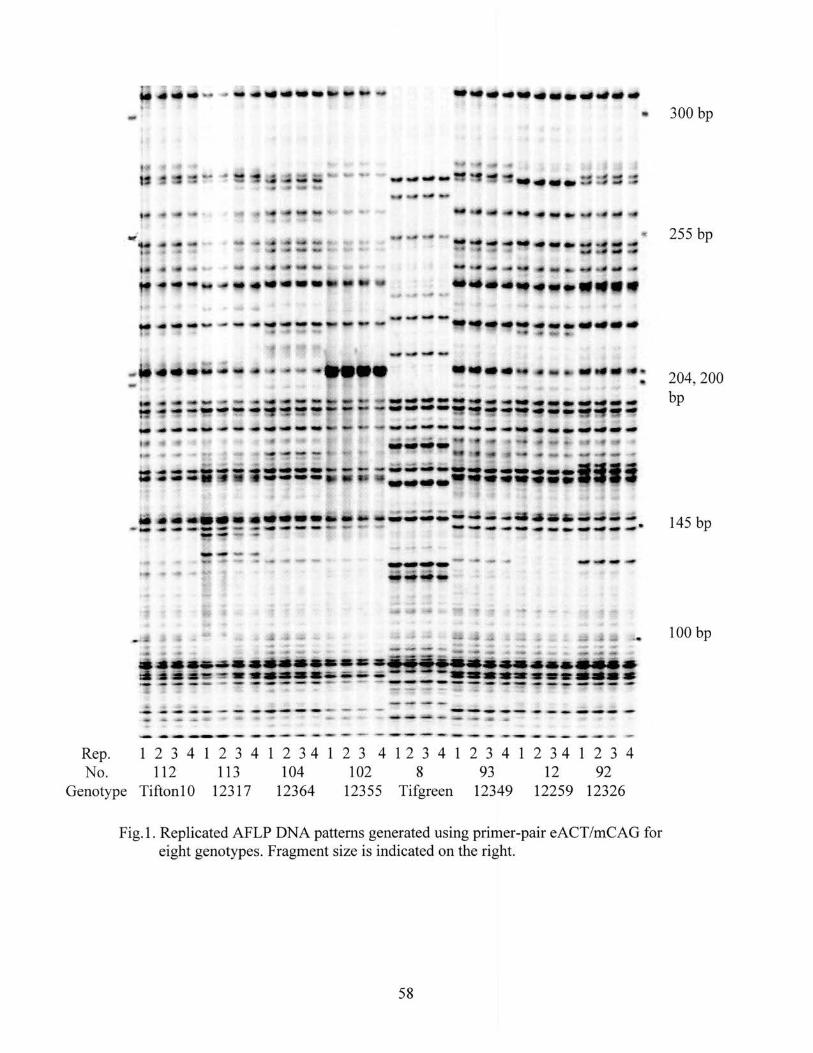
i, si -i • - _,,, ••• • , •• . ............ . ii - • 300 bp
-.
!
----· w · ,. ..
-··----·------------ ~-.•········ r . .... ,,. ,.,. ,"'VI " -~ ,. ----
.., '. · · - - . ' . ' ~ .. ·•·{iff - - ~-- ••••• - * r ff-..· ••••• ~· .... ..... -ff · ··· - r-•• ~---...,· ------
'* <ill, -· "" ... ---· ...= ·- .,,. .,,,.~,4/!<lli*'f#lt~.
~-~~- ~ ·--~ .. --·. - •.: .•. -- •--•~ ·· @•••ifs'. • wv••-~~- • • • • • •••• ---- \ . - .. " it - t>· * <f ...
' t't!'\lt ·- .{/ff .... --- "" ·,;;;;-~=-=••;WI I j
-------··-,.. ----.......
Rep. 1 2 3 4 1 2 3 4 1 2 3 4 1 2 3 4 1 2 3 4 1 2 3 4 1 2 3 4 1 2 3 4 No. 112 113 104 102 8 93 12 92
Genotype TiftonlO 12317 12364 12355 Tifgreen 12349 12259 12326
Fig.1. Replicated AFLP DNA patterns generated using primer-pair eACT/mCAG for eight genotypes. Fragment size is indicated on the right.
58
255 bp
204, 200 bp
145 bp
100 bp
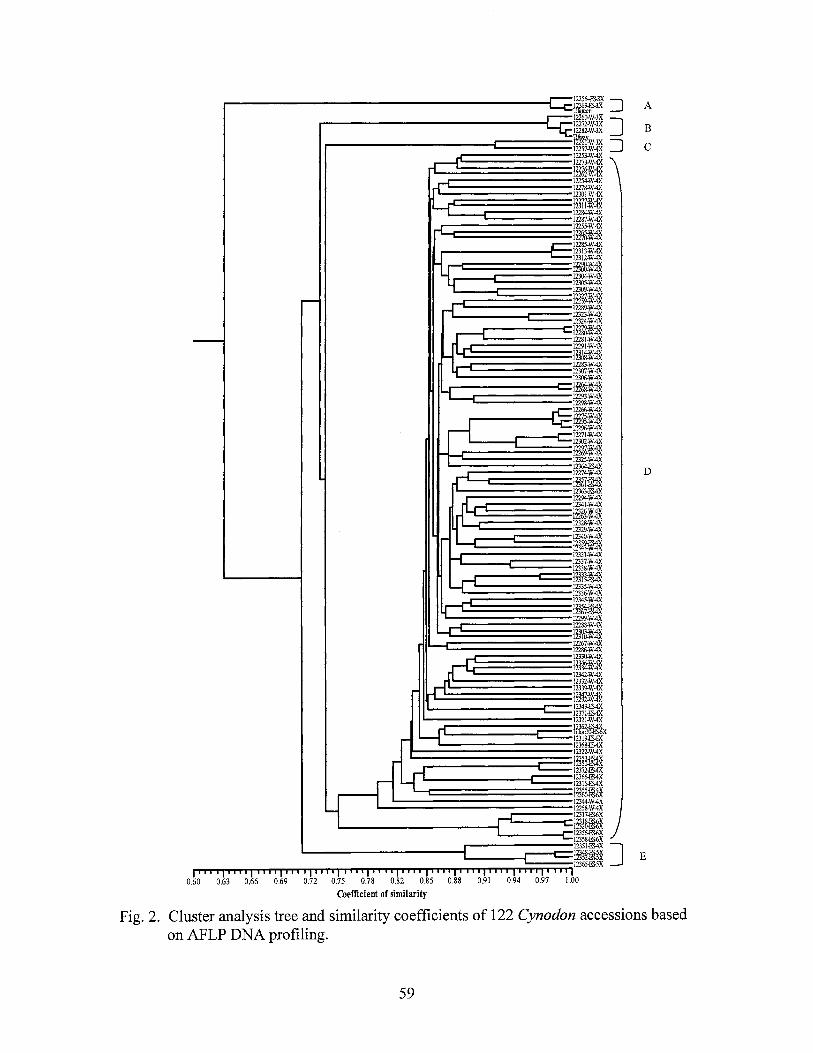
-
I I''' I iii 0.60 0.63
~
11 -,
_.
~ ---'
-I
yR ·~
-t
r-j I
f
~ -~ -I
k - ---r
.. r -rt
y I
I I ii ii Ii ii I I ''' I' Iii I iii 'I ''''I'' I ''I II I 0.66 0.69 0.72 0.75 0.78 0.82 0.85
I 0.88
I' 0.91
Coefficient of similarity
I
I
ii
--i:; 12256-ll!JX 1 .\?,!!/ffiJX _J imo.w.Jx 12272-W.JX J 12282-W.JX "'-Cc Tffi-w-Jx -, 12257.W-4X _! 12253-W4X 12273-W-4X
miWjI l22S4-W4X 12278-W-4X 12301-W-4X
IBTI:WjI 12284-W-4X 12287-W-4X 12255-W4X
lffljI r--1 2285-W-4X
2313-W-4X 2312-W-4X
I I
I B!B:W~ I 2304-W4X 23D5-W4X 2309-W-4X
I I
I ill~WjI I 2289W-4X 2323-W4X 2324-W-4X
I I
-....1 I I
I I I
lmWjI 2281-W-4X 2291-W-4X ~offijI
-I 2283-W4X 2307-W4X 2306-W-4X
ilmI I I I
I I
2293-W4X 2298-W4X 2266-W4X ii§s:WjI 2296-W4X 2271-W-4X 2302-W-4X
I I
I m-w~ I
I
2325-W4X 12364154X 2274-W-4X
I I I I
I I I I
I I I I
m1ti 236J.ffi4X 2294-W4X 2341-W4X
mmI 2328-W-4X 2329-W-4X 2340-W4X
m~I 2331-W-4X 2337-W-4X 2338-W-4X
-1 mW*
--
I I I
2335-W-4X 2336-W-4X 2345-W4X
I ~ I 2299-W-4X 2288-W-4X I
I I I I
I I I I
I I
~n:WjI lli7.W4X 2286-W4X 23JO.W-4X ~WjI 2342-W-4X 23J2.W4X 2339-W-4X mw~
-1 2349ffl4X 2371.ffi4X 2321.W-4X I
~mx -1
I I
231= 2368.ffi4X 2322-W-4X
I mau -1
I I
2372.ffi4X 2366.ffi4X 2316.ffi4X
I I I I
-1 -1 ._I
I
I I
~m 2344-W4X 225S.W4X 2317.m6X mm 2356<lSoX 2358.m6X
•] 236Sll>oX 1111 I iii I
0.97 , I 094
I 1.00
A
B
C
D
E
Fig. 2. Cluster analysis tree and similarity coefficients of 122 Cynodon accessions based on AFLP DNA profiling.
59
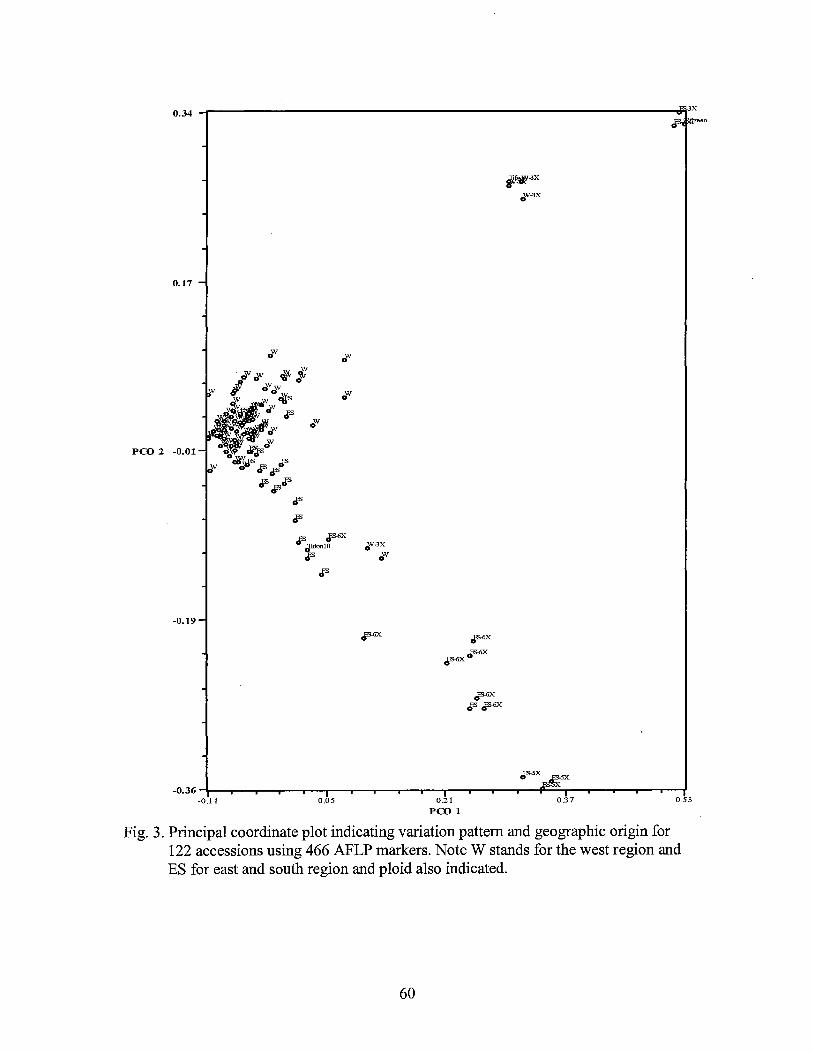
0.34 -r------------------------------..R3x
0.17
PCO 2 -0.01
-0.19
l" px Jlflon!O 0W-3X
l" ow
l"
F·3X
~-3X
JS-5X 5X
-0.36-l,..--~--~--~--~-.---.--.---.--.--_p:.;.:;X:.:....--.---.--,---.---J -0.11 0.05 0.21
PCO 1 0.37 0.53
Fig. 3. Principal coordinate plot indicating variation pattern and geographic origin for 122 accessions using 466 AFLP markers. Note W stands for the west region and ES for east and south region and ploid also indicated.
60
CHAPTER IV
AFLP ANALYSIS OF CYNODON DACTYLON (L.) PERS. VAR. DACTYLON GENETIC VARIATION
Y.Q. Wu*, C.M. Taliaferro, G.H. Bai, and M.P. Anderson
Y.Q. Wu*, C.M. Taliaferro, and M.P. Anderson, Department of Plant and Soil
Sciences, Oklahoma State University, Stillwater, OK 74078, U.S.A.; G.H. Bai,
USDA-ARS/Department of Agronomy, Kansas State University, Manhattan, KS
66506, U.S.A.
* Corresponding author email is [email protected], telephone number (405)
744-9627, fax number (405) 744-5269.
61
ABSTRACT
Cynodon dactylon (L.) Pers. var. dactylon (common bermudagrass) is
geographically widely distributed between about 45°N and 45°S latitudes, penetrating to
about 53°N latitude in Europe. The extensive variation of morphological and adaptive
characteristics of the taxon is substantially documented, but information is lacking on
DNA molecular variation in geographically disparate forms. Accordingly, this study was
conducted to assess molecular genetic variation and genetic relatedness among twenty
eight C. dactylon var. dactylon accessions originating from 11 countries encompassing
four continents (Africa, Asia, Australia, and Europe). A fluorescence-labeled amplified
fragment length polymorphism (AFLP) DNA profiling method was used to detect the
genetic diversity and relatedness. On the basis of 443 polymorphic AFLP fragments from
eight primer combinations, the accessions were grouped into clusters and subclusters
associating with their geographic origins. Genetic similarity coefficients (SC) for the 28
accessions ranged from 0.53 to 0.98. Accessions originating from Africa, Australia, Asia
and Europe formed major groupings as indicated by cluster and principal coordinate
analysis. Accessions from Australia and Asia, though separately clustered, were
relatively closely related and most distantly related to accessions of European origin.
African accessions formed two distant clusters and had the greatest variation in genetic
relatedness relative to accessions from other geographic regions. Sampling the full extent
of genetic variation in C. dactylon var. dactylon would require extensive germplasm
collection in the major geographic regions of its distributional range.
Key words: common bermudagrass, AFLP marker, genetic relatedness
62
INTRODUCTION
Cynodon dactylon (L.) Pers. var. dactylon (common bermudagrass) is the most
important member of the genus Cynodon because of its widespread distribution in
warmer parts of the world and its use as livestock herbage and turf (Harlan 1970). Harlan
and de Wet (1969) describe the taxon as the ubiquitous, cosmopolitan weed of the world,
containing enormous variation ranging from small, fine turf grasses used as golf course
putting green turf to robust types grown for pasture or hay. They indicated that the taxon
occurs across all continents and islands between about 45°N and 45°S latitudes, and
penetrates to approximately 53°N latitude in Europe. Evidence from biosystematic
studies of C. dactylon var. dactylon suggested to Harlan and de Wet (1969), Harlan
(1970) and Harlan et al. (1970c) that it was a Eurasian grass until recent times, and that a
geographic area extending from West Pakistan to Turkey was a center of evolutionary
activity for the taxon. Harlan (1970) stated that the aggressive weedy races now widely
geographically distributed likely emerged from that center ..
Variations in C. dactylon var. dactylon for morphological features, distributional
patterns and associated adaptive and reproductive characteristics are documented to a
fuller degree (Harlan and de Wet 1969; Harlan 1970; Harlan et al. 1970b, c, d) than are
variations in DNA markers. The ability of DNA profiling to discriminate between
genetically different Cynodon plants and estimate their degree of relatedness is
documented (Caetano-Annolle et al. 1995, 1997; Caetano-Annolle 1998; Ho et al. 1997;
Assefa et al. 1998; Anderson et al. 2001; Roodt et al. 2002; Zhang et al. 1999; Karaca et
al. 2002). DNA profiling techniques that have been successfully used in assessing
63
relatedness of Cynodon accessions include DNA fingerprinting (DAF) (Caetano-Annolle
et al. 1995, 1997; Caetano-Annolle 1998; Ho et al. 1997; Assefa et al. 1998; Anderson et
al. 2001), randomly amplified polymorphic DNA (RAPD) (Roodt et al. 2002), and
amplified fragment length polymorphism (AFLP) (Zhang et al. 1999; Karaca et al. 2002).
Though these studies have demonstrated the utility of DNA profiling in assessing the
degree of relatedness of Cynodon members, none has focused on assessing variations
within the cosmopolitan C. dactylon var. dactylon. This study was conducted to quantify
the genetic relatedness of C. dactylon var. dactylon accessions of disparate geographical
origin based on AFLP DNA markers.
64
MATERIALS AND METHODS
Plant materials and DNA isolation
Twenty-eight C. dactylon var. dactylon clonal·accessions (genotypes) originating
from 11 countries encompassing four continents were used in the study (Table 1 ). Plants
of each accession were grown in 15-cm diameter pots in the greenhouse. Total genomic
DNA samples were isolated from fresh leaf tissue of each accession with DNeasy plant
mini kit from QIAGEN Inc. (28159 Avenue Stanford, Valencia, CA). Prior to enzyme
digestion, genomic DNA was diluted to a final concentration of 1 OOng/ul.
AFLP DNA profiling
The AFLP analysis was performed as described by Vos et al. (1995). Lab
optimization and minor modifications were made according to Bai et al. (1999). Briefly,
isolated genomic DNA (approximately 300 ng) was double digested with EcoRI and
Msel restriction enzymes. AFLP adapters for both enzymes were then ligated to
restriction fragments. The ligated DNA was pre-amplified using a primer combination
based on the sequences of the adapters. Pre-amplification was performed for 30 cycles of
30s at 94°C, 1 min at 65°C, and 1 min at 72 °C. A total of eight AFLP selective primer
combinations (Table 2) with EcoRI primers being labeled with either IRD-700 or IRD-
800 infrared fluorescence dye were used for selective amplification. The following
touchdown thermal profile was used in all selective amplifications: 2 min at 94°C; 13
touchdown cycles at 94°C for 30s, 65°C for 30s (-0.7°C p~ cycle), and 72°C for 60s; 23
cycles at 94°C for 30s, 56°C for 30s, and 72°C for 60s. All PCR reactions were conducted
on a MJ PTC-100 thermocycler. One µ1 of the selective amplification PCR products and
65
1.2 µl of DNA size markers were loaded on a 6.5% denaturing Long Ranger gel (BMA,
Rockland, ME) in IX TBE buffer and run at a constant 2000V for 3.5 hr in a Li-Cor's
NEw® Global IR2-4200 DNA Analyzer (Li-Cor Inc. Lincoln, NE).
Eight accessions were used to test the reproducibility of the AFLP procedures.
Two sets of DNA samples were isolated separately from leaf tissues of each of the eight
plant accessions. One set of the DNA samples was used to produce one set of selectively
amplified PCR products using the previously described AFLP procedures. The second set
of DNA samples was processed through the digestion and ligation to produce eight pre
amplified PCR products. The eight pre-amplified PCR products were then selectively
amplified three times producing three sets of selectively amplified PCR Products. The
resulting four sets of selectively amplified PCR products from the two sets of DNA
samples were run on the same gel to measure reproducibility. The four PCR products
from the same accessions were run in adjacent lanes of the gel.
Data analysis for genetic relationships among accessions
AFLP bands throughout the gel profiles were scored visually as present (1 ),
absent (0) or ambiguous (9) at least twice for each accession. Data were compiled for
each accession in a data matrix and were analyzed using the NTSYS (Numerical
Taxonomy System) program, version 2.0 (Exeter Software, New York, NY). Similarity
coefficients were computed by using the SIMQUAL module. Cluster analysis was
performed according to the unweighted pair-group mean algorithm (UPGMA) within the
SAHN module of the NTSYS program. A principal coordinate analysis was performed
using the DCENTER module of the NTSYSpc program.
66
RESULTS AND DISCUSSION
Reproducibility of AFLP procedures
Reproducibility of the AFLP products was very high. Of the primer combinations
e-ACT/m-CAG and e-AAC/m-CAG amplified bands (data are not provided), 99.2% were
identical among the replicate DNA samples (Fig. I). The non-repeatable bands were
mainly faint bands that showed up in some PCR reactions, but not in others. These results
are consistent with previous reports regarding the reproducibility of AFLP markers
(Zhang et al. 1999; RoufMian et al. 2002) and further confirm that the AFLP technique
generates highly reproducible DNA profiles for Cynodon dactylon var. dactylon.
Genetic diversity and relatedness
The eight selective primer combinations totally amplified 590 bands, averaging
74±26 SD bands per primer combination, with most bands ranging in size from 50 to 500
bp {Table 2). Of the 590 bands scored, 443 (75%) were polymorphic by virtue of their
absence in at least one of the 28 accessions. The primer combination e-AGT/m-CAG
produced the greatest total number of bands (126) and the greatest number of
polymorphic bands (81), while e-AAC/m-CAC produced the fewest total (48) and
polymorphic (36) bands (Table 2).
Genetic similarity coefficients (SC) based on the AFLP data ranged from 0.53 to
0.98 for the 28 accessions {Table 3). The highest SC (0.98) for pair wise comparisons
among the 28 accessions was between accessions A12356 and A12358, respectively from
Zhejiang and Jiangsu provinces in east China. The lowest SC value (0.53) was for the
67
pair-wise comparisons of Nr 28 from Spain and A12378 from Australia, A12376 from
Australia and PI 251809 from Italy, and Cn-1 from Australia and PI 251809.
The UPGMA cluster tree generated by similarity coefficients grouped the 28
accessions into five major clusters designated as A, B, C, D, and E (Fig. 2). Cluster A
included four tetraploid (2n=4x=36) accessions, three (A12374, PI 291583 and PI
291584) from Zimbabwe and JT-1 from Japan. Field collection notes of W.W. Huffine
indicated that PI 291583, the commercial cultivar 'Australian Evergreen', was collected
from the turf plots of Marlborough nurseries in Zimbabwe. Genetic SC values among
these accessions within the cluster were very similar ranging from 0.69 to 0.82. Cluster
B was comprised of four tetraploid accessions (A12376, A12377, A12378, Cn-1) from
Australia and PI 295339 from Germany. Genetic SC values for accessions in cluster B
ranged from 0.78 to 0.82 with a mean of0.79±0.01. The very close relationship of the
four Australian accessions and PI 295339 suggests a common origin, but there is no
evidence that such was the case. Records indicate that PI 295339 was collected from
Ingelheim (Rheindamm) Germany and included in the U.S. Cynodon collection in 1964
(USDA, National Genetic Resources Program, 2003). Cluster C consisted oftetraploid
and hexaploid (2n=6x=54) accessions mainly from China. Genetic SC values for
accessions in cluster C ranged from 0. 76 to 0.98 with a mean of 0.85±0.06. Three sub
groups were evident. The first subgroup comprised only accession JT-2, which was
introduced to Japan from Dubai, United Arab Emirates (K. Razmjoo, personal
communication 1997). The second subgroup consisted of five tetraploid accessions from
China (A12262, Al2315, A1228, A12349 and A12361). The third sub-group was
comprised of five hexaploid (2n=6x=54) accessions from China. Three of the five
68
accessions, including 'Tifton 10' (Hanna et al., 1990), were collected in Shanghai and
the other two from adjacent Zhejiang (A12356) and Jiangsu (A12358) provinces.
Genetic SC for the five hexaploid accessions ranged from 0.86 to 0.98, with a mean of
0.92 ± 0.05. Hexaploidy is rare in Cynodon, having been reported for only a few plants
(Moffett and Hurcombe 1949; Powell et al. 1968; Felder 1967; Johnston 1975; Hanna et
al. 1990; Malik and Tripathi 1968). Hexaploid forms were not indicated for C. dactylon
var. dactylon in the taxonomic revision of the genus as listed by Harlan (1970), de Wet
and Harlan (1970), and Harlan et al. (1970a,b ), probably because their collection
contained none (Harlan and de Wet 1969). Relative to other Cynodon dactylon varieties,
the five hexaploid accessions in this study are morphologically most similar to plants of
variety dactylon and we accordingly consider them to best fit this taxon. Their dark
bluish green color is the one morphological characteristic that distinguishes them from
most other forms of C. dactylon var. dactylon.
The close genetic relationship of the tetraploid and hexaploid plants from China,
and their sympatric existence, suggest a common ancestry. We speculate that the
hexaploid race in China arose through hybridization either involving the union of an
unreduced female gamete with a reduced male gamete, or the spontaneous doubling of
chromosomes in a triploid zygote. Powell et al. (1968) attributed the origin of a
hexaploid plant found among F 1 progeny from a tetraploid C. dactylon x diploid C.
transvaalensis cross to spontaneous chromosome doubling at an early zygotic stage.
Felder (1967) reported the discovery of an autohexaploid among progeny plants resulting
from the self-pollination of a tetraploid C. dactylon plant. He hypothesized that the
autohexaploid plant resulted from the union of an unreduced female gamete and a
69
reduced male gamete. Functioning of unreduced female gametophytes (eggs) at relatively
high frequency has been reported in C. dactylon (Harlan and de Wet 1969), and has been
demonstrated in other polyploidy plant species as a mechanism effecting increase in
ploidy size (Harlan and de Wet 1963). Accordingly, the most likely scenario for the
origin of the Chinese hexaploid forms of C. dactylon var dactyl on was fertilization of an
unreduced egg with a reduced male gamete, especially assuming then as now a
prevalence oftetraploid forms in the region.
Cluster D was comprised of PI 290882 from South Africa, and two accessions
(PI 291582 and A12375) from Zimbabwe. Genetic SC values ranged from 0.70 to 0.83,
and averaged 0.76±0.07. Cluster E contained five accessions, Nr 24 from Bulgaria, Nr 28
from Spain, Nr 34 from Italy, and Nr 47 from France. Genetic SC values ranged
from.0.77 to 0.86, and averaged 0.83±0.02.
Principal coordinate analysis (PCA) (Fig. 3), in which PCl accounted for 24.8%
of total variation and PC2 13.9%, was generally consistent with results from the cluster
analysis in groupings of the accessions. Accessions originating from Australia, Asia,
Africa, and Europe were placed in distinct groups. The Asia accessions from China
separated into two distinct groups based on ploidy level. The PCA results indicated a
closer relationship of accessions of Australian and Asian origin compared with
accessions of European origin. The JT-1 accession from Japan was indicated as being
closely related to African accessions. The JT-2 accession from Dubai was closely related
to Chinese accessions and then to Australia accessions. It is possible that JT-1 and JT-2
were introduced into Dubai and Japan, respectively. Accessions of African origin clearly
were dispersed widely in the middle of the plot, clearly constituting the most diverse set
70
of accessions. The genetic SC values for the African origin accessions ranged from 0.62
to 0.83 (0. 70±0.06) verifying their broad genetic diversity relative to the other accessions
of common geographic origin.
The geographic clustering of C. dactylon var. dactylon accessions based on
AFLP polymorphisms is consistent with variations found in morphological, adaptive, and
cytogenetic characteristics. Clearly, geographic origin was a significant factor in their
genetic differentiation. The adaptional characteristics of C. dactylon var. dactylon vary
widely as a function of their evolution under different climatic and edaphic conditions
(Harlan and de Wet 1969; Harlan et al. 1970b, c, d). The taxon is distributed across
environments ranging from tropical to temperate and arid to humid. These forms differ
in response not only to temperature and precipitation differences but also to other biotic
and abiotic stresses associated with the different climatic conditions. Harlan and de Wet
(1969) observed that crossing C. dactylon var. dactylon plants of different races and/or
widely divergent geographic sources frequently resulted in reduced fertility due to
chromosomal structural differences mainly resulting from translocations and inversions.
The genetic isolation of plant populations based on chromosomal structural constitution
would have allowed these respective populations to be further genetically differentiated
by selective forces for adaptation to specific environments.
The genetic relationship of C. dactylon var. dactylon forms of different
geographic origins and the geographic differentiation pattern as indicated by the results of
this study have implications relative to germplasm collection, preservation, and
utilization. The results clearly indicate that comprehensive germplasm collection in
71

major geographic regions such as Africa, Australia, and Southeast Asia is required to
sample the full extent of the available variation.
72
REFERENCES
Anderson M.P., C.M. Taliaferro, D.L. Martin, and C. S. Anderson. 2001.Comparative
DNA profiling ofU-3 turfbermudagrass strains. Crop Sci. 41: 1184-1189.
Assefa S., C.M. Taliaferro, M.P. Anderson, B.G. de los Reyes, and R.M. Edwards. 1998.
Diversity among Cynodon accessions and taxa based on DNA amplification
fingerprinting. Genome. 42: 465-474.
Bai, G-H., H. Tefera, M. Ayele, and H. Nguyen. 1999. AFLP analysis oftef and its
relatives. Crop Sci. 39: 819-824.
Caetano-Anolles, G. 1998. DNA analysis ofturfgrass genetic diversity. Crop sci.
38: 1415-1424.
Caetano-Anolle, G., L. M. Callahan, and P.M.Gresshoff. 1997. The origin of
bermudagrass (Cynodon) off-types inferred by DNA amplification fingerprinting.
Crop Sci. 37: 81-87.
Caetano-Anolles, G., L.M.Callahan, P.E. Williams, KR.Weaver, and P.M. Gresshoff.
1995. DNA amplification fingerprinting analysis ofbermudagrass (Cynodon):
genetic relationships between species and interspecific crosses. Theor. Appl.
Genetics. 91: 228-235.
Felder, M.R. 1967. Chromosome associations in triploid Cynodon hybrids. M.S. thesis.
Oklahoma State Univ., Stillwater.
Hanna, W.W., G.W. Burton, and A.W. Johnson. 1990. Registration of 'Tifton 10' turf
bermudagrass. Crop Sci. 30: 355-1356.
Harlan, J.R. 1970. Cynodon species and their value for grazing or hay. Herbage Abs.
40: 233-238.
73
Harlan, J.R, and J.M.J. de Wet. 1969. Sources of variation in Cynodon dactylon (L.)
Pers. Crop Sci. 9: 774-778.
Harlan, J.R and J.M.J. de Wet. 1963. Role of apomixis in the evolution of the
Bothriochloa-Dichanthium complex. Crop Sci. 3:314-316.
Harlan, J.R, J.M.J. de Wet, W.W. Huffine, and J.R Deakin. 1970a. A guide to the
species of Cynodon (Gramineae). Bull. B-673. Okla. Agric. Exp. Stn., Stillwater.
Harlan, J.R, J.M.J. de Wet, and K.M. Rawal. 1970b. Geographic distribution of the
species of Cynodon LC.Rich (Gramineae). East Afri. Agric. Fores. J. 36: 220-
226.
Harlan, J.R, J.M.J. de Wet, and K.M. Rawal. 1970c. Origin and distribution of the
seleucidus race of Cynodon dactylon (L.) Pers. var. dactylon (Gramineae).
Euphytica 19: 465-469.
Harlan, J.R, J.M.J. de Wet, K.M. Rawal, M.R Felder, and W.L. Richardson. 1970d.
Cytogenetic studies in Cynodon L. C. Rich. (Gramineae). Crop Sci. 10: 288-291.
Ho, C.Y., S.J. McMaugh, A.N.Wilton, I.J.McFarlane, and A.G. Mackinlay. 1997. DNA
amplification variation within cultivars of turf-type couch grasses (Cynodon spp.).
Plant Cell Reports. 16: 797-801.
Johnston, RA. 1975. Cytogenetics of some hexaploid x tetraploid hybrids in Cynodon.
M.S. thesis. Oklahoma State Univ., Stillwater.
Karaca, M., Saha, S., Zipf, A., Jenkins, J.N., and Lang, D.J. 2002. Genetic diversity
among bermudagrass (Cynodon spp.): Evidence from chloroplast and nuclear
DNA fingerprinting. Crop Sci. 42: 2118-2127.
Malik, C.P., and RC. Tripathi. 1968. Cytological evolution within the Cynodon
74
dactylon complex. Biologisches Zentrablatt 87: 625-627.
Moffett, A.A., and R. Hurcombe. 1949. Chromosome numbers of South African
grasses. Heredity 3: 369-373
Powell, J.B., G.W. Burton, and C.M. Taliaferro. 1968. A hexaploid clone from a
tetraploid x diploid cross in Cynodon. Crop Sci. 8:184-185.
Roodt, R., J.J. Spies and T.H. Burger. 2002. Preliminary DNA fingerprinting of the turf
grass Cynodon dactylon (Poaceae: Chloridoideae). Bothalia. 32 (1): 117-122.
RoufMian, M.A., A.A. Hopkins, and J.C. Zwonizer. 2002. Determination of genetic
diversity in tall fescue with AFLP markers. Crop Sci. 42: 944-950.
USDA, ARS, National Genetic Resources Program. Germplasm Resources Information
Network- (GRIN). [Online Database] National Germplasm Resources Laboratory,
Beltsville, Maryland. Available: http://www.ars-grin.gov/cgi
in/npgs/html/acc_search.pl?accid=295339 (05 August 2003)
Vos, P., R. Rogers, M. Bleeker, M. Reijans, T. van de Lee, M. Homes, A. Frijters, J. Pot,
J. Peleman, M. Kuiper and M. Zabeau. 1995. AFLP: a new technique for DNA
fingerprinting. Nucleic Acids Research. 23: 4407-4414.
Zhang, L.-H., P. Ozias-Akins, G. Kochert, S. Kresovich, R. Dean and W. Hanna. 1999.
Differentiation ofbermudagrass (Cynodon spp.) genotypes by AFLP analyses.
Theor.Appl. Genet. 98: 895-902.
75
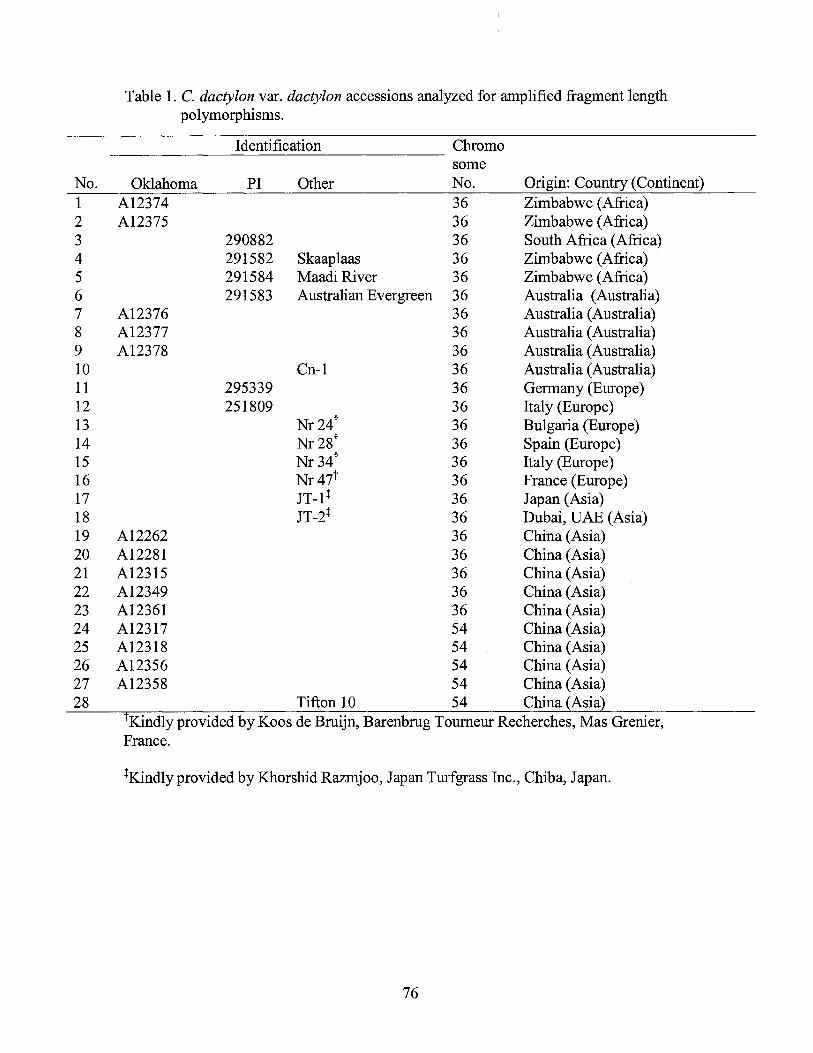
No. 1 2 3 4 5 6 7 8 9 10 11 12 13 14 15 16 17 18 19 20 21 22 23 24 25 26 27 28
Table 1. C. dactylon var. dactylon accessions analyzed for amplified fragment length polymorphisms.
Identification Chromo some
Oklahoma PI Other No. Origin: Country (Continent) A12374 36 Zimbabwe (Africa) A12375 36 Zimbabwe (Africa)
290882 36 South Africa (Africa) 291582 Skaaplaas 36 Zimbabwe (Africa) 291584 Maadi River 36 Zimbabwe (Africa) 291583 Australian Evergreen 36 Australia (Australia)
A12376 36 Australia (Australia) A12377 36 Australia (Australia) A12378 36 Australia (Australia)
Cn-1 36 Australia (Australia) 295339 36 Germany (Europe) 251809 36 Italy (Europe)
Nr24t 36 Bulgaria (Europe) Nr28t 36 Spain (Europe) Nr34t 36 Italy (Europe) Nr47t 36 France (Europe) JT-1 + 36 Japan (Asia) JT-2+ 36 Dubai, UAE (Asia)
A12262 36 China (Asia) A12281 36 China (Asia) A12315 36 China (Asia) A12349 36 China (Asia) A12361 36 China (Asia) A12317 54 China (Asia) A12318 54 China (Asia) A12356 54 China (Asia) A12358 54 China (Asia)
Tifton 10 54 China (Asia) tK.indly provided by Koos de Bruijn, Barenbrug Tourneur Recherches, Mas Grenier, France.
+Kindly provided by Khorshid Razmjoo, Japan Turf grass Inc., Chiba, Japan.
76
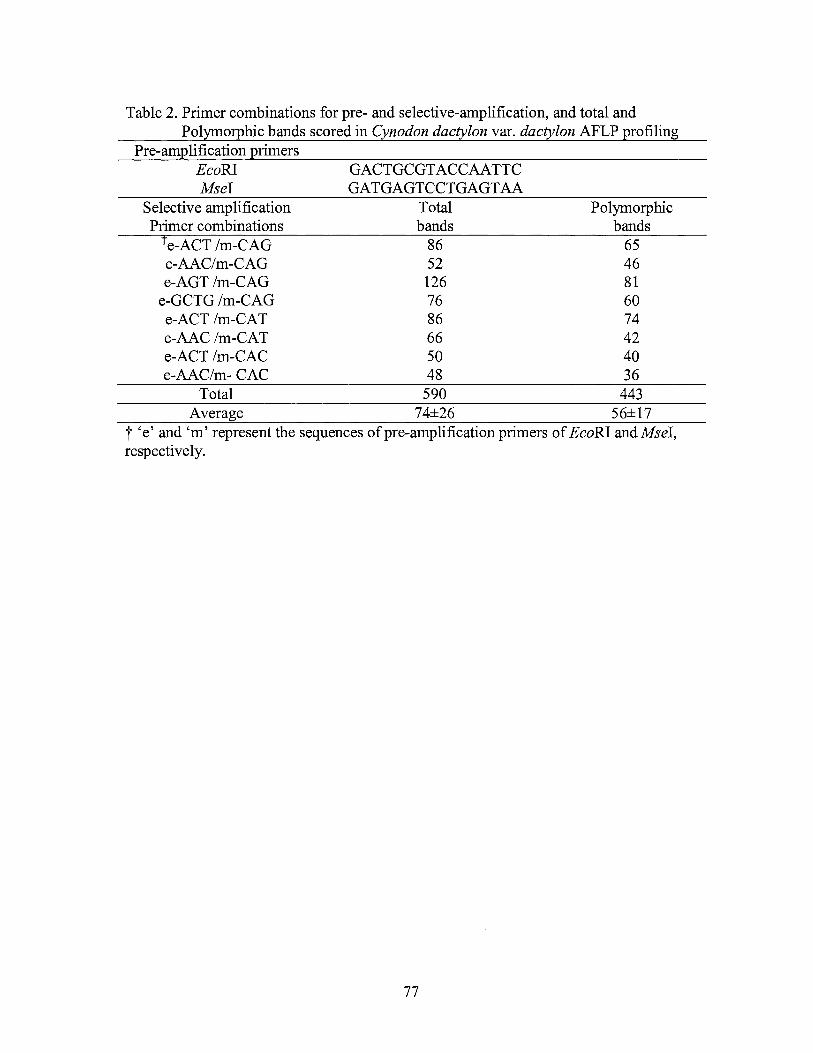
Table 2. Primer combinations for pre- and selective-amplification, and total and Polymorphic bands scored in Cynodon dactylon var. dactylon AFLP profiling
Pre-amplification primers Eco RI Msel
Selective amplification Primer combinations
t e-ACT lm-CAG e-AAClm-CAG e-AGT lm-CAG
e-GCTG lm-CAG e-ACT Im-CAT e-AAC Im-CAT e-ACT lm-CAC e-AAClm- CAC
Total
GACTGCGTACCAATTC GATGAGTCCTGAGTAA
Total bands
86 52 126 76 86 66 50 48 590
Polymorphic bands
65 46 81 60 74 42 40 36
443 Average 7 4±26 56±17
t 'e' and 'm' represent the sequences of pre-amplification primers of Eco RI and Msel, respectively.
77
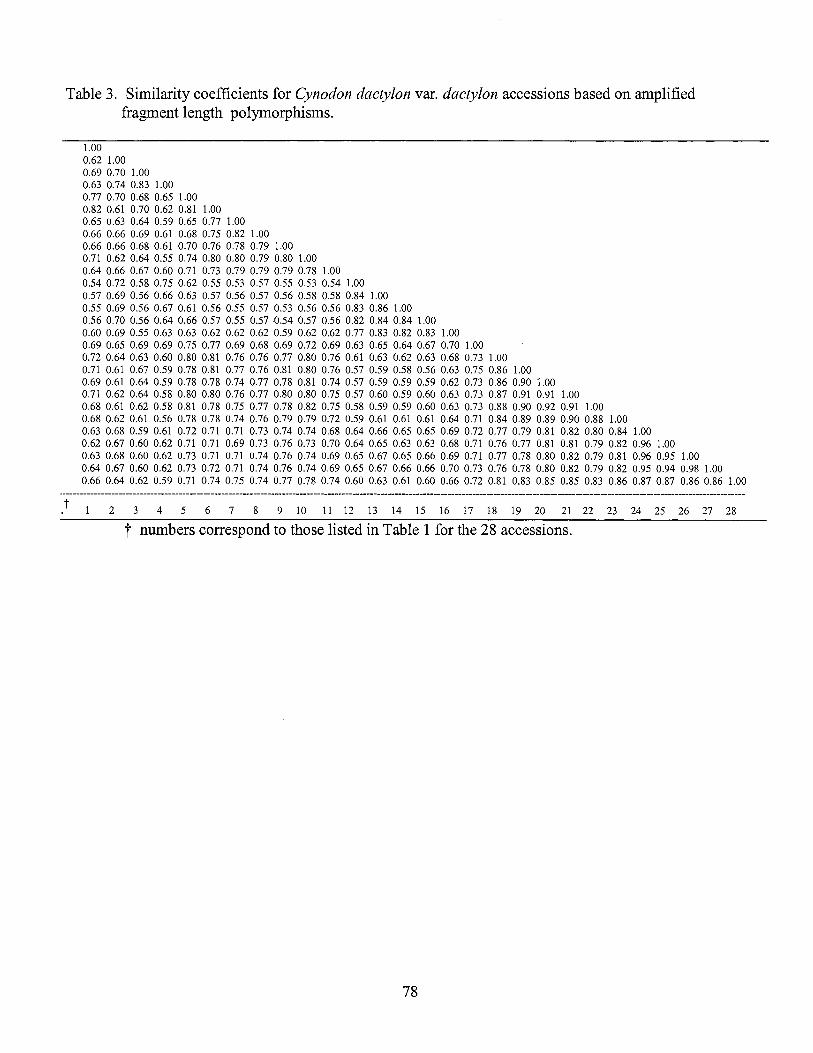
Table 3. Similarity coefficients for Cynodon dactylon var. dactylon accessions based on amplified fragment length polymorphisms.
1.00 0.62 1.00 0.69 0.70 1.00 0.63 0.74 0.83 1.00 0.77 0.70 0.68 0.65 1.00 0.82 0.61 0.70 0.62 0.81 1.00 0.65 0.63 0.64 0.59 0.65 0.77 1.00 0.66 0.66 0.69 0.61 0.68 0.75 0.82 1.00 0.66 0.66 0.68 0.61 0.70 0.76 0.78 0.79 1.00 0.71 0.62 0.64 0.55 0.74 0.80 0.80 0.79 0.80 1.00 0.64 0.66 0.67 0.60 0.71 0.73 0.79 0.79 0.79 0.78 1.00 0.54 0.72 0.58 0.75 0.62 0.55 0.53 0.57 0.55 0.53 0.54 1.00 0.57 0.69 0.56 0.66 0.63 0.57 0.56 0.57 0.56 0.58 0.58 0.84 1.00 0.55 0.69 0.56 0.67 0.61 0.56 0.55 0.57 0.53 0.56 0.56 0.83 0.86 1.00 0.56 0.70 0.56 0.64 0.66 0.57 0.55 0.57 0.54 0.57 0.56 0.82 0.84 0.84 1.00 0.60 0.69 0.55 0.63 0.63 0.62 0.62 0.62 0.59 0.62 0.62 0.77 0.83 0.82 0.83 1.00 0.69 0.65 0.69 0.69 0.75 0.77 0.69 0.68 0.69 0.72 0.69 0.63 0.65 0.64 0.67 0.70 1.00 0.72 0.64 0.63 0.60 0.80 0.81 0.76 0.76 0.77 0.80 0.76 0.61 0.63 0.62 0.63 0.68 0.73 1.00 0.71 0.61 0.67 0.59 0.78 0.81 0.77 0.76 0.81 0.80 0.76 0.57 0.59 0.58 0.56 0.63 0.75 0.86 1.00 0.69 0.61 0.64 0.59 0.78 0.78 0.74 0.77 0.78 0.81 0.74 0.57 0.59 0.59 0.59 0.62 0.73 0.86 0.90 1.00 0.71 0.62 0.64 0.58 0.80 0.80 0.76 0.77 0.80 0.80 0.75 0.57 0.60 0.59 0.60 0.63 0.73 0.87 0.91 0.91 1.00 0.68 0.61 0.62 0.58 0.81 0.78 0.75 0.77 0.78 0.82 0.75 0.58 0.59 0.59 0.60 0.63 0.73 0.88 0.90 0.92 0.91 1.00 0.68 0.62 0.61 0.56 0.78 0.78 0.74 0.76 0.79 0.79 0.72 0.59 0.61 0.61 0.61 0.64 0.71 0.84 0.89 0.89 0.90 0.88 1.00 0.63 0.68 0.59 0.61 0.72 0.71 0.71 0.73 0.74 0.74 0.68 0.64 0.66 0.65 0.65 0.69 0.72 0.77 0.79 0.81 0.82 0.80 0.84 1.00 0.62 0.67 0.60 0.62 0.71 0.71 0.69 0.73 0.76 0.73 0.70 0.64 0.65 0.63 0.63 0.68 0.71 0.76 0.77 0.81 0.81 0.79 0.82 0.96 1.00 0.63 0.68 0.60 0.62 0.73 0.71 0.71 0.74 0.76 0.74 0.69 0.65 0.67 0.65 0.66 0.69 0.71 0.77 0.78 0.80 0.82 0.79 0.81 0.96 0.95 1.00 0.64 0.67 0.60 0.62 0.73 0.72 0.71 0.74 0.76 0.74 0.69 0.65 0.67 0.66 0.66 0.70 0.73 0.76 0.78 0.80 0.82 0.79 0.82 0.95 0.94 0.98 1.00 0.66 0.64 0.62 0.59 0.71 0.74 0.75 0.74 0.77 0.78 0.74 0.60 0.63 0.61 0.60 0.66 0.72 0.81 0.83 0.85 0.85 0.83 0.86 0.87 0.87 0.86 0.86 1.00
t 2 3 4 5 6 7 8 9 10 11 12 13 14 15 16 17 18 19 20 21 22 23 24 25 26 27 28
t numbers correspond to those listed in Table 1 for the 28 accessions.
78
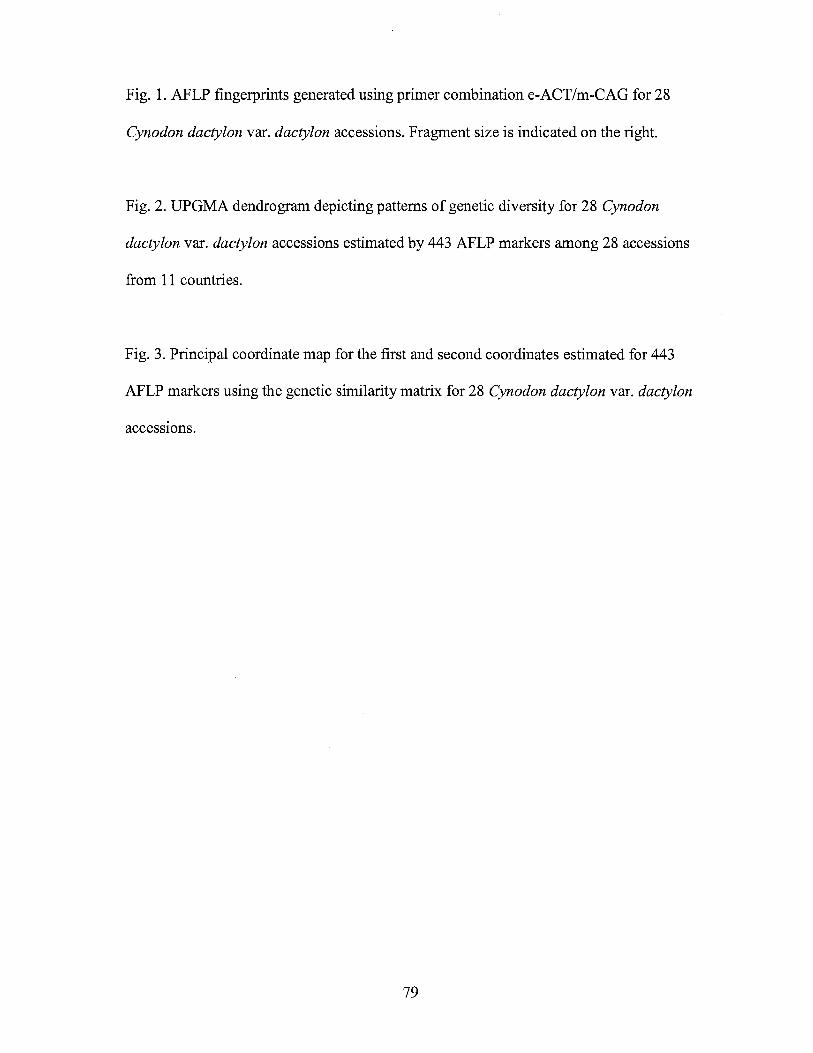
Fig. 1. AFLP fingerprints generated using primer combination e-ACT/m-CAG for 28
Cynodon dactylon var. dactylon accessions. Fragment size is indicated on the right.
Fig. 2. UPGMA dendrogram depicting patterns of genetic diversity for 28 Cynodon
dactylon var. dactylon accessions estimated by 443 AFLP markers among 28 accessions
from 11 countries.
Fig. 3. Principal coordinate map for the first and second coordinates estimated for 443
AFLP markers using the genetic similarity matrix for 28 Cynodon dactylon var. dactylon
accessions.
79
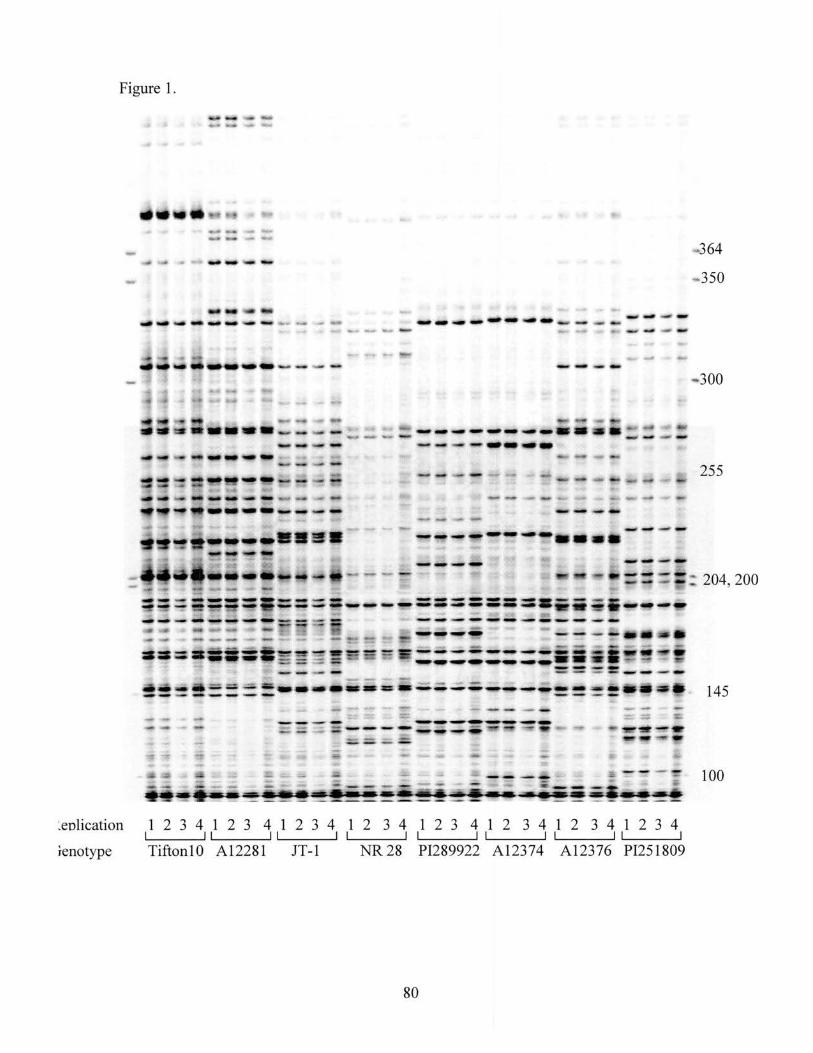
Figure 1.
'.eolication
knotype
--
.,--~~ ~ ... ''-*""'
----~ ---. ..,,. ............. --- - _.__, ____ ._ ___ ------
-- .. -----·------ - ----• --W!l· flo'# _,,
· - ·-·-·--·-..... :!· _ ::, _,, ___ _. ______ _ ----- -----··---- ----- . ---
-..,,,4 -----
.... 350
- --. ~•••--•e-• .. -~ '" ~ -~ --..... - 255 s -- ~_..,. _._ ___ ...,, ...... ----- ...... ---- ----
-- -,._, ___ ~
= -----·- ~..... . ._.,.._.._..~ ........... ~~ ~=~----~----~ - -~ ~'= - ,,. -"'
_ . _...,, "- ... ::::= = = ·-----.. -.
Wt • a -- • ,..... at ~·- 4- ., ~ - -- ~ ... ..._. ~ a '~ -~ _..... ,w, .... _:; ·4<h . -·~ _..:., . - ---~ ~ -_·. __ ;;, .~-- -- C"· .~ ~ - - .·"'*""° ~ - ..... ~ ~ --~-: . .:·& . ~ .-~-~~·~!!7tM!~'.~~-------~~·--l!~~~k·~· 1234123 41234 12 34 123 412 3412 341234
TiftonlO Al2281 JT-1 NR 28 PI289922 A12374 A12376 PI251809
80
204,200
145
100
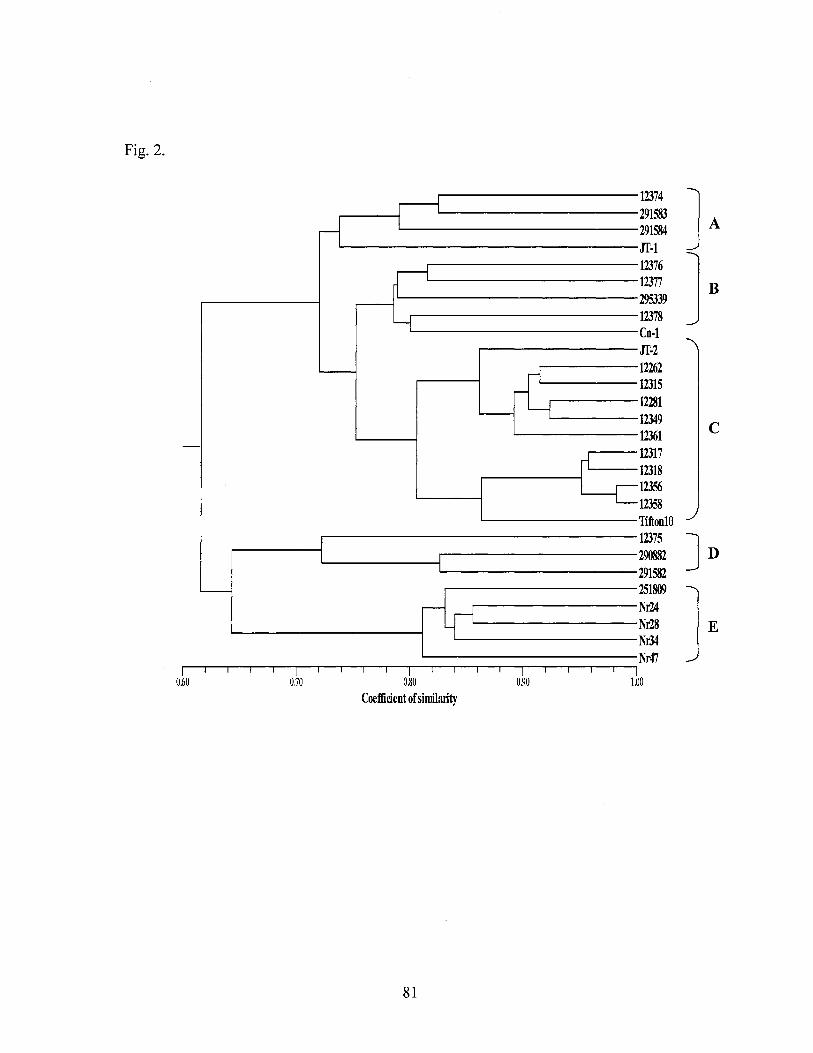
Fig. 2.
~
-
-
~
0.60 0.70
I
I I
I
r -
~
I I
--r 0.80
Coefficient of similarity
81
_-c
090
12374 291583 291584 Jf-1 12376 12377 295339 12378 Cn-1 Jf-2 12262 12315 12281 12349 12361 12317 12318 12356 12358 Tifton10 12375 290882 291582 251809 Nr24 Nr28 Nr34 Nr47
1.00
C
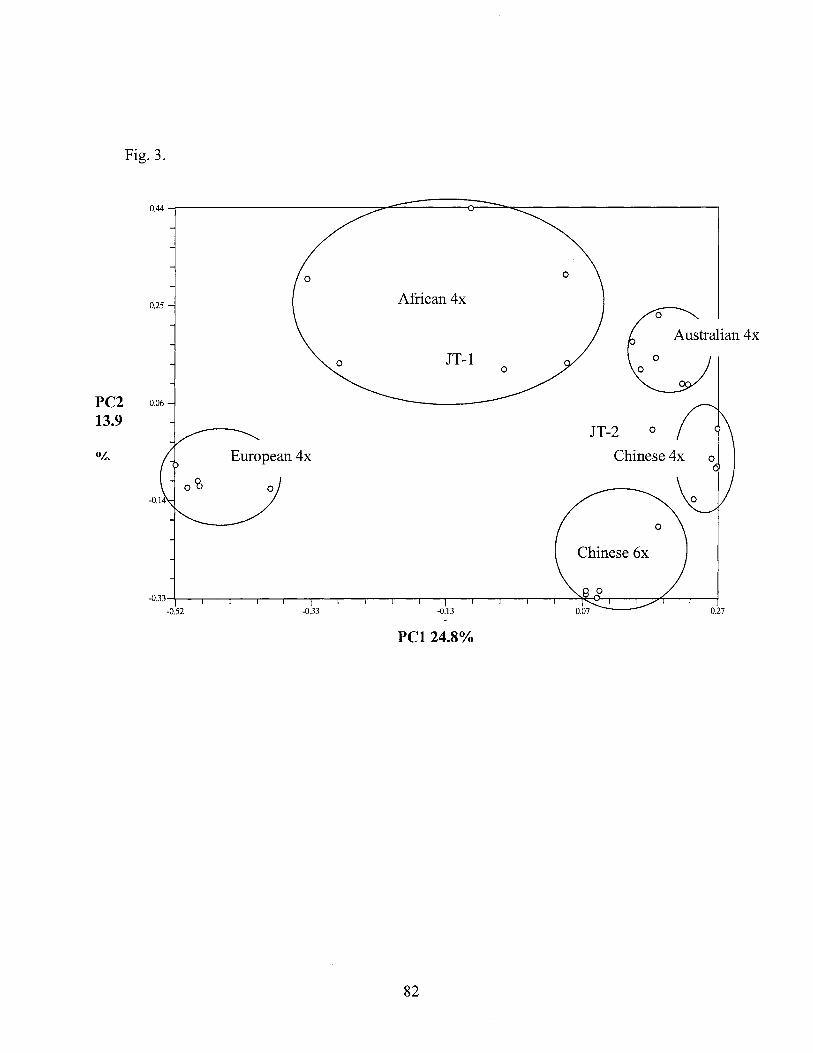
Fig. 3.
0.44 --,---------------=,.......::::::::::===~;::::::::::...""<::"" __________ --,
025 African4x
Australian 4x
JT-1
PC2 0.06
13.9 JT-2 0
O.f... European4x
0
0
Chinese 6x
-0.33 -0.52 -0.33 -0.13 0.27
PCl 24.8%
82
CHAPTERV
GENETIC DIVERSITY OF CYNODON TRANSV AALENSIS BURTT-DA VY AND
ITS RELATEDNESS TO HEXAPLOID C. DACTYLON (L.) PERS.
AS INDICATED BY AFLP MARKERS
Y.Q. Wu*, C.M. Taliaferro, G.H. Bai, and M.P. Anderson
EXECUTIVE SUMMARY
Cynodon transvaalensis is used as turf and has been hybridized with C. dactylon var.
dactylon to produce high quality turf bermudagrass cul ti vars. Little information exists on
the magnitude of genetic variation within the South Africa indigenous species. Wu et al.
(xxxx-xxxx) demonstrated variation among 14 C. transvaalensis accessions for AFLP
DNA markers and characterized their relatedness to two C. dactylon var. dactylon
accessions and three derivative interspecific hybrids. The results suggest that there is
sufficient genetic variation within C. transvaalensis for genetic improvement.
Short title: Cynodon transvaalensis Genetic Diversity
Y.Q. Wu, C.M. Taliaferro, and M.P. Anderson, Plant and Soil Sciences Dep., Oklahoma
State Univ., Stillwater, OK 74078; G.H. Bai, USDA-ARS/Dep. of Agronomy, Kansas
State Univ., Manhattan, KS 66506. Received ____ . *Corresponding author
83
ABSTRACT
Cynodon transvaalensis Burtt-Davy (African bermudagrass) is valued as turf and
for use in interspecific hybridization with C. dactylon (L.) Pers. var. dactylon to produce
turf cultivars. Little information is available regarding the magnitude of genetic variation
within the taxon. Accordingly, this study was undertaken to evaluate the genetic diversity
among 14 C. transvaalensis accessions and to examine the phylogenetic relatedness of
C. transvaalensis, two hexaploid (2n=6x=54) C. dactylon var. dactylon accessions, two
C. transvaalensis by hexaploid C. dactylon var. dactylon interspecific tetraploid
(2n=4x=36) F 1 hybrids and one putative tetraploid C. dactylon var. dactylon by C.
transvaalensis triploid (2n=3x=27) F1 hybrid. Fluorescence-labeled amplified fragment
length polymorphism (AFLP) DNA profiling was used to study the genetic relationships
among these accessions. A total of381 polymorphic AFLP markers were amplified from
13 primer combinations. The 14 C. transvaalensis accessions and. the putative triploid F 1
hybrid clustered into one group and had genetic dissimilarity coefficients ranging from
0.01 to 0.51. The 14 C. transvaalensis accessions had genetic dissimilarity coefficients
ranging from 0.01 to 0.34. The C. dactylon var. dactylon accessions and the two
tetraploid F 1 hybrids clustered in the second group, with genetic dissimilarity coefficients
ranging from 0.17 to 0.33. The tetraploid F1 hybrids were more closely related to C.
dactylon var. dactylon than to C. transvaalensis, while the opposite was true for the
putative triploid F 1 hybrid. The results indicate the presence of genetic diversity in C.
transvaalensis that could be exploited in intra- and inter-specific breeding improvement.
84
INTRODUCTION
Cynodon transvaalensis Burtt-Davy (African bermudagrass) is valued as turf and
for use in interspecific hybridization with C. dactylon (L.) Pers. var. dactylon to produce
turf cultivars. African bermudagrass, a diploid (2n=2x= 18) species, is indigenous to the
southwestern Transvaal and the northern part of the central Cape Province of South
Africa (Harlan et al., 1970a) where it is found primarily near wet sites (Harlan et al.,
1970b ). Plants of C. transvaalensis are distinctive because of their small size, yellow
green color, and erect narrow leaves, and 2-4 racemes per inflorescence with the spikelets
loosely arranged on the racemes (Harlan et al., 1970b ). C. transvaalensis is adapted to
much cooler climates and is more winter hardy than needed in its natural distribution
(Harlan et al., 1970a). The rhizomatous and stoloniferous plants spread to form a dense
sod because of high shoot density. Because of their dense sod, fine leaf texture, and
ability to tolerate relatively low mowing heights, C. transvaalensis cultivars such as
'Florida' and 'Uganda' have been used on sporting surfaces such as golf course putting
greens, bowling greens, and tennis courts (Juska and Hanson, 1964; Roux, 1969).
Characteristics that limit the use of C. transvaalensis as turf include relatively high
fertility and water requirements, summer decline in turf quality when temperatures are
high (~38°C), and intolerance to sustained very low (~3.2mm) mowing heights (Juska
and Hanson, 1964).
Abbreviations: AFLP, amplified fragment length polymorphism; DAF, DNA
amplification fingerprinting; RAPD, random amplified polymorphic DNA; RFLP,
restriction fragment length polymorphism.
85
Information on the magnitude of variation within C. transvaalensis is limited. C.
transvaalensis plants were described by de Wet and Harlan (1971) as being very uniform
in appearance. However, substantial variation for morphological and adaptation traits has
been observed in segregating populations of C. transvaalensis (Taliaferro, 1992). The
most important use of C. transvaalensis has been in interspecific hybridization with
tetraploid C. dactylon var. dactylon to produce clonally-propagated F1 hybrids. Many turf
bermudagrass cultivars, including the industry standards 'Tifgreen' and 'Tifway', were
produced by this method (Burton, 1973, 1991; Alderson and Sharp, 1995). However,
relatively few C. transvaalensis accessions have been used in breeding, genetic studies,
or as commercial turf cultivars (Taliaferro, 1992, 1995).
Few hexaploid Cynodon plants have been reported, one being C. dactylon cv
'Tifton 10' (Hanna et al., 1990). Tifton 10 originated as a vegetative introduction
collected by G.W. Burton in 1974 in Shanghai, China. Its major distinguishing features
are coarse-textured foliage with a natural dark bluish-green color, rapid establishment
rate, and early green-up in spring (Hanna et al., 1990). The morphological characteristics
of Tifton 10 are most consistent with plants classified as C. dactylon var. dactylon in
Harlan et al.'s (1970b) taxonomic classification for the genus Cynodon. We have crossed
C. transvaalensis with Tifton 10 to produce tetraploid F 1 plants.
DNA profiling has been used to estimate genetic relatedness among Cynodon
plants. DNA amplified fingerprinting (DAF) was used to identify cultivars and study the
origin of off-types found in cultivars (Caetano-Anolles, 1998; Caetano-Anolles et al.,
1995; Ho et al., 1997; Anderson et al., 2001). Assefa et al. (1999) used DAF to assess
genetic relatedness within and among eight Cynodon taxa. Roodt et al. (2002) used
86
randomly amplified polymorphic DNA (RAPD) profiles to determine genetic relatedness
of Cynodon cultivars in South Africa and to assess genetic variation. Zhang et al. (1999)
and Karaca et al. (2002) respectively differentiated between 27 and 31 Cynodon
genotypes using amplified fragment length polymorphism (AFLP) profiles.
The objectives of this study were to assess the genetic diversity within C.
transvaalensis accessions, and to quantify the genetic relatedness among C.
transvaalensis and hexaploid C. dactylon var. dactylon accessions, and three interspecific
hybrids based on AFLP DNA profiling.
87
MATERIALS AND METHODS
Plant Materials and DNA Isolation
Plant materials consisted of 19 bermudagrass accessions including 14 African
bermudagrasses, two hexaploid (2n=6x=54) C. dactylon var. dactylon accessions, two
tetraploid F 1 hybrid plants from diploid C. transvaalensis by hexaploid C. dactylon var.
dactylon cv 'Tifton 10' crosses, and triploid PI 290897 (Table 1). All of the accessions
were clonally propagated single plants. PI 290897 was included based on its
classification as C. transvaalensis in the USDA-ARS National Plant Germplasm System
(NPGS), Germplasm Resources Information Network (GRIN) database (National Plant
Germplasm System, 2003). During the course of our investigation, DNA profiling data
showed that PI 290897 is significantly different from other C. transvaalensis genotypes.
We determined that PI 290897 is not C. transvaalensis based on coarser foliage
morphology and chromosome number (2n=3x=27). Chromosome number was
determined using the leaf squash procedure of Powell (1968).
The plants were grown in a greenhouse at the Agronomy Research Station,
Oklahoma State University, Stillwater, OK, in 15 cm diameter pots containing Metro
Mix 250 growing medium (Scotts-Sierra Horticultural Products Co., Marysville, OH).
They were watered daily and fertilized biweekly with M-77 Peat-lite Special water
soluble fertilizer (Scotts-Sierra Horticultural Products Co., Marysville, OH). All plants
were actively growing and healthy at time of sampling. Bermudagrass genomic DNA
samples were isolated from fresh leaf tissue with DNeasy Plant Mini Kit (QIAGEN Inc.,
Valencia, CA).
88
AFLP Analysis
AFLP analysis was performed as described by Vos et al. (1995), except for minor
modifications as described by Bai et al. (1999). Briefly, 300 ng genomic DNA was
double digested with EcoRI and MseI restriction enzymes. AFLP adapters for both
enzymes were then ligated to the restriction fragments. The ligated DNA was pre
amplified using a primer combination based on the sequences of the adapters. The
sequences of EcoRI and Msel primers were 5-GACTGCGTACCAATTC and
5-GATGAGTCCTGAGTAA, respectively. Pre-amplification started at 94 °C for 1 min,
then 30 cycles of 30 s at 94 °C followed by 1 min each at 65°C and 72 °C. A 1 % agarose
gel was used to check the products of pre-amplification. Thirteen pairs of selective AFLP
primers (Table 2) with EcoRI primers labeled with infrared (IR) fluorescence were used
for selective amplification. All PCR reactions were conducted on a MJ PTC-100
thermocycler (MJ Research, Inc., Waltham, MA). A 10 µ1 PCR mixture consisted of 1.0
µ1 1 OX PCR buffer, 1.0 µ1 25mM MgCh, 0.2 µl 1 OmM dNTP, 0.4 µl labeled EcoRI
primer, 0.04 µl Taq polymerase, 0.35 µl MseI primer, 5.01 µ1 H20, and 2.0 µ11:10
diluted preamplified template DNA. All selective amplifications were conducted using
the following touchdown thermal profile: one cycle of 2 min at 94 °C; 13 touchdown
cycles of 30 s at 94 °C, 30 s at 65 °C (-0. 7 °C per cycle), 60 s at 72 °C; 23 cycles of 30 s at
94 °C, 30 sat 56 °C, 60 sat 72 °C. One µ1 of the selectively amplified PCR products were
loaded on a 6.5% denaturing Long Ranger gel (BMA, Rockland, ME) and run in IX TBE
buffer at 1500V for 3.5 hr in a Li-Cor automated sequencer (Li-Cor Inc., Lincoln, NE).
DNA size standard (Li-Cor Inc., Lincoln, NE) was loaded on first and last lanes of a gel
as a molecular weight reference.
89
DNA samples from 8 of the 19 accessions were used to test the reproducibility of
the AFLP procedures. Two DNA samples were independently isolated from each of the
eight plant accessions, thus constituting two sets of eight samples. The DNA samples in
one set were amplified once while those in the second set were amplified three times in
each case using the amplification steps outlined above. The amplified DNA products
from the two sets were treated as four replicates and run on the same gel to measure
reproducibility. The primer combinations e-ACT/m-CAG, e-AAC/m-CAG, e-ACT/m
CAT, and e-AAC/m-CAT, were used for the selective amplification.
Data Analysis
Polymorphic DNA bands were scored as present (1), absent (0) or ambiguous (9)
for each accession by visual inspection. In order to insure accurate scoring, all markers
were scored at least twice. Data were compiled in a binary data matrix. Relative genetic
dissimilarity was estimated according to Nei and Li (1979). Similarity was calculated as
Sxy=2nx/(nx+ny), where nx and ny were the numbers of fragments in individuals X and Y,
respectively, and nxy was the number of the fragments shared between individuals.
Dissimilarity, D, was calculated by the equation Dxy=l-Sxy using Microsoft Excel.
Cluster analysis was performed with the NTSYS-pc (Numerical Taxonomy System)
version 2.0 program (Exeter Software, New York, NY) using the unweighted pair-group
mean algorithm (UPGMA) within the SAHN module. A goodness-of-fit test of
cophenetic matrix to similarity matrix was performed using the MXCOMP module in the
NTYSY-pc program. A principal component analysis was performed using the
DCENTER module of the NTSYS-pc program.
90
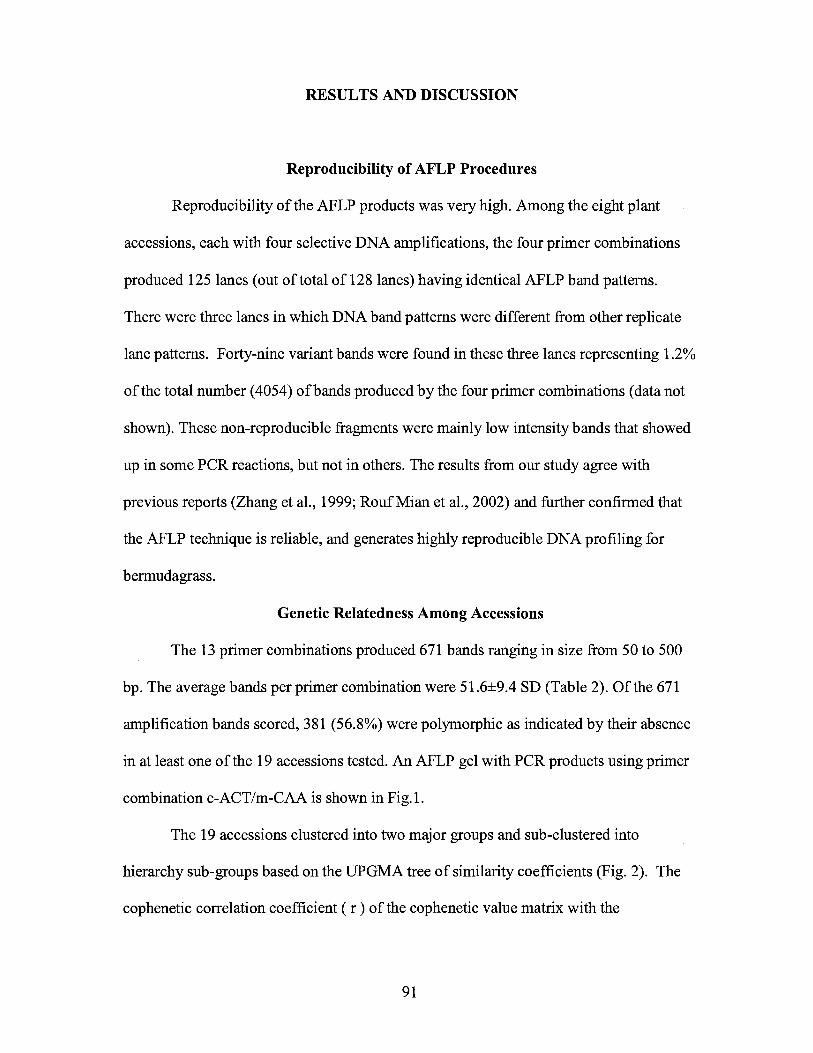
RESULTS AND DISCUSSION
Reproducibility of AFLP Procedures
Reproducibility of the AFLP products was very high. Among the eight plant
accessions, each with four selective DNA amplifications, the four primer combinations
produced 125 lanes (out of total of 128 lanes) having identical AFLP band patterns.
There were three lanes in which DNA band patterns were different from other replicate
lane patterns. Forty-nine variant bands were found in these three lanes representing 1.2%
of the total number (4054) of bands produced by the four primer combinations (data not
shown). These non-reproducible fragments were mainly low intensity bands that showed
up in some PCR reactions, but not in others. The results from our study agree with
previous reports (Zhang et al., 1999; RoufMian et al., 2002) and further confirmed that
the AFLP technique is reliable, and generates highly reproducible DNA profiling for
bermudagrass.
Genetic Relatedness Among Accessions
The 13 primer combinations produced 671 bands ranging in size from 50 to 500
bp. The average bands per primer combination were 51.6±9.4 SD (Table 2). Of the 671
amplification bands scored, 381 (56.8%) were polymorphic as indicated by their absence
in at least one of the 19 accessions tested. An AFLP gel with PCR products using primer
combination e-ACT/m-CAA is shown in Fig.l.
The 19 accessions clustered into two major groups and sub-clustered into
hierarchy sub-groups based on the UPGMA tree of similarity coefficients (Fig. 2). The
cophenetic correlation coefficient ( r ) of the cophenetic value matrix with the
91
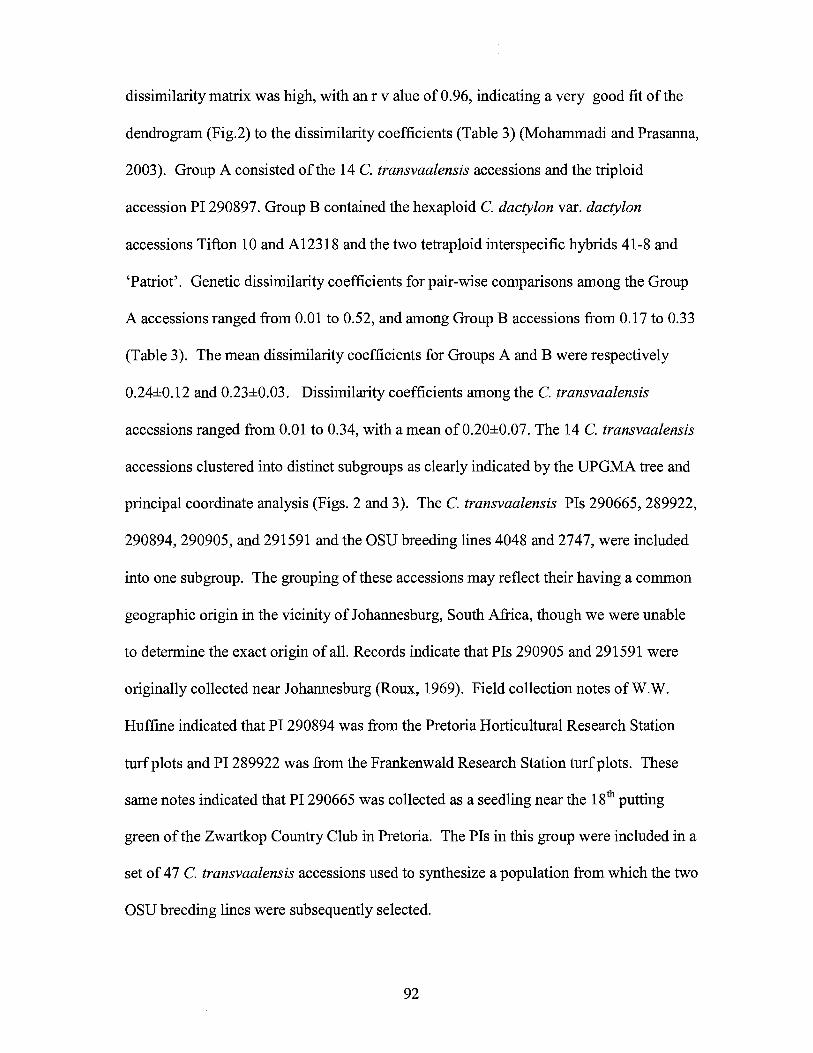
dissimilarity matrix was high, with an r value of 0.96, indicating a very good fit of the
dendrogram (Fig.2) to the dissimilarity coefficients (Table 3) (Mohammadi and Prasanna,
2003). Group A consisted of the 14 C. transvaalensis accessions and the triploid
accession PI 290897. Group B contained the hexaploid C. dactylon var. dactylon
accessions Tifton 10 and A12318 and the two tetraploid interspecific hybrids 41-8 and
'Patriot'. Genetic dissimilarity coefficients for pair-wise comparisons among the Group
A accessions ranged from 0.01 to 0.52, and among Group B accessions from 0.17 to 0.33
(Table 3). The mean dissimilarity coefficients for Groups A and B were respectively
0.24±0.12 and 0.23±0.03. Dissimilarity coefficients among the C. transvaalensis
accessions ranged from 0.01 to 0.34, with a mean of 0.20±0.07. The 14 C. transvaalensis
accessions clustered into distinct subgroups as clearly indicated by the UPGMA tree and
principal coordinate analysis (Figs. 2 and 3). The C. transvaalensis Pis 290665, 289922,
290894, 290905, and 291591 and the OSU breeding lines 4048 and 2747, were included
into one subgroup. The grouping of these accessions may reflect their having a common
geographic origin in the vicinity of Johannesburg, South Africa, though we were unable
to determine the exact origin of all. Records indicate that Pis 290905 and 291591 were
originally collected near Johannesburg (Roux, 1969). Field collection notes of W.W.
Huffine indicated that PI 290894 was from the Pretoria Horticultural Research Station
turf plots and PI 289922 was from the Frankenwald Research Station turf plots. These
same notes indicated that PI 290665 was collected as a seedling near the 18th putting
green of the Zwartkop Country Club in Pretoria. The Pis in this group were included in a
set of 4 7 C. transvaalensis accessions used to synthesize a population from which the two
OSU breeding lines were subsequently selected.
92
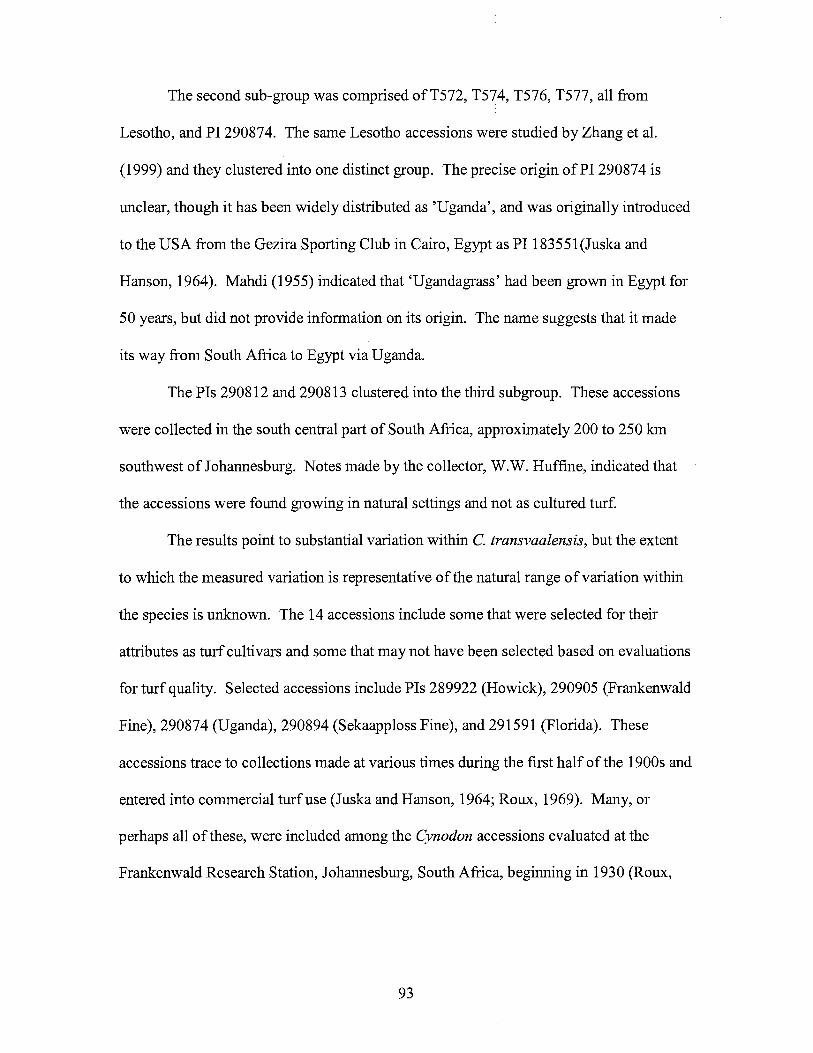
The second sub-group was comprised ofT572, T574, T576, T577, all from
Lesotho, and PI 29087 4. The same Lesotho accessions were studied by Zhang et al.
(1999) and they clustered into one distinct group. The precise origin of PI 290874 is
unclear, though it has been widely distributed as 'Uganda', and was originally introduced
to the USA from the Gezira Sporting Club in Cairo, Egypt as PI 183551(Juska and
Hanson, 1964). Mahdi (1955) indicated that 'Ugandagrass' had been grown in Egypt for
50 years, but did not provide information on its origin. The name suggests that it made
its way from South Africa to Egypt via Uganda.
The Pis 290812 and 290813 clustered into the third subgroup. These accessions
were collected in the south central part of South Africa, approximately 200 to 250 km
southwest of Johannesburg. Notes made by the collector, W.W. Huffine, indicated that
the accessions were found growing in natural settings and not as cultured turf.
The results point to substantial variation within C. transvaalensis, but the extent
to which the measured variation is representative of the natural range of variation within
the species is unknown. The 14 accessions include some that were selected for their
attributes as turf cultivars and some that may not have been selected based on evaluations
for turf quality. Selected accessions include Pis 289922 (Howick), 290905 (Frankenwald
Fine), 290874 (Uganda), 290894 (Sekaapploss Fine), and 291591 (Florida). These
accessions trace to collections made at various times during the first half of the 1900s and
entered into commercial turf use (Juska and Hanson, 1964; Roux, 1969). Many, or
perhaps all of these, were included among the Cynodon accessions evaluated at the
Frankenwald Research Station, Johannesburg, South Africa, beginning in 1930 (Roux,
93
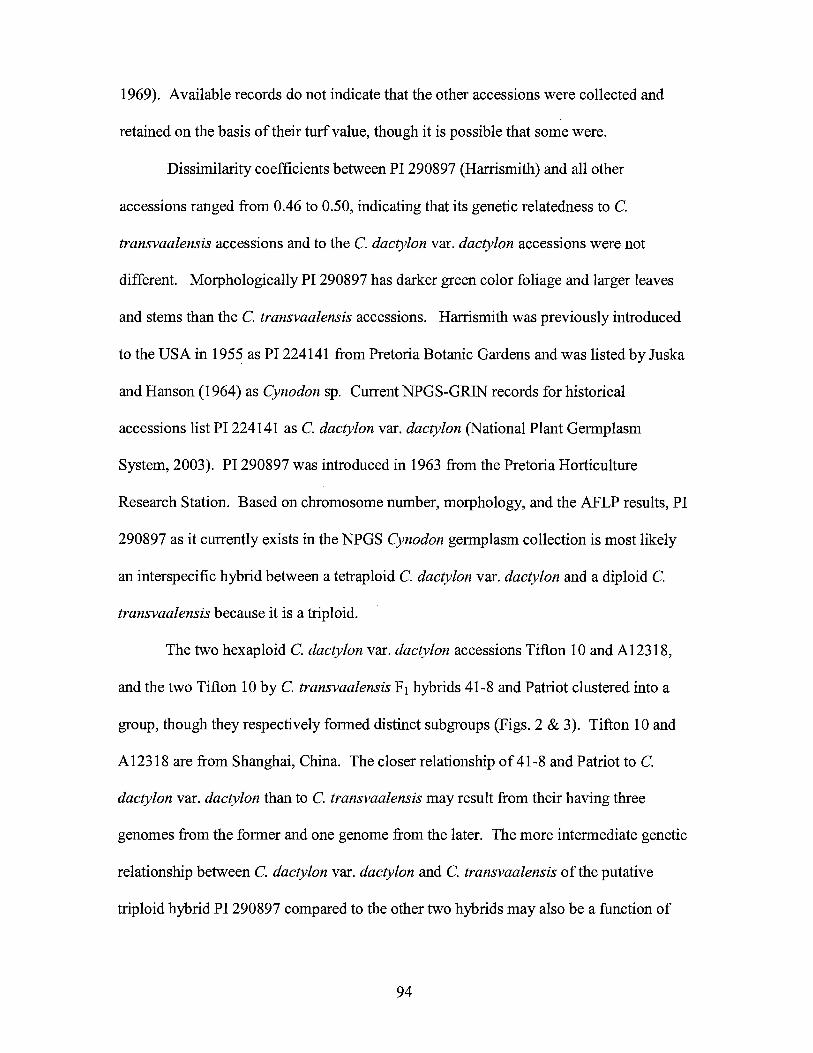
1969). Available records do not indicate that the other accessions were collected and
retained on the basis of their turf value, though it is possible that some were.
Dissimilarity coefficients between PI 290897 (Harrismith) and all other
accessions ranged from 0.46 to 0.50, indicating that its genetic relatedness to C.
transvaalensis accessions and to the C. dactylon var. dactylon accessions were not
different. Morphologically PI 290897 has darker green color foliage and larger leaves
and stems than the C. transvaalensis accessions. Harrismith was previously introduced
to the USA in 1955 as PI 224141 from Pretoria Botanic Gardens and was listed by Juska
and Hanson (1964) as Cynodon sp. Current NPGS-GRIN records for historical
accessions list PI 224141 as C. dactylon var. dactylon (National Plant Germplasm
System, 2003). PI 290897 was introduced in 1963 from the Pretoria Horticulture
Research Station. Based on chromosome number, morphology, and the AFLP results, PI
290897 as it currently exists in the NPGS Cynodon germplasm collection is most likely
an interspecific hybrid between a tetraploid C. dactylon var. dactylon and a diploid C.
transvaalensis because it is a triploid.
The two hexaploid C. dactylon var. dactylon accessions Tifton 10 and A12318,
and the two Tifton 10 by C. transvaalensis F 1 hybrids 41-8 and Patriot clustered into a
group, though they respectively formed distinct subgroups (Figs. 2 & 3). Tifton 10 and
A12318 are from Shanghai, China. The closer relationship of 41-8 and Patriot to C.
dactylon var. dactylon than to C. transvaalensis may result from their having three
genomes from the former and one genome from the later. The more intermediate genetic
relationship between C. dactylon var. dactylon and C. transvaalensis of the putative
triploid hybrid PI 290897 compared to the other two hybrids may also be a function of
94
genomic constitution differences, because the triploid contains two genomes from its
tetraploid C. dactylon parent and one genome from diploid C. transvaalensis parent.
The amount of genetic diversity within C. transvaalensis is important relative to
the potential for its breeding improvement and its use in interspecific hybridization with
C. dactylon var. dactylon to produce improved turf cultivars. The magnitude of variation
for AFLP markers within C. transvaalensis suggests probable genetic variation for other
traits that could be manipulated by classical breeding. Additionally, the potential exists
for discovery of C. transvaalensis plants with superior combining ability when
hybridized with C. dactylon var. dactylon plants.
95
REFERENCES
Alderson, J., and W.C. Sharp. 1995. Grass varieties in the United States. USDA. CRC
Lewis Publishers. Boca Raton, FL.
Anderson, M.P., C.M. Taliaferro, D.L. Martin, and C. S. Anderson. 2001. Comparative
DNA profiling ofU-3 turfbermudagrass strains. Crop Sci. 41:1184-1189.
Assefa, S., C.M. Taliaferro, M.P. Anderson, B.G. de los Reyes, and RM. Edwards. 1999.
Diversity among Cynodon accessions and taxa based on DNA amplification
fingerprinting. Genome 42:465-474.
Bai, G-H., H. Tefera, M. Ayele, and H. Nguyen. 1999. Amplified fragment length
polymorphism analysis oftef (Eragrostisis tef(Zucc.) Trotter). Crop Sci. 39:819-
824.
Burton, G.W. 1973. Breeding bermudagrass for turf. p. 18-22. In E.C. Roberts (ed.).
Proceedings of the second international turf grass research conference.
International turfgrass research conference, Blacksburg, VA.
Burton, G.W. 1991. A history ofturfresearch at Tifton. U.S. Golf Assoc. Green Section
Record. 29:12-14.
Caetano-Anolles, G., L.M. Callahan, P.E. Williams, KR.Weaver, and P.M. Gresshoff.
1995. DNA amplification fingerprinting analysis of bermudagrass (Cynodon):
genetic relationships between species and interspecific crosses. Theor. Appl.
Genetics. 91 :228-235.
Caetano-Anolles, G. 1998. DNA analysis of turfgrass genetic diversity. Crop Sci.
38:1415-1424.
96
de Wet, J.M.J. and J.R. Harlan. 1971. South African species of Cynodon (Gramineae). J.
S. Afric. Bot. 37(1): 53-56.
Hanna, W.W., G.W. Burton, and A.W. Johnson. 1990. Registration of 'Tifton 10' turf
bermudagrass. Crop Sci. 30:1355-1356.
Harlan, J.R., J.M.J. de Wet, and K.M. Rawal. 1970a. Geographic distribution of the
species of Cynodon LC.Rich (Gramineae). East Afric. Agric. Fores. J. 36: 220-
226.
Harlan, J.R., J.M.J. de Wet, W.W. Huffine, and J.R. Deakin. 1970b. A guide to the
species of Cynodon (Gramineae). Bulletin B-673. Okla. Agric. Stn.
Ho, C.Y., S.J. McMaugh, A.N.Wilton, I.J. Mcfarlane, and A.G. Mackinlay. 1997. DNA
amplification variation within cultivars of turf-type couch grasses (Cynodon spp.).
Plant Cell Reports. 16:797-801.
Juska, F.V. and A.A. Hanson. 1964. Evaluation ofbermudagrass varieties for general
purpose turf. USDA-ARS, Agric. Handbook No. 270.
Karaca, M., S. Saha, A. Zipf, J. N. Jenkins, and D.J. Lang. 2002. Genetic diversity among
forage bermudagrass (Cynodon spp.): Evidence from chloroplast and nuclear
DNA fingerprinting. Crop Sci. 42:2118-2127.
Mahdi, Z. 1955. Egyptian bermudagrass strain has many merits. P. 82, Golfdom,
October, 1955.
Mohammadi, S.A. and B.M. Prasanna. 2003. Analysis of genetic diversity in crop plants
salient statistical tools and considerations. Crop Sci, 43:1235-1248.
97
National Plant Germplasm System, USDA-ARS. 2003. Germplasm Resources
Information Network database. Published on the internet, http://www.ars
grin.gov/npgs/ [Accessed 3 March 2003 at 1600 GMT].
Nei, M. and W-H. Li.1979. Mathematical model for studying genetic variation in terms
ofrestriction endonucleases. Proc. Natl. Acad. Sci. USA. 76:5269-5273.
Powell, J.B. 1968. Karyological leaf squashes in grasses aided bypectinase digestion at
45°C. Stain Technology. 43:135-138.
Rouf Mian, M.A., A.A. Hopkins, and J.C. Zwonizer. 2002. Detennination of genetic
diversity in tall fescue with AFLP markers. Crop Sci. 42: 944-950.
Roodt, R., J.J. Spies and T.H. Burger. 2002. Preliminary DNA fingerprinting of the
turfgrass Cynodon dactylon (Poaceae: Chloridoideae). Bothalia. 32: 117-122.
Roux, W.M. 1969. Grass, a history ofFrankenwald. Oxford University press, Cape
Town, South Africa.
Taliaferro, C.M. 1992. Out of Africa-a new look at "African" bermudagrass. U. S. Golf
Association Green Section Record 30:10.:.12.
Taliaferro, C.M. 1995. Diversity and vulnerability ofbermuda turfgrass species. Crop
Sci. 35: 327-332.
Vos, P., R. Rogers, M. Bleeker, M. Reijans, T. van de Lee, M. Homes, A. Frijters, J. Pot,
J. Peleman, M. Kuiper and M. Zabeau. 1995. AFLP: a new technique for DNA
fingerprinting. Nucl. Acids Res. 23 :4407-4414.
Zhang, L.-H., P. Ozias-Akins, G. Kochert, S. Kresovich, R. Dean and W. Hanna. 1999.
Differentiation ofbermudagrass (Cynodon spp.) genotypes by AFLP analyses.
Theor. Appl. Genet. 98:895-902.
98
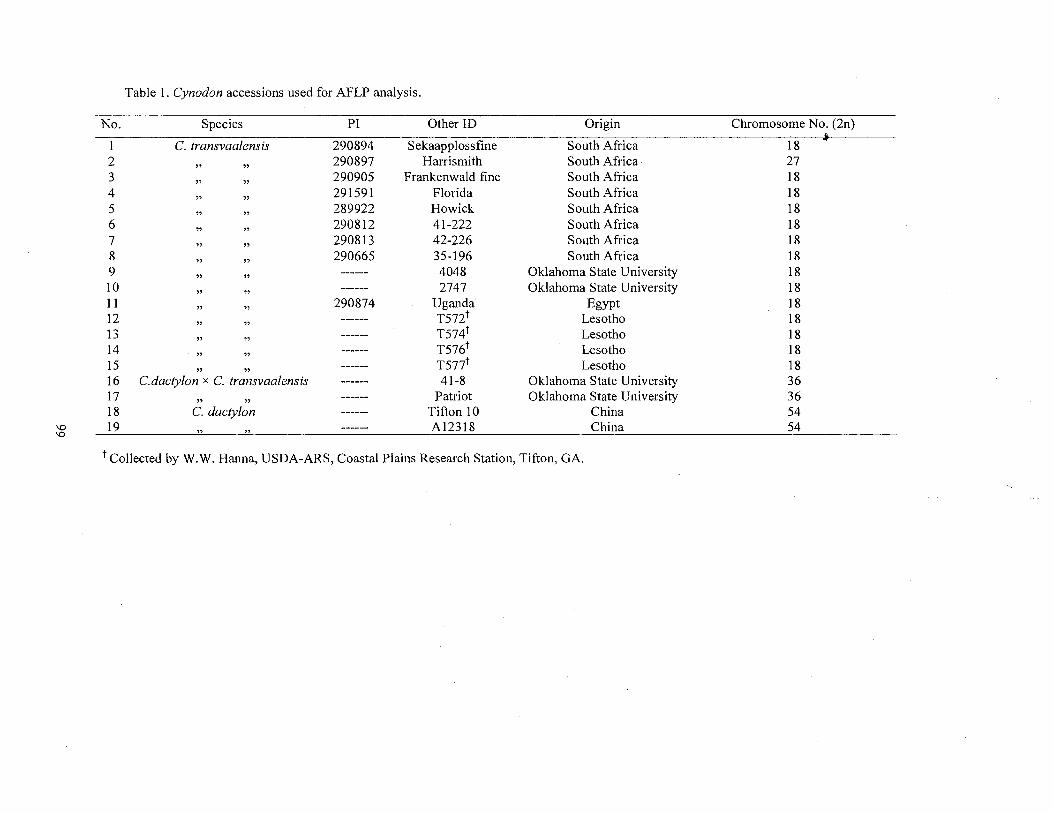
Table 1. Cynodon accessions used for AFLP analysis.
No. Species PI Other ID Origin Chromosome No. (2n)
1 C. transvaalensis 290894 Sekaapplossfine South Africa 18 2
" " 290897 Harrismith South Africa 27
3 " "
290905 Frankenwald fine South Africa 18 4
" " 291591 Florida South Africa 18
5 " "
289922 Howick South Africa 18 6
" " 290812 41-222 South Africa 18
7 " "
290813 42-226 South Africa 18 8
" " 290665 35-196 South Africa 18
9 " "
------ 4048 Oklahoma State University 18 IO
" " ------ 2747 Oklahoma State University 18
11 " "
290874 Uganda· Egypt 18 12
" " ------ T572t Lesotho 18
13 " " ------ T574t Lesotho 18
14 " " ------ T576t Lesotho 18
15 " " ------ T577t Lesotho 18
16 C.dactylon x C. transvaalensis ------ 41-8 Oklahoma State University 36 17
" " ------ Patriot Oklahoma State University 36
18 C. dacty/on ------ Tifton IO China 54 \0 19
- ~ n ------ Al2318 China 54 \0 -
t Collected by W.W. Hanna, USDA-ARS, Coastal Plains Research Station, Tifton, GA.
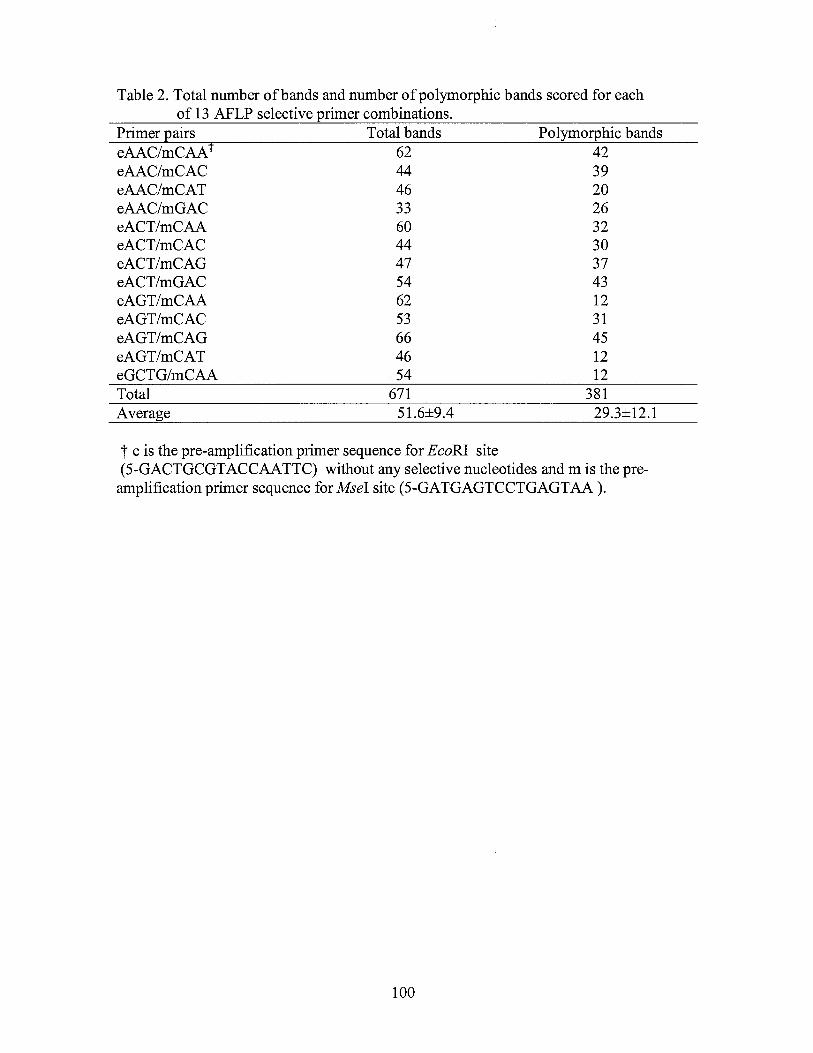
Table 2. Total number of bands and number of polymorphic bands scored for each of 13 AFLP selective primer combinations.
Primer pairs Total bands eAAC/mCAA t 62 eAAC/mCAC 44 eAAC/mCAT 46 eAAC/mGAC 33 eACT/mCAA 60 eACT/mCAC 44 eACT/mCAG 47 eACT/mGAC 54 eAGT/mCAA 62 eAGT/mCAC 53 eAGT/mCAG 66 eAGT/mCAT 46 eGCTG/mCAA 54 Total 671 Average 51.6±9.4
Polymorphic bands 42 39 20 26 32 30 37 43 12 31 45 12 12
381 29.3±12.1
t e is the pre-amplification primer sequence for EcoRI site (5-GACTGCGTACCAATTC) without any selective nucleotides and mis the preamplification primer sequence for Msel site (5-GATGAGTCCTGAGTAA ).
100
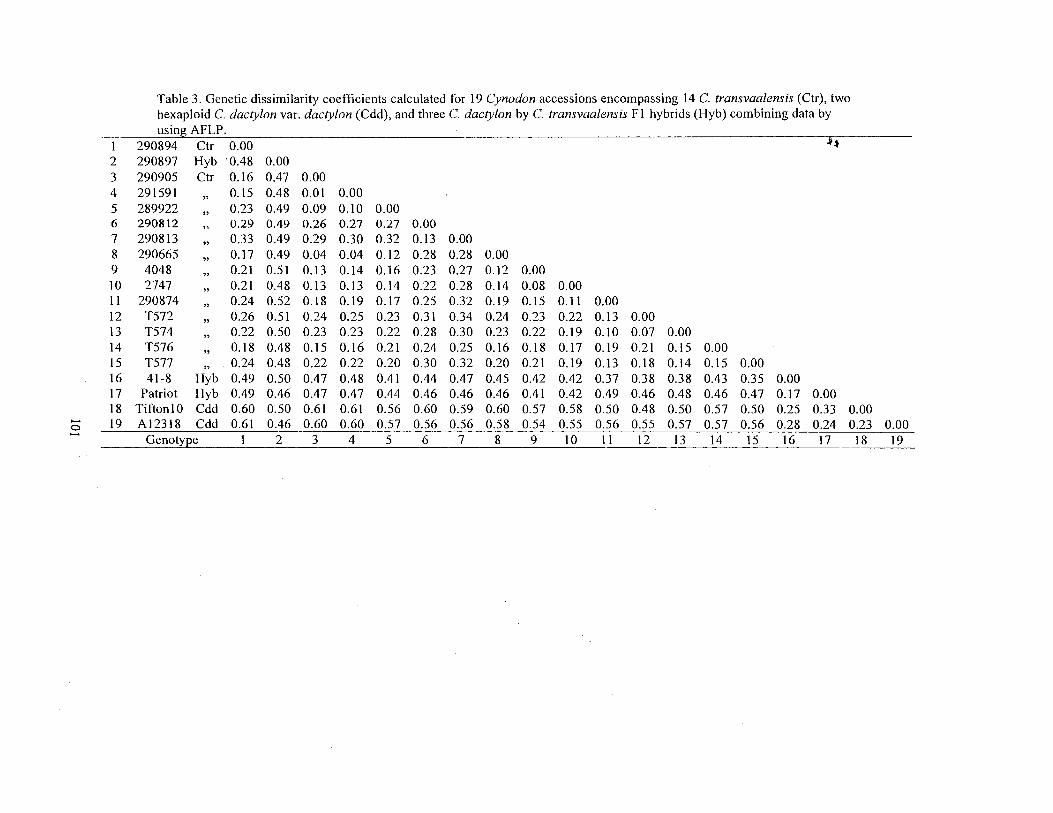
Table 3. Genetic dissimilarity coefficients calculated for 19 Cynodon accessions encompassing 14 C. transvaalensis (Ctr), two hexaploid C. dactylon var. dactylon (Cdd), and three C. dactylon by C. transvaalensis Fl hybrids (Hyb) combining data by using AFLP.
1 290894 Ctr 0.00 ~ ... 2 290897 Hyb ·o.48 0.00 3 290905 Ctr 0.16 0.47 0.00 4 291591
" 0.15 0.48 0.01 0.00
5 289922 "
0.23 0.49 0.09 0.10 0.00 6 290812 0.29 0.49 0.26 0.27 0.27 0.00 7 290813
" 0.33 0.49 0.29 0.30 0.32 0.13 0.00
8 290665 0.17 0.49 0.04 0.04 0.12 0.28 0.28 0.00 9 4048 0.21 0.51 0.13 0.14 0.16 0.23 0.27 0.12 0.00 10 2747 0.21 0.48 0.13 0.13 0.14 0.22 0.28 0.14 0.08 0.00 11 290874
" 0.24 0.52 0.18 0.19 0.17 0.25 0.32 0.19 0.15 0.1 l 0.00
12 T572 0.26 0.51 0.24 0.25 0.23 0.31 0.34 0.24 0.23 0.22 0.13 0.00 13 T574 0.22 0.50 0.23 0.23 0.22 0.28 0.30 0.23 0.22 0.19 0.10 0.07 0.00 14 T576 0.18 0.48 0.15 0.16 0.21 0.24 0.25 0.16 0.18 0.17 0.19 0.21 0.15 0.00 15 T577
" 0.24 0.48 0.22 0.22 0.20 0.30 0.32 0.20 0.21 0.19 0.13 0.18 0.14 0.15 0.00
16 41-8 Hyb 0.49 0.50 0.47 0.48 0.41 0.44 0.47 0.45 0.42 0.42 0.37 0.38 0.38 0.43 0.35 0.00 17 Patriot Hyb 0.49 0.46 0.47 0.47 0.44 0.46 0.46 0.46 0.41 0.42 0.49 0.46 0.48 0.46 0.47 0.17 0.00 18 TiftonlO Cdd 0.60 0.50 0.61 0.61 0.56 0.60 0.59 0.60 0.57 0.58 0.50 0.48 0.50 0.57 0.50 0.25 0.33 0.00
..... 19 Al2318 Cdd 0.61 0.46 0.60 0.60 0.57 0.56 0.56 0.58 0.54 0.55 0.56 0.55 0.57 0.57 0.56 0.28 0.24 0.23 0.00 0
Genotype ~ l ··~·~ 2 ··~·· 3 ~··~·· 4 .... 5 6 7 8 9 10 11 12 13 14 15 16 17 I 8 19 -- --- - - -------- ----- ------ -----

Fig. 1. AFLP fingerprints generated using primer combination e-ACT/m-CAA.
Fragment size is indicated on the right. Lanes from 1 to 19 are accessions:
290894,290897,290905,291591,289922,290812,290813,290665,
4048,2747,290874, T572, T574, T576, T577,41-8,Patriot, TiftonlO,and
A12318, respectively.
Fig. 2. UPGMA tree of similarity coefficients derived from phenetic analysis of
AFLP data.
Fig. 3. Principal coordinate analysis ofbermudagrass accessions based on AFLP.
102
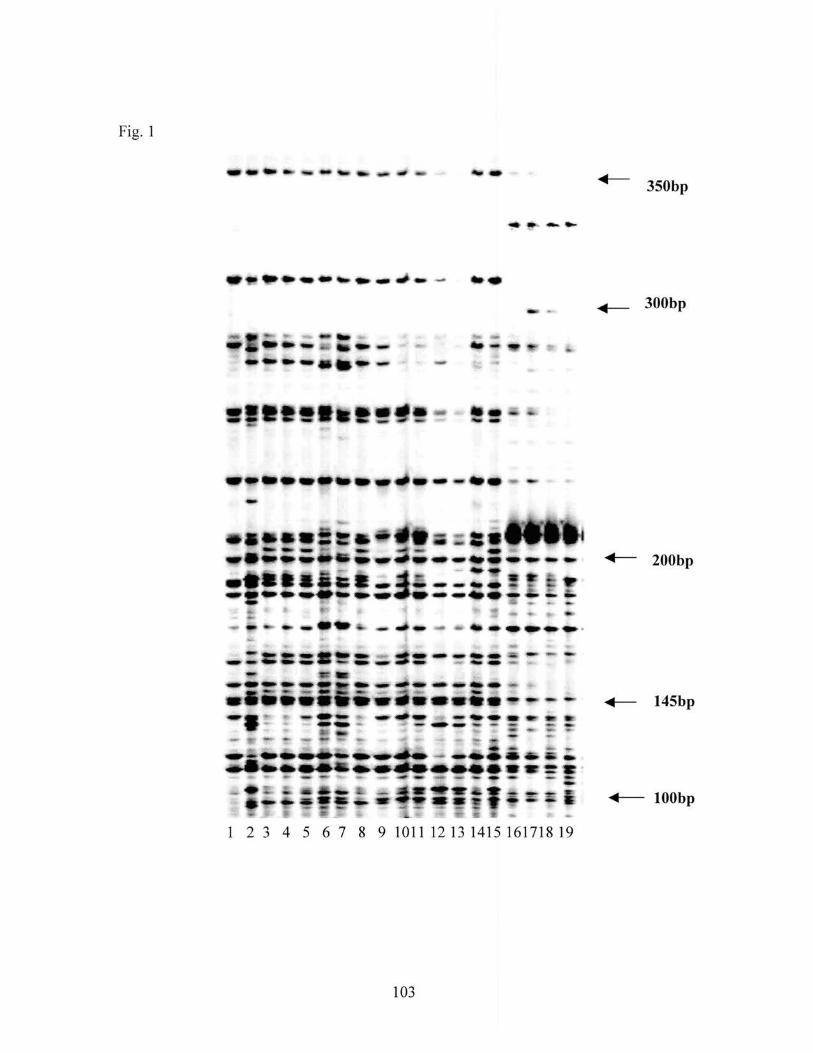
Fig. 1
---·---·-·· -- 350bp
._ 300bp
w : ;, •• : • .... ' ......... ' -- --- ..,_
- --..... · ... ··--- w:- -
.......... .,. _____ _ -
._ 200bp
# w •• • -·--.... ... ,.., .......
1 2 3 4 5 6 7 8 9 1011 12 13 1415 161718 19
103
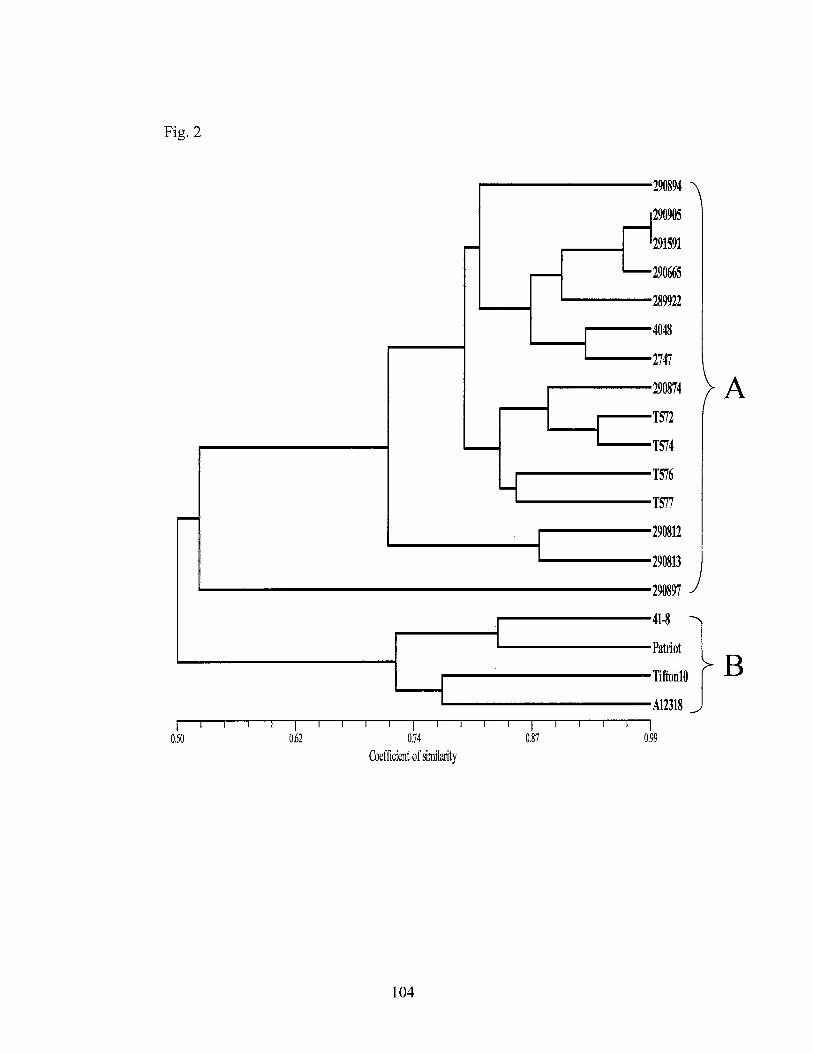
Fig. 2
-
I 0.50
I 0.62
I I
I 0.74
Coefficient of similarity
104
-
-Lf
-
I I
I 0.87
I I
I
l
rl ---
290894
290905
291591
290665
289922
4048
2747
290874
TS72
T574
T576
T577
290812
290813
290897
41-8
Patriot
TiftonlO
A12318 I
099
A
B
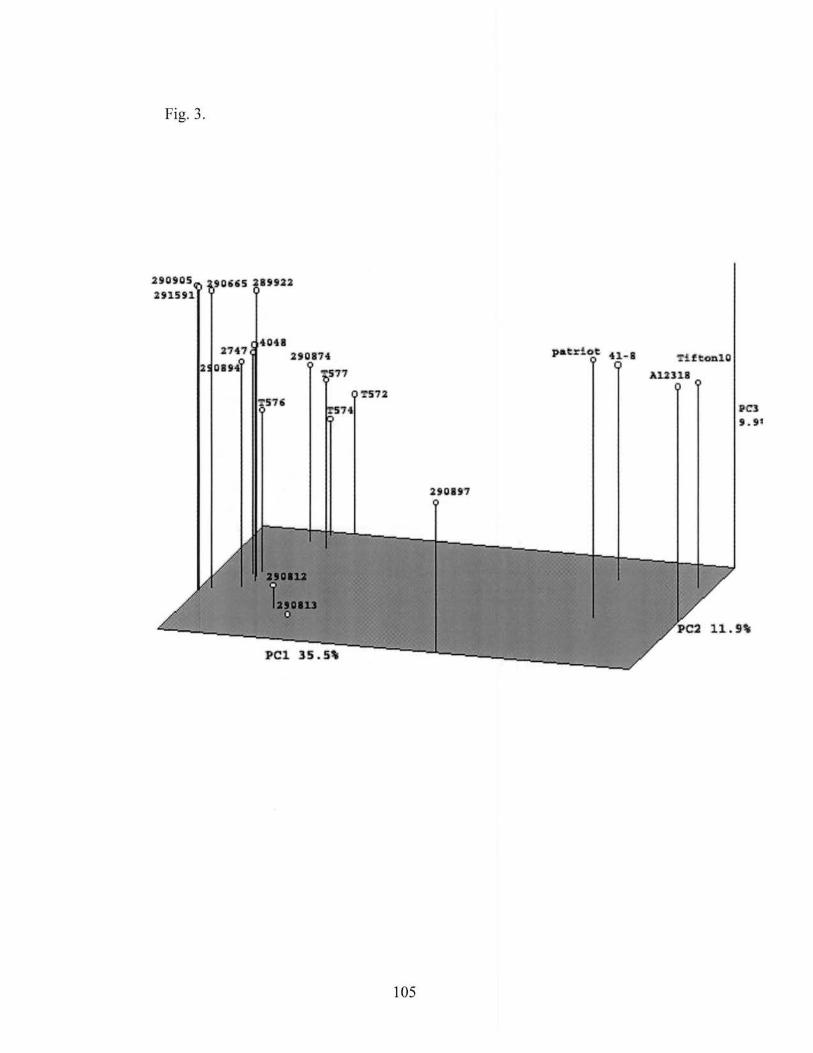
Fig. 3.
29091>5 ,ous .2HH.2 nun
4048 flf7
2 l>BH .2,011•
'1'576
"'577
'!'572
57i
2'0897
105
TUtt'ffl.10
Al.13:U
CHAPTER VI
GENETIC CHARACTERIZATION OF CHINESE CYNODON ACCESSIONS BY
FIELD EXPERIMENTATIONS:
I. Genetic Variability in Seed Yield and its Components
ABSTRACT
Cynodon dactylon (L.) Pers. is indigenous and widely distributed in China but no
information is available on the diversity of the indigenous germplasm for seed yields and
related traits. Accordingly, we conducted two field experiments in 2002 and 2003 at
Stillwater, Oklahoma to characterize the genetic variability among 120 C. dactylon
accessions from china for seed yield and its components, and to determine relationships
among seed yield and its components. Experiment A consisted of 120 clonal Chinese C.
dactyl on accessions (genotypes), while experiment B consisted of half-sib families from
56 of the 120 accessions. The field plot design for both experiments was a randomized
complete block design with three replications. Highly significant differences (P>0.01)
existed in both experiments for seed yield, seed head prolificacy, seed set percentage,
seed number seedhead·1, raceme number seedhead·1and raceme length seedhead·1•
However, significant (P<0.01) year and genotype xyear interactions for seed yield, seed
head prolificacy, seed set percentage and seed number seedhead·1, and large magnitudes
of variances of year and genotype xyear interactions occurred in both experiments
106
indicating important environmental influences on those traits. Phenotypic correlation
analyses indicated that correlations of seed yield with seed head prolificacy, seed set
percentage, and seed number seedhead·1 were substantial and positive (P<0.01) in both
experiments, while correlations of seed yield with raceme number and raceme length
seedhead·1 were negligible. Path coefficient analyses indicated that seed head prolificacy
and seed set percentage had the highest direct effects on seed yield. The enormous
amount of genetic variability of seed yield and related components in Chinese C.
dactylon demonstrated the potential of the germplasm for developing seeded cultivars.
Seed head prolificacy and seed set percentage would be the good indirect predictors for
selection of seed yield in early stage of breeding.
107
INTRODUCTION
Cynodon dactylon (L.) Pers. is widely used for turf, forage, soil stabilization and
soil remediation (Harlan, 1970; Taliaferro, 1995, 2003). This species is highly cross
pollinated and self-incompatible (Burton, 1947; 1965). Burton and Hart (1967) reported
the open-pollinated seed set of single-cross combinations of six C. dactylon plants ranged
from 0.5 to 37.0 % in a field experiment in Arizona, while the self-pollinated seed set for
the same clones ranged from 0.05 to 2.3% in laboratory. Richardson et al. (1978)
reported open-pollination seed set ranging from 2.8 to 43.2% and self-pollinated seed set
ranging from 0.10 to 8.09% among eight selected clones. Taliaferro and Lamie (1997)
reported that bermudagrass self-pollination resulted in greatly reduced growth rate of
pollen tubes with very few reaching the micropyle as compared to cross-pollination.
Cluff and Baltensperger ( 1991) reported that the realized heritabilities for seed yield and
its components were from 0.33 to 0.94, and seed yield was partially (42%) determined by
additive gene action and could be increased by phenotypic selection methods. From the
more than 700 Cynodon accessions originally assembled at the Oklahoma Agricultural
Experiment Station by Harlan and de Wet (1969), several cold tolerant genotypes were
discovered that had good fertility and good seed production potential (Ahring et al.,
1974). From their study of single-cross bermudagrass seed production under different
management conditions, Ahring et al. (1982) indicated the feasibility of using available
germplasm in their collection to produce new single-cross seed propagated cultivars.
Sustained efforts of bermudagrass breeding aimed at improvement of seed production
and cold adaptation resulted in the release of the first seeded bermudagrass cultivar
108
'Guymon' in 1982 (Taliaferro et al. 1983). In the subsequent 20 years, the interest in
breeding seeded bermudagrass cultivars substantially increased, especially in
development of new turf-type cultivars by private seed companies, and dramatic
improvement in seed yield and turf quality related traits were achieved (Baltensperger
and Klingenberg, 1994; Taliaferro, 2003).
Correlation coefficients have been commonly used to measure the closeness of
the relationships of related characteristics in plants. However, a correlation coefficient
only furnishes information of relationship between two examined traits without
considering multiple associations with other characters. As more variables are
considered in correlation analysis, relationships among variables become complex. Path
coefficient analysis partitions a correlation coefficient into direct and indirect effects, and
permits a critical examination of the specific forces acting to produce a given correlation
and measures the relative importance of each variable (Dewey and Lu, 1959). Studies on
seed yield and its components and biomass yield and its components (Dewey and Lu,
1959; Board et al., 1997; Das et al., 2004) have demonstrated that path coefficient
analysis provides more useful information by dissecting correlation coefficients into
direct and indirect effects.
C. dactylon is indigenous to China where it is widely distributed in tropical,
subtropical and warm temperate regions. It is most prevalent south of the Yellow river,
bit is scattered sparsely in northern parts of China including the far northwest and
northeast regions (Anonymous, 1990). There is no published report available on seed
yield and seed yield components of Chinese native bermudagrass. The objectives of the
present study were to (i) characterize the genetic variability of seed yield and its
109
components, and (ii) determine relationships among seed yield and its components by
phenotypic correlation and path coefficient analysis in Chinese C. dactylon.
110
MATERIALS AND METHODS
The study consisted of two field experiments conducted in 2002 and 2003. In
experiment A, 120 Chinese Cynodon clonal accessions and four U.S. commercial
cultivars as controls were used (Table 1 ). Experiment B comprised half-sib families from
56 of the 120 clonal accessions and the same four commercial cultivars as in experiment
A (Table 1 ). The Chinese Cynodon accessions were collected from eleven provinces of
China ranging from tropical Hainan Island to the temperate climate region around
Beijing. The two experiments were conducted in neighboring fields on the Oklahoma
State University Agronomy Research Station, Efaw Farm, Stillwater.
The experimental design for each of the two field experiments was a
randomized complete block with three replications. Plot size was 2.5 x 2.5 m2 with 0.5 m
alleys between neighboring plots. The. soil type was Renfrow loam ( a member of the fine,
mixed, thermic family ofUdertic Paleustolls). Based on the results of soil analyses by
the Soil, Water& Forage Analytical laboratory, Plant and Soil Sciences Department,
Oklahoma State University, nitrogen and phosphorous fertilizers were incorporated
during seed bed preparation prior to planting by applying a 28-28-0 fertilizer mix at a rate
of 400 kg ha-1 in May 2001. The pH of the soil was 6.0. Plants for the two experiments
were started and grown in a greenhouse at the Agronomy Research Station, Oklahoma
State University, Stillwater, Oklahoma. Six plants from each clonal accession and each
half-sib family accession were started in January 2001 by planting in cells containing
Metro-Mix 250 growing medium (Scotts-Sierra Horticultural Products Co., Marysville,
OH). Plants of the clonal accessions were started from vegetative propagules and plants
ofhalf-sib families were from seed. The plants grew under favorable conditions for
111
approximately four months in the greenhouse. They were watered daily and fertilized
biweekly with M-77 Peat-lite Special water-soluble fertilizer (Scotts-Sierra Horticultural
Products Co., Marysville, OH). All plants were healthy and trimmed to approximately 6
cm height before transplanting into field plots on June 5 (Experiment A) and June 8
(Experiment B). Greenhouse plants were transplanted to field plots on June 5 and June
8, 2001 for experiments A and B, respectively. Two plants were spaced 1 m apart in the
center of each plot. Immediately after transplanting to the field, a pre-emergence
herbicide was applied to control annual weeds. Supplemental irrigation was provided
during the first 2-weeks to facilitate growth. In August 2001, nitrogen was applied at a
rate of 10 g m-1 to increase plant growth. Nitrog~n fertilizer was applied thereafter on
April 30, 2002 and in first week of May 2003 at a rate of 112 kg N ha-1• In early spring
of each year prior to the initiation of bermudagrass growth, Roundup® (glyphosate, N
phosphonomethyl glycine), 2,4-D [(2,4-dichlorophenoxy) acetic acid] and a pre
emergence herbicide [Barricade® (prodiamine)] were applied to control weeds. The
major winter weeds were henbit (Lamium amplexicaule), dandelion (Taraxicum
officinale) and plantain (Plantago spp.). The 0.5 m alleys between plots were cleaned
with applications of Roundup as needed during the growing seasons to separate the plots.
On March 14, 2002, the plots were burned. In the first week of May 2003, all plots were
mowed to 5 cm height. In late August of2002 and 2003, the above ground biomass of the
plots was mowed to a height of 5 cm.
Plant samples and data were collected from both experiments in 2002 and 2003
using identical methods. Seed head prolificacy of each plot was visually assessed in
August each year, using a rating scale from one to nine, where one represents no
112
inflorescence, three a few, five some, seven many, and nine the most abundant on a
comparative basis. The number of racemes seedhead-1, raceme length (mm) seedhead-1
and number of seed seedhead-1 were determined for five random mature seed head
samples from each plot. The number of seed seedhead-1 was counted under dissecting
microscopes after the seed heads were soaked in 15-20% (v: v) bleach solution for four to
12 h. The spikelet number seedhead-1 was estimated with a linear formula derived from
212 random inflorescence samples by regressing spikelet number on the raceme length of
same seed head: Y=8.4+0.79X (r2=0.68, P<0.01). Percent of open-pollinated seed set for
a plot was calculated by dividing the number of caryopses seedhead-1 by the number of
spikelets seedhead-1 and multiplying the result by 100 and averaging over the five
seedheads from each plot. Seed yield was estimated by harvesting all biomass from a
0.09m2 area from each plot in August each year. Pure seed per sample was obtained by
isolating and hand rubbing the seed heads in each sample, then separating pure seed and
inert fractions by screening followed by air separation with a Model B South Dakota seed
blower. Seed weight plof1 was determined using an electronic balance.
Among the120 Chinese accessions, 56 half-sib families and four commercial
cultivars used in two field experiments, three accessions and two half-sib families did not
survive in at least in one plot over the 2001 winter. Accordingly, those entries were not
included into the data analysis. Plot means for seed set, seedhead prolificacy, seed
number seedhead-1, racemes seedhead-1 and raceme length seedhead-1 were used for
statistical analyses. A randomized complete block design was used with entries as fixed
effects, while year and replication were considered as random effect~. Log transformation
for data in seed yield was used to help correct non-normality for the trait. The PROC
113
Mixed procedure of SAS (SAS Inst., 1999) was used for analysis of variance (ANOV A)
and to estimate variance components. The PROC CORR procedure was used to perform
phenotypic correlation (subsequently referred to simply as correlation) analyses. Path
coefficient analyses were conducted using standard methods (Fig.1) (Dewey and Lu,
1959; Das et al., 2004).
114
RESULTS AND DISCUSSIONS
Variability of Seed yield and its components
There were highl):j significant differences (P<0.01) among accessions for all traits
in Experiment A (Table 2). For this experiment, effects of year on seed yield and yield
components were also significant (P<0.01). Genotype x year interactions were significant
for all traits examined; therefore, means and ranges for all traits are presented by year in
Table 3. Mean seed yield in 2003 was three fold higher than in 2002. Seed head
prolificacy, seed set, and seed number seedhead-1were higher in 2003 compared to 2002,
while racemes seedhead-1 and raceme length seedhead-1 were lower in 2003 than in 2002.
Ranges of the seed yield components were, however, similar between years.
Interestingly, seed was obtained from six triploids (12260, 12261 , 12272, 12282,
Tifsport and Tifway), three pentaploids (12348, 12352 and 12365) and seven hexaploids
(12317, 12318, 12319, 12320, 12356, 12358 and 12360), except for three triploids
(12272, 12282 and Tifsport) in 2002. Although seed was not detected in several seed
yield samples (0.9 M2) of the triploid genotypes, one or more seed was found in all of the
seed head samples (5 heads plof1) used to assess set percentage. Seed set percentages of
the triploids ranged from 0.1 to 0.5 . Seed yield of the pentaploid accessions was
relatively low (8-65 kg ha-1) , but all seed yield samples and seed head samples contained
seed, with percent seed set ranging from 9.5 to 21.7. For the seven hexaploids, seed yield
and seed set percentages were in the ranges of 3.0 to198 kg ha-1 and 3.0 to 33.8 %,
respectively.
For experiment B, analyses of variance of seed yield and yield components
indicated significant differences (P<0.01) due to genotypes (Table 4). Effect of year was
115
significant (P<0.01) for seed yield, seed head prolificacy, seed set, and seed number
seedhead-1, but not significant for raceme number seedhead-1and raceme length.
Genotype x year interactions were significant for seed yield and seed head prolificacy
and nonsignificant for other traits measured (Table 4). Therefore, means and ranges for
seed yield and seed head prolificacy are presented by year and for the other traits over
years in Table 5. Mean seed yield in 2003 was about six fold higher than in 2002.
Bermudagrass seed production typically increases after the 1st post establishment year.
The results from both experiments clearly indicate enormous variation in seed yield and
seed yield components among the Chinese bermudagrass genotypes. The ranges of seed
yield and seed set percentage in these experiments were similar to the ranges reported by
Ahring et al. (1974, 1982), Richardson et al (1978) and Kenna et al. (1983).
Estimates of variance components and associated standard errors for seed yield,
seed head prolificacy, percent seed set, seed number seedhead-1, raceme number
seedhead-1and raceme length seedhead-1 for experiment A are presented in Table 6.
Estimates of genotypic variance ( o 2 0 ) and genotype x year variance ( o 2 GxY) for seed
yield and five seed yield components were significant (P<0.01). Additionally, variance
estimates for genotype x block for seed head prolificacy, seed number seedhead-1, raceme
number seedhead-1and raceme length seedhead-1 were also significant (P<0.05 or
P<O.O 1 ). The magnitude of o 2 o for seed yield was higher than o 2 oxv, o 2 Band o 2 GxB,
but lower than o 2v. These results indicated substantial genetic variability in seed yield
among the Chinese bermudagrass genotypes, but also clearly indicated that
environmental effects and genotype x environment interactions were large. Variance
estimates for seed yield components also indicated large magnitudes of genetic variability
116
among Chinese bennudagrass genotypes (Table 6). Magnitudes of variance estimates for
D 2 oxv, D 2 8 , D 2 oxa, and D 2v relative to that of D 2 o were larger for seed prolificacy,
seed set, and seed number seedhead-1than for raceme number per head and raceme length
per head, indicating that the former three traits are more sensitive to environment than the
latter.
For experiment B, variance component estimates for seed yield, seed head
prolificacy, percent seed set, seed number seedhead-1, raceme number seedhead-1and
raceme length seedhead-1 are presented in Table 7. Highly significant (P<0.01) estimates
were obtained for D 2 0 ( seed yield and the five seed yield components), D 2 oxv ( seed
yield, seed head prolificacy, seed set percentage and seed number seedhead-1), and D 2 oxa
(seed head prolificacy and raceme length seedhead- 1). For seed yield, the magnitude of
D 2 0 was lower than D 2 oxv and D 2 y, indicating substantial effects due to environment
and interaction of genotype and environment. As in experiment A, the magnitude of D 2 0
for seed head prolificacy in experiment B was larger than all other main effect variance
components, suggesting that this trait was not as sensitive as seed yield to environmental
conditions. For seed set percentage and seed number seedhead-1, the variance components
attributable to D 2 y were larger than those of D 2 o indicating the importance of
environment during time of flowering. For raceme number seedhead-1and raceme length
seedhead-1, magnitudes of D 2owere larger than those of D 2oxv, D 2v, D 2oxaand D 2a,
indicating the relatively greater importance of genotype for these traits.
117
Correlation and path coefficient analysis
Correlation coefficients for seed yield and yield components in experiment A and
Bare given in Table 8. Correlation coefficients for same pair-wise comparisons were
basically similar in both experiments. Seed yield and seed head prolificacy had
significantly positive correlations for both experiments. These results indicated that
genotypes with more seed heads tended to produce higher seed yields. For both
experiments, seed yield was significantly positively correlated with seed set and seed
number seedhead-1 (Table 8). These results indicated that higher seed set and higher seed
number seedhead-1 both contributed significantly to increased seed yields. The results are
in congruence with those of Kenna et al. (1983) who reported positive and significant
correlation (r=0.52) between open-pollinated seed set percentage and seed yield. Ahring
et al. (1974) also reported that high seed set contributed significantly to seed yield.
Correlations of seed yield with raceme number seedhead-1 and raceme length seedhead-1
were negligible, even though the correlation between seed yield and raceme length in
experiment A was significant (P<0.01). This indicated that raceme number seedhead-1and
raceme length seedhead-1had no substantial effects on seed yield. Ahring et al. (1974)
pointed out that the relative numbers of component parts of the inflorescence (i.e.,
racemes seedhead-1' florets raceme-1, and florets seedhead-1) were apparently of only
minor importance in determining seed yield. The highest correlation coefficients among
seed yield components was between seed set percentage and seed number seedhead-1 in
both experiments (Table 8). This indicated that genotypes bearing more seeds seedhead-1
had higher fertility. The correlations between raceme length and raceme number
118
seedhead-1 were positive and significant in both experiments. This indicated that it is
possible to have higher raceme number and longer racemes in the same genotype. Plants
with more racemes per seed head normally had more spikelets, although these two
characters did not contribute greatly to seed yield. The correlations of seed head
prolificacy with seed set and seeds seedhead-1 were low but positive and significant in
both experiments.
Path coefficient analysis partitioned correlation coefficients among seed yield and
its components into direct and indirect effects (Tables 9 and 10). Seed head prolificacy
had the largest direct positive effect on seed yield in both experiments. The magnitudes
of these direct effects were not much different from the magnitudes of correlation
between these two traits. The path coefficient and correlation analyses both indicated that
direct selection for higher seed head prolificacy would indirectly select for higher seed
yield in bermudagrass populations having seed production capability. In both
experiments, seed set had the second highest direct positive effect on seed yield, again
agreeing with correlation analyses that together indicate the importance of seed set as a
determinant of seed yield. Correlations between seed number seedhead-1 and seed yield
were positive in both experiments, however, the direct effects of seed number seedhead-
1on seed yield were negligible. This indicated that indirect effects resulted in the positive
correlation. It is evident from Tables 9 and 10 that seed number had a high indirect effect
on seed yield via seed set. This indicates seed set may be used as a criterion for indirect
selection for seed yield. In phenotypic path coefficient analysis, a large residual effect
usually indicates that there are traits other than those included in pathways that contribute
to the dependent variables (Wang et al., 1999). In the present study, residual effects for
119
experiments A and B were 0.642 and 0.601, respectively (Table 9 and 10). These large
residual effects indicated that there were either other unmeasured traits contributing to
seed yield or there was substantial sampling error.
The enormous amount of genetic variability for seed yield and seed yield
components among the Chinese C. dactylon genotypes in this study supports the findings
on genotypes from other origins (Richardson et al., 1978; Harlan and de Wet, 1969). Seed
yield is heavily affected by environment and genotype by environment interactions. In
this study, average seed yields in 2003 were approximately six times and three times
higher than those in 2002 for experiments A and B, respectively. These differences may
be due to age of stand, or environmental conditions during the respective flowering
periods, or both. Excellent summer seed yields were obtained under dryland conditions
followed by a moist and dry weather sequence (Ahring et al., 1974). Ahring et al. (1982)
further indicated mild stress and growth promotion cycles resulted in progressive
"flushes" of inflorescence production.
In summary, the results of the two field experiments demonstrate the existence of
enormous genetic variability in seed yields and seed yield components in the Chinese C.
dactylon collection. The results from correlation and path coefficient analyses indicate
that selection for increased seed head prolificacy and seed set should be the best indirect
selection traits for improvement of seed yield.
120
REFERENCES
Ahring, R.M., C.M. Taliaferro, and R.D. Morrison. 1974. Seed production of several
strains and hybrids ofbennudagrass, Cynodon dactylon (L.) Pers. Crop Sci.
14:93-95.
Ahring, R.M., C.M. Taliaferro, and W.L. Richardson. 1982. Single-cross bermudagrass
seed production under different management. Agron. J. 74:445-446.
Alderson, J., and W.C. Sharp. 1994. Grass varieties in the United States. CRC lewis
publisher, Inc., Boca Raton, FL.
Anonymous.1990. Chinese Floral Acta. Science Press, Beijing. 10:82-85. (in Chinese).
Baltensperger, A.A., and J.P. Klingenberg. 1994. Introducing new seed-propagated Fl
hybrid (2-clone synthetic) bermudagrass. USGA Green Section Record. 32:14-19.
Burton, G.W. 1947. Breeding Bermuda grass for the southeastern United States.
Agron. J. 39:551-569.
Burton, G.W. 1965. Breeding better bermudagrass. P 93-96. In Proc. IX Intl. Grassl.
Cong., Sao Paulo, Brazil.
Burton, G.W. 1966. Tifway (Tifton 419) bermudagrass. Crop Sci. 6:93-94.
Burton, G.W., and R.H. Hart. 1967. Use of self-incompatibility to produce commercial
seed-propagated F1 bermudagrass hybrids. Crop Sci. 7:524-527.
Burton, G.W., and W.G. Monson. 1978. Registration of 'Tifton 44' bermudagrass. Crop
Sci. 18:911.
Cluff, G.J., and A.A. Baltensperger. 1991. Heritability estimates for seed yield and seed
121
yield components in bermudagrass. Agric. Exp. St. Bull. 759. College of Agric.
And Home Economics, New mexico State University.
Das, M.K., R.G. Fuentes, and C.M. Taliaferro. 2004. Genetic variability and trait
relationships in switchgrass. Crop Sci. 44:443-448.
Dewey, D.R., and K.H. Lu. 1959. A correlation and path-coefficient analysis of
components of crested wheatgrass seed production. Agron. J. 51:515-518.
Harlan, J.R., and J.M.J. de Wet. 1969. Source of variation in Cynodon dactylon (L.) Pers.
Crop Sci. 9:774-778.
Harlan, J.R. 1970. Cynodon species and their value for grazing or hay. Herbage Abs.
40:233-238.
Hanna, W.W., R.N. Carrow, and A.J. Powell. 1997. Registration of 'Tift 94'
bermudagrass. Crop Sci. 37:1012.
Hein, M.A. 1953. Registration of varieties and strains of Bermuda grass, II [Cynodon
dactylon (L.) Pers.]. Agron. J. 45:572-573.
Kenna, M.P., C.M. Taliaferro, and W.L. Richardson. 1983. Comparative fertility and
seed yields of parental bermudagrass clones and their single cross Fl and F2
populations. Crop Sci. 23:1133-1135.
Richardson, W.L., C.M. Taliaferro, and R.M. Ahring. 1978. Fertility of eight
bermudagrass clones and open-pollinated progeny from them. Crop Sci. 18:332-
334.
SAS Institute. 1999. SAS Proprietary Software Version 8.0 SAS Inst., Cary, NC.
Taliaferro, C.M., R.M. ahring, and W.L. Richardson. 1983. Registration of 'Guymon'
bermudagrass. Crop Sci. 23:1219.
122
Taliaferro, C.M. 1995. Diversity and vulnerability of Bermuda Turfgrass species.
Crop Sci. 35:327-332.
Taliaferro, C.M., and J.T. Lam.le. 1997. Cytological analysis of self-incompatibility in
Cynodon dactylon (L.) Pers. International Turfgrass Society Research J. 8:393-
399.
Taliaferro, C.M. 2003. Bermudagrass (Cynodon (L.) Rich). P.235-256. In M.D.
Casler and R. Duncan ( ed.) Turfgrass Biology, Genetics, and Breeding. Sleeping
Bear Press.
Wang, G., M.S. Kang, and 0. Moreno. 1999. Genetic analyses of grain filling rate and
duration in maize. Field Crops Res. 61:211-222.
123
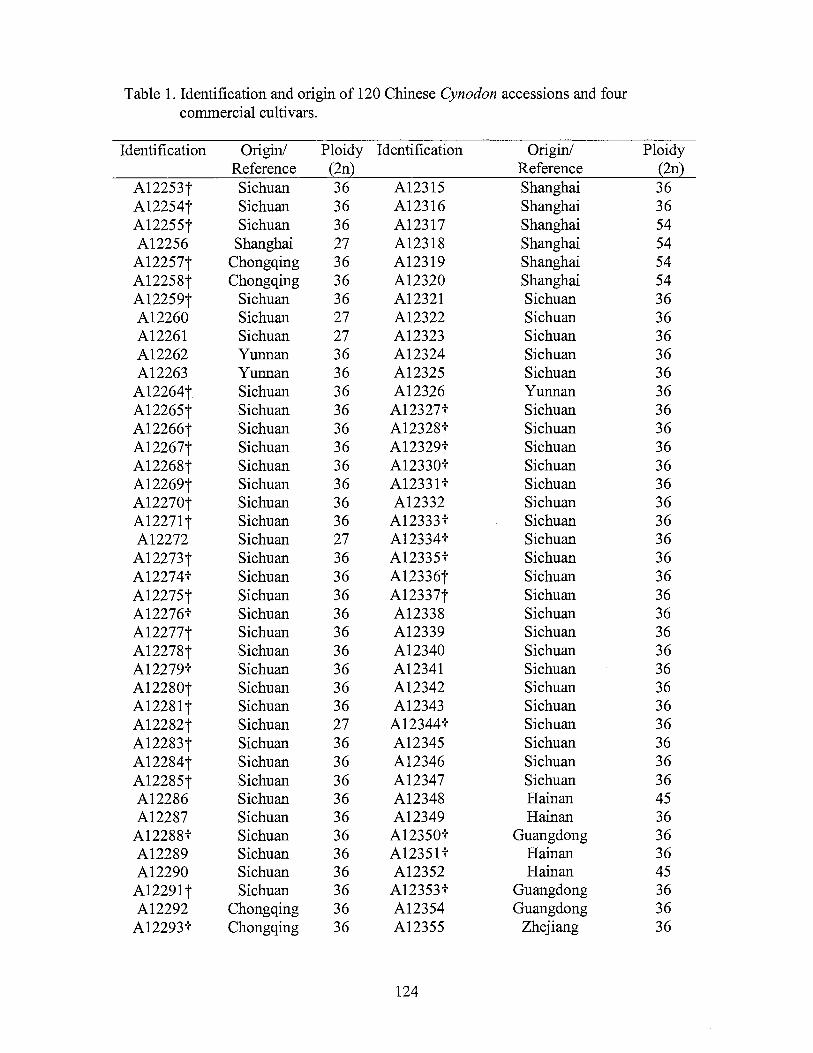
Table 1. Identification and origin of 120 Chinese Cynodon accessions and four commercial cultivars.
Identification Origin/ Ploidy Identification Origin/ Ploidy Reference (2n) Reference (2n}
Al2253t Sichuan 36 A12315 Shanghai 36 A12254t Sichuan 36 A12316 Shanghai 36 A12255t Sichuan 36 A12317 Shanghai 54 Al2256 Shanghai 27 A12318 Shanghai 54
A12257t Chongqing 36 A12319 Shanghai 54 Al2258t Chongqing 36 A12320 Shanghai 54 A12259t Sichuan 36 A12321 Sichuan 36 A12260 Sichuan 27 A12322 Sichuan 36 A12261 Sichuan 27 A12323 · Sichuan 36 Al2262 Yunnan 36 A12324 Sichuan 36 Al2263 Yunnan 36 A12325 Sichuan 36 A12264t Sichuan 36 A12326 Yunnan 36 A12265t Sichuan 36 A12327t Sichuan 36 A12266t Sichuan 36 A12328t Sichuan 36 A12267t Sichuan 36 A12329t Sichuan 36 A12268t Sichuan 36 A12330t Sichuan 36 A12269t Sichuan 36 A12331t Sichuan 36 A12270t Sichuan 36 A12332 Sichuan 36 A12271 t Sichuan 36 Al2333t Sichuan 36 A12272 Sichuan 27 A12334t Sichuan 36 A12273t Sichuan 36 A12335t Sichuan 36 A12274t Sichuan 36 Al2336t Sichuan 36 A12275t Sichuan 36 A12337t Sichuan 36 A12276t Sichuan 36 A12338 Sichuan 36 Al2277t Sichuan 36 A12339 Sichuan 36 Al2278t Sichuan 36 A12340 Sichuan 36 A12279t Sichuan 36 A12341 Sichuan 36 A12280t Sichuan 36 A12342 Sichuan 36 Al2281t Sichuan 36 A12343 Sichuan 36 A12282t Sichuan 27 A12344t Sichuan 36 A12283t Sichuan 36 A12345 Sichuan 36 A12284t Sichuan 36 A12346 Sichuan 36 A12285t Sichuan 36 A12347 Sichuan 36 A12286 Sichuan 36 A12348 Hainan 45 A12287 Sichuan 36 A12349 Hainan 36 A12288t Sichuan 36 A12350t Guangdong 36 A12289 Sichuan 36 A12351t Hain an 36 A12290 Sichuan 36 A12352 Hain an 45
A12291t Sichuan 36 A12353t Guangdong 36 A12292 Chongqing 36 A12354 Guangdong 36 A12293t Chongqing 36 A12355 Zhejiang 36
124
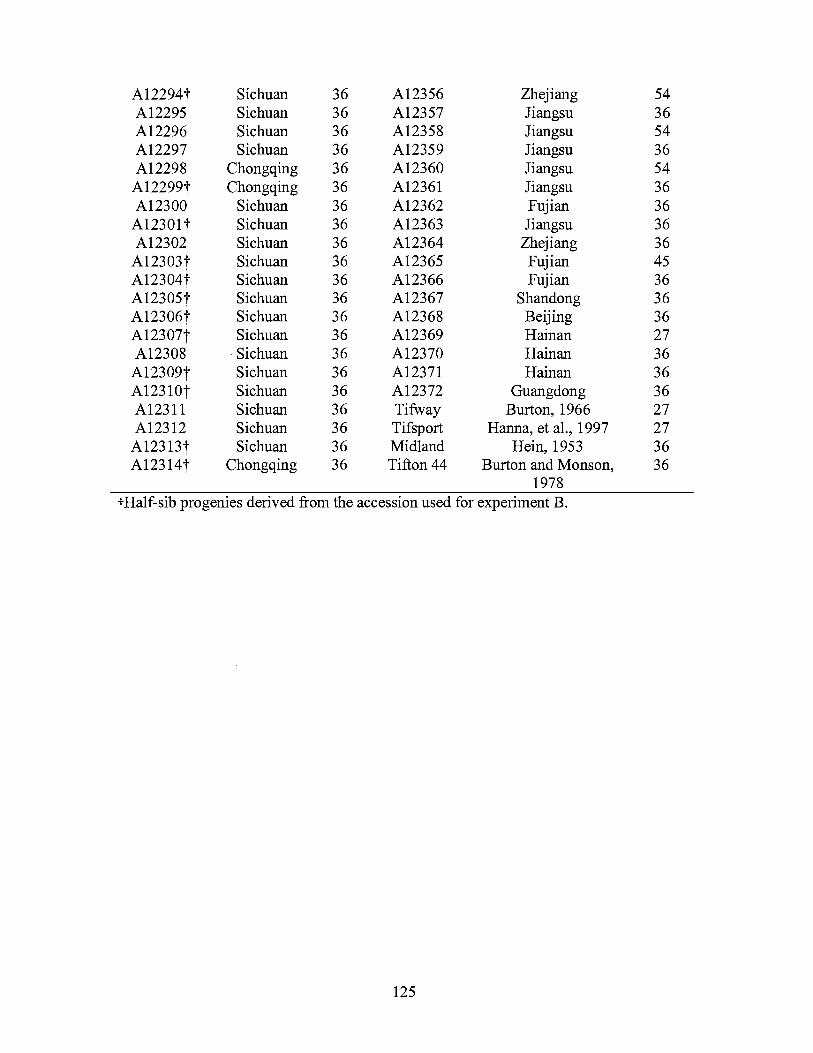
A12294t Sichuan 36 A12356 Zhejiang 54 A12295 Sichuan 36 A12357 Jiangsu 36 A12296 Sichuan 36 A12358 Jiangsu 54 A12297 Sichuan 36 A12359 Jiangsu 36 A12298 Chongqing 36 A12360 Jiangsu 54
A12299t Chongqing 36 Al2361 Jiangsu 36 A12300 Sichuan 36 A12362 Fujian 36
A12301 t Sichuan 36 A12363 Jiangsu 36 A12302 Sichuan 36 A12364 Zhejiang 36 A12303t Sichuan 36 A12365 Fujian 45 A12304t Sichuan 36 A12366 Fujian 36 A12305t Sichuan 36 A12367 Shandong 36 A12306t Sichuan 36 A12368 Beijing 36 A12307t Sichuan 36 A12369 Hainan 27 A12308 · Sichuan 36 Al2370 Hain an 36 A12309t Sichuan 36 A12371 Hainan 36 A12310t Sichuan 36 Al2372 Guangdong 36 A12311 Sichuan 36 Tifway Burton, 1966 27 A12312 Sichuan 36 Tifsport Hanna, et al., 1997 27
A12313t Sichuan 36 Midland Hein, 1953 36 A12314t Chongqing 36 Tifton 44 Burton and Monson, 36
1978 tHalf-sib progenies derived from the accession used for experiment B.
125
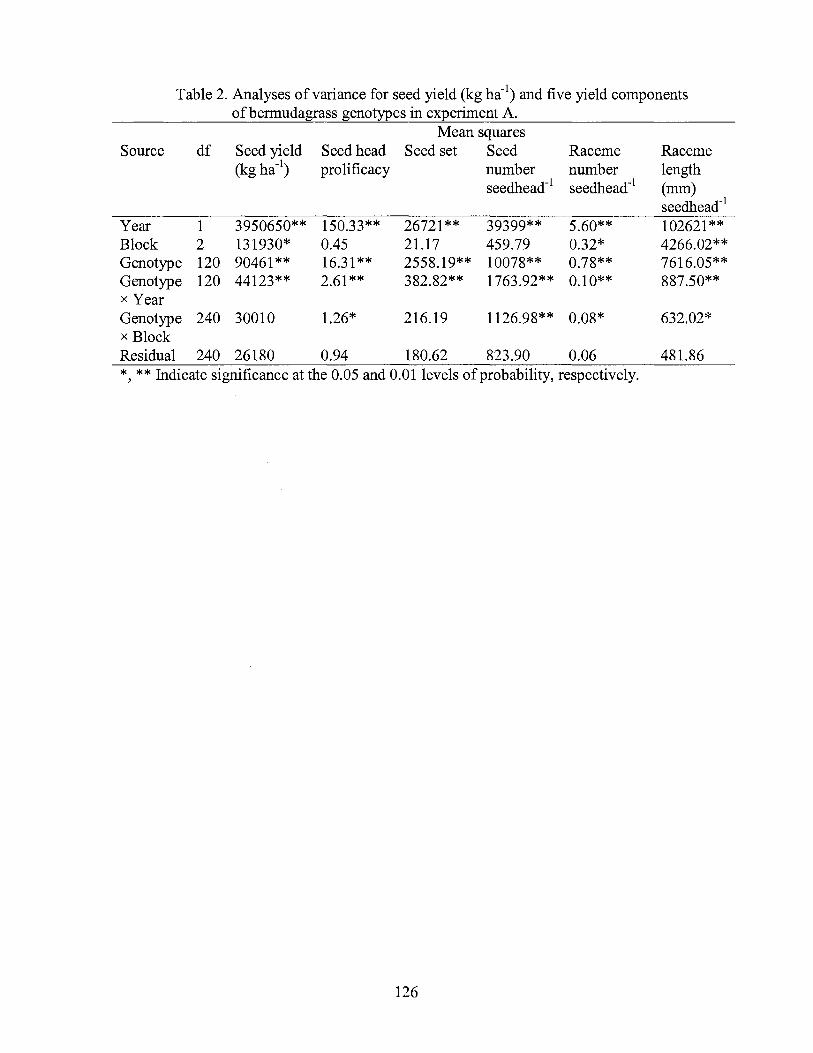
Table 2. Analyses of variance for seed yield (kg ha-1) and five yield components of bermudagrass genotypes in ex:eeriment A.
Mean squares Source df Seed yield Seed head Seed set Seed Raceme Raceme
(kg ha-1) prolificacy number number length seedhead-1 seedhead-1 (mm)
seedhead-1
Year 1 3950650** 150.33** 26721** 39399** 5.60** 102621** Block 2 131930* 0.45 21.17 459.79 0.32* 4266.02** Genotype 120 90461** 16.31** 2558.19** 10078** 0.78** 7616.05** Genotype 120 44123** 2.61 ** 382.82** 1763.92** 0.10** 887.50** x Year Genotype 240 30010 1.26* 216.19 1126.98** 0.08* 632.02* x Block Residual 240 26180 0.94 180.62 823.90 0.06 481.86 *,**Indicate significance at the 0.05 and 0.01 levels of probability, respectively.
126
Table 3. Mean and range of seed yield and its components for experiment A in 2002 and 2003.
Descriptor 2002 2003 Mean± Std Range Mean± Std Range
Seed yield 74.44±143.33 0.00-466.30 222.58±249.18 0.00-864.44 (kg/ha) Seed head 4.43±1.94 1.00-9.00 5.33±2.00 2.00-9.00 prolificacy Seed set 31.20±23.94 0.00-88.72 43.43±26.22 0.05-96.16 (%) Seed No./ 67.40±53.34 0.00-206.10 81.74±49.82 0.01-190.50 head Racemes/ 4.68±0.46 3.70-5.70 4.48±0.43 3.50-5.90 head Raceme 217.67±47.48 131.60-345.20 191.98±37.51 119.60-329.40 length/head (mm
127
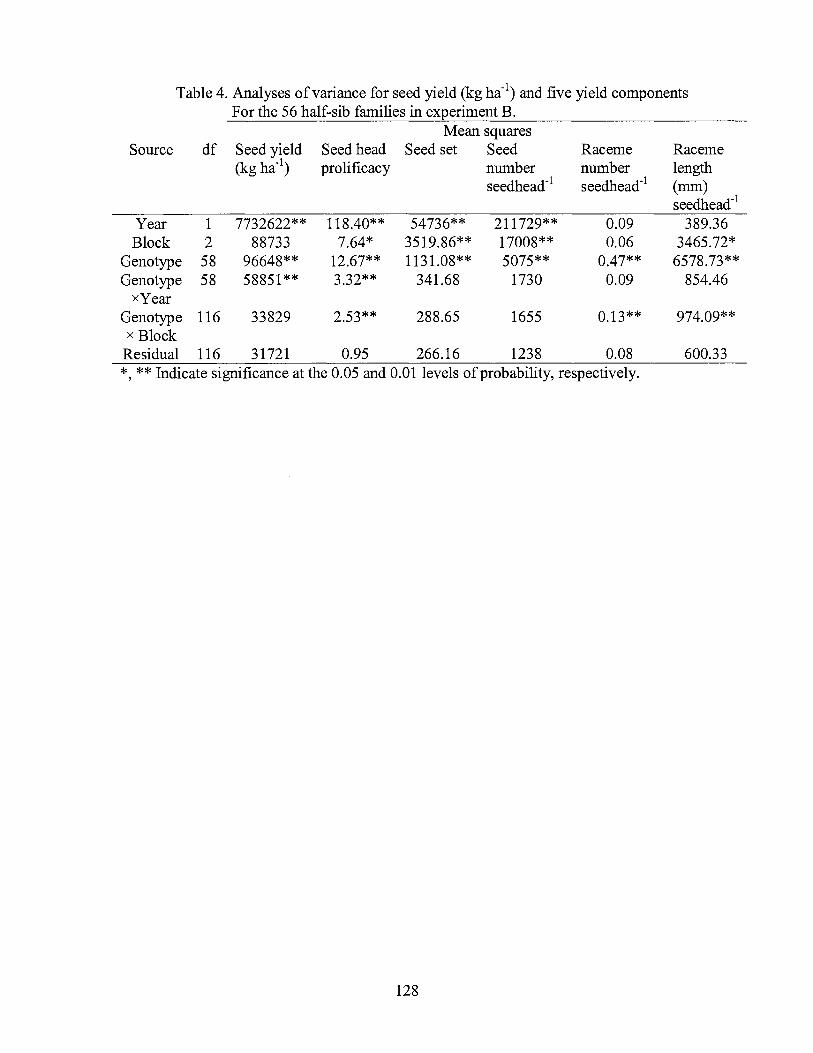
Table 4. Analyses of variance for seed yield (kg ha-1) and five yield components For the 56 half-sib families in ex:eeriment B.
Mean squares Source df Seed yield Seed head Seed set Seed Raceme Raceme
(kg ha-1) prolificacy number number length seedhead-1 seedhead-1 (mm)
seedhead-1
Year 1 7732622** 118.40** 54736** 211729** 0.09 389.36 Block 2 88733 7.64* 3519.86** 17008** 0.06 3465.72*
Genotype 58 96648** 12.67** 1131.08** 5075** 0.47** 6578.73** Genotype 58 58851** 3.32** 341.68 1730 0.09 854.46
xYear Genotype 116 33829 2.53** 288.65 1655 0.13** 974.09** x Block
Residual 116 31721 0.95 266.16 1238 0.08 600.33 *,**Indicate significance at the 0.05 and 0.01 levels of probability, respectively.
128
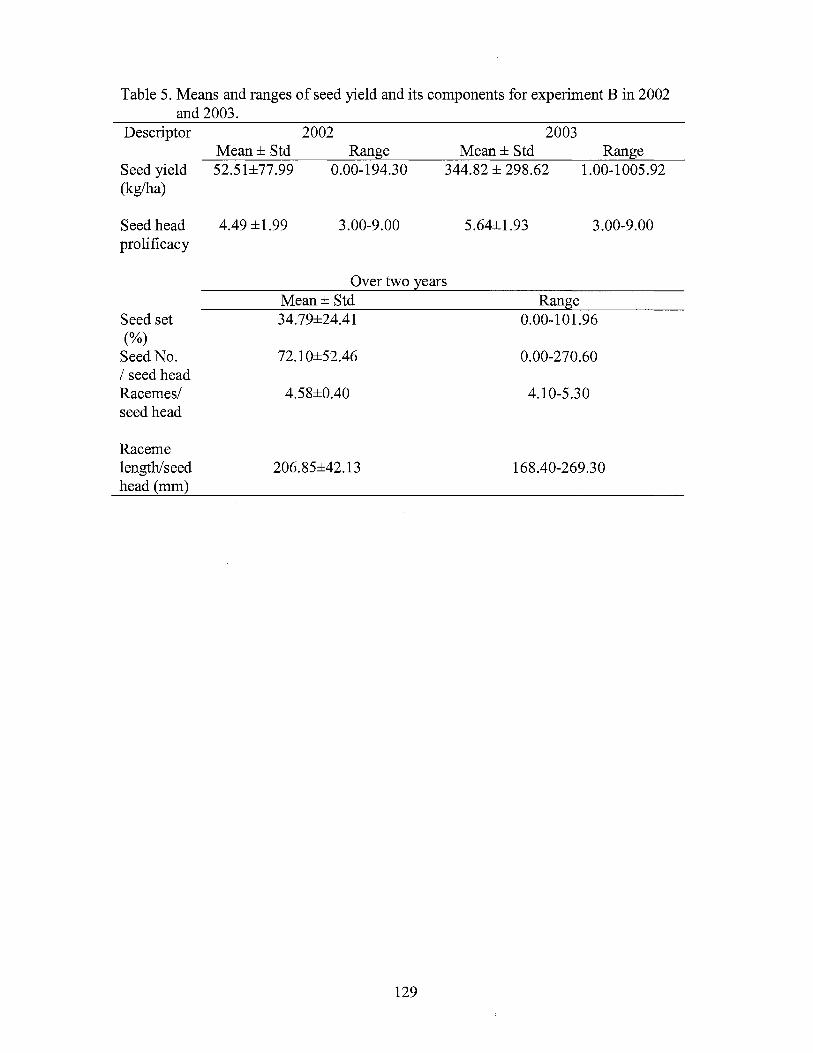
Table 5. Means and ranges of seed yield and its components for experiment Bin 2002 and 2003.
Descriptor
Seed yield (kg/ha)
Seed head prolificacy
Seed set (%)
Seed No. I seed head Racemes/ seed head
Raceme length/seed head (mm)
2002 2003 Mean± Std Range Mean± Std Range 52.51±77.99 0.00-194.30 344.82 ± 298.62 1.00-1005.92
4.49 ±1.99 3.00-9.00 5.64±1.93 3.00-9.00
Over two years Mean± Std Range 34. 79±24.41 0.00-101.96
72.10±52.46 0.00-270.60
4.58±0.40 4.10-5.30
206.85±42.13 168.40-269.30
129
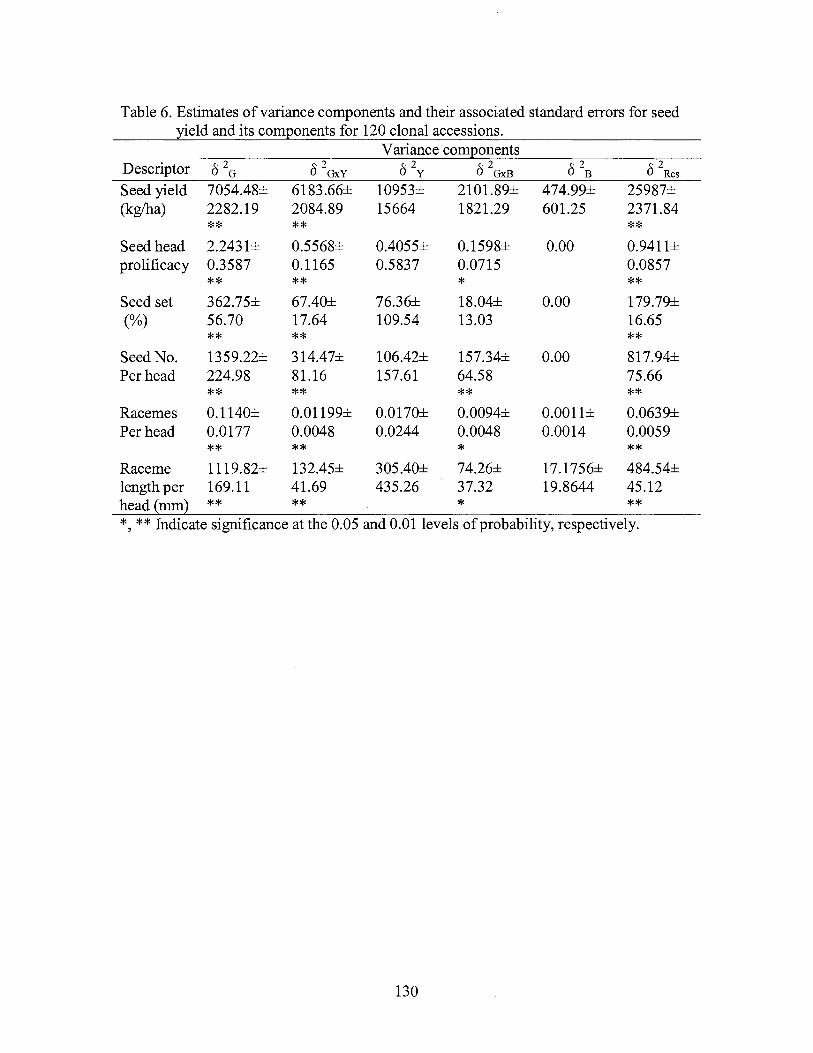
Table 6. Estimates of variance components and their associated standard errors for seed yield and its components for 120 clonal accessions.
Variance components Descriptor D 2o D 2GxY D 2v D 2oxB D 2a D 2Res
Seed yield 7054.48± 6183.66± 10953± 2101.89± 474.99± 25987± (kg/ha) 2282.19 2084.89 15664 1821.29 601.25 2371.84
** ** ** Seed head 2.2431± 0.5568± 0.4055± 0.1598± 0.00 0.9411± prolificacy 0.3587 0.1165 0.5837 0.0715 0.0857
** ** * ** Seed set 362.75± 67.40± 76.36± 18.04± 0.00 179.79± (%) 56.70 17.64 109.54 13.03 16.65
** ** ** Seed No. 1359.22± 314.47± 106.42± 157.34± 0.00 817.94± Per head 224.98 81.16 157.61 64.58 75.66
** ** ** ** Racemes 0.1140± 0.01199± 0.0170± 0.0094± 0.0011± 0.0639± Per head 0.0177 0.0048 0.0244 0.0048 0.0014 0.0059
** ** * ** Raceme 1119.82± 132.45± 305.40± 74.26± 17.1756± 484.54± length per 169.11 41.69 435.26 37.32 19.8644 45.12 head(mm) ** ** * ** *,**Indicate significance at the 0.05 and 0.01 levels of probability, respectively.
130
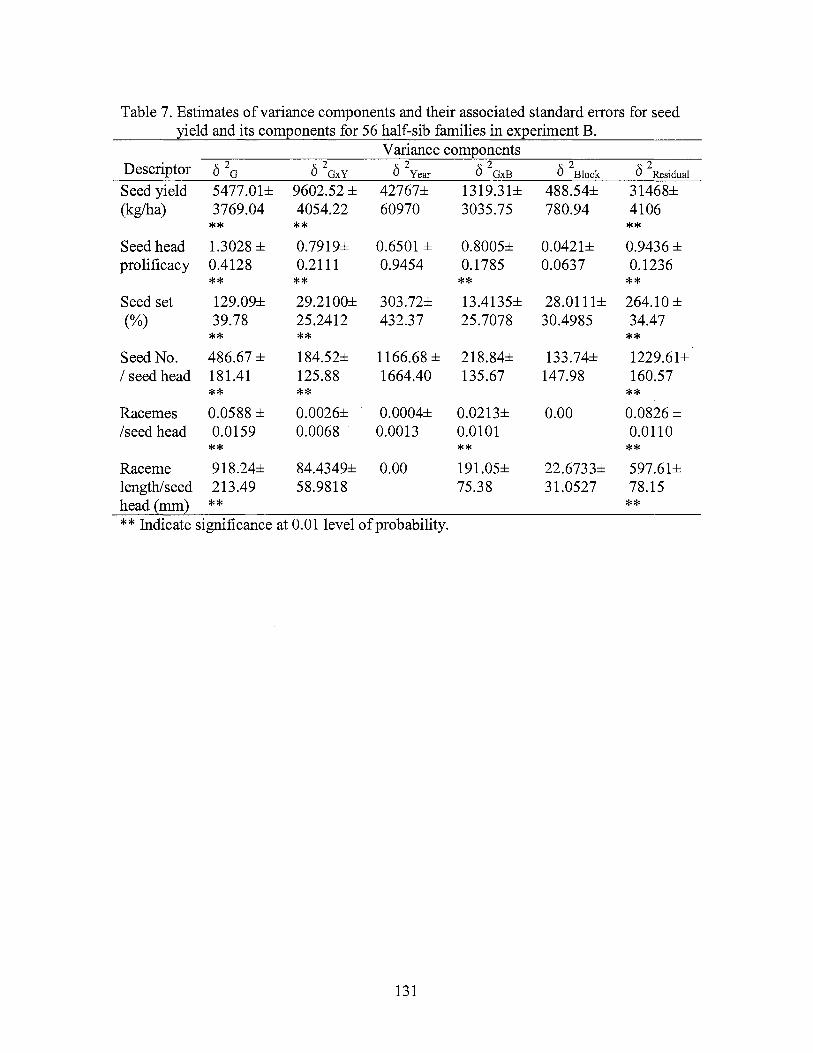
Table 7. Estimates of variance components and their associated standard errors for seed yield and its components for 56 half-sib families in ex:eeriment B.
Variance components Descriptor 0 2o 0 2GxY 0 2vear 0 2oxB 0 2B1ock 0 2Residual
Seed yield 5477.01± 9602.52 ± 42767± 1319.31± 488.54± 31468± (kg/ha) 3769.04 4054.22 60970 3035.75 780.94 4106
** ** ** Seed head 1.3028 ± 0.7919± 0.6501 ± 0.8005± 0.0421± 0.9436 ± prolificacy 0.4128 0.2111 0.9454 0.1785 0.0637 0.1236
** ** ** ** Seed set 129.09± 29.2100± 303.72± 13.4135± 28.0111± 264.10 ± (%) 39.78 25.2412 432.37 25.7078 30.4985 34.47
** ** ** Seed No. 486.67 ± 184.52± 1166.68 ± 218.84± 133.74± 1229.61± I seed head 181.41 125.88 1664.40 135.67 147.98 160.57
** ** ** Racemes 0.0588 ± 0.0026± 0.0004± 0.0213± 0.00 0.0826 ± /seed head 0.0159 0.0068 0.0013 0.0101 0.0110
** ** ** Raceme 918.24± 84.4349± 0.00 191.05± 22.6733± 597.61± length/seed 213.49 58.9818 75.38 31.0527 78.15 head(mm) ** ** ** Indicate significance at 0.01 level of probability.
131
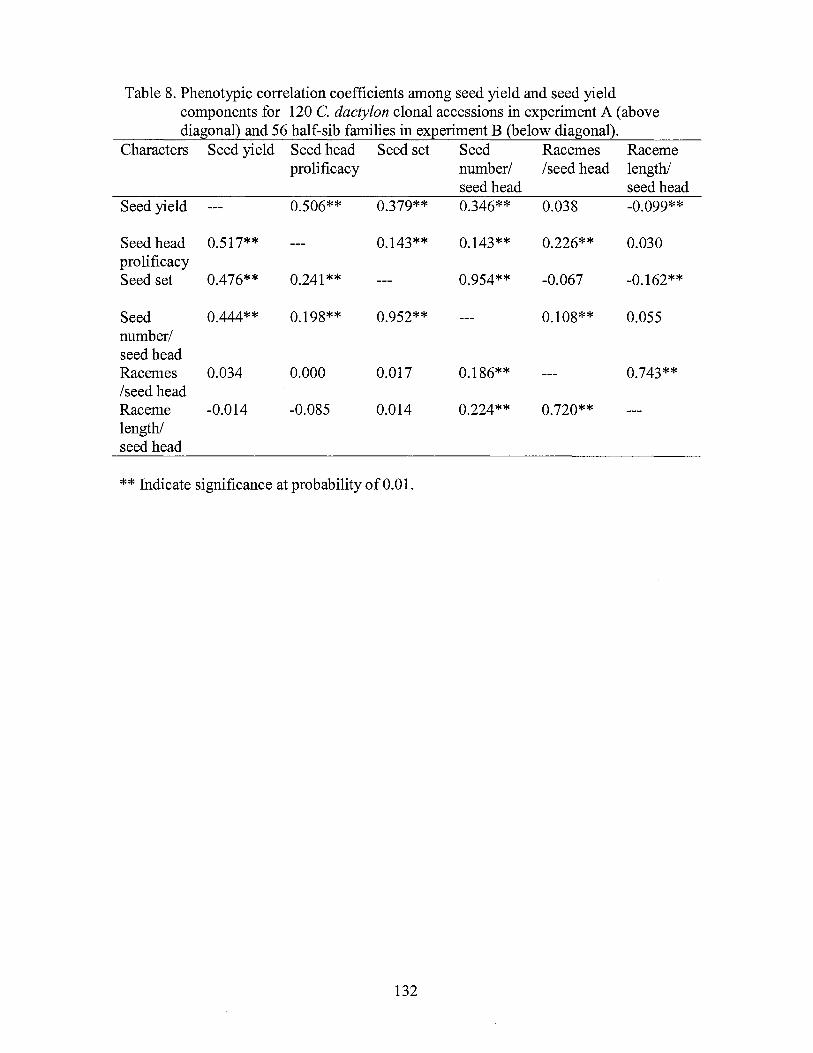
Table 8. Phenotypic correlation coefficients among seed yield and seed yield components for 120 C. dactylon clonal accessions in experiment A (above diagonal) and 56 half-sib families in experiment B (below diagonal).
Characters Seed yield Seed head Seed set Seed Racemes Raceme prolificacy number/ /seed head length/
seed head seed head Seed yield 0.506** 0.379** 0.346** 0.038 -0.099**
Seed head 0.517** 0.143** 0.143** 0.226** 0.030 prolificacy Seed set 0.476** 0.241 ** 0.954** -0.067 -0.162**
Seed 0.444** 0.198** 0.952** 0.108** 0.055 number/ seed head Racemes 0.034 0.000 0.017 0.186** 0.743** /seed head Raceme -0.014 -0.085 0.014 0.224** 0.720** length/ seed head
** Indicate significance at probability of 0.01.
132
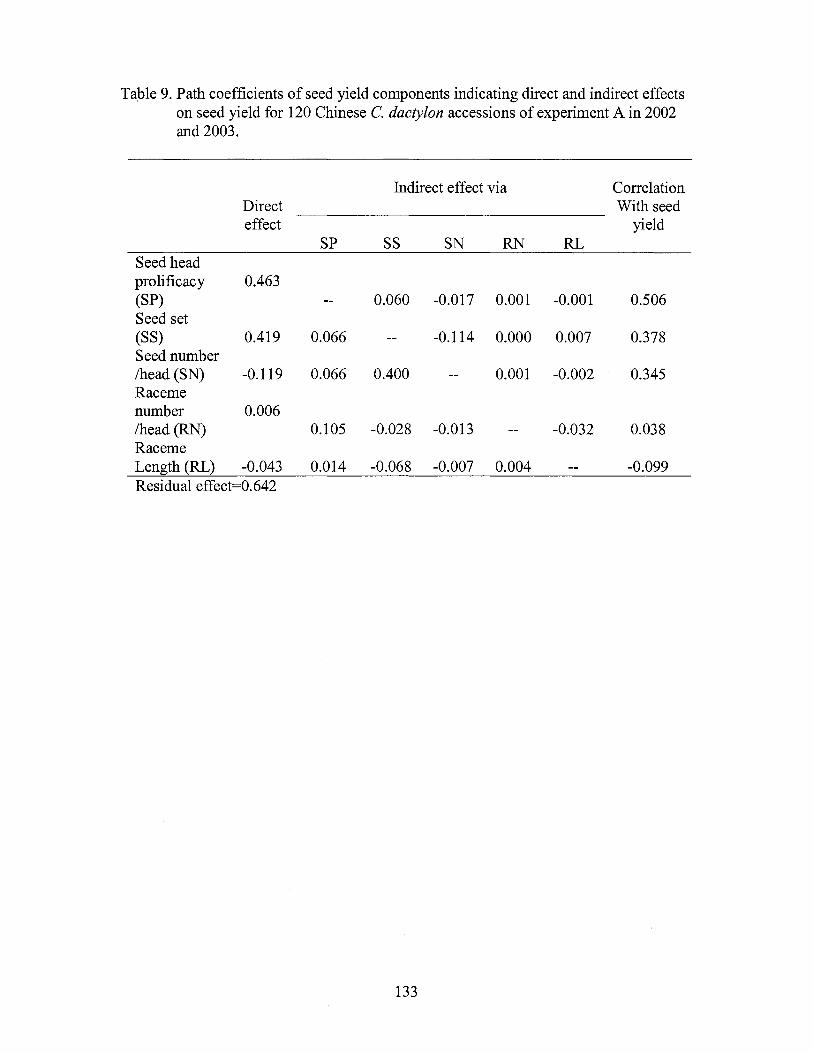
Table 9. Path coefficients of seed yield components indicating direct and indirect effects on seed yield for 120 Chinese C. dactylon accessions of experiment A in 2002 and 2003.
Indirect effect via Correlation Direct With seed effect yield
SP ss SN RN RL Seed head prolificacy 0.463 (SP) 0.060 -0.017 0.001 -0.001 0.506 Seed set (SS) 0.419 0.066 -0.114 0.000 0.007 0.378 Seed number /head (SN) -0.119 0.066 0.400 0.001 -0.002 0.345 Raceme number 0.006 /head (RN) 0.105 -0.028 -0.013 -0.032 0.038 Raceme Length(RL) -0.043 0.014 -0.068 -0.007 0.004 -0.099 Residual effect=0.642
133
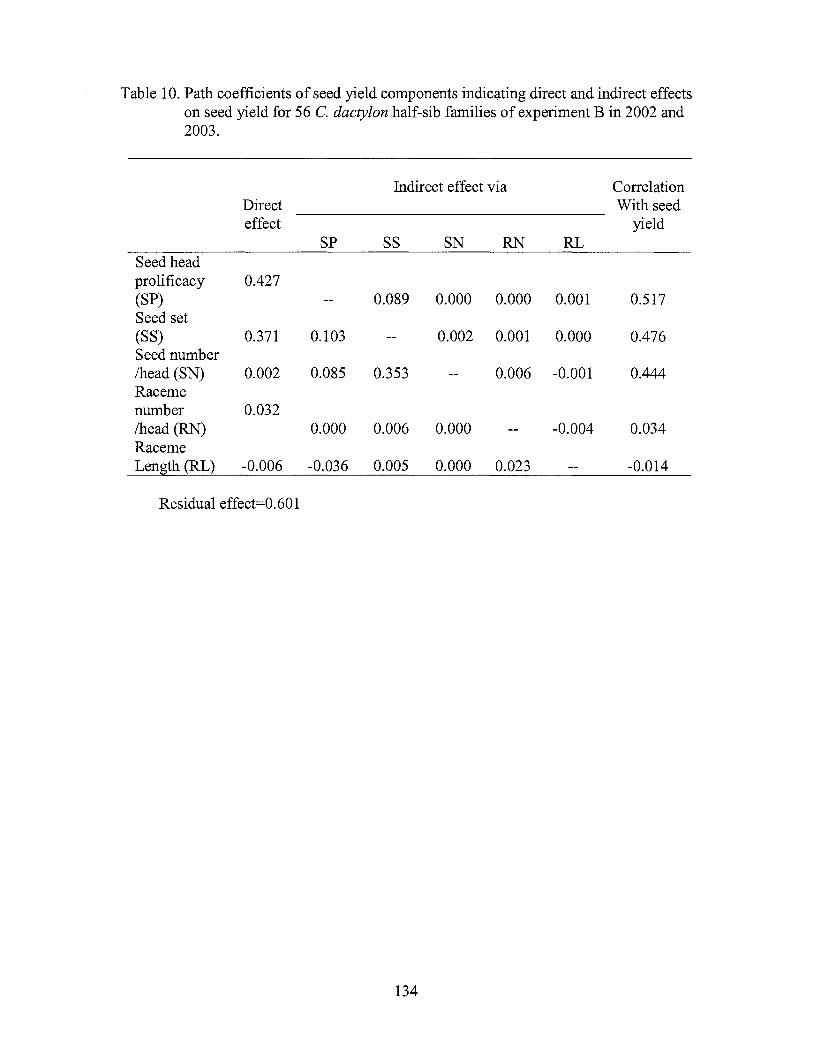
Table 10. Path coefficients of seed yield components indicating direct and indirect effects on seed yield for 56 C. dactylon half-sib families of experiment B in 2002 and 2003.
Indirect effect via Correlation Direct With seed effect yield
SP ss SN RN RL Seed head prolificacy 0.427 (SP) 0.089 0.000 0.000 0.001 0.517 Seed set (SS) 0.371 0.103 0.002 0.001 0.000 0.476 Seed number /head (SN) 0.002 0.085 0.353 0.006 -0.001 0.444 Raceme number 0.032 /head (RN) 0.000 0.006 0.000 -0.004 0.034 Raceme Length (RL) -0.006 -0.036 0.005 0.000 0.023 -0.014
Residual effect=0.601
134
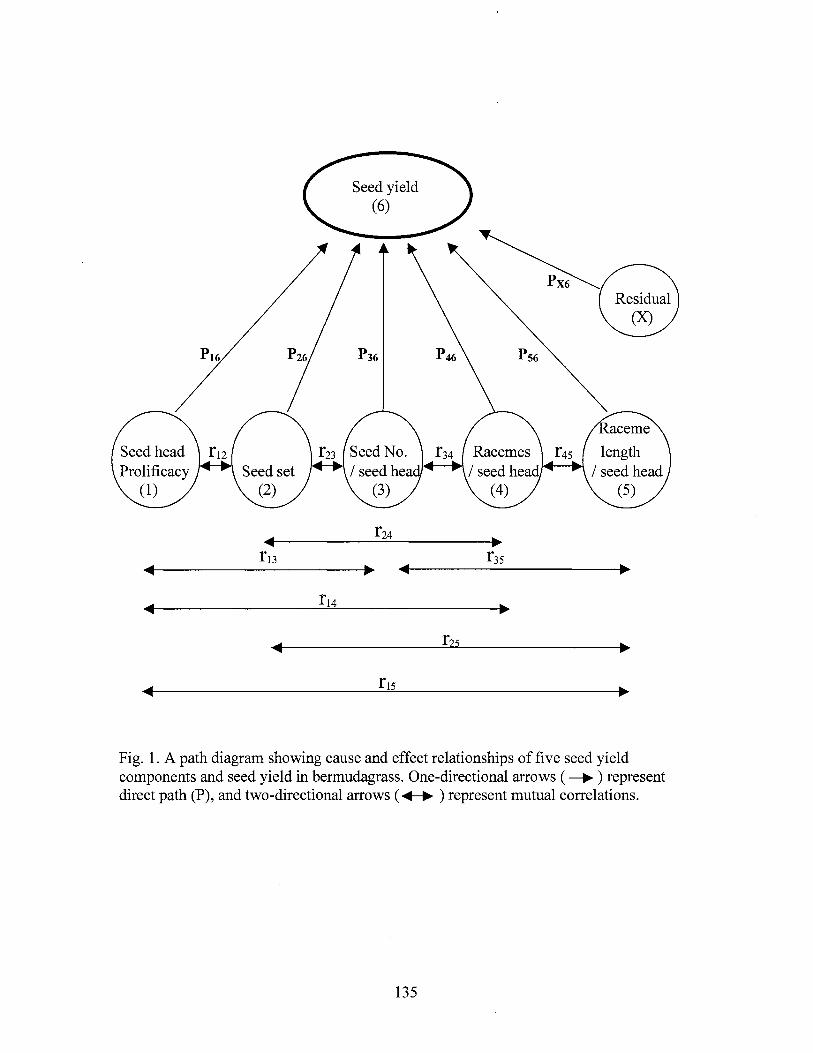
... f24 ~
f13 f35 ... • ... • f14
~ f2s • f15
Fig. 1. A path diagram showing cause and effect relationships of five seed yield components and seed yield in bermudagrass. One-directional arrows ( ___. ) represent direct path (P), and two-directional arrows ( ._. ) represent mutual correlations.
135
CHAPTER VII
GENETIC CHARACTERIZATION OF CHINESE CYNODON ACCESSIONS BY
FIELD EXPERIMENTATIONS:
II. Genetic Variability in Traits Related to Turf
ABSTRACT
Bermudagrasses, Cynodon spp., are warm-season, sod-forming, perennial plants
widely used for turf in warmer regions of the world. Although bermudagrass is
indigenous to and widely distributed in China no information is available on genetic
within this pool for characters related to turf performance. Accordingly, two field
experiments were conducted in 2002 and 2003 to assess variation among 120 clonal
accessions (Experiment 1) and half-sib progeny families of 56 of the 120 clonal
accessions (Experiment 2) collected in China. 'Tifway' and 'TifSport' were included in
each experiment as standards. Eleven and 12 traits were respectively assessed by visual
rating and by measurement in both experiments using a randomized complete block
design with three replications. Clonal accessions in Experiment 1 differed significantly
(P<0.05) for all traits. Half-sib family accessions in Experiment 2 differed significantly
(P<0.05) for most of the traits. Cluster analysis was used to group the accessions based
on similarity of phenotypic traits. Magnitude of genetic variance estimate for each of all
traits in the accessions was larger than that in half-sib families. Compared to cv 'Tifway'
136
and 'Tifsport', the Chinese accessions were higher in ratings for green up, but lower in
winter color retention. Seven phenotypic clusters were formed among the accessions, and
a core sub-collection of forty-seven accessions was selected based on both the cluster
analysis and the diversity of ploidy and geographic origin. The evaluated characters
should be improved by classical breeding procedures.
137
INTRODUCTION
Cynodon dactylon (L.) Pers. var. dactylon, common bermudagrass, is ubiquitous
and cosmopolitan (Harlan et al., 1970). The taxon is found on every continent and most
islands between about 45°N and 45°S latitudes. It penetrates to approximately 53°N in
Europe and is found reaching around 3,000 m elevation in South Asia, and below sea
level in East Asia and North Africa (Harlan et al., 1969). In warmer regions of the world,
the warm-season, sod-forming, perennial grass is widely used for turf, forage, and soil
stabilization and remediation (Harlan et al., 1969; Beard, 1973; Taliaferro, 1995; 2003).
In the southern U.S., bermudagrass is the principal introduced forage and turfgrass
species.
Natural variation within the taxon is enormous, ranging from very small, fine
textured plants used as turfgrasses to large, leafy robust plants used as pasture grasses
(Harlan et al., 1969). In the U.S., many superior turfbermudagrass cultivars were
derived from bermudagrass germ.plasm imported primarily from Africa during the last
century (Taliaferro, 1995; 2003). Juska and Hanson (1964) reported the morphological
characteristics related to general turf use of twenty-four bermudagrass cultivars,
introductions and selections, and their results provided some indications of the wide
range in morphological traits within turf-type bermudagrass. Wofford and Baltensperger
(1985), and Coffey and Baltensperger (1989) reported heritability estimates for selected
turfgrass characters in bermudagrass. Their results indicated that variation for various
morphological and turf performance characters were heritable, and several traits
including leaf length and leaf width had moderate to high narrow sense heritability values
138
(Wofford and Baltensperger, 1985; Coffey and Baltensperger, 1989). However, the full
range of genetic variability in C. dactylon var. dactylon is likely not represented in
current germ.plasm collections and much potential exists to add valuable new germ.plasm
to the collected pool (Taliaferro, 2003). Harlan (1970) noted that little of the enormous
variability that exists in the taxon had been used in breeding improvement programs up to
that time. The notation remains currently true.
Cynodon dactylon is indigenous to China. The species is widely distributed in the
southern provinces, ranging from tropical Hainan Island to a line connecting the northern
edge of Sichuan province eastward to Shanghai. C. dactylon is also found in northern
China, especially in the regions south of the Yellow River (Anonymous,1990). In the far
northwest region, C. dactylon is found in the southern and northern oasis plains in
Xinjiang (Abulaiti et al., 1998). In southwestern China, it is widely distributed including
sites at approximately 3000 min elevation in Yunnan, but only reaches around 1700 m
elevation in the western mountainous regions in Sichuan. No information exists on
genetic variation for turf related characters in Chinese native bermudagrass. The
objectives of the study were to quantify genetic variability for morphological and
adaptive characters related to turf performance in Chinese Cynodon accessions.
139
MATERIALS AND METHODS
The plant accessions and experimental design used in this study were the same
as described in the previous chapter. Sampling and data collection were in 2001 through
2003, and methods were identical for both field experiments.
The characters examined, year and date of evaluation, and method of data
collection in this study are given in Table 1. First year ground coverage, winter color
retention, greenup, genetic color, sod density, slime mold, leaf spot and weed abundance
were visually rated in field as described in Table 1. Rate of plant establishment (stolon
growth), plant height with seedhead and height without seedhead were measured in field.
In August of2002 and 2003, five full-length stems were collected randomly in each plot,
and were kept in a plastic bag which was stored at -20°C in a freezer for measurements of
morphological traits (Table 1 ).
The PROC Mixed procedure of SAS (SAS Inst., 1999) was used to perform
analysis of variance (ANOVA), and to estimate variance components. Clonal accessions
or half-sib family accessions were treated as fixed effects and years and replications were
treated as random effects. Plot mean values for all traits were used in the statistic
analyses. Arcsine and square root transformation of data in percentages were used for
visually estimated estimates of ground coverage and winter-kill. For cluster analyses,
standardization of the accession mean for each trait by year in experiment A ( clonal
accessions) was performed within STAND module, and similarity coefficients among the
accessions were calculated using SIMINT module of NTSYS program version 2.0
(Exeter Software, New York, NY). Then cluster analysis was performed according to the
140
un-weighted pair-group mean algorithm (UPGMA) within SAHN module of the NTSYS
program by using the standardized data.
141
RESULTS AND DISCUSSIONS
Genetic variability of turf related traits in experiment A
Analyses of variance (ANOVA) for 11 visually rated and 12 measured traits in
the 117 Chinese Cynodon accessions are given in Table 2. Significant differences
(P<0.01) among genotypes were observed for each of the 23 traits (Table 2). Variation
due to years and genotype x year interactions were significant (P<0.05) for 16 of 18 traits
measured over years. Accordingly, means and ranges of the 16 traits are given by year in
Table 3. Standard deviations (Std) and ranges indicated phenotypic variation was
enormous for each of the 23 traits (Table 3). Estimates of the variance components and
associated standard errors for traits are presented in Table 4. Genotypic variance ( o 2 a)
components were significant (P<0.05) for all traits. Genotype by year interaction
components ( o 2axv) were significant (P<0.05) for all traits except the two leafblade
width traits (i.e. I st leaf blade width and 2nd leaf blade width on 3rd node). Variance
component estimates associated with year ( o 2 y ), genotype by block interaction ( o 2 axB)
and block ( o 2 8 ) were not significant. Magnitudes of o 2 a for winter color retention,
genetic color, sod density, winter-kill, greenup I, 2nd intemode length, 2nd intemode
diameter, 3rd intemode diameter were smaller than o 2axY or o 2v, suggesting large
environment effects and genotype by environment interactions for those traits.
Accordingly, accurate assessment of these traits requires testing in more than one
environment, with emphasis on testing two or more years. Magnitudes of o 2 GxY, o 2y for
plant height with seedhead, height without seedhead, greenup II and greenup III, average
intemode length, 3rd intemode length, leaf blade width and leaf blade length were lower
142
than those of o 2 0 , indicating higher heritability values for those traits. These results are
in congruence with those of Wofford and Baltensperger (1985) based on the magnitudes
of their reported heritability estimates for leaf length, leaf width, and intemode length.
Magnitudes of o 2 0 for stolon growth, ground coverage, slime mold and leaf spot, which
were measured only in one year, are larger than the summation of o 2 8 and o 2 Res,
suggesting high genetic effects on phenotypic variation for those traits. However, slime
mold and leaf spot only discernibly occurred in 2002, indicating environmental effects
are critical. The occurrence of weeds in significant numbers was only in 2003 because
when no control measures were taken. The magnitude of o 2 0 for weed abundance was
larger that of o 28 , indicating weed abundance in plots largely is decided by genotypes.
Weed abundance was greatest in plots of genotypes with a more open sod due either to
grown habit or to adaptational weakness ( e.g. winter injury).
Means and ranges of visually rated and measured traits for Tifway and Tifsport
standard are presented in Table 5. Comparison of the data in Table 5 with that in Table 3
for the Chinese accessions is informative relative to the potential value of the Chinese
germplasm in trait improvement. For instance, none of the Chinese accessions retained
late season color as well as Tifway or Tifsport. Alternatively, many of the Chinese
accessions had earlier spring greenup compared to the two cultivars. Some of the Chinese
accessions had darker green color than the two cultivars as indicated in the upper range
for genetic color. None of the Chinese accessions had the textural fineness ofTifway and
Tif'Sport as indicated by values for leaf blade width and intemode diameter.
Genetic variability of turf related traits in Experiment B
143
The ANOV A mean squares for visually rated and measured characters for the 54
half-sib families are given in Table 6. Significant differences (P<0.05) among half-sib
families were found for sod density, height with seedhead, winter kill, greenup II,
greenup III, average internode length, 2nd intemode length, 3rd intemode length, 3rd
intemode diameter, 1st leaf blade width on 3rd node, 1st leaf blade length on 3rd node, 2nd
leaf blade width on 3rd node, 2nd leaf blade length on 3rd node, stolon growth rate, slime
mold, leaf spot and weed abundance. No significant differences (P>0.05) were found
among the half-sib families for genetic color, height without seedhead, greenup I, 3rd
intemode diameter and winter color retention. Significant differences among the half-sib
families suggest that additive genetic effects constitute a major portion of the total
genetic variation for those traits. Breeding methods that capitalize on additive genetic
variation should result in improvement for those traits (Wofford and Baltensperger,
1985). Genotype by year interactions were significant for six and two of the visually
rated and physically measured traits, respectively. Means and ranges of means for all
traits are presented in Table 7. Standard deviations and ranges of the means for all traits
examined in 2001 through 2003 were smaller than those values in experiment A (Table
3), except four descriptors (two intemode diameters and two leaf blade lengths) in 2003
in Experiment B (Table 7). These results are in agreement with the previous reported
(Wofford and Baltensperger, 1985). The genetic variance component estimates for the 54
half-sib families are given in Table 8. All o 2 0 variance components except that for sod
density in Table 8 were smaller than the corresponding values in Table 4. The results are
expected since the variance component estimates from the half-sib families were the
additive portion of the total genetic variation (Wofford and Baltensperger, 1985).
144
Cluster Analysis of the Chinese Cynodon accessions
Cluster analysis resulted in a dendrogram of nine clusters based on the phenotypic
data (Fig. 1). Accessions with co-phenetic distances smaller than the subjective value
1.28 were included in the same cluster. Cluster one consisted of Midland and Tifton-44,
both pasture-type cultivars of similar morphology. Cluster four contained Tifsport and
Tifway. The Chinese accessions were included in seven different clusters (2, 3, and 5 to
9). Cluster nine had eight distinct sub-groupings. The number of accessions in each of
the seven clusters and their geographical origins and ploidy levels are given in Table 9.
Tetraploid accessions were grouped into each of the seven clusters, indicating this
cytotype to have a greater range of phenotypic variation than the other cytotypes. The
three pentaploids were grouped into one cluster indicating the smallest range of
phenotypic variation relative to other cytotypes. Hexaploid and triploid Chinese
cytotypes grouped into three and two separate clusters, respectively. Phenotypic
similarity of the majority of accessions from Sichuan province is indicated by 76 of 117
being included in group nine. The cluster analysis provided a basis for developing a core
collection of the Chinese accessions comprised of 47 accessions (Table 10). The
accessions in the core from cluster nine include one to five accessions from the cluster or
subclusters proportional to the number in respective groupings. Accessions included in
the core were selected to represent cytotypes and the various regions of geographic
origin. Triploid cytotypes were not included in the core groupings. Since most of the
morphological traits are very sensitive to environment and genotype by environment
interactions, the core selections would be of high value in regions climatically similar to
145
Oklahoma. In such environments, phenotypic expression and variability should be similar
to the kinds and levels exemplified by respective groupings (Casler, 2001).
In summary, significant genetic variability existed among the clonal and half-sib
Chinese Cynodon accessions for most traits. Magnitudes of genetic variance for all traits
in the clonal accessions was higher than that ofhalf-sib families. Traits indicated as
having moderate to high levels of genetic variation as indicated by genetic variance
components should respond to selection using traditional breeding methods. Those
characters having moderate to high narrow sense heritability values should be improved
using classical phenotypic recurrent selection procedures, while characters with low
heritability could be improved by traditional breeding procedures with progeny testings.
Seven phenotypic clusters were formed among the Chinese Cynodon accessions.
Tetraploid and pentaploid cytotype accessions contained the largest and smallest amounts
ofphenotypic variation, respectively. A core sub-collection of 47 accessions was selected
from each Chinese Cynodon cluster based on the diversity of ploidy levels and
geographic origins.
146
REFERENCES
Abulaiti, D.S. Shi, G. Yang, Reheman, and Kamili. 1998. Preliminary research report on
the native Cynodon dactylon in Xinjiang. J.Xinjiang Agric. Univ. 21:124-127.
Anonymous.1990. Chinese Floral Acta. Science Press, Beijing. 10:82-85. (in Chinese)
Beard, J.B. 1973. Turfgrass Science and Culture. Prentice-Hall, NJ, USA.
Burton, G.W. 1993. A history of turf research at Tifton. USGA Green Section Record.
29:12-14.
Casler, M.D. 2001. Patterns of variation in a collection of timothy accessions. Crop Sci.
41 :1616-1624.
Coffey, B.N., and A.A. Baltensperger. 1989. Heritability estimates for selected turfgrass
characteristics ofbermudagrass evaluated under shade. Pl 17-119. In H. Takatoh
(ed.). Proc. Int. Turfgrass Res. Conf., 6th, 31 July-5 Aug. 1989. Tokyo, Japan. Intl.
Turfgrass Soc. and Japan Soc. Turfgrass Sci. Tokyo.
Harlan, J.R., and J.M.J. de Wet. 1969. Source of variation in Cynodon dactylon (L.) Pers.
Crop Sci. 9:774-778.
Harlan, J.R. 1970. Cynodon species and their value for grazing or hay. Herbage Abs.
40:233-238.
Harlan, J.R., and J.M.J. de Wet, and K.M. Rawal. 1970. Geographic distribution of the
species of Cynodon L.C. Rich (Gramineae). East Afric. Agric. For. J. 36:220-
226.
Juska, F.V., and A.A. Hanson. 1964. Evaluation ofbermudagrass varieties for general
purpose turf. U.S.D.A. Agric. Res. Ser. Agric. Handbook No. 270. U.S. Gov.
Print. Office, Washington.
147
Mohammadi, S.A., and B.M. prasanna. 2003. Analysis of genetic diversity in crop
plants-salient statistical tools and considerations. Crop Sci. 43:1235-1248.
SAS Institute. 1999. SAS Proprietary Software Version 8.0 SAS Inst., Cary, NC.
Taliaferro, C.M. 1995. Diversity and vulnerability of Bermuda Turfgrass species.
Crop Sci. 35:327-332,
Taliaferro, C.M. 2003. Bermudagrass (Cynodon (L.) Rich). P.235-256. In M.D.
Casler and R. Duncan (ed.) Turfgrass Biology, Genetics, and Breeding. Sleeping
Bear Press.
Wofford, D.S., and A.A. Baltensperger. 1985. Heritability estimates for turfgrass
characteristics in bermudagrass. Crop Sci. 25:133-136.
148
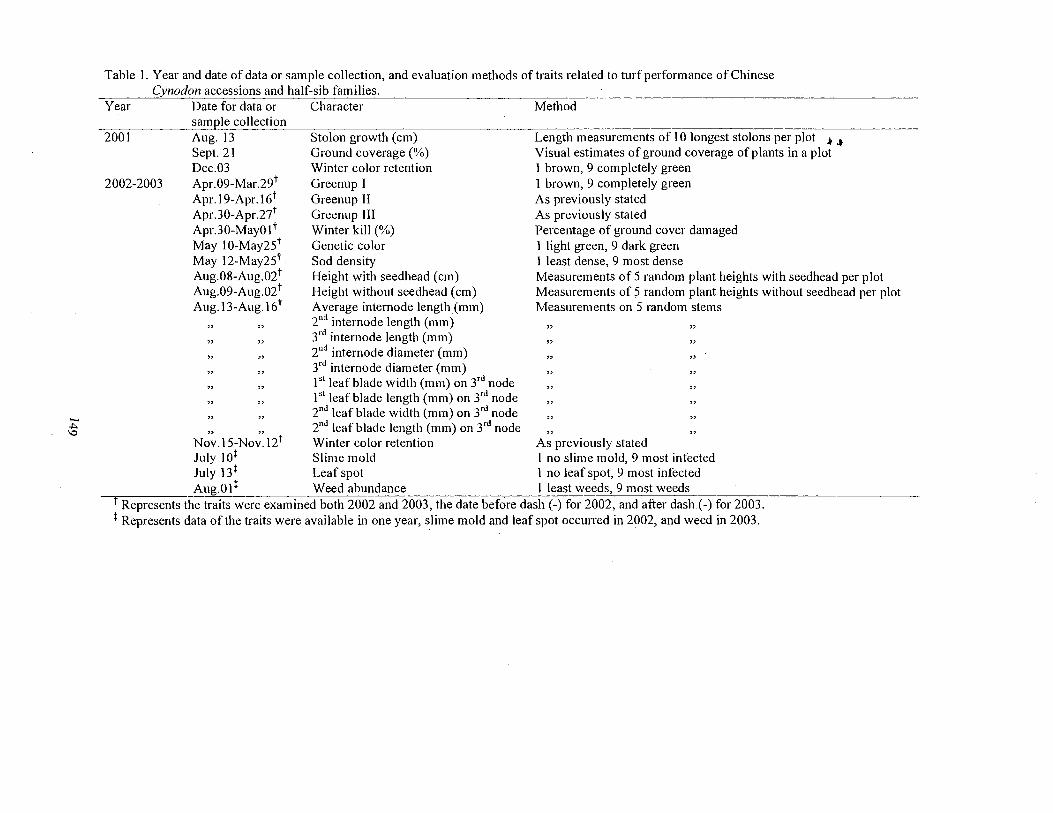
-.J;,.. \Q
Table 1. Year and date of data or sample collection, and evaluation methods of traits related to turf performance of Chinese C)l_nodon accessions and half-sib families.
Year Date for data or Character Method
2001
2002-2003
samE_le collection Aug. 13 Sept. 21 Dec.03 Apr.09-Mar.29t Apr. l 9-Apr. l 6t Apr.30-Apr.27t Apr.30-MayO 1 t May lO-May2st May 12-May25t Aug.08-Aug.02t Aug.09-Aug.02t Aug.13-Aug.16t
Stolon growth (cm) Ground coverage(%) Winter color retention Greenup I Greenup II Greenup III Winter kill (%) Genetic color Sod density Height with seedhead (cm) Height without seedhead (cm) Average internode length (mm) 211d internode length (mm) 3rd internode length (mm) 2nd internode diameter (mm) 3rd internode diameter (mm) 1" leaf blade width (mm) on 3rd node 1st leaf blade length (mm) on 3rd node 2nd leaf blade width (mm) on 3rd node
,, ,, 2"d leaf blade length (mm) on 3rd node
Length measurements of 10 longest stolons per plot -t ,.. Visual estimates of ground coverage of plants in a plot l brown, 9 completely green 1 brown, 9 completely green As previously stated As previously stated Percentage of ground cover damaged 1 light green, 9 dark green 1 least dense, 9 most dense Measurements of 5 random plant heights with seedhead per plot Measurements of 5 random plant heights without seedhead per plot Measurements on 5 random stems
Nov. l 5-Nov.12t Winter color retention As previously stated July 10t Slime mold I no slime mold, 9 most infected July 13 t Leaf spot 1 no leaf spot, 9 most infected Aug.Olt Weed abundance I least weeds, 9 most weeds
f Represents the traits were examined both 2002 and 2003, the date before dash(-) for 2002, and after dash(-) for 2003. t Represents data of the traits were available in one year, slime mold and leaf spot occun-ed in 2002, and weed in 2003.
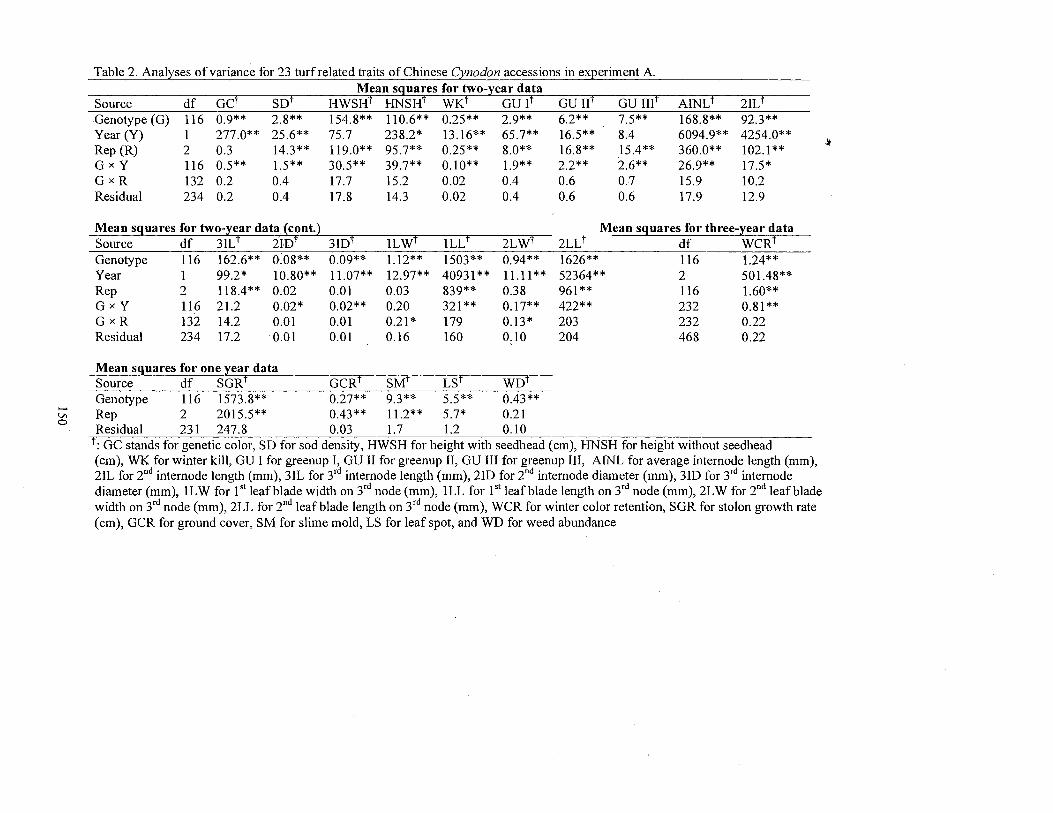
...... V, 0
Table 2. Analyses of variance for 23 turf related traits of Chinese Cynodon accessions in experiment A. Mean sguares for two-year data
Source df Ger SDT HWSH'f HNSH'f WK'f GU 1f GU ur GU rnf AINLf 2ILf Genotype (G) 116 0.9** 2.8** 154.8** 110.6** 0.25** 2.9** 6.2** 7.5** 168.8** 92.3** Year (Y) 1 277.0** 25.6** 75.7 238.2* 13.16** 65.7** 16.5** 8.4 6094.9** 4254.0** Rep (R) 2 0.3 14.3** 119.0** 95.7** 0.25** 8.0** 16.8** 15.4** 360.0** 102.1 ** GxY 116 0.5** 1.5** 30.5** 39.7** 0.10** 1.9** 2.2** 2.6** 26.9** 17.5* GxR 132 0.2 0.4 17.7 15.2 0.02 0.4 0.6 0.7 15.9 10.2 Residual 234 0.2 0.4 17.8 14.3 0.02 0.4 0.6 0.6 17.9 12.9
Mean sguares for two-year data (cont.) Mean sguares for three-year data Source df 3IL'f iID'f 3mr lLWf lLLf 2LW'f 2LLt df WCRT Genotype 116 162.6** 0:08** 0.09** 1.12** 1503** 0.94** 1626** 116 1.24** Year 1 99.2* 10.80** 11.07** 12.97** 40931** 11.11** 52364** 2 501.48** Rep 2 118.4** 0.02 0.01 0.03 839** 0.38 961** 116 1.60** GxY 116 21.2 0.02* 0.02** 0.20 321** 0.17** 422** 232 0.81 ** GxR 132 14.2 0.01 0.01 0.21 * 179 0.13* 203 232 0.22 Residual 234 17.2 0.01 0.01 0.16 160 0)0 204 468 0.22
Mean sguares for one year data Source df SGR GCRT SJ\-11" LSr WDt Genotype 116 1573.8** 0.27** 9.3** 5.5** 0.43** Rep 2 2015.5** 0.43** 11.2** 5.7* 0.21 Residual 231 247.8 0.03 1.7 1.2 0.10
t: GC stands for genetic color, SD for sod density, HWSH for height with seedhead (cm), HNSH for height without seedhead (cm), WK for winter kill, GU I for greenup I, GU II for greenup II, GU III for greenup III, AINL for average internode length (mm), 2IL for 2nd internode length (mm), 3IL for 3rd internode length (mm), 21D for 2nd internode diameter (mm), 31D for 3rd internode diameter (mm), IL W for 1st leaf blade width on 3rd node (mm), ILL for 1st leaf blade length on 3rd node (mm), 2L W for 2nd leaf blade width on 3rd node (mm), 2LL for 2nd leaf blade length on 3rd node (mm), WCR for winter color retention, SGR for stolon growth rate ( cm), GCR for ground cover, SM for slime mold, LS for leaf spot, and WD for weed abundance
'
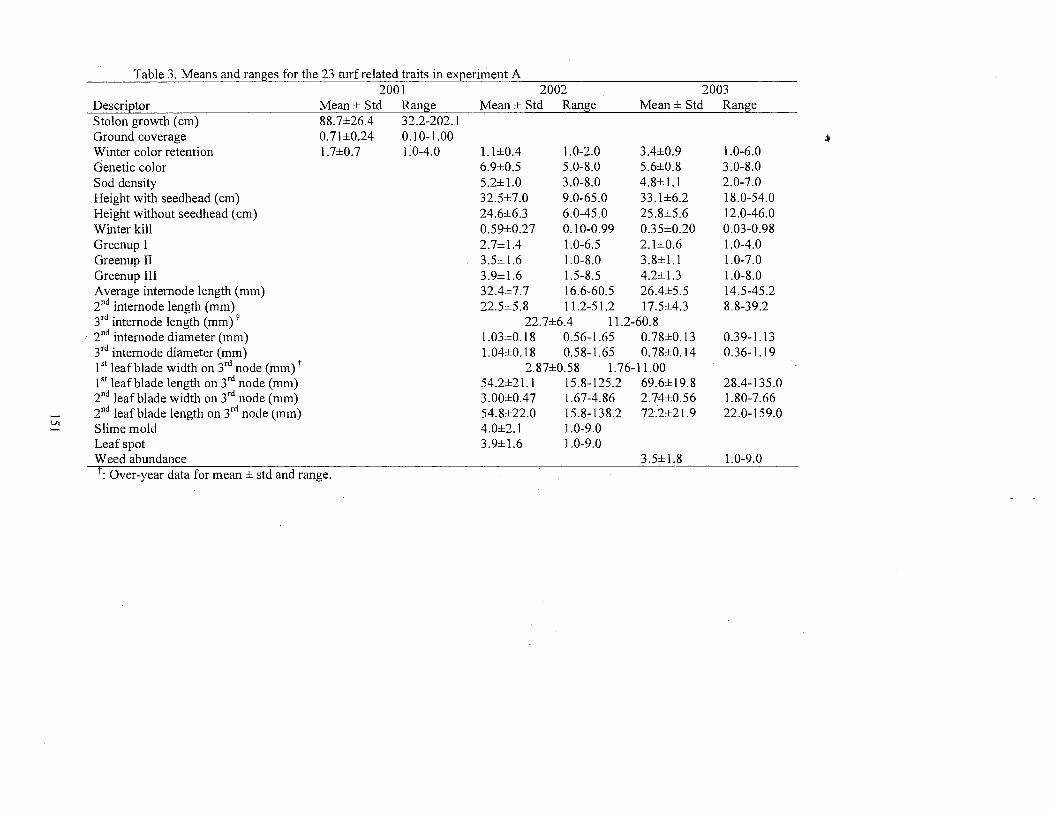
-V,
Table 3. Means and ranges for the 23 turfrelated traits in experiment A 2001 2002 2003
Descriptor Mean ± Std Range Mean ± Std Range Mean ± Std Range Stolon growth (cm) 88.7±26.4 32.2-202.1 Ground coverage 0.71±0.24 0.10-1.00 Winter color retention 1.7±0.7 L0-4.0 Genetic color Sod density Height with seedhead (cm) Height without seedhead (cm) Winter kill Greenup I Greenup II Greenup III Average internode length (mm) 2nd intemode length (mm) 3rd intemode length (mm) t
, 2nd intemode diameter (mm) 3rd internode diameter (mm) 1st leaf blade width on 3rd node (mm) t 1"1 leaf blade length on 3rd node (mm) 2nd leaf blade width on 3rd node (mm) 2nd leaf blade length on 3rd node (mm) Slime mold Leaf spot Weed abundance t: Over-year data for mean ± std and range.
1.1±0.4 1.0-2.0 3.4±0.9 6.9±0.5 5.0-8.0 5.6±0.8 5.2±1.0 3.0-8.0 4.8±1.1 32.5±7.0 9.0-65.0 33.1±6.2 24.6±6.3 6.0-45.0 25.8±5.6 0.59±0.27 0.10-0.99 0.35±0.20 2. 7± 1.4 1.0-6.5 2.1±0.6 3.5±1.6 1.0-8.0 3.8±1.1 3.9± 1.6 1.5-8.5 4.2± 1.3 32.4±7.7 16.6-60.5 26.4±5.5 22.5±5.8 11.2-51.2 17.5±4.3
22.7±6.4 11.2-60.8 1.03±0.18 0.56-1.65 0. 78±0.13 1.04±0.18 0.58-1.65 0.78±0.14
2.87±0.58 1.76-11.00 54.2±21.1 15.8-125.2 69.6±19.8 3.00±0.47 1.67-4.86 2.74±0.56 54.8±22.0 15.8-138.2 72.2±21.9 4.0±2. l 1.0-9.0 3.9±1.6 1.0-9.0
3.5±1.8
1.0-6.0 3.0-8.0 2.0-7.0 18.0-54.0 12.0-46.0 0.03-0.98 1.0-4.0 1.0-7.0 1.0-8.0 14.5-45.2 8.8-39.2
0.39-1.13 0.36-1.19
28.4-135.0 1.80-7.66 22.0-159.0
1.0-9.0
..
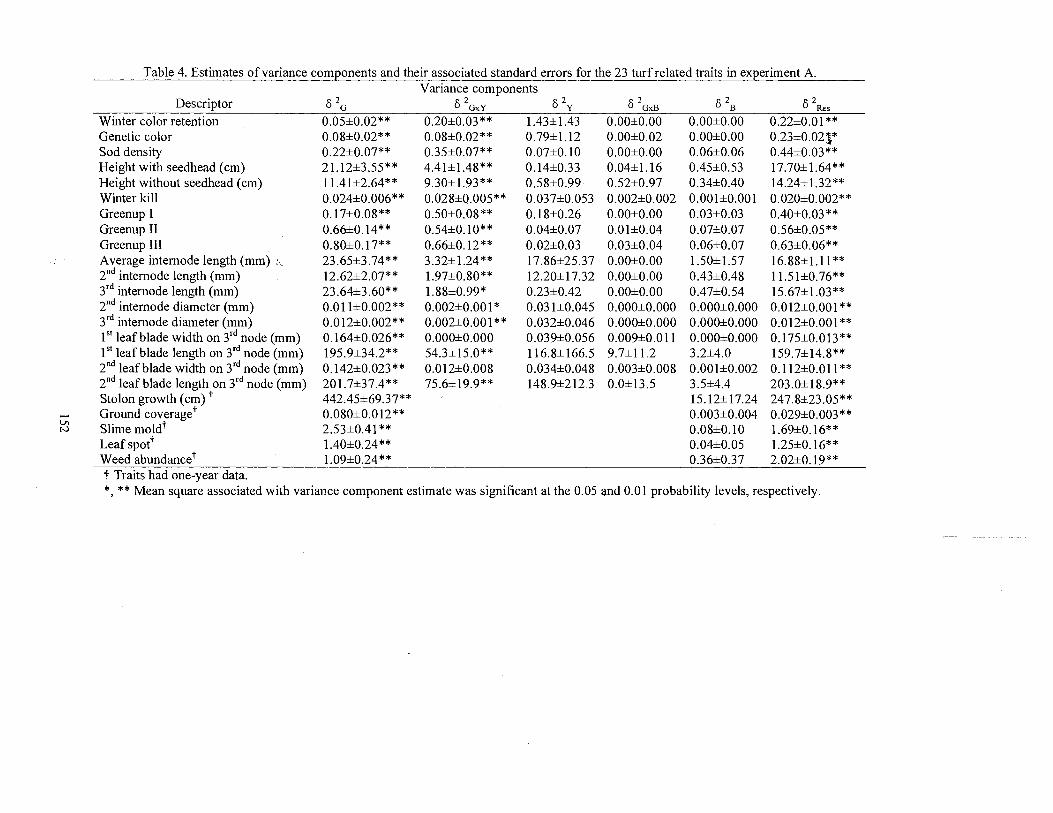
Table 4. Estimates of variance com2onents and their associated standard errors for the 23 turfrelated traits in ex2eriment A. Variance components
Descriptor 0 2 G O 2GxY 0 2y O 2GxB
0 2 B O \es
Winter color retention 0.05±0.02** 0.20±0.03 ** 1.43±1.43 0.00±0.00 0.00±0.00 0.22±0.01 ** Genetic color 0.08±0.02** 0.08±0.02** 0.79±1.12 0.00±0.02 0.00±0.00 0.23±0.02)* Sod density 0.22±0.07** 0.35±0.07** 0.07±0.10 0.00±0.00 0.06±0.06 0.44±0.03** Height with seedhead (cm) 21.12±3.55** 4.41±1.48** 0.14±0.33 0.04±1.16 0.45±0.53 17.70±1.64** Height without seedhead (cm) 11.41±2.64** 9.30±1.93** 0.58±0.99 0.52±0.97 0.34±0.40 14.24±1.32** Winter kill 0.024±0.006** 0.028±0.005** 0.037±0.053 0.002±0.002 0.001±0.001 0.020±0.002** Greenup I 0.17±0.08** 0.50±0.08 ** 0.18±0.26 0.00±0.00 0.03±0.03 0.40±0.03** Greenup II 0.66±0.14** 0.54±0.10** 0.04±0.07 0.01±0.04 0.07±0.07 0.56±0.05** Greenup III 0.80±0.17** 0.66±0.12** 0.02±0.03 0.03±0.04 0.06±0.07 0.63±0.06** Average intemode length (mm) · 23.65±3.74** 3.32±1.24** 17.86±25.37 0.00±0.00 1.50±1.57 16.88±1.11 ** 2nd intemode length (mm) 12.62±2.07** 1.97±0.80** 12.20±17.32 0.00±0.00 0.43±0.48 11.51±0. 76** 3rd intemode length (mm) 23.64±3.60** 1.88±0.99* 0.23±0.42 0.00±0.00 0.47±0.54 15.67±1.03** 2nd internode diameter (mm) 0.011±0.002** 0.002±0.001 * 0.031±0.045 0.000±0.000 0.000±0.000 0.012±0.001 ** 3rd internode diameter (mm) 0.012±0.002** 0.002±0.001 ** 0.032±0.046 0.000±0.000 0.000±0.000 0.012±0.001 ** 1st leaf blade width on 3rd node (mm) 0.164±0.026** 0.000±0.000 0.039±0.056 0.009±0.011 0.000±0.000 0.175±0.013** 1st leaf blade length on 3rd node (mm) 195.9±34.2** 54.3±15.0** 116.8±166.5 9.7±11.2 3.2±4.0 159.7±14.8** 2nd leaf blade width on 3rd node (mm) 0.142±0.023** 0.012±0.008 0.034±0.048 0.003±0.008 0.001±0.002 0.112±0.011 ** 2nd leaf blade length on 3rd node (mm) 201.7±37.4** 75.6±19.9** 148.9±212.3 0.0±13.5 3.5±4.4 203.0±18.9** Stolon growth (cm) t 442.45±69.37** 15.12±17.24 247.8±23.05**
...... Ground coverage t 0.080±0.012** 0.003±0.004 0.029±0.003** V,
Slime moldt 2.53±0.41 ** 0.08±0.10 1.69±0.16** N
Leaf spott 1.40±0.24** 0.04±0.05 1.25±0.16** Weed abundancet 1.09±0.24** 0.36±0.37 2.02±0.19** t Traits had one-year data. *,**Mean square associated with variance component estimate was significant at the 0.05 and 0.01 probability levels, respectively.
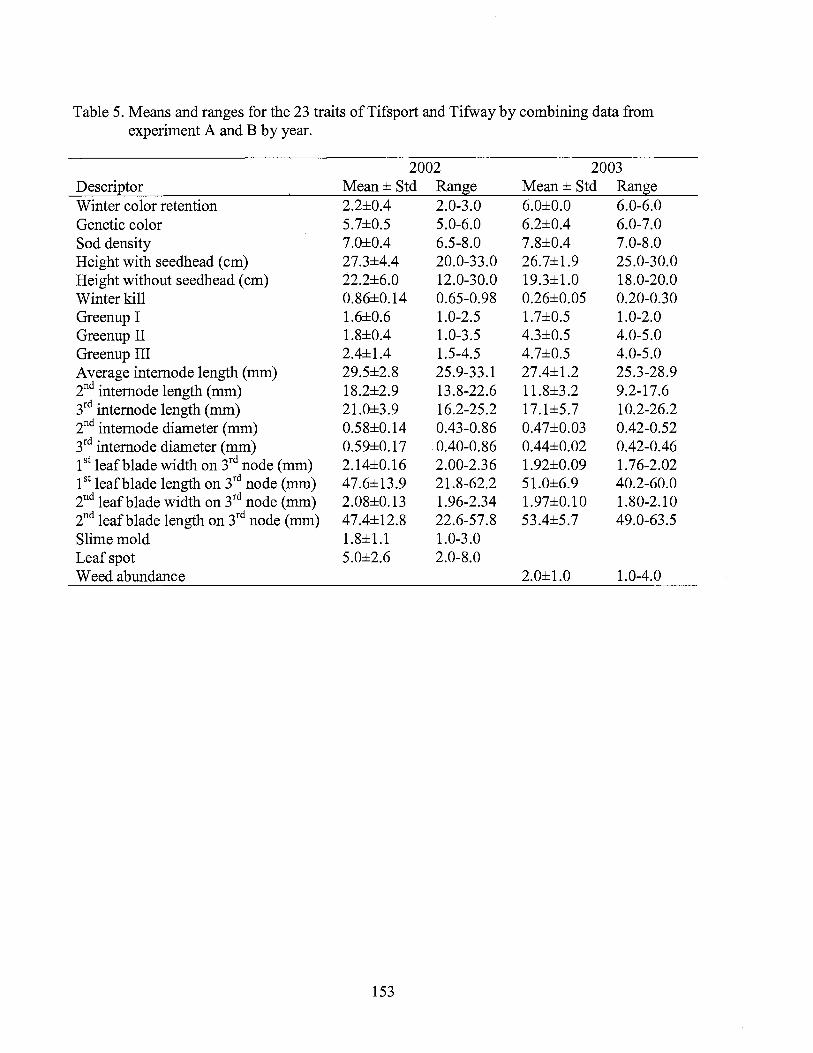
Table 5. Means and ranges for the 23 traits ofTifsport and Tifwayby combining data from experiment A and B by year.
2002 2003 Descriptor Mean± Std Range Mean± Std Range Winter color retention 2.2±0.4 2.0-3.0 6.0±0.0 6.0-6.0 Genetic color 5.7±0.5 5.0-6.0 6.2±0.4 6.0-7.0 Sod density 7.0±0.4 6.5-8.0 7.8±0.4 7.0-8.0 Height with seedhead ( cm) 27.3±4.4 20.0-33.0 26.7±1.9 25.0-30.0 Height without seedhead ( cm) 22.2±6.0 12.0-30.0 19.3±1.0 18.0-20.0 Winter kill 0.86±0.14 0.65-0.98 0.26±0.05 0.20-0.30 Greenup I 1.6±0.6 1.0-2.5 1.7±0.5 1.0-2.0 Greenup II 1.8±0.4 1.0-3.5 4.3±0.5 4.0-5.0 Greenup III 2.4±1.4 1.5-4.5 4.7±0.5 4.0-5.0 Average intemode length (mm) 29.5±2.8 25.9-33.1 27.4±1.2 25.3-28.9 2nd intemode length (mm) 18.2±2.9 13.8-22.6 11.8±3.2 9.2-17.6 3rd intemode length (mm) 21.0±3.9 16.2-25.2 17.1±5.7 10.2-26.2 2nd intemode diameter (mm) 0.58±0.14 0.43-0.86 0.47±0.03 0.42-0.52 3rd intemode diameter (mm) 0.59±0.17 0.40-0.86 0.44±0.02 0.42-0.46 1st leaf blade width on 3rd node (mm) 2.14±0.16 2.00-2.36 1.92±0.09 1.76-2.02 1st leaf blade length on 3rd node (mm) 47.6±13.9 21.8-62.2 51.0±6.9 40.2-60.0 2nd leaf blade width on 3rd node (mm) 2.08±0.13 1.96-2.34 1.97±0.10 1.80-2.10 2nd leaf blade length on 3rd node (mm) 47.4±12.8 22.6-57.8 53.4±5.7 49.0-63.5 Slime mold 1.8±1.1 1.0-3.0 Leaf spot 5.0±2.6 2.0-8.0 Weed abundance 2.0±1.0 1.0-4.0
153
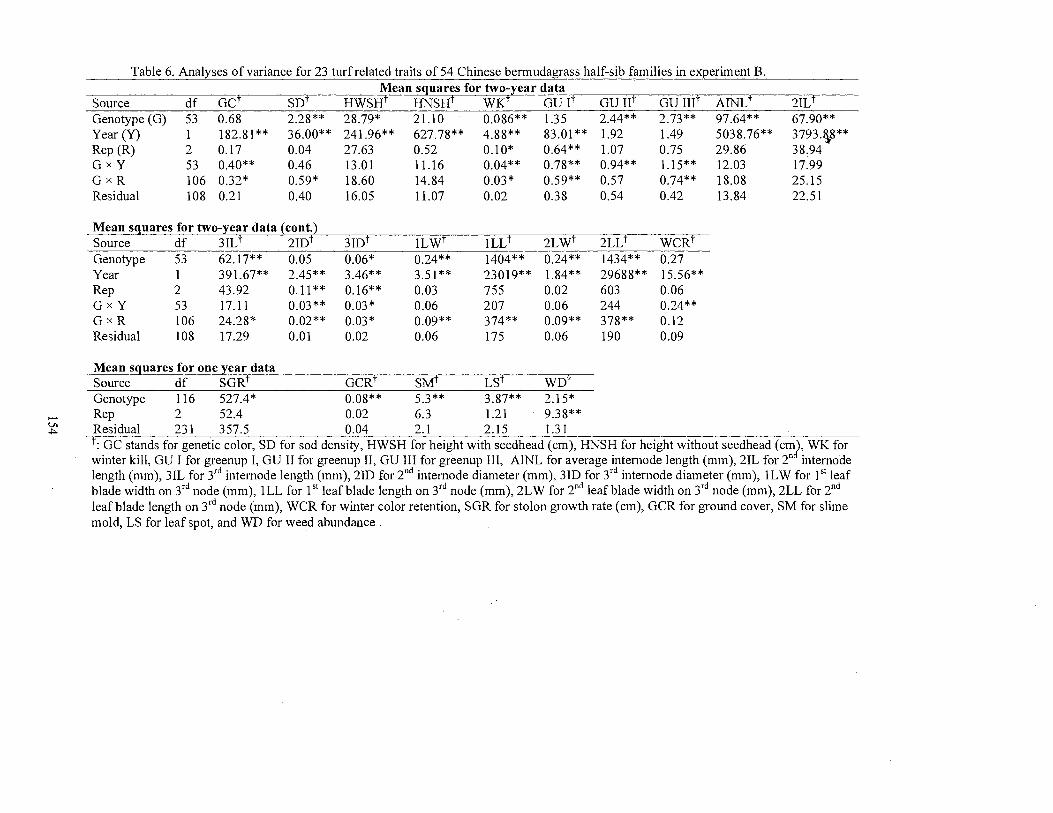
-u, .i,..
Table 6. Analyses of variance for 23 turf related traits of 54 Chinese bermudagrass half-sib families in exQeriment B. Mean sguares for two-year data
Source df Gcf snf HWSHf HNSHf WKf GU If GU nf GU rnf AINLf 21Lf Genotype (G) 53 0.68 2.28** 28.79* 21.10 0.086** 1.35 2.44** 2.73** 97.64** 67.90** Year (Y) 1 182.81** 36.00** 241.96** 627.78** 4.88** 83.01 ** 1.92 1.49 5038.76** 3793.\8** Rep (R) 2 0.17 0.04 27.63 0.52 0.10* 0.64** 1.07 0.75 29.86 38.94 GxY 53 0.40** 0.46 13.01 11.16 0.04** 0.78** 0.94** 1.15** 12.03 17.99 GxR 106 0.32* 0.59* 18.60 14.84 0.03* 0.59** 0.57 0.74** 18.08 25.15 Residual 108 0.21 0.40 16.05 11.07 0.02 0.38 0.54 0.42 13.84 22.51
Mean sguares for two-year data (cont.) Source df 3ILf 2rnf 3rnr lLWf lLLf 2LWf 2LLf wcRr Genotype 53 62.17** 0.05 0.06* 0.24** 1404** 0.24** 1434** 0.27 Year 1 391.67** 2.45** 3.46** 3.51** 23019** 1.84** 29688** 15.56** Rep 2 43.92 0.11 ** 0.16** 0.03 755 0.02 603 0.06 GxY 53 17.11 0.03** 0.03* 0.06 207 0.06 244 0.24** GxR 106 24.28* 0.02** 0.03* 0.09** 374** 0.09** 378** 0.12 Residual 108 17.29 0.01 0.02 0.06 175 0.06 190 0.09
Mean sguares for one year data Source df SGRt - - - - - - GCRf - - sMt ____ LS'- wnt
Genotype 116 527.4* 0.08** 5.3** 3.87** 2.15* Rep 2 52.4 0.02 6.3 1.21 9.38** Residual 231 357.5 0.04 2.1 2.15 1.31 t: GC stands for genetic color, SD for sod density, HWSH for height with seedhead (cm), HNSH for height without seedhead (cm), WK for winter kill, GU I for greenup I, GU II for greenup II, GU III for greenup III, AINL for average internode length (mm), 2IL for 2n internode length (mm), 3IL for 3rd intemode length (mm), 21D for 211d intemode diameter (mm), 31D for 3rd internode diameter (mm), ILW for 1st leaf blade width on 3rd node (mm), ILL for 1st leaf blade length on 3rd node (mm), 2LW for 2nd leaf blade width on 3rd node (mm), 2LL for 211d leaf blade length on 3rd node (mm), WCR for winter color retention, SGR for stolon growth rate (cm), GCR for ground cover, SM for slime mold, LS for leaf spot, and WD for weed abundance .
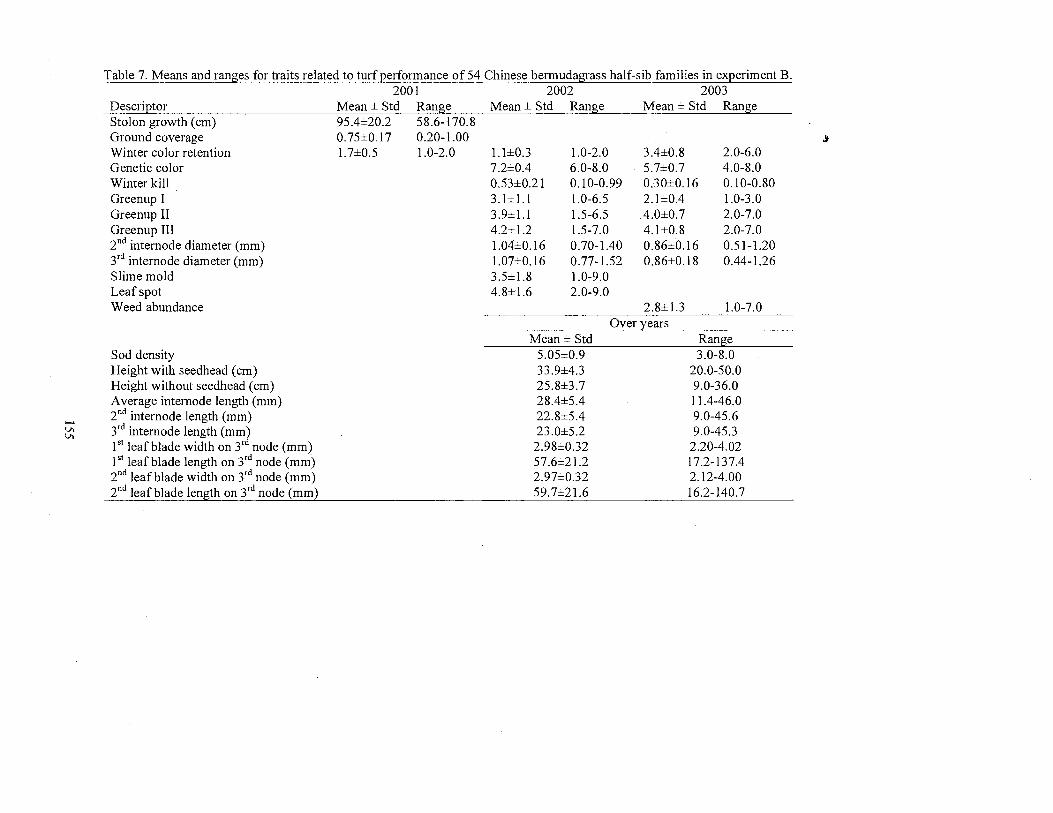
Table 7. Means and ranges for traits related to turf performance of 54 Chinese bermudagrass half-sib families in experiment B. 2001 2002 . 2003
Descriptor Mean± Std Range Mean± Std Range Mean± Std Range Stolon growth (cm) 95.4±20.2 58.6-170:8 Ground coverage 0.75±0.17 0.20-1.00 ,i
Winter color retention 1.7±0.5 1.0-2.0 1.1±0.3 1.0-2.0 3.4±0.8 2.0-6.0 Genetic color 7.2±0.4 6.0-8.0 5:7±0.7 4.0-8.0 Winter kill 0.53±0.21 0.10-0.99 0:30±0.16 0.10-0.80 Greenup I 3.1±1.1 1.0-6.5 2.1±0.4 1.0-3.0 Greenup II 3.9±1.1 1.5-6.5 4.0±0.7 2.0-7.0 Greenup III 4.2±1.2 1.5-7.0 4.1±0.8 2.0-7.0 2nd intemode diameter (mm) 1.04±0.16 0.70-1.40 0.86±0.16 0.51-1.20 3rd intemode diameter (mm) 1.07±0.16 0.77-1.52 0.86±0.18 0.44-1.26 Slime mold 3.5±1.8 1.0-9.0 Leaf spot 4.8±1.6 2.0-9.0 Weed abundance 2.8±1.3 1.0-7.0
Over years Mean± Std Range
Sod density 5.05±0.9 3.0-8.0 Height with seedhead (cm) 33.9±4.3 20.0-50.0 Height without seedhead (cm) 25.8±3.7 9.0-36.0 Average intemode length (mm) 28.4±5.4 11.4-46.0
..... 2nd intemode length (mm) 22.8±5.4 9.0-45.6 VI 3rd intemode length (mm) 23.0±5.2 9.0-45.3 VI
1st leaf blade width on 3rd node (mm) 2.98±0.32 2.20-4.02 1st leaf blade length on 3rd node ( mm) 57.6±21.2 17.2-137.4 2nd leaf blade width on 3rd node (mm) 2.97±0.32 2.12-4.00 2nd leaf blade length on 3rd node (mm) 59.7±21.6 16.2-140.7
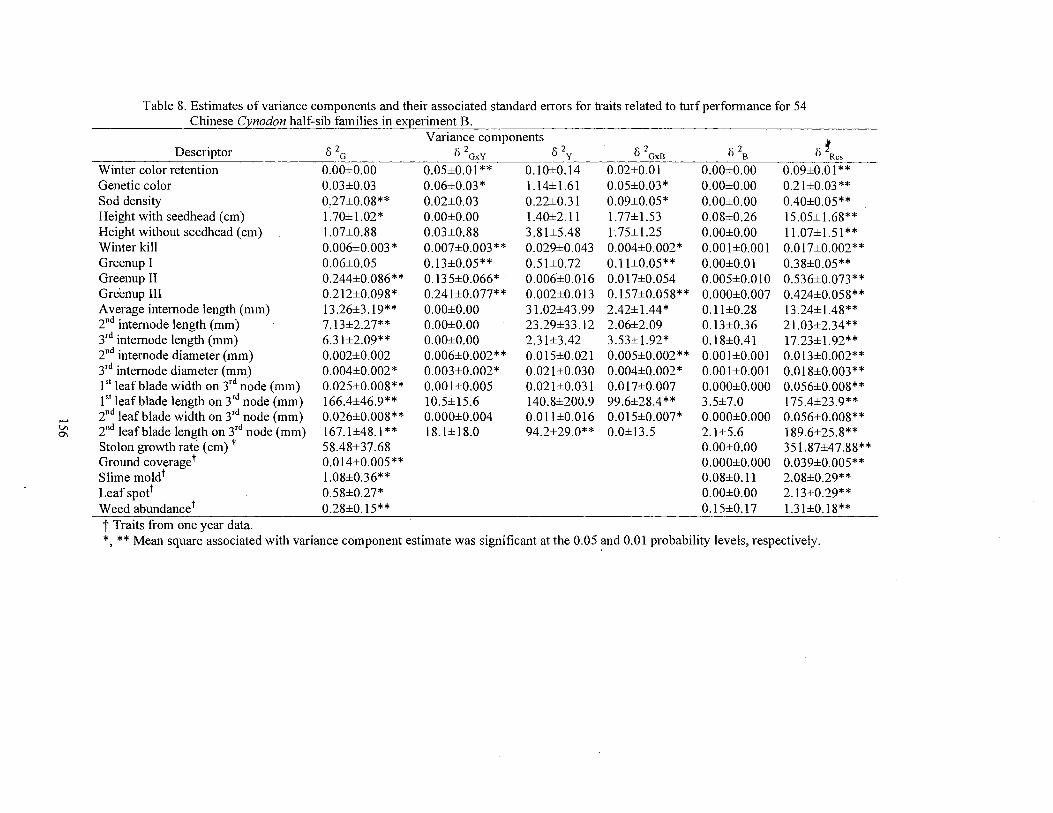
Table 8. Estimates of variance components and their associated standard errors for traits related to turf performance for 54 Chinese Cynodon half-sib families in ex12eriment B.
Variance components ! Descriptor 0 2 O 2GxY
0 2 O 2GxB 0 2 O Res G y B
Winter color retention 0.00±0.00 0.05±0.01 ** 0.10±0.14 0.02±0.01 0.00±0.00 0.09±0.01 ** Genetic color 0.03±0.03 0.06±0.03* 1.14±1.61 0.05±0.03* 0.00±0.00 0.21±0.03** Sod density 0.27±0.08** 0.02±0.03 0.22±0.31 0.09±0.05* 0.00±0.00 0.40±0.05** Height with seedhead (cm) 1.70±1.02* 0.00±0.00 1.40±2.11 1.77±1.53 0.08±0.26 15.05±1.68** Height without seedhead (cm) 1.07±0.88 0.03±0.88 3.81±5.48 1.75±1.25 0.00±0.00 11.07±1.51 ** Winter kill 0.006±0.003* 0.007±0.003** 0.029±0.043 0.004±0.002* 0.001±0.001 0.017±0.002** Greenup I 0.06±0.05 0.13±0.05** 0.51±0.72 0.11±0.05** 0.00±0.01 0.38±0.05** Greenup II 0.244±0.086** 0.135±0.066* 0.006±0.016 0.017±0.054 0.005±0.010 0.536±0.073** Greenup III 0.212±0.098* 0.241±0.077** 0.002±0.013 0.157±0.058** 0.000±0.007 0.424±0.058** Average intemode length (mm) 13.26±3.19** 0.00±0.00 31.02±43.99 2.42±1.44* 0.11±0.28 13.24±1.48** 2nd intemode length (mm) 7.13±2.27** 0.00±0.00 23.29±33.12 2.06±2.09 0.13±0.36 21.03±2.34** 3rd intemode length (mm) 6.31±2.09** 0.00±0.00 2.31±3.42 3.53±1.92* 0.18±0.41 17.23±1.92** 2nd intemode diameter (mm) 0.002±0.002 0.006±0.002** 0.015±0.021 0.005±0.002** 0.001±0.001 0.013±0.002** 3rd intemode diameter (mm) 0.004±0.002* 0.003±0.002* 0.021±0.030 0.004±0.002* 0.001±0.001 0.018±0.003** 1st leaf blade width on 3rd node (mm) 0.025±0.008** 0.001±0.005 0.021±0.031 0.017±0.007 0.000±0.000 0.056±0.008** 1st leaf blade length on 3rd node (mm) 166.4±46.9** 10.5±15.6 140.8±200.9 99.6±28.4** 3.5±7.0 175.4±23.9**
..... 2nd leaf blade width on 3rd node (mm) 0.026±0.008** 0.000±0.004 0.011±0.016 0.015±0.007* 0.000±0.000 0.056±0.008** V. 2"d leaf blade length on 3rd node (mm) 167.1±48.1 ** 18.1±18.0 94.2±29.0** 0.0±13.5 2.1±5.6 189.6±25.8** 0\
Stolon growth rate (cm) t 58.48±37.68 0.00±0.00 351.87±47.88** Ground coverage t 0.014±0.005** 0.000±0.000 0.039±0.005** Slime moldt 1.08±0.36** 0.08±0.11 2.08±0.29** Leaf spott 0.58±0.27* 0.00±0.00 2.13±0.29** Weed abundancet 0.28±0.15** 0.15±0.17 1.31±0.18** t Traits from one year data. *, ** Mean square associated with variance component estimate was significant at the 0.05 and 0.01 probability levels, respectively.
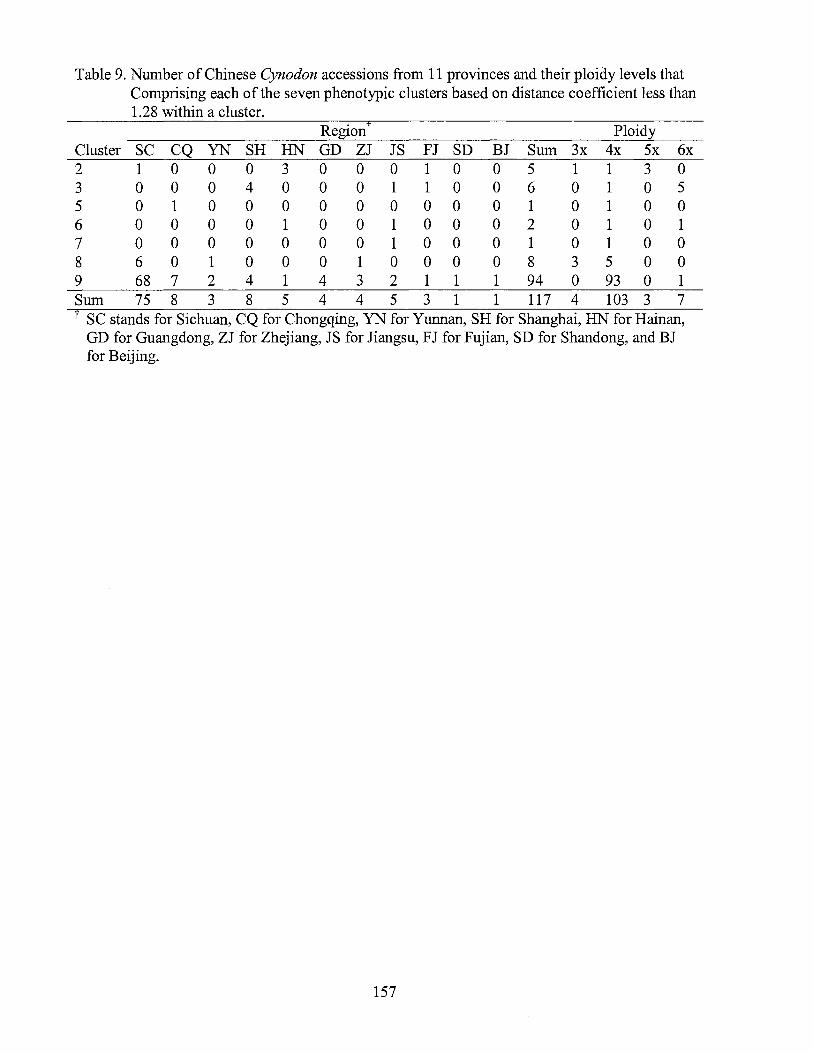
Table 9. Number of Chinese Cynodon accessions from 11 provinces and their ploidy levels that Comprising each of the seven phenotypic clusters based on distance coefficient less than 1.28 within a cluster.
Region Ploidy Cluster SC CQ YN SH HN GD ZJ JS FJ SD BJ Sum 3x 4x 5x 6x 2 1 0 0 0 3 0 0 0 1 0 0 5 1 1 3 0 3 0 0 0 4 0 0 0 1 1 0 0 6 0 1 0 5 5 0 1 0 0 0 0 0 0 0 0 0 1 0 1 0 0 6 0 0 0 0 1 0 0 1 0 0 0 2 0 1 0 1 7 0 0 0 0 0 0 0 1 0 0 0 1 0 1 0 0 8 6 0 1 0 0 0 1 0 0 0 0 8 3 5 0 0 9 68 7 2 4 1 4 3 2 1 1 1 94 0 93 0 1 Sum 75 8 3 8 5 4 4 5 3 1 1 117 4 103 3 7 t SC stands for Sichuan, CQ for Chongqing, YN for Yunnan, SH for Shanghai, HN for Hainan,
GD for Guangdong, ZJ for Zhejiang, JS for Jiangsu, FJ for Fujian, SD for Shandong, and BJ for Beijing.
157
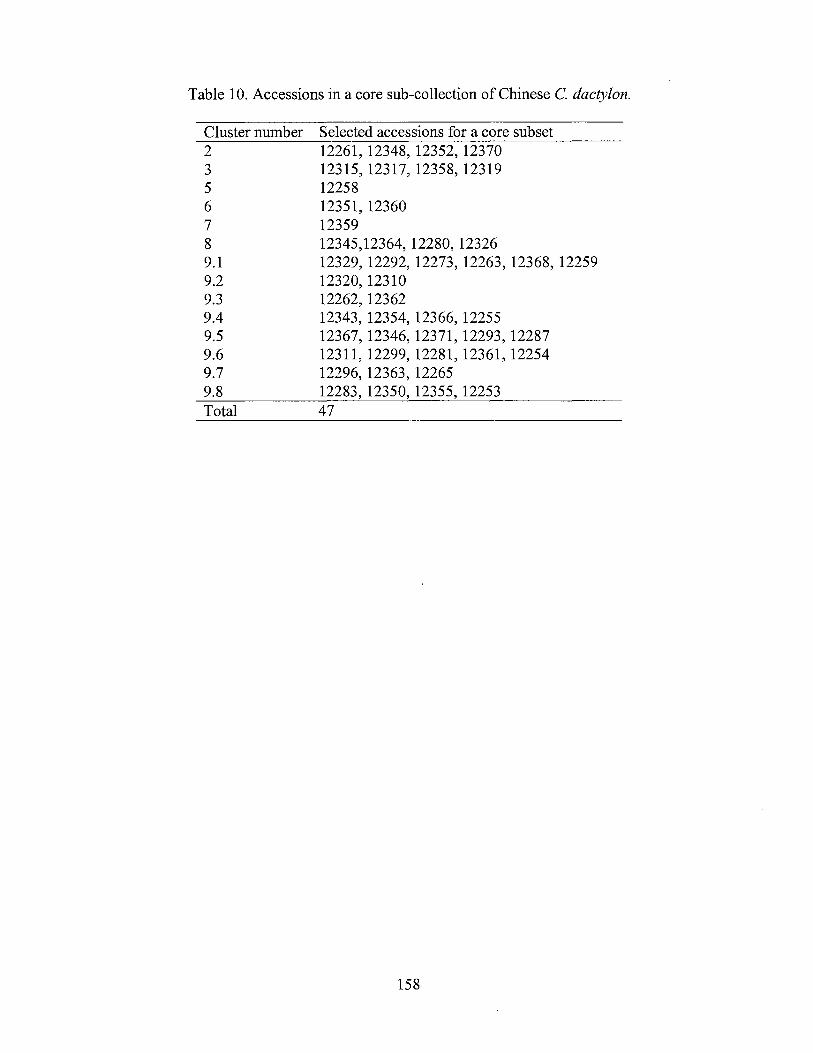
Table 10. Accessions in a core sub-collection of Chinese C. dactylon.
Cluster number 2 3 5 6 7 8 9.1 9.2 9.3 9.4 9.5 9.6 9.7 9.8 Total
Selected accessions for a core subset 12261, 12348, 12352, 12370 12315, 12317, 12358, 12319 12258 12351, 12360 12359 12345,12364, 12280, 12326 12329, 12292, 12273, 12263, 12368, 12259 12320, 12310 12262, 12362 12343, 12354, 12366, 12255 12367, 12346, 12371, 12293, 12287 12311, 12299, 12281, 12361, 12254 12296, 12363, 12265 12283, 12350, 12355, 12253 47
158
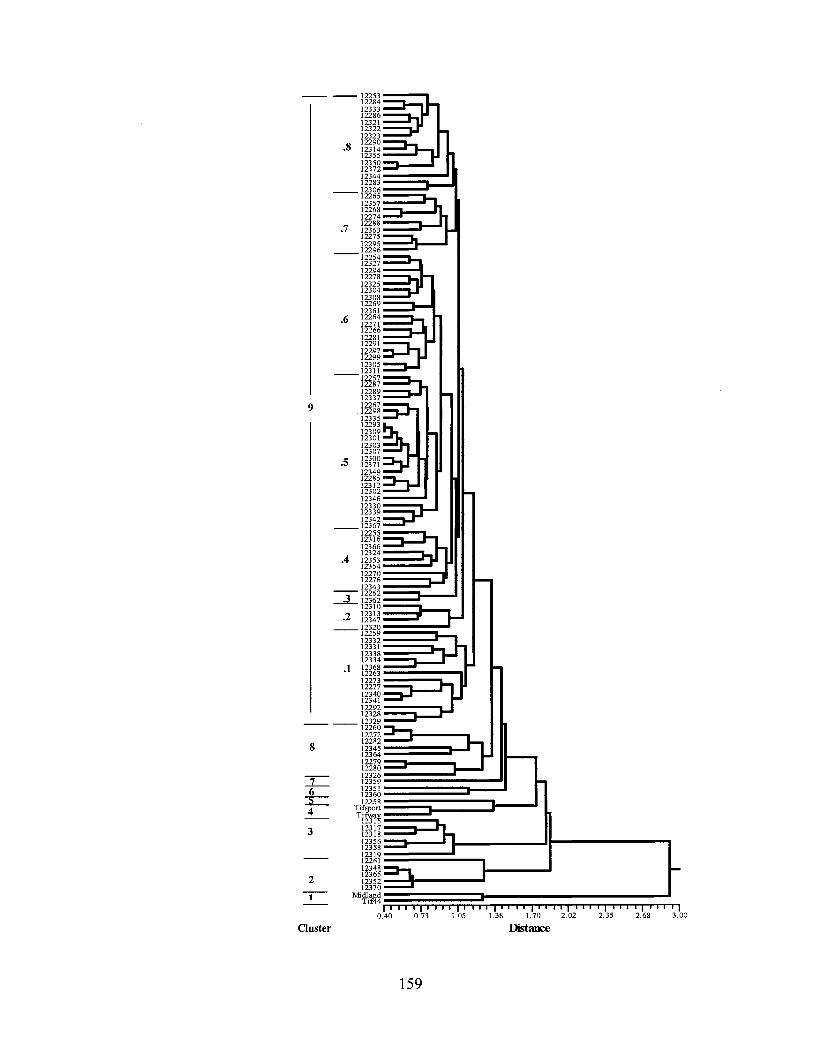
159
Fig. 1. A phenotypic dendrogram for the Chinese Cynodon accessions and four cul ti vars.
160
CHAPTER VIII
GENETIC CHARACTERIZATION OF CHINESE CYNODON
ACCESSIONS BY FIELD EXPERIMENTATIONS:
III. Genetic Variability in Biomass and Trait Relationships
ABSTRACT
Cynodon dactylon is enormously variable and extremely valuable as a forage
grass. The taxon is indigenous to and widely distributed from tropical through temperate
regions in China. There is no information in the literature on genetic variability for
biomass yield in the Chinese C. dactylon germplasm. Accordingly, two field experiments
were each conducted over 2 years (2002 and 2003) to: 1) characterize the genetic
variability for biomass yield in 117 clonal Chinese Cynodon accessions (Experiment A)
and half-sib families of 54 of the clonal accessions (Experiment B), and 2) characterize
the relationships among biomass yield and selected morphological and adaptive
characters. A randomized complete block design with three replications was used for
both experiments. Differences in biomass yield among the 117 clonal accessions were
highly significant (P<0.01). Yield differences among half.:-sib families were significant at
P=O. l 0. All quantitatively measured morphological traits were significantly and
positively correlated. For traits measured by visual rating, winter kill was positively
161
correlated with weed prolificacy, but negatively with spring green up. Stepwise selection
ofregression analyses and path coefficient analyses indicated selection for plant height
and adaptive capability in bermudagrass should be the best potential indirect selection
traits for increased forage yield.
162
INTRODUCTION
Cynodon dactylon is enormously variable and extremely valuable as a forage
grass for grazing and hay production (Harlan, 1970a). It is widely distributed over all
continents and islands between 45° S and 45°N latitudes, where climatic conditions
support its survival (Harlan et al., 1970b). Variety dactylon, is the cosmopolitan and
ubiquitous taxon, and provides the most important forage resources in the species
(Harlan, 1970a).
There is enormous genetic variability available in bermudagrass (Kneebone,
1973). The variability within C. dactylon var. dactylon is thought to have resulted from
its interaction with two taxonomic varieties, C. dactylon var. aridus and var. afghanicus
(Harlan and de Wet, 1969). Burton (1947) reported data from extensive evaluations of
hay yield, sod density, head abundance, frost resistance, disease resistance, vigor, color,
percentage weeds, and percentage cover on 147 selections of 5,000 plants derived from
intercrosses of three clonal plants identified as 'Tift' and two tall-growing bermudagrass
strains from South Africa. He found extensive variation among the 147 selected clonal
plants for all variables evaluated (Burton, 194 7). A positive correlation was observed
between hay yield in first three months post establishment with the total hay yield for 4
years, while there was no association between the total greenhouse yields and field yields
(Burton, 1947). In the same study, a correlation coefficient of 0.80 between first year hay
yield and the four-year total yield indicated the hay yields for the first year after
establishment should give an excellent index of later yield performance (Burton, 1947).
· De Silva (1991) reported significant amounts of genetic variation for shoot dry weight
163
among populations collected from five climatic zones ( dry, arid, intermediate, wet and
hill country) in Sri Lanka. Avis et al. (1980) reported significant genotype x environment
interactions in forage yield in bermudagrass indicating the necessity to use multiple
environment testing through time (years) and space (locations) to characterize relative
genotypic differences. Development of superior cultivars for livestock grazing and hay
production started in 1940's in the USA (Burton, 1947). Bermudagrass is grown on an
estimated 10 to 12 million hectares in the Southern USA for these purposes (Taliaferro et
al., 2004). However, only a tiny fraction of the total germplasm has been studied and
even less utilized (Harlan, 1970a).
Cynodon dactylon is indigenous to China and widely distributed from tropical
Hainan Island to northern temperate regions. This wide distribution probably suggests
large variation in Chinese native C. dactylon germplasm. However, genetic variability for
biomass yield in Chinese Cynodon germplasm has not been documented in the literature.
The objectives of the present study were to: 1) characterize genetic variability for
biomass yield among 120 clonal Cynodon dactylon var. dactylon accessions collected
from a wide geographic expanse in China and half-sib progenies from 56 of the clonal
accessions, and 2) to analyze the relationships among the biomass yield and a number of
morphological and agronomic traits of the Chinese Cynodon collections.
164
MATERIALS AND METHODS
The study included two field experiments as described in Chapter VI. Briefly,
120 Chinese clonal accessions and four commercial cultivars were included in
experiment A, while half-sib families from 56 of the 120 accessions were included in
experiment B. The field plot design for both experiments was a randomized complete
block with three replications. Experiments A and B were established June 5 and 8, 2001,
respectively, and fertility and cultural management was as described in Chapter VI.
Samples and data were collected using identical methods in both 2002 and 2003.
Biomass samples were harvested in every plot by hand clipping a 0.3 x 0.3 m2 area. The
biomass samples were dehydrated at 55°C (130 °F) in forced air ovens for 72 hr. The
biomass yield (ton ha-1) was calculated from the dried sample weight by multiplying a
coefficient of 0.1111. Stolon growth rate, height with seedhead, height without seedhead,
average intemode length, 2nd intemode length, 3rd intemode length, 2nd intemode
diameter, 3rd intemode diameter, 1st leaf blade width on 3rd node, 1st leaf blade length on
3rd node, 2nd leaf blade width on 3rd node, 2nd leaf blade length on 3rd node were measured
on five shoots samples from each plot, while first year coverage, spring greenup I, spring
greenup II, spring greenup III, winter kill, sod density, slime mold, leaf spot and weed
abundance were visually rated for each plot as described in Table 1 in Chapter VII.
Among the120 Chinese accessions, 56 half-sib families and four commercial
cultivars, three accessions and two half-sib families did not survive in at least one plot
over 2001-2002 winter. Accordingly, those entries were not included in the data analysis.
The PROC Mixed procedure of SAS (SAS Inst., 1999) was used for analysis of variance
(ANOV A) and to estimate variance components. Entries were considered as fixed effects,
165
while year and replication were considered as random effects. The PROC CORR
procedure was used to perform phenotypic correlation analyses. All analyses were done
on a plot mean basis. Path coefficient analyses were performed using standard methods
(Fig.1) (Dewey and Lu, 1959; Das et al., 2004), after stepwise selection procedures using
regression analysis.
166
RESULTS AND DISCUSSION
Variability of biomass yield
Dry biomass yield differences were significant (P<0.01) among the 117 clonal
accessions in experiment A, but did not differ significantly (P>0.05) among the 54 half
sib families in experiment B (Table 1 ). Effects of year and block for biomass yield were
significant (P<0.01) for both experiments. The genotype x year interaction for biomass
yield was significant in experiment A but not in experiment B. Mean dry biomass weight
for the Chinese accessions and 'Midland' and 'Tifton 44' and their relative ranks are
presented in Table 2. The different order of rankings among the accessions in experiment
A for the 2 years further confirmed the genotype x environment interaction. The mean
biomass yield (ton ha-1) for experiment A (Table 2) was 12.9±4.3, ranging from 4.9 to
23 .1 in 2002, while the mean in 2003 was 11. 8±3 .1, ranging from 7 .2 to 1 7.3. The mean
and standard deviation of biomass yields in experiment B over the two years was
12.4±3.4, ranging from 3.58 to 21.3. The biomass yields of Midland and Tifton 44 were
within the range of the Chinese Cynodon accessions for both years. Their intermediate
ranking within this range indicated that many of the higher yielding Chinese accessions
have potential for use in breeding higher yielding cultivars. Estimates of variance
components and associated standard errors for biomass yield for both experiments are
given in Table 3. The magnitude of o 2owas higher than o 2oxY, o \, o 2oxB and o 2B in
experiment A, but lower than o 2 y and o 2 oxB in experiment B. The results suggest
considerable genetic variability among the 117 accessions, but also indicated that the
magnitude of environment effects was large for both experiments. Avis et al. (1980)
found considerable genotype by environment (year and location) interactions in
167
bermudagrass multi-environment tests. The results of the present study strongly support
their conclusion that it is necessary to characterize relative genotypic differences in
multiple environment testing conducted through time and space (Avis et a., 1980).
Correlations among morphological, adaptive and agronomic traits
Correlation coefficients for 25 morphological, adaptive, and agronomic
characters in experiment A are presented in Table 4. Highly positive correlations were
found between the two plant heights (HWSH and HNSH), two leaf blade widths (L W I
and L W 11), two leaf blade lengths (LL I and LL II), two intemode diameters (2nd ID and
3rd ID), and among the three greenup variables (I, II and Ill) and three intemode lengths
(AIL, 2nd IL and 3rd IL). The results clearly indicate those characters were highly
uniform and stable in mature stands, and indicated the predictive capability of the
correlated traits, one for the other.
Stolon growth rate (vigor) had significantly positive correlations with first year
ground coverage, plant height, stem intemode length, intemode diameters, leaf blade
width, and leaf blade length, and weed prolificacy, but negative correlations with two
winter color retentions (WCR I and WCR 11) and leaf spot occurrence. The results
indicated that large plants grow faster, had better first year ground coverage, and had less
leaf spot (Bipolaris cynodontis) disease infection. The results also suggested that the
faster growing plants had poor winter color retention and more weed infestation. This
probably is because most of the faster growing plants were collected from tropical and
southern subtropical regions. Winter color retention in November (WCR I) had
substantial positive correlation with sod density, intemode diameter and leaf blade width.
However, color retention in December (WCR 11) had substantially greater positive
168
correlations with winter kill and weed prolificacy, and greater negative correlations with
spring green up. The results suggested that more poorly adapted accessions had good
color in December, but more winter kill and consequently poorer spring green up. Plant
height was positively correlated with other morphological traits such as leaf blade width,
leaf blade length, and intemode diameter and length. The results indicate that tall plants
tend to have larger leaf blades and coarse and long intemodes. No significant correlations
were found involving slime mold and leaf spot occurrence, indicating that simultaneous
selection for resistance may be possible. Biomass dry weight was positively correlated
with stolon growth rate, first year ground coverage, genetic color, plant height, spring
greenup, intemode length, intemode diameter, and leaf blade width and length, but
negatively correlated with December winter color, leaf spot occurrence, winter kill rate.
Path coefficients analysis
Spring greenup I, znd intemode diameter, leaf spot occurrence, slime mold
occurrence, height without seed head, height with seed head and znd leaf blade length on
3rd stem node, were selected and accounted for 48% of the total variation of biomass
yield by using selection procedures of multiple regression at the 0.05 probability level
(Table 5). Path coefficients for biomass yield and the seven selected characters are given
in Table 6. A positive and direct effect of plant height without seedhead on biomass
yield was observed (Table 6), indicating that it is a good predictor of biomass yield. The
correlation coefficient of plant height without seed head vs. biomass yield was
intermediate (0.375) because it was significantly correlated with leaf blade length, leaf
blade width, stem intemode diameter, intemode length, and height with seed head. The
latter characters contributed to biomass yield via plant height without seed head; hence
169
they had either negative or low positive effects (Table 6). Greenup I, leaf spot, and slime
mold occurrence were not highly associated with morphological traits, because their
direct effects were respectively close to their total effects on biomass yield. The direct
path coefficient of Greenup I with biomass yield was substantial (Table 6). It is evident
that plants with early green up have a longer growth period resulting in more dry matter
accumulation. The results also indicated the plants with early green up had good adaptive
capability. It is obvious that ifbermudagrass accessions are adapted and tall growing,
they will, on the average, be relatively high yielding. The path direct coefficients and
correlation coefficients of leaf spot and slime mold occurrences with biomass yield were
intermediate, but consistent. This result indicates those two diseases can be important
negative agents resulting in reduced forage yields in bermudagrass. Bipolaris cynodontis
(Marig.) Shoem. can cause serious diseases on leaf, crown and root tissues of
bermudagrass, and weaken and even kill stands of susceptible bermudagrass plants
(Taliaferro et al., 2004). Slime mold fungi may shade individual grass leaves to the extent
that plants may be weakened by inefficient photosynthesis (Smiley et al., 1993).
The enormous amount of genetic variability in the biomass yields of the Chinese
Cynodon clonal accessions is congruent with the findings from many other studies
(Burton, 1947; Avis et al., 1980; Harlan, 1970a, b; Harlan et al., 1969; de Silva, 1991).
The genetic variability for biomass in experiment B is significant only at the level of
0.10, probably because our sampling area was small (0.09 m2 per plot). Biomass yield is
also heavily influenced by environment and genotype by environment interactions. The
direct positive effect of plant height to biomass yield indicated it to be best trait for
170

indirect selection for high biomass yield in populations well adapted to a specific
environment.
171
REFERENCES
Avis, J.D., C.M. Taliaferro, and D. Holbert. 1980. Genotype x interaction study of
bermudagrass yields in Oklahoma. Proc. Okla. Acad. Sci. 60:69-74.
Burton, G.W. 1947. Breeding Bermuda grass for the southeastern United States. Agron.
J. 39:551-569.
Das, M.K., R.G. Fuentes, and C.M. Taliaferro. 2004. Genetic variability and trait
relationships in switchgrass. Crop Sci. 44:443-448.
de Silva, P.H.A.U. 1991. The ecological genetics of Cynodon dactylon (L.) Pers. In Sri
Lanka. Ph.D. dissertation. University of Reading. UK.
Dewey, D.R., and K.H. Lu. 1959. A correlation and path-coefficient analysis of
components of crested wheatgrass seed production. Agron. J. 51 :515-518.
Harlan, J.R., and J.M.J. de Wet. 1969. Sources of variation in Cynodon dactylon (L.)
Pers. Crop Sci. 9:774-778.
Harlan, J.R. 1970a. Cynodon species and their value for grazing or hay. Herbage Abs.
40:233-238.
Harlan, J.R., and J.M.J. de Wet, and K.M. Rawal. 1970b. Geographic distribution of the
species of Cynodon L.C. Rich (Gramineae). East Afric. Agric. For. J. 36:220-
226.
Kneebone, W.R. 1973. Breeding seeded varieties ofbermudagrass for turfgrass use. Proc.
Scotts Turfgrass Res. Conf. 4:149-153.
SAS Institute. 1999. SAS Proprietary Software Version 8.0 SAS Inst., Cary, NC.
Smiley, R.W., P.H. Demoeden, and B.B. Clarke. 1993. Compendium ofTurfgrass
172
Diseases (second edition). APS press, The American Phytopathological Society.
St. Paul, MN.
Taliaferro, C.M., F.M. Rouquette, Jr., and P. Mislevy. 2004. Bermudagrass and Stargrass.
In Moser L., L. Sollenberger, and B. Burson. (ed.) Warm-Season Grasses. Am.
Soc. Agron. Monograph. (in press).
173
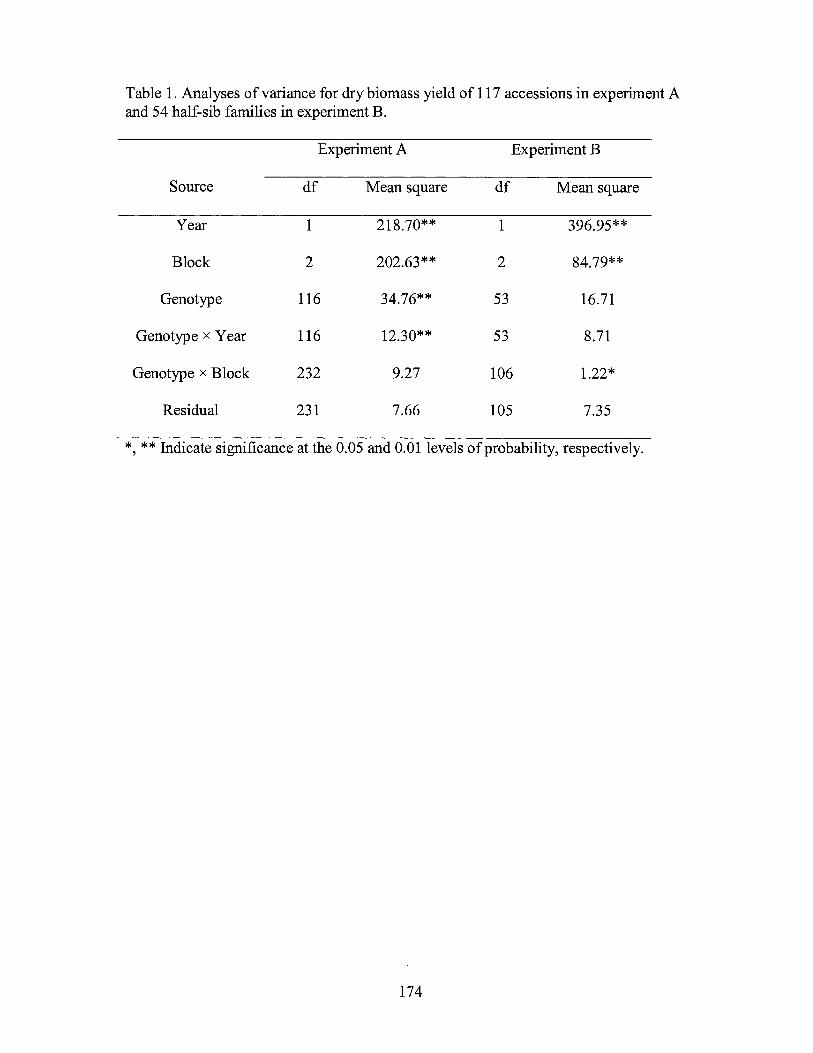
Table 1. Analyses of variance for dry biomass yield of 117 accessions in experiment A and 54 half-sib families in experiment B.
Experiment A Experiment B
Source df Mean square df Mean square
Year 1 218.70** 1 396.95**
Block 2 202.63** 2 84.79**
Genotype 116 34.76** 53 16.71
Genotype x Year 116 12.30** 53 8.71
Genotype x Block 232 9.27 106 1.22*
Residual 231 7.66 105 7.35
*,**Indicate significance at the 0.05 and 0.01 levels of probability, respectively.
174
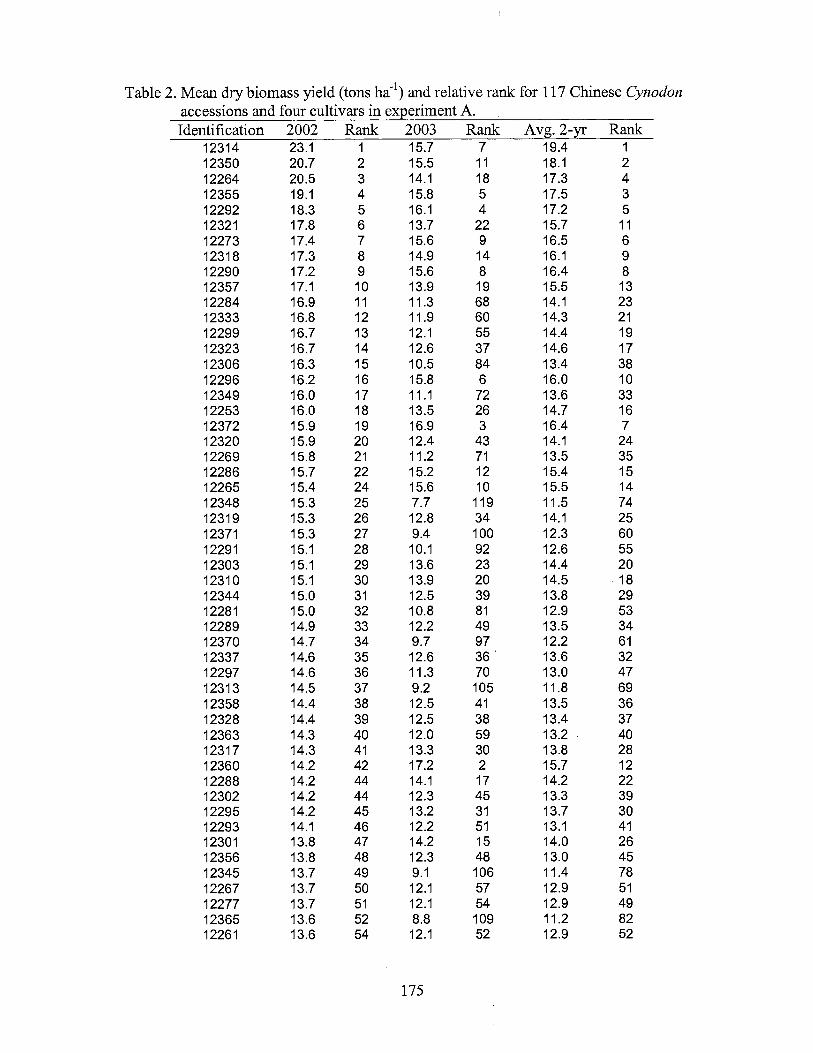
Table 2. Mean dry biomass yield (tons ha-1) and relative rank for 117 Chinese Cynodon accessions and four cultivars in experiment A. Identification 2002 Rank 2003 Rank Avg. 2-yr Rank
12314 23.1 1 15.7 7 19.4 1 12350 20.7 2 15.5 11 18.1 2 12264 20.5 3 14.1 18 17.3 4 12355 19.1 4 15.8 5 17.5 3 12292 18.3 5 16.1 4 17.2 5 12321 17.8 6 13.7 22 15.7 11 12273 17.4 7 15.6 9 16.5 6 12318 17.3 8 14.9 14 16.1 9 12290 17.2 9 15.6 8 16.4 8 12357 17.1 10 13.9 19 15.5 13 12284 16.9 11 11.3 68 14.1 23 12333 16.8 12 11.9 60 14.3 21 12299 16.7 13 12.1 55 14.4 19 12323 16.7 14 12.6 37 14.6 17 12306 16.3 15 10.5 84 13.4 38 12296 16.2 16 15.8 6 16.0 10 12349 16.0 17 11.1 72 13.6 33 12253 16.0 18 13.5 26 14.7 16 12372 15.9 19 16.9 3 16.4 7 12320 15.9 20 12.4 43 14.1 24 12269 15.8 21 11.2 71 13.5 35 12286 15.7 22 15.2 12 15.4 15 12265 15.4 24 15.6 10 15.5 14 12348 15.3 25 7.7 119 11.5 74 12319 15.3 26 12.8 34 14.1 25 12371 15.3 27 9.4 100 12.3 60 12291 15.1 28 10.1 92 12.6 55 12303 15.1 29 13.6 23 14.4 20 12310 15.1 30 13.9 20 14.5 18 12344 15.0 31 12.5 39 13.8 29 12281 15.0 32 10.8 81 12.9 53 12289 14.9 33 12.2 49 13.5 34 12370 14.7 34 9.7 97 12.2 61 12337 14.6 35 12.6 36 13.6 32 12297 14.6 36 11.3 70 13.0 47 12313 14.5 37 9.2 105 11.8 69 12358 14.4 38 12.5 41 13.5 36 12328 14.4 39 12.5 38 13.4 37 12363 14.3 40 12.0 59 13.2 40 12317 14.3 41 13.3 30 13.8 28 12360 14.2 42 17.2 2 15.7 12 12288 14.2 44 14.1 17 14.2 22 12302 14.2 44 12.3 45 13.3 39 12295 14.2 45 13.2 31 13.7 30 12293 14.1 46 12.2 51 13.1 41 12301 13.8 47 14.2 15 14.0 26 12356 13.8 48 12.3 48 13.0 45 12345 13.7 49 9.1 106 11.4 78 12267 13.7 50 12.1 57 12.9 51 12277 13.7 51 12.1 54 12.9 49 12365 13.6 52 8.8 109 11.2 82 12261 13.6 54 12.1 52 12.9 52
175
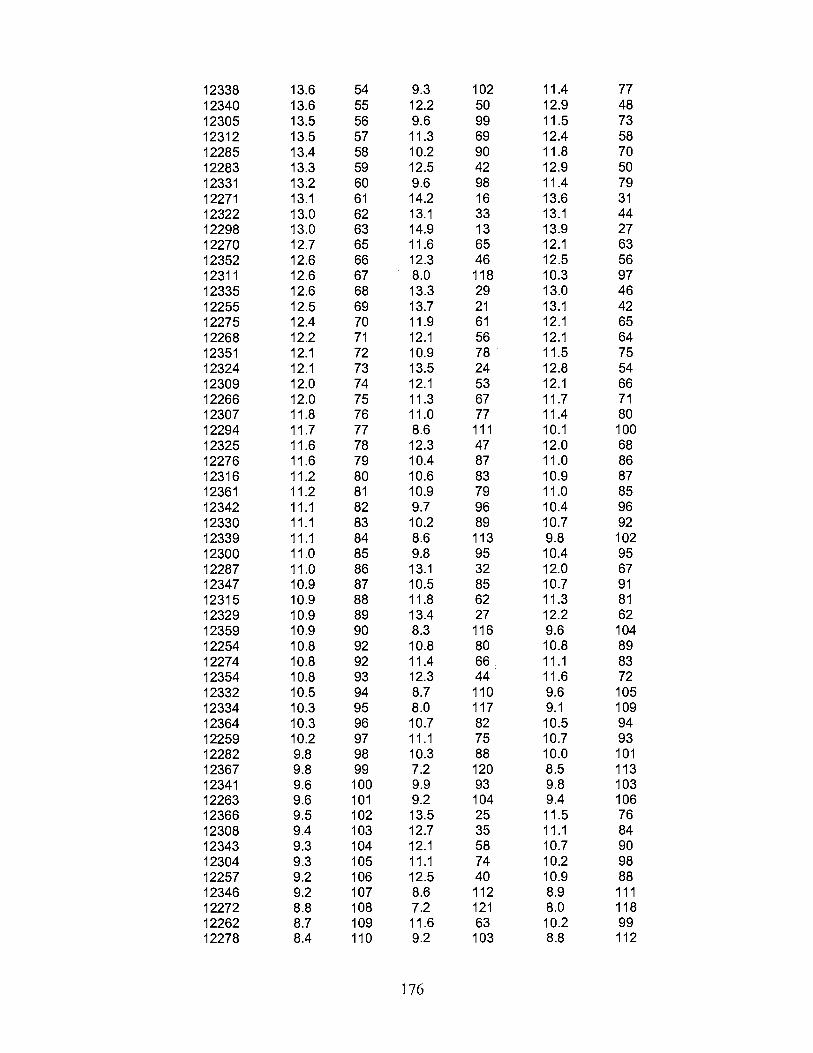
12338 13.6 54 9.3 102 11.4 77 12340 13.6 55 12.2 50 12.9 48 12305 13.5 56 9.6 99 11.5 73 12312 13.5 57 11.3 69 12.4 58 12285 13.4 58 10.2 90 11.8 70 12283 13.3 59 12.5 42 12.9 50 12331 13.2 60 9.6 98 11.4 79 12271 13.1 61 14.2 16 13.6 31 12322 13.0 62 13.1 33 13.1 44 12298 13.0 63 14.9 13 13.9 27 12270 12.7 65 11.6 65 12.1 63 12352 12.6 66 12.3 46 12.5 56 12311 12.6 67 8.0 118 10.3 97 12335 12.6 68 13.3 29 13.0 46 12255 12.5 69 13.7 21 13.1 42 12275 12.4 70 11.9 61 12.1 65 12268 12.2 71 12.1 56 12.1 64 12351 12.1 72 10.9 78. 11.5 75 12324 12.1 73 13.5 24 12.8 54 12309 12.0 74 12.1 53 12.1 66 12266 12.0 75 11.3 67 11.7 71 12307 11.8 76 11.0 77 11.4 80 12294 11.7 77 8.6 111 10.1 100 12325 11.6 78 12.3 47 12.0 68 12276 11.6 79 10.4 87 11.0 86 12316 11.2 80 10.6 83 10.9 87 12361 11.2 81 10.9 79 11.0 85 12342 11.1 82 9.7 96 10.4 96 12330 11.1 83 10.2 89 10.7 92 12339 11.1 84 8.6 113 9.8 102 12300 11.0 85 9.8 95 10.4 95 12287 11.0 86 13.1 32 12.0 67 12347 10.9 87 10.5 85 10.7 91 12315 10.9 88 11.8 62 11.3 81 12329 10.9 89 13.4 27 12.2 62 12359 10.9 90 8.3 116 9.6 104 12254 10.8 92 10.8 80 10.8 89 12274 10.8 92 11.4 66. 11.1 83 12354 10.8 93 12.3 44 11.6 72 12332 10.5 94 8.7 110 9.6 105 12334 10.3 95 8.0 117 9.1 109 12364 10.3 96 10.7 82 10.5 94 12259 10.2 97 11.1 75 10.7 93 12282 9.8 98 10.3 88 10.0 101 12367 9.8 99 7.2 120 8.5 113 12341 9.6 100 9.9 93 9.8 103 12263 9.6 101 9.2 104 9.4 106 12366 9.5 102 13.5 25 11.5 76 12308 9.4 103 12.7 35 11.1 84 12343 9.3 104 12.1 58 10.7 90 12304 9.3 105 11.1 74 10.2 98 12257 9.2 106 12.5 40 10.9 88 12346 9.2 107 8.6 112 8.9 111 12272 8.8 108 7.2 121 8.0 118 12262 8.7 109 11.6 63 10.2 99 12278 8.4 110 9.2 103 8.8 112
176
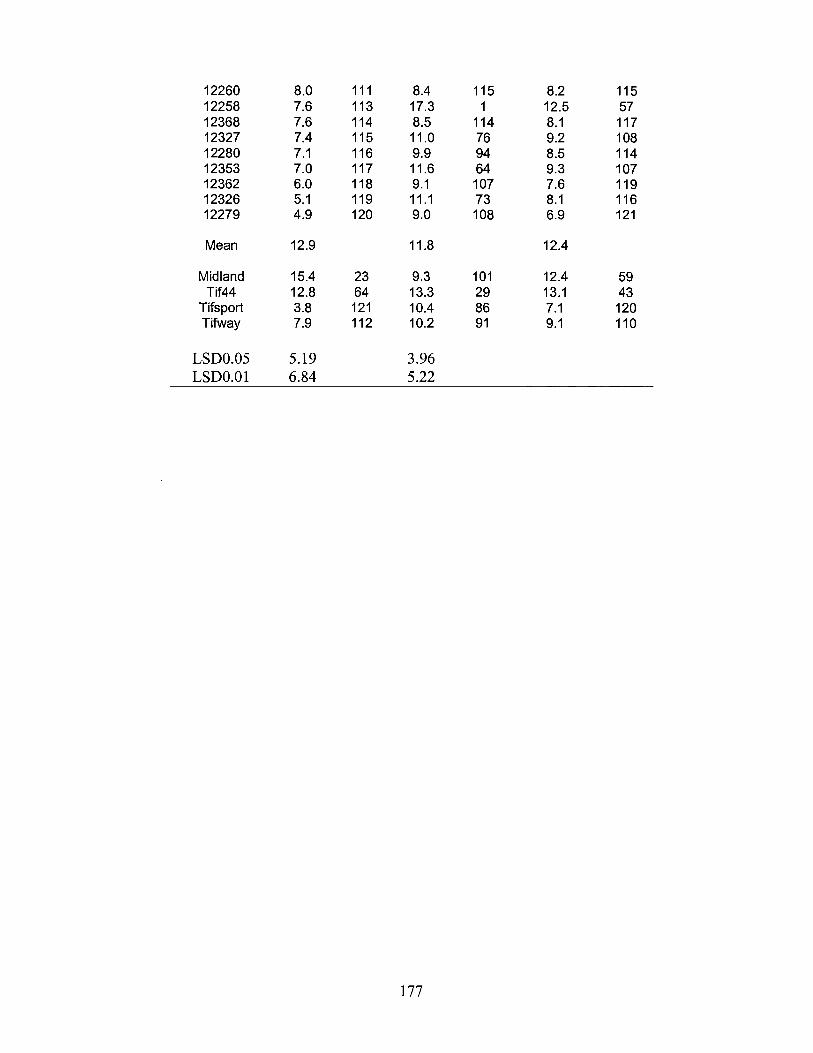
12260 8.0 111 8.4 115 8.2 115 12258 7.6 113 17.3 1 12.5 57 12368 7.6 114 8.5 114 8.1 117 12327 7.4 115 11.0 76 9.2 108 12280 7.1 116 9.9 94 8.5 114 12353 7.0 117 11.6 64 9.3 107 12362 6.0 118 9.1 107 7.6 119 12326 5.1 119 11.1 73 8.1 116 12279 4.9 120 9.0 108 6.9 121
Mean 12.9 11.8 12.4
Midland 15.4 23 9.3 101 12.4 59 Tif44 12.8 64 13.3 29 13.1 43
Tifsport 3.8 121 10.4 86 7.1 120 Tifway 7.9 112 10.2 91 9.1 110
LSD0.05 5.19 3.96 LSD0.01 6.84 5.22
177
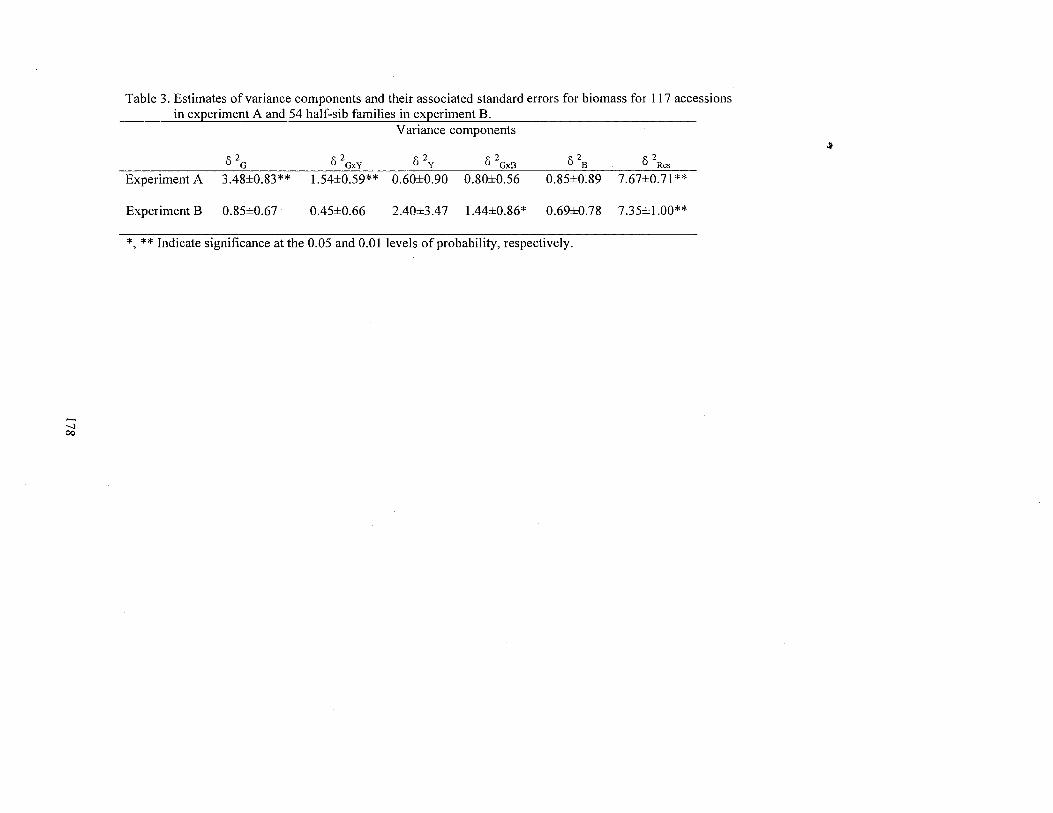
'-I co
Table 3. Estimates of variance components and their associated standard errors for biomass for 117 accessions in experiment A and 54 half-sib families in experiment B.
Variance components
52 G 6 2GxY 6 2 y 6 2GxB
52 B 6 \es
Experiment A 3.48±0.83** 1.54±0.59** 0.60±0.90 0.80±0.56 0.85±0.89 7.67±0.71 **
Experiment B 0.85±0.67 0.45±0.66 2.40±3.47 1.44±0.86* 0.69±0.78 7.35±1.00**
*, ** Indicate significance at the 0.05 and 0.01 levels of probability, respectively.
..
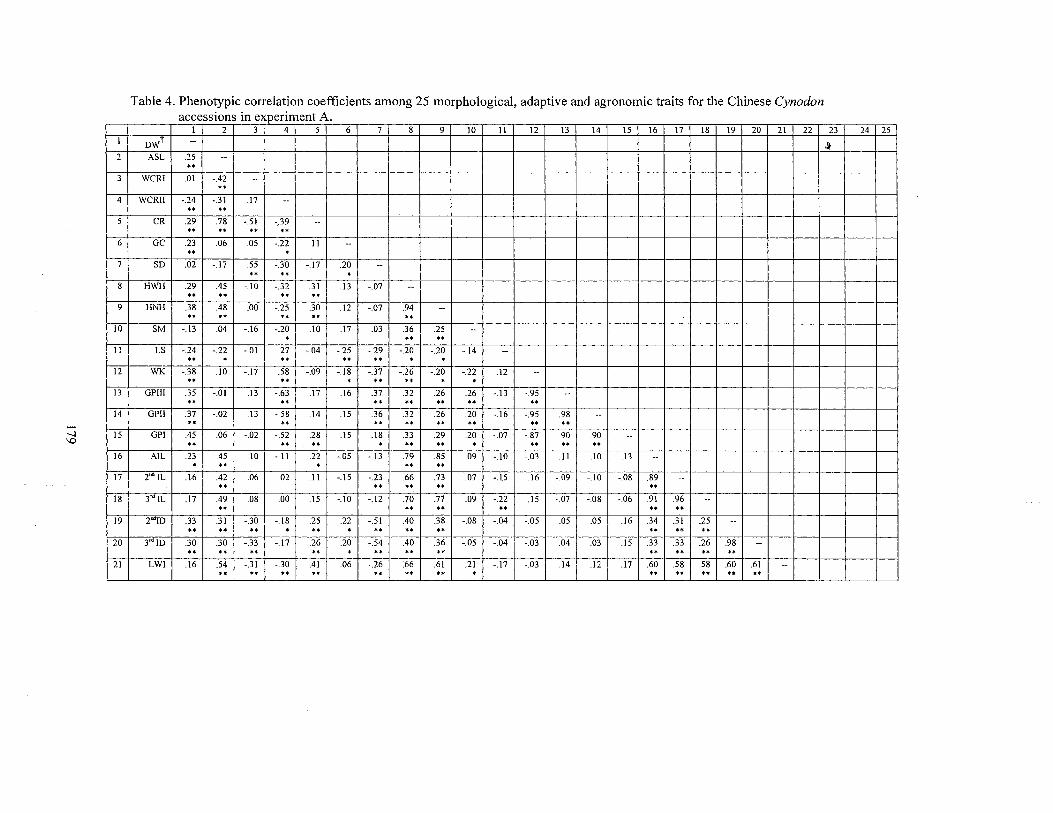
..... -..J \0
I
2
3
4
s
6
7
8
9
10
II
12
13
14
15
16
17
18
19
20
21
Table 4. Phenotypic correlation coefficients among 25 morphological, adaptive and agronomic traits for the Chinese Cynodon accessions in ex_p_eriment A.
I 2 3 4 s 6 7 8 9 10 II 12 13 14 IS 16 17 18 19 20 21 22 23 24 25
DWT --~
ASL .25 ·-.. WCRI .01 -.42 --
•• WCRII -.24 -.31 .17 ·-
•• .. CR .29 .78 -.SI -.39 ·-
•• .. . . •• GC .23 .06 .OS -.22 .11 --
•• . SD .02 -.17 .55 s.30 -.17 .20 --
•• .. • HWH .29 .45 -.10 -.32 .31 .13 -.07 ..
•• .. .. •• HNH .38 .48 .00 -.25 .30 .12 -.07 .94 --
•• .. .. .. .. SM -.13 .04 -.16 -.20 .10 .17 .03 .36 .25 ·-. .. •• LS -.24 -.22 -.01 .27 -.04 -.25 -.29 -.20 ·.20 -.14 --.. • .. . . .. . •
WK -.38 .10 -.17 .58 -.09 -.18 -.37 -.26 -.20 -.22 .12 ·-.. .. • . . ** • . GPIII .35 -.01 .13 -.63 .17 .16 .37 .32 .26 .26 -.13 -.95 ..
•• .. .. .. .. •• •• GPII .37 -.02 .13 -.58 .14 .15 .36 .32 .26 .20 -.16 -.95 .98 -· .. •• .. .. . . .. •• . . GP! .45 .06 -.02 -.52 .28 .15 .18 .33 .29 .20 -.07 -.87 .90 .90 -·
•• .. •• • .. .. • .. .. . . AIL .23 .45 .IO -.II .22 -.05 -.13 .79 .85 .09 ·.10 -.03 .11 .10 .13 ·-
• ** • .. .. 2"'1L .16 .42 .06 .02 .11 -.15 -.23 .66 .73 .07 -.15 .16 -.09 -.10 -.08 .89 --
•• .. . . .. .. 3"'IL .17 .49 .08 .00 .15 -.10 -.12 .70 .77 .09 -.22 .15 -.07 -.08 -.06 .91 .96 --
•• •• •• •• •• •• 2"'ID .33 .31 -.30 -.18 .25 .22 -.SI .40 .38 -.08 -.04 -.05 .OS .05 .16 .34 .31 .25 --
•• •• •• • .. • .. . . •• ** •• •• 3"ID .30 .30 -.33 -.17 .26 .20 -.54 .40 .36 -.05 -.04 -.03 .04 .03 .15 .33 .33 .26 .98 --
•• •• .. .. • •• ** •• •• •• • • .. LWI . 16 .54 -.31 -.30 .41 .06 -.26 .66 .61 .21 -.17 -.03 .14 .12 .17 .60 .58 .58 .60 .61 --
** .. •• •• •• ** •• • •• •• • • •• ••
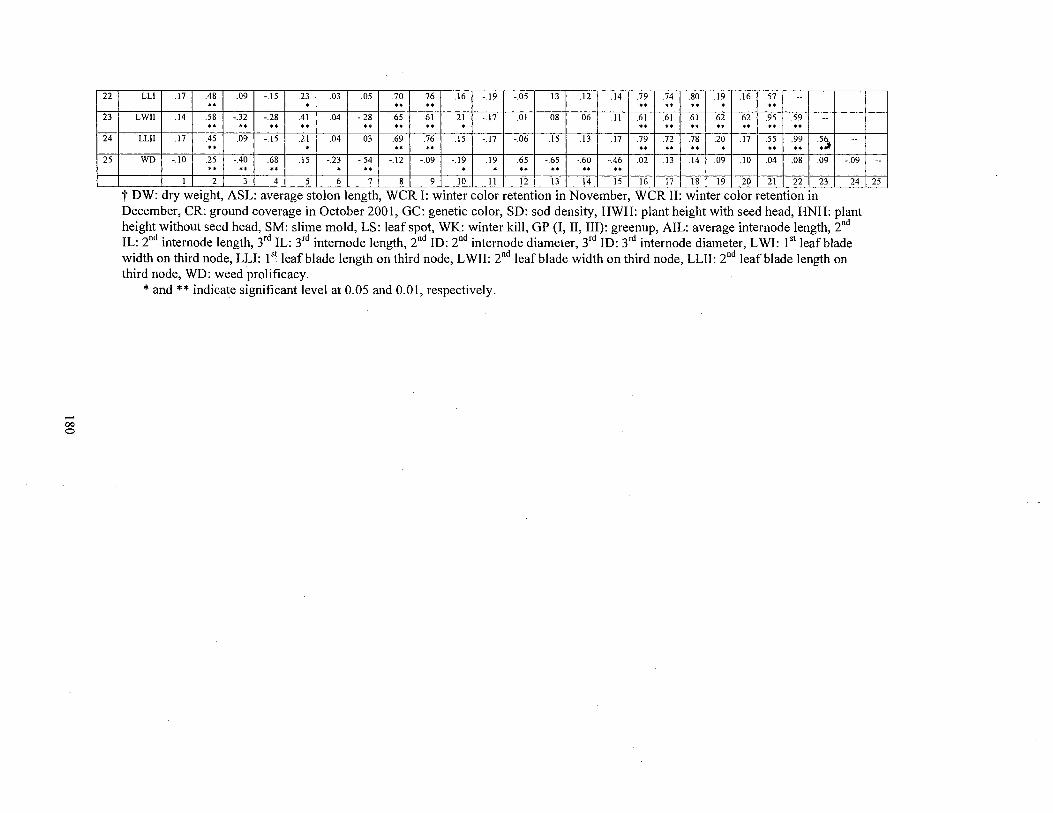
...... 00 0
22
23
24
25
LL! .17 .48 .09 -.15 .23 .03 .05 .70 .76 .16 -.19 -.05 .13 .12 .14 .79 .74 .80 .19 .16 .57 --.. • .. •• .. .. •• . . . LWII .14 . 58 -.32 -.28 .41 .04 -.28 .65 .61 .21 -.17 .OJ .08 .06 .II .61 .61 .61 .62 .62 .95 .59 --
•• .. .. .. .. •• •• . .. . . .. .. . . .. .. LL!l .17 .45 .09 -.15 .21 .04 .03 .69 .76 .15 -.17 -.06 .15 .13 .17 .79 .72 .78 .20 .17 .55 .99 ;~ --.. • .. .. .. .. •• • •• •• WD -.10 .25 -.40 .68 .15 -.23 -.54 -.12 -.09 -.19 .19 .65 -.65 -.60 -.46 .02 .13 .14 .09 .10 .04 .08 .09 -.09 .. •• • • • .. . • •• •• •• • •
1 2 3 4 5 6 7 8 9 10 11 12 13 14 15 16 17 18 19 20 21 22 23 24
t DW: dry weight, ASL: average stolon length, WCR I: winter color retention in November, WCR II: winter color retention in December, CR: ground coverage in October 2001, GC: genetic color, SD: sod density, HWH: plant height with seed head, HNH: plant height without seed head, SM: slime mold, LS: leaf spot, WK: winter kill, GP (I, II, III): green up, AIL: average internode length, 2nd
IL: 2nd internode length, 3rd IL: 3rd internode length, 2nd ID: 2nd internode diameter, 3rd ID: 3rd internode diameter, L WI: I st leaf blade width on third node, LLI: I st leaf blade length on third node, LWII: 2nd leaf blade width on third node, LLII: 2nd leaf blade length on third node, WD: weed prolificacy.
*and** indicate significant level at 0.05 and 0.01, respectively .
--
25
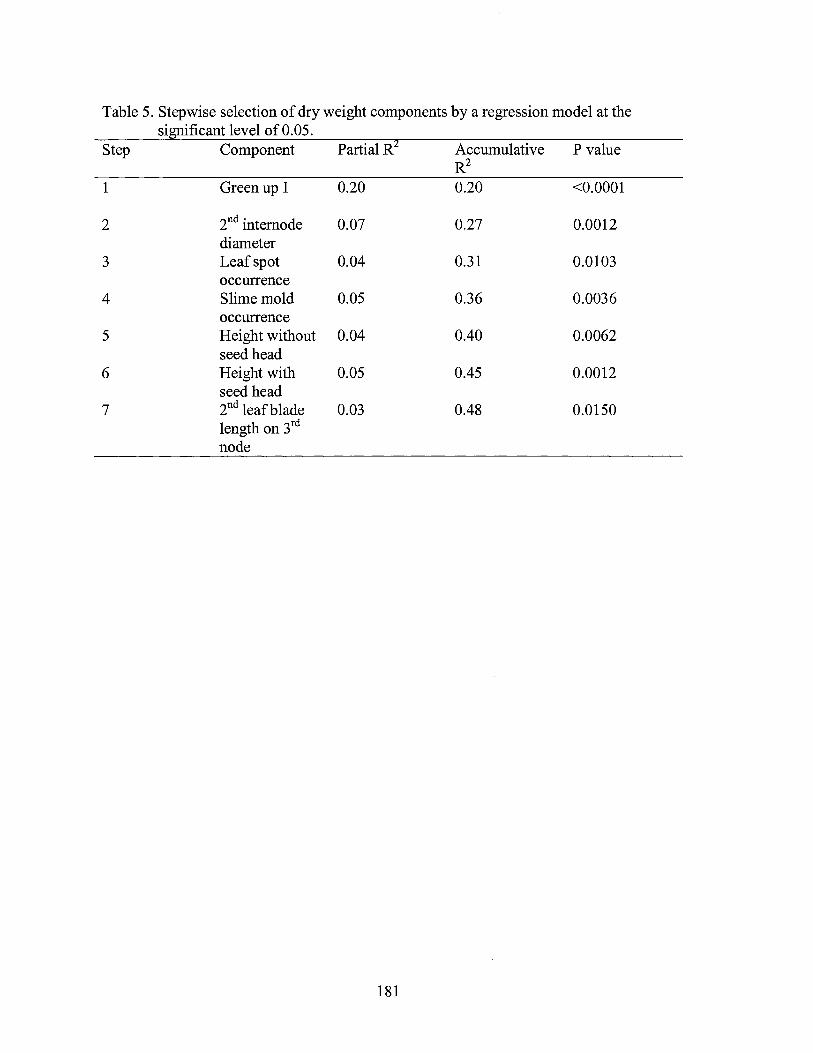
Table 5. Stepwise selection of dry weight components by a regression model at the significant level of 0.05.
Step Component Partial R Accumulative P value R2
1 Green up I 0.20 0.20 <0.0001
2 2nd intemode 0.07 0.27 0.0012 diameter
3 Leaf spot 0.04 0.31 0.0103 occurrence
4 Slime mold 0.05 0.36 0.0036 occurrence
5 Height without 0.04 0.40 0.0062 seed head
6 Height with 0.05 0.45 0.0012 seed head
7 2nd leaf blade 0.03 0.48 0.0150 length on 3rd node
181
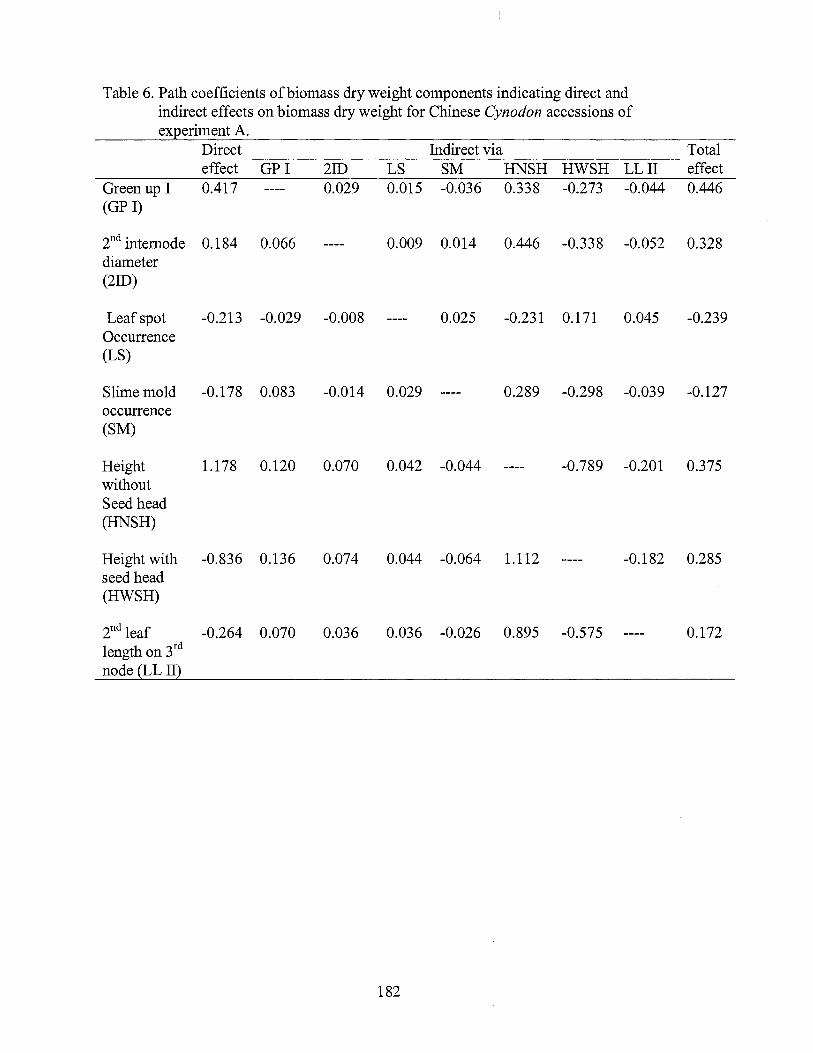
Table 6. Path coefficients of biomass dry weight components indicating direct and indirect effects on biomass dry weight for Chinese Cynodon accessions of experiment A.
Direct Indirect via Total effect GPI 210 LS SM HNSH HWSH LLII effect
Green up I 0.417 0.029 0.015 -0.036 0.338 -0.273 -0.044 0.446 (GP I)
2nd intemode 0.184 0.066 0.009 0.014 0.446 -0.338 -0.052 0.328 diameter (210)
Leaf spot -0.213 -0.029 -0.008 0.025 -0.231 0.171 0.045 -0.239 Occurrence (LS)
Slime mold -0.178 0.083 -0.014 0.029 ---- 0.289 -0.298 -0.039 -0.127 occurrence (SM)
Height 1.178 0.120 0.070 0.042 -0.044 -0.789 -0.201 0.375 without Seed head (HNSH)
Height with -0.836 0.136 0.074 0.044 -0.064 1.112 -0.182 0.285 seed head (HWSH)
2nd leaf -0.264 0.070 0.036 0.036 -0.026 0.895 -0.575 0.172 length on 3rd node (LL II)
182
*r VITA
Yanqi Wu
Candidate for the Degree of
Doctor of Philosophy
Thesis: GENETIC CHARACTERIZATION OF CYNODON ACCESSIONS BY MORPHOLOGY, FLOW CYTOMETRY AND DNA PROFILING
·· Major field: Crop Science
Biographical:
Personal Data: Born in Yanchi County, Ningxia, China, March 1965.
Education: Graduated from Yanchi First High School, Ningxia, China in June 1981; received B.S. (Ag.) degree in Animal Science from Ningxia University in July 1985; received M.S. (Ag.) in Grassland Science from Sichuan Agricultural University, China in July 1988; and completed the requirements for the Doctor of Philosophy degree in Crop Science at Oklahoma State University in May, 2004.
Professional Experience: Faculty member, Sichuan Agricultural University, China, 1988 to 2000; Graduate research assistant, Department of Plant and Soil Sciences, Oklahoma State University, January 2001 to May 2004.
Professional Membership: Crop Science Society of America, American Society of Agronomy, Chinese Grassland Science Society, Chinese Turfgrass Science Society.
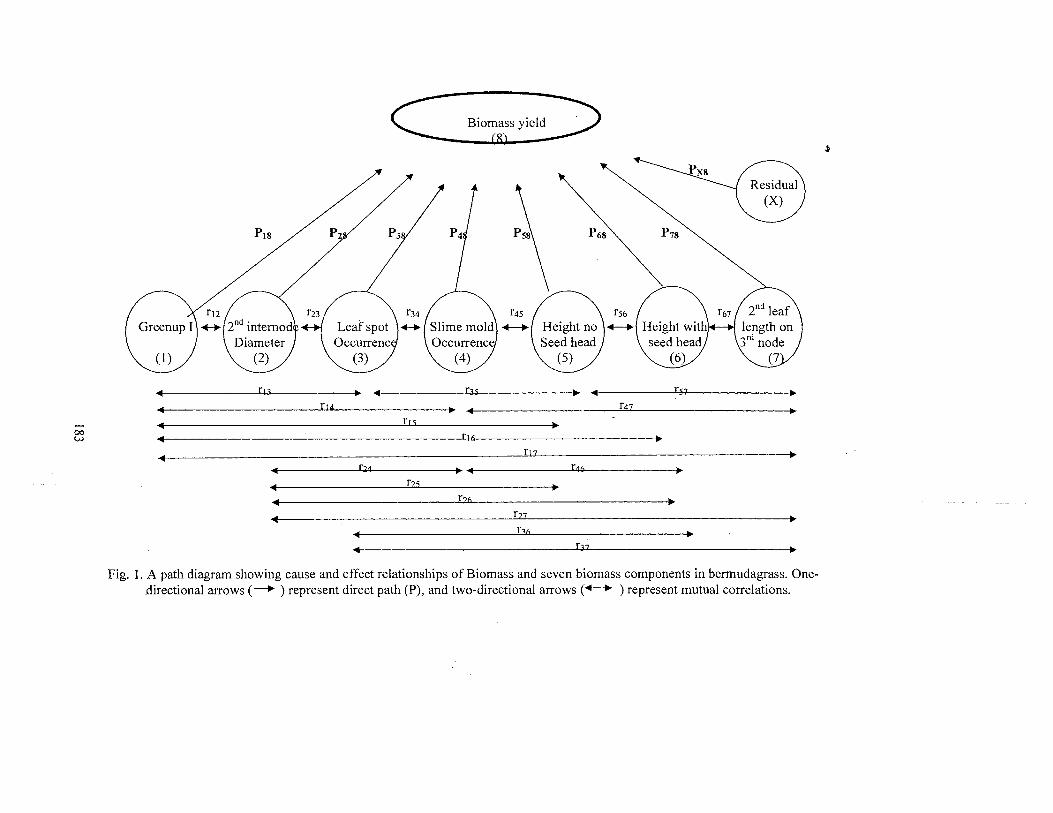
..... co w
r • r
r
r r
r
rs6 ........
r~~~~~~~~~~~~~-
Fig. 1. A path diagram showing cause and effect relationships of Biomass and seven biomass components in bermudagrass. Onedirectional arrows(_. ) represent direct path (P), and two-directional arrows(+-+ ) represent mutual correlations.
,j