genetic conectivity patterns in holothuria … · lights, during the darker periods of this thesis....
TRANSCRIPT

UNIVERSIDADE DO ALGARVE
GENETIC CONECTIVITY PATTERNS IN HOLOTHURIA MAMMATA CONSIDERING DIFFERENT SPATIAL SCALES
Filipe Freitas Henriques
Dissertação para obtenção do grau de:
Mestrado em Biologia Marinha
Trabalho efetuado sob a orientação de:
Mercedes González- Wangüemert, PhD
Ester A. Serrão, PhD
2015
2
UNIVERSIDADE DO ALGARVE
GENETIC CONECTIVITY PATTERNS IN HOLOTHURIA MAMMATA CONSIDERING DIFFERENT SPATIAL SCALES
Filipe Freitas Henriques
Dissertação para obtenção do grau de:
Mestrado em Biologia Marinha
Trabalho efetuado sob a orientação de:
Mercedes González-Wangüemert, PhD
Ester A. Serrão, PhD
2015

3
GENETIC CONECTIVITY PATTERNS IN HOLOTHURIA MAMMATA CONSIDERING DIFFERENT SPATIAL SCALES
Declaração de autoria de trabalho
Declaro ser a autor deste trabalho, que é original e inédito. Autores e trabalhos consultados estão devidamente citados no texto e constam da
listagem de referências incluída.
©Copyright Filipe Freitas Henriques
A Universidade do Algarve tem o direito, perpétuo e sem limites geográficos, de arquivar e publicitar este trabalho através de exemplares impressos reproduzidos em papel ou de forma digital, ou por qualquer outro meio conhecido ou que venha a ser inventado, de o divulgar através de repositórios científicos e de admitir a sua cópia e distribuição com objetivos educacionais ou de investigação, não comerciais, desde que seja dado crédito ao autor e editor.

4
I. ACKNOWLEDGEMENTS
First of all, a very big thanks to Mercedes González-Wangüemert for helping me during all parts of the process, by providing comments, information, papers, and software necessary to finish the thesis.
Special thanks to Ester A. Serrão, who promptly received me with arms wide
open into her research group and guided me to a thesis project with Mercedes.
These two super Women were always there when I needed, always motivating me, and I really admire their Excellency as scientists and as persons. It was an honour for me to work with them.
Thanks for all the precious help of several people that participate in the
CUMFISH project and retrieved the samples. I hope this work may fulfil your efforts. I would like to thank also to Professor Karim Erzini, Aschwin Engelen, Onno
Diekmann, Sara Valente, Francisco Fernandes, Diogo Paulo and all people working in the CCMAR facilities who helped me during my initial thesis and more.
Thanks to my family. My Mom, who always believed in me, especially in some
hard moments of ours lifes. My Father, who was the first to introduce me to the marine realm, and indirectly influenced my career. My Brothers, just for being true brothers, and always there when I needed. My girlfriend, Raquel Marques, who turned on the lights, during the darker periods of this thesis.
At last but not least, thanks to my master course colleagues, especially Ana Costa, Joana Pimentel, Daniela Nobre, Magda Frade, Cátia Freitas, André Silva, Inga Silva and Pedro Shaw, for being such good teammates. Our great friendship and dedication to this course, was fundamental to keep us highly motivated. I think that all those dinners and weekends studying together created bonds that will endure eternally. This master thesis was only possible due to all of you.
5
II. ABSTRACT
As a consequence of the world population growth, the demand for sea food
resources is increasing. Consequently, worldwide fisheries transition from depleted
finfish resources to alternative invertebrates species created a massive industry. Sea
cucumber stocks have been overfished in Indo-Pacific Oceans as result of lack of
effective management, non-regulated fisheries and an increasing demand from Oriental
countries. The “beche de mer” demands have induced expansion of their fisheries
worldwide and have resulted in catches of new target species from the Mediterranean
Sea and NE Atlantic Ocean. With high commercial value and fragile life-history traits,
sea cucumbers are particularly vulnerable to commercial fisheries, especially when
there are no scientific knowledge to support their effective management.
This study aims to fill in some of the gap in scientific data about sea cucumber
populations, namely Holothuria mammata. It was assessed the genetic diversity and
structure, connectivity and effective population size with novel polymorphic molecular
markers (microsatellites). This analysis was done in several spatial scales and
considering oceanographic patterns. Some morphometric traits were also analysed, such
as the distribution of length and weight classes.
The results showed that Holothuria mammata has globally high genetic
diversity, higher genetic connectivity between Atlantic populations and genetic
differentiation between Atlantic/Mediterranean and eastern/western Mediterranean
basins. Effective population sizes were smaller in the Atlantic, showing some mutation-
drift disequilibrium. Oceanographic patterns were strongly correlated with the genetic
differentiation patterns. Atlantic populations presented bigger individuals (i.e. length
and weight) than Mediterranean ones, clearly associated with environmental conditions,
and ecology features. Biometric data and genetic analysis allowed us to establish the
three potential stocks inhabiting the geographic area and improve the biological
knowledge of this new target species. This information will be useful to suggest the first
recommendations to its effective fishery management, and future comparisons in order
to assess the fishery effects either at genetic and/or morphometric level.
Key Words: Holothuria mammata, genetic structure, oceanographic patterns,
microsatellites, morphometry, fishery management.

6
III. RESUMO
Com a população Mundial na ordem dos 7,2 biliões e projeções a apontar para
um aumento populacional na ordem dos 9.6 biliões para 2050, é previsto um aumento a
nível Mundial pela procura dos recursos alimentares marinhos. Apesar de uma recente
estabilização da quantidade de capturas de pescado, estima-se que pelo menos, 28.8%
dos stocks pesqueiros globais estejam sobreexplorados. A situação poderá ser
potencialmente preocupante, se tivermos em conta que o atual nível de capturas apenas
se tem mantido relativamente constante devido a uma persistente procura por novos
recursos pesqueiros e pela expansão das áreas de pesca. Como consequência do
aumento da procura internacional por recursos pesqueiros, existe evidências muito
claras que o nível trófico médio das espécies alvo está a diminuir, significando uma
transição nas descargas de pescado, de espécies de nível trófico alto (e.g. grandes
predadores), para níveis tróficos baixos (e.g. invertebrados e peixes planctívoros). Esta
situação resulta de um declínio Mundial dos predadores de topo e consequentemente,
um aumento da pressão pesqueira em outros recursos pesqueiros, como os
invertebrados, na qual os moluscos, crustáceos e equinodermes representam os mais
afetados com o aumento da demanda global. Além dos impactes ambientais negativos
originados pela pesca (e.g. arrasto de fundo, by-catch, rejeições, sobrepesca, entre
outros) também são registadas alterações na biologia e ecologia dos organismos
marinhos, desde variações na diversidade genética e estrutura das populações, a
modificações na estrutura e função dos ecossistemas marinhos. A sobre-exploração
promove a perda de diversidade genética, através da redução do tamanho efetivo da
população (NE), e consequentemente uma diminuição da variação genética e fenotípica,
tal como o tamanho corporal, fecundidade, fitness e taxa de crescimento. Estes efeitos
têm-se mostrado não reversíveis mesmo após a libertação da pressão pesqueira. A
implementação de uma gestão pesqueira sustentável permite manter a diversidade
genética das populações e o seu potencial a nível evolutivo, mas também a resiliência
dos ecossistemas.
A falta de gestão efetiva das pescas e/ou políticas de conservação, são das
principais causas para a sobrepesca. Na maioria dos casos tal deve-se à falta de
conhecimento ecológico e/ou biológico das espécies comerciais. Este tipo de situações
acontece repetidamente quando se inicia a exploração de novos recursos pesqueiros.
Os stocks de pepinos de mar nos Oceanos Indo-Pacifico têm sido um exemplo
em que a sobre-exploração ocorreu não só pela falta de conhecimento
7
ecológico/biológico, mas também devido a pescas não regulamentadas. Com os stocks
asiáticos praticamente esgotados, e sendo a procura por este recurso pesqueiro cada vez
maior, a forma mais fácil de responder a esta procura, foi expandir a pesca de pepinos
do mar a um nível global, na qual inclui o Mar Mediterrâneo e Oceano Atlântico. Com
alto valor comercial e histórias de vida frágeis, os pepinos do mar estão particularmente
vulneráveis á pesca comercial, principalmente quando não existe estudos biológicos,
ecológico ou genéticos que possam aconselhar e suportar a sua gestão sustentável.
Estudos recentes têm demonstrado o potencial farmacológico das holotúrias,
com descobertas de compostos com propriedades antimicrobianas, antioxidantes e
anticancerígenas.
Os pepinos do mar são espécies igualmente importantes para o funcionamento
saudável dos ecossistemas, pois para além de decomporem a matéria orgânica contida
nos sedimentos, reciclam os nutrientes, estimulando o crescimento de microalgas e
prevenindo eutrofização dos fundos marinhos.
Consideramos urgente iniciar estes estudos de modo a averiguar os parâmetros
biológicos e ecológicos fundamentais para dar início a uma gestão de pescas
regulamentada e efetiva. Informações como taxas de crescimento e mortalidade,
longevidade, biologia reprodutiva, duração larvar, diversidade genética, padrões de
conectividade e estrutura genética, permitiram implementar uma gestão pesqueira
sustentável a médio e longo prazo. No âmbito desta necessidade de fornecimento de
informação sobre os pepinos do mar, este estudo analisou e avaliou a diversidade
genética e respetiva estrutura genética populacional, a sua conectividade e o tamanho
efetivo das populações. Para tal foi feita uma recolha de amostras de 8 populações ao
longo do Mar Mediterrâneo e do Oceano Atlântico, cobrindo grande parte da
distribuição geográfica da espécie alvo de estudo, a Holothuria mammata.
Desenvolveu-se também marcadores moleculares específicos para esta espécie (i.e.
Microssatélites). A análise genética foi feita em varias escalas espaciais e tendo em
conta os padrões oceanográficos das correntes de superfície, de forma a compreender
como se processa a dispersão larvar de acordo com a conectividade genética.
Para além das análises genéticas, também foi analisado algumas características
morfométricas como a distribuição de classes de comprimento e peso.
Os resultados deste estudo mostraram que a Holothuria mammata apresenta a
nível geral, grande diversidade genética, uma maior conectividade genética entre as
populações do Atlântico e diferenciação genética entre Atlântico/Mediterrâneo como

8
também entre as bacias este e oeste do Mediterrâneo. As populações do Oceano
Atlântico apresentaram evidências de um desequilíbrio entre a mutação e a deriva
genética. Também verificou-se que o tamanho efetivo das populações do oceano
Atlântico são menores do que as populações do Mar Mediterrâneo.
Os padrões oceanográficos das correntes de superfície demonstraram estar
fortemente correlacionados com os padrões de diferenciação genética encontrados.
A nível das análises morfométricas efetuadas, verificou-se que a Holothuria
mammata apresenta uma morfometria alométrica, evidenciando uma alteração na forma
corporal á medida que o animal cresce. As populações do oceano Atlântico
apresentaram indivíduos maiores, quer a nível do cumprimento como a nível do peso,
do que as populações do mar Mediterrâneo. Estas diferenças corporais estão associadas
às diferentes condições ambientais, tal como a disponibilidade de habitat e alimento, e
também às características ecológicas, como a competição por alimento.
As análises biométricas e genéticas, permitiram-nos identificar os stocks
existentes na área geográfica do estudo e contribuir para o conhecimento da biologia
desta nova espécie com interesse comercial. Pelo menos três stocks devem ser
considerados; um stock para as populações do Atlântico, e dois stocks para o Mar
Mediterrano (Bacias Este e Oeste).
A informação contida nesta Tese, terá grande utilidade na sugestão das primeiras
recomendações para uma gestão efetiva das pescas. Adicionalmente, estes dados irão
servir para futuras comparações quer a nível genético, como a nível morfométrico, de
modo a avaliar os efeitos da pescaria.
Palavras-chave: Holothuria mammata, estrutura genética, padrões
oceanográficos, microssatélites, gestão de pescas.
9
IV. INDEX I. ACNOWLEDGEMENTS……………………………………………………. 4
II. ABSTRACT……………………………………………….…………………. 5 III. RESUMO…………………………………………………………………..... 6
IV. INDEX……………………………………………………………………….. 9
V. LIST OF FIGURES…………………………………………………………... 11
VI. LIST OF TABLES…………………………………………………………… 13
1.Introduction ........................................................................................................14
1.1.State of the World Fisheries.................................................................. 14
1.2.Genetics and Fisheries Management….. ….…………………………. 15
1.2.1.Genetic Diversity and Effective Population Size…………... 16
1.2.2.Population Genetic Structure... …………………………...... 16
1.2.3.Connectivity ……........ .......................................................... 17
1.2.4.Selection……………………………………………………. 17
1.3.Oceanographic Currents.……………………………………………… 18
1.3.1.Northern Atlantic Ocean Surface Currents............................ 19
1.3.2.Mediterranean Sea-Overall Functioning…………………… 21
1.3.2.1.Western Mediterranean Sea Surface Currents……. 21
1.3.2.2.Eastern Mediterranean Surface Currents…………. 24
1.4.Study Case: Sea Cucumbers.…………………………………………. 25
1.4.1.Ecological Role .......................................................... 25
1.4.2.Food Potential and Sea Cucumber Fisheries……………….. 26
1.4.3.Pharmacological Potential...................................................... 29
1.4.4.Integrated Multi-Trophic Aquaculture Potential…………… 29
1.5.Biological Model: Holothuria mammata (Grube, 1840)……………. 30
2.Objectives............................................................................................................ 33
3.Methodology…………………………………………………………………… 34
3.1.Sampling……………………………………………………………... 34
3.2.DNA Extraction, PCR Amplification and Screening…………............ 35
3.3.Genetic Analysis……………………………………………………... 36
3.3.1.Genetic Diversity…………………………………………... 36

10
3.3.2.Genetic Structure…………………………………………... 37
3.3.3.Gene Flow.............................................................................. 38
3.3.4.Bottlenecks…………………………………………………. 39
3.3.5.Selection……………………………………………………. 39
3.4.Morphometry Analysis………………………………………………. 39
4.Results................................................................................................................. 41
4.1.Genetic Diversity and Linkage Disequilibrium……………………… 41
4.2.Genetic Structure…………………………………………………….. 44
4.3.Genetic Connectivity and Effective Population Size………………… 49
4.4.Bottlenecks…………………………………………………………… 52
4.5.Morphometry Analyses………………………………………………. 53
5.Discussion……………………………………………………………………… 58
5.1.Genetic Diversity……………………………………………………... 58
5.2.Genetic Differentiation……………………………………………….. 61
5.2.1.Great Spatial Scale: Atlantic and Mediterranean Regions…. 61
5.2.2.Small Spatial Scale: Sampled Locations…………………… 62
5.3.Bottlenecks…………………………………………………………… 65
5.4.Morphometry…………………………………………………………. 66
6.Conclusion……………………………………………………………………... 69
6.1.Populations Genetics…………………………………………………. 69
6.2.Morphometry…………………………………………………………. 69
7.Recommendations for Fisheries and Conservation Management………… 70
8.References……………………………………………………………………… 71
9.Appendix……………………………………………………………………….. 84
11
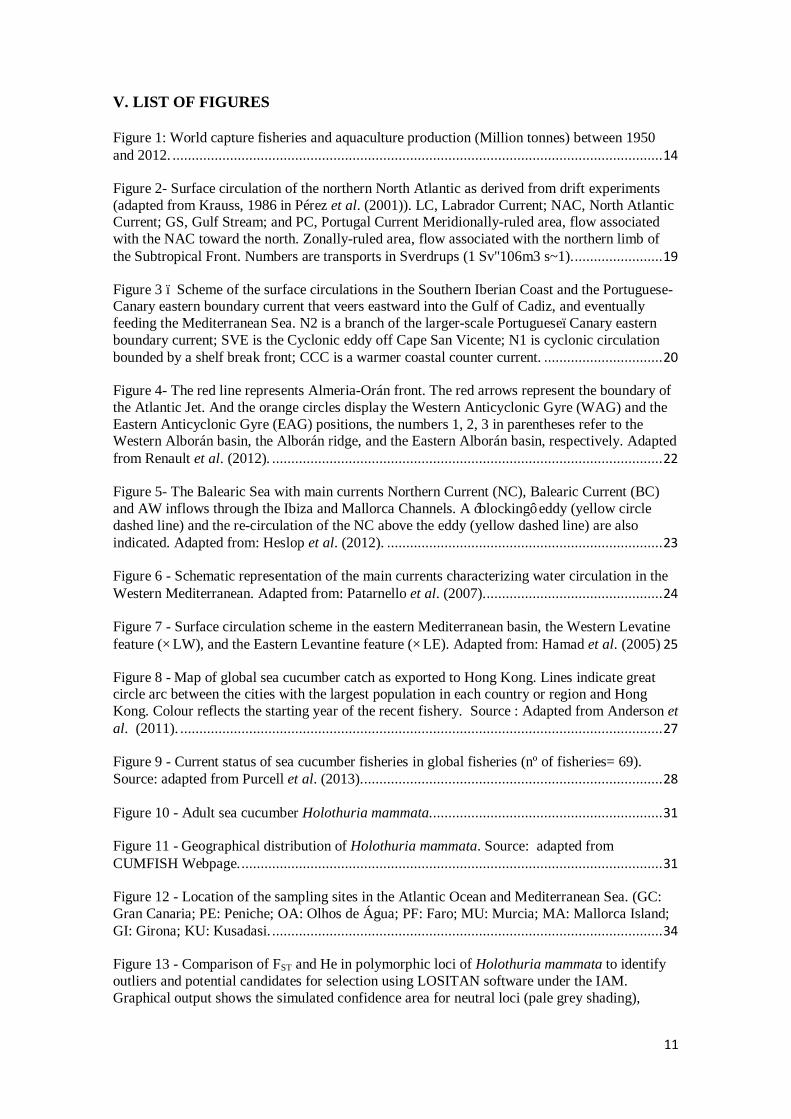
V. LIST OF FIGURES Figure 1: World capture fisheries and aquaculture production (Million tonnes) between 1950 and 2012. ................................................................................................................................ 14
Figure 2- Surface circulation of the northern North Atlantic as derived from drift experiments (adapted from Krauss, 1986 in Pérez et al. (2001)). LC, Labrador Current; NAC, North Atlantic Current; GS, Gulf Stream; and PC, Portugal Current Meridionally-ruled area, flow associated with the NAC toward the north. Zonally-ruled area, flow associated with the northern limb of the Subtropical Front. Numbers are transports in Sverdrups (1 Sv"106m3 s~1). ....................... 19
Figure 3 – Scheme of the surface circulations in the Southern Iberian Coast and the Portuguese-Canary eastern boundary current that veers eastward into the Gulf of Cadiz, and eventually feeding the Mediterranean Sea. N2 is a branch of the larger-scale Portuguese–Canary eastern boundary current; SVE is the Cyclonic eddy off Cape San Vicente; N1 is cyclonic circulation bounded by a shelf break front; CCC is a warmer coastal counter current. ............................... 20
Figure 4- The red line represents Almeria-Orán front. The red arrows represent the boundary of the Atlantic Jet. And the orange circles display the Western Anticyclonic Gyre (WAG) and the Eastern Anticyclonic Gyre (EAG) positions, the numbers 1, 2, 3 in parentheses refer to the Western Alborán basin, the Alborán ridge, and the Eastern Alborán basin, respectively. Adapted from Renault et al. (2012). ...................................................................................................... 22
Figure 5- The Balearic Sea with main currents Northern Current (NC), Balearic Current (BC) and AW inflows through the Ibiza and Mallorca Channels. A ‘blocking’ eddy (yellow circle dashed line) and the re-circulation of the NC above the eddy (yellow dashed line) are also indicated. Adapted from: Heslop et al. (2012). ........................................................................ 23
Figure 6 - Schematic representation of the main currents characterizing water circulation in the Western Mediterranean. Adapted from: Patarnello et al. (2007). .............................................. 24
Figure 7 - Surface circulation scheme in the eastern Mediterranean basin, the Western Levatine feature (∑LW), and the Eastern Levantine feature (∑LE). Adapted from: Hamad et al. (2005) 25
Figure 8 - Map of global sea cucumber catch as exported to Hong Kong. Lines indicate great circle arc between the cities with the largest population in each country or region and Hong Kong. Colour reflects the starting year of the recent fishery. Source : Adapted from Anderson et al. (2011). .............................................................................................................................. 27
Figure 9 - Current status of sea cucumber fisheries in global fisheries (nº of fisheries= 69). Source: adapted from Purcell et al. (2013). .............................................................................. 28
Figure 10 - Adult sea cucumber Holothuria mammata. ............................................................ 31
Figure 11 - Geographical distribution of Holothuria mammata. Source: adapted from CUMFISH Webpage. .............................................................................................................. 31
Figure 12 - Location of the sampling sites in the Atlantic Ocean and Mediterranean Sea. (GC: Gran Canaria; PE: Peniche; OA: Olhos de Água; PF: Faro; MU: Murcia; MA: Mallorca Island; GI: Girona; KU: Kusadasi. ...................................................................................................... 34
Figure 13 - Comparison of FST and He in polymorphic loci of Holothuria mammata to identify outliers and potential candidates for selection using LOSITAN software under the IAM. Graphical output shows the simulated confidence area for neutral loci (pale grey shading),

12
positive selection (red area) and balancing selection (yellow bottom area). Loci outliers are tagged with labels. Locus Holmam_05474 is candidate for positive selection. ......................... 43
Figure 14 - Comparison of FST and He in polymorphic loci of Holothuria mammata to identify outliers and potential candidates for selection using LOSITAN software under the SMM. Graphical output shows the simulated confidence area for neutral loci (pale grey shading), positive selection (red area) and balancing selection (yellow bottom area). Loci outliers are tagged with labels. Locus Holmam_05474 is candidate for positive selection .......................... 44
Figure 15 - Summary plot of estimates of Q at K=2. Each individual is represented by a single vertical line broken into K coloured segments, with lengths proportional to each of the K inferred clusters. The abbreviations correspond to the predefined populations. ........................ 46
Figure 16- Relationship between pairwise FST and Geographic /Oceanographic distances for the 8 populations of H. mammata.................................................................................................. 47
Figure 17 - Correspondence analysis plot based on the allele frequencies for the 8 populations of H. mammata. .......................................................................................................................... 49
Figure 18 - Assignment tests of H. mammata individuals based on 10 microsatellite loci. The circular charts indicate the adjusted mean probability of the assigned individual actually belonging to a given population, based on the exclusion-simulation test. ................................. 50
Figure 19- Column chart for each sampling location, showing the mutation scaled estimate of the effective populations size (Ne) for each sampling locality. ................................................. 51
Figure 20- Weight - Frequency distribution of Holothuria mammata along all sampling locations ................................................................................................................................. 53
Figure 21 – Length - Frequency distribution of Holothuria mammata along all sampling locations ................................................................................................................................. 54
Figure 22 - Length-Frequency distribution of Holothuria mammata in Atlantic Ocean sampling localities ................................................................................................................................. 54
Figure 23 - Length-Frequency distribution of Holothuria mammata in Mediterranean Sea sampling localities .................................................................................................................. 54
Figure 24 - Mean length in all sampled populations ................................................................. 55
Figure 25 - Mean weight in all sampled populations ................................................................ 55
Figure 26 - Mean length and weight considering Atlantic Ocean and Mediterranean Sea populations ............................................................................................................................. 56
Figure 27 - Length-weight relationships and R-squared. .......................................................... 57
Figure 28-Magnitude of ∆K as a function of K (mean ± SD over 10 replicates) for 9 microsatellites. ........................................................................................................................ 84

13
VI. LIST OF TABLES Table I- Primers sequences, type of repeats, size, nº number of alleles found in 15 samples and annealing temperature for PCR amplification. ......................................................................... 35
Table II-PCR conditions, with reagents concentration, number of cycles and temperatures, respectively ............................................................................................................................. 36
Table III: Primers sequences, type of repeats, size, nº number of alleles and annealing temperature for PCR amplification. ......................................................................................... 41
Table IV-Estimates of FST values (Weir, 1996) for each pair of Holothuria mammata populations considering (above diagonal) and not using (below diagonal) the ENA correction described in Chapuis and Estoup (2007). ................................................................................. 42
Table V-Estimates of genetic diversity of the 8 sampling sites of Holothuria mammata from the Mediterranean Sea and Northeastern Atlantic Ocean. .............................................................. 42
Table VI-Estimates of genetic diversity of Holothuria mammata between the Mediterranean Sea and Northeastern Atlantic Ocean regions ................................................................................. 43
Table VII: Pairwise fixation indices (FST) between 8 sampling localities of Holothuria mammata (below diagonal) and respective p-values (above diagonal)...................................................... 44
Table VIII- Pairwise fixation indices (FST), (below diagonal) and respective p-values (above diagonal). ................................................................................................................................ 45
Table IX-Total genic and genotypic differentiation between populations. ................................ 45
Table X : Mantel test coefficient of correlation (r) and respective p-values between genetic (i.e. FST) and geographic/oceanographic distances of Holothuria mammata .................................... 47
Table XI Analysis of molecular variance (AMOVA) among different groups setup. ................ 48
Table XII-Migration rates (M = m/μ) based on 9 microsatellites loci of Holothuria mammata from sources (columns) to sink populations (rows). ................................................................. 52
Table XIII-: Heterozygosity excess/deficiency under different mutation models in all populations and respective Sign and Wilcoxon tests. ............................................................... 52
Table XIV: Summary of the data used in Length-Weight relationship for Holothuria mammata. (N: number of individuals sampled; STD: standard deviation; Min: minimum value; Max: maximum value. ..................................................................................................................... 53
Table XV- ANOVA considering the “Locality” and “Regions” as factors. ............................... 55
Table XVI-Pairwise comparisons using t test. Bonferroni p-value adjustment method was applied. Below diagonal Weight, above diagonal Length. Significant p-values are in bold. ...... 56
Table XVII: Coefficients of the linear model (EW vs. FW) for Holothuria mammata. ............. 57
Table XVIII-Table output of the Evanno method results. Bold values shows the largest value in the Delta K column. ................................................................................................................ 84
14
1. Introduction
1.1. State of the World Fisheries
Oceans, covering nearly 71% of Earth surface, are the oldest reservoir of
biodiversity, being our main life support system. The goods and services provided from
marine biodiversity are harboured on a huge and still increasing list, being the human
the main beneficent (Roff & Zacharias, 2011). Earth’s population suffered an important
growth during the last centuries, from about 600 million people in 1700 to 6.3 billion in
2003 (Cohen, 2003). According recent predictions, the current 7.2 billion is projected to
increase by almost one billion people in the next eleven years, reaching 9.6 billion in
2050 (United Nations, Department of Economic and Social Affairs, 2013). As
consequence of this population growth, the demand for food is also increasing specially
from marine resources.
Despite apparent stabilization of overall global capture fisheries (at 90 million
tonnes; Figure-1), the percentage of overexploited stocks has exhibited a general
increasing trend in the last decades (32,5 % of global stocks in 2008 were
overexploited), although more recent data shows a decreasing of overexploitation to
28,8% in 2011 (FAO, 2014) . In this thesis I will use the “stock” definition provided by
Begg et al. (1999): ‘a “stock” describes characteristics of semi-discrete groups of
fish/invertebrates with some definable attributes which are of interest to fishery
managers’.
Figure 1: World capture fisheries and aquaculture production (Million tonnes) between 1950 and 2012. Source: adapted from (FAO, 2014)

15
Overfishing not only causes negative ecological consequences, it also reduces
fish/invertebrate production, leading to adverse social and economic consequences. It is
estimated that rebuilding overfished stocks could increase fishery production by 16.5
million tonnes and annual rent by $32 billion, which would increase the food security,
economies and well-being of the coastal communities (FAO, 2014), especially in under-
development countries, where marine food resources are a vital source of protein and
essential nutrients.
From a global perspective, there is strong evidence that the trophic level of
target species are decreasing, meaning a transition in landings from high (big predators)
to low trophic levels (invertebrates and planktivorous pelagic fish). This situation is
causing global decline of top predators and consequently, an increasing pressure shifted
to non-finfish resources (Pauly, 1998). In fact since 1950 until present, invertebrates
total global catch has been increasing from 2 to 12 million tonnes; nevertheless, this
expansion has only been maintained due to new target species as cephalopods and
echinoderms and a higher number of countries fishing invertebrates (Anderson et al.,
2011a; Eriksson et al., 2012).
1.2. Genetics and Fisheries Management
Extensive evidence exists indicating the direct impacts of fishing on marine
biodiversity, but also the collateral ones such as bottom trawling (e.g. Jones, 1992), by-
catch (e.g. Hall et al., 2000) and discards (e.g. Harrington et al., 2005). However, only
recently its being recognized that fishing has also effects on the biology and ecology of
marine organisms, from changes on genetic diversity and structure of populations, to
modifications on the structure and function of marine ecosystems (Pope et al., 2000;
Stokes & Law, 2000; Scheffer & Carpenter, 2003; Stockwell et al., 2003; Kuparinen &
Merila, 2007; Roff & Zacharias, 2011; Allendorf et al., 2014).
With the development of biochemical and molecular techniques, the discipline
of population genetics has evolved from a theoretic field to a powerful empirical
approach (Charlesworth & Charlesworth, 2009; Allendorf et al., 2013) . There are some
subjects which can be address through the application of population genetics to fisheries
management and to conservation (Ryman & Utter, 1987; Ward, 2000; Abaunza et al.,
2008; Kochzius et al., 2010; Abdul-Muneer, 2014).

16
1.2.1. Genetic Diversity and Effective Population Size
Genetic diversity, is a useful parameter to assess the “health” or fitness of target
species. In fact, the genetic diversity is recognized by the International Union for the
Conservation of Nature (IUCN) like one of the three forms of biodiversity, that needs to
be conserved (Roff & Zacharias, 2011) in order to maintain the evolutionary potential of
species and populations (Allendorf et al., 2013). Overexploitation promotes the loss of
genetic diversity (Allendorf et al., 2014; Pinsky & Palumbi, 2014), either by reducing
population size directly and/or decreasing the number of migrants between local
populations (Hindar et al., 2004; Allendorf et al., 2013). Nevertheless, the number of
reproductively successful individuals, defined in population genetics as the effective
population size or “Ne” (Watts et al., 2007), determines the level of inbreeding and the
rate of loss of genetic diversity. When a species suffers strong reductions of its effective
population size (e.g. by overfishing), the stochastic effect of genetic drift increases,
unbalancing the drift-mutation equilibrium, in which the rate of mutation (i.e. source of
diversity) is not enough to balance the loss of diversity determined by the genetic drift
(Hare et al., 2011; Allendorf et al., 2014; Pinsky & Palumbi, 2014). Moreover, as Ne
declines, the balance between natural selection and genetic drift is also altered,
favouring changes in gene frequency (Hare et al., 2011). A reduced Ne could also erode
the genetic variation by increasing the probability of fixation of deleterious alleles,
instead of fixation of adaptive alleles chosen by selection, reducing overall fitness and
limiting adaptive responses to environmental change (Allendorf et al., 2013). On the
other hand, the use of historical Ne could be very useful to the fisheries management
because the pre-exploitation estimates of abundance can be corrected, considering that
demographic data from fisheries resources are normally collected after the onset of
exploitation (Ovenden et al., 2013).
1.2.2. Population Genetic Structure
Most marine species are subdivided (or structured) in time and space by several
local random mating units, or subpopulations (Roff & Zacharias, 2011; Allendorf et al.,
2013). In fisheries management, these demographically cohesive groups of individuals
are considered as stocks, although many other definitions have been provided until now
(Çiftci, 2002; Ovenden et al., 2013 and references therein). Knowledge of populations
17
structure is critical for the understanding the biology of the species (Gharbi & Said,
2011) and especially important to their fishery management because of the delimitation
of stocks could optimize the overall productivity and protect the most vulnerable
populations (ICES, 2014). Moreover, preserving the population structure and the
evolutionary processes that lead to structuring among populations (i.e. drift, selection,
migration and mutation), will guarantee the range of diversity within a species over a
variety of environmental conditions, and therefore enhance the natural resilience to
perturbations (Eldridge et al., 2009).
1.2.3. Connectivity
Genetic connectivity or gene flow is the number of migrants interchanged
between populations that successfully contribute to gene pool (Hedgecock et al.,
2007a). Gene flow is an evolutionary force that reduces genetic differences between
populations and increases variation within populations. Understanding population
connectivity is an essential pre-requisite for implementing effective fishery
management, either in delineation of appropriate scales for management as well in the
development of networks of marine protected areas (MPAs) (Fogarty et al., 2007). A
right design of MPAs network will maximize larval export and spillover of adults to
adjacent fishing areas, allowing higher yields and profits, while maintaining self-
persistence (i.e. inter-reserve connectivity) of their subpopulations (Halpern, 2003;
White et al., 2008; Gaines et al., 2010).
1.2.4. Selection
Overharvesting promotes unnatural selection (i.e. fisheries), through removal of
phenotypes most chosen by natural and sexual selection, and leaving survivors with
relatively high fitness to the fishing selection, but less optimal with respect to natural
selection, jeopardizing the evolutionary potential of species (Thériault et al., 2008;
Allendorf et al., 2013). In fish for example, about 20–30% of the variation in life-history
traits, such as age and size at maturation, is heritable (Stokes & Law, 2000; Law, 2007),
therefore the effects of harvesting on individual life histories should receive more
attention.

18
Several examples have been published showing the fishery effects on the
exploited stocks: reduced body size (Grift et al., 2003; Olsen et al., 2004; Consuegra et
al., 2005; Swain et al., 2007), earlier age at maturation (Grift et al., 2003; Olsen et al.,
2004; Swain et al., 2007), slower growth rate (Swain et al., 2007), earlier time of
spawning (Consuegra et al., 2005), and low fecundity (Hutchings & Baum, 2005;
Jørgensen et al., 2007; Biro & Post, 2008). Therefore, fisheries are an important source
of selective pressures favouring particular life histories, morphologies and behaviours.
Morphometric data such as length and weight, although being considered basic, can be
useful for morphological and life historical comparisons between stocks at several
spatial scales (Froese, 2006). These baseline data could help on the implementation of
effective management and conservation policies, mainly when ecological and biological
information from the new target species is lost, such as on European sea cucumbers
(González-Wangüemert et al., 2014a).
Recent studies have also demonstrated that fisheries reduce the genetic diversity
of the populations (Pérez-Ruzafa et al., 2006; Pinsky & Palumbi, 2014; González-
Wangüemert et al., 2015). Genetic changes due to fisheries cannot be avoided in most
cases, but they should be detected and measured their magnitude (Allendorf et al.,
2014). Therefore, the genetic monitoring can reveal a comprehensive picture of the
target population status, by assessing both ecological and evolutionary time frames,
being this methodology more reliable and cheaper than traditional monitoring
approaches (Schwartz et al., 2007).
1.3. Oceanographic Currents.
The marine realm allows many marine species to be widely distributed, through
the dispersal of larvae, migration and aggregation (Roff & Zacharias, 2011). As referred
previously, genetic studies can provide valuable information about connectivity patterns
between populations; ocean currents could help to spatially predict how the connectivity
occurs (Roff & Zacharias, 2011). Therefore, the general pattern of oceanographic
surface circulation in our sampling distribution area is described below.

19
1.3.1. Northern Atlantic Ocean Surface Currents
North Atlantic Current (NAC) reaches the meridian zone of the North Atlantic
(Figure 2) divided in two main branches, one as a Northeast Drift Current called Eastern
North Atlantic Central Water Subpolar mode (ENACWsp), and the other one as a
Southeast Drift Current called Eastern North Atlantic Central Water subtropical
(ENACWst) mode. Between the NAC modes there is a transition zone, where the
Portugal Current System is formed (Pérez et al., 2001).
Figure 2- Surface circulation of the northern North Atlantic as derived from drift experiments (adapted from Krauss, 1986 in Pérez et al. (2001)). LC, Labrador Current; NAC, North Atlantic Current; GS, Gulf Stream; and PC, Portugal Current Meridionally-ruled area, flow associated with the NAC toward the north. Zonally-ruled area, flow associated with the northern limb of the Subtropical Front. Numbers are transports in Sverdrups (1 Sv"106m3 s~1).
This system is composed by a slow, offshore, basin scale equator-ward flow
(Portugal Current, PC) and a fast, Iberian slope scale, seasonally reversing coastal flow,
the Portugal Coastal Current. During Autumn/Winter, predominance of strong south-
southwest winds, favours coastal convergence of surface circulation northwards,
transporting warmer subtropical waters (ENACWst) over the upper slope and shelf
break (aprox. 200 m deep) and preventing the off-shelf export of coastal water masses
(Álvarez-Salgado et al., 2003). This surface poleward current is called the Portugal
Coastal Counter-current (PCCC) and it is driven by the large scale atmospheric pressure
distribution in the North Atlantic(Coelho et al., 2002) .
In late spring/summer, the increase in the pressure gradient between the Azores
and Portugal induces the formation of north/northwestern winds, shutting down the

20
PCCC, and originating instead, a coastal upwelling and a southward surface current in
the vicinity of the shelf break, the Portugal Coastal current (PCC). The PCC transports
recently up-welled cold and nutrient rich ENACWsp in the north (>45º N), and warmer
and nutrient poor ENACWst (<40º N) in the south.
However, recent studies ((Relvas et al., 2007; Nolasco et al., 2013) point out
evidences that PCCC ( in these studies designated as the Iberian poleward current, IPC)
is active during summer, suggesting interannual variability of the oceanographic
regimes in the Iberian Coast.
Also on the Portuguese coast an undercurrent mixed with ENACWst and
mediterranean outflow waters, extends vertically from 1500m to the bottom of surface
mixed layer (Ambar (1986) in Coelho et al., 2002) and moves poleward permanently
(Coelho et al., 2002). This subsurface occasionally reaches surface along the west and
southwest coast, particularly in winter (Álvarez-Salgado et al., 2003).
At the southeastern coast of Iberia (Figure 3), the Portuguese-Canary eastern
boundary currents moves eastward into the Gulf of Cadiz, performing a quasi-
permanent cyclonic eddy near the Cape of São Vicente, and moving further east towards
the Strait of Gibraltar, feeding the Atlantic inflow into the Mediterranean Sea (Criado-
Aldeanueva et al., 2006; García-Lafuente et al., 2006), and part, moves southward re-
joining the Canary current.
Figure 3 – Scheme of the surface circulations in the Southern Iberian Coast and the Portuguese-Canary eastern boundary current that veers eastward into the Gulf of Cadiz, and eventually feeding the Mediterranean Sea. N2 is a branch of the larger-scale Portuguese–Canary eastern boundary current; SVE is the Cyclonic eddy off Cape San Vicente; N1 is cyclonic circulation bounded by a shelf break front; CCC is a warmer coastal counter current. Source: Adapted from García-Lafuente et al. (2006).

21
On northeastern Africa, the Portugal current (PC) and the Azores current, will
feed the Canary Current (CC). This equator-ward, broad, yearlong surface flow, is
influenced by summer upwelling events, in response to the trade winds. Further south,
in the vicinity of the Cape Verde Islands, this current is divided curving toward the west
helping to create the North Equatorial Current (Batteen et al., 2000; Barton, 2001).
1.3.2. Mediterranean Sea-Overall Functioning
This semi-enclosed sea is strongly affected by evaporation, precipitation, and
river runoff (Millot & Taupier-letage, 2005). The Mediterranean Sea evaporation is the
core engine that promotes the entrance of Atlantic Waters (AW) through the Strait of
Gibraltar, in order to balance the difference in sea water levels between Northeastern
Atlantic Ocean and Mediterranean Sea.
When AW passes through Gibraltar strait is modified increasing density due to
evaporation, and suffering temperature changes due to climate seasonality. In winter,
Northwestern and Northeastern Mediterranean basins, suffer marked cooling and
evaporation, induced by cold dry air masses and strong northerly winds (Millot &
Taupier-Letage, 2005). AW sink and mix with denser waters underneath creating the
Levantine intermediate waters (LIW) and the Deep Mediterranean Waters (MWs).
Considering the volume of AW entering trough Gibraltar Strait, it is estimated
that 90% of this water mass forms the LIW and MWs (10% evaporates), showing an
average residence time of 50 to 100 years (Millot & Taupier-Letage, 2005). Finally,
these colder, saltier and denser MWs outflow and diverge deeper in the northern
Atlantic Ocean, where it can be recognised at 1000-1200 meters.
1.3.2.1.Western Mediterranean Sea Surface Currents
Western Mediterranean Sea (WMS) surface circulation is mainly driven by the
inflow of AW (i.e. Atlantic jet, AJ) through the Strait of Gibraltar, wind patterns
(André, G., P. Garreau, V. Vernier, 2005) orographic features and evaporation,
producing different circulation regimes, seasonally and inter-annually. Therefore, we
will consider in detail only the most prevailing circulation systems during summer and
early autumn, covering the main reproduction season and larvae dispersal phase of
Holothuria mammata.

22
The influx of AW moves firstly northeastwards due to the orientation of the
strait, and usually starts describing a year around persistent clockwise gyre in the west
of the Alborán Sea, designated by Western Anticyclonic Gyre (WAG) and a second,
less intense and recurrent clockwise gyre at east of Alborán Sea, called Eastern
Anticyclone Gyre (EAG). Both Gyres are separated by the Alborán Ridge, and confined
between the strait of Gibraltar at western limit and the Almeria-Orán front forming the
eastern limit of the Alborán circulation system (Renault et al., 2012).
Figure 4- The red line represents Almeria-Orán front. The red arrows represent the boundary of the Atlantic Jet. And the orange circles display the Western Anticyclonic Gyre (WAG) and the Eastern Anticyclonic Gyre (EAG) positions, the numbers 1, 2, 3 in parentheses refer to the Western Alborán basin, the Alborán ridge, and the Eastern Alborán basin, respectively. Adapted from Renault et al. (2012).
The WAG and EAG circulation regime prevails in summers months (Figure 4),
when AW kinetic energy (KE) is stronger, the single anticyclonic gyre (WAG) regime
is more recurrent in winter months, when KE decreases (Millot & Taupier-Letage,
2005; Renault et al., 2012). The Almeria-Orán frontal zone separates this relatively
fresh surface water mass with Atlantic origin, from the denser and modified
Mediterranean water mass of the Algerian basin (Renault et al., 2012).
After restructuring itself due to the Coriolis effect, (Millot & Taupier-Letage,
2005), the AJ forms two main branches, the first one which is predominant when the
EAG is well defined (i.e. in late Summer-early Autumn), flows into the Algerian sub-
basin forming the Algerian current (AC), and the second branch (Figure 5) that inflows
to the Northwestern sub-basin, through the Ibiza and Mallorca Channel, forming the
Balearic Current (BC). The AC flows from Alborán Sea to the east along continental

23
slope of northern coast of Africa (Sayol et al., 2013) and the BC flows along the
northwest coast of the Balearic Islands (Heslop et al., 2012).
Figure 5- The Balearic Sea with main currents Northern Current (NC), Balearic Current (BC) and AW inflows through the Ibiza and Mallorca Channels. A ‘blocking’ eddy (yellow circle dashed line) and the re-circulation of the NC above the eddy (yellow dashed line) are also indicated. Adapted from: Heslop et al. (2012).
The intensity of the EAG and Northern Current (NC) modulates the circulation
to the eastern (to form the AC) as well as the inflow of AW to the Northwestern sub-
basin (to form the BC), being only in summer when the NC decreases, that southern
waters progressively invade the Balearic sub-basin (Pinot et al., 2002; Sayol et al.,
2013).
The AC will generate wide cyclonic open sea eddies, some of them reaching the
Balearic Islands (Millot & Taupier-Letage, 2005), but will continue to transport AW
along slope, part through the western coast of Corsica forming the Corsica Vein, and the
other part through the Channel of Sardinia to form the Tyrrhenian vein and Eastern
Mediterranean vein (Figure 6). Both (Corsica, Tyrrhenian Vein) water masses will join
at the Lingurian sea, reorganizing itself again as the Western Basin Gyre. This gyre will
continue north-westerly along slope, forming the Northern Current near the Gulf of
Lions. This modified cold saline water mass, will proceed southward, closing its cycle
when exiting to the North Western sub-basin through the Ibiza channel, or/and being
retroflected cyclonically to form, along with the inflow of AW, the Balearic Current
(Sayol et al., 2013).

24
Figure 6 - Schematic representation of the main currents characterizing water circulation in the Western Mediterranean. Adapted from: Patarnello et al. (2007).
1.3.2.2. Eastern Mediterranean Surface Currents
After entering the Channel of Sicily, AW circulates southward, branching into
Tunisia coast and shelf veins, and a third inter-annual meandering vein that flows
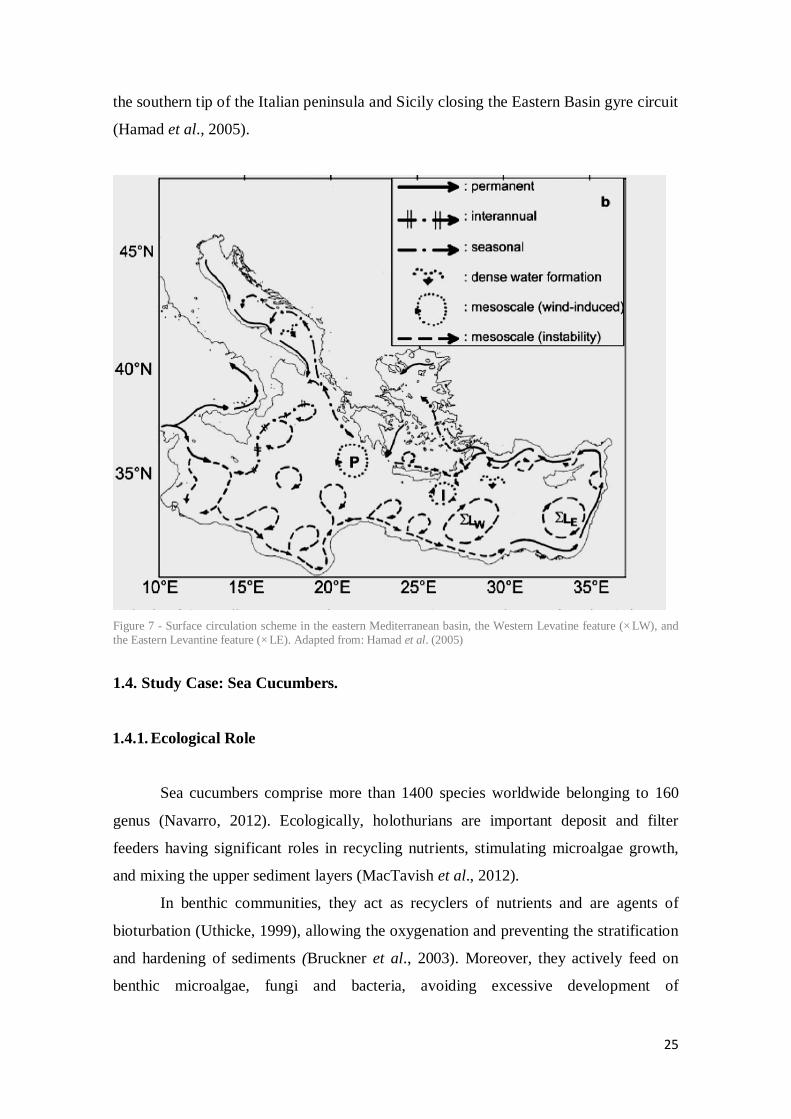
northerly into the Ionian Sea, forming mesoscales eddies (Figure 7) (Hamad et al.,
2005; Millot & Taupier-Letage, 2005). At Libia, both parts of Tunisian vein merge
hence becoming a Libyan vein, moving along slope in eastward direction. Instability
dominates the Libyan basin, promoting eddies that moves away from the Coast to
southern Ionian (Hamad et al., 2005). The “Libyo-Egyptian Current” develop
anticyclonic eddies, that moves and accumulate in the Western Levatine feature (∑LW).
Instability of the AW circulation in the Middle East slope, also promotes small scale
eddies that accumulate and decay in the Eastern Levantine feature (∑LE). From the
Turkish slope until the Rhode Island, the Asia Minor current generates meanders, some
of them evolving to small eddies (Millot & Taupier-Letage, 2005). The Eastern basin
gyre at the Rhode Island enters the Aegean Sea and divides into a Northwestern and a
Southwestern veins. The Northwestern vein flows along the Turkish slope most of the
year, except in summer, where a sub-vein flows southward due to Melten winds and
join the black sea outflow. The Southwestern vein moves along southern slope of Crete
until Ierapetra, but then it flows toward ∑LW and again around the eastern Levantine.
Therefore most of AW exits via the Aegean west of Crete. AW continues northwards
trough Ionian Sea, where it re-constitutes the eastern gyre before bifurcating into a
northern vein that penetrates into the Adriatic and mixes with river run-off and
eventually joins the westward vein that bypassed the Adriatic. Both ones continue along
25
the southern tip of the Italian peninsula and Sicily closing the Eastern Basin gyre circuit
(Hamad et al., 2005).
Figure 7 - Surface circulation scheme in the eastern Mediterranean basin, the Western Levatine feature (∑LW), and the Eastern Levantine feature (∑LE). Adapted from: Hamad et al. (2005)
1.4. Study Case: Sea Cucumbers.
1.4.1. Ecological Role
Sea cucumbers comprise more than 1400 species worldwide belonging to 160
genus (Navarro, 2012). Ecologically, holothurians are important deposit and filter
feeders having significant roles in recycling nutrients, stimulating microalgae growth,
and mixing the upper sediment layers (MacTavish et al., 2012).
In benthic communities, they act as recyclers of nutrients and are agents of
bioturbation (Uthicke, 1999), allowing the oxygenation and preventing the stratification
and hardening of sediments (Bruckner et al., 2003). Moreover, they actively feed on
benthic microalgae, fungi and bacteria, avoiding excessive development of

26
microorganisms, increasing the aerobic layer of sediments and avoiding eutrophication
(Uthicke, 1999; Hamel & Mercier, 2008).
Some sea cucumbers consume large quantities of suspension or sediment
organic matter, converging organic detritus and releasing nitrogenous compounds which
can be used by algae (Uthicke & Klumpp, 1998; Uthicke, 2001) and seagrasses
(Wolkenhauer et al., 2010), increasing their productivity, thus producing more available
food for herbivores (Uthicke, 2001). Removal of sea cucumbers in some habitats may
therefore reduce primary production for the whole food chain and negatively affect
sediment infauna by reducing the aerobic layer of sediments (Uthicke, 1999; Purcell,
2013). Some sea cucumbers showing suspensivorous feeding are also helping to
regulate water quality, carbonate content and pH of the water (Massin, 1982).
Holothurians are also important preys for fish, seastars and crustaceans (Francour,
1997).
1.4.2. Food Potential and Sea Cucumber Fisheries
The decline of several traditional fin-fisheries (Hutchings & Baum, 2005; Pauly
et al., 2005; Eldridge et al., 2009), brings our concern to one heavily exploited
invertebrate: sea cucumbers. They are also known as “beche-de-mer,” “trepang,” or
“haisom” and are mainly an Asiatic feeding custom, (Chen, 2003). They have been a
popular luxury food item in the Asian dried seafood markets for centuries (Purcell,
2013), but also considered as medicine (Chen, 2003) and aphrodisiac (Ramón et al.,
2010a). Holothurian nutritional profiles have demonstrated the presence of high protein
content, antioxidant and bioactive compounds (Bordbar et al., 2011; Roggatz, 2012) .
Records from their utilization can be traced back to 1368–1644 BC in China
(Chen, 2003) but during this last millennium the Indo-Pacific regions have started to
harvest and trade sea cucumbers driven primarily by the Chinese demand (Anderson et
al., 2011b). During the last 6 decades sea cucumber fisheries have grown exponentially
with an increase in global captures of 2300 tonnes of wet weight in 1950 to 30 500
tonnes of wet weight in 2006 (Conand & Bryne, 1993; Anderson et al., 2011b) and 100
000 tonnes in 2010 (FAO, 2010). In 2000, about 6 000 tonnes of processed (i.e. mostly
dried) animals were exported to Asian markets, having a value over 130 million US
dollars (FAO, 2010).
27
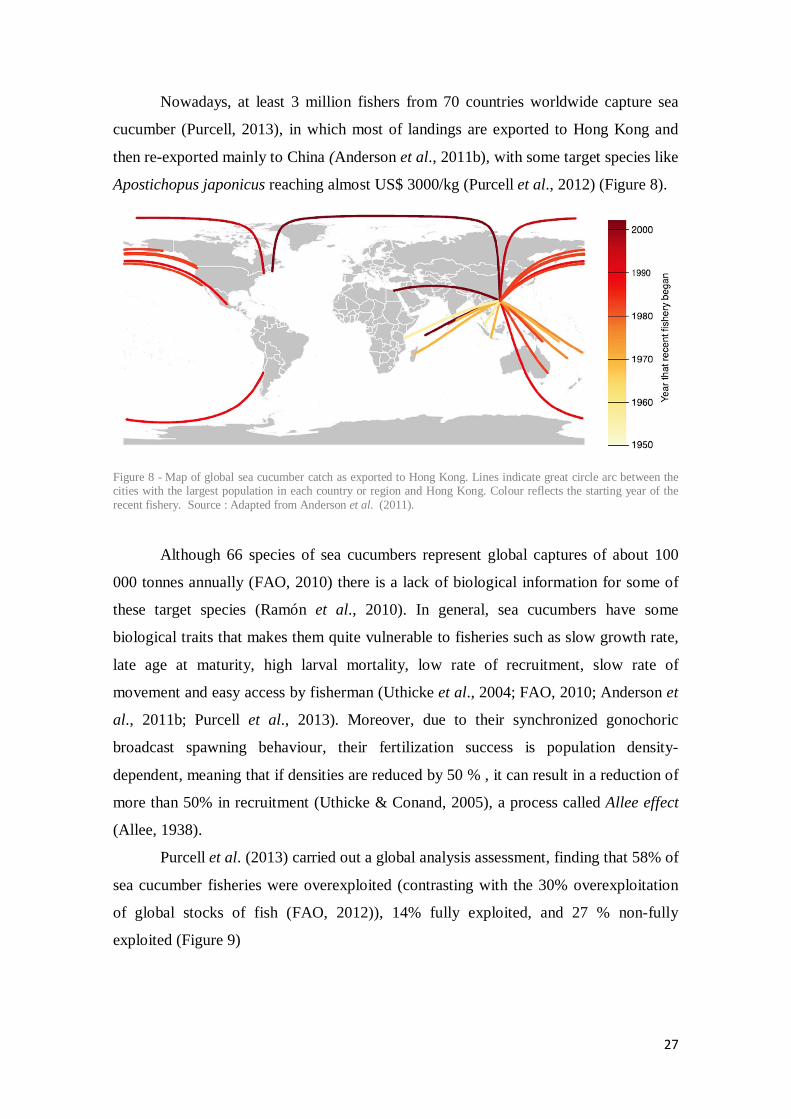
Nowadays, at least 3 million fishers from 70 countries worldwide capture sea
cucumber (Purcell, 2013), in which most of landings are exported to Hong Kong and
then re-exported mainly to China (Anderson et al., 2011b), with some target species like
Apostichopus japonicus reaching almost US$ 3000/kg (Purcell et al., 2012) (Figure 8).
Figure 8 - Map of global sea cucumber catch as exported to Hong Kong. Lines indicate great circle arc between the cities with the largest population in each country or region and Hong Kong. Colour reflects the starting year of the recent fishery. Source : Adapted from Anderson et al. (2011).
Although 66 species of sea cucumbers represent global captures of about 100
000 tonnes annually (FAO, 2010) there is a lack of biological information for some of
these target species (Ramón et al., 2010). In general, sea cucumbers have some
biological traits that makes them quite vulnerable to fisheries such as slow growth rate,
late age at maturity, high larval mortality, low rate of recruitment, slow rate of
movement and easy access by fisherman (Uthicke et al., 2004; FAO, 2010; Anderson et
al., 2011b; Purcell et al., 2013). Moreover, due to their synchronized gonochoric
broadcast spawning behaviour, their fertilization success is population density-
dependent, meaning that if densities are reduced by 50 % , it can result in a reduction of
more than 50% in recruitment (Uthicke & Conand, 2005), a process called Allee effect
(Allee, 1938).
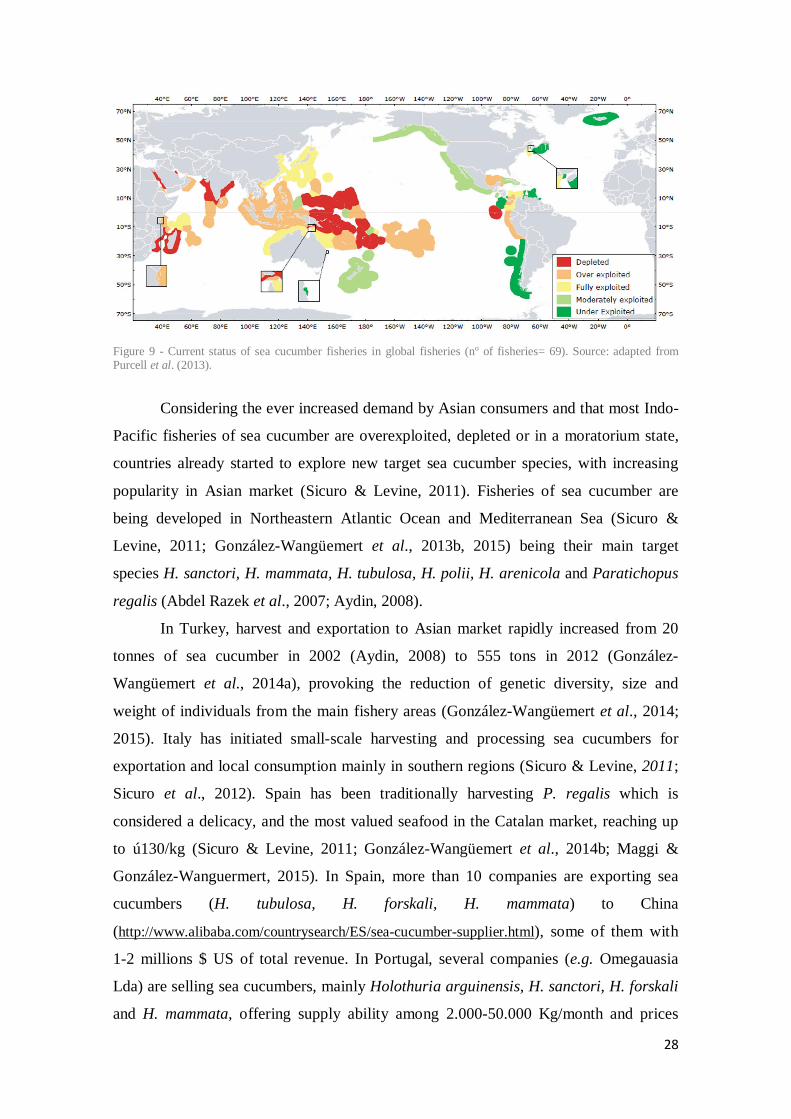
Purcell et al. (2013) carried out a global analysis assessment, finding that 58% of
sea cucumber fisheries were overexploited (contrasting with the 30% overexploitation
of global stocks of fish (FAO, 2012)), 14% fully exploited, and 27 % non-fully
exploited (Figure 9)
28
Figure 9 - Current status of sea cucumber fisheries in global fisheries (nº of fisheries= 69). Source: adapted from Purcell et al. (2013).
Considering the ever increased demand by Asian consumers and that most Indo-
Pacific fisheries of sea cucumber are overexploited, depleted or in a moratorium state,
countries already started to explore new target sea cucumber species, with increasing
popularity in Asian market (Sicuro & Levine, 2011). Fisheries of sea cucumber are
being developed in Northeastern Atlantic Ocean and Mediterranean Sea (Sicuro &
Levine, 2011; González-Wangüemert et al., 2013b, 2015) being their main target
species H. sanctori, H. mammata, H. tubulosa, H. polii, H. arenicola and Paratichopus
regalis (Abdel Razek et al., 2007; Aydin, 2008).
In Turkey, harvest and exportation to Asian market rapidly increased from 20
tonnes of sea cucumber in 2002 (Aydin, 2008) to 555 tons in 2012 (González-
Wangüemert et al., 2014a), provoking the reduction of genetic diversity, size and
weight of individuals from the main fishery areas (González-Wangüemert et al., 2014;
2015). Italy has initiated small-scale harvesting and processing sea cucumbers for
exportation and local consumption mainly in southern regions (Sicuro & Levine, 2011;
Sicuro et al., 2012). Spain has been traditionally harvesting P. regalis which is
considered a delicacy, and the most valued seafood in the Catalan market, reaching up
to €130/kg (Sicuro & Levine, 2011; González-Wangüemert et al., 2014b; Maggi &
González-Wanguermert, 2015). In Spain, more than 10 companies are exporting sea
cucumbers (H. tubulosa, H. forskali, H. mammata) to China
(http://www.alibaba.com/countrysearch/ES/sea-cucumber-supplier.html), some of them with
1-2 millions $ US of total revenue. In Portugal, several companies (e.g. Omegauasia
Lda) are selling sea cucumbers, mainly Holothuria arguinensis, H. sanctori, H. forskali
and H. mammata, offering supply ability among 2.000-50.000 Kg/month and prices
29
oscillating among 70-350 euro/kg (http://www.alibaba.com/countrysearch/PT/sea-
cucumber.html) depending on quality of product.
All these data show that sea cucumber fisheries in the Mediterranean Sea and
Northeastern Atlantic Ocean are starting to become an active industry. Given that most
sea cucumber fisheries worldwide have not had an effective management due to the lack
of biological, genetic and ecological data (among another reasons), it is mandatory to
initiate studies focused on these new target species of sea cucumbers from the
Mediterranean Sea and Northeastern Atlantic Ocean in order to assess their growth,
mortality rates, longevity, reproductive biology, larval duration, genetic diversity,
connectivity and genetic structure. All this information will allow a better understanding
of the sea cucumber population dynamics, fishery effects and the delimitation of their
stocks as management units.
1.4.3. Pharmacological Potential
Although the Chinese people have been using sea cucumber for medicinal
purposes since more than 3000 years (Chen, 2003), only recently it has been
demonstrated the antimicrobial, antioxidant, and anticancer potential of sea cucumbers
(Sicuro & Levine, 2011; Roggatz, 2012). New compounds are being discovered, such as
anti-malaria and anti-HIV therapy drugs (Sicuro & Levine, 2011) and also new
biochemical compounds for fighting cancer with less toxicity than traditional ones
(Attoub et al., 2013).
1.4.4. Integrated Multi-Trophic Aquaculture Potential
Aquaculture is one of the fastest-growing food producing sectors in the World,
providing almost half of all fish for human consumption, and it is projected to rise to 62
% in 2030 (FAO, 2014), a near future in which the human population is expected to
reach around 8.3 billion people (United Nations, 2013).
With increasing fishing pressure on wild stocks worldwide, responsible and
regulated aquaculture development seems a sustainable way of supplying part of the
demand from worldwide markets, releasing the pressure from wild populations and
supporting efforts to preserve natural populations. However, standard aquaculture
systems produce a large amount of particulate organic matter derived from unconsumed

30
feed, faeces and inorganic nutrient excretions (Troell et al., 2003; Slater & Carton,
2007; Yokoyama, 2013). This could result in excessive release of dissolved nutrients
into the water column, promoting harmful algal blooms and poisoning the farmed fish
and surroundings (Neori et al., 2004; Imai et al., 2006). Moreover the increased bio-
deposition below the fish cages is known to change the chemistry of the bottom
(Richardson, 2008; Yokoyama, 2013), shifting in most cases the composition of benthic
communities from oxygen sensitive species to opportunistic species (Troell et al.,
2003).
Integrated Multi-Trophic Aquaculture (IMTA) is a promising alternative that
reassures greater environmental stewardship while increasing economic benefits for
farmers and communities. The underlying principle is based on an ecosystem approach
and involves growing several commercial species, with different trophic levels but with
direct trophic linkage in the same system (Hughes & Kelly, 2006; Barrington et al.,
2009) . On this way uneaten feed, wastes, nutrients and by-products of fed species (e.g.
finfish, shrimp) could be recaptured and converted into fertilizer, feed and energy for
the growth of organic extractive species as filter feeders (e.g. mussels) and deposit
feeders (e.g. sea urchins, sea cucumbers) and inorganic extractive species (e.g. sea
weeds). IMTA has the advantage of providing diverse and safe food products (Neori et
al., 2004), extra income to farmers (Troell et al., 2003; Yokoyama, 2013) and
mitigation of the environmental impacts caused by aquaculture facilities, increasing the
carrying capacity of farming areas and consequentially improving the overall health of
the site with minimum potential risks to wild and cultured species (Rawson et al., 2002;
Barrington et al., 2009). Due to their ecological characteristics (i.e. filter and/or deposit
feeders), high global demand and alarming levels of overfishing, sea cucumbers are a
suitable candidate for co-culture in the recently developing IMTA systems (Slater &
Carton, 2007; Nelson et al., 2012; Yokoyama, 2013; Domínguez-Godino et al., 2015),
mainly because they can fill one of the main ecological niche of IMTA by filtering the
larger organic matter particles (Nelson et al., 2012).
1.5. Biological Model: Holothuria mammata (Grube, 1840)
Sea cucumbers are invertebrates from the phylum Echinodermata, having a
limbless soft bodied, with a cucumber form. The genus Holothuria belongs to family

31
Holothuriidae and is one of the most diverse genus in the Holothuroidea class (Borrero-
Pérez et al., 2010).
Figure 10 - Adult sea cucumber Holothuria mammata.
Holothuria mammata is a temperate species occurring throughout the
Mediterranean Sea and Northeast Atlantic Ocean, including the continental Atlantic
coast of Portugal and the Macaronesian Islands of the Azores, Madeira and Canary
Islands (Borrero-Pérez et al., 2009) (Figure 11).
Figure 11 - Geographical distribution of Holothuria mammata. Source: adapted from CUMFISH Webpage.
H. mammata coloration has scarce variation, with uniform dark purplish brown
in dorsal and ventral side and brighter tube feet and papillae (Figure 10). The ventral

32
side is densely covered by pedicles which are organized in 5 rows. The species has
small Cuvierian tubules but few in number and never expelled (Borrero-Pérez et al.,
2011; Navarro, 2012). Its lenght average is 23 cm, and may reach 35 cm in Canary
islands (Navarro et al., 2013), and ranged between 13 to 25cm in Ria Formosa
(Siegenthaler, 2013).
They can be normally found within rocks crevices showing mainly nocturnal
activity (Navarro, 2012; Navarro et al., 2013). Despite its rocky habitat preference, H.
mammata was also found on sandy/muddy bottoms with seagrass from Ria Formosa
coastal lagoon (Portugal), although showing low densities (González-Wangüemert et
al., 2013a; Siegenthaler, 2013).
Scarce information is available about the reproduction or larval duration on this
species. Santos (2013) established that the maximum sexual maturation state
(Gonadosomatic Index, GSI) of H.mammata from Peniche (W Portugal) is reached only
in April, suggesting a single annual spawning season in this region.
Recent breeding and rearing trials, showed that they have a broadcast spawning
behaviour in mid-summer with a planktotrophic larval cycle duration of 19 days until
the pentactula settlement stage (Dominguez-Godino, personal communication).
33
2. Objectives
The main purpose of this study is to characterize genetically populations of
Holothuria mammata from 8 localities, four of them belonging geographically to
Northeastern Atlantic, and the other ones to Mediterranean Sea. Its genetic diversity and
structure will be analysed considering several spatial scales.
Moreover, morphometric data (weight vs. length) will be studied through their
frequency distributions, in order to implement baseline data for future morphological
comparisons between stocks with different fishery pressure. This assessment will be
fundamental to initiate proper management policies in order to conserve this novel
target species. Therefore, this work is focused on these particular aims:
1. To evaluate the genetic diversity patterns of H. mammata through its
geographical distribution.
2. To assess the genetic structure of this target species at different spatial scales
considering the role of current and historical barriers to gene flow in several potential
genetic breaks: Atlantic and Mediterranean basins, Western and Eastern Mediterranean
Sea, geographical isolation of the oceanic islands (Canary archipelago) and isolation
among coastal vs. islands samples.
3. To establish the potential stocks present in our study area considering the
genetic and morphological data.
4. To estimate the effective size of H. mammata populations.
5. To evaluate the status of the target species by analysing the distribution of size
and weight classes of their populations.
6. To discuss potential impacts of fisheries on H. mammata under genetic and
morphological perspectives.
7. To suggest first recommendations towards sustainable management of the H.
mammata fishery in Mediterranean Sea and Northeastern Atlantic Ocean.
34
3. Methodology
3.1. Sampling
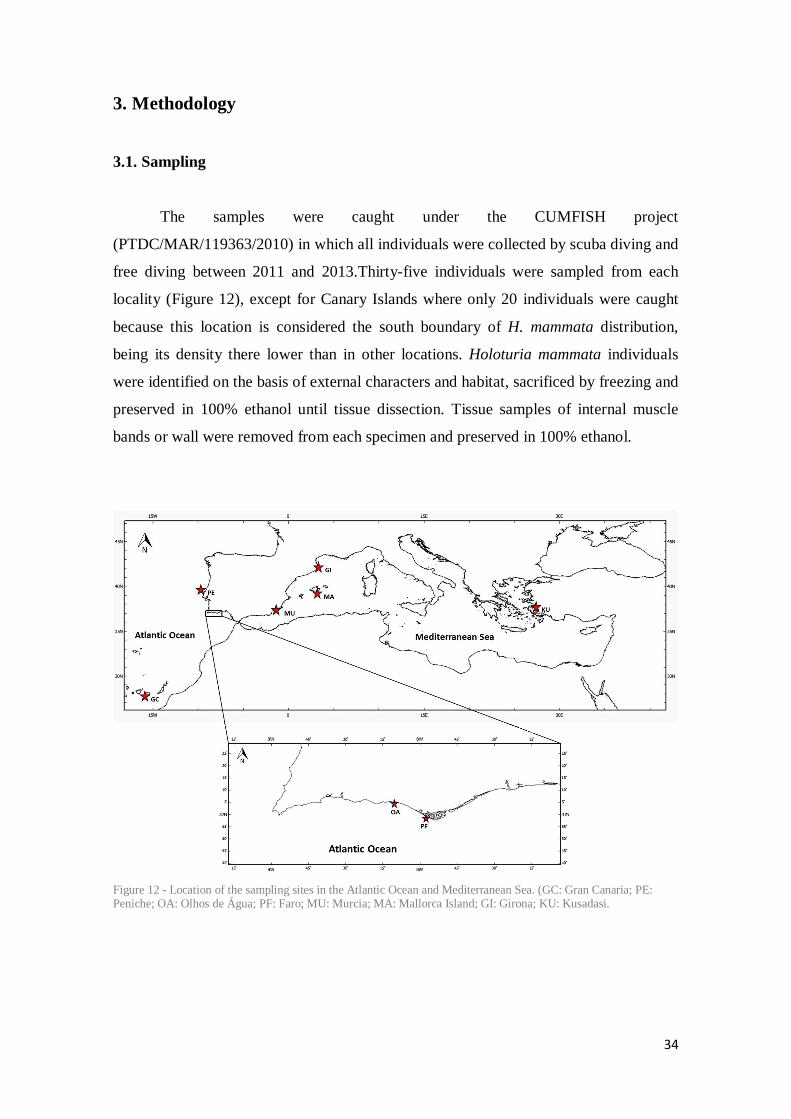
The samples were caught under the CUMFISH project
(PTDC/MAR/119363/2010) in which all individuals were collected by scuba diving and
free diving between 2011 and 2013.Thirty-five individuals were sampled from each
locality (Figure 12), except for Canary Islands where only 20 individuals were caught
because this location is considered the south boundary of H. mammata distribution,
being its density there lower than in other locations. Holoturia mammata individuals
were identified on the basis of external characters and habitat, sacrificed by freezing and
preserved in 100% ethanol until tissue dissection. Tissue samples of internal muscle
bands or wall were removed from each specimen and preserved in 100% ethanol.
Figure 12 - Location of the sampling sites in the Atlantic Ocean and Mediterranean Sea. (GC: Gran Canaria; PE: Peniche; OA: Olhos de Água; PF: Faro; MU: Murcia; MA: Mallorca Island; GI: Girona; KU: Kusadasi.
35
3.2. DNA Extraction, PCR Amplification and Screening
Total genomic DNA was extracted from muscle tissues according to the
procedure of Sambrook et al. (1989), with minor modifications.
The development of the Holothuria mammata specific primers for
microsatellites, was performed by Ecogenics™ from 15 samples belonging to different
locations. Size selected fragments from genomic DNA were enriched for SSR content
by using magnetic streptavidin beads and biotin-labeled CT and GT repeat
oligonucleotides. The SSR enriched library was analyzed on a Roche 454 platform
using the GS FLX titanium reagents.
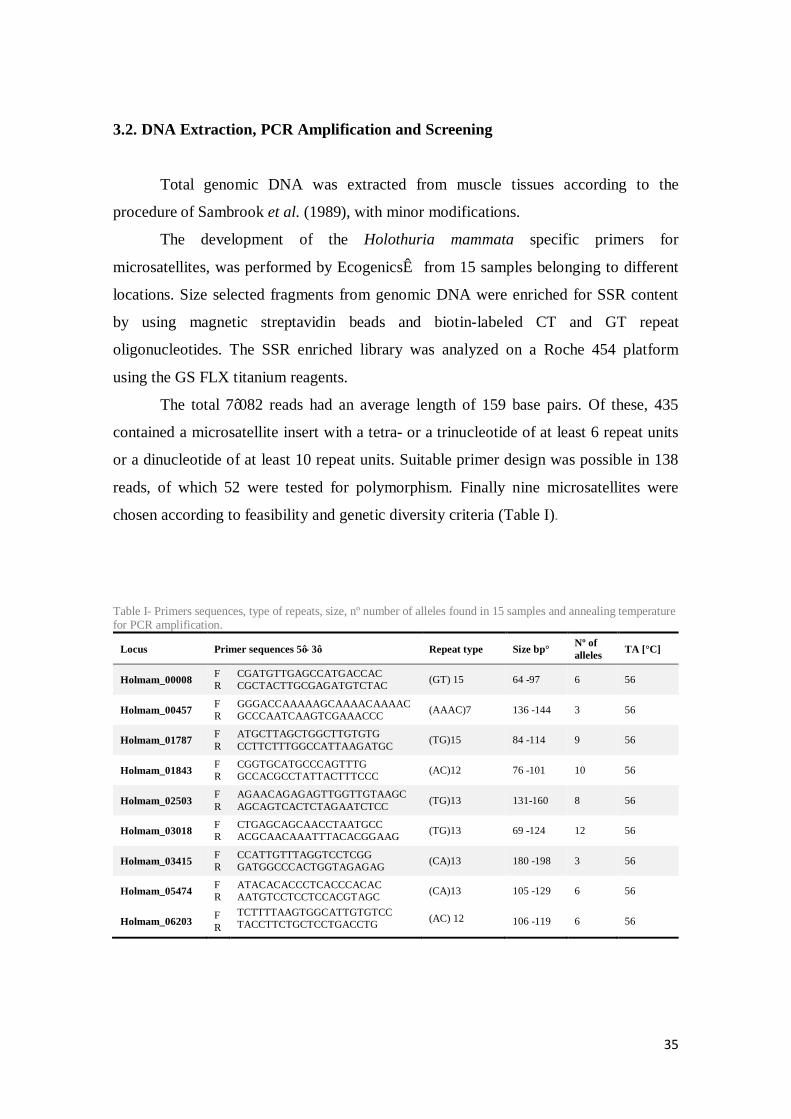
The total 7’082 reads had an average length of 159 base pairs. Of these, 435
contained a microsatellite insert with a tetra- or a trinucleotide of at least 6 repeat units
or a dinucleotide of at least 10 repeat units. Suitable primer design was possible in 138
reads, of which 52 were tested for polymorphism. Finally nine microsatellites were
chosen according to feasibility and genetic diversity criteria (Table I).
Table I- Primers sequences, type of repeats, size, nº number of alleles found in 15 samples and annealing temperature for PCR amplification.
Locus Primer sequences 5’- 3’ Repeat type Size bp° Nº of alleles TA [°C]
Holmam_00008 F R
CGATGTTGAGCCATGACCAC CGCTACTTGCGAGATGTCTAC (GT) 15 64 -97 6 56
Holmam_00457 F R
GGGACCAAAAAGCAAAACAAAAC GCCCAATCAAGTCGAAACCC (AAAC)7 136 -144 3 56
Holmam_01787 F R
ATGCTTAGCTGGCTTGTGTG CCTTCTTTGGCCATTAAGATGC (TG)15 84 -114 9 56
Holmam_01843 F R
CGGTGCATGCCCAGTTTG GCCACGCCTATTACTTTCCC (AC)12 76 -101 10 56
Holmam_02503 F R
AGAACAGAGAGTTGGTTGTAAGC AGCAGTCACTCTAGAATCTCC (TG)13 131-160 8 56
Holmam_03018 F R
CTGAGCAGCAACCTAATGCC ACGCAACAAATTTACACGGAAG (TG)13 69 -124 12 56
Holmam_03415 F R
CCATTGTTTAGGTCCTCGG GATGGCCCACTGGTAGAGAG (CA)13 180 -198 3 56
Holmam_05474 F R
ATACACACCCTCACCCACAC AATGTCCTCCTCCACGTAGC (CA)13 105 -129 6 56
Holmam_06203 F R
TCTTTTAAGTGGCATTGTGTCC TACCTTCTGCTCCTGACCTG (AC) 12 106 -119 6 56
36
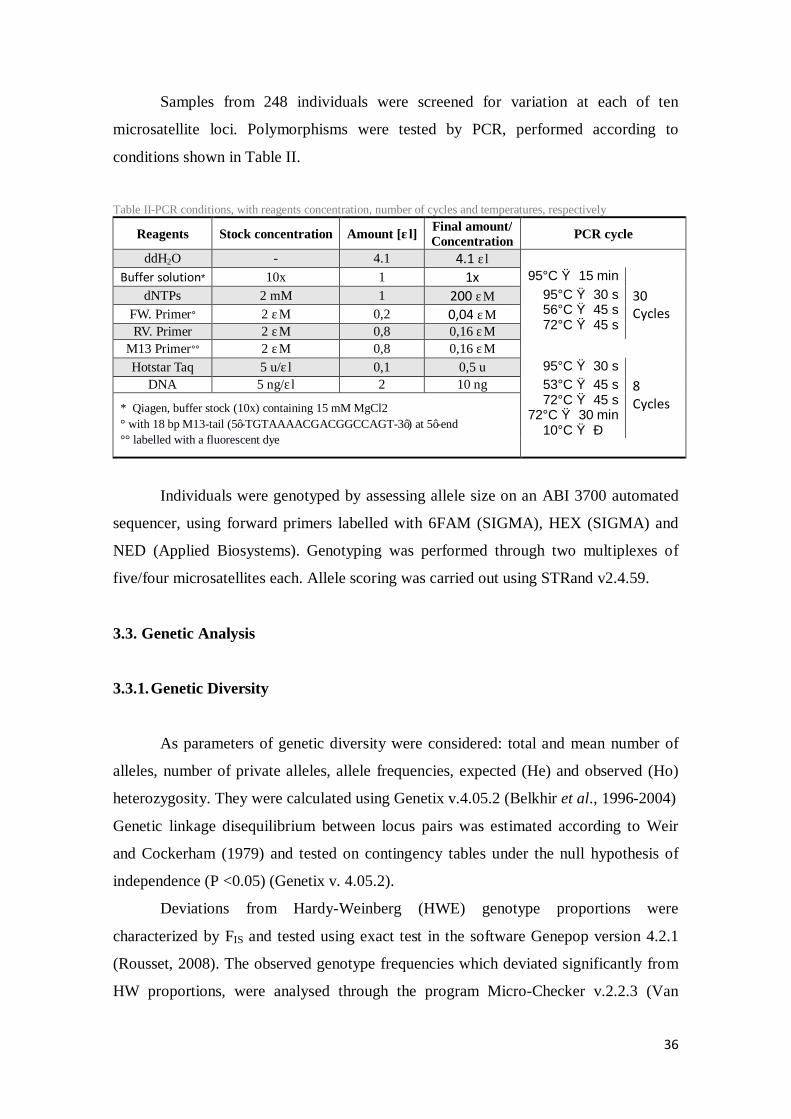
Samples from 248 individuals were screened for variation at each of ten
microsatellite loci. Polymorphisms were tested by PCR, performed according to
conditions shown in Table II.
Table II-PCR conditions, with reagents concentration, number of cycles and temperatures, respectively
Reagents Stock concentration Amount [μl] Final amount/ Concentration PCR cycle
ddH2O - 4.1 4.1 μl Buffer solution* 10x 1 1x 95°C → 15 min
dNTPs 2 mM 1 200 μM 95°C → 30 s 56°C → 45 s 72°C → 45 s
30 Cycles FW. Primer° 2 μM 0,2 0,04 μM
RV. Primer 2 μM 0,8 0,16 μM M13 Primer°° 2 μM 0,8 0,16 μM Hotstar Taq 5 u/μl 0,1 0,5 u 95°C → 30 s
DNA 5 ng/μl 2 10 ng 53°C → 45 s 72°C → 45 s 72°C → 30 min 10°C → ∞
8 Cycles * Qiagen, buffer stock (10x) containing 15 mM MgCl2
° with 18 bp M13-tail (5’-TGTAAAACGACGGCCAGT-3’) at 5’-end °° labelled with a fluorescent dye
Individuals were genotyped by assessing allele size on an ABI 3700 automated
sequencer, using forward primers labelled with 6FAM (SIGMA), HEX (SIGMA) and
NED (Applied Biosystems). Genotyping was performed through two multiplexes of
five/four microsatellites each. Allele scoring was carried out using STRand v2.4.59.
3.3. Genetic Analysis
3.3.1. Genetic Diversity
As parameters of genetic diversity were considered: total and mean number of
alleles, number of private alleles, allele frequencies, expected (He) and observed (Ho)
heterozygosity. They were calculated using Genetix v.4.05.2 (Belkhir et al., 1996-2004)
Genetic linkage disequilibrium between locus pairs was estimated according to Weir
and Cockerham (1979) and tested on contingency tables under the null hypothesis of
independence (P <0.05) (Genetix v. 4.05.2).
Deviations from Hardy-Weinberg (HWE) genotype proportions were
characterized by FIS and tested using exact test in the software Genepop version 4.2.1
(Rousset, 2008). The observed genotype frequencies which deviated significantly from
HW proportions, were analysed through the program Micro-Checker v.2.2.3 (Van

37
Oosterhout et al., 2004) in order to infer the most probable causes for those deviations.
Since Micro-Checker' main assumption of HW equilibrium, overestimates null allele
frequencies when there is natural inbreeding populations (i.e. when populations are not
in HW proportions), estimations of null allele frequency for each population and locus
was obtained through the Expectation Maximization (EM) algorithm of Dempster et al.
(1977) implemented in FreeNA software (Chapuis & Estoup, 2007). Also, FreeNA was
used for evaluating possible differences between estimations of global and pairwise FST
values including (i.e. INA) and excluding null alleles (i.e. ENA), in order to decide the
feasibility of adjusting genotypes in the data set.
To distinguish the natural inbreeding of the species from the presence of null
alleles, INEST software v1.0 (Chybicki & Burczyk, 2009), was used, which uses an
individual inbreeding approach model (IIM) to estimate simultaneously null allele
frequencies at each locus and the average level of natural intra-population inbreeding. In
order to use IIM model, 500 000 Markov Chain Monte Carlo (MCMC) iterations, 10
000 n-th updates (i.e. thinning), and a burn-in period of 50 000 were used. Then, it was
performed a Bayesian procedure of model comparison. For this purpose INEST
computes Deviance Information Criterion (DIC) for each model; according with
Chybicki & Burczyk (2009), the lowest DIC is corresponding with the model best
fitting to data.
3.3.2. Genetic Structure
Microsatellites markers are very variable, therefore a set of statistical approaches
to assess the spatial genetic structure of H. mammata was used. First, the quantification
of the differentiation among locations through FST (i.e. using the estimator θ of Weir &
Cockerham (1984)) was performed in Arlequin version 3.5 (Excoffier & Lischer, 2010),
and then we tested the allele-frequency heterogeneity using an exact test and the p-
values to check the significance of genetic differentiation.
Tests of genic and genotypic differentiation (i.e. G-based) for all pairs of
populations (Raymond & Rousset 1995a; Goudet et al. 1996) were performed on
GENEPOP version 4.2.1 (Rousset, 2008). Cavalli-Sforza distances were also computed
between pairwise samples. Levels of statistical significance were adjusted according to
a sequential Bonferroni correction for multiple comparisons (Rice, 1989).

38
Genetic differences were also analysed using a principal component analysis
(PCA) on the allelic frequencies y She et al. (1987) and implemented with the “ade4”
package (Chessel et al., 2004) in R software (R Development Core Team, 2013).
An analysis of molecular variance (AMOVA) was carried out to assess the
component of genetic diversity attributable to (i) variance between regions/groups; (ii)
variance among populations within regions/ groups; (iii) variance within populations.
First, Mediterranean and Atlantic basins were considered as groups and later “coastal”
and “islands” groups. Also we considered edges and central geographical groups, and
accordingly with FST results we grouped non-differentiated populations. Finally it was
grouped populations according to biogeographic criteria. Arlequin v3.5 software was
used to carry out these analyses.
Population structure was also inferred using STRUCTURE v.2.2 software by the
method of Pritchard et al. (2000) from multilocus genotype data. Each K was replicated
10 times for 100 000 iterations after a burn-in period of 50 000, using sampling
locations as prior information to assist clustering. Each simulation was performed using
1) the admixed ancestry model and 2) the correlated allele frequencies model.
STRUCTURE results were analysed in the program STRUCTURE HARVESTER
v0.6.94 (Earl & vonHoldt, 2012), to calculate the ad-hoc ∆K statistic suggested by
Evanno et al. (2005), which takes into account the change in the log probability of the
data, in order to choose the number of clusters that best fit the data.
3.3.3. Gene Flow
To assess potential connectivity patterns on this species, isolation by distance,
the coefficient of correlation between genetic and geographic/oceanographic distances
was calculated using the Mantel test (10,000 permutations; Mantel, 1967) implemented
in Genetix software. The geographical distance (km) was computed as the coastline
distance between continental sampled locations and as the straight geographical distance
for island populations. The oceanographic distances (Km), was computed according to
the main oceanographic surface currents.
To study gene flow among localities, migration rates based on maximum
likelihood was obtained with the program MIGRATE v. 3.2.7 (Beerli & Felsenstein,
2001;). MIGRATE uses a Markov Chain Monte Carlo based (MCMC) approach to
explore all possible gene genealogies, providing estimates of the population size and
39
migration rates accordingly with the data. The MCMC run consisted of 10 short chains
(sampling 50 000 trees) and one long chain (sampling 500 000 trees) with a burn-in
period of 10 000 trees.
For a better understanding of gene flow pattern between the sampled localities
an assignment test was conducted using GeneClass2 software v.2.0 (Piry et al., 2004) to
determine the most likely geographic origin of each individual using a frequency based
method (Paetkau et al., 1995) .
3.3.4. Bottlenecks
Previous studies using mtDNA markers have demonstrated changes in H.
mammata population sizes (Borrero-Pérez et al., 2011). For this reason, we tested the
presence of recent population bottlenecks at our samples in the last 2Ne-4Ne
generations (Cornuet & Luikart, 1996). Bottlenecks can be detected by the depletion of
allele number and a transient heterozygosity excess. We used the Sign and Wilcoxon
tests implemented in the program Bottleneck v.1.2.2 (Piry et al., 1999). Computations
were based on the infinite allele model (IAM) and the two phase model (TPM).
3.3.5. Selection
To assess whether any microsatellites loci are under selection, LOSITAN
software v. 1.0.0 was used (http://popgen.eu/soft/lositan/) (Antao et al., 2008). This
program evaluates the relationship between FST and expected heterozygosity (HE) to
identify outlier loci. We performed 75 000 simulations with ‘neutral mean FST’ and
‘force mean FST’, to increase the reliability of the mean FST and the entire microsatellite
dataset under the Infinite Allele Model (IAM) and Stepwise Mutation Model (SMM).
We choose confidence intervals of 99% to carry out a more conservative test for
selection.
3.4. Morphometry Analysis
The total length (TL) and eviscerated weight (EW) for each individual with an
accuracy ±0.1cm and ±0.1g respectively were registered. To improve the accuracy of
the measures, the weight was registered after the death, evisceration and total cleaning

40
of the sea cucumbers. 298 individuals of H. mammata from 8 sampling localities were
used for morphometric analysis. Regarding the measurements from Kusadasi (Turkey),
length was measured after evisceration by Dr. Mehmet Aydin (Ordu University,
Turkey), instead of registering the length when specimens were alive. Therefore, to
compare the data from this locality with the other ones, we obtained an estimated length
(i.e. length measurement before death) from the length-weight relationship resulting
from all the length-weight data of individuals collected from the other localities
included in this study (W = 5.62L – 31.01).
The mean length and weight for each population/region is represented through
bar graphics. Length-weight relationship (LWR) was established using the linear
regression analysis where EW= a + b (TL), in which a is the intercept of the regression,
and b the slope (i.e. growth coefficient). The significance of the regression was assessed
by F-statistic, and the b-value for each species was tested by the t-test to check if it was
significantly different from the isometric growth (i.e. b=3). When b is different from 3 it
reflects an allometric growth, which could be positive (i.e. when b > 3) or negative (i.e.
when b < 3) (Sokal & Rohlf, 1981). Data from Kusadasi (Turkey) were disregarded for
LWR analyses, since it would bias results towards a linear relationship between
eviscerated weight data and estimated length.
One-way ANOVA was used to test differences in length and weight among
localities and between Atlantic vs. Mediterranean regions, considering “locality /
region” as factors. Pairwise comparisons followed by Bonferroni adjustment were used
to determine which group differences were statistically significant. All the analysis were
performed in R statistic software (R Development Core Team, 2013).

41
4. Results 4.1. Genetic Diversity and Linkage Disequilibrium
All nine microsatellites revealed high polymorphism (Table III), with a total of
199 different alleles. Number of alleles per locus ranged from 13 at Holmam_00457 to
31 at Holmam_05474.
Table III: Primers sequences, type of repeats, size, nº number of alleles and annealing temperature for PCR amplification.
Locus Primer sequences 5’- 3’ Repeat type Size (bp) Nº of alleles
TA [°C]
Holmam_00008 F R
CGATGTTGAGCCATGACCAC CGCTACTTGCGAGATGTCTAC (GT) 15 61 -105 21 56
Holmam_00457 F R
GGGACCAAAAAGCAAAACAAAAC GCCCAATCAAGTCGAAACCC (AAAC)7 132 -176 13 56
Holmam_01787 F R
ATGCTTAGCTGGCTTGTGTG CCTTCTTTGGCCATTAAGATGC (TG)15 87 -151 28 56
Holmam_01843 F R
CGGTGCATGCCCAGTTTG GCCACGCCTATTACTTTCCC (AC)12 69 -119 21 56
Holmam_02503 F R
AGAACAGAGAGTTGGTTGTAAGC AGCAGTCACTCTAGAATCTCC (TG)13 130-190 19 56
Holmam_03018 F R
CTGAGCAGCAACCTAATGCC ACGCAACAAATTTACACGGAAG (TG)13 71 -155 29 56
Holmam_03415 F R
CCATTGTTTAGGTCCTCGG GATGGCCCACTGGTAGAGAG (CA)13 185 -217 16 56
Holmam_05474 F R
ATACACACCCTCACCCACAC AATGTCCTCCTCCACGTAGC (CA)13 71 -167 31 56
Holmam_06203 F R
TCTTTTAAGTGGCATTGTGTCC TACCTTCTGCTCCTGACCTG (AC) 12 104 -144 21 56
Considering all populations (Table V), mean allelic richness for Holothuria
mammata was 22.1 alleles, with Murcia (SE Spain) and Kusadasi (Turkey) showing the
highest values (14.2 and 13.7, respectively) and Gran Canaria (SW Spain) presenting
the lowest one (9.7), probably due to smaller sample size (Table V). We found 42
private alleles in total, with Kusadasi being the population with more private alleles (8)
and Gran Canaria and Peniche, the localities with lower values (2 and 3 respectively) .
The observed and expected heterozygosity ranged from 0.501 (Olhos de Água. S
Portugal) to 0.711 (Kusadasi, S Turkey) and from 0.758 (Faro, S Portugal) to 0.811
(Mallorca, E Spain), respectively. Inbreeding coefficient (FIS) was positive and
statistically significant in all sampling locations, indicating a possible deficit of
heterozygotes (deviation from Hardy Weinberg equilibrium, HWE) (Table V).
Analysis of the most probable causes for deviations of HWE using Micro-
Checker software, disregarded stuttering and large allele dropout, however several loci
presented evidence for null alleles. Therefore, it was used freeNA software in order to
compare FST values (Weir, 1996) from the original data set, and FST value obtained from

42
corrected data for null alleles, estimated by the ENA method ( Chapuis & Estoup
(2007). There was no bias due to null alleles, as assessed when comparing ENA (i.e.
excluding null alleles) global FST (0.0081) with INA (i.e. including null alleles) global
FST (0.0089). Pairwise FST values (Table IV) with the INA and ENA showed similar
trend, so we maintained the original data set for further analyses.
Table IV-Estimates of FST values (Weir, 1996) for each pair of Holothuria mammata populations considering (above diagonal) and not using (below diagonal) the ENA correction described in Chapuis and Estoup (2007). Localities PE OA FA GC MU MA GI KU Peniche (PE) -------- 0.003 0.006 0.003 0.006 0.006 0.015 0.022 Olhos de Água (OA) 0.002 -------- 0.002 0.008 0.002 0.000 0.012 0.021 Faro (FA) 0.002 0.000 -------- 0.000 0.002 0.006 0.016 0.021 Gran Canaria (GC) 0.000 0.002 0.000 -------- 0.009 0.007 0.015 0.023 Murcia (MU) 0.007 0.000 0.001 0.008 -------- 0.000 0.007 0.013 Mallorca (MA) 0.005 0.000 0.005 0.003 0.000 -------- 0.006 0.013 Girona (GI) 0.018 0.012 0.019 0.017 0.007 0.005 -------- 0.011 Kusadasi (KU) 0.026 0.019 0.024 0.026 0.013 0.011 0.010 --------
In order to better understand the significant positive FIS values, INEST was used
(Table V). The FIS (obtained by INEST software) was positive in Gran Canaria and
Mallorca, with values of 0.264 and 0.140 respectively and in Peniche with 0.110. The
INEST model with the best fitting in Peniche and Mallorca, is considering the presence
of null alleles and inbreeding. For Gran Canaria, the best model indicated that the
inbreeding estimate calculated is due to populations' inbreeding and some genotyping
errors. The model for the other localities, indicated null alleles as the only factor
explaining the excess of homozygotes: the FIS (INEST) was null on these populations
(Table V).
Table V-Estimates of genetic diversity of the 8 sampling sites of Holothuria mammata from the Mediterranean Sea and Northeastern Atlantic Ocean.
Pop. Sample size Alleles Allelic
Richness Private alleles Ho He FIS
GENEPOP HPDl<FIS <HPDh
INEST M PE 33 112 12.4 3 0,527 0,785 0.332* 0.000<0.110<0.273 n/f OA 32 112 12.4 4 0,501 0,790 0.369* 0.000<0.000<0.000 n FA 33 116 12.8 7 0,590 0,758 0.224* 0.000<0.000<0.000 n GC 19 88 9.7 2 0,562 0,760 0.265* 0.191<0.264<0348 f/b MU 33 128 14.2 6 0,613 0,807 0.243* 0.000<0.000<0.000 n MA 33 111 12.3 5 0,567 0,811 0.303* 0.023<0.140<0.257 n/f GI 31 110 12.2 7 0,593 0,796 0.258* 0.000<0.000<0.000 n/b KU 33 124 13,7 8 0,711 0,799 0.112* 0.000<0.000<0.000 n
Total 247 199 22.1 42 0.585 0.797 0.267* 0.009<0.044<0.092 n/f HO: observed heterozygosity; HE: expected heterozygosity; FIS: deviation from Hardy–Weinberg proportions. * P<0.001. FIS (INEST) is the mean unbiased inbreeding coefficient taking into account null alleles, and genotyping errors. M is the INEST model which best fit the data: n=null alleles, f=inbreeding, b=genotyping error. HPDl / HPDh is the 95% highest posterior density interval.

43
Girona (NE Spain) and Faro (S Portugal) localities presented linkage
disequilibrium between two loci, Holmam_01787 and Holmam_02503. Also,
Holmam_01787 and Holmam_03018 loci presented linkage disequilibrium in Olhos de
Água (S Portugal) and all Western Mediterranean populations (i.e. Murcia, Mallorca
and Girona).
When a larger spatial scale was considered in order to analyse the genetic
diversity pattern, interesting results were found: higher values on allelic richness (20.1
vs. 18.1), number of private alleles (35 vs. 19) and heterozygosity (0.62 vs 0.54) were
registered in the Mediterranean region than the Atlantic one (Table VI).
Table VI-Estimates of genetic diversity of Holothuria mammata between the Mediterranean Sea and Northeastern Atlantic Ocean regions
Regions Sample size Alleles Allelic
Richness Private alleles Ho He FIS
GENEPOP HPDl<FIS <HPDh
INEST M ATL 117 163 18.1 19 0.54 0.77 0.301*** 0.000<0.000<0.000 n
MED 130 181 20.1 35 0.62 0.81 0.233*** 0.000<0.000<0.000 n HO: observed heterozygosity; HE: expected heterozygosity; FIS: deviation from Hardy–Weinberg proportions. * P<0.001. FIS (INEST) is the mean unbiased inbreeding coefficient taking into account null alleles, and genotyping errors. M is the INEST model which best fit the data: n=null alleles, f=inbreeding, b=genotyping error. HPDl / HPDh is the 95% highest posterior density interval.
Among the 10 polymorphic loci, Holmam_05474 appears as candidate for
positive selection in both mutation models.
Figure 13 - Comparison of FST and He in polymorphic loci of Holothuria mammata to identify outliers and potential candidates for selection using LOSITAN software under the IAM. Graphical output shows the simulated confidence area for neutral loci (pale grey shading), positive selection (red area) and balancing selection (yellow bottom area). Loci outliers are tagged with labels. Locus Holmam_05474 is candidate for positive selection.

44
Figure 14 - Comparison of FST and He in polymorphic loci of Holothuria mammata to identify outliers and potential candidates for selection using LOSITAN software under the SMM. Graphical output shows the simulated confidence area for neutral loci (pale grey shading), positive selection (red area) and balancing selection (yellow bottom area). Loci outliers are tagged with labels. Locus Holmam_05474 is candidate for positive selection
4.2. Genetic Structure
The pairwise FST estimates for the 8 populations (Table VII), ranged from 0
(between Olhos de Água & Mallorca and Murcia & Mallorca) to 0.030 (between
Kusadasi and Gran Canaria). Significant differentiation (FST) was found between
Kusadasi and all sampling localities. Girona was also significantly different when
compared with all populations excepting with Mallorca (FST=0.009; p=0.095), that only
showed significant differentiation with Peniche and Kusadasi (Table VII). Murcia
presented significant differentiation with Gran Canaria and Peniche from Atlantic
Ocean, and with Girona and Kusadasi from Mediterranean Sea.
Although we found positive values of pairwise FST, no significant differentiation
was found between Atlantic sampling localities (p>0.12). After sequential Bonferroni
correction, significant differentiation was only found when comparing Kusadasi
(Eastern Mediterranean) with all Atlantic Sea localities, and Girona with Peniche, Faro
and Gran Canaria (Table VII). Table VII: Pairwise fixation indices (FST) between 8 sampling localities of Holothuria mammata (below diagonal) and respective p-values (above diagonal). Localities PE OA FA GC MU MA GI KU Peniche (PE) -------- 0.117 0.141 0.393 0.021* 0.039* 0.000* 0.000* Olhos de Água (OA) 0.008 -------- 0.706 0.175 0.462 0.866 0.011* 0.000* Faro (FA) 0.007 0.001 -------- 0.529 0.300 0.105 0.000* 0.000* Gran Canaria (GC) 0.007 0.011 0.003 -------- 0.033* 0.131 0.000* 0.000* Murcia (MU) 0.012 0.003 0.004 0.015 -------- 0.985 0.039* 0.003* Mallorca (MA) 0.011 0.000 0.008 0.011 0.000 -------- 0.095 0.013* Girona (GI) 0.023 0.017 0.024 0.025 0.011 0.009 -------- 0.002* Kusadasi (KU) 0.027 0.020 0.024 0.030 0.014 0.012 0.014 -------- * FST with significant values (P<0.05). Significant values after sequential Bonferroni correction are indicated in bold.

45
Since, H. mammata is present in the Mediterranean Sea and Atlantic Ocean, we
tested if both regions (considering a larger spatial scale) are showing significant genetic
differentiation such as it was demonstrated by other marine species. Our results (Table
VIII) showed low but highly significant genetic differentiation among regions.
Table VIII- Pairwise fixation indices (FST), (below diagonal) and respective p-values (above diagonal).
Regions Atlantic Ocean Mediterranean Sea Atlantic Ocean ----------- 0.0000* Mediterranean Sea 0.0097 -------------
Pairwise estimates of genic and genotypic differentiation were also calculated
(Table IX). Twenty-six of 28 pairwise genic comparisons (92.8%) were significantly
different across all loci. The genic differentiation was not significant between two
population pairs: Faro with Gran Canaria and Murcia with Mallorca. These same
population pairs did not presented significant genotypic differentiation. Genotypic
differentiation tests presented less significant differentiation (53.5%) than genic tests.
Both genic and genotypic differentiation (highly significant with p ≤0.001) was found
between: 1) Kusadasi with all Atlantic populations (i.e. Faro, Gran Canaria, Olhos de
Água and Peniche); 2) Girona with all Atlantic populations; 3) Peniche with Mallorca.
When considering both genic and genotypic differentiation, Kusadasi was significantly
differentiated from all Western Mediterranean localities (MU, GI, MA). Some close
Mediterranean localities, such as Mallorca and Girona, were both genic and genotypic
differentiated. Genic and genotypic differentiation between some Atlantic and
Mediterranean localities was also detected, such as Faro with Mallorca, Peniche and
Murcia. No genotypic differentiation was registered between Atlantic populations. . Table IX-Total genic and genotypic differentiation between populations.
Population pair Genic Genotypic
X2 P-value X2 P-value
PE & OA 53.1819 0.0000*** 24.1975 0.1486 PE & FA 35.9686 0.0071** 18.8824 0.3990 OA & FA 34.0469 0.0124* 16.7399 0.5410 PE & GC 32.3995 0.0197* 14.1606 0.7185 OA & GC 51.5729 0.0000*** 24.6982 0.1334 FA & GC 26.3385 0.0922 14.7107 0.6817 PE & CC ∞ 0.0000*** 38.1237 0.0037** OA & CC 43.6410 0.0006*** 22.6735 0.2034 FA & CC 41.9650 0.0011** 21.8335 0.2394
* FST with significant values (P<0.05). Sign. values after sequential Bonferroni correction are indicated in bold.

46
GC & MU 45.2581 0.0003*** 26.0105 0.0995 PE & MA ∞ 0.0000*** ∞ 0.0000*** OA & MA 43.1733 0.0007*** 21.7408 0.2436 FA & MA ∞ 0.0000*** 36.8643 0.0054** GC & MA 45.1418 0.0003*** 26.0245 0.0991 MU & MA 25.0501 0.1235 13.0399 0.7891 PE & GI ∞ 0.0000*** ∞ 0.0000*** OA & GI 65.1538 0.0000*** 43.1641 0.0007*** FA & GI ∞ 0.0000*** ∞ 0.0000*** GC & GI 79.4786 0.0000*** 48.0274 0.0001*** MU & GI 43.4457 0.0006*** 25.1404 0.1210 MA & GI 50.0020 0.0000*** 29.8102 0.0393* PE & KU ∞ 0.0000*** ∞ 0.0000*** OA & KU 83.8830 0.0000*** 67.6200 0.0000*** FA & KU ∞ 0.0000*** ∞ 0.0000*** GC & KU ∞ 0.0000*** 53.8369 0.0000*** MU & KU 49.1747 0.0001*** 31.2676 0.0268* MA & KU 55.0049 0.0000*** 37.2653 0.0048** GI & KU 57.7138 0.0000*** 41.9264 0.0011**
P-value for each population pair across all loci (Fisher’s method). Significance of p codes: *0.01<p<0.05; **0.001<p<0.01;***p<0.001
The STRUCTURE software (Figure 15) identified two genetically differentiated
clusters corresponding to Atlantic and Mediterranean regions, as the peak in ∆K was for
K=2. These populations are consistent with the FST values obtained. A gradient of
admixture between populations is observed, being this gradient lower in Eastern
Mediterranean region (Kusadasi, KU). Considering the Atlantic localities, Olhos de
Água (S Portugal) is showing the higher Mediterranean admixture.
Figure 15 - Summary plot of estimates of Q at K=2. Each individual is represented by a single vertical line broken into K coloured segments, with lengths proportional to each of the K inferred clusters. The abbreviations correspond to the predefined populations.
The pattern of differentiation between sampled localities was studied trough
Mantel correlation to establish the relationships among FST values and
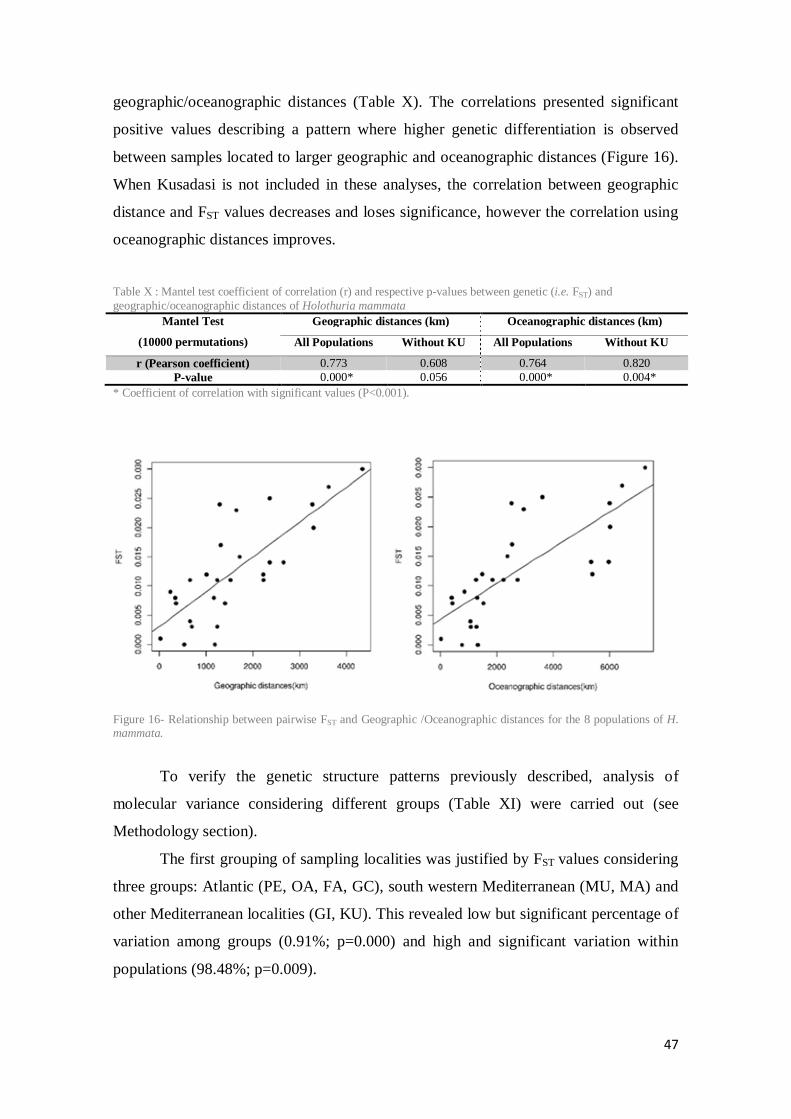
47
geographic/oceanographic distances (Table X). The correlations presented significant
positive values describing a pattern where higher genetic differentiation is observed
between samples located to larger geographic and oceanographic distances (Figure 16).
When Kusadasi is not included in these analyses, the correlation between geographic
distance and FST values decreases and loses significance, however the correlation using
oceanographic distances improves.
Table X : Mantel test coefficient of correlation (r) and respective p-values between genetic (i.e. FST) and geographic/oceanographic distances of Holothuria mammata
Mantel Test
(10000 permutations)
Geographic distances (km) Oceanographic distances (km) All Populations Without KU All Populations Without KU
r (Pearson coefficient) 0.773 0.608 0.764 0.820 P-value 0.000* 0.056 0.000* 0.004*
* Coefficient of correlation with significant values (P<0.001).
Figure 16- Relationship between pairwise FST and Geographic /Oceanographic distances for the 8 populations of H. mammata.
To verify the genetic structure patterns previously described, analysis of
molecular variance considering different groups (Table XI) were carried out (see
Methodology section).
The first grouping of sampling localities was justified by FST values considering
three groups: Atlantic (PE, OA, FA, GC), south western Mediterranean (MU, MA) and
other Mediterranean localities (GI, KU). This revealed low but significant percentage of
variation among groups (0.91%; p=0.000) and high and significant variation within
populations (98.48%; p=0.009).

48
When considering two groups as Island vs. Continental populations, hardly any
variance was explained by the groups and most of the variation was within populations.
Considering the localization of the samples according to the edges of distribution
of H. mammata two groups were considered: a first one, harbouring the samples located
on edges of distribution, PE (North-western) and GC (South-Western) and a second one
including the rest of localities (OA, FA, MU, MA, GI, KU). Small but significant
differentiation was found among groups (0.56%; p=0.000), and the variation among
populations within groups was also significant (1.06%; p=0.000).
The clustering of localities belonging to Atlantic (PE, OA, FA, GC) and
Mediterranean (MU, MA, GI, KU) groups, found significant differentiation
Finally, three groups according to biogeographic criteria were established:
Atlantic (PE, OA, FA, GC), Western (MU, MA, GI) and Eastern Mediterranean (KU).
0.97% of the variance was attributed to differences among groups, 0.60% among
populations within groups, but most of the variance (98.43%) was significantly
attributed within populations.
Table XI Analysis of molecular variance (AMOVA) among different groups setup.
Groups Hierarchical level Var. %
Fixation indices
P value
∙ Atlantic (PE, OA, FA, GC) ∙ SW Mediterranean (MU, MA) ∙ Other Mediterranean (GI, KU)
Among groups 0.91 ᶲCT =0.015 0.000* Among populations within groups 0.61 ᶲSC =0.006 0.109
Within populations 98.48 ᶲST =0.009 0.009* ∙ Island Populations (GC,MA) ∙ Continental Pop. (PE, OA, FA, MU,
GI, KU)
Among groups -0.38 ᶲCT =0.01 0.000* Among populations within groups 1.42 ᶲSC =0.014 0.000*
Within populations 98.96 ᶲST =-0.003 0.931 ∙ Edge Populations (PE, GC) ∙ Central Populations (OA, FA, MU,
MA, GI, KU)
Among groups 0.56 ᶲCT =0.016 0.000* Among populations within groups 1.06 ᶲSC =0.010 0.000*
Within populations 98.38 ᶲST =0.005 0.070 ∙ Atlantic (PE, OA, FA, GC) ∙ Mediterranean (MU, MA, GI, KU)
Among groups 0.76 ᶲCT =0.015 0.000* Among populations within groups 0.84 ᶲSC =0.008 0.005*
Within populations 98.40 ᶲST =0.007 0.027* ∙ Atlantic (PE, OA, FA, GC) ∙ W Mediterranean (MU, MA, GI) ∙ E Mediterranean (KU)
Among groups 0.97 ᶲCT =0.015 0.000* Among populations within groups 0.60 ᶲSC =0.006 0.004*
Within populations 98.43 ᶲST =0.009 0.004* *Significant values (p<0.05)
Principal Component Analysis (Figure 17) based on the allele frequencies
showed two mains groups: Atlantic localities on positive side of Component I and
Mediterranean samples in the negative side. Kusadasi belonging to this last group was
located on the negative side of both components and differentiated to the other
Mediterranean localities grouped on the positive part of component II. Both components
(I and II) explained 40.8% of the variance.
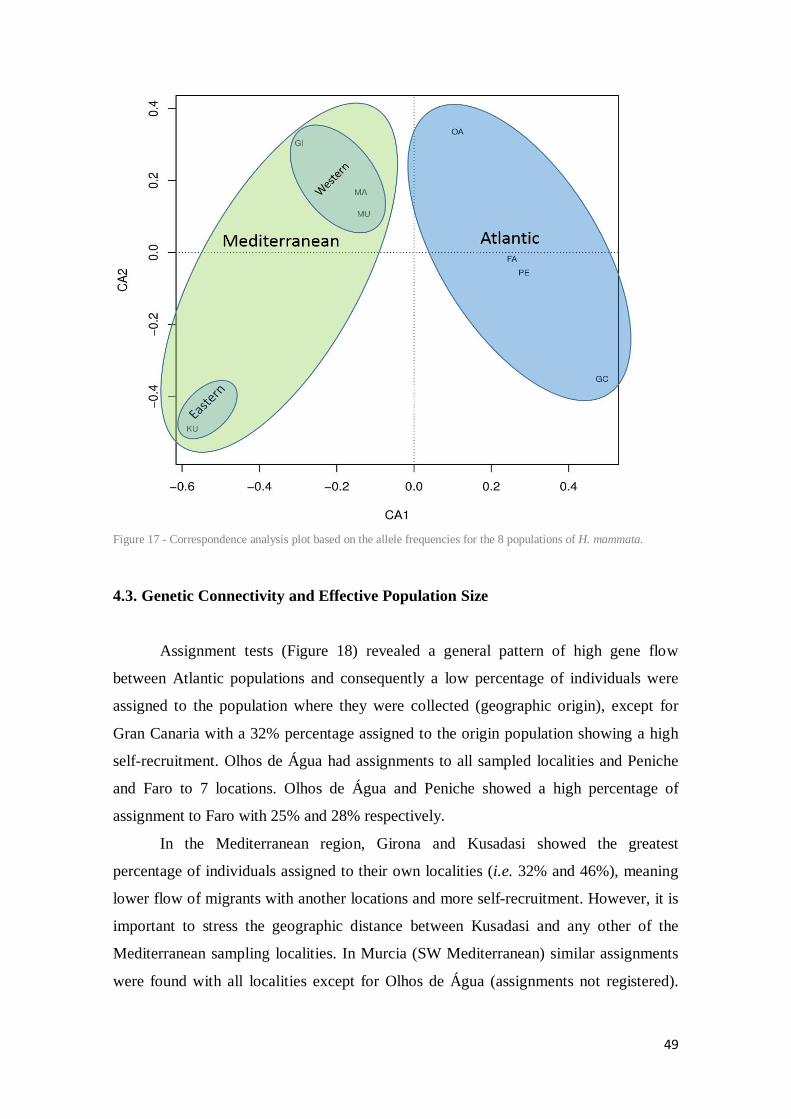
49
Figure 17 - Correspondence analysis plot based on the allele frequencies for the 8 populations of H. mammata.
4.3. Genetic Connectivity and Effective Population Size
Assignment tests (Figure 18) revealed a general pattern of high gene flow
between Atlantic populations and consequently a low percentage of individuals were
assigned to the population where they were collected (geographic origin), except for
Gran Canaria with a 32% percentage assigned to the origin population showing a high
self-recruitment. Olhos de Água had assignments to all sampled localities and Peniche
and Faro to 7 locations. Olhos de Água and Peniche showed a high percentage of
assignment to Faro with 25% and 28% respectively.
In the Mediterranean region, Girona and Kusadasi showed the greatest
percentage of individuals assigned to their own localities (i.e. 32% and 46%), meaning
lower flow of migrants with another locations and more self-recruitment. However, it is
important to stress the geographic distance between Kusadasi and any other of the
Mediterranean sampling localities. In Murcia (SW Mediterranean) similar assignments
were found with all localities except for Olhos de Água (assignments not registered).

50
Interestingly, 34% of Mallorca individuals (SW Mediterranean) were assigned to Olhos
de Água (S Portugal).
Figure 18 - Assignment tests of H. mammata individuals based on 10 microsatellite loci. The circular charts indicate the adjusted mean probability of the assigned individual actually belonging to a given population, based on the exclusion-simulation test.
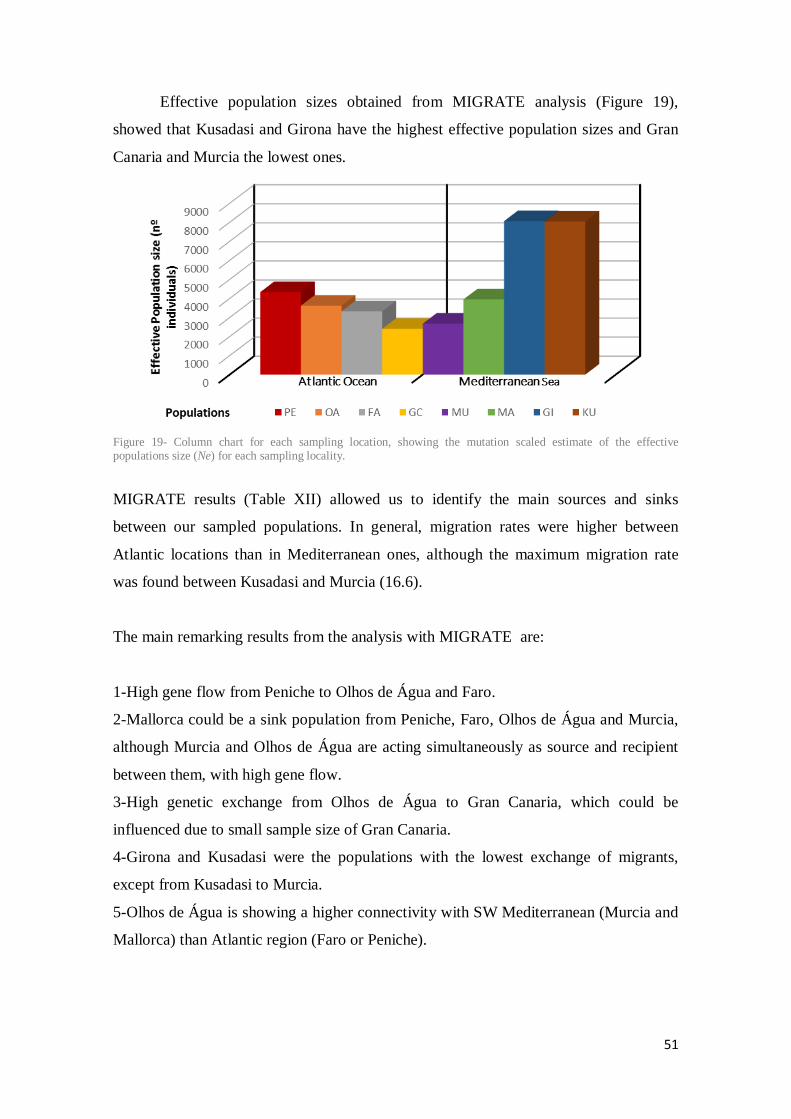
51
Effective population sizes obtained from MIGRATE analysis (Figure 19),
showed that Kusadasi and Girona have the highest effective population sizes and Gran
Canaria and Murcia the lowest ones.
Figure 19- Column chart for each sampling location, showing the mutation scaled estimate of the effective populations size (Ne) for each sampling locality.
MIGRATE results (Table XII) allowed us to identify the main sources and sinks
between our sampled populations. In general, migration rates were higher between
Atlantic locations than in Mediterranean ones, although the maximum migration rate
was found between Kusadasi and Murcia (16.6).
The main remarking results from the analysis with MIGRATE are:
1-High gene flow from Peniche to Olhos de Água and Faro.
2-Mallorca could be a sink population from Peniche, Faro, Olhos de Água and Murcia,
although Murcia and Olhos de Água are acting simultaneously as source and recipient
between them, with high gene flow.
3-High genetic exchange from Olhos de Água to Gran Canaria, which could be
influenced due to small sample size of Gran Canaria.
4-Girona and Kusadasi were the populations with the lowest exchange of migrants,
except from Kusadasi to Murcia.
5-Olhos de Água is showing a higher connectivity with SW Mediterranean (Murcia and
Mallorca) than Atlantic region (Faro or Peniche).

52
Table XII-Migration rates (M = m/μ) based on 9 microsatellites loci of Holothuria mammata from sources (columns) to sink populations (rows).
Locality Migration rates PE to OA to FA to GC to MU to MA to GI to KU to
Peniche ---- 4.6 4.1 2.7 2.8 5.3 2.8 2.9 Olhos de Água 12.9 ---- 3.4 11.9 8.8 4.8 7.2 6.4
Faro 12.3 4.9 ---- 5.0 4.5 4.4 6.6 5.3 Gran Canaria 4.5 12.4 5.1 ---- 4.2 6.7 6.0 8.6
Murcia 4.9 8.1 5.5 2.6 ---- 6.8 8.6 16.6 Mallorca 12.8 7.8 9.3 4.2 9.9 ---- 2.2 1.8 Girona 1.1 1.8 1.9 2.4 1.0 1.3 ---- 2.4
Kusadasi 1.5 2.7 2.6 3.3 4.9 1.8 2.2 ---- 4.4. Bottlenecks
Tests for signatures of recent population bottlenecks (Table XIII) did not find
any significant evidence considering Infinite Allele Model (IAM). However, Peniche,
Faro, Gran Canaria and Murcia presented significant values for Wilcoxon and Sign tests
under Two Phase Model (TPM), and Olhos de Água showed only significance for the
Wilcoxon test under TPM. Table XIII-: Heterozygosity excess/deficiency under different mutation models in all populations and respective Sign and Wilcoxon tests.
Nº of locus with: PE OA FA GC MU MA GI KU
Infin
ite A
llele
Mod
el (I
AM)
Sign
Tes
t Expected He excess 5.47 5.44 5.45 5.44 5.47 5.44 5.44 5.47 He deficiency 4 5 6 6 6 5 4 5 He excess 5 4 3 3 3 4 5 4 Probability 0.498 0.258 0.092 0.093 0.091 0.256 0.506 0.251
Wilc
oxon
test
P (One tail for He deficiency
0.285 0.410 0.101 0.101 0.179 0.751 0.589 0.410
P (One tail for He excess)
0.751 0.632 0.917 0.917 0.849 0.285 0.455 0.632
P (Two tail for He excess and deficiency
0.570 0.820 0.203 0.203 0.359 0.570 0.910 0.820
Two
Phas
e M
odel
(TPM
)
Sign
Tes
t Expected He excess 5.35 5.36 5.41 5.36 5.37 5.34 5.36 5.35 He deficiency 8 6 7 7 7 6 6 6 He excess 1 3 2 2 2 3 3 3 Probability 0.004 0.104 0.024 0.026 0.026 0.107 0.104 0.105
Wilc
oxon
test
P (One tail for He deficiency
0.009 0.024 0.006 0.009 0.013 0.064 0.082 0.064
P (One tail for He excess)
0.993 0.981 0.995 0.993 0.990 0.975 0.935 0.975
P (Two tail for He excess and deficiency
0.019 0.048 0.013 0.019 0.027 0.128 0.164 0.128
Parameters for T.P.M: Variance = 30.00; Proportion of SMM in TPM = 70.00%; Estimation based on 100 000 interactions; He: Heterozygosity. Bold values are significant at P<0.05.
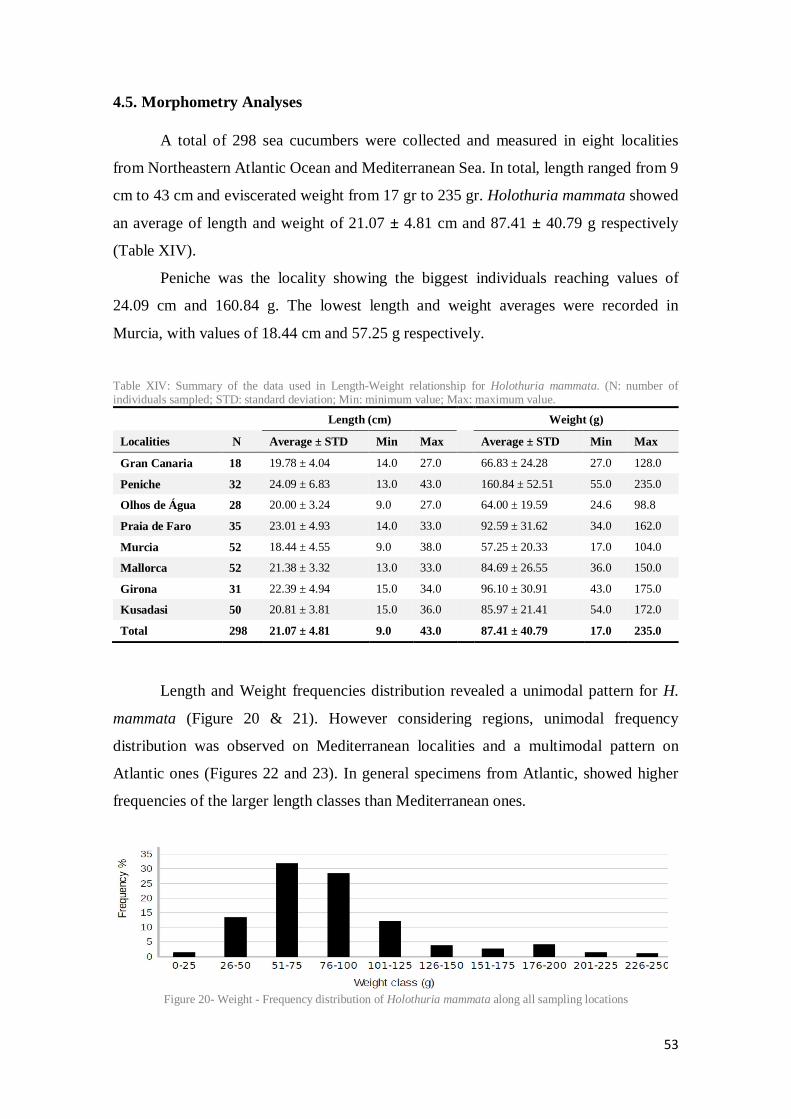
53
4.5. Morphometry Analyses
A total of 298 sea cucumbers were collected and measured in eight localities
from Northeastern Atlantic Ocean and Mediterranean Sea. In total, length ranged from 9
cm to 43 cm and eviscerated weight from 17 gr to 235 gr. Holothuria mammata showed
an average of length and weight of 21.07 ± 4.81 cm and 87.41 ± 40.79 g respectively
(Table XIV).
Peniche was the locality showing the biggest individuals reaching values of
24.09 cm and 160.84 g. The lowest length and weight averages were recorded in
Murcia, with values of 18.44 cm and 57.25 g respectively.
Table XIV: Summary of the data used in Length-Weight relationship for Holothuria mammata. (N: number of individuals sampled; STD: standard deviation; Min: minimum value; Max: maximum value.
Length (cm) Weight (g)
Localities N Average ± STD Min Max Average ± STD Min Max
Gran Canaria 18 19.78 ± 4.04 14.0 27.0 66.83 ± 24.28 27.0 128.0
Peniche 32 24.09 ± 6.83 13.0 43.0 160.84 ± 52.51 55.0 235.0
Olhos de Água 28 20.00 ± 3.24 9.0 27.0 64.00 ± 19.59 24.6 98.8
Praia de Faro 35 23.01 ± 4.93 14.0 33.0 92.59 ± 31.62 34.0 162.0
Murcia 52 18.44 ± 4.55 9.0 38.0 57.25 ± 20.33 17.0 104.0
Mallorca 52 21.38 ± 3.32 13.0 33.0 84.69 ± 26.55 36.0 150.0
Girona 31 22.39 ± 4.94 15.0 34.0 96.10 ± 30.91 43.0 175.0
Kusadasi 50 20.81 ± 3.81 15.0 36.0 85.97 ± 21.41 54.0 172.0
Total 298 21.07 ± 4.81 9.0 43.0 87.41 ± 40.79 17.0 235.0
Length and Weight frequencies distribution revealed a unimodal pattern for H.
mammata (Figure 20 & 21). However considering regions, unimodal frequency
distribution was observed on Mediterranean localities and a multimodal pattern on
Atlantic ones (Figures 22 and 23). In general specimens from Atlantic, showed higher
frequencies of the larger length classes than Mediterranean ones.
Figure 20- Weight - Frequency distribution of Holothuria mammata along all sampling locations

54
Figure 21 – Length - Frequency distribution of Holothuria mammata along all sampling locations
Figure 22 - Length-Frequency distribution of Holothuria mammata in Atlantic Ocean sampling localities
Figure 23 - Length-Frequency distribution of Holothuria mammata in Mediterranean Sea sampling localities
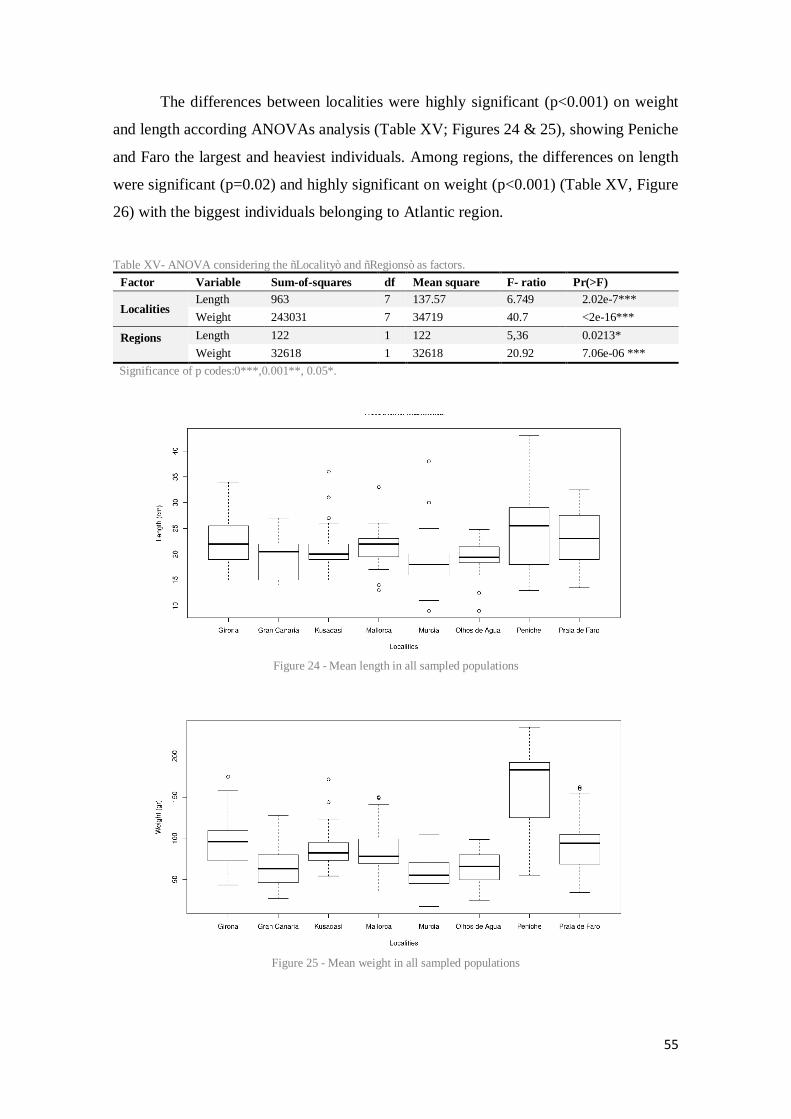
55
The differences between localities were highly significant (p<0.001) on weight
and length according ANOVAs analysis (Table XV; Figures 24 & 25), showing Peniche
and Faro the largest and heaviest individuals. Among regions, the differences on length
were significant (p=0.02) and highly significant on weight (p<0.001) (Table XV, Figure
26) with the biggest individuals belonging to Atlantic region.
Table XV- ANOVA considering the “Locality” and “Regions” as factors.
Factor Variable Sum-of-squares df Mean square F- ratio Pr(>F)
Localities Length 963 7 137.57 6.749 2.02e-7*** Weight 243031 7 34719 40.7 <2e-16***
Regions
Length 122 1 122 5,36 0.0213* Weight 32618 1 32618 20.92 7.06e-06 ***
Significance of p codes:0***,0.001**, 0.05*.
Figure 24 - Mean length in all sampled populations
Figure 25 - Mean weight in all sampled populations
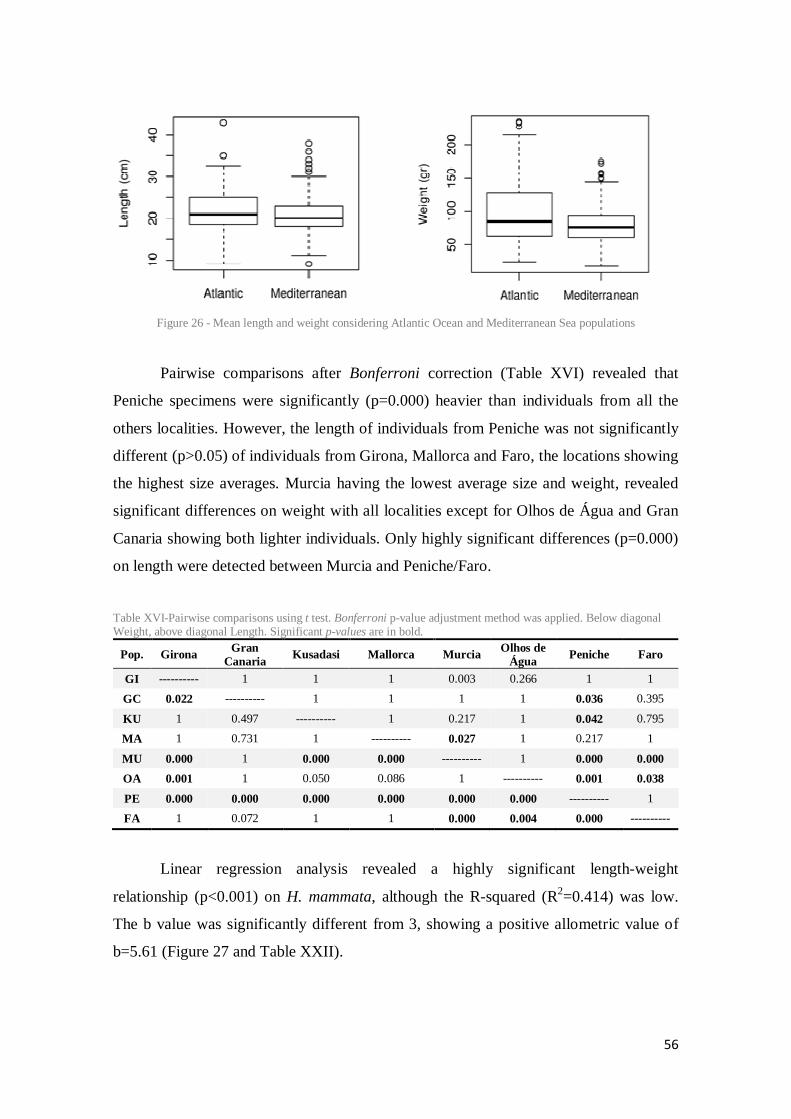
56
Figure 26 - Mean length and weight considering Atlantic Ocean and Mediterranean Sea populations
Pairwise comparisons after Bonferroni correction (Table XVI) revealed that
Peniche specimens were significantly (p=0.000) heavier than individuals from all the
others localities. However, the length of individuals from Peniche was not significantly
different (p>0.05) of individuals from Girona, Mallorca and Faro, the locations showing
the highest size averages. Murcia having the lowest average size and weight, revealed
significant differences on weight with all localities except for Olhos de Água and Gran
Canaria showing both lighter individuals. Only highly significant differences (p=0.000)
on length were detected between Murcia and Peniche/Faro.
Table XVI-Pairwise comparisons using t test. Bonferroni p-value adjustment method was applied. Below diagonal Weight, above diagonal Length. Significant p-values are in bold.
Pop. Girona Gran Canaria Kusadasi Mallorca Murcia Olhos de
Água Peniche Faro
GI ---------- 1 1 1 0.003 0.266 1 1
GC 0.022 ---------- 1 1 1 1 0.036 0.395
KU 1 0.497 ---------- 1 0.217 1 0.042 0.795
MA 1 0.731 1 ---------- 0.027 1 0.217 1
MU 0.000 1 0.000 0.000 ---------- 1 0.000 0.000 OA 0.001 1 0.050 0.086 1 ---------- 0.001 0.038
PE 0.000 0.000 0.000 0.000 0.000 0.000 ---------- 1
FA 1 0.072 1 1 0.000 0.004 0.000 ----------
Linear regression analysis revealed a highly significant length-weight
relationship (p<0.001) on H. mammata, although the R-squared (R2=0.414) was low.
The b value was significantly different from 3, showing a positive allometric value of
b=5.61 (Figure 27 and Table XXII).

57
Figure 27 - Length-weight relationships and R-squared.
Table XVII: Coefficients of the linear model (EW vs. FW) for Holothuria mammata. Coefficients Estimate Std. Error t value Pr(>|t|) Intercept (a) -30.5131 9.2549 -3.297 0.00112 ** Length (b) 5.6094 0.4264 13.155 <2e-16 ***
Significance of p codes: 0***,0.001**.

58
5. Discussion
This Master thesis provides the first population genetic assessment carried out
with novel polymorphic markers (microsatellites) to the commercially valuable species,
Holothuria mammata. This study considers different spatial scales covering nearly the
geographical distribution of the species.
5.1. Genetic Diversity
Holothuria mammata showed high genetic diversity (i.e. allelic diversity, private
alleles, He) in all populations. The comparison of these values with another holothurian
species is difficult considering that until now no population genetics studies using
microsatellites were published on European holothurians species. Only, some studies
using microsatellites, were published on tropical species such as Stichopus japonicus
(Chang et al., 2009; Kang et al., 2011). This species showed lower mean number of
alleles and less observed heterozygosity than values registered on H. mammata. S.
japonicus has been heavily overfished in the last decades, which could be explaining its
lower genetic diversity.
A previous study focused on Holothuria mammata (Borrero-Pérez et al., 2011),
using mtDNA markers (COI and 16S genes) detected also high genetic diversity (16S
gene: H=0.93; π=0.006; COI gene: H=0.92; π=0.007) on most of the populations
covering the geographical distribution of the species. Holothuria arguinensis, a very
close species of H. mammata distributed in NE Atlantic and colonizing the SW
Mediterranean Sea, presented lower values of genetic diversity on mtDNA genes (16S
gene: H=0.88; π=0.005; COI gene: H=0.90; π=0.01), perhaps due to its more restricted
geographical distribution (Rodrigues et al., 2015). Holothuria polii another species
belonging to the Holothuria Genus and having overlapped its distribution with H.
mammata in the Mediterranean Sea, showed lower values of genetic diversity for 16S
genes (16S gene: H=0.65; π=0.003) than H. mammata, although similar results were
obtained for COI gene (COI gene: H=0.93; π=0.005) (Valente et al., 2015)
Considering the spatial scale of regions, our study on H. mammata using
microsatellites found higher genetic diversity (number of total alleles, private alleles and
observed and expected heterozygosity) on Mediterranean region than the Atlantic one.
This pattern of diversity was already described by Borrero-Pérez et al., (2011) on H.

59
mammata using COI gene, however their results obtained from 16S gene did not
corroborated it.
Similar results were found for other invertebrates, like equinoderms (Pérez-
Portela et al., 2010) and crustaceans (Roman & Palumbi, 2004) , however they attribute
these differences in genetic diversity due to former colonization into the Atlantic Ocean
or vice versa. Higher diversity in the Mediterranean region could be driven by more
complex environmental conditions and historic climatic fluctuations than the Atlantic
one. Important gradients of temperature, salinity and nutrients have been described for
the Mediterranean Sea coupled with highly variable currents circulation (Danovaro et al
1999, Bethoux et al 1999, Pattarnelo 2007). This historical and contemporaneous
heterogeneous environmental conditions might induce higher intraspecific variability
enhancing the adaptive potential for adverse and changing conditions (Pamilo, 1988;
Lowe et al., 2012; Mitchell et al., 2015) .
When smaller spatial scale (locations) is taken into account, Kusadasi (Turkey)
and Murcia (SE Spain) presented the highest mean allelic diversity (13.7 and 14.2
respectively) and observed heterozygosity (0.71 and 0.61 respectively). In Murcia, the
influence of different oceanographic regimes (i.e. Atlantic waters, Northern current)
could increase its connectivity, receiving migrants from the nearby populations of
Western Mediterranean and Atlantic. Murcia has high gene flow (i.e., no differentiation)
with Olhos de Água and Faro (S Portugal), but also with Mallorca (E Spain) and Girona
(i.e. genotypic), which might contribute to its higher gene diversity. Kusadasi (Turkey)
is influenced by the different hydrographic features of the two Aegean sea sub-basins
(Ignatiades et al 2002) where the North area is showing a high primary productivity and
the South area is an oligotrophic environment (Siokou-frangou et al 2002). Migrants
from both sub basins, might contribute with different gene pools to the recipient
Kusadasi population. However, this hypothesis must be considered with limitations,
because only one locality from Eastern Mediterranean was studied. Further genetic
studies, sampling several localities from this region could be necessary to confirm or
disregard this hypothesis. Other factor could be considered to explain our results of high
genetic diversity in Kusadasi, the existence of older lineages from putative glacial
refugia located in this geographical area. However, this hypothesis does not seem to be
supported by the previous phylogeographic study on H. mammata using mtDNA
markers (COI and 16S genes) (Borrero-Pérez et al., 2011) which found the lowest
60
genetic diversity in a Turkish population (Foça); but it is important to stress that this
locality was under heavy fishery pressure which could affect the results found.
The lowest genetic diversity values were found in Gran Canaria (Atlantic), but
this result could be biased partially by the low number of individuals sampled there.
However, other reasons could be affecting the diversity found in Gran Canaria such as
island isolation and its localization at the Southern edge of geographical distribution of
H. mammata (Borrero-Pérez et al., 2011). Populations inhabiting the edges of
distribution usually show a low effective number of individuals suffering a founder
effect with decrease of genetic diversity and few rare variants (Excoffier 2009). Finally,
the high abundance of another sea cucumber species, Holothuria sanctori, on this
locality (Navarro et al., 2013) competing by the same resources, could affect the H.
mammata population size and therefore its genetic diversity.
Heterozygote deficiency in relation to HWE and positive significant FIS values
were found in all populations of H. mammata. Significant and positive FIS values were
also found (although not in all loci) in populations of S. japonicus in both published
studies using microsatellites (Chang et al., 2009; Kang et al., 2011). This deficit of
heterozygotes could be explained by several causes such as laboratory artefacts,
unidentified null alleles, loci under selection, non-random mating and Wahlund effect
(Allendorf et al., 2013). Results from INEST analysis on H. mammata, clearly indicated
the null alleles as the most contributing factor for positive and significant FIS values in
most of the populations. Some studies have found that free-spawners producing millions
of eggs could have higher mutation rates caused by larger numbers of cell cycles,
contributing to an increase in the frequency of null alleles, due to mutations on the
microsatellite primer binding sites (Addison & Hart, 2005). Since most sea cucumbers
(including Holothuria mammata) are broadcast spawners, it would be possible the
existence of null alleles in our populations due to higher rates of natural mutations on
primers binding sites. Gran Canaria was the only place where INEST did not attributed
null alleles as the main factor contributing to the HWE deviations found, which
supports evidences for true inbreeding in this population. In Gran Canaria, one third of
the individuals are potential descendants from local population, meaning an important
local retention of larvae (self-recruitment), which could promote inbreeding on this
population and deficit of heterozygosity. On the other hand, the effective population
size on this location was the smallest one, favouring also the inbreeding and loss of
genetic variation due to stronger effects of the stochastic genetic drift.
61
The hypothesis of sweepstakes reproductive success promoting inbreeding and
low effective population sizes (Hedgecock et al., 2007b) , could also explain the HW
disequilibrium detected on our populations but further studies must be done to
corroborate it.
5.2. Genetic Differentiation
5.2.1. Great Spatial Scale: Atlantic and Mediterranean Regions
The genetic analysis performed on H. mammata revealed genetic subdivision
between Eastern Mediterranean (i.e. Kusadasi), Western Mediterranean and the NE
Atlantic regions. At this great spatial scale, pairwise FST comparisons showed a
significant subdivision and STRUCTURE analyses also confirmed clearly the genetic
break between NE Atlantic Ocean and Mediterranean Sea, revealing a decreasing
gradient of Atlantic pool admixture in Eastern direction. These results agree with the
previous ones obtained for the same species by Borrero-Pérez et al., (2011) using
mtDNA markers (COI and 16S genes). These authors also found genetic breaks
between populations from the North-Eastern Mediterranean Sea (i.e. Aegen Sea), West
Mediterranean and NE Atlantic Ocean, although considered Algarve (i.e. FA) and West
Mediterranean (i.e. MU&MA) as a panmictic metapopulation.
Differentiation between Atlantic and Mediterranean basins have been widely
illustrated on other echinoderms, such as sea urchins (Duran et al., 2004) which only
disperse at the larval phase (i.e. Pelagic larval duration or PLD, between 20-40 days),
molluscs, like limpets (Sá-Pinto et al., 2012) which also disperse with pelagic larvae
(PLD up to 31.5 days) or crustaceans, like the global invasive crab Carcinus maenas
(Roman & Palumbi, 2004), which have a approx. 40 days of PLD (Mohamedeen &
Hartnoll, 1990) . This Atlanto-Mediterranean genetic break pattern was also described
in fishes, as the swordfish, with high dispersal ability during adult stage and able to
perform long distance migrations (Vinas et al., 2010). Some Sparids, closely related
species, with similar ecological, behavioural and evolution, such as Diplodus puntazzo
and Diplodus sargus also presented marked differences in the differentiation patterns
between both basins, with the former presenting marked genetic differentiation and
latter with no significant genetic divergence between Atlantic and Mediterranean,
respectively (Bargelloni et al., 2005).
62
At NE Atlantic spatial scale, a lack of genetic structure was found. Two
hypothesis could explain these results. First one considers that Atlantic populations
could be the result of an historical expansion from the Mediterranean Sea, in which due
to a limited evolutionary time passed since the Atlantic colonization, populations did
not have enough time to differentiate between them. This hypothesis is supported by
bottleneck results, lower number of rare alleles in Atlantic than Mediterranean and
lower genetic diversity. The second hypothesis is the existence of high gene flow and
connectivity between Atlantic locations which hampers their genetic differentiation. The
oceanographic features of this region are showing a predominant southward flow (but
not exclusively) moving at relatively faster speed, connecting genetically the Atlantic
locations which could be considered as a panmictic metapopulation. This high gene
flow scenario between Atlantic localities as it was stressed previously, could prevent
genetic differentiation, but at the same time increase the genetic diversity in the edges of
H. mammata distribution.
According to our results, the Atlantic populations seem to be genetically
connected with Southern-Western Mediterranean (i.e. Murcia and Mallorca), perhaps
favoured by the constant Atlantic water inflow into the Alborán sea and seasonally in
Balearic Sea (Renault et al., 2012b; Sayol et al., 2013a). However this Atlantic
influence does not seems to reach the NW Mediterranean area (i.e. Girona). Similar
results were found by Borrero-Pérez et al., (2011) establishing the Algarve region (FA)
and West Mediterranean (MU&MA) as a panmictic metapopulation.
5.2.2. Small Spatial Scale: Sampled Locations
The migration rates obtained from Migrate analysis should be considered
carefully and taking into account the time scale of models and markers used. The
coalescent approach combines the mutational-scaled immigration rates, meaning that
the results (average migration rates) are a combination of historical and
contemporaneous gene flow (Vitor C. Sousa et al., 2011; Wilkinson-Herbots, 2012).
Therefore, we only consider the migration rates and their directionality, when they are
showing biological meaning and are congruent with the actual oceanographic patterns
and with the results from the assignment tests. In this way, we could obtain a more
accurate model of the actual source and sink dynamics on H. mammata.

63
It is important to stress that, the low FST values found between some locations
should be interpreted with caution and to be considered another parameters assessing
genetic structure such as genic and genotypic differentiation. The mathematical
dependency of FST on the allele frequencies and diversities must be taken in account,
particularly when the population presents high diversities (as H. mammata) which
biases downwards the FST values. Genic and genotypic differentiation between
populations could detect in these cases more accurately the subdivision patterns
(Jakobsson et al., 2012).
At location scale, the connectivity patterns are strongly influenced by the ocean
currents, such as it was demonstrated from the results obtained by Mantel test using
oceanographic distances. In our study, some localities presented significant
genic/genotypic differentiation (e.g. Girona (NE Spain) and Mallorca (E Spain)
separated by 240 km) while other ones, such as Olhos de Água (S Portugal) and
Mallorca separated by 1000 km, showed a lack of differentiation (i.e. genotypic and FST
values). In NW Mediterranean Sea, the existence of the predominant Northern Current
flowing southward and the Atlantic water flowing northeastward are acting as a density
barrier between Mallorca and Girona forming the Balearic Front (Robinson & Leslie,
2001), explaining why these localities have negligible genetic exchange (i.e. are
isolated), in spite of being geographically close. This pattern of genetic isolation
between Mallorca and the Northeastern coast of Spain, was also found in several fish
species with different early life histories traits (e.g. egg type, pelagic larval duration),
reinforcing evidences that oceanographic patterns play a bigger role in shaping
connectivity at this spatial scale (Galarza et al., 2009; Schunter et al., 2011) than just
ecological dispersal potential of species.
Murcia (SE Spain), in opposite way to Mallorca, seems to have some gene flow
with Girona (i.e. supported by non-genotypic differentiation and migration rates) in
spite of FST significant values, and high gene flow with the Atlantic populations. The
Northern Current, which flows slowly (i.e. low kinetic energy) in only southward
direction close to the Spanish coast, suggests Girona as probable source population. The
Atlantic waters moving rapidly with high kinetic energy and periodically (i.e. in Mid-
Summer, the AOF relaxes and AW moves through the Ibiza Channel), arrive to Murcia
allowing a high gene flow from the Atlantic populations (i.e. source populations).
Murcia in fact could be considered as a sink but also as source population because
receives migrants from several sources depending on the oceanographic regime in this

64
zone (if WA dominates or if the AOF pushes AW to African Coast allowing to the
Northern current to reach Murcia), and also send migrants to another locations such as
Mallorca.
According our results, Girona has more local recruitment than immigrants
arriving from the rest of sampled locations. However, the AW moving southward into a
slower mesoscale gyre along African, Corsica and French coast in an anti-clock wise
direction and eventually becoming the dense Northern current after travelling thousands
of km, could suggest another source populations for Girona. However we cannot assess
this hypothesis because no sampling was performed in those areas.
Kusadasi (SW Turkey) shows clearly an isolation by distance (IBD) that
complicates the assessment of connectivity patterns with the rest of our sampling
localities, since it was the only sampled population in the Eastern Mediterranean Sea.
Due to this IBD pattern, the migration rates obtained for Kusadasi were the lowest ones
detected, (except with Murcia) and the migration rates for this locality are probably
related to a historical pattern of gene flow, rather than a contemporaneous exchange of
migrants.
Peniche (W Portugal) could be considered as source of Olhos de Água and Faro
(S Portugal) according to Migrate results. The oceanographic patterns in the Iberian
Coast during the spawning season of H. mammata have an interannual variability
circulation patterns which favours bidirectional North / South exchange of larvae at a
interannual temporal scale, which could favour the connectivity between these
locations.
Faro (S Portugal) is acting mainly as a sink population, receiving migrants from
the different populations. The role of source for Faro population is not likely since H.
mammata population inhabiting Ria Formosa is not very abundant considering that the
sandy/muddy bottoms with seagrass is not suitable habitat for this species which prefers
rocky bottoms (Borrero-Pérez et al., 2011; Siegenthaler, 2013). This role is different to
the previously observed for Holothuria arguinensis inhabiting Ria Formosa (Rodrigues
et al., 2015). These authors found evidences that Ria Formosa populations of H.
arguinensis are contributing to the overall genetic diversity of the species acting as
source. In that case, it was demonstrated that the populations of H. arguinensis in Ria
Formosa have high effective population sizes and show high densities ranged from 140
to 563 ind ha-1 (González-Wangüemert et al., 2013; Siegenthaler et al., 2015).

65
Olhos de Água (S Portugal) and Gran Canaria are acting simultaneously between
them as source and sink. This pattern could be explained by the current system only
with gene flow from Olhos de Água to Canaries, but not the inverse. This corroborates
the fact that results between Canaries and the others populations must be considered
carefully because they could be influenced by the small sample size of Gran Canaria.
Olhos de Água is showing a higher connectivity with SW Mediterranean (Murcia and
Mallorca) than Atlantic region (Faro or Peniche). According the oceanographic patterns
for the Southern Iberian Coast (García-Lafuente et al., 2006), Olhos de Água is more
influenced by the Cyclonic eddy (i.e. core N1, figure 3) than Faro, which could result in
increased larval export to Mediterranean. Also, Olhos de Água is more exposed to
oceanographic conditions (i.e. the current that flows over the continental shelf break and
slope) than the Ria Formosa coastal lagoon (Faro), increasing the chance of gene flow
from Olhos de Água to Murcia and Mallorca.
5.3. Bottlenecks
Populations that have experienced a recent expansion of their effective
population sizes exhibit a correlative increase of the allele number and heterozygosity at
polymorphic loci. Usually, the allele number is raised faster than heterozygosity (He),
therefore the He becomes smaller (i.e. deficiency) than the expected heterozygosity at
mutation-drift equilibrium (Maruyama & Fuerst, 1984; Cornuet & Luikart, 1996; Piry et
al., 1999; Girod et al., 2011).
Although detected only in the T.P.M model, significant signature of recent
expansion after bottleneck or founder event was found in Peniche, Olhos de Água, Faro,
Gran Canaria and Murcia meaning that these populations are not in a drift-mutation
equilibrium. In the cases of Peniche and Gran Canaria, their localization in the edges of
H. mammata distribution could explain their signature of found event.
Murcia, Faro and Olhos de Água have bottleneck signatures difficult to justify
although anthropogenic factors (such as fishery catches) cannot be ruled out.
Availability of optimal habitat area, or inter-annual variability of food resources in these
areas could also affect the demography of these populations. However no clear
evidences were found about reasons explaining the bottlenecks, and therefore further
ecology studies should be done.

66
5.4. Morphometry
There is a generalised lack of information about length and weight frequencies
for Holothuria mammata, except for Turkish region (González-Wangüemert et al.,
2014) and Canaries (Navarro et al., 2013) . This study compiles considerable amount of
weight and length data from Holothuria mammata, covering most of its distribution
area. Our results demonstrated that there is high variability in size and weight between
locations along the distribution of the target species. This might be related to local
nutrient regimes at each particular site (see below). However, significant trend was
found with larger animals in the Atlantic than in the Mediterranean, and in the Western
than in the Eastern Mediterranean.
The average size (21.07±4.81cm) of H.mammata is in general smaller than other
commercial species of Holothuria genus from the Indo-pacific such as H. scabra (29.00
cm), H. pulla (30.90 cm), H. atra (32.00 cm), H. nobilis (27.00 cm) and H. fuscogilva
(29.50) (Khalfan et al. 2007, Herrero-Pérezrul & Reyes-Bonilla 2008). However, sea
cucumbers are soft body individuals with the ability of high body contraction which
brings a common larger error on the length measurements due to the difficulty in
obtaining the complete relaxation of the body muscle. Thus, the use of gutted weight
measurements could be more accurate than length to estimate population dynamics as it
was stressed by other authors (Conand 1981, Bulteel et al. 1992, Tuwo & Conand,
1992, Kazanidis et al. 2010).
In Peniche, H. mammata specimens presented marked and significant
differences in weight with all others localities. In this location, Northerly winds
favoring seasonal coastal upwelling which are observed especially during summer (June
to September) (Peliz et al. 2002; Álvarez-Salgado et al. 2003), enhancing the
availability of nutrients in this area. Moreover, this locality is also positioned at the top
of the Nazaré Canyon, a topographic feature that penetrates the continental platform
allowing a very close to shore upwelling and additional enrichment in this region
(Mendes et al. 2011). A higher availability of nutrients could favor the faster growth of
bacteria community and diatoms in the bottom allowing a higher size and weight of H.
mammata individuals inhabiting this area.
Inversely, Gran Canaria and Murcia presents the lightest and shortest specimens
of H. mammata. The seafloor bathymetry around Canaries is abrupt with narrow shelf
and a steep slope to more than 1000 meters depth, producing near shore conditions
67
similar to open sea (Navarro-Pérez & Barton 2001). These features could limit the
abundance of some species (Popescu & Gras 2013) such as H. mammata. Moreover,
Canary Islands are located in the southern edge of distribution of H. mammata (Borrero-
Pérez et al. 2009). Usually resources and conditions (abiotic and biotic) of these
marginal habitats are not optimal for growing and reproduction (Kawecki 2008). In
addition, H. mammata could compete for food and habitat with another sea cucumber
species (H. sanctori) very abundant in Canary Islands, since both species have similar
rocky bottoms preferences (Navarro et al. 2013)
In Murcia the low size and weight values are difficult to explain, since the
abundance of H. mammata in this location was high. This population is inhabiting a
rocky restricted area showing the optimal habitat for this species but surrounded by sand
beaches, which could be affecting to the biological features of the species. Further
ecology studies are necessary to better understand our morphometric results in this
locality.
Girona was the Mediterranean locality with biggest specimens (i.e. weight and
length). The sampling locality in Girona is influenced by sewage discharges (pers.
observation) which can promote nutrient and organic matter enrichment of the marine
environment (Guidetti et al. 2003, Vizzini & Mazzola 2006). The input of nutrients
(mainly nitrates and phosphates) could stimulate algal growth and increase the input of
organic matter to the sediment - water interface (Boesch 2002), also increasing
heterotrophic bacteria that utilize organic carbon produced by algae (Amin et al. 2012).
Both microalgae and bacteria are the main food sources for sea cucumbers (Uthicke
1999, 2001). Since sea cucumbers are deposit feeders which use the organic matter
directly at the sediment surface, they are likely to benefit from the high food availability
in this location, therefore reaching higher sizes (Amon & Herndl 1991a, b, Navarro et
al. (2013).
Unimodal length and weight frequency distributions were obtained for H.
mammata. Other studies involving another species of sea cucumbers such as Actinopyga
echinites, Stichopus variegatus, and Holothuria forskali (Conand et al. 1982, 1993,
Tuwo and Conand, 1992) also showed a unimodal length frequency-distribution.
However multimodal length frequency distributions were obtained when we considered
each sampling locality separately (data not showed). Mediterranean studies of H.
mammata (González-Wangüemert et al., 2014) confirms this same length frequency
68
distribution pattern in Turkish waters. The most probable causes explaining the different
patterns of size distributions between localities could be due to differences on
environmental features such as temperature, nutrient availability and competition for
food resources due to the presence of other sea cucumber species.
Morphometric relationships followed a positive allometric growth for H.
mammata (b = 5.60). This allometric positive growth was previously described for H.
mammata in Turkish waters (González-Wangüemert et al., 2014a), and it was also
described as characteristic growth for most holothurian species (Ramon et al., 2010).
This strong positive relationship (0.4 < r index <= 0.7) between length and weight, was
significantly different from isometric growth (b ≠ 3) and highly correlated (p < 2.2e-16).
Similar values of parameter b (i.e. b > 3) were registered on H. mammata from Turkey
(González-Wangüemert et al., 2014) suggesting that larger specimens increase in height
or width more than in length. Accordingly to Froese (2006), this could result from two
reasons: 1) ontogenetic changes in body shape, it could be rejected because as far as we
know, sea cucumbers only suffer strong ontogenetic changes on body shape during
larval development; 2) most common reason is the presence of larger individuals being
thicker than smaller ones, meaning a better nutritional condition in larger specimens
than in juveniles. Better condition on adults is expected, since they reduce their energy
demands necessary for growth when reach the maturity. Adult’s life strategy implies
energy storage, which is used for gonads maturation and better condition of their eggs,
however juveniles use the energy for growth mainly (Reyes-Bonilla & Herrero-Pérezrul
2003, So et al. 2010, Poot-Salazar et al. 2014).

69
6. Conclusion
6.1. Populations Genetics
This study was the first population genetics evaluation using polymorphic
microsatellites markers in order to compensate the lack of knowledge for this ecological
important species, and to provide important data for future management and
conservation.
Holothuria mammata showed great genetic diversity, and differentiation
between Atlantic and Mediterranean basins. The gene flow within and between Atlantic
Ocean and Mediterranean sea populations is greater when oceanographic conditions
favors the exchange of larvae, connecting Atlantic populations with Mediterranean
ones, and thus increasing the populations genetic variation. In Mediterranean the spatial
scale of differentiation is smaller than the Atlantic, due to historical events and
contemporaneous complex spatial patterns of oceanographic regimes.
6.2. Morphometry
In conclusion, this morphometric analysis allowed us to have a first insight into
the length-weight classes and growth pattern of Holothuria mammata, a species with
commercial interest. Length-weight classes and relationships have not been previously
reported for the species in such a wide geographical distribution range and by which
allowed biogeographic comparisons. Due to their high commercial value coupled with a
high risk of stock depletion, management measures should be taken. Therefore, besides
setting biometric baselines, these results could be useful to create new legislation as
well as used as reference to compare between natural / protected and exploited
populations in order to evaluate the fishery effects on these target species.
70
7. Recommendations for Fisheries and Conservation Management
Considering the results obtained in this Thesis, we suggest the following
recommendations for management of H. mammata as a resource:
1. Holothuria mammata should be managed taking in account three distinct
units/stocks: 1) the northeast Atlantic Ocean; 2) the western Mediterranean Sea; 3) in
the eastern Mediterranean Sea. Management regulations should be aimed at this spatial
scale in order to avoid overfishing of smaller discrete populations.
2. At small spatial scale (locations), the resource in Gran Canaria should not be
harvested, due to small effective population size and low genetic diversity. Fisheries
focused on these island populations should be avoided in order to impede further
deterioration of the adaptive potential of the population.
3. Source populations in the NE Atlantic Ocean, especially in Peniche, should
also be conserved in order to maintain the patterns of connectivity, and consequently
larval spillover to southern populations of the Portuguese Coast. Moreover this
population appears to live in an edge distribution limit, reinforcing their fragility to
climatic oscillations and consequently to fisheries.
4. Ria Formosa (i.e. Faro) also presents a unique population (i.e. high diversity,
high number of rare alleles), that should be conserved, so it can become well established
and increase exportation of larvae to others sink populations such as Gran Canaria and
Murcia, improving their gene pool.
5. In the Eastern Mediterranean Sea, the Kusadasi population should also be
subject of a precautionary approach when implementing fisheries, since it is harboring
the highest genetic diversity.
6. In the Western Mediterranean Sea, the Murcia populations is showing a small
effective population size and the smallest size individuals. Therefore any catches should
not be authorized in this location until the reasons explaining these features are
understood.
71
8. References
Abaunza P., Murta A. G., Campbell N., Cimmaruta R., Comesaña A. S., Dahle G., García Santamaría M.T., Gordo L.S., Iversen S. A., MacKenzie K., Magoulas A., Mattiucci S., Molloy J., Nascetti G., Pinto A. L., Quinta R., Ramos P., Sanjuan A., Santos A. T., Stransky C., & Zimmermann C. (2008) Stock identity of horse mackerel (Trachurus trachurus) in the Northeast Atlantic and Mediterranean Sea: Integrating the results from different stock identification approaches. Fisheries Research, 89, 196–209.
Abdel Razek F.A., Abdel Rahman S.H., Mona M.H., El-Gamal M.M., & Moussa R.M. (2007) An observation on the effect of environmental conditions on induced fission of the Mediterranean sand sea cucumber, Holothuria arenicola in Egypt. Beche-de-mer Information Bulletin, 26, 33–34.
Abdul-Muneer P.M. (2014) Application of microsatellite markers in conservation genetics and fisheries management: recent advances in population structure analysis and conservation strategies. Genetics research international, 2014, 691759.
Addison J. A & Hart M.W. (2005) Spawning, copulation and Spawning, copulation and inbreeding coefficients in marine invertebrates. Biology letters, 1, 450–3.
Allee W.C. (1938) The social life of animals. W. W. Norton & Company, Inc, New York.
Allendorf F.W., Berry O., & Ryman N. (2014) So long to genetic diversity, and thanks for all the fish. Molecular ecology, 23, 23–5.
Allendorf F.W., Luikart G., & Aitken S.N. (2013) Conservation and the Genetics of Populations. Wiley-Blackwell, West Sussex.
Álvarez-Salgado X., Figueiras F., Pérez F., Groom S., Nogueira E., Borges A., Chou L., Castro C., Moncoiffé G., Ríos A., Miller A. E., Frankignoulle M., Savidge G., & Wollast R. (2003a) The Portugal coastal counter current off NW Spain: new insights on its biogeochemical variability. Progress in Oceanography, 56, 281–321.
Anderson S.C., Flemming J.M., Watson R., & Lotze H.K. (2011a) Rapid Global Expansion of Invertebrate Fisheries : Trends, Drivers, and Ecosystem Effects. PloS one, 6, 1–9.
Anderson S.C., Flemming J.M., Watson R., & Lotze H.K. (2011b) Serial exploitation of global sea cucumber fisheries. Fish and Fisheries, 12, 317–339.
André, G., P. Garreau, V. Vernier and P.F. (2005) Modelled variability of the sea surface circulation in the North-western Mediterranean Sea and in the Gulf of Lions. Ocean Dynamics, 55, 294–308.

72
Antao T., Lopes A., Lopes R.J., Beja-Pereira A., & Luikart G. (2008) LOSITAN: a workbench to detect molecular adaptation based on a Fst-outlier method. BMC bioinformatics, 9, 323.
Attoub S., Arafat K., Gélaude A., Al Sultan M.A., Bracke M., Collin P., Takahashi T., Adrian T.E., & De Wever O. (2013) Frondoside a suppressive effects on lung cancer survival, tumor growth, angiogenesis, invasion, and metastasis. PloS one, 8, e53087.
Aydin M. (2008) The commercial sea cucumber fishery in Turkey. Beche-de-mer Information Bulletin, 28, 40–41.
Bargelloni L., Alarcon J. A., Alvarez M.C., Penzo E., Magoulas A., Palma J., & Patarnello T. (2005) The Atlantic-Mediterranean transition: Discordant genetic patterns in two seabream species, Diplodus puntazzo (Cetti) and Diplodus sargus (L.). Molecular Phylogenetics and Evolution, 36, 523–535.
Barrington K., Chopin T., & Robinson S. (2009) Integrated multi-trophic aquaculture ( IMTA ) in marine temperate waters. FAO Fisheries and Aquaculture Technical Paper, 529, 7–46.
Barton E.D. (2001) Encyclopedia of Ocean Sciences. Elsevier,
Batteen M.L., Martinez J.R., Bryan D.W., & Buch E.J. (2000) A modeling study of the coastal eastern boundary current system off Iberia and Morocco. Journal of Geophysical Research, 105, 14173.
Beerli P. & Felsenstein J. (2001) Maximum likelihood estimation of a migration matrix and effective population sizes in n subpopulations by using a coalescent approach. Proceedings of the National Academy of Sciences of the United States of America, 98, 4563–4568.
Begg G., Friedland K., & Pearce J. (1999) Stock identification and its role in stock assessment and fisheries management: an overview. Fisheries Research, 43, 1–8.
Belkhir K., Borsa P., Chikhi L., Raufaste N., & Bonhomme F. (1996) GENETIX 4.05, logiciel sous Windows TM pour la génétique des populations. .
Biro P. A. & Post J.R. (2008) Rapid depletion of genotypes with fast growth and bold personality traits from harvested fish populations. Proceedings of the National Academy of Sciences of the United States of America, 105, 2919–22.
Bordbar S., Anwar F., & Saari N. (2011) High-value components and bioactives from sea cucumbers for functional foods - A review. Marine Drugs, 9, 1761–1805.
Borrero-Pérez G.H., Gómez-Zurita J., González-Wangüemert M., Marcos C., & Pérez-Ruzafa A. (2010) Molecular systematics of the genus Holothuria in the Mediterranean and Northeastern Atlantic and a molecular clock for the diversification of the Holothuriidae (Echinodermata: Holothuroidea). Molecular phylogenetics and evolution, 57, 899–906.

73
Borrero-Pérez G.H., González-Wangüemert M., Marcos C., & Pérez-Ruzafa A. (2011) Phylogeography of the Atlanto-Mediterranean sea cucumber Holothuria (Holothuria) mammata: the combined effects of historical processes and current oceanographical pattern. Molecular ecology, 20, 1964–75.
Borrero-Pérez G.H., Pérez-Ruzafa A., Marcos C., & González-Wangüemert M. (2009) The taxonomic status of some Atlanto-Mediterranean species in the subgenus Holothuria (Echinodermata: Holothuroidea: Holothuriidae) based on molecular evidence. Zoological Journal of the Linnean Society, 157, 51–69.
Bruckner A., Johnson K., & Field J. (2003) Conservation strategies for sea cucumbers: Can a CITES Appendix II listing promote sustainable international trade. SPC Bêche-de-mer information Bulletin, 24–33.
Chang Y., Feng Z., Yu J., & Ding J. (2009) Genetic variability analysis in five populations of the sea cucumber Stichopus (Apostichopus) japonicus from China, Russia, South Korea and Japan as revealed by microsatellite markers. Marine Ecology, 30, 455–461.
Chapuis M.-P. & Estoup A. (2007) Microsatellite null alleles and estimation of population differentiation. Molecular biology and evolution, 24, 621–31.
Charlesworth B. & Charlesworth D. (2009) Darwin and genetics. Genetics, 183, 757–766.
Chen J. (2003) Overview of sea cucumber farming and sea ranching practices in China. SPC beche-de-mer Information Bulletin, 18–23.
Chessel D., Dufour A.B., & Thioulouse J. (2004) The ade4 package - I : One-table methods. R News, 4, 5–10.
Chybicki I.J. & Burczyk J. (2009) Simultaneous estimation of null alleles and inbreeding coefficients. Journal of Heredity, 100, 106–113.
Çiftci Y. (2002) Fish Population Genetics and Applications of Molecular Markers to Fisheries and Aquaculture : I- Basic Principles of Fish Population Genetics. Turkish Journal of Fisheries and Aquatic Sciences, 2, 145–155.
Coelho H., Neves R., White M., Leitão P.C., & Santos A.J. (2002) A model for ocean circulation on the Iberian coast. Journal of Marine Systems, 32, 153–179.
Cohen J.E. (2003) Human population: the next half century. Science, 302, 1172–5.
Conand C. & Bryne M. (1993) A review of recent developments in the world sea cucumber fisheries. Marine Fisheries Review, 55, 1–13.
Consuegra S., Leániz C.G. de, Serdio A., & Verspoor E. (2005) Selective exploitation of early running fish may induce genetic and phenotypic changes in Atlantic salmon. Journal of Fish Biology, 67, 129–145.
74
Cornuet J.M. & Luikart G. (1996) Description and Power Analysis of Two Tests for Detecting Recent Population Bottlenecks From Allele Frequency Data. Genetics, 144, 2001–2014.
Criado-Aldeanueva F., García-Lafuente J., Vargas J.M., Del Río J., Vázquez A., Reul A., & Sánchez A. (2006) Distribution and circulation of water masses in the Gulf of Cadiz from in situ observations. Deep-Sea Research Part II: Topical Studies in Oceanography, 53, 1144–1160.
Dempster A.P., Laird N.M., & Rubin D.B. (1977) Maximum Likelihood from Incomplete Data via the EM Algorithm. Journal of the Royal Statistical Society, 39, 1–38.
Domínguez-Godino J.A., Slater M.J., Hannon C., & González-wangüermert M. (2015) A new species for sea cucumber ranching and aquaculture : Breeding and rearing of Holothuria arguinensis. Aquaculture, 438, 122–128.
Duran S., Palacín C., Becerro M. A., Turon X., & Giribet G. (2004) Genetic diversity and population structure of the commercially harvested sea urchin Paracentrotus lividus (Echinodermata, Echinoidea). Molecular Ecology, 13, 3317–3328.
Earl D. A. & vonHoldt B.M. (2012) STRUCTURE HARVESTER: A website and program for visualizing STRUCTURE output and implementing the Evanno method. Conservation Genetics Resources, 4, 359–361.
Eldridge W.H., Myers J.M., & Naish K. A. (2009) Long-term changes in the fine-scale population structure of coho salmon populations (Oncorhynchus kisutch) subject to extensive supportive breeding. Heredity, 103, 299–309.
Eriksson H., Torre-castro M. De, & Olsson P. (2012) Mobility , Expansion and Management of a Multi-Species Scuba Diving Fishery in East Africa. PloS one, 7.
Evanno G., Regnaut S., & Goudet J. (2005) Detecting the number of clusters of individuals using the software STRUCTURE: a simulation study. Molecular ecology, 14, 2611–20.
Excoffier L. & Lischer H.E.L. (2010) Arlequin suite ver 3.5: A new series of programs to perform population genetics analyses under Linux and Windows. Molecular Ecology Resources, 10, 564–567.
FAO (2010) Putting into practice an ecosystem approach to managing sea cucumber fisheries. .
FAO (2012) The State of World Fisheries and Aquaculture. Rome.
FAO (2014) The State of World Fisheries and Aquaculture. Rome.
Fogarty M.J., Fogarty M.J., Botsford L.W., & Botsford L.W. (2007) Population connectivity and spatial management of marine fisheries. Oceanography, 20, 112–123.
75
Francour P. (1997) Predation on holothurians: a literature review. Invertebrate Biology, 116, 52–56.
Froese R. (2006) Cube law, condition factor and weight-length relationships: history, meta-analysis and recommendations. Journal of Applied Ichthyology, 22, 241–253.
Gaines S.D., White C., Carr M.H., & Palumbi S.R. (2010) Designing marine reserve networks for both conservation and fisheries management. Proceedings of the National Academy of Sciences of the United States of America, 107, 18286–93.
Galarza J.A., Carreras-carbonell J., Macpherson E., Pascual M., Roques S., Turner G.F., & Rico C. (2009) The influence of oceanographic fronts and early-life-history traits on connectivity among littoral fish species. 106, 1473–1478.
García-Lafuente J., Delgado J., Criado-Aldeanueva F., Bruno M., del Río J., & Miguel Vargas J. (2006) Water mass circulation on the continental shelf of the Gulf of Cádiz. Deep-Sea Research Part II: Topical Studies in Oceanography, 53, 1182–1197.
Gharbi A. & Said K. (2011) Genetic variation and population structure of Holothuria polii from the eastern and western Mediterranean coasts in Tunisia. Journal of the Marine Biological Association of the United Kingdom, 91, 1599–1606.
Girod C., Vitalis R., Leblois R., & Fréville H. (2011) Inferring population decline and expansion from microsatellite data: A simulation-based evaluation of the msvar method. Genetics, 188, 165–179.
González-Wangüemert M., Aydin M., & Conand C. (2014a) Assessment of sea cucumber populations from the Aegean Sea (Turkey): First insights to sustainable management of new fisheries. Ocean & Coastal Management, 92, 87–94.
González-Wangüemert M., Braga T., Silva M., Valente S., Rodrigues F., & Serrao E. (2013a) Volunteer programme assesses the Holothuria arguinensis populations in Ria Formosa (southern Portugal). SPC beche-de-mer Information Bulletin, 44–48.
González-Wangüemert M., Conand C., Uthicke S., Borrero-Pérez G., Aydin M., Erzini K., & Serrao E. (2013b) Sea cucumbers: The new resource for a hungry fishery (CUMFISH). Project PTDC/MAR/119363/2010. SPC beche-de-mer Information Bulletin, 65–66.
González-Wangüemert M., Maggi C., Valente S., Martínez-Garrido J., & Rodrigues N.V. (2014b) Parastichopus regalis — The main host of Carapus acus in temperate waters of the Mediterranean Sea and northeastern Atlantic Ocean. 34, 38–42.
González-Wangüemert M., Valente S., & Aydin M. (2015) Effects of fishery protection on biometry and genetic structure of two target sea cucumber species from the Mediterranean Sea. Hydrobiologia, 65–74.
76
Grift R.E., Rijnsdorp A.D., Barot S., Heino M., & Dieckmann U. (2003) Fisheries-induced trends in reaction norms for maturation in North Sea plaice. Marine Ecology Progress Series, 257, 247–257.
Hall M.A., Alverson D.L., & Metuzals K.I. (2000) By-Catch : Problems and Solutions. Marine Pollution Bulletin, 41, .
Halpern B.S. (2003) The impact of marine reserves: Do reserves work and does reserve size matter? Ecological Applications, 13, .
Hamad N., Millot C., & Taupier-letage I. (2005) A new hypothesis about the surface circulation in the eastern basin of the mediterranean sea. 66, 287–298.
Hamel J. & Mercier A. (2008) Population status , fisheries and trade of sea cucumbers in temperate areas of the Northern Hemisphere. FAO Fisheries and Aquaculture Technical Paper, 257–291.
Hare M.P., Nunney L., Schwartz M.K., Ruzzante D.E., Burford M., Waples R.S., Ruegg K., & Palstra F. (2011) Understanding and estimating effective population size for practical application in marine species management. Conservation biology : the journal of the Society for Conservation Biology, 25, 438–449.
Harrington J.M., Myers R.A., & Rosenberg A.A. (2005) Wasted fishery resources : discarded by-catch in the USA. Fish and Fisheries, 6, 350–361.
Hedgecock D., Barber P.H., & Edmands S. (2007a) Marine Population Connectivity. Genetic Approaches to Measuring Connectivity. Oceanography, 20, 70–79.
Hedgecock D., Launey S., Pudovkin A.I., Naciri Y., Lapègue S., & Bonhomme F. (2007b) Small effective number of parents ( N b ) inferred for a naturally spawned cohort of juvenile European flat oysters Ostrea edulis. Springer Science+Business Media, 150, 1173–1182.
Heslop E.E., Ruiz S., Allen J., López-Jurado J.L., Renault L., & Tintoré J. (2012) Autonomous underwater gliders monitoring variability at “choke points” in our ocean system: A case study in the Western Mediterranean Sea. Geophysical Research Letters, 39, n/a–n/a.
Hindar K., Tufto J., Sattem L., & Balstad T. (2004) Conservation of genetic variation in harvested salmon populations. ICES Journal of Marine Science, 61, 1389–1397.
Hughes A.D. & Kelly M.S. (2006) Integrated multi-trophic aquaculture. Aquaculture.
Hutchings J. A & Baum J.K. (2005) Measuring marine fishes biodiversity: temporal changes in abundance, life history and demography. Philosophical transactions of the Royal Society of London. Series B, Biological sciences, 360, 315–38.
ICES (2014) Report of the Working Group on the Application of Genetics in Fisheries and Mariculture (WGAGFM). .

77
Imai I., Yamaguchi M., & Hori Y. (2006) Eutrophication and occurrences of harmful algal blooms in the Seto Inland Sea, Japan. Plankton Benthos Res, 1, 71–84.
Jakobsson M., Edge M.D., & Rosenberg N.A. (2012) The relationship between FST and the frequency of the most frequent allele. Genetics, .
Jones J.B. (1992) Environmental impact of trawling on the seabed : a review. New Zealand Journal of Marine and Freshwater Research, 26, 59–67.
Jørgensen C., Enberg K., Dunlop E.S., Arlinghaus R., Boukal D.S., Brander K., Ernande B., Gårdmark A., Johnston F., Matsumura S., Pardoe H., Raab K., & Silva A. (2007) Managing Evolving Fish Stocks. Science, 318, .
Kang J.H., Kim Y.K., Kim M.J., Park J.Y., An C.M., Kim B.S., Jun J.C., & Kim S.K. (2011) Genetic differentiation among populations and color variants of sea cucumbers (Stichopus japonicus) from Korea and China. International journal of biological sciences, 7, 323–32.
Kochzius M., Seidel C., Antoniou A., Botla S.K., Campo D., Cariani A., Vazquez E.G., Hauschild J., Hervet C., Hjörleifsdottir S., Hreggvidsson G., Kappel K., Landi M., Magoulas A., Marteinsson V., Nölte M., Planes S., Tinti F., Turan C., Venugopal M.N., Weber H., & Blohm D. (2010) Identifying Fishes through DNA Barcodes and Microarrays. PloS one, 5, 15.
Kuparinen A. & Merila J. (2007) Detecting and managing fisheries- induced evolution. Trends in Ecology & Evolution, 22, 8.
Law R. (2007) Fisheries-induced evolution: present status and future directions. Marine Ecology Progress Series, 335, 271–277.
Lowe C.D., Martin L.E., Montagnes D.J.S., & Watts P.C. (2012) A legacy of contrasting spatial genetic structure on either side of the Atlantic-Mediterranean transition zone in a marine protist. Proceedings of the National Academy of Sciences of the United States of America, 109, 20998–1003.
Maggi C. & González-Wanguermert M. (2015) Genetic differentiation among Parastichopus regalis populations from Western Mediterranean Sea: potential effects of its fishery and current connectivity. Mediterranean Marine Science, .
Mantel N. (1967) The detection of disease clustering and a generalized regression approach. Cancer research, 27, 209–20.
Maruyama T. & Fuerst P. A. (1984) Population Bottlenecks and Nonequilibrium Models in Population Genetics. I. Allele Numbers When Populations Evolve From Zero Variability. Genetics, 108, 745–763.
Massin C. (1982) Effects of feeding on the environment: Holothuroidea. Echinoderm nutrition (ed. by M. Jangoux and J.M. Lawrence), pp. 493–487. A.A. Balkema, Rotterdam.

78
Millot C. & Taupier-Letage I. (2005) Circulation in the Mediterranean Sea. Hdb Environment Chemical, 5, 323–334.
Mitchell M.W., Locatelli S., Clee P.R.S., Thomassen H. A., & Gonder M.K. (2015) Environmental variation and rivers govern the structure of chimpanzee genetic diversity in a biodiversity hotspot. BMC Evolutionary Biology, 1–13.
Mohamedeen H. & Hartnoll R. (1990) Larval and postlarval growth of individually reared specimens of the common shore crab Carcinus maenas (L.). Journal of Experimental Marine Biology and Ecology, 11–24.
Navarro P.G. (2012) Biología y Ecología de las Holoturias [Echinodermata: Holothuroidea] de la isla de Gran Canaria (Atlántico Central-Oriental. Universidad de Las Palmas de Gran Canaria,
Navarro P.G., García-Sanz S., & Tuya F. (2013) Patrones de abundancia y talla de Holothuria sanctori, Holothuria mammata y Holothuria arguinensis (Echinodermata: Holoturoidea) en la isla de Gran Canaria, Atlántico oriental. Revista de biología marina y oceanografía, 48, 273–284.
Nelson E.J., MacDonald B. A., & Robinson S.M.C. (2012) The absorption efficiency of the suspension-feeding sea cucumber, Cucumaria frondosa, and its potential as an extractive integrated multi-trophic aquaculture (IMTA) species. Aquaculture, 370-371, 19–25.
Neori A., Chopin T., Troell M., Buschmann A.H., Kraemer G.P., Halling C., Shpigel M., & Yarish C. (2004) Integrated aquaculture: rationale, evolution and state of the art emphasizing seaweed biofiltration in modern mariculture. Aquaculture, 231, 361–391.
Nolasco R., Pires A.C., Cordeiro N., Le Cann B., & Dubert J. (2013) A high-resolution modeling study of the Western Iberian Margin mean and seasonal upper ocean circulation. Ocean Dynamics, 63, 1041–1062.
Olsen E.M., Heino M., Lilly G.R., Morgan M.J., Brattey J., Ernande B., & Dieckmann U. (2004) Maturation trends indicative of rapid evolution preceded the collapse of northern cod. Nature, 428, 932–5.
Van Oosterhout C., Hutchinson W.F., Wills D.P.M., & Shipley P. (2004) MICRO-CHECKER: Software for Identifying and Correcting Genotyping Errors in Microsatellite Data. Molecular Ecology Notes, 4, 535–538.
Ovenden J.R., Berry O., Welch D.J., Buckworth R.C., & Dichmont C.M. (2013) Ocean’s eleven: A critical evaluation of the role of population, evolutionary and molecular genetics in the management of wild fisheries. Fish and Fisheries, .
Paetkau D., Calvert W., & Strobeck I.S. (1995) Microsatellite analysis of population structure in Canadian polar bears. Molecular Ecology, 4, 347–354.
79
Pamilo P. (1988) Genetic variation in heterogeneous environments. Annales Zoologici Fennici, 25, 99–106.
Patarnello T., Volckaert F. A.M.J., & Castilho R. (2007) Pillars of Hercules: is the Atlantic-Mediterranean transition a phylogeographical break? Molecular ecology, 16, 4426–44.
Pauly D. (1998) Fishing Down Marine Food Webs. Science, 279, 860–863.
Pauly D., Watson R., & Alder J. (2005) Global trends in world fisheries: impacts on marine ecosystems and food security. Philosophical transactions of the Royal Society of London. Series B, Biological sciences, 360, 5–12.
Pérez F., Castro C., Álvarez-Salgado X.A., & Ríos A.F. (2001) Coupling between the Iberian basin—scale circulation and the Portugal boundary current system: a chemical study. Deep Sea Research Part I: Oceanographic Research Papers, 15, 1–15.
Pérez-Portela R., Villamor A., & Almada V. (2010) Phylogeography of the sea star Marthasterias glacialis (Asteroidea, Echinodermata): deep genetic divergence between mitochondrial lineages in the north-western mediterranean. Marine Biology, 157, 2015–2028.
Pérez-Ruzafa Á., González-Wangüemert M., Lenfant P., Marcos C., & García-Charton J.A. (2006) Effects of fishing protection on the genetic structure of fish populations. Biological Conservation, 129, 244–255.
Pinot J.M., López-Jurado J.L., & Riera M. (2002) The CANALES experiment (1996-1998). Interannual, seasonal, and mesoscale variability of the circulation in the Balearic Channels. Progress in Oceanography, 55, 335–370.
Pinsky M.L. & Palumbi S.R. (2014) Meta-analysis reveals lower genetic diversity in overfished populations. Molecular ecology, 23, 29–39.
Piry S., Alapetite A., Cornuet J., & Paetkau D. (2004) GeneClass2: A software for Genetic Assignment and First-Generation Migrant Detection. Journal of Heredity, 95, 536–539.
Piry S., Luikart G., & Cornuet J.M. (1999) BOTTLENECK: A Computer Program for Detecting Recent Reductions in the Effective Population Size Using Allele Frequency Data. The Jornal of Heredity, 90, 499–503.
Pope J.G., MacDonald D.S., Daan N., Reynolds J.D., & Jennings S. (2000) Gauging the impact of fishing mortality on non-target species. ICES Journal of Marine Science, 57, 689–696.
Pritchard J.K., Stephens M., & Donnelly P. (2000) Inference of population structure using multilocus genotype data. Genetics, 155, 945–959.

80
Purcell S. (2013) Increasing the value of sea cucumber harvests by improving postharvest processing of fishers. .
Purcell S.W., Hair C. A., & Mills D.J. (2012) Sea cucumber culture, farming and sea ranching in the tropics: Progress, problems and opportunities. Aquaculture, 368-369, 68–81.
Purcell S.W., Mercier A., Conand C., Hamel J.F., Toral-Granda M.V., Lovatelli A., & Uthicke S. (2013) Sea cucumber fisheries: global analysis of stocks, management measures and drivers of overfishing. Fish and Fisheries, 14, 34–59.
R Development Core Team (2013) R: a language and environment for statistical computing.
Ramón M., Lleonart J., & Massutí E. (2010) Royal cucumber (Stichopus regalis) in the northwestern Mediterranean: Distribution pattern and fishery. Fisheries Research, 105, 21–27.
Rawson M.V., Chen C., Ji R., Zhu M., Wang D., Wang L., Yarish C., Sullivan B.J., Chopin T., & Carmona R. (2002) Understanding the interaction of extractive and fed aquaculture using ecosystem modeling. Responsible Marine Aquaculture., 263–296.
Relvas P., Barton E.D., Dubert J., Oliveira P.B., Peliz Á., da Silva J.C.B., & Santos a. M.P. (2007) Physical oceanography of the western Iberia ecosystem: Latest views and challenges. Progress in Oceanography, 74, 149–173.
Renault L., Oguz T., Pascual a., Vizoso G., & Tintore J. (2012) Surface circulation in the Alborán Sea (western Mediterranean) inferred from remotely sensed data. Journal of Geophysical Research, 117, C08009.
Rice W.R. (1989) Analizing Tables of Statistical Tests. Evolution, .
Richardson A.J. (2008) In hot water: zooplankton and climate change. 279–295.
Robinson A.R. & Leslie W.G. (2001) Encyclopedia of Ocean Sciences. Elsevier,
Roff J. & Zacharias M. (2011) Marine Conservation Ecology. Earthscan,
Roggatz C.C. (2012) Health from the Ocean – Sea cucumbers as food of high nutritional value and source of bioactive compounds. Universidade do Algarve,
Roman J. & Palumbi S.R. (2004) A global invader at home: Population structure of the green crab, Carcinus maenas, in Europe. Molecular Ecology, 13, 2891–2898.
Rousset F. (2008) GENEPOP’007: a complete re-implementation of the genepop software for Windows and Linux. Molecular ecology resources, 8, 103–6.
Ryman N. & Utter F. (1987) Population genetics and fishery management. University of Washington, Washington.
81
Santos R.F.A. (2013) Estudo da Biologia Reprodutiva e do Potencial Biotecnológico e Alimentar de Holotúrias da Costa de Peniche. Escola Superior de Turismo e Tecnologia do Mar,
Sá-Pinto A., Branco M.S., Alexandrino P.B., Fontaine M.C., & Baird S.J.E. (2012) Barriers to Gene Flow in the Marine Environment: Insights from Two Common Intertidal Limpet Species of the Atlantic and Mediterranean. PLoS ONE, 7, .
Sayol J., Orfila A., Simarro G., Renault L., Gal A., Conti D., Sayol C., Orfila A., Simarro G., & L C. (2013a) Sea surface transport in the Western Mediterranean Sea : A Lagrangian perspective. 118, 6371–6384.
Sayol J.M., Orfila A., Simarro G., López C., Renault L., Galán A., & Conti D. (2013b) Sea surface transport in the Western Mediterranean Sea: A Lagrangian perspective. Journal of Geophysical Research: Oceans, 118, 6371–6384.
Scheffer M. & Carpenter S.R. (2003) Catastrophic regime shifts in ecosystems: linking theory to observation. Trends in Ecology & Evolution, 18, 648–656.
Schunter C., Carreras-Carbonell J., MacPherson E., TintorÉ J., Vidal-Vijande E., Pascual A., Guidetti P., & Pascual M. (2011) Matching genetics with oceanography: Directional gene flow in a Mediterranean fish species. Molecular Ecology, 20, 5167–5181.
Schwartz M.K., Luikart G., & Waples R.S. (2007) Genetic monitoring as a promising tool for conservation and management. Trends in Ecology and Evolution, 22, 25–33.
She J.X., M. Autemm, Kotulas G., Pasteur N., & Bonhomme F. (1987) Multivariate analysis of genetic exchanges between Solea segalensis (Teleosts, Soleidae). Biological Journal of the Linnean Society, 32, 357–371.
Sicuro B. & Levine J. (2011) Sea Cucumber in the Mediterranean: A Potential Species for Aquaculture in the Mediterranean. Reviews in Fisheries Science, 19, 299–304.
Sicuro B., Piccinno M., Gai F., Abete M.C., Danieli A., Dapra F., Mioletti S., & Vilella S. (2012) Food Quality and Savety of Mediterranean Sea Cucumbers Holothuria tubulosa and Holunthuria polii in Southern Adriatic Sea. Asian Journal of Animal and Veterinary Advances, 7, 851–859.
Siegenthaler A. (2013) Spatial Distribution Patterns and Population Structure of Holothuria Arguinensis in the Ria Formosa ( Portugal ). University of Algarve,
Slater M.J. & Carton A.G. (2007) Survivorship and growth of the sea cucumber Australostichopus (Stichopus) mollis (Hutton 1872) in polyculture trials with green-lipped mussel farms. Aquaculture, 272, 389–398.
Sokal R.R. & Rohlf F.J. (1981) Biometry. Freeman, San Francisco.
82
Stockwell C. A., Hendry A.P., & Kinnison M.T. (2003) Contemporary evolution meets conservation biology. Trends in Ecology & Evolution, 18, 94–101.
Stokes K. & Law R. (2000) Fishing as an evolutionary force. Marine Ecology Progress Series, 208, 307–313.
Swain D.P., Sinclair A.F., & Mark Hanson J. (2007) Evolutionary response to size-selective mortality in an exploited fish population. Proceedings. Biological sciences / The Royal Society, 274, 1015–22.
Thériault V., Dunlop E.S., Dieckmann U., Bernatchez L., & Dodson J.J. (2008) The impact of fishing-induced mortality on the evolution of alternative life-history tactics in brook charr. Evolutionary Applications, 1, 409–423.
Troell M., Halling C., Neori A., Chopin T., Buschmann A., Kautsky N., & Yarish C. (2003) Integrated mariculture: asking the right questions. Aquaculture, 226, 69–90.
United Nations (2013) World population projected to reach 9.6 billion by 2050 with most growth in developing regions , especially Africa – says UN. .
United Nations, Department of Economic and Social Affairs P.D. (2013) World Population Prospects: The 2012 Revision, Highlights and Advance Tables. .
Uthicke S. (1999) Sediment Bioturbation and Impact of Feeding Activity of Holothuria (Halodeima) atra and Stichopus Chloronotus, Two sediment Feeding Holothurians, at Lizard Island, Great Barrier Reef. Bulletin of Marine Science, 64, 129–141.
Uthicke S. (2001) Nutrient regeneration by abundant coral reef holothurians. Journal of Experimental Marine Biology and Ecology, 265, 153–170.
Uthicke S. & Conand C. (2005) Local examples of beche-de-mer overfishing: An initial summary and request for information. SPC beche-de-mer Information Bulletin, 9–14.
Uthicke S. & Klumpp D. (1998) Microphytobenthos community production at a near-shore coral reef: seasonal variation and response to ammonium recycled by holothurians. Marine Ecology Progress Series, 169, 11.
Uthicke S., Welch D., & Benzie J. A. H. (2004) Slow Growth and Lack of Recovery in Overfished Holothurians on the Great Barrier Reef: Evidence from DNA Fingerprints and Repeated Large-Scale Surveys. Conservation Biology, 18, 1395–1404.
Valente S., Serrão E. A., & González-Wangüemert M. (2015) West versus East Mediterranean Sea: origin and genetic differentiation of the sea cucumber Holothuria polii. Marine Ecology, 1–11.
Vinas J., Perez-Serra A., Vidal O., Alvarado Bremer J.R., & Pla C. (2010) Genetic differentiation between eastern and western Mediterranean swordfish revealed by
83
phylogeographic analysis of the mitochondrial DNA control region. ICES Journal of Marine Science, 67, 1222–1229.
Vitor C. Sousa, Grelaud A., & Hey J. (2011) On the non-identifiability of migration time estimates in isolation with migration models. Molecular Ecology, 29, 3956–3962.
Ward R. (2000) Genetics in fisheries management. Hydrobiologia, 420, 191–201.
Watts P.C., Saccheri I.J., Kemp S.J., & Thompson D.J. (2007) Effective population sizes and migration rates in fragmented populations of an endangered insect (Coenagrion mercuriale: Odonata). Journal of Animal Ecology, 76, 790–800.
Weir B.S. (1996) Genetic Data Analysis II: Methods for Discrete Population Genetic Data. Sinauer Associates, Massachusetts.
Weir B.S. & Cockerham C.C. (1984) Estimating F-Statistics for the Analysis of Population Structure. Evolution, 38, 1358–1370.
White C., Kendall B.E., Gaines S., Siegel D. A., & Costello C. (2008) Marine reserve effects on fishery profit. Ecology Letters, 11, 370–379.
Wilkinson-Herbots H.M. (2012) The distribution of the coalescence time and the number of pairwise nucleotide differences in a model of population divergence or speciation with an initial period of gene flow. Theoretical Population Biology, 82, 92–108.
Wolkenhauer S.M., Uthicke S., Burridge C., Skewes T., & Pitche R. (2010) The ecological role of Holothuria scabra (Echinodermata: Holothuroidea) within subtropical seagrass beds. Journal of the Marine Biological Association of the United Kingdom, 90, 215–223.
Yokoyama H. (2013) Growth and food source of the sea cucumber Apostichopus japonicus cultured below fish cages — Potential for integrated multi-trophic aquaculture. Aquaculture, 372-375, 28–38.
Webpage of the CUMFISH Project: http://www.ccmar.ualg.pt/cumfish/
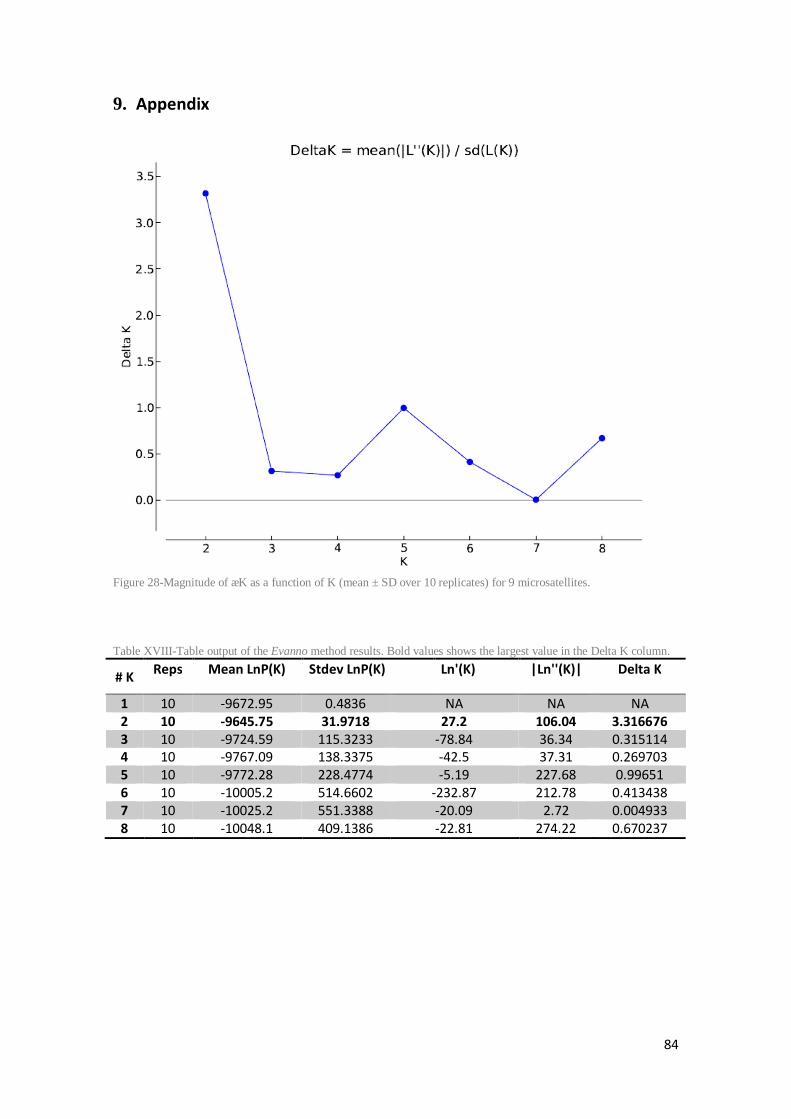
84
9. Appendix
Figure 28-Magnitude of ∆K as a function of K (mean ± SD over 10 replicates) for 9 microsatellites.
Table XVIII-Table output of the Evanno method results. Bold values shows the largest value in the Delta K column.
# K Reps Mean LnP(K) Stdev LnP(K) Ln'(K) |Ln''(K)| Delta K
1 10 -9672.95 0.4836 NA NA NA 2 10 -9645.75 31.9718 27.2 106.04 3.316676 3 10 -9724.59 115.3233 -78.84 36.34 0.315114 4 10 -9767.09 138.3375 -42.5 37.31 0.269703 5 10 -9772.28 228.4774 -5.19 227.68 0.99651 6 10 -10005.2 514.6602 -232.87 212.78 0.413438 7 10 -10025.2 551.3388 -20.09 2.72 0.004933 8 10 -10048.1 409.1386 -22.81 274.22 0.670237