genetic diversity among promising lines and their f1
TRANSCRIPT

Int.J.Curr.Microbiol.App.Sci (2017) 6(7): 2756-2768
2756
Original Research Article https://doi.org/10.20546/ijcmas.2017.607.386
Genetic Diversity among Promising Lines and their
F1 Progeny of Sponge Gourd [Luffa cylindrica (Roem) L.]
Yamuna Prasad Singh*, V.B. Singh, Praveen Kumar Singh,
Vimlesh Kumar and Ram Parsad
Department of Vegetable Science, Narendra Deva University of Agriculture and Technology,
Narendra Nagar, Kumarganj, Faizabad (U.P.) 224 229, India *Corresponding author
A B S T R A C T
Introduction
Luffa (Luffa cylindrica (L.) MJ. Roem syn. L.
aegyptica Mill.) are domesticated species and
commonly called as sponge gourd, loofah,
vegetable sponge or dish cloth. It belongs to
the family Cucurbitaceae with diploid
chromosome number 2n = 2x = 26 which
includes about 118 genera and 825 species. It
is one of the most important cucurbit, both as
International Journal of Current Microbiology and Applied Sciences ISSN: 2319-7706 Volume 6 Number 7 (2017) pp. 2756-2768 Journal homepage: http://www.ijcmas.com
The investigation revealed that the 54 genotypes (10 lines + 4 testers + 40 F1’s) of sponge
gourd in randomized block design with three replications during two seasons were grouped
into 8 distinct non over lapping clusters which indicated presence of considerable diversity
among the genotypes during both seasons, which shows clusters contained genotypes of
heterogenous origin. It is also suggested that there is no parallelism between genetic and
geographic diversity. Cluster I had highest number of genotypes (32 and 36) while, the
monogenotypic clusters II, III, IV and VI (1 and 1) having minimum genotype in both the
years, respectively. In Y1, the intra-cluster D2
values ranged from 0.00 to 420.45 while the
inter-cluster values ranged from 63.09 to 504.73. The highest intra-cluster distance was
420.45 for cluster VIII, while lowest one was zero for monogenotypic clusters II, III, IV
and VI. The maximum inter-cluster distance was observed between cluster II and cluster
VIII (504.73). In Y2, the intra-cluster D2
values ranged from 0.00 to 151.57 while the inter-
cluster value varied from 57.56 to 426.59. The highest intra-cluster distance was shown by
cluster VIII (151.57), whereas it was zero for mono-genotype clusters II, III IV and VI.
The maximum inter-cluster distance was observed between cluster V and cluster VIII
(426.59) suggesting that the genotypes/F1’s belonging to these clusters may be used as
parents/crosses for hybridization programme to develop desirable type F1 or segregates
because crosses between genetically divergent lines/crosses will generate heterotic F1s.
Highest inter-cluster value indicated that the selected breeding lines were highly divergent.
Cluster means for different traits indicated considerable differences between the clusters.
Cluster VI, VII and VIII in Y1 and cluster V, II and III in Y2 had in general medium mean
performance for most of the characters. Maximum cluster means for average fruit yield per
plant was observed in cluster II followed by cluster VI in Y1, while in Y2 cluster VI
recorded maximum cluster means for average fruit yield followed by cluster I. In Y1, vine
length (m) contributed maximum contribution towards total divergence while minimum
contribution was reflected by days to first fruit harvest in both the years, respectively.
K e y w o r d s
Sponge gourd,
Genetic
divergence,
D2 analysis,
Cluster analysis.
Accepted:
29 June 2017
Available Online:
10 July 2017
Article Info

Int.J.Curr.Microbiol.App.Sci (2017) 6(7): 2756-2768
2757
rainy and summer season vegetable which is
grown throughout the country and world. It
originated in subtropical Asian region
particularly India (Kaloo, 1993). Sponge
gourd is an annual and monoeceous cucurbit
plant and it has a gelatinous compound
luffien. The nutritive value of sponge gourd
fruits per 100 g edible portion (tough skin
removed, edible portion 80%) is: water 93.2
g, energy 18 kcal, protein 1.2 g, fat 0.2 g,
carbohydrate 2.9 g, fibre 2.0 g, Ca 36 mg, P
19 mg, Fe 1.1 mg, carotene 120 µg, thiamine
0.02 mg, riboflavin 0.06 mg, niacin 0.4 mg
and the composition of young leaves per 100
g edible portion is: water 89 g, protein 5.1 g,
carbohydrate 4.0 g, fibre 1.5 g, Ca 56 mg, Fe
11.5 mg, carotene 9.2 mg, ascorbic acid 95
mg. It used for scrubbing of body skin as a
bath sponge increased blood circulation and
utensils purposes. The tender fruits are rich in
vitamin A, vitamin C and iron (Yawalkar,
2004). It has certain medicinal uses. The
cooked fruits are easily digestible and very
appetizing, therefore, it is recommended to
the patients suffering from malaria or other
seasonal fevers. Among vegetables, cucurbits
are associated with the origin of agriculture
and dawn of human civilization. In food
crops, cucurbits are largest producer of
biological water and easily digestive and
recommended even to sick and frail patients.
Its flowers are yellow in colour and showy
having five petals. The inflorescences of
staminate flowers are raceme, while pistillate
flowers are solitary and short long
pendunculate. It produces fruits containing a
fibrous vascular system having vigorous vines
with cylindrical ten angled fruits, (Whitaker
and Davis, 1962). To develop a new variety
there is need of high magnitude of genetic
variability in the base material and the vast of
variability for desired characters. A good
knowledge on genetic diversity or genetic
similarity could be helpful in long term
selection gain in plants (Kumar et al., 2012).
Hence, genetic variability and diversity is of
prime interest to the plant breeder as it plays a
key role in framing a successful breeding
programme. The genetically diverse parents
are always able to produce high heterotic
effects and great frequency of desirable
segregants in further generations as already
reported by Kumar et al., (1994). D2 statistic
is a useful tool to measure genetic divergence
among genotypes in any crop as developed by
Mahalanobis (1936). However, in the present
study, an attempt has been made to identify
genetically divergent promising lines and
their F1 progenies, so as to select the potential
parents for breeding programme to attain the
anticipated improvement in fruit yield per
plant of sponge gourd either by crossing two
dissimilar parents to get heterotic F1 or by
making single cross, three way cross, double
cross and selfing of crosses (F1) obtained by
the divergent parents of sponge gourd.
Materials and Methods
The experimental materials consisted of 14
promising parental lines of sponge gourd and
their F1 progenies. Out of these advanced
breeding parental lines 10 parents were
choosen as lines and four as testers and
crossed as per L × T design to get 40 F1’s.
These experimental materials were grown
under Randomized Block Design (RBD) with
three replications at Main Experiment Station,
Department of Vegetable Science, Narendra
Deva University of Agriculture and
Technology, Narendra Nagar, Kumarganj,
Faizabad (U.P.) India. The treatments were
sown in rows spaced 2.50 meters apart with a
plant to plant spacing of 0.50 meter during
2013-14 (Y1) and 2014-15 (Y2). All the
recommended agronomic package of
practices and protection measures were
followed to raise a good crop. Fertilizers and
manures were applied as per recommended
dose. Observations were recorded on all the
six plants maintained carefully in each plot
for fourteen quantitative characters viz., node

Int.J.Curr.Microbiol.App.Sci (2017) 6(7): 2756-2768
2758
number to anthesis of first staminate flower,
node number to anthesis of first pistillate
flower, days to anthesis of first staminate
flower, days to anthesis of first pistillate
flower, node number of first fruit harvest,
days to first fruit harvest, number of primary
branches per plant, inter nodal length (cm),
vine length (m), fruit length (cm), fruit
circumference (cm), average fruit weight (g),
number of fruits per plant and average fruits
yield per plant (kg). Analysis of variance was
carried out as suggested by Panse and
Sukhatme (1967). Clustering of genotypes
was done according to Tocher’s method as
described by Rao (1952). The per cent
contribution of characters towards genetic
divergence was calculated according to Singh
and Chaudhary (1985). Genetic divergence
was estimated by using D2 statistics of
Mahalanobis (1936).
Results and Discussion
The analysis of variance (Table 1) revealed
that the significant differences were present
for all the characters studied and the
experimental materials were genetically
divergent from each other both (Y1 and Y2)
the years which indicated that there is ample
scope for selection of promising lines and
their F1 progenies from the present gene pool
aimed at enhancing genetic yield potential of
sponge gourd. All the fifty four genotypes
were grouped into 8 different non over
lapping clusters following Mahalanobis’s
methods (Table 2). Cluster I had highest
number of genotypes (32 and 36) while, the
monogenotypic clusters II, III, IV and VI (1
and 1) having minimum genotype in both the
years, respectively. The estimates of intra and
inter-cluster distances represented by D2
values are given in table 3. In Y1, the intra-
cluster D2
values ranged from 0.00 to 420.45
while the inter-cluster values ranged from
63.09 to 504.73. The highest intra-cluster
distance was 420.45 for cluster VIII, while
lowest one was zero for monogenotypic
clusters II, III, IV and VI. The maximum
inter-cluster distance was observed between
cluster II and cluster VIII (504.73). In Y2, the
intra-cluster D2
values ranged from 0.00 to
151.57 while the inter-cluster value varied
from 57.56 to 426.59. The highest intra-
cluster distance was shown by cluster VIII
(151.57), whereas it was zero for mono-
genotype clusters II, III IV and VI. The
maximum inter-cluster distance was observed
between cluster V and cluster VIII (426.59)
suggesting that the genotypes/F1’s belonging
to these clusters may be used as
parents/crosses for hybridization programme
to develop desirable type F1 or segregates
because crosses between genetically divergent
lines/crosses will generate heterotic F1s
Varalakshmi et al., (1994), Mathew et al.,
(2001), Karuppaiah et al., (2005), Islam et al.,
(2010) and Resmi et al., (2012) also reported
similar findings. As heterosis can be best
exploited and chances of getting transgressive
segregants are maximum when generating
diverse lines are crossed. High inter-cluster
value indicated that the selected breeding
lines were highly divergent in both the years
(Sundaram and Vadivel (2007) and Singh et
al., (2014).
Highest inter-cluster value indicated that the
selected breeding lines were highly divergent.
The comparison of clusters means revealed
considerable differences among the clusters of
different quantitative characters (Table 4).
Cluster VIII showed high mean value for
maximum five characters viz., node number to
anthesis of first staminate flower (10.47),
node number to anthesis of first pistillate
flower (14.13), days to anthesis of first
staminate flower (41.20), node number of first
fruit harvest (14.46) and days to first fruit
harvest (50.97), cluster II showed high mean
value for fruit circumference (9.30), number
of fruits per plant (37.63) and average fruits
yield per plant (3.87) and cluster VII showed
high mean value for inter nodal length (7.71)
and average fruit weight (172.65).

Int.J.Curr.Microbiol.App.Sci (2017) 6(7): 2756-2768
2759
Table.1 Analysis of variance for yield and its component traits in sponge gourd (Y1=2013-14 and Y2=2014-15)
S.
No.
Characters
Mean sum of Squares
Source of
variation Replications Treatments Error
Years Y1 Y2 Y1 Y2 Y1 Y2
df 2 2 53 53 106 106
1. Node no.to anthesis of first staminate
flower 0.07 0.10 12.09** 15.39** 0.13 0.12
2. Node no.to anthesis of first pistillate
flower 0.39 0.56 18.17** 18.06** 0.32 0.31
3. Days to anthesis of first staminate flower 0.14 3.38 85.67** 84.87** 3.73 3.53
4. Days to anthesis of first pistillate flower 2.10 1.38 75.00** 70.83** 4.02 4.16
5. Node no. of first fruit harvest 0.67 0.35 18.38** 16.55** 0.32 0.32
6. Days to first fruit harvest 7.47 8.75 66.32** 66.37** 7.32 7.08
7. No.of primary branches per plant 0.09 0.16 3.92** 4.51** 0.15 0.18
8. Inter nodal length (cm) 0.41 0.00 5.79** 5.59** 0.20 0.19
9. Vine length (m) 0.02 0.07 3.78** 3.27** 0.06 0.06
10. Fruit length (cm) 0.57 0.08 47.29** 43.56** 2.24 2.26
11. Fruit circumference (cm) 34.00 0.36 1.16** 1.48** 0.30 0.31
12. Average fruit weight (g) 132.48 23.15 1361.00** 1131.41** 60.43 57.29
13. No. of fruits per plant 6.65 2.11 93.07** 93.10** 2.60 2.43
14. Average fruits yield per plant (kg) 0.06 0.02 0.96** 1.16** 0.05 0.04

Int.J.Curr.Microbiol.App.Sci (2017) 6(7): 2756-2768
2760
Table.2 Clustering pattern of fifty four genotypes of sponge gourd on the basis of Mahalnobis ‘D2’
statistics (Y1=2013-14 and Y2=2014-15)
Cluster
number Years
No. of
genotypes Genotypes
I
Y1 32
NDSG-21 x NDSG-11, NDSG-55 x NDSG-15, NDSG-21 x NDSG-15, NDSG-4 x NDSG-15, NDSG-6 x NDSG-15,
NDSG-63 x NDSG-15, NDSG-2 x NDSG-15, NDSG-6 x Pusa Chikni(c), NDSG-21 x Pusa Chikni(c), NDSG-63 x
NDSG-12, NDSG-2 x NDSG-11, NDSG-6 x NDSG-12, NDSG-1 x NDSG-11, NDSG-55 x Pusa Chikni(c), NDSG-6
x NDSG-11, NDSG-1 x Pusa Chikni(c), NDSG-24 x NDSG-11, NDSG-55, NDSG-55 X NDSG-12, NDSG-18 X
NDSG-15, NDSG-1 X NDSG-15, NDSG-63 X Pusa Chikni, NDSG-24 X NDSG-12, NDSG-1 X NDSG-12, NDSG-2
X NDSG-12, NDSG-12, NDSG-18 X NDSG-12, Pusa Chikni ©, NDSG-55 X NDSG-11, NDSG-10 X Pusa Chikni,
NDSG-11, NDSG-4 X NDSG-11
Y2 36
NDSG-21 X NDSG-15, NDSG-55 X NDSG-15, NDSG-4 X NDSG-15, NDSG-2 X NDSG-15, NDSG-6 X NDSG-15,
NDSG-21 X NDSG-11, NDSG-63 X NDSG-15, NDSG-63 X NDSG-12, NDSG-2 X NDSG-11, NDSG-1 X NDSG-
11, NDSG-18 X NDSG-15, NDSG-55 X Pusa Chikni, NDSG-6 X NDSG-12, NDSG-2 X NDSG-12, NDSG-1 X
NDSG-12, NDSG-21 X Pusa Chikni, NDSG-1 X NDSG-15, NDSG-55 X NDSG-12, NDSG-55 X NDSG-11, NDSG-
1 X Pusa Chikni, NDSG-6 X Pusa Chikni, NDSG-6 X NDSG-11, NDSG-10 X Pusa Chikni, NDSG-24 X NDSG-12,
NDSG-10 X NDSG-12, NDSG-63 X Pusa Chikni, Pusa Chikni ©, NDSG-12, NDSG-55, NDSG-18 X NDSG-12,
NDSG-1, NDSG-24 X NDSG-11, NDSG-21 X NDSG-12, NDSG-10 X NDSG-15, NDSG-4 X NDSG-11, NDSG-24
X NDSG-15
II Y1 1 NDSG-18 X NDSG-11
Y2 1 NDSG-11
III Y1 1 NDSG-21 X NDSG-12
Y2 1 NDSG-2 X Pusa Chikni
IV Y1 1 NDSG-24 X NDSG-15
Y2 1 NDSG-4 X Pusa Chikni
V Y1 9
NDSG-4 X NDSG-12, NDSG-63 X NDSG-11, NDSG-4 X Pusa Chikni, NDSG-24 X Pusa Chikni, NDSG-18 X Pusa
Chikni, NDSG-10 X NDSG-12, NDSG-18, NDSG-24, NDSG-4
Y2 3 NDSG-10 X NDSG-11, NDSG-10, NDSG-4
VI Y1 1 NDSG-1
Y2 1 NDSG-24 X Pusa Chikni
VII
Y1 4 NDSG-10 X NDSG-15, NDSG-10, NDSG-10 X NDSG-11, NDSG-2 X Pusa Chikni
Y2 6 NDSG-4 X NDSG-12, NDSG-63 X NDSG-11, NDSG-18, NDSG-18 X Pusa Chikni, NDSG-24, NDSG-18 X NDSG-
11
VIII Y1 5 NDSG-6, NDSG-63, NDSG-2, NDSG-21, NDSG-15
Y2 5 NDSG-6, NDSG-63, NDSG-2, NDSG-21, NDSG-15

Int.J.Curr.Microbiol.App.Sci (2017) 6(7): 2756-2768
2761
Table.3 Intra-inter clusters D2 values for eight clusters in sponge gourd (Y1=2013-14 and Y2=2014-15)
Years Cluster I Cluster II Cluster III Cluster IV Cluster V Cluster VI Cluster VII
Cluster
VIII
Cluster I Y1 45.37 75.33 83.19 68.15 95.73 79.98 102.49 350.25
Y2 52.12 90.43 75.22 75.40 108.99 88.90 107.36 324.47
Cluster II Y1 0.00 182.34 117.52 139.38 162.52 170.76 504.73
Y2 0.00 69.14 87.57 73.71 190.84 121.15 417.83
Cluster III Y1 0.00 104.09 132.17 72.10 133.15 226.84
Y2 0.00 57.56 74.60 115.31 114.66 258.20
Cluster IV Y1 0.00 63.09 150.19 112.92 376.85
Y2 0.00 90.69 77.84 87.34 381.39
Cluster V Y1 56.79 156.65 155.59 422.21
Y2 45.13 192.84 171.88 426.59
Cluster VI Y1 0.00 167.28 226.01
Y2 0.00 100.37 343.85
Cluster VII Y1 100.38 420.45
Y2 98.80 392.30
Cluster VIII Y1 420.45
Y2 151.57

Int.J.Curr.Microbiol.App.Sci (2017) 6(7): 2756-2768
2762
Table.4 Intra-cluster group mean for 14 clusters in sponge gourd (Y1=2013-14 and Y2=2014-15)
Cluster number Years
Node no.to
anthesis of
first staminate
flower
Node no.to
anthesis of
first pistillate
flower
Days to
anthesis of
first staminate
flower
Days to
anthesis of first
pistillate flower
Node no. of
first fruit
harvest
Days to first
fruit harvest
No.of primary
branches per
plant
I Y1 4.59 7.59 30.23 34.28 8.29 45.98 6.31
Y2 4.53 7.77 30.74 34.94 8.34 46.20 6.36
II Y1 3.87 6.10 21.17 25.80 6.13 38.17 7.50
Y2 3.83 8.17 20.70 29.53 8.07 42.50 8.13
III Y1 4.50 12.20 30.07 38.17 13.30 50.33 4.87
Y2 4.53 10.13 34.13 37.27 10.63 51.27 6.50
IV Y1 4.80 7.33 31.47 32.33 8.03 44.27 7.17
Y2 4.23 7.10 25.37 31.67 8.00 54.63 7.20
V Y1 4.24 7.63 27.60 32.48 8.57 45.71 6.79
Y2 3.44 7.21 26.03 29.76 7.97 43.61 6.01
VI Y1 6.67 8.33 36.47 41.70 10.07 51.70 4.07
Y2 4.23 8.23 31.27 37.13 8.93 50.27 7.70
VII Y1 3.68 7.99 28.13 30.85 8.77 42.55 6.03
Y2 4.30 7.77 27.52 30.39 8.74 44.24 7.38
VIII Y1 10.47 14.13 41.20 41.36 14.46 50.97 5.89
Y2 11.62 14.29 40.37 40.19 14.67 50.30 5.89
Cluster number Years
Inter nodal
length (cm)
Vine length
(m)
Fruit length
(cm)
Fruit
circumference
(cm)
Average fruit
weight (g)
No. of fruits
per plant
Average fruits
yield per plant
(kg)
I Y1 6.94 2.95 24.07 8.79 143.47 26.19 3.21
Y2 7.13 3.04 23.99 8.80 146.80 25.36 3.18
II Y1 6.40 2.50 23.33 9.30 125.07 37.63 3.87
Y2 6.20 2.37 22.23 7.80 115.07 24.63 2.46
III Y1 7.60 3.63 21.03 9.27 135.73 27.27 3.16
Y2 4.37 3.33 23.37 8.23 145.10 16.47 2.08
IV Y1 8.30 5.33 18.43 8.37 130.27 22.23 2.56
Y2 4.93 4.40 27.20 7.60 170.27 17.47 2.79
V Y1 6.51 5.13 23.85 8.85 148.84 22.76 2.87
Y2 7.56 2.54 20.04 8.27 159.90 11.99 1.73
VI Y1 4.50 2.10 26.40 7.87 138.43 26.53 3.28
Y2 7.60 5.93 20.43 8.33 170.50 25.33 4.12
VII Y1 7.71 2.63 19.83 8.33 172.65 15.20 2.17
Y2 6.34 5.08 24.88 9.11 124.48 28.97 3.09
VIII Y1 6.40 3.19 25.80 8.79 143.98 22.87 2.83
Y2 6.17 3.15 25.47 9.03 144.01 21.61 2.87
Int.J.Curr.Microbiol.App.Sci (2017) 6(7): 2756-2768
2763
Table.5 Per cent contribution of 14 characters towards total genetic divergence in sponge gourd
(Y1=2013-14 and Y2=2014-15)
S. No. Characters Contribution (%)
Y1 Y2
1. Node no.to anthesis of first staminate flower 11.18 16.14
2. Node no.to anthesis of first pistillate flower 9.64 4.75
3. Days to anthesis of first staminate flower 0.84 3.35
4. Days to anthesis of first pistillate flower 1.96 1.54
5. Node no. of first fruit harvest 4.40 0.91
6. Days to first fruit harvest 0.21 0.14
7. Inter nodal length (cm) 12.37 10.69
8. No.of primary branches per plant 10.13 7.06
9. Vine length (m) 22.99 18.66
10. Fruit length (cm) 5.52 8.46
11. Fruit circumference (cm) 0.21 0.63
12. Average fruit weight (g) 3.63 2.31
13. No. of fruits per plant 14.40 12.37
14. Average fruits yield per plant (kg) 2.52 13.00
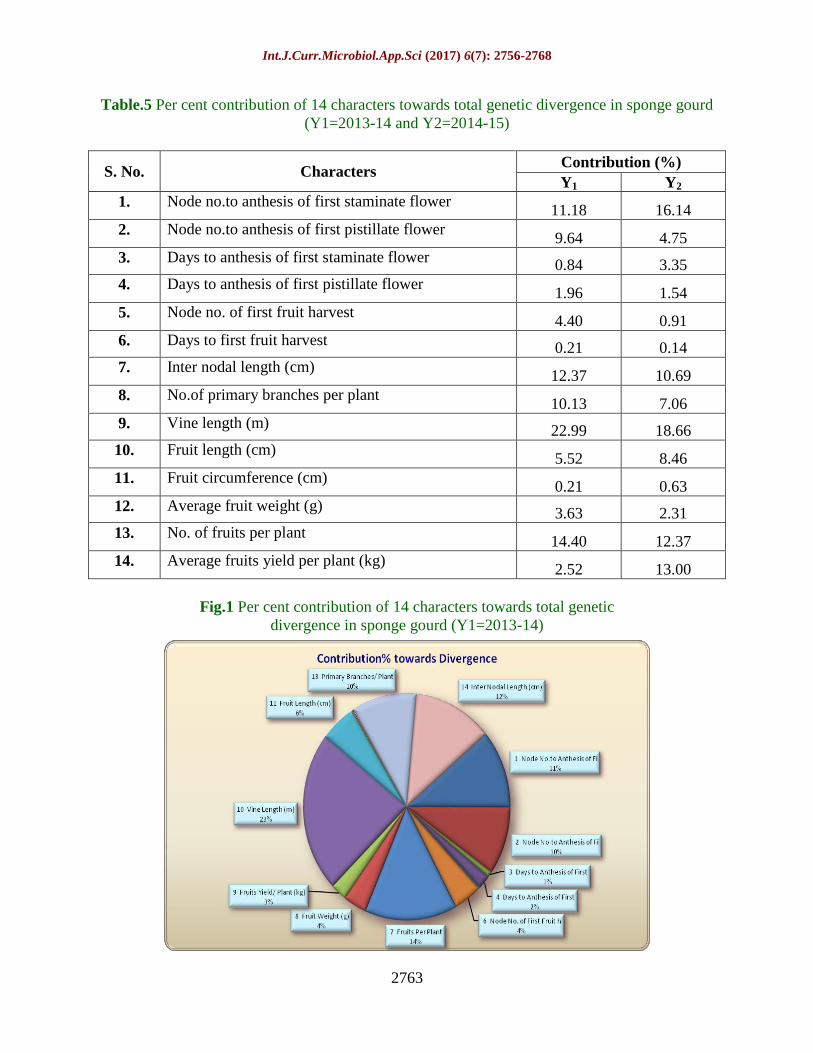
Fig.1 Per cent contribution of 14 characters towards total genetic
divergence in sponge gourd (Y1=2013-14)

Int.J.Curr.Microbiol.App.Sci (2017) 6(7): 2756-2768
2764
Fig.2 Per cent contribution of 14 characters towards total genetic divergence in sponge gourd
(Y2=2014-15)
Fig.3 Intra and inter cluster distance diagram for different quantitative characters in sponge
gourd by Tocher’s method (Y1=2013-14)

Int.J.Curr.Microbiol.App.Sci (2017) 6(7): 2756-2768
2765
Fig.4 Clustering by Tocher’s method in sponge gourd (Y1=2013-14)

Int.J.Curr.Microbiol.App.Sci (2017) 6(7): 2756-2768
2766
Fig.5 Clustering by Tocher’s method in sponge gourd (Y2=2014-15)

Int.J.Curr.Microbiol.App.Sci (2017) 6(7): 2756-2768
2767
Fig.6 Intra and inter cluster distance diagram for different quantitative characters in sponge
gourd by Tocher’s method (Y2=2014-15)
Whereas, cluster IV and VI showed high
mean value for single character which were
number of primary branches per plant (7.17)
and fruit length (26.40), respectively in Y1.
Cluster VIII showed high mean value for
maximum five characters viz., node number to
anthesis of first staminate flower (11.62),
node number to anthesis of first pistillate
flower (14.29), days to anthesis of first
staminate flower (40.37),days to anthesis of
first pistillate flower (40.19) and node number
of first fruit harvest (14.67), cluster VI
showed high mean value for inter nodal
length (7.60), vine length (5.93), average fruit
weight (170.50) and average fruits yield per
plant (4.12) whereas, cluster II, IV and VII
showed high mean value for single character
which were number of primary branches per
plant (8.13), days to first fruit harvest(54.63),
and number of fruits per plant (28.97),
respectively in Y2.
Highest per cent contribution towards total
genetic divergence (Table 5) was exhibited by
vine length (22.99 and 18.66) while minimum
contribution was reflected by days to first
fruit harvest (0.21 and 0.14 %) in both the
years, respectively. Rest of the characters
exhibited low contribution towards total
genetic divergence (Figs. 1 and 2). Therefore,
necessary attention is required to be focused
on these characters.
Intra and inter-cluster distance diagram for
different quantitative characters in sponge
gourd is given in Figure 3 and 6. Clustering
by Tocher method shows that the lines/F1’s
fall in to same cluster having lowest degree of
divergence from each other (Figs. 4 and 5)
and crosses among the lines/F1’s of the same
cluster will be unable to produce any
transgressive segregants. While, the lines/F1’s
belonging to different clusters having

Int.J.Curr.Microbiol.App.Sci (2017) 6(7): 2756-2768
2768
maximum divergence can be successfully
utilize in hybridization programmes to get
desirable heterotic F1’s /transgressive
segregants.
References
Badade, D.S., Warade, S.D. and Gaikwad,
S.K. 2001. Genetic divergence in bottle
gourd. J. Maharashtra Agril.
Universities, 26(2): 137-139.
Islam, M.R., Hossain, M.S., Bhuijan, M.S.R.,
Hasan, G.N. and Syed, A. 2010.
Multivariate analysis of bitter gourd.
Middle East J. Sci. Res., 5(2): 86-90.
Kalloo, G. 1993. Loofah-Luff S.P.P. (ed.).
Genetic Improvement of Vegetable
Crops, pp. 265-266.
Karuppaiah, P., Kavita, R. and Kumar, P.S.
2005. Correlation and path analysis in
ridge gourd (Luffa acutangula L.). Crop
Res., 29: 490-494.
Kumar, D., Malik, B.P.S. and Singh, V.P.
1994. Assessing genetic divergence and
identification of promising parents for
hybridization in field pea (Pisum
sativum L.). Legume Res., 17(3-4): 225-
228.
Kumar, H., Srivastava, A., Vishwakarma,
M.K. and Lal, J.P. 2012. Genetic
enhancement of variability through
induced mutagenesis in two genotypes
of Brassica napus L. Madras Agric. J.,
99(4-6): 228-231.
Mahalanobis, P.C. 1936. On generalized
distance in statistics. Proceedings of
national institute of science. 2: 49-55.
Mathew, A., Markose, B.L., Rajan, S. and
Devi, S.N. 2001. Genetic divergence in
bottle gourd [Lagenaria siceraria
(Mol.) Standl.]. Veg. Sci., 28(2): 121-
123.
Panse, V.G. and Shukhatme, P.V. 1967.
Statistical Methods for Agricultural
Workers, 2nd
eds. Indian Council of
Agriculture Research, New Delhi, pp.
235-247.
Rao, C.R. 1952. Advanced statistical method
in biometrical Res., J. Wiley and Sons,
Inc. New York., 15(10): 130-134.
Singh, R.K. and Chaudhary, B.D. 1985.
Biometrical methods in quantitative
genetic analysis, Kalyani publishers,
New Delhi-Ludhiana, India. p. 318.
Sundaram, V. and Vadivel, E. 2007. Genetic
divergence in bitter gourd under salt
stress. Crop Res., 1/3: 139-142.
Varalakshmi, B., Reddy, Y.N. and Reddy,
B.M. 1994. Genetic divergence in ridge
gourd. J. Genet. Pl. Breed., 48(2): 131-
134.
Whitaker, T.W. and Davis, G.N. 1962.
Cucurbits. Interscience Publ. Inc. New
York, pp-250.
Yawalkar, K.S. 2004. Cucurbitaceous or vine
crops. Vegetable Crops of India (V.ed.),
p. 152-155.
How to cite this article:
Yamuna Prasad Singh, V.B. Singh, Praveen Kumar Singh, Vimlesh Kumar and Ram Parsad.
2017. Genetic Diversity among Promising Lines and their F1 Progeny of Sponge Gourd [Luffa
cylindrica (Roem) L.]. Int.J.Curr.Microbiol.App.Sci. 6(7): 2756-2768.
doi: https://doi.org/10.20546/ijcmas.2017.607.386