genetic evaluation, blup
TRANSCRIPT

Genetic Evaluation, BLUP Lecture 11 Introduction to Breeding and Genetics GENE 251/351 School of Environment and Rural Science (Genetics)

Estimation of Breeding Values in livestock in Australia
• Genetic evaluation systems Beef: BREEDPLAN via breed societies
Sheep: Sheep Genetics: Lambplan, MerinoSelect
Dairy: ADHIS
– Breeder submits phenotypes and pedigree
– Genetic evaluation system returns EBVs • plus other information e.g. selection indexes, accuracies,
inbreeding coefficients
– Calculating of EBVs is generally via BLUP method

Extract from LAMBPLAN report
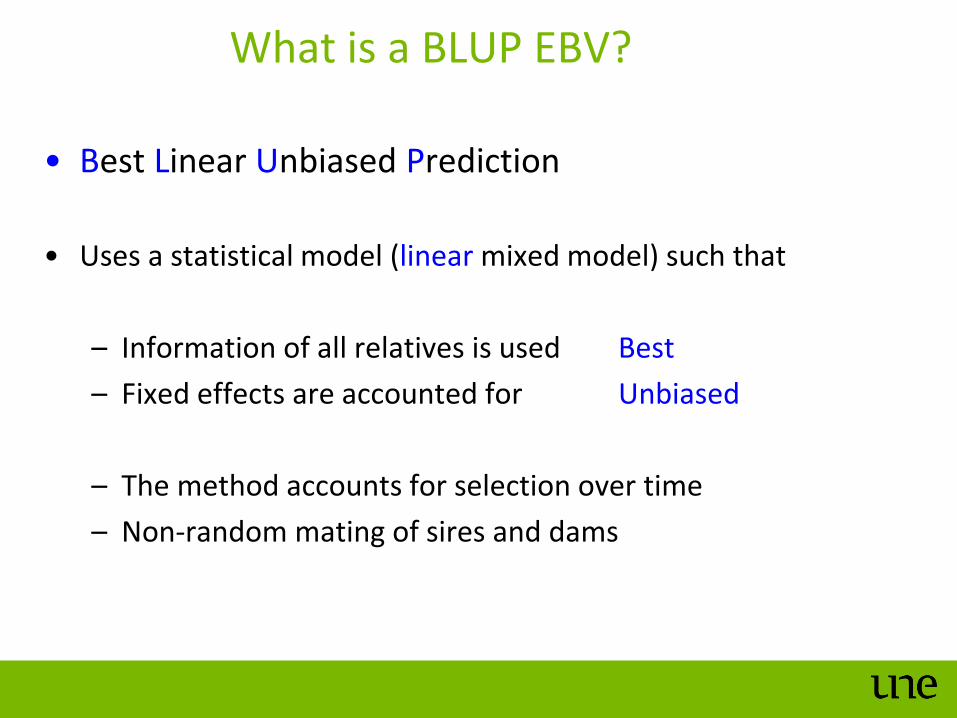
What is a BLUP EBV?
• Best Linear Unbiased Prediction
• Uses a statistical model (linear mixed model) such that
– Information of all relatives is used Best
– Fixed effects are accounted for Unbiased
– The method accounts for selection over time
– Non-random mating of sires and dams

Accuracy of EBV = correlation with True BV
Accuracy = 45% Accuracy = 90%
EBV EBV
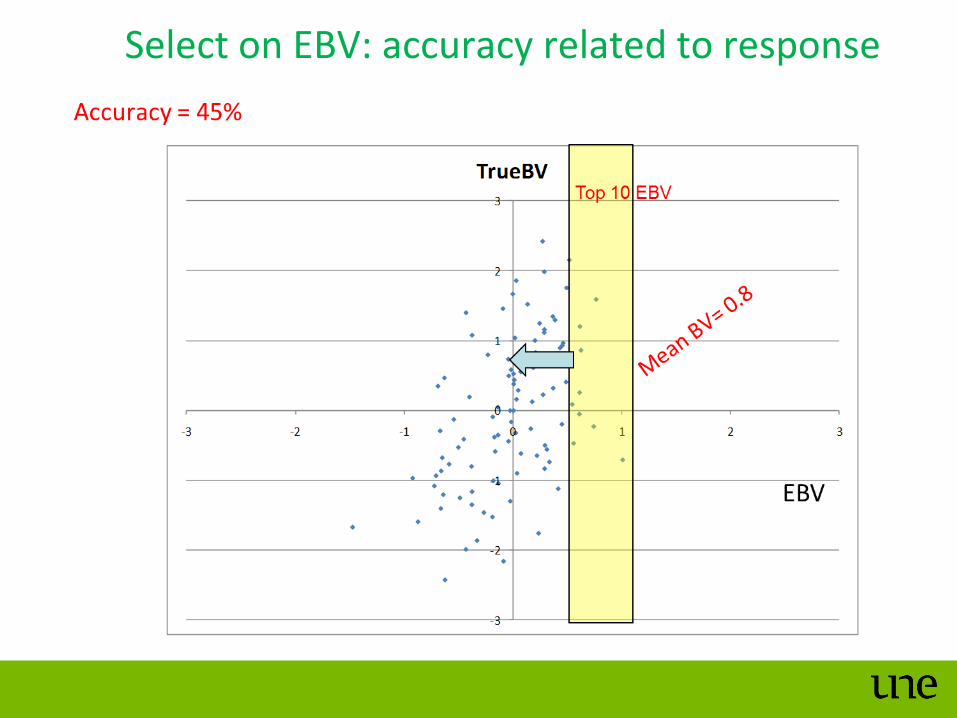
Select on EBV: accuracy related to response

Double accuracy gives double selection response!
-3
-2
-1
0
1
2
3
-3 -2 -1 0 1 2 3
TrueBV
EBV
Top 10 EBV
Accuracy = 90%

the more accuracy, the more response
-3
-2
-1
0
1
2
3
-3 -2 -1 0 1 2 3
TrueBV
Accuracy = 45%
EBV
Top 10 EBV
-3
-2
-1
0
1
2
3
-3 -2 -1 0 1 2 3
TrueBV
EBV
Top 10 EBV

Accuracy of predicting a breeding value
Info used. h2 = 0.25 Accuracy of EBV
Sire + Dam 0.35
Prog Tested Sire + Dam 0.49
… ……………………. + Own Record 0.63
............................................. + DNA markers 0.71
................................................ . + 30 progeny 0.85
................................................ + 1000 progeny 0.99
9
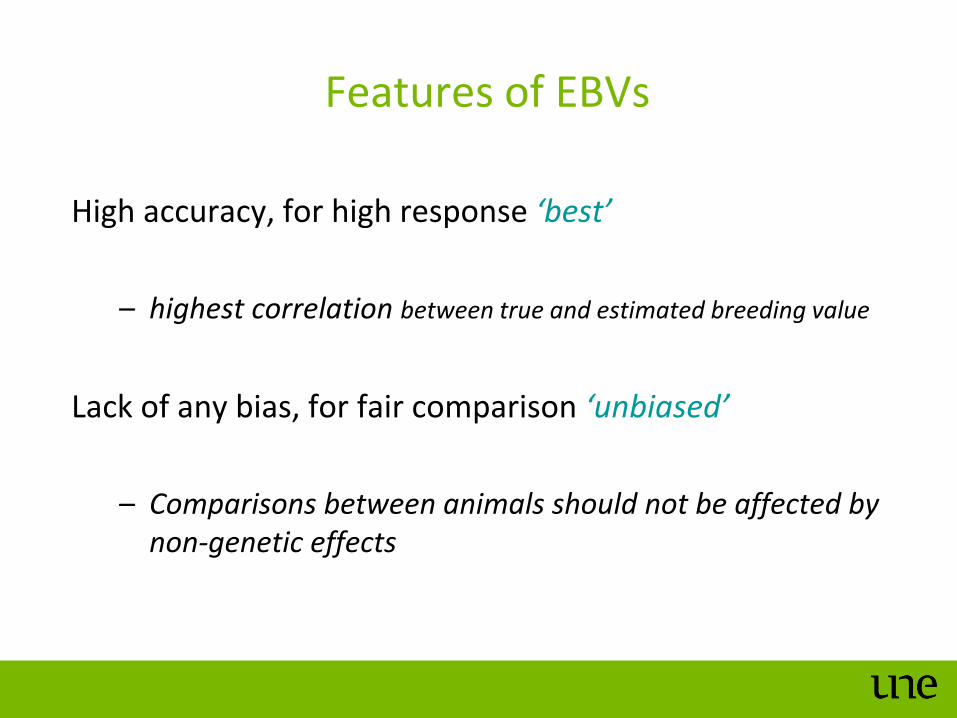
Features of EBVs
High accuracy, for high response ‘best’
– highest correlation between true and estimated breeding value
Lack of any bias, for fair comparison ‘unbiased’
– Comparisons between animals should not be affected by non-genetic effects

Possible causes of bias from ‘fixed effects’
– Problem: Animals reared as different birth/rearing type
– Solution: Compare phenotypes with others of same type
– Problem: Animals producing in different herds
– Solution: Take phenotypic deviation from herd mean
– Problem: Animals are measured at different ages
– Solution: Correct phenotypes back to the appropriate age

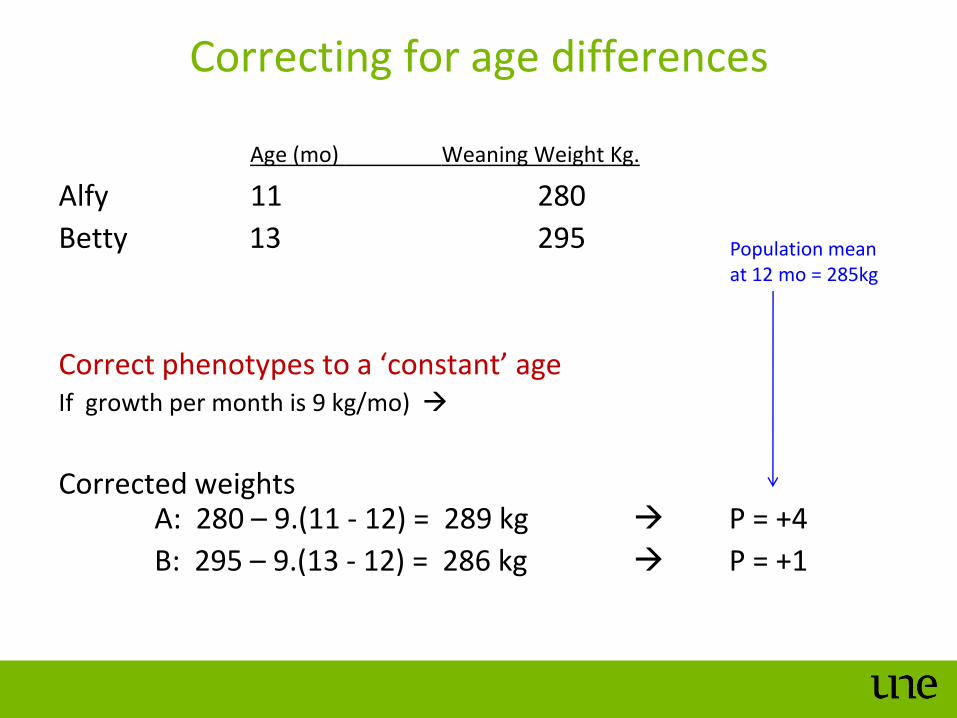
Correcting for age differences
Age (mo) Weaning Weight Kg.
Alfy 11 280
Betty 13 295
Population mean at 12 mo = 285kg
Correcting for age differences
Age (mo) Weaning Weight Kg.
Alfy 11 280
Betty 13 295
Correct phenotypes to a ‘constant’ age If growth per month is 9 kg/mo)
Corrected weights A: 280 – 9.(11 - 12) = 289 kg P = +4
B: 295 – 9.(13 - 12) = 286 kg P = +1
Population mean at 12 mo = 285kg

Example of contemporary groups
Bull YW Herd Ave P EBV h2=40%
Bert 330 300
Flossy 300 260 +16 +12
+40
+30
Note that this assumes that herds have the same genetic mean
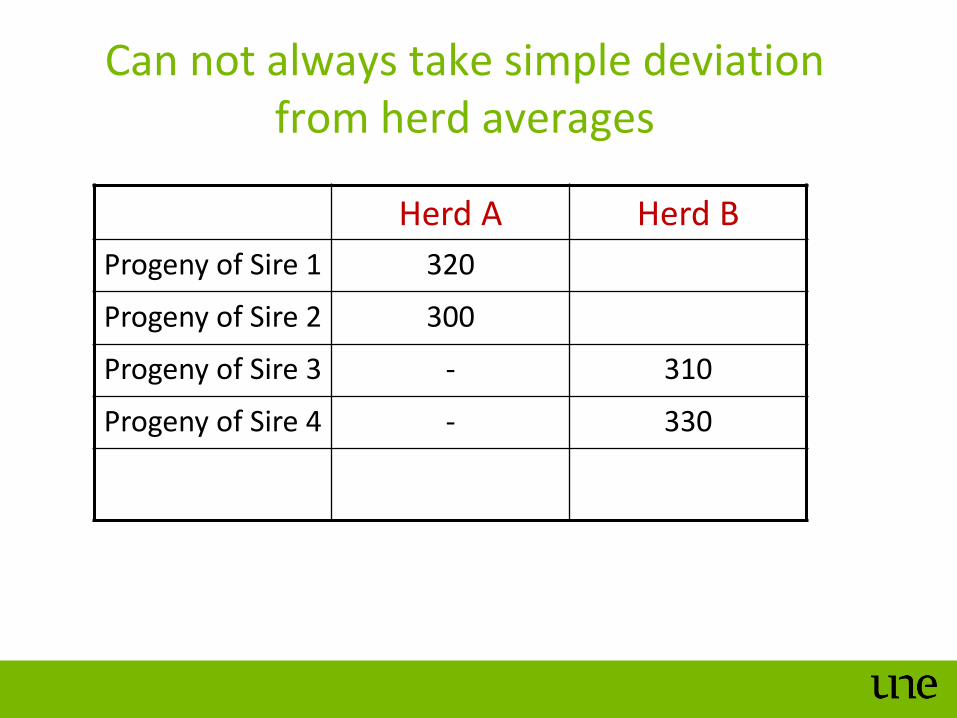
Can not always take simple deviation from herd averages
Herd A Herd B
Progeny of Sire 1 320
Progeny of Sire 2 300
Progeny of Sire 3 - 310
Progeny of Sire 4 - 330

Can not always take simple deviation from herd averages
A linear model is used to correct for unbalanced data
Herd A Herd B
Progeny of Sire 1 320
Progeny of Sire 2 300
Progeny of Sire 3 - 310
Progeny of Sire 4 - 330
Progeny of Sire 5 290 340
Link sire
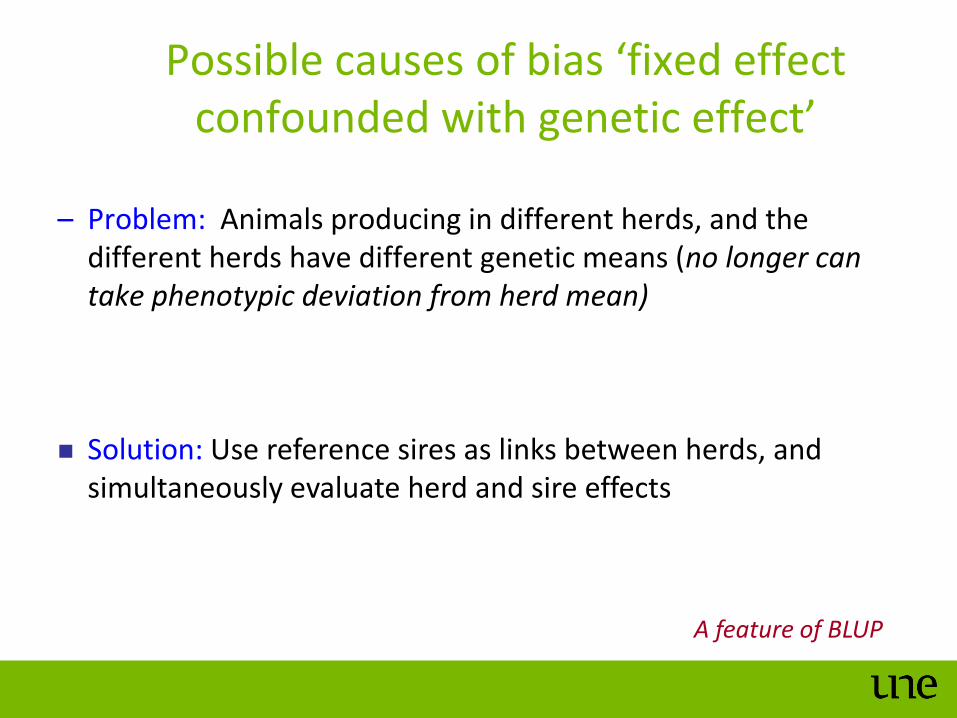
Solution: Use reference sires as links between herds, and simultaneously evaluate herd and sire effects
Possible causes of bias ‘fixed effect confounded with genetic effect’
– Problem: Animals producing in different herds, and the different herds have different genetic means (no longer can take phenotypic deviation from herd mean)
A feature of BLUP

– Linkage between flocks/herd is now substantial
– This allows across-flock and even across-breed analysis
In most genetic evaluation programs:

Solution: Account for mates by evaluating all animals jointly
– Problem: Some sires have better mates
Sire 1: +300 Dam 1: +200 Progeny: +250
Sire 2: +300 Dam 2: +300 Progeny: +300
Possible causes of bias ‘unequal merit of mates’
Without information on the dams, sire 2
would ‘look better’ due to a higher progeny mean
A feature of BLUP

– Problem: There is culling and selection
• worst sires have more progeny culled ‘culling bias’
• animals are from selected parents
Possible causes of bias ‘selection bias’
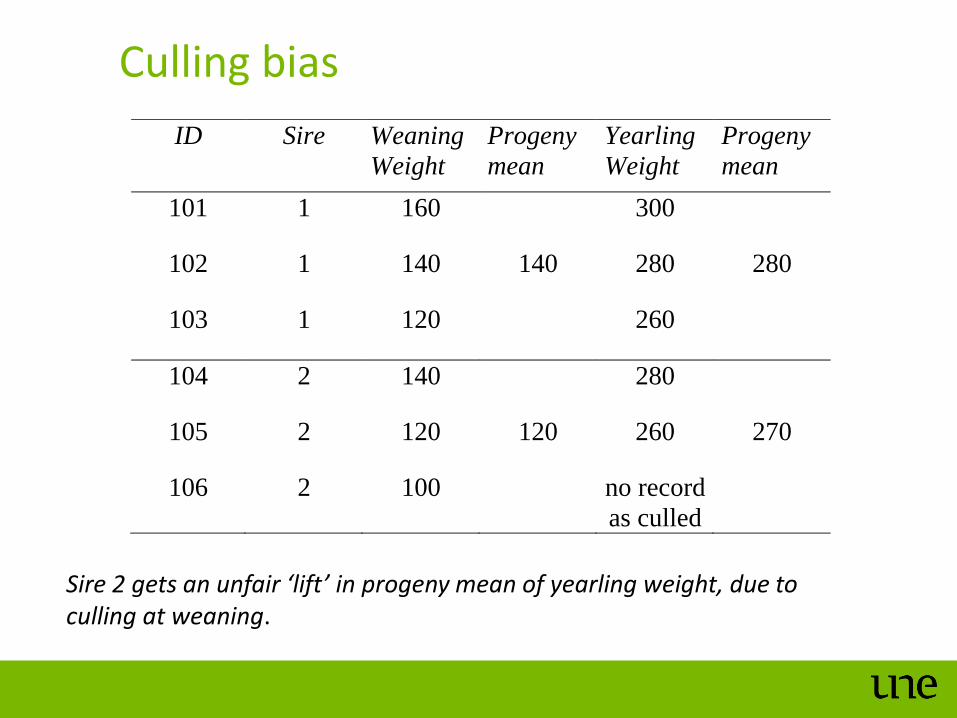
ID Sire Weaning
Weight
Progeny
mean
Yearling
Weight Progeny
mean
101 1 160 300
102 1 140 140 280 280
103 1 120 260
104 2 140 280
105 2 120 120 260 270
106 2 100 no record
as culled
Sire 2 gets an unfair ‘lift’ in progeny mean of yearling weight, due to culling at weaning.
Culling bias

Animals are from selected parents
350 300 250
325 315 285 Year 2
Year 1 Mean = 300
Mean = 308

Estimating genetic trend
350 300 250
325 315 285 Year 2
Year 1 Mean = 300
Mean = 308
EBV: 14 -2 -13
EBV: 10 8 -4
Ave Year
EBV Effect
0 300
5 304
0123456789
1 2
P
E
A
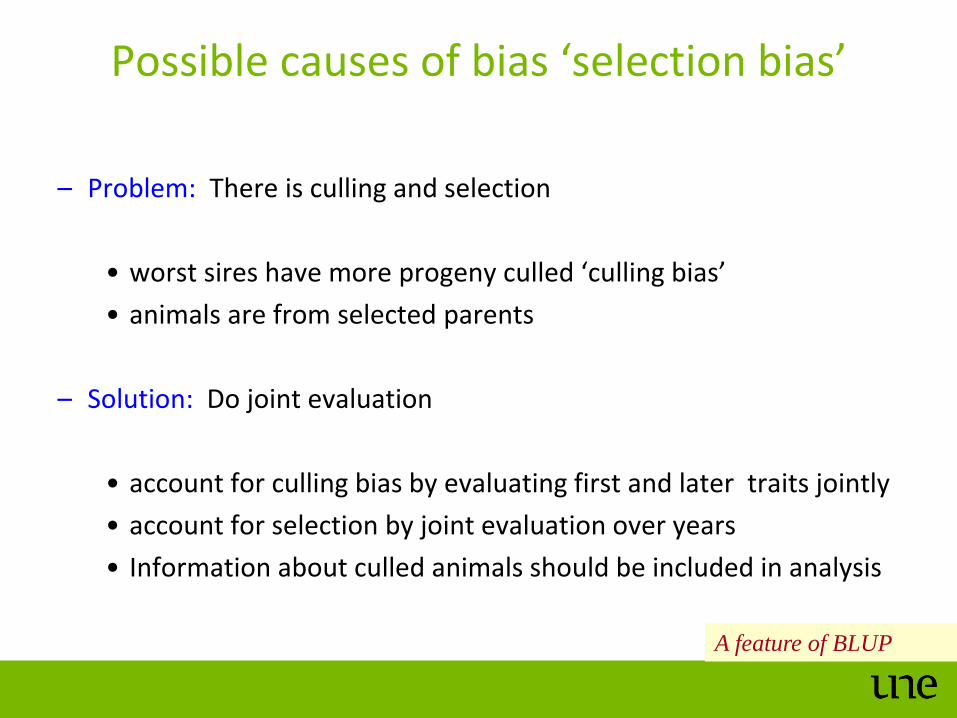
– Problem: There is culling and selection
• worst sires have more progeny culled ‘culling bias’
• animals are from selected parents
– Solution: Do joint evaluation
• account for culling bias by evaluating first and later traits jointly
• account for selection by joint evaluation over years
• Information about culled animals should be included in analysis
Possible causes of bias ‘selection bias’
A feature of BLUP

Genetic trends
BLUP separates genetic and year effects
genetic trends can be observed by plotting BLUP EBVs over years

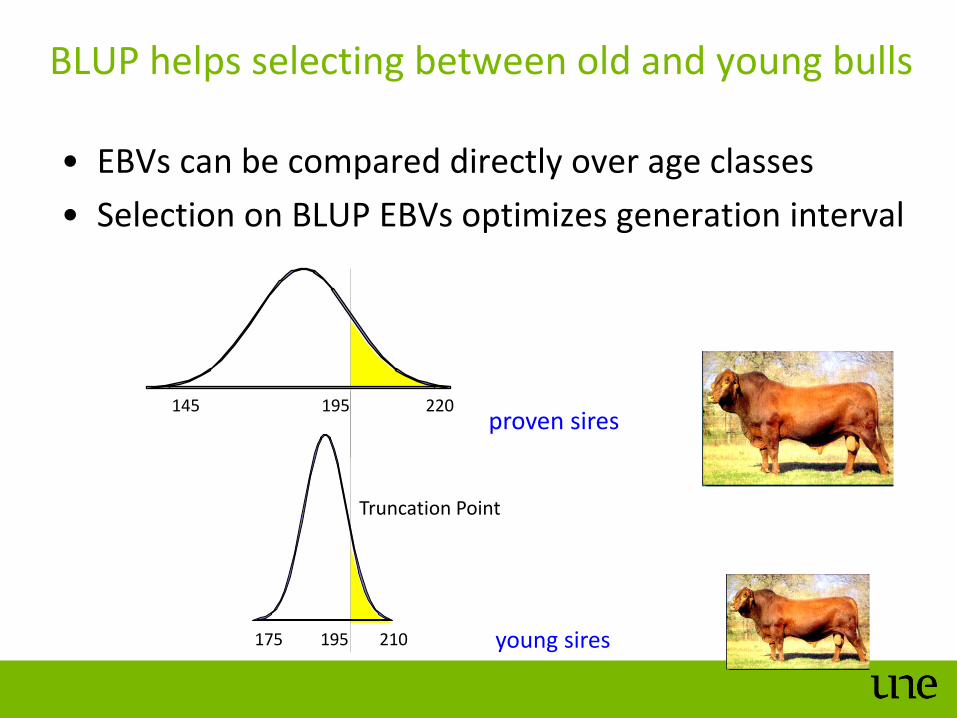
BLUP helps selecting between old and young bulls
• EBVs can be compared directly over age classes
• Selection on BLUP EBVs optimizes generation interval
proven sires
young sires
Truncation Point
145 195 220
175 195 210

Example of BLUP selection (truncation)
Consider top 15 sires, truncation point = 195
Sires in top are from various age classes
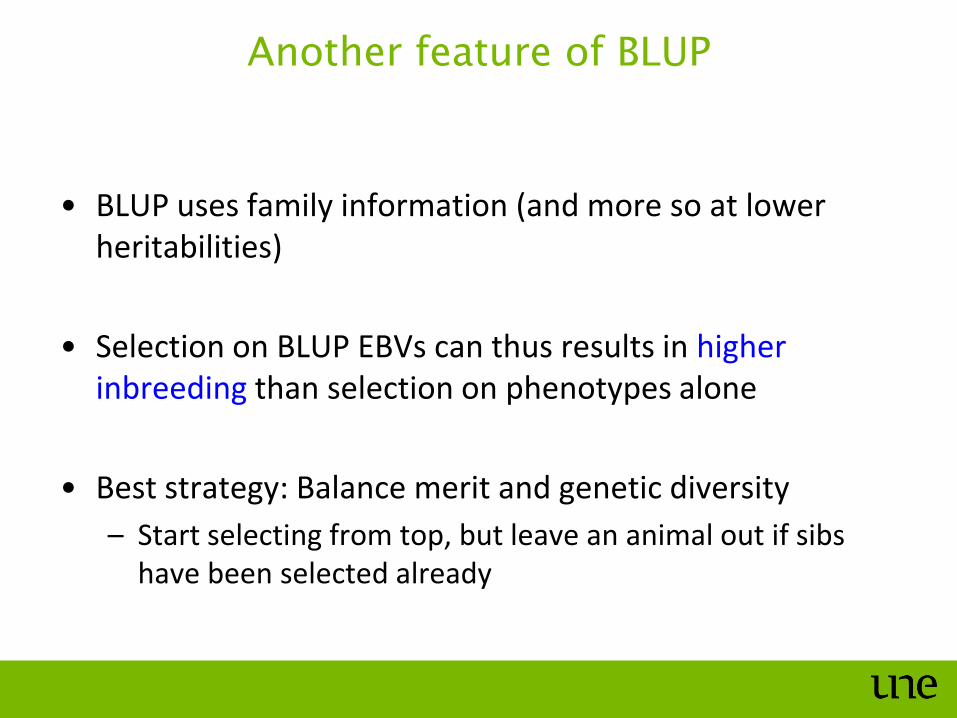
Another feature of BLUP
• BLUP uses family information (and more so at lower heritabilities)
• Selection on BLUP EBVs can thus results in higher inbreeding than selection on phenotypes alone
• Best strategy: Balance merit and genetic diversity
– Start selecting from top, but leave an animal out if sibs have been selected already

Example of BLUP selection
These are sibs so
might not select
all of them as
flock sire

• Accuracy of BLUP EBVs depends on amount and the quality of the data (as well as the trait heritability)
– Accurate phenotypic measurements
– Correct pedigree
– Correct recording of fixed effects & contemporary groups
– Appropriate data structure (e.g. information on mates, culls)
• Remember, if BLUP doesn’t know a piece of information, it cannot account for it
Good methods need good data

BLUP summary
• Uses information on all relatives optimally
• Accounts for fixed effects such as herd, birth type, age
• Accounts for unequal usage of sires in different herds
• Can compare across herd or flocks but need links to exist
• Accounts for culling and selection, non-random mating – but non selected animals and mates need to be included in analysis!
• Allows selection across age classes
• Provides an estimate of genetic trend
Why is selection on BLUP EBVs better than selecting on an animals’ phenotype?
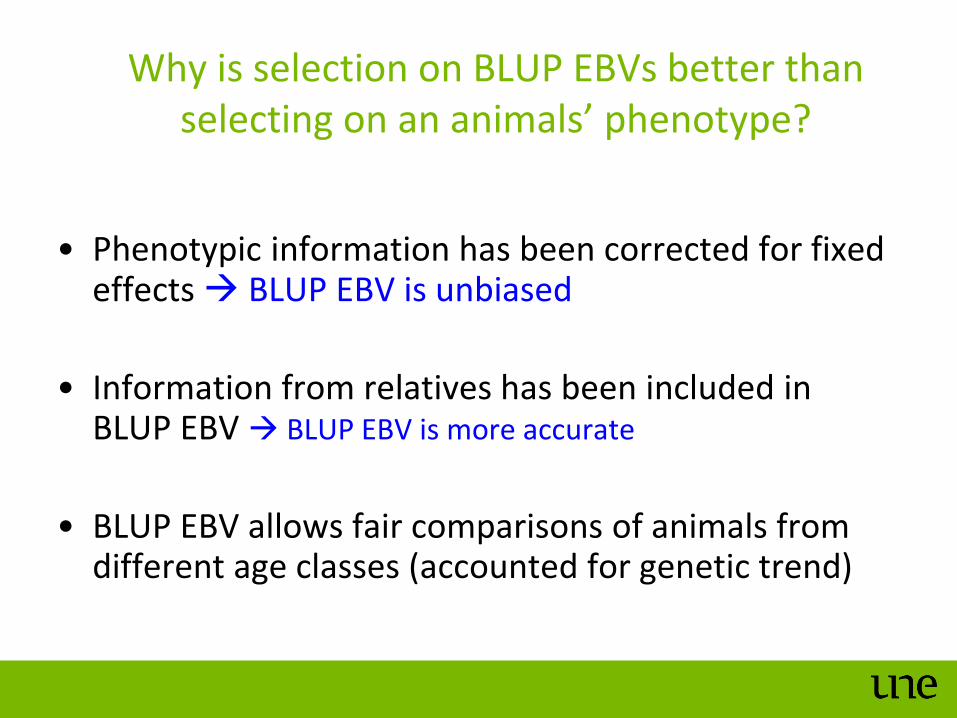
• Phenotypic information has been corrected for fixed effects BLUP EBV is unbiased
• Information from relatives has been included in BLUP EBV BLUP EBV is more accurate
• BLUP EBV allows fair comparisons of animals from different age classes (accounted for genetic trend)
Why is selection on BLUP EBVs better than selecting on an animals’ phenotype?