genetic improvement of dairy cattle · as for any species or population, genetic improvement of...
TRANSCRIPT

To appear in Genetics of Cattle 2nd Edition, Garrick D.J, Ruvinsky A (Editors), CAB International
1
Genetic Improvement of Dairy Cattle
Vincent Ducrocq1 and George Wiggans2
1UMR1313, Génétique Animale et Biologie Intégrative (GABI)
INRA, 78352 Jouy-en-Josas, France
2Animal Improvement Programs Laboratory Agricultural Research Service, United States Department of Agriculture, Beltsville,
Maryland 20705-2350, USA Introduction As for any species or population, genetic improvement of dairy cattle involves determining a desirable direction for improvement, identifying traits that provide information to move in that direction, quantifying their heritability, deciding how to evaluate them, and designing a breeding program to achieve the goals. With regard to these issues, dairy cattle are one of the most highly studied of all domesticated species.
This chapter describes how to determine which goals should be established to emphasize profit or efficiency as the ultimate goal of the dairy enterprise. The traits typically measured are listed along with how they are related and the genetic parameters utilized in the selection process. Evaluation procedures used to establish genetic rankings based on observations on related animals (genetic evaluations) or on genomic information (genomic evaluations) are reviewed. Their incorporation into breeding programs is outlined. Breeding Objectives Derivation of a breeding objective The first step in the design of a breeding program is to specify its goal: the breeding objective. The usual purpose of a breeding program is assumed to be the increase of profitability by modifying the genetic mean of key traits. Often, this increase must be performed under an uncertain future economic environment, under diverse management systems and under some constraints (e.g., quota on overall production or constant feed supply or pasture area at farm level). Therefore, the definition of the breeding objective starts with an inventory of representative management systems and of likely future scenarios as well as the description of specific constraints to satisfy. The derivation of the breeding objective involves a profit function which shows how a change in each relevant trait influences profitability (Goddard, 1998). This profit function is often based on a bioeconomic model of the farm and obviously depends on the prices the farmer receives for milk and other products and the prices paid for inputs (Groen et al., 1997). Typical illustrations can be found in Visscher et al. (1994) for pasture-based dairy farming in Australia or Steine et al.
2
(2008) for Norwegian Red cattle. Other required characteristics are the genetic parameters, the phenotypic means and the age structure of the herd at demographic equilibrium. When the performance level for one trait is modified by one unit under the specified constraints, a new equilibrium is reached and the economic efficiency of the herd changes. The economic weight of this trait is the monetary difference between the two situations, or mathematically, the value of the partial derivative of the profit function with respect to the trait. This weight will be used in the construction of a Total Merit Index (TMI), i.e., a linear combination of estimated breeding values which will serve as selection criterion to generate genetic progress on the breeding objective. When future economic scenarios are too vague or when the economic impact of some traits is too difficult to determine, it may be preferred to derive a breeding goal which induces genetic gain in a direction of general consensus (Olesen et al., 1999). One approach involves finding weights for the traits in the breeding objective which lead to desired or restricted genetic gains. This is also a way to incorporate farmer or consumer opinion. For example, continuous decline in fertility or resistance to mastitis may be regarded as no longer admissible, while solely economic consideration would tolerate the deterioration. On the other hand, constraints or restrictions must be included with care because they can have a strong negative impact on overall benefits. A common practice is a two-step approach where a bio-economic model is first developed to derive reference weights for the traits in the breeding goal. Expected genetic gains under a typical value for selection intensity are computed and then, relative weights are empirically modified to get a more acceptable response, while controlling its overall cost compared with the initial situation. In practice, the economic weight for a given trait depends on the other traits that are included in the profit function. For instance, if feed intake is not included in the profit function, the economic weight for cow body weight is positive because increasing body weight increases income from sale of cull cows. However, if feed intake is included in the profit function but not as a measured trait, the economic weight of body weight may be negative because larger cows have greater feed requirements for maintenance.
National breeding programmes are often compared by contrasting the (relative) economic weights of the traits of interest (Miglior et al., 2005). However, such comparison may be misleading (Cunningham and Taubert, 2009; Ducrocq, 2010). First, the relative weights may be attached to traits expressed in different units, such as phenotypic, genetic or even average EBV standard deviations. Furthermore, traits are not independent: for example, productive life and fertility are genetically correlated, and the weight ascribed to productive life differs strongly when the cost of culling due to sterility is assigned to productive life or instead, to fertility, even though the expected responses are similar. When some traits receive a negative weight, the meaning of a relative weight assuming a sum of 100% is questionable. Finally, when the average reliabilities of the EBV included in TMI vary a lot, traits with high EBV variability may contribute more to the overall ranking of animals than their economic weight indicates. This is clearly the case for production compared to fertility and disease traits.
To appear in Genetics of Cattle 2nd Edition, Garrick D.J, Ruvinsky A (Editors), CAB International
3
Recent evolutions in breeding objectives For decades, breeding goals in dairy cattle included few traits worldwide. These were mainly production and type traits, with a strong emphasis on production. Exceptions included the Scandinavian countries with far-sighted focus on udder health and fertility and dual-purpose breeds for which growth and beef traits were also valued. Hence in most countries, functional traits, i.e., traits related to the ability to remain productive, fertile and in good health with minimum human intervention were basically ignored in breeding programs, except indirectly through some morphological (type) predictors. As a result, the overall robustness of dairy cows has been decreasing along with the continuous and successful increase in performance for those production traits under selection. This was the consequence of the nearly universal negative genetic correlation between production and fitness (Jorjani, 2007). Functional traits are difficult to select because of their low heritability but they often have large genetic variability and therefore, they can also easily deteriorate. Attention towards more sustainable breeding schemes has increased tremendously over the past twenty years, following the path paved by Scandinavian countries. So breeding objectives are now broader, more complex but also more balanced in many countries. Nowadays, the relative weight given to production in breeding objectives is generally between 25 and 50% and functional traits receive larger attention, in order to improve long term sustainability of dairy production. Traits to consider The yields of milk, fat and protein are the major determinants of income to dairy farmers and the most important traits in the objective. Their relative economic weights depend on the pricing formula by which farmers are paid. If the milk is used for manufacturing, protein is generally most valuable, fat has some value but milk volume has a negative value because it must be transported from farm to factory and evaporated to make particular products. Other traits commonly included in breeding objectives are health (in particular udder health), fertility, calving ease, body weight, milking speed, temperament and length of productive life. Resistance to mastitis is the health trait of major concern in dairy cattle. It represents the ability to avoid udder infection or to quickly recover after infection. In some cases, resistance to a particular pathogen is considered but the latter is usually unknown. Negative economic consequences of a mastitis event are numerous: lower milk production, discarded milk because of the presence of antibiotics or inadequate composition, lower milk payment, increased veterinary and labor costs, increased cow replacement. Indeed, other health traits (lameness, metabolic or reproductive disorders) share most of these negative impacts. Cow fertility influences AI and veterinary costs, the interval between calvings and hence the pattern and yield from current and later lactations. In countries relying heavily on pasture (New Zealand, Ireland) or where male calves have a higher value and can be channeled toward meat production, fertility has always been an important trait. In contrast, in countries where dairy calves are of low value and where farmers can manage cows with long calving intervals so that those cows have long persistent
4
lactations, the economic weight of cow fertility used to be low. However, even in such a situation, the degradation of fertility in Holstein is an issue. This has led to increasing the economic weight on fertility traits everywhere. Calving ease is valuable because dystocia has potentially severe consequences on stillbirth, production, fertility and general health, leading to veterinary costs, extra labor costs, lost calves and cows, reduced milk yield and infertility. In dairy cattle, losses due to difficult calvings mostly occur at first calving. The economic weight depends heavily on the average incidence of dystocia. Calving ease is affected by the genetic merit of both the calf and its dam; therefore, selection needs to consider calving ease as a maternal trait (of the cow) and a direct trait of the calf. Cows are culled when they are no longer economically or physically sustainable. Length of productive life (LPL) from first calving to culling can be seen as an overall measure of her ability to stay productive. If LPL is corrected for the major source of voluntary culling (production), the resulting functional longevity depicts her ability to elude involuntary culling related to fertility, health or workability problems. In most selected dairy breeds, the proportion of involuntary culling has been increasing and voluntary culling on production traits has been declining, leading to closer convergence between true and functional longevity. Milking speed is of economic value because slow milkers increase the labor cost of milking. Good temperament, while it may be difficult to assign a monetary value to it, is valued highly by dairy farmers in Australia and New Zealand who milk large numbers of cows and want to avoid the disruption and danger caused by cows with poor temperament. Genetic variation Genetic parameters quantify the rate of genetic change which is possible to achieve. They are required for estimation of genetic merit. Of these parameters, the heritability describes what portion of the variation (variance) in a trait is of genetic origin and correlations among these traits indicate how genetic change in one trait can affect the others. When multiple traits are evaluated, covariances indicate to what degree the information from one trait influences the others. If an animal has more than one observation for a trait, the repeatability describes the expected similarity among those observations. Other genetic parameters include the effects of dominance, individual genes, breed, inbreeding and heterosis (crossbreeding). Breed Differences The World’s dairy cattle include Bos taurus and Bos indicus breeds. The Bos taurus are dominant in temperate regions and are noted for high production. The Bos indicus are prevalent in hotter climates and subsistence farming. The breeds of the Bos taurus population mostly arose in Europe. Globally, most animals are purebred but crossbreeding programs have been proposed as a way of upgrading indigenous cattle to a high producing breed, or as a way to obtain the benefits of complementarity and heterosis. Registry organizations maintain pedigree records, which enable animals to be traced to the origin of the breed, or its importation. With globalization, selection goals around the world have converged, as have the technologies to support high yields, particularly in temperate regions. In those environments, the Holstein breed
To appear in Genetics of Cattle 2nd Edition, Garrick D.J, Ruvinsky A (Editors), CAB International
5
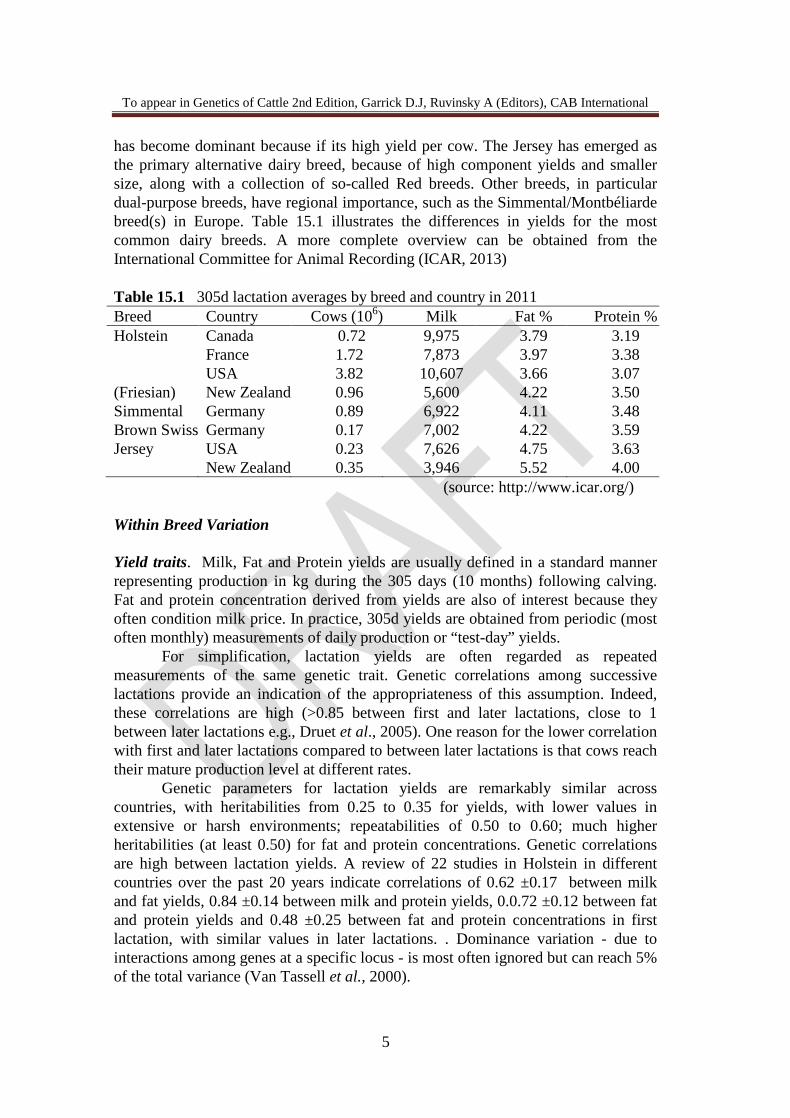
has become dominant because if its high yield per cow. The Jersey has emerged as the primary alternative dairy breed, because of high component yields and smaller size, along with a collection of so-called Red breeds. Other breeds, in particular dual-purpose breeds, have regional importance, such as the Simmental/Montbéliarde breed(s) in Europe. Table 15.1 illustrates the differences in yields for the most common dairy breeds. A more complete overview can be obtained from the International Committee for Animal Recording (ICAR, 2013) Table 15.1 305d lactation averages by breed and country in 2011 Breed Country Cows (106) Milk Fat % Protein % Holstein Canada 0.72 9,975 3.79 3.19 France 1.72 7,873 3.97 3.38 USA 3.82 10,607 3.66 3.07 (Friesian) New Zealand 0.96 5,600 4.22 3.50 Simmental Germany 0.89 6,922 4.11 3.48 Brown Swiss Germany 0.17 7,002 4.22 3.59 Jersey USA 0.23 7,626 4.75 3.63 New Zealand 0.35 3,946 5.52 4.00
(source: http://www.icar.org/) Within Breed Variation Yield traits. Milk, Fat and Protein yields are usually defined in a standard manner representing production in kg during the 305 days (10 months) following calving. Fat and protein concentration derived from yields are also of interest because they often condition milk price. In practice, 305d yields are obtained from periodic (most often monthly) measurements of daily production or “test-day” yields.
For simplification, lactation yields are often regarded as repeated measurements of the same genetic trait. Genetic correlations among successive lactations provide an indication of the appropriateness of this assumption. Indeed, these correlations are high (>0.85 between first and later lactations, close to 1 between later lactations e.g., Druet et al., 2005). One reason for the lower correlation with first and later lactations compared to between later lactations is that cows reach their mature production level at different rates.
Genetic parameters for lactation yields are remarkably similar across countries, with heritabilities from 0.25 to 0.35 for yields, with lower values in extensive or harsh environments; repeatabilities of 0.50 to 0.60; much higher heritabilities (at least 0.50) for fat and protein concentrations. Genetic correlations are high between lactation yields. A review of 22 studies in Holstein in different countries over the past 20 years indicate correlations of 0.62 ±0.17 between milk and fat yields, 0.84 ±0.14 between milk and protein yields, 0.0.72 ±0.12 between fat and protein yields and 0.48 ±0.25 between fat and protein concentrations in first lactation, with similar values in later lactations. . Dominance variation - due to interactions among genes at a specific locus - is most often ignored but can reach 5% of the total variance (Van Tassell et al., 2000).
6
Test-day yields are measurements specific to a particular testing day, with such tests usually being distributed over the whole lactation. Longitudinal analyses of such data are particularly interesting compared to analysis of whole lactation yields because they allow a more precise description of how genetic and non-genetic factors affect production over the lactation. For example, the specific effect of a herd on a given test day can be accounted for, and the effects of month or age at calving or stage of gestation and the additive genetic merit of the animal on the level and shape of the lactation can be accurately modeled. Such test-day models have gained popularity since the mid-nineties, as special cases of random regression models. Heritability estimates of test-day production are typically lower at the beginning and end of the lactation but can be high in mid lactation. Genetic correlations between production traits at different stages of lactation are usually high to very high (close to 1), except for the beginning and the end of lactation. As a result, the overall heritability estimates over the lactation are definitely higher (up to 0.50) than when the total 305d lactation yields are directly analyzed. Persistency, which describes how steeply the production decreases during the lactation, and maturity, which expresses how production evolves between first and later lactations can be specifically evaluated using test-day models. Their heritability is generally low (e.g., 0.09 to 0.16 for milk persistency according to Jakobsen et al., 2002) Conformation traits. Visual appraisals of cows for conformation (also known as type) traits have been collected for many years. Improving type traits has been advocated as a way to improve fitness, longevity and workability. This view has been altered in the recent past: size (or height) is receiving considerable attention worldwide in most breeds, while its relationship with fitness is often uncertain, and in some production systems, clearly unfavourable (Pryce et al., 2009). It is now well established that dairy character – or dairy form, dairyness or angularity – is unfavorably associated with body condition score, fertility and mastitis resistance (Lassen et al., 2003). Indeed, the objectives of elite breeders regarding type traits often diverge from those of most commercial dairymen. Traits such as angularity, body condition score (Pryce et al., 2001), body depth or rump angle are useful, but mainly as predictors of poor fertility. In contrast, udder traits have unambiguous beneficial impact on functional longevity, resistance to mastitis and milking speed. Udder depth is certainly the most important udder trait in that respect, together with fore and rear attachment, suspensory ligament and teat length and placement. A few feet and leg traits (rear leg set, foot angle, locomotion) are routinely collected and evaluated nationally and internationally, but generally have low heritability and a disappointingly low correlation with, for example, actual longevity. Some countries are now investigating other relevant traits better related to lameness and longevity such as information on claw disorders collected by hoof trimmers (e.g., Van der Linde et al., 2010). Other traits such as muscling are recorded in dual-purpose breeds (Simmental, Montbéliarde, Normande). Conformation traits are most often scored on linear scales, e.g., on a scale from 1 to 9. Heritability is usually relatively low (0.05-0.20) for feet and leg traits, moderate (0.20-0.35) for udder traits and moderate to high (0.25-0.60) for traits related to size (Interbull, 2013). Cows usually get a final score to summarize overall conformation. The final score is a combination of scores characterizing udder, body

To appear in Genetics of Cattle 2nd Edition, Garrick D.J, Ruvinsky A (Editors), CAB International
7
or feet and legs quality. Because genetic parameters vary between type traits as well as the weights used to combine them into a final score, composite indices combining genetic merit of the elementary traits in a formal way are preferable to direct evaluation of final scores. Workability traits. Workability traits include milking speed and temperament. They are often recorded at the same time as type traits, on linear scales (e.g., 1 to 5 in a within herd comparison) or with actual measure (milk flow). Except in the latter case where larger estimates were found, heritability estimates are moderate (0.20-0.25) for milking speed and low (0.10) for temperament. Calving traits. Birth weight is seldom recorded in dairy herds, whereas dystocia is commonly recorded as a calving code (e.g., 1 = no assistance, 2 = easy pull, 3 = hard pull, 4 = caesarean). Stillbirth is recorded as an all or none trait (alive or dead within 24 or 48 hours after birth). Calving traits are under the influence of the genetic and non-genetic characteristics of both the calf (direct effect, ease of birth) and its dam (maternal effect, ease of calving). Heritabilities are usually quite low (<0.10), especially when adult cows or maternal effects are considered (Interbull, 2013). Fertility traits. Female fertility has been neglected in breeding programmes for decades. As a result, it has been notably compromised by intensive selection for production. Initially, female fertility traits were limited to crude measures such as calving intervals or days open which can be directly extracted from milk recording data. However, fertility is a composite phenotype which can be decomposed into various basic traits requiring joint analysis of insemination and calving data. Records corresponding to natural services are usually ignored in analysis of fertility data. Most fertility traits are considered as genetically different between heifers and adult cows, the latter being challenged by concomitant production. Jorjani (2007) classified female fertility traits into 4 groups: ability to conceive (non return rates, conception rate, number of inseminations) for heifers; ability to conceive for adult cows; ability to recycle after calving (interval from calving to first AI); interval measures of ability to conceive (interval from first to successful (or last) AI). Calving intervals and days open are pooled measures of these abilities. Gestation length is moderately heritable but does not vary much within breed and is rarely considered in breeding programs. Health traits. Milk samples collected to determine fat and protein content are also analyzed for somatic cell counts (SCC) which, after a normalizing transformation, become somatic cell scores (SCS), an indicator of udder health (Ali and Shook, 1980). High SCS are associated with clinical or sub-clinical mastitis and depressed milk yield. Scandinavian countries have a long history of systematic disease data collection (Aamand, 2006). In particular, the actual occurrence of clinical mastitis is routinely recorded. More countries are following this track, especially in Europe (Austria, France). Other health traits include feet and legs, reproductive or digestive disorders (e.g., Egger-Danner et al., 2012). Those health traits are characterized by a low incidence, a low heritability but a large genetic variance.

8
Longevity. A typical measure of longevity is Length of Productive Life (LPL), defined as the number of days between first calving and culling. For cows still alive, only the current LPL (i.e., a lower bound of their “final” LPL) is known: the observation is said to be censored. Another characteristic of LPL measures is that environmental factors influencing risk of being culled (season, parity, herd size, etc) are changing at the same time as LPL is measured. Any statistical analysis of LPL should take these features into account. It is also possible to predict LPL of cows still in the herd so they can be analyzed with a standard linear model. An alternative simplified trait is survival (0/1) to the next lactation, also called stayability. Heritability estimates for longevity are around 0.10 or less. Because of its low heritability and its relatively late availability, LPL information is generally combined with early predictors such as type traits or SCS to improve longevity evaluations. Correlation between trait groups Table 15.2 reports genetic correlation estimates between traits included in the breeding goal in France for the Holstein breed. Udder health traits (somatic cell count and clinical mastitis) are strongly correlated (0.70) but clearly correspond to distinct traits, themselves related to udder conformation traits. Fast milking Holstein cows have higher SCC. The situation is reversed in other breeds such as the Montbéliarde, where selection for milking ease has not been as strong. Ability to conceive and ability to recycle are two poorly correlated fertility traits. Functional longevity exhibits a relatively high genetic correlation (close to 0.5) with a number of functional traits related to udder health (somatic cell count, clinical mastitis, udder depth) and fertility (conception rate). Table 15.2: Estimated genetic correlations between some traits included in the Holstein Total Merit Index in France(1)
Trait name and abbreviation Milk yield SCC Clm CRate IC-1AI MEase UddD Somatic cell count SCC *(2) Clinical mastitis ClM -0.26 0.70 Conception Rate CRate -0.22 0.25 0.24 Interval calving – 1stAI IC-1AI(3) -0.42 * 0.23 0.16 Milking ease MEase * -0.37 -0.18 * * Udder depth UddD -0.22 0.27 0.30 0.15 * 0.28 Functional longevity FLong 0.17 0.48 0.47 0.47 * 0.17 0.41
(1) trait scales are transformed: positive values indicate favourable values, e.g., positive SCC means lower SCC (2) *: absolute value of genetic correlation less than 0.15 (3) interval between calving and first insemination Inbreeding, genetic variability and heterosis. An animal is inbred if its parents are related. The inbreeding coefficient is the probability that an animal receives from both parents the same ancestral copy of any particular allele or chromosome fragment. The intense selection of bulls in most breeds, each with (tens of) thousands of daughters, and the use of a reduced number of sires of sons at the international level have led to a continuous increase in inbreeding. The use of close family information in genetic evaluation tends to further

To appear in Genetics of Cattle 2nd Edition, Garrick D.J, Ruvinsky A (Editors), CAB International
9
increase inbreeding because the consideration of all relationships tends to make the evaluations of family members similar, i.e., more likely to be selected together. Systematic calculation of inbreeding relative to a base population which is assumed unrelated and non-inbred is feasible in very large populations. Inbreeding can be strongly underestimated when pedigree data is incomplete, or pedigree depth i.e., the equivalent number of generations of known parents is low, but methods have been proposed to account for missing ancestors (VanRaden, 1992). Other measures of genetic variability less sensitive to missing data exist. They are related to the probability of gene origin, e.g., the effective number of founders or ancestors, or the number of ancestors accounting for 50% of the genes (Boichard et al., 1997). They show that actual population size is not at all representative of genetic variability. This is demonstrated by some values obtained in Holstein in France: 8 bulls contributed 50% of the genes in females born between 2004 and 2007 and the effective number of ancestors was 21 (Danchin-Burge et al., 2012). This situation is observed in all Holstein populations. The evolution of inbreeding for the Holstein population in the United States is shown in Figure 15.1. The base population consisted of animals born before 1960. For 20 years until 1980, inbreeding increased slowly at about 0.044 %/year. For the next 15 years it rose rapidly at 0.275%/year. More recently, during the period from 2000, the rate of increase has decreased to 0.11 %/year. Figure 15.1. Average inbreeding by birth year for US Holstein cows.
A consequence of receiving the same genes identical by descent from both ancestors is that the likelihood of homozygosity among recessive alleles increases. Homozygosity can lead to embryo failure, mendelian diseases and decreased productivity related to inbreeding depression. Table 15.3 presents estimates of inbreeding depression for Holstein cows in the United States

10
Table 15.3 Estimates of inbreeding depression and heterosis in US Holstein.
Statistic Milk Yield
Fat Yield
Protein Yield
Somatic Cells Score
Daughter Pregnancy
Rate
Productive Life (mo)
Inbreeding depression1
-67 -2.5 -2.0 0.0045 -0.071 -0.27
Heterosis2 452 26 18 0.010 1,5 0.0 (1) Effect per 1% inbreeding (2) Effect for animals with 100% heterosis, i.e., in F1 crosses
Heterosis can be viewed as the opposite of inbreeding depression and results from an increase in heterozygosity, reducing the likelihood of deleterious homozygous recessive genes. Heterosis measures the degree that offspring exceed the average of the performance of their parents, the magnitude of which depends on the genetic distance between the parents. Some estimates of heterosis are presented in Table 15.3. Heterosis is most apparent in breed crosses. If parental breeds are quite different in the trait of interest, the benefit of heterosis is unlikely to make the progeny competitive with the higher producing parental breed. However, heterosis may contribute a significant advantage in fitness. In New Zealand where most milk is used in manufacturing, cows from the Jersey breed (less milk, but high in fat) managed at higher stocking rates than their larger Holstein counterparts (more milk, but less fat), are perceived as financially competitive on a per ha basis and the progeny of crosses between these breeds are also highly regarded. In the US, concern about reduced fertility and survival of Holstein cows is leading some farmers to crossbreed with Montbéliarde, Normande, and Swedish Red or Norwegian Red bulls to improve fitness traits (Heins and Hansen, 2012). Heterosis and a related concept - recombination loss - have been of interest in Europe since the introduction of Holstein semen and embryos from North America. Crossbred progeny were backcrossed to North American bulls, so the performance of generations beyond the F1 was important. If epistatic gene combinations in the parent breeds have a positive effect on yield, often breaking these combinations up in subsequent generations will reduce yield. The loss of these epistatic effects is called recombination loss. Estimates of recombinant loss are usually negative, meaning that the segregating generations perform worse than expected from the performance of the parent breeds and the F1. Although epistasis is a possible cause of these results, there are also other possible explanations, e.g., preferential treatment of the F1. QTL and individual genes affecting traits of economic importance The traits considered for genetic evaluation are generally quantitative, affected by many genes as well as environmental factors. However, for many traits, there are some individual genes with a moderate effect which are worth studying more precisely: when these genes are identified, it increases our understanding of the mechanism of genetic control and this knowledge may be useful in improving accuracy of breeding value predictions. In the nineties, a lot of work was devoted to detection of Quantitative Trait Loci (QTL), i.e., polymorphic chromosomal segments which have an impact on quantitative traits. Mapping QTL by linkage to genetic markers chosen to represent

To appear in Genetics of Cattle 2nd Edition, Garrick D.J, Ruvinsky A (Editors), CAB International
11
sparse coverage of the entire genome was a first step towards the identification of actual genes affecting traits. It was also a prerequisite to the implementation of Marker Assisted Selection (MAS). As for the more recent approach known as genomic selection which will be covered later, QTL detection requires a reference population with phenotypic records and associated marker genotypes. Special designs were proposed to increase the power of QTL detection, in particular the daughter and grand-daughter designs (Weller et al., 1990) which are well suited to dairy cattle. The grand-daughter design traces the transmission of genetic markers in families comprising a sire and his progeny tested sons, which all have accurate phenotypes (average adjusted performances of a large number of daughters). Initially, microsatellites were used as markers because they are highly polymorphic. However, microsatellite genotyping was rather expensive and QTL detection studies were typically restricted to the use of only a few dozens or hundreds of microsatellites per animal. With the availability of high density marker coverage, the prospects of detecting QTL have improved considerably (Weller et al, 2013). Large QTL detection programs were implemented, in particular in the Holstein breeds (e.g., Ashwell et al., 2001; Boichard et al., 2003, Spelman et al., 2001). Dozens of QTL were discovered (see Khatkar et al., 2004, for a review). Unfortunately, they usually explained at most a few percent of genetic variance and the confidence interval of their location remained large (>10 centimorgans). Nevertheless, these discoveries were used in some MAS programs, in particular in New Zealand (Spelman, 2002) and in France, to pre-select young candidates before progeny testing. These programs were complex and costly because association between alleles at the marker and at the QTL had to be established within each sire family. In France, 70,000 animals were genotyped between 2001 and 2008 for 14 chromosome regions traced by 45 microsatellites markers (Boichard et al., 2012b). The efficiency of this program was retrospectively shown to be essentially as expected (Guillaume et al., 2008), i.e., small compared with what can be achieved nowadays with denser sets of markers. In practice, MAS programs have been replaced by genomic selection strategies.
With QTL detection based on microsatellite markers, finding the gene(s) involved and the causal mutation(s) was an extremely difficult and time-consuming task, unless good positional candidates were identified by comparative mapping. The most prominent discoveries were the ATP-binding cassette, subfamily G, member 2 gene (ABCG2), the acylCoA:diacyglycerol acyltransferase (DGAT1) and the growth hormone receptor (GHR) genes (Grisart et al., 2002; Winter et al., 2002; Cohen-Zinder et al., 2005, Blott et al., 2003) on chromosomes 6, 14 and 20 respectively, which have very significant effects on milk yield and/or composition in Holstein. QTL detection became much more effective with the development of assays that can be used to genotype at low cost large numbers of another class of genomic markers, the single nucleotide polymorphisms (SNP) (Van Tassel et al., 2008). The much denser coverage of the whole genome with markers makes the linkage disequilibrium between SNP and QTL extend beyond families to breed level. As a typical example, a QTL affecting dystocia, conformation, and economic merit was discovered on chromosome 18 (Cole et al., 2009). It appears to be related to calf size or birth weight and may be the result of longer gestation lengths.

12
Genetic evaluation The goal of a genetic evaluation system is to produce rankings of animals that will generate progress on a breeding objective when selection decisions are based on the rankings. Genetic evaluation systems have been developed over the past 60 years, progressively making more efficient use of national databases that are growing in nature and scope, while exploiting sophisticated statistical techniques and fast-growing computing power. Evaluation Models Currently, animal models are used in all major dairy countries for most of the traits evaluated. In an animal model, the phenotype of a particular cow is described as a function of her own additive genetic merit, in contrast with sire models for which only the genetic contribution of her sire is considered. Animal and sire models are special cases of mixed linear models (Henderson, 1984) where effects such as environmental groupings are typically treated as fixed effects while genetic effects are considered as random. Best Linear Unbiased Prediction (BLUP) is the favourite estimation procedure (Henderson, 1963, 1984). From a Bayesian perspective, this means that environmental effects are estimated only from the data, while genetic effects are estimated (or predicted) combining information from data with prior knowledge of pedigree relationships between animals. The BLUP approach most commonly used involves a system of so-called mixed model equations, which can be constructed and solved relatively easily. The solutions include estimates of fixed effects corrected for all other factors and, estimated breeding values (EBV) for every cow or bull in the pedigree. The EBV of any individual is a function of EBV of its parents and its progeny as well as its own records (VanRaden and Wiggans, 1991). Because all equations are solved simultaneously, data from one animal influences EBV of all its relatives and herdmates. Together with EBV, reliabilities are also computed or approximated from the mixed model equations, the reliabilities reflecting the accuracy of each EBV. There has been considerable work in the recent past to adapt evaluation models, methods and software to the specific characteristics of each trait evaluated. These adaptations are based on relaxation of the underlying assumptions of simple linear mixed model analyses. For example, evaluations for production traits now often account for heterogeneous residual variances across herds and years (Robert-Granié et al., 1999; Wiggans et al., 1991). Random regression models for test-day evaluations include sophisticated modelling of fixed effects describing the lactation curves and description of the correlation structure between breeding values at different stages of lactation and different lactations (Jamrozik et al., 1997). Such modelling allows for a better correction for environmental factors, provides a higher heritability and allows evaluation of underlying traits such as production persistency. Type traits are generally analyzed altogether in multiple trait animal model evaluations, where the high correlations particularly within trait groups (udder traits, body traits, feet and legs traits) allow data from one trait to contribute to the accuracy of the evaluation of the others (Misztal et al., 1992). Genetic evaluations of discrete data such as calving scores have been implemented using threshold models (Gianola
To appear in Genetics of Cattle 2nd Edition, Garrick D.J, Ruvinsky A (Editors), CAB International
13
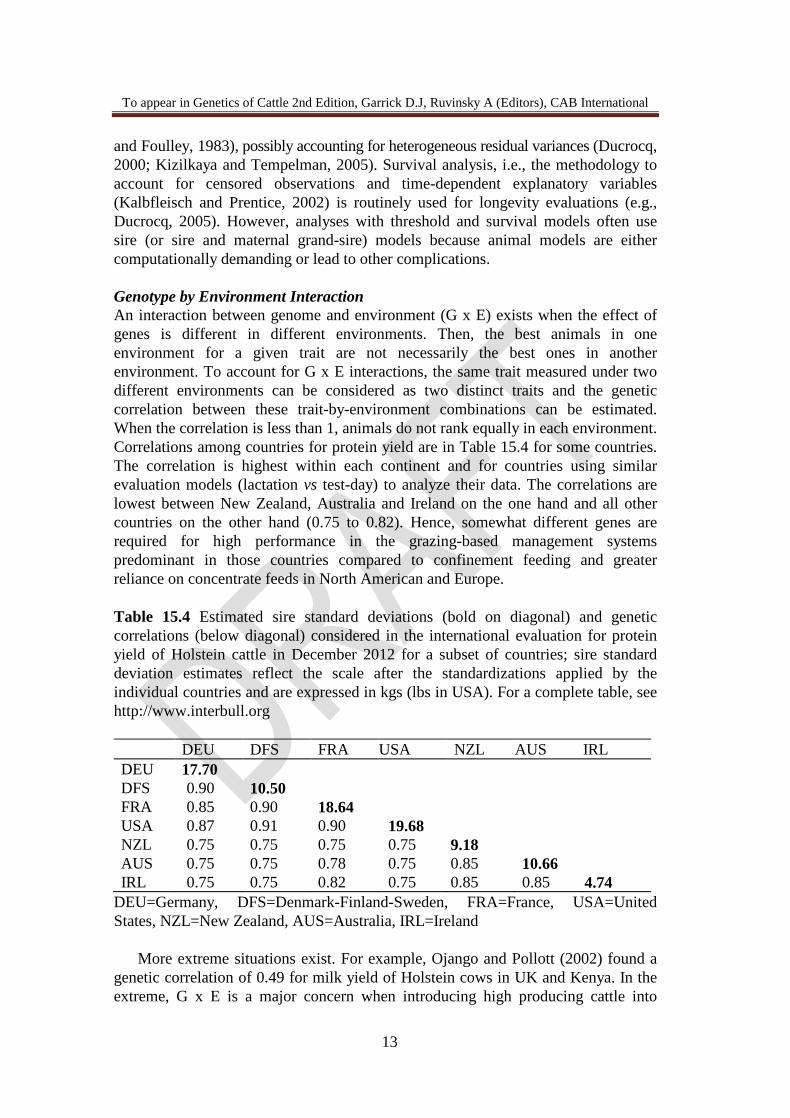
and Foulley, 1983), possibly accounting for heterogeneous residual variances (Ducrocq, 2000; Kizilkaya and Tempelman, 2005). Survival analysis, i.e., the methodology to account for censored observations and time-dependent explanatory variables (Kalbfleisch and Prentice, 2002) is routinely used for longevity evaluations (e.g., Ducrocq, 2005). However, analyses with threshold and survival models often use sire (or sire and maternal grand-sire) models because animal models are either computationally demanding or lead to other complications. Genotype by Environment Interaction An interaction between genome and environment (G x E) exists when the effect of genes is different in different environments. Then, the best animals in one environment for a given trait are not necessarily the best ones in another environment. To account for G x E interactions, the same trait measured under two different environments can be considered as two distinct traits and the genetic correlation between these trait-by-environment combinations can be estimated. When the correlation is less than 1, animals do not rank equally in each environment. Correlations among countries for protein yield are in Table 15.4 for some countries. The correlation is highest within each continent and for countries using similar evaluation models (lactation vs test-day) to analyze their data. The correlations are lowest between New Zealand, Australia and Ireland on the one hand and all other countries on the other hand (0.75 to 0.82). Hence, somewhat different genes are required for high performance in the grazing-based management systems predominant in those countries compared to confinement feeding and greater reliance on concentrate feeds in North American and Europe. Table 15.4 Estimated sire standard deviations (bold on diagonal) and genetic correlations (below diagonal) considered in the international evaluation for protein yield of Holstein cattle in December 2012 for a subset of countries; sire standard deviation estimates reflect the scale after the standardizations applied by the individual countries and are expressed in kgs (lbs in USA). For a complete table, see http://www.interbull.org DEU DFS FRA USA NZL AUS IRL DEU 17.70 DFS 0.90 10.50 FRA 0.85 0.90 18.64 USA 0.87 0.91 0.90 19.68 NZL 0.75 0.75 0.75 0.75 9.18 AUS 0.75 0.75 0.78 0.75 0.85 10.66 IRL 0.75 0.75 0.82 0.75 0.85 0.85 4.74
DEU=Germany, DFS=Denmark-Finland-Sweden, FRA=France, USA=United States, NZL=New Zealand, AUS=Australia, IRL=Ireland More extreme situations exist. For example, Ojango and Pollott (2002) found a genetic correlation of 0.49 for milk yield of Holstein cows in UK and Kenya. In the extreme, G x E is a major concern when introducing high producing cattle into
14
marginal environments to upgrade indigenous cattle. Native cattle are well adapted to harsh conditions and will survive in environments where the improved cattle do not. Thus the native cattle are superior in that environment and the import of foreign animals or semen will produce disappointing results. Even if the genetic ranking of sires does not change across environments, a smaller or larger response in one environment is still indicative of an interaction. A typical example is a higher genetic variance for production traits in more intensive or specialized environments (Huquet et al., 2012). National vs International Evaluations Each country has adapted its evaluation system to model the structure of its data. Some of the ways in which systems differ include trait definition, trait measurement or calculation, parameter estimates, definition of environmental groups, definition of base population through unknown parent groups, account of inbreeding and heterosis, and reporting scale for evaluations. The extensive marketing of bull semen and embryos internationally has generated enormous interest in international comparison of bulls. Since 1994, the Interbull Centre (Interbull, 2013) in Uppsala, Sweden, has combined bull evaluations from participating countries on all continents to generate rankings that include bulls from all those countries, reported on each country’s own evaluation scale. This evaluation first involves the estimation of genetic correlations between performances in different countries (as in table 15.4). These are less than 1 because of genotype by environment interactions and also because of differences in national evaluations. As a consequence, the average daughter performance of each bull is considered as describing a trait which is different in each country, and a multiple trait, across country evaluation (MACE; Schaeffer, 1994) is performed. Interbull has 32 members in 2013 and performs MACE evaluations three times a year. Six (groups of) international breeds are considered: Holstein (with 29 populations participating to the production evaluations), Red dairy breeds (14), Jersey (11), Simmental (11), Brown Swiss (10) and Guernsey (6). Evaluated traits are grouped into production, type, udder health, fertility, calving, longevity and workability traits. Not all countries and breeds are considered for each trait group, but there is a continuous trend towards the inclusion of more breed x country x trait combinations. Total Merit Indexes Optimal selection for a particular breeding goal supposes that EBV on different traits are combined into a total merit index (Philippson et al., 1994). But EBV on important functional traits are often available only on males and with a satisfactory reliability obtained too late to be used efficiently at young ages. Early predictors can be added to increase this reliability, especially for low heritability traits, such as longevity. This is frequently done using selection index theory leading to weights that depend on the reliability of each EBV, and the genetic and residual correlations between traits. In practice, this step is often simplified and the same coefficients are used in all situations (VanRaden, 2001). Another strategy consists of approximating a BLUP multiple trait animal model evaluation (MTAM). MTAM has a number of desirable features: it effectively merges all information sources, properly accounting for residual correlations and differences in reliabilities. MTAM also prevents biases

To appear in Genetics of Cattle 2nd Edition, Garrick D.J, Ruvinsky A (Editors), CAB International
15
in genetic trends due to selection on correlated traits. A full-scale implementation of MTAM for all traits of interest is not feasible in large populations, in particular because genetic evaluation models greatly differ from one group of traits to the other (e.g., test-day models for production traits vs survival analysis for longevity). Good two-step approximations exist (Lassen et al., 2007): first single trait evaluations are carried out and average performances corrected for all non genetic effects and their associated weight are computed for all recorded cows.. Then, all ingredients for calculation of TMI are available for all males and females and a simpler MTAM evaluation is easily implemented. The optimal weights of the resulting EBV in TMI are simply the economic weights of the traits. Other essential outcomes are EBV for each functional trait optimally combining direct and indirect information from early predictors (e.g., longevity or fertility).
Genetic Trends Genetic trends reflect the historical progress achieved. Average breeding value of cows by birth year is a common measure of genetic trend and indication of the success of a national breeding program. However, the evaluation model and adjustments for age effects can affect trend estimates. Table 15.5 shows the trend in breeding values for yield traits of U.S. Holstein cows born during two periods. A comparison of the two periods indicates changes in selection goals over time. Recent trends in milk and protein were lower than earlier trends, but more favourable progress was made in productive life, SCS and daughter pregnancy rate. Table 15.5 Genetic trend for U.S. Holstein cows
Trait
1993-1997 2003-2007
Annual trend
% of phenotypic mean
Annual trend
% of phenotypic
mean Milk (kg) 94 0.9 76 0.6 Fat (kg) 2.6 0.7 2.9 0.7 Protein (kg) 2.8 0.9 2.5 0.7 Productive life (mo) 0.13 0.5 0.25 0.9 Somatic cell score(1) 0.01 0.3 -0.02 -0.6 Daughter pregnancy rate (%)
-0.13(2) -0.6(2) 0.05 0.2
(1) Score obtained after a normalizing transformation of somatic cell count (SCC) : SCS= log base 2 (SCC / 100,000) + 3 (2) for the period 1998-2002
Across breed analysis Historically, genetic evaluation was done within breed to limit the complexity of genetic evaluations and avoid the need to consider heterosis and differences in scale between breeds. In countries such as New Zealand where crossbreeding has become popular because of benefits from heterosis and complementarity, there is interest in using information from crossbred daughters in evaluating bulls, and having genetic evaluations of the crossbreds themselves. New Zealand implemented an across-breed

16
analysis (Garrick et al., 1997; Harris et al., 2006) with TMI reported across breed in terms of profit per unit dry matter consumed. The US began an across breed analysis in 2007 for yield and fitness traits (VanRaden et al., 2007). In the US, evaluations are calculated on an all-breed base but converted to traditional within-breed genetic bases for publication. The effect of heterosis is subtracted from each trait in the all-breed model, but when evaluations of crossbred animals are converted to the pure breed evaluation, the heterosis expected when crossbreds are mated to purebreds is included in the predicted transmitting ability. Genomic selection The genomic era for dairy cattle began in 2007 with the development of assays that can be used to genotype large numbers of SNP at low cost (Matukumalli et al., 2011). Since then it has become possible to obtain genomic evaluations of adequate accuracy as soon as a DNA sample is processed (Meuwissen et al., 2001). Principles and methods Although SNP are only biallelic (2 states), their large number allows tracking the inheritance of short chromosomal segments. The BovineSNP50® BeadChip (Illumina, 2011) with 54,001 approximately evenly-spaced SNP was a major innovation and its adoption in dairy cattle was extremely fast. Genomic selection requires the definition of a reference population of animals for which both phenotypes and genotypes are available. Because male phenotypes (defined as average daughter performances corrected for all non genetic effects estimated in classical genetic evaluations) are much more precise than individual cow records, reference populations mainly comprise genotyped bulls with progeny test results. However, some countries, in particular the USA, also include cows with individual performance in their reference population, after a particular standardization of the phenotypes to buffer the impact of potential preferential treatment of bull dams (Wiggans et al., 2011a).
Genomic evaluation comprises the random multiple regression of average daughter performances of each bull in the reference population on its SNP genotypes expressed as the number of one of the alleles. The substitution effect of this allele summarizes the effect of the surrounding chromosomal segment. Mixed linear or nonlinear models are assumed. Many genomic evaluation methods have been proposed (Meuwissen et al., 2001; VanRaden et al., 2009; Hayes et al., 2009a, Verbyla et al., 2009, Croiseau et al., 2011). They vary in the proportion of SNP actually contributing to the phenotype (from a small fraction to all of them), the underlying distribution of the SNP effects (most often normal with constant or heterogeneous variance) and the estimation method (GBLUP, i.e., a genomic extension of BLUP, Bayesian methods relying on Markov Chain Monte Carlo methods, methods adapted to situations when there are many more unknowns (SNP effects) than observations (phenotypes) and machine learning approaches. In France, selected SNP are grouped into haplotypes of 4-6 SNP which are included in a QTL-BLUP evaluation (Boichard et al., 2012b). Using haplotypes improves SNP informativeness by increasing linkage disequilibrium between each group of SNP and the neighboring chromosomal region. Comparisons between methods show a
To appear in Genetics of Cattle 2nd Edition, Garrick D.J, Ruvinsky A (Editors), CAB International
17
modest advantage to Bayesian methods in most cases. This advantage becomes more substantial for traits characterized by a small number of larger QTL, such as fat content.
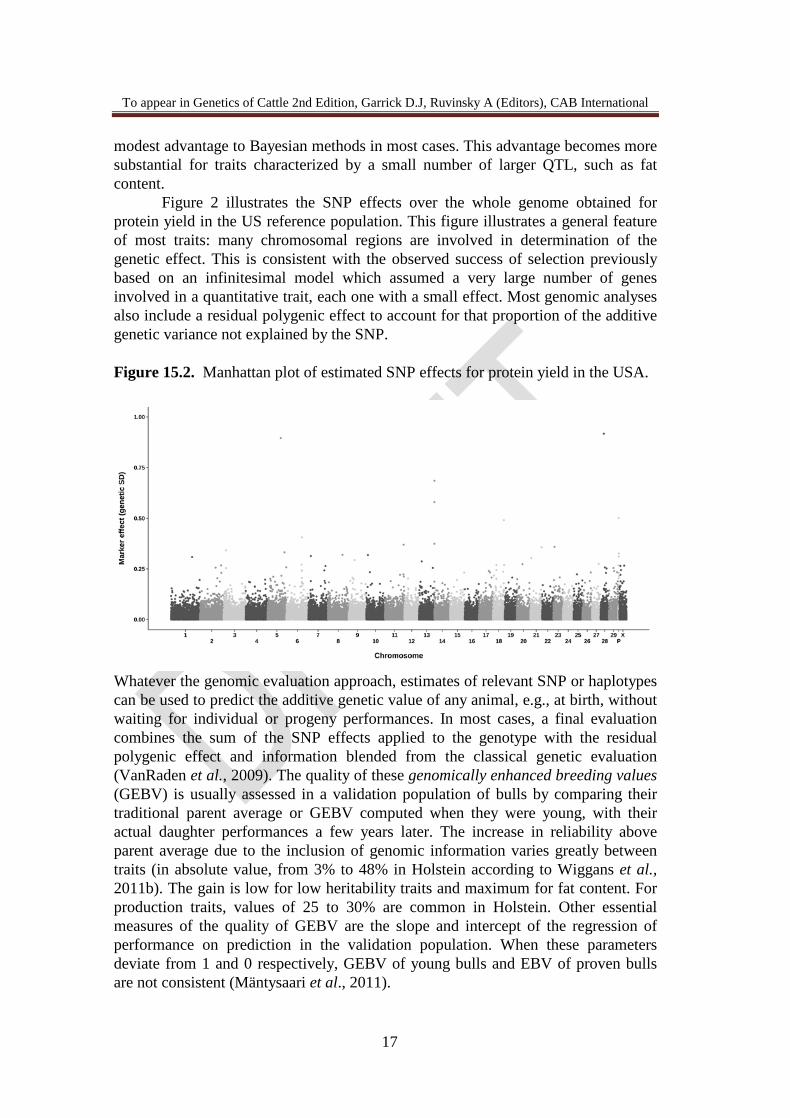
Figure 2 illustrates the SNP effects over the whole genome obtained for protein yield in the US reference population. This figure illustrates a general feature of most traits: many chromosomal regions are involved in determination of the genetic effect. This is consistent with the observed success of selection previously based on an infinitesimal model which assumed a very large number of genes involved in a quantitative trait, each one with a small effect. Most genomic analyses also include a residual polygenic effect to account for that proportion of the additive genetic variance not explained by the SNP. Figure 15.2. Manhattan plot of estimated SNP effects for protein yield in the USA.
Whatever the genomic evaluation approach, estimates of relevant SNP or haplotypes can be used to predict the additive genetic value of any animal, e.g., at birth, without waiting for individual or progeny performances. In most cases, a final evaluation combines the sum of the SNP effects applied to the genotype with the residual polygenic effect and information blended from the classical genetic evaluation (VanRaden et al., 2009). The quality of these genomically enhanced breeding values (GEBV) is usually assessed in a validation population of bulls by comparing their traditional parent average or GEBV computed when they were young, with their actual daughter performances a few years later. The increase in reliability above parent average due to the inclusion of genomic information varies greatly between traits (in absolute value, from 3% to 48% in Holstein according to Wiggans et al., 2011b). The gain is low for low heritability traits and maximum for fat content. For production traits, values of 25 to 30% are common in Holstein. Other essential measures of the quality of GEBV are the slope and intercept of the regression of performance on prediction in the validation population. When these parameters deviate from 1 and 0 respectively, GEBV of young bulls and EBV of proven bulls are not consistent (Mäntysaari et al., 2011).

18
SNP chips After the very successful BovineSNP50 BeadChip®, the Illumina company released in 2010 two additional genotyping chips: a low-density chip (Bovine3K®) with 2,900 SNP and a high-density chip (BovineHD®) with 777,962 SNP. The Bovine3K reduced the cost of genotyping, thereby increasing application to females.
The BovineHD® chip (Mattukumalli et al., 2009) has been used primarily for research, because only small increases in the accuracy of within breed genomic evaluations have been reported (VanRaden et al., 2011b), insufficient to justify its more than two-fold higher cost.
SNP chips have since become more diversified: in 2011, the Bovine3K was replaced by the BovineLD® chip (Boichard et al., 2012a) with 6,909 SNP which uses the same Infinium® chemistry as the BovineSNP50®, with better performance than the GoldenGate® technology used in the Bovine3K. The BovineLD® supports custom addition of up to 80,000 SNP. Examples of custom chips include the 8,000 SNP GGP-LD and 77,000 SNP GGP-HD from GeneSeek and a 10,000 SNP chip from Eurogenomics, which all include individual gene tests as well as markers spread throughout the genome.
With this increasing variety of genotyping chips, it has been necessary to develop tools to simultaneously include all densities of genotypes in genomic evaluations. Provided SNP markers are spaced throughout the genome, it is possible to use statistical methods to predict (or “impute”) the missing markers, thus transforming lower density genotypes into higher density ones (e.g., LD into 50K or 50K into HD genotypes), albeit with some uncertainty. Imputation and phasing (i.e., the construction of haplotypes of paternal and maternal origin) basically use the same statistical approaches (Druet and George, 2010). The accuracy of imputation is often very good, but depends on the number of genotypes available at higher density, on the imputation method implemented and for a particular animal, on the availability of genotypes of its parents, other direct ancestors and progeny. Imputation is also able to create the entire genotype of a non-genotyped animal if it has sufficient genotyped progeny (e.g., at least 5). Implementation Genomic evaluation is particularly beneficial in dairy cattle because of the possibility to dramatically reduce the generation interval. Now, bulls can be used heavily at 1 or 2 years of age instead of waiting until 5 years when their progeny test information is available. The cost of genotyping is modest compared to the value of a dairy animal and is negligible compared to the cost of progeny testing. Furthermore, this cost has declined since genotyping first became available. This has resulted in the widespread genotyping of young calves (table 15.6). Genotyping of females is used to select calves to be kept as replacements as well as the ones to be used as bull dams. Tens of thousands of animals are genotyped every month and most countries with large dairy populations have a genomic evaluation system.
Before being included in genomic evaluations, the genotypes should be checked to determine if they are associated with the correct animal and if the individual SNP genotypes appear accurate. Because most sires have been genotyped, sire conflicts can be detected and the correct sire discovered in many cases. Conflicts may be due to sample ID error as well as errors in the pedigree. The quality of SNP
To appear in Genetics of Cattle 2nd Edition, Garrick D.J, Ruvinsky A (Editors), CAB International
19
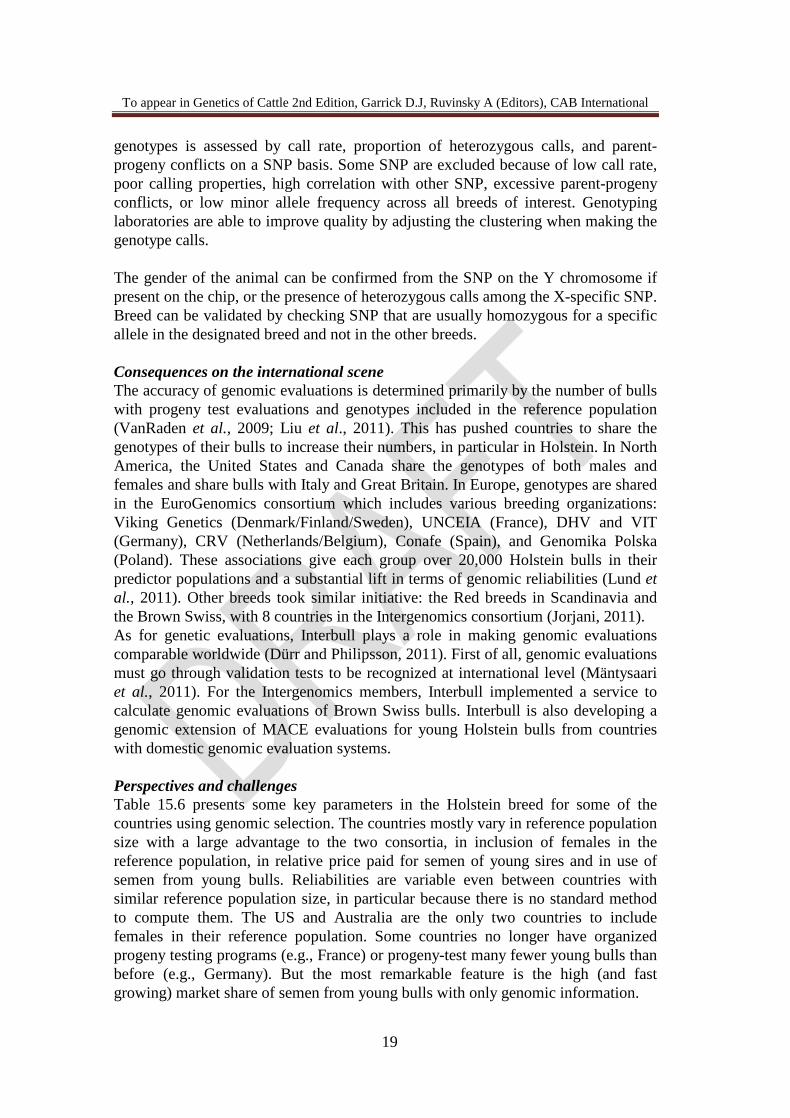
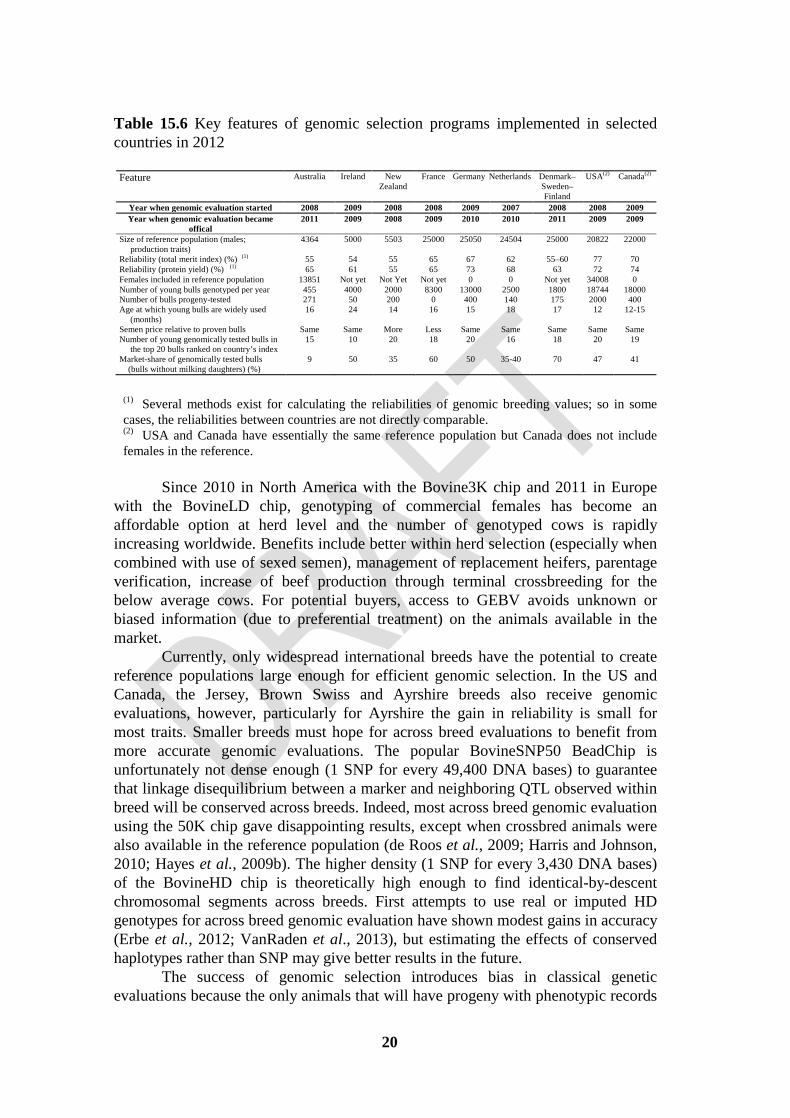
genotypes is assessed by call rate, proportion of heterozygous calls, and parent-progeny conflicts on a SNP basis. Some SNP are excluded because of low call rate, poor calling properties, high correlation with other SNP, excessive parent-progeny conflicts, or low minor allele frequency across all breeds of interest. Genotyping laboratories are able to improve quality by adjusting the clustering when making the genotype calls. The gender of the animal can be confirmed from the SNP on the Y chromosome if present on the chip, or the presence of heterozygous calls among the X-specific SNP. Breed can be validated by checking SNP that are usually homozygous for a specific allele in the designated breed and not in the other breeds. Consequences on the international scene The accuracy of genomic evaluations is determined primarily by the number of bulls with progeny test evaluations and genotypes included in the reference population (VanRaden et al., 2009; Liu et al., 2011). This has pushed countries to share the genotypes of their bulls to increase their numbers, in particular in Holstein. In North America, the United States and Canada share the genotypes of both males and females and share bulls with Italy and Great Britain. In Europe, genotypes are shared in the EuroGenomics consortium which includes various breeding organizations: Viking Genetics (Denmark/Finland/Sweden), UNCEIA (France), DHV and VIT (Germany), CRV (Netherlands/Belgium), Conafe (Spain), and Genomika Polska (Poland). These associations give each group over 20,000 Holstein bulls in their predictor populations and a substantial lift in terms of genomic reliabilities (Lund et al., 2011). Other breeds took similar initiative: the Red breeds in Scandinavia and the Brown Swiss, with 8 countries in the Intergenomics consortium (Jorjani, 2011). As for genetic evaluations, Interbull plays a role in making genomic evaluations comparable worldwide (Dürr and Philipsson, 2011). First of all, genomic evaluations must go through validation tests to be recognized at international level (Mäntysaari et al., 2011). For the Intergenomics members, Interbull implemented a service to calculate genomic evaluations of Brown Swiss bulls. Interbull is also developing a genomic extension of MACE evaluations for young Holstein bulls from countries with domestic genomic evaluation systems. Perspectives and challenges Table 15.6 presents some key parameters in the Holstein breed for some of the countries using genomic selection. The countries mostly vary in reference population size with a large advantage to the two consortia, in inclusion of females in the reference population, in relative price paid for semen of young sires and in use of semen from young bulls. Reliabilities are variable even between countries with similar reference population size, in particular because there is no standard method to compute them. The US and Australia are the only two countries to include females in their reference population. Some countries no longer have organized progeny testing programs (e.g., France) or progeny-test many fewer young bulls than before (e.g., Germany). But the most remarkable feature is the high (and fast growing) market share of semen from young bulls with only genomic information.
20
Table 15.6 Key features of genomic selection programs implemented in selected countries in 2012
Feature Australia Ireland New Zealand
France Germany Netherlands Denmark–Sweden–Finland
USA(2) Canada(2)
Year when genomic evaluation started 2008 2009 2008 2008 2009 2007 2008 2008 2009 Year when genomic evaluation became
offical 2011 2009 2008 2009 2010 2010 2011 2009 2009
Size of reference population (males; production traits)
4364 5000 5503 25000 25050 24504 25000 20822 22000
Reliability (total merit index) (%) (1) 55 54 55 65 67 62 55–60 77 70 Reliability (protein yield) (%) (1) 65 61 55 65 73 68 63 72 74 Females included in reference population 13851 Not yet Not Yet Not yet 0 0 Not yet 34008 0 Number of young bulls genotyped per year 455 4000 2000 8300 13000 2500 1800 18744 18000 Number of bulls progeny-tested 271 50 200 0 400 140 175 2000 400 Age at which young bulls are widely used (months)
16 24 14 16 15 18 17 12 12-15
Semen price relative to proven bulls Same Same More Less Same Same Same Same Same Number of young genomically tested bulls in the top 20 bulls ranked on country’s index
15 10 20 18 20 16 18 20 19
Market-share of genomically tested bulls (bulls without milking daughters) (%)
9 50 35 60 50 35-40 70 47 41
(1) Several methods exist for calculating the reliabilities of genomic breeding values; so in some cases, the reliabilities between countries are not directly comparable. (2) USA and Canada have essentially the same reference population but Canada does not include females in the reference.
Since 2010 in North America with the Bovine3K chip and 2011 in Europe
with the BovineLD chip, genotyping of commercial females has become an affordable option at herd level and the number of genotyped cows is rapidly increasing worldwide. Benefits include better within herd selection (especially when combined with use of sexed semen), management of replacement heifers, parentage verification, increase of beef production through terminal crossbreeding for the below average cows. For potential buyers, access to GEBV avoids unknown or biased information (due to preferential treatment) on the animals available in the market.
Currently, only widespread international breeds have the potential to create reference populations large enough for efficient genomic selection. In the US and Canada, the Jersey, Brown Swiss and Ayrshire breeds also receive genomic evaluations, however, particularly for Ayrshire the gain in reliability is small for most traits. Smaller breeds must hope for across breed evaluations to benefit from more accurate genomic evaluations. The popular BovineSNP50 BeadChip is unfortunately not dense enough (1 SNP for every 49,400 DNA bases) to guarantee that linkage disequilibrium between a marker and neighboring QTL observed within breed will be conserved across breeds. Indeed, most across breed genomic evaluation using the 50K chip gave disappointing results, except when crossbred animals were also available in the reference population (de Roos et al., 2009; Harris and Johnson, 2010; Hayes et al., 2009b). The higher density (1 SNP for every 3,430 DNA bases) of the BovineHD chip is theoretically high enough to find identical-by-descent chromosomal segments across breeds. First attempts to use real or imputed HD genotypes for across breed genomic evaluation have shown modest gains in accuracy (Erbe et al., 2012; VanRaden et al., 2013), but estimating the effects of conserved haplotypes rather than SNP may give better results in the future.
The success of genomic selection introduces bias in classical genetic evaluations because the only animals that will have progeny with phenotypic records
To appear in Genetics of Cattle 2nd Edition, Garrick D.J, Ruvinsky A (Editors), CAB International
21
are those which were preselected at a young age based on their GEBV (Patry and Ducrocq, 2011). Their additive genetic value substantially deviates from the average of their parents. BLUP evaluations cannot account for this deviation unless the genomic information used in selection is suitably included in the evaluation. The computational challenges of making such a combined system with all pedigree, genomic and phenotypic information in large populations are considerable, but current progress in this direction is fast (Aguilar et al., 2009; Christensen and Lund, 2010). Such so-called single step approaches offer a number of conceptual advantages making their development in the near future a priority.
Genomic information may be used to improve mating decisions. Discovery of haplotype segments that never occur in the homozygous state has led to the identification of abnormalities that cause early embryonic death (VanRaden et al., 2011a). Mating allocation software using genomic information can avoid carrier by carrier matings.
As technology has improved, it has become affordable to obtain full sequence information on important bulls (1,000 genome consortium, 2013). This data will enable discovery of millions of genetic variants. Research will in time associate these with diseases and variation in performance. As an increasing number of the causative variants are discovered, the accuracy of genomic evaluation should increase, along with improved likelihood of evaluation across breeds (Meuwissen and Goddard, 2010).
Design of Breeding Programs EBV and GEBV provide cattle breeders with tools for identifying the best bulls and cows for breeding. To get maximum genetic gain through selection requires the design of efficient breeding programs. Assuming that a fraction α of the candidates are selected in the top EBV list for a given trait, the theoretical annual genetic gain per year can be computed using the formula ∆Gy=(ι ρ σG)/L (Rendel and Robertson, 1950) which involves 4 parameters: 1) the selection intensity (ι) which is a function of α which measures the superiority of selected animals compared to all candidates to selection, 2) the EBV accuracy (ρ), 3) the generation interval (L) which is the average age of parents when their progeny are born, 4) the genetic standard deviation (σG) of the trait of interest. In dairy cattle, research into the design of breeding programs has focused for decades on finding the best combinations of these parameters, taking advantage of reproductive technology such as artificial insemination (AI) and multiple ovulation and embryo transfer (MOET). AI and MOET The availability of AI led to the development of breeding programs based on progeny testing: a group of young bulls is progeny tested by producing a number of daughters each. When these daughters get recorded performances included in genetic evaluations, bulls selected for widespread use are mated with the best cows available to produce replacement heifers and a new generation of young bulls. Selection of cows to produce replacement heifers is also practiced, but is of limited value because the low reproductive rate of cows means that a large proportion of each batch of new
22
heifers is needed to maintain the herd size. Thus selection decisions concern four types of combinations: bulls to breed bulls (bb), bulls to breed cows (bc), cows to breed bulls (cb) and cows to breed cows (cc), but the selection intensity on the fourth pathway is low. The formula to compute annual genetic gain is then extended to:
Gcccbbcbb
cccccbcbbcbcbbbby
LLLL G σ
+++ρι+ρι+ρι+ρι
=∆ (Rendel and Robertson, 1950)
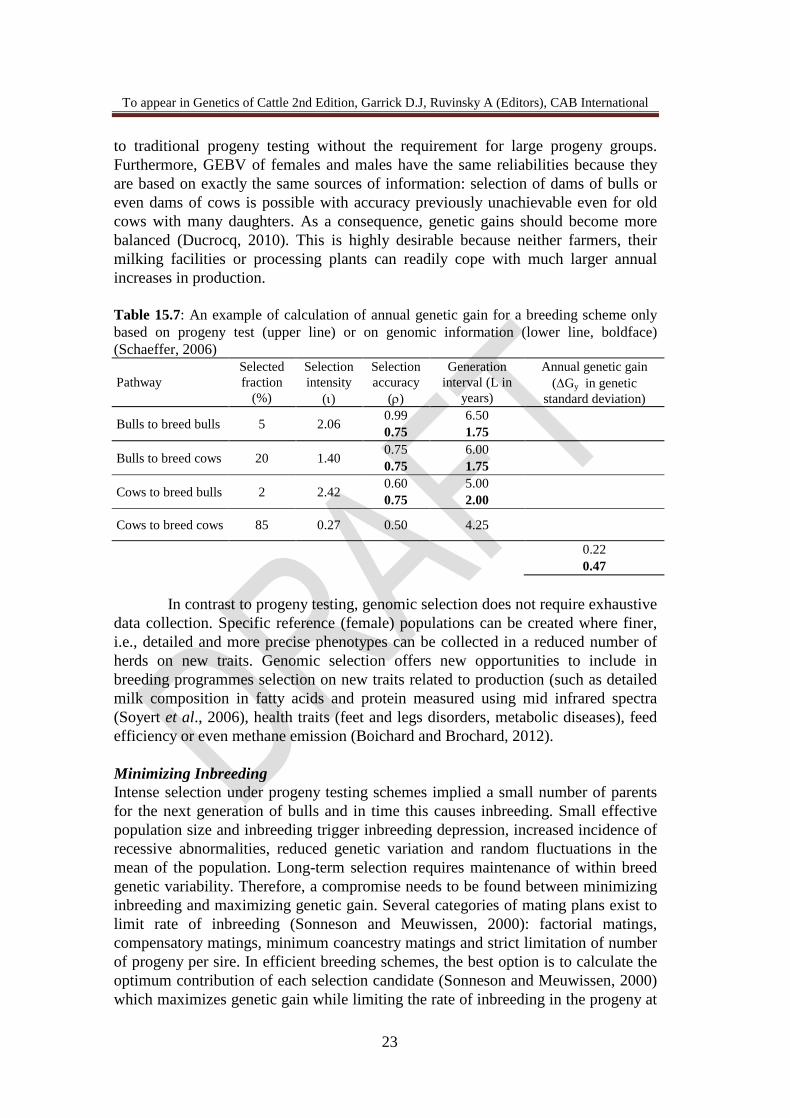
Table 15.7 demonstrates such calculation for a typical progeny test of the pre-genomic era. The parameters which have attracted most attention in breeding programs are the proportion of cows to be mated to young bulls, the number of young bulls progeny tested per year and the number of daughters per young bull. The optimum values of these parameters varied widely between studies, from 15% to almost 100% of cows mated to young bulls and 20 to 400 daughters per young bull. For a cow population of a given size, these two parameters used to determine the number of young bulls to be progeny tested. (Dekkers et al., 1996) Different optima were found depending on the objective (maximum rate of genetic progress, maximum monetary outcome from the program), the economic horizon, the population size and the breeding goal (inclusion of traits of low heritability or observed late in life). As the population size increased, the optimum proportion of matings to young bulls decreased, the number of daughters per bull increased, the number of bulls progeny tested increased and the rate of genetic gain increased. When economic benefit was the objective, 80 to 150 daughters per young bull was close to optimum, but in practice, these optima were relatively flat so there was little cost to departing slightly from the optimum value of a parameter. When MOET became possible, new designs were proposed to increase genetic gain despite the associated extra cost. Nicholas and Smith (1989) suggested nucleus breeding herds with selection of bulls based on the performance of their sibs and older relatives. In MOET designs, generation interval is reduced but at the expense of a less accurate selection than progeny testing. Breeding programs with genomic selection The genomic revolution has imposed a complete revision of the previous golden standards and traditional breeding schemes are being disrupted. Genomic selection relies on the same feature as MOET schemes (reduced generation interval) but at a much lower global cost – especially when the genotyping of the reference population is financed through public funds and/or shared within consortia - and with only a modest decrease in reliability compared with progeny testing. Breeding parameters along the same four pathways are adapted to optimize breeding programs. Schaeffer (2006) showed that under genomic selection, the annual genetic gain for the current breeding goals can be doubled even when keeping selection intensity unchanged: compared with a typical progeny testing scheme, the average generation interval can be more than halved and the higher reliability of dams of bulls compensates for the lower reliability of sires of bulls. Table 15.7 includes expected figures from Schaeffer (2006) for a typical breeding scheme fully based on GEBV. His hypotheses may not all be realistic but they clearly illustrate the huge impact of the generation interval reduction on annual genetic gain. Yet changes induced by genomic selection are not limited to a faster global genetic gain. GEBV of functional traits (often with low heritability) are available at birth with reliabilities comparable
To appear in Genetics of Cattle 2nd Edition, Garrick D.J, Ruvinsky A (Editors), CAB International
23
to traditional progeny testing without the requirement for large progeny groups. Furthermore, GEBV of females and males have the same reliabilities because they are based on exactly the same sources of information: selection of dams of bulls or even dams of cows is possible with accuracy previously unachievable even for old cows with many daughters. As a consequence, genetic gains should become more balanced (Ducrocq, 2010). This is highly desirable because neither farmers, their milking facilities or processing plants can readily cope with much larger annual increases in production. Table 15.7: An example of calculation of annual genetic gain for a breeding scheme only based on progeny test (upper line) or on genomic information (lower line, boldface) (Schaeffer, 2006) Pathway
Selected fraction
(%)
Selection intensity
(ι)
Selection accuracy
(ρ)
Generation interval (L in
years)
Annual genetic gain (∆Gy in genetic
standard deviation)
Bulls to breed bulls 5 2.06 0.99 6.50 0.75 1.75
Bulls to breed cows 20 1.40 0.75 6.00 0.75 1.75
Cows to breed bulls 2 2.42 0.60 5.00 0.75 2.00
Cows to breed cows 85 0.27 0.50 4.25
0.22 0.47 In contrast to progeny testing, genomic selection does not require exhaustive data collection. Specific reference (female) populations can be created where finer, i.e., detailed and more precise phenotypes can be collected in a reduced number of herds on new traits. Genomic selection offers new opportunities to include in breeding programmes selection on new traits related to production (such as detailed milk composition in fatty acids and protein measured using mid infrared spectra (Soyert et al., 2006), health traits (feet and legs disorders, metabolic diseases), feed efficiency or even methane emission (Boichard and Brochard, 2012). Minimizing Inbreeding Intense selection under progeny testing schemes implied a small number of parents for the next generation of bulls and in time this causes inbreeding. Small effective population size and inbreeding trigger inbreeding depression, increased incidence of recessive abnormalities, reduced genetic variation and random fluctuations in the mean of the population. Long-term selection requires maintenance of within breed genetic variability. Therefore, a compromise needs to be found between minimizing inbreeding and maximizing genetic gain. Several categories of mating plans exist to limit rate of inbreeding (Sonneson and Meuwissen, 2000): factorial matings, compensatory matings, minimum coancestry matings and strict limitation of number of progeny per sire. In efficient breeding schemes, the best option is to calculate the optimum contribution of each selection candidate (Sonneson and Meuwissen, 2000) which maximizes genetic gain while limiting the rate of inbreeding in the progeny at
24
a given level by restricting relationships between selected parents. A challenging question is then how to choose a suitable maximum rate of inbreeding. An alternative is to choose an acceptable reduction of genetic gain and organize matings to minimize the average coancestry of future animals (Colleau et al., 2004). A reduction of about 20% of this parameter can be obtained with very little loss in genetic gain. To be efficient, these approaches require a strong and centralized control of the planned matings, which may be difficult in practice.
At first glance, minimizing inbreeding under genomic selection appears more critical: with the reduction in generation interval, the same increase in rate of inbreeding per generation results in a faster increase per year. Indeed, Colleau (according to Boichard et al., 2012) showed that in a scenario where half of the cow population is bred to young bulls preselected on their GEBV and the other half is bred to the best 25% of these bulls returning to AI after performances of their progeny become available, the annual rate of inbreeding was 69% higher than in the progeny test reference situation. However, when the whole cow population was bred to young bulls, nearly the same increase in genetic gain was observed (>80%), but with a decrease in rate of inbreeding (-23%). The reason is that many more bulls are used, each one contributing a few thousand inseminations over a short period of time before being replaced. In France, this has been implemented and has led to the complete end of planned progeny testing. Of course, genetic evaluations of older bulls based on progeny performances are (and will be) still available. Another trend which is beneficial to control inbreeding is the large increase of the number of sires of bulls with no damaging impact on genetic gain: only their best sons are eventually selected based on their genomic information.
Conclusions Rapid progress in genetic improvement of dairy cattle has been achieved and the fast adoption of genomic selection portends an even more rapid increase. In recent years, the focus has shifted somewhat from yields of milk and components, to fitness and fertility traits to better track the total economic value. The investment of producers in milk recording and artificial insemination organizations in genotyping a large number of young bulls each year have been important contributions to this success. Data collection is somewhat easier with dairy cattle than some other farm species because of the intensive nature of production and the relatively high value of the individual animals. This situation has led to a highly developed system of data collection, genotyping and genetic evaluation. Further developments in genomic evaluation methods, mating programs and breeding plans hold promise for further increases in the rate of a more sustainable genetic improvement. References 1000 genome consortium (2013). http://www.1000bullgenomes.com/ Aamand, G.P. (2006). Use of health data in genetic evaluation and breeding. EAAP
Scientific Series 121, 275-282. Aguilar, I., Misztal, I., Johnson, D.L., Legarra, A., Tsuruta, S. and Lawlor, T. J. (2010) A
unified approach to utilize phenotypic, full pedigree and genomic information for
To appear in Genetics of Cattle 2nd Edition, Garrick D.J, Ruvinsky A (Editors), CAB International
25
genetic evaluation of Holstein final score. Journal of Dairy Science 93,743-752. Ali, A.K.A, and Shook, G.E. (1980). An optimum transformation for somatic cell
concentration in milk. Journal of Dairy Science 62, 487-490. Ashwell M.S., Van Tassell, C.P. and Sonstergard, T.S. (2001). A genome scan to identify
quantitative trait loci affecting economically important traits in a US Holstein population. Journal of Dairy Science 84, 2535-2542.
Blott, S., Kim, J.J., Moisio, S., Schmidt-Küntzel, A., Cornet, A., Berzi, P., Cambiaso, N., Ford, C., Grisart, B., Johnson, D., Karim, L., Simon, P., Snell, R., Spelman, R., Wong, J., Vilkki, J., Georges, M., Farnir, F. and Coppieters, W. (2003). Molecular dissection of a quantitative trait locus: A phenylalanine-to-tyrosine substitution in the transmembrane domain of the bovine growth hormone receptor is associated with a major effect on milk yield and composition. Genetics 163, 253-266.
Boichard, D. and Borchard, M. (2012) New phenotypes for new breeding goals in dairy cattle. Animal 6, 544-550.
Boichard, D., Maignel, L. and Verrier E. (1997). Value of using probabilities of gene origin to measure genetic variability in a population. Genetics Selection Evolution 29, 5-23.
Boichard, D., Grohs, C., Bourgeois, F., Cerqueira, F. Faugeras, R., Neau, A., Rupp, R., Amigues, Y., Boscher, M.Y. and Leveziel, H. (2003). Detection of genes influencing economic traits in three French dairy cattle breeds. Genetics Selection Evolution 35, 77-101.
Boichard, D., Chung, H., Dassonneville, R., David, X., Eggen, A., Fritz, S., Gietzen, K.J., Hayes, B.J., Lawley, C.T., Sonstegard, T. S., Van Tassell, C.P., VanRaden, P.M., Viaud-Martinez, K. A. and Wiggans, G. R. (2012a). Design of a Bovine Low-Density SNP Array Optimized for Imputation. PLoS ONE 7, e34130
Boichard, D., Guillaume, F., Baur, A., Croiseau, P., Rossignol, M.N., Boscher, M.Y., Druet, T., Genestout, L., Colleau, J.J., Journaux, L., Ducrocq, V. and Fritz, S. (2012b). Genomic Selection in French Dairy Cattle. Animal Production Science 52, 115-120.
Christensen, O.F. and Lund, M.S. (2010). Genomic prediction when some animals are not genotyped. Genetics Selection Evolution 42, 2.
Cohen–Zinder, M., Seroussi, E., Larkin, D.M., Loor, J.J., Everts–van der Wind A. and Lee J.–H. (2005) Identification of a missense mutation in the bovine ABCG2 gene with a major effect on the QTL on chromosome 6 affecting milk yield and composition in Holstein cattle. Genome Research 15, 936–944.
Cole, J.B., VanRaden, P.M., O’Connell, J.R., Van Tassell, C.P., Sonstergard, T.S., Schnabel, R.D., Taylor J.F. and Wiggans, G.R. (2009) Distribution and location of genetic effects for dairy traits. Journal of Dairy Science 92, 2931–2946.
Colleau, J.J., Moureaux, S., Briend, M. and Béchu, J., (2004). A method for the dynamic management of genetic variability in dairy cattle. Genetics Selection Evolution 36, 373-394.
Croiseau, P., Legarra, A., Guillaume, F., Fritz, S., Baur, A., Colombani, C., Robert-Granié, C., Boichard, D. and Ducrocq, V. (2011) Fine tuning genomic evaluations in dairy cattle through SNP pre-selection with Elastic-Net algorithm. Genetic Research 93, 409-417.
Cunningham, E.P. and Täubert, H. (2009) Measuring the effect of change in selection indices. Journal of Dairy Science 92, 6192–6196.
Danchin-Burge, C., Leroy, G., Brochard, M., Moureaux, S. and Verrier, E. (2012) Evolution of genetic variability of eight French dairy cattle breeds assessed by pedigree analysis. Journal of Animal Breeding and Genetics 129, 206-217.
De Roos, A.P.W., Hayes, B.J. and Goddard, M.E. (2009) Reliability of genomic predictions across multiple populations. Genetics 183, 1545-1553.
Druet, T., Jaffrezic, F. and Ducrocq, V., (2005). Estimation of genetic parameters for test day records of dairy traits in the first three lactations. Genetics Selection Evolution 37,

26
257 -271. Druet, T. and George, M. (2010) A hidden Markow model combining linkage and linkage
disequilibrium information for haplotype reconstruction and quantitative trait locus fine mapping. Genetics 184, 789-798.
Ducrocq, V. (2000). Calving ease evaluation of French dairy bulls with a heteroskedastic threshold model with direct and maternal effects. Interbull Bulletin 25, 123-130
Ducrocq, V. (2005). An improved model for the French genetic evaluation of dairy bulls on length of productive life of their daughters. Animal Science 80, 249-256.
Ducrocq V. (2010). Sustainable dairy cattle breeding: illusion or reality? Proceedings of the 9th World Congress on Genetics Applied to Livestock Production. Leipzig, Germany, August 1-6, Communication 66.
Dürr, J. and Philipsson, J., (2011). International cooperation: the pathway for cattle genomics. Animal Frontiers 2,16-21.
Egger-Danner, C., Fuerst-Waltl, B., Obritzhauser, W., Fürst, C., Schwarzenbacher, H., Grassauer, B., Mayerhofer, M. and Koeck, A. (2012). Recording of direct health traits in Austria -Experience report with emphasis on aspects of availability for breeding purposes. Journal of Dairy Science 95, 2765-2777.
Erbe, M., Hayes, B.J., Matukumalli, L.K., Goswami, S., Bowman, P.J., Reich, C.M., Mason, B.A. and Goddard, M.E. (2012) Improving accuracy of genomic predictions within and between dairy cattle breeds with imputed high-density single nucleotide polymorphism panels. Journal of Dairy Science 95, 4114-4129.
Garrick, D.J., B.L. Harris and D.L. Johnson. 1997. The across-breed evaluation of dairy cattle in New Zealand. Proceedings of the Association for the Advancement of Animal Breeding and Genetics 12th Conference, 12:611-615.
Gianola, D. and Foulley, J.L. (1983) Sire evaluation for ordered categorical data with a threshold model. Genetics Selection Evolution 15, 201-224
Goddard, M.E. (1998) Consensus and debate in the definition of breeding objectives. Journal of Dairy Science 81, 6-16.
Grisart, B., Coppieters, W., Farnir, F., Karim, L., Ford, C., Berzi, P., Cambisano, N., Mni, M., Reid, S., Simon, P., Spelman, R., Georges, M. and Snell, R. (2002). Positional candidate cloning of a QTL in dairy cattle: Identification of a missense mutation in the bovine DGAT1 gene with major effect on milk yield and composition. Genome Research 12, 222–231.
Groen, A., Steine, T., Colleau, J., Pedersen, J., Pribyl, J. and Reinsch, N. (1997) Economic values in dairy cattle breeding, with special reference to functional traits - report of an EAAP working group (review). Livestock Production Science 49, 1-21.
Guillaume, F., Fritz, S., Boichard, D. and Druet, T (2008). Correlations of marker-assisted breeding values with progeny-test breeding values for eight hundred ninety-nine French Holstein bulls. Journal of Dairy Science 91, 2520–2522.
Harris, B.L., Winkelman, A.M., Johnson, D.L. and Montgomerie W.A. (2006) Development of a national production testday model for New-Zealand. Interbull Bulletin 35, 27-32.
Harris, B.L, and Johnson, D.L. (2010). Genomic predictions for New Zealand dairy bulls and integration with national genetic evaluation. Journal of Dairy Science 93, 1243-1252.
Hayes, B.J., Bowman, P.J., Chamberlain, A.J. and Goddard, M.E., (2009a). Genomic selection in dairy cattle: Progress and challenges. Journal of Dairy Science 92, 433-443.
Hayes, B.J., Bowman, P.J., Chamberlain, A.C., Verbyla, K. and Goddard, M.E. (2009b) Accuracy of genomic breeding values in multi-breed dairy cattle populations. Genetics Selection Evolution 24, 41-51.
Heins, B.J. and Hansen, L.B., (2012) Fertility, somatic cell score, and production of Normande × Holstein, Montbéliarde × Holstein, and Scandinavian Red× Holstein

To appear in Genetics of Cattle 2nd Edition, Garrick D.J, Ruvinsky A (Editors), CAB International
27
crossbreds versus pure Holsteins during their first 5 lactations. Journal of Dairy Science 95, 918-924.
Henderson, C.R., (1963). Selection index and expected genetic advance. in Hanson, W.D. and Robinson, H.F. (Eds.) Statistical genetics and plant breeding pp 141-163. National Academy of Science. National Research Council, Publ. 982, Washington, DC.
Henderson, C.R. (1984) Applications of linear models in animal breeding. Univ. Guelph, Guelph, Ontario, Canada. ISBN 0-88955-030-1.
Huquet, B., Leclerc, H. and Ducrocq, V. (2012). Modelling and estimation of genotype by environment interactions for production traits in French dairy cattle. Genetics Selection Evolution 44, 35.
Illumina, (2011). Data sheet: DNA analysis. BovineSNP50 genotyping BeadChip. Publ. N° 370-2007-029. Illumina Inc., San Diego, CA, USA.
International Committee for Animal Recording (2013) http://www.icar.org Interbull (2013) http://www.interbull.org Jackobsen, J.H., Madsen, P., Jensen, J., Pedersen, J., Christensen, L.G., Sorensen, D.A.
(2002) Genetic parameters for milk production and persistency for Danish Holsteins estimated in random regression models using REML. Journal of Dairy Science 85, 1607-1616.
Jamrozik, J., Schaeffer, L.R. and Dekkers, J.C.M. (1997) Genetic evaluation of dairy cattle using test day yields and random regression model. Journal of Dairy Science 80, 1217-1226.
Jorjani, H. (2007) International genetic evaluation of female fertility traits in five major breeds Interbull Bulletin 37, 144:151.
Jorjani, H. (2011). Genomic evauation of BSW populations, Intergenomics: results and deliverables. Interbull Bulletin 43, 5-8.
Kalbfleisch, J.D., and Prentice, R.L. (2002) The statistical analysis of failure time data 2nd edition. Wiley series in probability and statistics. 462pp.
Kizilkaya, K and Tempelman, R.J. (2005) A general approach to mixed effects modeling of residual variances in generalized linear mixed models Genetics Selection Evolution 37, 31-56
Khatkar M.S., Thomson P.C., Tammen, I. and Raadsmaa, H.W. (2004). Quantitative trait loci mapping in dairy cattle: review and meta-analysis. Genetics Selection Evolution 36, 163-190.
Lassen, J., Hansen, N., Sørensen, M. K.. Aamand, G.P., Christensen, L.G. and Madsen, P. (2003). Genetic Relationship Between Body Condition Score, Dairy Character, Mastitis, and Diseases Other than Mastitis in First-Parity Danish Holstein Cows. Journal of Dairy Science 86, 3730-3735.
Liu, Z., Seefried, F.R., Reinhardt, F., Rensing, S., Thaller, G. and Reents, R. (2011). Impacts of both reference population size and inclusion of a residual polygenic effect on the accuracy of genomic prediction. Genetics Selection Evolution 43, 19.
Lund, M.S., de Roos, A.P.W., de Vries, A.G., Druet, T., Ducrocq, V., Fritz, S., Guillaume, F., Guldbrandtsen, B., Liu, Z., Reents, R., Schrooten, C., Seefried, M. and Su, G. (2011). Common reference of four European Holstein populations increase reliability of Genomic Predictions Genetics Selection Evolution 43, 43.
Mäntysaari, E., Liu, Z., and VanRaden, P. 2011. Interbull Validation Test for Genomic Evaluations. Interbull Bulletin 41, 17-21.
Matukumalli, L.K., Lawley, C.T., Schnabel, R.D., Taylor, J.F., Allan, M.F., Heaton, M.P., O'Connell, J., Moore, S.S., Smith, T.P., Sonstegard, T.S. and Van Tassell, C.P. (2009). Development and Characterization of a High Density SNP Genotyping Assay for Cattle. PLoS One. 4, e5350.
Meuwissen, T.H.E. (1991) Expectation and variance of genetic gain in open and closed
28
nucleus and progeny testing schemes. Animal Production 53, 133-141. Meuwissen, T.H.E., Hayes, B.J. and Goddard, M.E. (2001). Prediction of total genetic value
using genome-wide dense marker maps. Genetics 157,1819-1829. Meuwissen, T.H.E. and Goddard, M.E. (2010). Accurate Prediction of Genetic Values for
Complex Traits by Whole-Genome Resequencing. Genetics 185, 623-631 Miglior, F., Muir, B.L. and Van Doormaal, B.J. (2005). Selection indices in Holstein cattle
of various countries. Journal of Dairy Science 88, 1255-1263. Misztal, I., Varona, L., Culbertson, M., Gengler, N., Bertrand, J.K., Mabry, J., Lawlor, T.J.
and Van Tassell, C.P. (1998) Studies on the value of incorporating effect of dominance in genetic evaluations of dairy cattle, beef cattle, and swine. Proceedings on 6th World Congress on Genetics Applied to Livestock Production. Armidale, NSW, Australia. 25, pp. 513-516.
Misztal, I., Lawlor, T.J.,. Short, T.H and VanRaden, P.M. (1992) Multiple-trait estimation of variance components of yield and type traits using an animal model. Journal of Dairy Science 75, 544-551.
Nicholas, F.W. and Smith, C. (1989) Increased rates of genetic change in dairy cattle by embryo transfer and splitting. Animal Production 36, 341-353.
Ojango, J.M.K and Pollot, G.E. (2002). The relationship between Holstein bull breeding values for milk yield derived in both the UK and Kenya. Livestock Production Science 74,1–12.
Olesen, I., Gjerde, B.and Groen, A. F. (1999) Methodology for deriving non-market trait values in animal breeding goals for sustainable production systems. Interbull Bulletin 23, 13-22.
Patry, C., and Ducrocq, V., (2011). Evidence of biases in genetic evaluations due to genomic pre-selection in dairy cattle. Journal of Dairy Science 94, 1011-1020.
Philipsson, J., Banos, G. and Arnason, T. (1994) Present and future uses of selection index methodology in dairy cattle. Journal of Dairy Science 77, 3252-3261.
Pryce, J.E., Coffey, M.P. and Simm, G. (2001) The Relationship Between Body Condition Score and Reproductive Performance. Journal of Dairy Science 84,1508–1515.
Pryce, J.E., Harris, B.L., Bryant, J.R. and Montgomerie, W. A. (2009) Do robust dairy cows already exist? EAAP Scientific Series 126, 99-112.
Rendel, J.M., and Robertson, A. (1950) Estimation of genetic gain in milk yield by selection in a closed herd of dairy cattle. Journal of Genetics 50, 1-10.
Robert-Granié, C., Bonaiti, B., Boichard, D. and Barbat, A. (1999). Accounting for variance heterogeneity in French dairy cattle genetic evaluation. Livestock Production Science 60, 343-357
Schaeffer, L.R. (1994) Multiple-country comparison of dairy sires. Journal of Dairy Science 77, 2671-2678.
Schaeffer, L.R. (2006). Strategy for applying genome-wide selection in dairy cattle. Journal of Animal Breeding and Genetics 123, 218-223.
Sonneson, A.K and Meuwissen T.H.E., (2000). Mating schemes for optimum contribution selection with constrained rate of inbreeding. Genetics Selection Evolution 32, 231-248.
Soyert, H., Dardenne, P., Dehareng, F, Lognay, G., Veselko, D., Marlier, M., Bertozzi, C., Mayeres, P. and Gengler, N., (2006). Estimating fatty acid content in cow milk using mid-infrared spectrometry. Journal of Dairy Science 89, 3690-3695.
Spelman, R.J., (2002) Utilisation of molecular information in dairy cattle breeding. Proceedings of the 7th World Congress on Genetics Applied to Livestock Production 33, 1-17.
Spelman R.J., Coppieters W., Grisart B., Blott, S.and Georges M. (2001). Review of QTL mapping in the New Zealand and Dutch dairy cattle populations Proceedings of the Association for Advancement of Animal Breeding and Genetics 14, 11-16
Steine, G., Kristofersson, D. and Guttormsen A.G, (2008), Economic evaluation of the

To appear in Genetics of Cattle 2nd Edition, Garrick D.J, Ruvinsky A (Editors), CAB International
29
breeding goal for Norvegian Red dairy cattle. Journal of Dairy Science 91, 418428. Van der Linde, C., De Jong, G., Koenen, E.P.C and Eding, H. (2010). Claw health index for
Dutch dairy cattle based on claw trimming and conformation data. Journal of Dairy Science 93, 4883-4891
VanRaden, P.M. and Wiggans, G.R. (1991). Derivation, calculation, and use of national animal model information. Journal of Dairy Science 74, 2737-2746.
VanRaden, P.M. (1992) Accounting for inbreeding and crossbreeding in genetic evaluation of large populations. Journal of Dairy Science 75, 3136.
VanRaden, P.M. (2001) Method to combine estimated breeding values obtained from separate sources. Journal of Dairy Science 84 (E. Suppl): E47-E55.
VanRaden, P.M., Tooker, M.E., Cole, J.B., Wiggans, G.R. and Megonigal, J.H. (2007) Genetic evaluations for mixed-breed populations. Journal of Dairy Science 90, 2434-2441.
VanRaden, P.M., (2008). Efficient Methods to Compute Genomic Predictions. Journal of Dairy Science 91, 4414-4423.
VanRaden, P.M., Van Tassell, C.P., Wiggans, G.R., Sonstegard, T.S., Schnabel, R.D., Taylor, J.F. and Schenkel, F.S. (2009). Reliability of genomic predictions for North American Holstein bulls. Journal of Dairy Science 92, 16-24
VanRaden, P.M., O'Connell, J.R., Wiggans, G.R. and Weigel, K.A. (2011a) Genomic evaluations with many more genotypes. Genetics Selection Evolution 43,10.
VanRaden, P.M., Olson, K.M, Null, D.J. and Hutchison, J.L. (2011b) Harmful recessive effects on fertility detected by absence of homozygous haplotypes. Journal of Dairy Science 94, 6153–6161
VanRaden, P.M., Null, D.J., Sargolzaei, M., Wiggans, G.R., Tooker, M.E. Cole, J.B., Connor, E.E., Winters, M., Van Kaam, J.B.C.H.M., Sonstegard, T.S, Valentini, A., Van Doormaal, B.J., Faust, M.A. and Doak, G.A. (2013) Genomic imputation and evaluation using high-density Holstein genotypes. Journal of Dairy Science 96, 668–678
Van Tassell, C.P., Misztal, I. and Varona, L. (2000) Method R Estimates of Additive
Genetic, Dominance, Genetic and Permanent Environmental Fraction of Variance for Yield and Health Traits of Holsteins. Journal of Dairy Science 83,1873–1877
Van Tassell, C.P., Smith, T.P.L., Matukumalli, L.K., Taylor, J.F., Schnabel, R.D., Taylor Lawley, C., Haudenschild, C.D., Moore, S.S., Warren, W.C. and Sonstegard, T.S.. (2008). SNP discovery and allele frequency estimation by deep sequencing of reduced representation libraries. Nature Methods 5, 247–252.
Verbyla, K.L., Hayes, B.J., Bowman, P.J. and Goddard, M.E. (2009). Accuracy of genomic selection using stochastic search variable selection in Australian Holstein Friesian dairy cattle. Genetics Research 91, 307-311.
Visscher, P.M., Bowman, P.J. and Goddard, M.E. (1994) Breeding objectives for pasture based dairy production systems. Livestock Production Science 40, 123-137.
Weller, J.I., Kashi, Y. and Soller, M. (1990) Power of daughter and granddaughter designs for determining linkage between marker loci and quantitative trait loci in dairy cattle. Journal of Dairy Science 73, 2525-2537.
Weller, J.I., VanRaden, P.M., and Wiggans, G.R. (2013) Application of a posteriori granddaughter and modified granddaughter designs to determine Holstein haplotype effects. Journal of Dairy Science Published online: 7 June 2013 DOI: 10.3168/jds.2013-6650.
Wiggans, G.R. and VanRaden, P.M. (1991) Method and effect of adjustement for heterogeneous variance. Journal of Dairy Science 74, 4350-4357.
Wiggans, G.R., VanRaden, P.M. and Zuurbier, J. (1995) Calculation and use of inbreeding coefficients for genetic evaluation of United States Dairy Cattle. Journal of Dairy

30
Science 78, 1584-1590. Wiggans, G.R., Cooper, T.A., VanRaden, P.M. and Cole, J.B. (2011a) Adjustment of
traditional cow evaluations to improve accuracy of genomic predictions. Journal of Dairy Science 94, 6188–6193
Wiggans, G.R., VanRaden, P.M. and Cooper, T.A. (2011b) The genomic evaluation system in the United States: Past, present, future. Journal of Dairy Science 94, 3202-3221.
Winter, A., Kramer, W., Werner, F.A.O., Kollers, S., Kata, S., Durstewitz, G, Buitkamp, J., Womack, J.E., Thaller, G. and Fries, R. (2002) Association of a lysine-232/alanine polymorphism in a bovine gene encoding acyl-CoA: diacylglycerol acyltransferase (DGAT1) with variation at a quantitative trait locus for milk fat content. Proceedings of the National Academy of Science 99, 9300-9305.