genetic investigation and comparison of …etd.lib.metu.edu.tr/upload/12612369/index.pdf · and...
TRANSCRIPT
GENETIC INVESTIGATION AND COMPARISON OF KARTALDAĞ AND MADENDAĞ EPITHERMAL GOLD MINERALIZATION IN
ÇANAKKALE-REGION
A THESIS SUBMITTED TO THE GRADUATE SCHOOL OF NATURAL AND APPLIED SCIENCES
OF MIDDLE EAST TECHNICAL UNIVERSITY
BY
EZGİ ÜNAL
IN PARTIAL FULFILMENT OF THE REQUIREMENTS FOR
THE DEGREE OF MASTER OF SCIENCE IN
GEOLOGICAL ENGINEERING
SEPTEMBER 2010

Approval of the thesis: GENETIC INVESTIGATION AND COMPARISON OF KARTALDAĞ AND
MADENDAĞ EPITHERMAL GOLD MINERALIZATION IN ÇANAKKALE-REGION, TURKEY
submitted by EZGI ÜNAL in partial fulfillment of the requirements for the degree of Master of Science in Geological Engineering Department, Middle East Technical University by,
Prof. Dr. Canan Özgen Dean, Graduate School of Natural and Applied Sciences
Prof. Dr. Zeki Çamur Head of Department, Geological Engineering Dept.
Prof. Dr. Nilgün Güleç Supervisor, Geological Engineering Dept., METU
Prof. Dr. İlkay Kuşcu Co-Supervisor, Geological Engineering Dept., Muğla University
Examining Committee Members:
Prof. Dr. Asuman G. Türkmenoğlu Geological Engineering Dept., METU
Prof. Dr. Nilgün Güleç Geological Engineering Dept., METU
Prof. Dr. M. Cemal Göncüoğlu Geological Engineering Dept., METU
Assoc. Prof. Dr. Sönmez Sayılı Geological Engineering Dept., Ankara University
Assist. Prof. Dr. Tolga Oyman Geological Engineering Dept., Dokuz Eylül University
Date: 13.09.2010

iii
I hereby declare that all information in this document has been obtained and presented in accordance with academic rules and ethical conduct. I also declare that, as required by these rules and conduct, I have fully cited and referenced all material and results that are not original to this work.
Name, Last name: Ezgi Ünal
Signature:

iv
ABSTRACT
GENETIC INVESTIGATION AND COMPARISON OF KARTALDAĞ AND
MADENDAĞ EPITHERMAL GOLD MINERALIZATION IN ÇANAKKALE-
REGION, TURKEY
Ünal, Ezgi
M.Sc., Department of Geological Engineering Supervisor: Prof. Dr. Nilgün Güleç Co-Supervisor: Prof. Dr. Ilkay Kuşcu
September 2010, 181 Pages This thesis study is concerned with the genetic investigation of two epithermal gold
deposits (Madendağ and Kartaldağ) in Çanakkale, NW Turkey. The methodology
comprises field and integrated laboratory studies including mineralogic-petrographic,
geochemical, isotopic, and fluid inclusion analysis.
Kartaldağ deposit, hosted by dacite porphyry, is a typical vein deposit associated
with four main alteration types: i) propylitic, ii) quartz-kaolin, iii) quartz-alunite-
pyrophyllite, iv) silicification, the latter being characterized by two distinct quartz
generations as early (vuggy) and late (banded, colloform). Primary sulfide minerals
are pyrite, covellite and sphalerite. Oxygen and sulfur isotope analyses, performed on
quartz (δ18O: 7.93- 8.95 ‰) and pyrite (δ34S: -4.8 ‰) separates, suggest a magmatic
source for the fluid. Microthermometric analysis performed on quartz yield a
temperature range of 250-285 ºC, and 0-1.7 wt % NaCl eqv. salinity.
Madendağ deposit, hosted by micaschists, is also vein type associated with two main
alteration types: illite and kaolin dominated argillization and silicification,

v
characterized by two distinct quartz phases as early and late. Oxygen isotope
analyses on quartz (δ18O: 9.55-18.19 ‰) indicate contribution from a metamorphic
source. Microthermometric analysis on quartz yield a temperature range of 235-255
ºC and 0.0-0.7 wt % NaCl eqv. salinity.
The presence of alunite, pyrophyllite and kaolinite, vuggy quartz and covellite
suggest a high-sulfidation epithermal system for Kartaldağ. On the other hand,
Madendağ is identified as a low- sulfidation type owing to the presence of neutral pH
clays and typical low temperature textures (e.g. colloform, comb, banded quartz).
Keywords: Kartaldağ Gold Deposit, Madendağ Gold Deposit, Hydrothermal Alteration,
High Sulfidation Epithermal Systems, Low Sulfidation Epithermal Systems, Fluid
Inclusion, Oxygen and Sulfur Isotopes

vi
ÖZ
ÇANAKKALE YÖRESİ KARTALDAĞ VE MADENDAĞ EPİTERMAL ALTIN
CEVHERLEŞMELERİNİN KARŞILAŞTIRMALI JENETİK İNCELEMESİ
Ünal, Ezgi
Yüksek Lisans, Jeoloji Mühendisliği Bölümü Tez Yöneticisi: Prof. Dr. Nilgün Güleç Ortak Tez Yöneticisi: Prof. Dr. İlkay Kuşcu
Eylül 2010, 181 Sayfa Bu tez çalışması, Çanakkale (KB Türkiye)’deki iki epitermal altın yatağının
(Madendağ ve Kartaldağ) kökensel incelemesini konu edinmektedir. Metodoloji,
arazi çalışması ile mineralojik-petrografik, jeokimyasal, izotopik ve sıvı kapanım
analizlerini içeren bütünleşik laboratuvar çalışmalarını kapsamaktadır.
Kartaldağ yatağı, dasit porfiri yankayacında bulunan damar tipi bir yatak olup, dört
ana alterasyon zonuna sahiptir: i) propilitik, ii) kuvars-kaolin, iii) kuvars-alünit-
pirofillit, iv) silisleşme. Silisleşme zonu, “vuggy” dokulu erken kuvars ve bantlı-
kolloform dokulu geç kuvarstan oluşan iki ayrı kuvars türü ile tanımlanmaktadır.
Birincil sülfid mineralleri pirit, kovelit ve sfalerittir. Kuvars (δ18O: 7.93- 8.95 ‰) ve
pirit (δ34S: -4.8 ‰) örneklerinin oksijen ve kükürt izotop analizleri, akışkan için
magmatik bir kaynak önermektedir. Kuvarslardaki mikrotermometrik analizler ile
250-285 ºC sıcaklık ve 0-1.7 % NaCl eşdeğeri tuzluluk aralıkları elde edilmiştir.
Madendağ yatağı mikaşist yankayacı içine yerleşmiş olup iki ana alterasyon türüne
sahiptir: illit ve kaolen hakim arjillik alterasyon ve iki ayrı kuvars fazıyla (erken ve
geç) betimlenen silisleşme. Kuvars minerallerinde yapılan oksijen izotopları ile elde

vii
edilen aralık (δ18O: 9.55-18.19 ‰ ) metamorfik bir kaynaktan katkı belirtmektedir.
Kuvars üzerinde yapılan mikrotermometrik analizler, 235-255 ºC sıcaklık ve 0-0.7 %
NaCl eşdeğeri tuzluluk aralığı vermiştir.
Alünit, pirofillit ve kaolinit, “vuggy” kuvars ve kovelitin varlığı, Kartaldağ için
yüksek sülfidasyonlu epitermal bir sisteme işaret etmektedir. Diğer taraftan
Madendağ, nötr pH koşullarındaki kil mineralleri ve tipik düşük sıcaklık dokularının
varlığından dolayı (kolloform, taraksı, bantlı kuvars) düşük sülfidasyonlu bir
epitermal sistem olarak tanımlanmıştır. Anahtar Kelimeler: Kartaldağ Altın Yatağı, Madendağ Altın Yatağı, Hidrotermal
Alterasyon, Yüksek Sülfidasyonlu Epitermal Sistemler, Düşük Sülfidasyonlu Epitermal
Sistemler, Sıvı Kapanım, Oksijen ve Kükürt İzotopları

viii
To my family...

ix
ACKNOWLEDGEMENTS It is a great pleasure to express my deepest gratitude to my supervisor, Prof. Dr. Nilgün Güleç, and my co-supervisor, Prof. Dr. İlkay Kuşcu for their guidance, endless support, encouraging suggestions, and insight from the initial to final level of this research. They showed me the various ways to approach a problem and the needs to be tolerant so that the goal will be accomplished successfully. Thank you for your trust, I always feel appreciated. Besides my advisors, I am grateful to Prof. Dr. Tony Fallick from Scottish
Universities Environmental Research Center (SUERC), for the (charge-free) stable
isotope analyses and his insightful stance. I should also express my special thanks to
Prof. Dr. Asuman G. Türkmenoğlu for her allowance to use the clay mineralogy
laboratory and scientific help in the XRD and SEM/EDX studies and Prof. Dr. M.
Cemal Göncüoğlu for his valuable advises in different stages of the study.
Special thanks to Orhan Karaman for his help during all phases of the field campaigns, technical support and friendly attitude. I would like to thank Prof. Dr. Yusuf Kaan Kadıoğlu, Assoc. Prof. Dr. Sömez Sayılı for their tolerance in using mineralogy-petrography and fluid inclusion laboratories in the Department of Geological Engineering, Ankara University. I want to express my appreciation to Assist. Prof. Dr. Fatma T. Köksal for allowing me kindly to use the sample preparation laboratory. It is a great honor to feel her admiration. I feel also indebted to Assoc. Prof. Dr. M. Lütfi Süzen, Assoc. Prof. Dr. Bora Rojay, Prof. Dr. Erdin Bozkurt, Assoc. Prof. Dr. Nuretdin Kaymakcı, and Assist. Prof.Dr. Arda Özacar. I should thank to Erkan Yılmazer for any assistance and Gökhan Demirela who kindly helped me in fluid inclusion studies. I also wish to thank to Gülay Sezerer Kuru for her help for preparing the fluid inclusion samples.

x
I am thankful to Kıvanç Yücel, Kaan Sayıt, Selin Süer, Yavuz Özdemir, and Ayşe Özdemir who were always helpful and kind to me. I should thank to Zafer Kaplan for his helps in using XRD instrument. I offer my regards to the academic and technical staff of ALS (CA and TR), SUERC (UK), Fluid Inclusion Technologies, Inc. (USA) laboratories, Central Laboratory of METU, and SEM laboratory in the Department of Metallurgical and Materials Engineering, particularly to Cengiz Tan (Research Associate) who was very helpful. I should thank to the Scientific and Technological Research Council (TÜBİTAK) of Turkey for the financial support and the scholarship via the project no.109Y183. I would also like to thank to Çanakkale Mining Co. for allowing me to study in the “Serçeler” licensed area. I wish to express my special thanks to my friends Filiz Diri, Sabire Aslı Oflaz, Zuhal Şeker, and Irmak Aynur for their motivational support and tolerance. I would like to extent my thanks to Nesrin Tüfekçi, İ. Ferid Öge, Gülsevim Özışık, and Seda Çiçek for all their support. I am heartily thankful to Ali İmer who is trying to support me any kind. Four years of faith, kindness and appreciation has helped me to increase my confidence and led myself to improve. His endless moral support, scientific guidance, punctual suggestions, and –may be the most important- patience was very significant. Last, but not least, I would like to thank my family: my parents, Sevgi and Hüseyin
Ünal for providing me a peaceful family atmosphere, for educating me, and for
unconditional love. My brother, Eray Çağlar Ünal, for believing in me in every step
of life and for being my depressant at home.

xi
TABLE OF CONTENTS ABSTRACT ................................................................................................................ iv
ÖZ ............................................................................................................................... vi
ACKNOWLEDGEMENTS ........................................................................................ ix
TABLE OF CONTENTS ............................................................................................ xi
LIST OF TABLES .................................................................................................... xiv
LIST OF FIGURES .................................................................................................. xvi
CHAPTERS
1. INTRODUCTION.................................................................................................... 1
1.1 Purpose and Scope ......................................................................................... 1
1.2 Geographic Setting ......................................................................................... 1
1.3 Methods of Study ........................................................................................... 4
1.4 Layout of Thesis ............................................................................................. 8
2. TECTONIC SETTING AND REGIONAL GEOLOGY ......................................... 9
2.1 Western Anatolia: Tectonic Setting and Geologic Outline ............................ 9
2.2 Biga Peninsula: Regional Geology .............................................................. 12
2.2.1 Pre-Tertiary – Basement Rocks ............................................................ 14
2.2.2 Tertiary rocks of the Biga Peninsula ..................................................... 17
2.2.2.1 Neogene sedimentary sequences .................................................... 17
2.2.2.2 Cenozoic volcanism ....................................................................... 17
2.2.2.3 Granitoids of the Biga Peninsula .................................................... 18
3. EPITHERMAL DEPOSITS: AN OVERVIEW .................................................... 20
3.1 General Characteristics of Epithermal Deposits .......................................... 20
3.1.1 Low Sulfidation (LS) type epithermal deposits .................................... 27
3.1.2 High Sulfidation (HS) type epithermal deposits ................................... 30
3.2 Epithermal Deposits in Turkey .................................................................... 33
3.3 Biga Peninsula: Previous Studies ................................................................. 36
4. LOCAL GEOLOGY .............................................................................................. 39
4.1 Rock Units .................................................................................................... 39
4.1.1 Pre-Tertiary Rocks ................................................................................ 39

xii
4.1.2 Tertiary rocks ........................................................................................ 44
5. ORE DEPOSITS: GEOLOGY AND ALTERATION PETROGRAPHY ............. 52
5.1 Kartaldağ Gold Mine ................................................................................... 52
5.1.1 Field Aspects ......................................................................................... 52
5.1.2 Wall Rock Alteration ............................................................................ 64
5.1.2.1 Propylitic Alteration ....................................................................... 64
5.1.2.2. Quartz-Kaolin Alteration .............................................................. 69
5.1.2.3 Quartz-Alunite-Pyrophyllite Alteration ......................................... 72
5.1.2.4 Vuggy Quartz / Pervasive Silicification ......................................... 78
5.1.3 Ore Petrography .................................................................................... 85
5.2 Madendağ Gold Mine .................................................................................. 90
5.2.1 Field Aspects ......................................................................................... 90
5.2.2. Wall Rock Alterations ........................................................................ 101
5.2.2.1 Argillic Alteration ........................................................................ 101
5.2.2.2 Silicification ................................................................................. 107
5.2.3 Ore Petrography .................................................................................. 114
6. ORE DEPOSITS: ALTERATION GEOCHEMISTRY AND STABLE ISOTOPE
COMPOSITIONS ............................................................................................... 116
6.1. Alteration Geochemistry ........................................................................... 116
6.1.1 Alteration Geochemistry of Kartaldağ Deposit ................................... 117
6.1.1.1 Element Mobility during Propylitic Alteration of Dacite Porphyry
.................................................................................................................. 122
6.1.1.2 Element Mobility during Quartz - Kaolin and Quartz –Alunite
Pyrophyllite Alterations ........................................................................... 125
6.1.2 Alteration Geochemistry of Madendağ Deposit ................................. 130
6.1.2.1 Element Mobility during Argillic (Illite Dominated) Alteration of
the Micaschist ........................................................................................... 135
6.1.2.2 Element Mobility during Silicic Alteration (Silicification) of the
Micaschist ................................................................................................ 139
6.2 Stable Isotope Compositions ...................................................................... 141
6.2.1 Oxygen Isotope Compositions of Kartaldağ and Madendağ Districts 143
6.2.2 Sulphur Isotope Compositions of Kartaldağ and Madendağ Deposits 145

xiii
7. FLUID INCLUSIONS ......................................................................................... 146
7.1. Fluid Inclusion Analyses ........................................................................... 146
7.2 Fluid Inclusion Petrography ....................................................................... 149
7.3 Fluid Inclusion Microthermometry ............................................................ 155
8. DISCUSSION AND CONCLUSIONS ............................................................... 160
8.1 Kartaldağ Deposit ...................................................................................... 160
8.2 Madendağ Deposit ..................................................................................... 163
8.3 Concluding Remarks .................................................................................. 165
REFERENCES ......................................................................................................... 169

xiv
LIST OF TABLES
TABLES Table 3.1 Nomenclature used for the two end-member epithermal environments
(modified from Hedenquist et al., 2000; Hedenquist and Sillitoe, 2003) ............. 21
Table 3.2 Known HS type epithermal deposits with their principal features in Biga
Peninsula (superscript numbers refer to the references) ....................................... 37
Table 3.3 Known LS type epithermal deposits with their principal features in Biga
Peninsula ............................................................................................................... 38
Table 4.1. Results of the geochronologic analyses for the rock units in this study .. 47
Table 5.1 Samples collected in the Kartaldağ mine district ...................................... 60
Table 5.1 (cont.) ........................................................................................................ 61
Table 5.1 (cont.) ........................................................................................................ 62
Table 5.1 (cont.) ........................................................................................................ 63
Table 5.2 Samples collected in the Madendağ mine district ..................................... 97
Table 5.2 (cont.) ........................................................................................................ 98
Table 5.2 (cont.) ........................................................................................................ 99
Table 5.2 (cont.) ...................................................................................................... 100
Table 6.1 Representative chemical analyses of almost fresh and altered samples from
Kartaldağ Mine District (oxides and S and C in wt %, trace and rare earth
elements in ppm) (bold values were used to construct isocon diagrams) ........... 118
Table 6.1 (cont.) ...................................................................................................... 119
Table 6.1 (cont.) ...................................................................................................... 120
Table 6.1 (cont.) ...................................................................................................... 121
Table 6.2 Gains (G) and losses (L) of the elements during propylitic alteration .... 124
Table 6.2 (cont.) ...................................................................................................... 125
Table 6.3 Gain (G) and losses (L) of the elements during Quartz-Kaolin (sample no.
KD3-d) and Pyrophyllite-Alunite-Quartz (samples no. KD5-a, 5-c, and 8-c)
alterations ............................................................................................................ 128

xv
Table 6.3 (cont.) ...................................................................................................... 129
Table 6.4 Representative chemical analyses of almost fresh and altered samples from
Madendağ Mine District (oxides and S and C in wt %, trace and rare earth
elements in ppm) (bold values were used to construct isocon diagrams) ........... 131
Table 6.4 (cont.) ...................................................................................................... 132
Table 6.4 (cont.) ...................................................................................................... 133
Table 6.4 (cont.) ...................................................................................................... 134
Table 6.5 Gain (G) and losses (L) of the elements during argillic alteration (sample
no. MD6-1, MD18, MD6-4, and MD6-14) ......................................................... 137
Table 6.5 (cont.) ...................................................................................................... 138
Table 6.6 Gain (G) and losses (L) of the elements during silicic alteration (sample
no. MD6-8, MD12, and MD13) .......................................................................... 140
Table 6.6 (cont.) ...................................................................................................... 141
Table 6.7 Representative oxygen and sulfur isotope analyses results of the silicified
samples from Madendağ and Kartaldağ mine districts ....................................... 142
Table 7.1 Fluid inclusion petrography of sample MD9-2 ....................................... 149
Table 7.2 Fluid inclusion petrography of sample KD6 ........................................... 150
Table 7.3 Fluid inclusion petrography of sample KD7 ........................................... 150
Table 7 .4 Microthermometric analysis results of the fluid inclusion populations the
Madendag district in sample MD9-2 (number in parentheses indicates the number
of inclusions measured, N/A is not available) ..................................................... 155
Table 7.4 (cont.) ...................................................................................................... 156
Table 7.5 Microthermometric analysis results of the fluid inclusion populations for
the Kartaldag district in sample KD6 (number in parentheses indicates the number
of inclusions measured, N/A is not available) ..................................................... 157
Table 7 .6 Microthermometric analyze results of the fluid inclusion populations
found in sample KD7 (number in parentheses indicates the number of inclusions
measured, N/A is Not Available) ........................................................................ 159

xvi
LIST OF FIGURES FIGURES Figure 1.1 Geographic setting of the study area .......................................................... 3
Figure 2.1 Simplified map showing the tectonic setting of western Anatolia within
the overall framework of the neotectonic units of Turkey (Bozkurt, 2001) .......... 11
Figure 2.2 The map showing the major paleo-tectonic units of western Anatolia
(Bozkurt and Oberhänsli, 2001) ............................................................................ 12
Figure 2.3 Regional geologic map of Biga Peninsula (modified from Okay and Satır,
2000) ...................................................................................................................... 13
Figure 2.4 Geological map of northern Ezine showing the study area (from Okay
and Satır, 2000) ..................................................................................................... 16
Figure 2.5 Simplified geological map of Altunkaynak (2007) showing the
distribution of Eocene and Oligo-Miocene granitoids of NW Turkey (1: Kestanbol
Pluton, 2: Kuşçayır Pluton, 3: Evciler Pluton, 4: Karabiga Pluton, 5: Eybek
Granodiorite, 6: Kapıdağ Granitoid, 7: Ilıca - Şamlı Granodiorite, 8: Çataldağ
Granodiorite, 9: Fıstıklı Granitoids, 10: Orhaneli Granitoid, 11: Topuk Granitoid,
12: Göynükbelen Granitoid, 13: Gürgenyayla Granitoid) ..................................... 19
Figure 3.1 f S2–T phase diagram showing the sulfide minerals in epithermal deposits
defining the sulfidation states (Hedenquist and Sillitoe, 2003) ............................ 23
Figure 3.2 Tectonic settings of gold-rich epigenetic mineral deposits ..................... 24
(Groves et al., 1998) ................................................................................................... 24
Figure 3.3 Global distribution of epithermal and intrusion related Au deposits
(Taylor, 2007) ........................................................................................................ 25
Figure 3.4 Sketch view displaying the formations of two end-member epithermal
deposits and their relation with the subvolcanic source (Hedenquist and
Lowenstern, 1994; Hedenquist et al., 1996, 2000) ................................................ 26
Figure 3.5 Thermally induced hydrothermal minerals in the epithermal ore zone
(White and Hedenquist, 1995; Hedenquist et al., 2000) ....................................... 27

xvii
Figure 3.6 Crustiform and colloform banding and comb textured ore at the
McLaughlin mine, California, USA (Deb, 2008) .................................................. 28
Figure 3.7 General model created for the LS alteration style (Hedenquist et al.,
2000) ...................................................................................................................... 29
Figure 3.8 A sketch displaying the boiling process in the low sulfidation systems
(Cooke and Simmons, 2000) ................................................................................. 30
Figure 3.9 The silicic vuggy host in Summitville HS deposit, Colorado, USA (Deb,
2008) ...................................................................................................................... 30
Figure 3.10 Diagrammatic alteration model created for HS epithermal deposits
(Hedenquist et al., 1994; Hedenquist et al., 2000) ................................................ 31
Figure 3.11 HS alteration and ore deposition model based on the previous model of
White, 1991 (Arribas, 1995; Cooke and Simmons, 2000) .................................... 33
Figure 3.12 Distribution of the epithermal deposits and prospects of Turkey showing
Madendağ and Kartaldağ deposits (from Yiğit, 2009) .......................................... 35
Figure 4.1 Geological map of the area covering Madendağ and Kartaldağ ancient
mines (Modified from Dönmez et al, 2008) .......................................................... 41
Figure 4.2 Tectonostratigraphic section of the study area (Not to scale) .................. 42
Figure 4.3 Field photo showing grey to greenish grey, slightly oxidized quartz-
micaschist (Çamlıca metamorphics) ..................................................................... 42
Figure 4.4 Photomicrograph illustrating general mineralogical and textural features
of quartz-micaschist Q: Quartz, Mus: Muscovite (Sample no. MD14) ................ 43
Figure 4.6 Serpentinized ultramafic rock (mostly harzburgite) outcropping in the
vicinity of Çiftlikdere village ................................................................................ 44
Figure 4.7 Dacite porphyry outcrop and hand specimen photo (host rock of
Kartaldağ gold mine) ............................................................................................. 46
Figure 4.8 Photograph showing granodiorite handspecimen. Hbl: Hornblende, Pl:
Plagioclase (Sample no. KD-25) ........................................................................... 47
Figure 4.9 Photomicrograph of granodiorite sample (No. KD25) showing coarse
grained, weakly altered hornblende, quartz, and plagioclase minerals, Hbl:
Hornblende, Pl: Plagioclase, Q: Quartz ................................................................. 48
Figure 4.10 Basaltic tuff (Şahinli Formation) exposed in the north of the study area
............................................................................................................................... 49

xviii
Figure 4.11 Photograph showing acidic tuff (oxidized) outcrop within the study area
............................................................................................................................... 49
Figure 4.12 Photomicrograph of andesitic-basaltic tuff unit. Ti: Titanite, Pl:
Plagioclase ............................................................................................................. 50
Figure 4.13 Photomicrograph of olivine basalt. Ol: Olivine, Pl: Plagioclase (Sample
no. MD2) ............................................................................................................... 50
Figure 4.14 Handspecimen photo and photomicrograph of dacitic volcanic breccia.
Quartz, Arg.: Argillic matrix, Lm: Limonite, Pl: Plagioclase (Sample no. MD-15)
............................................................................................................................... 51
Figure 5.1 The main inclined gallery driven through the main quartz vein by the
Astyra Mining Co. ................................................................................................. 53
Figure 5.2 Alteration map of Kartaldağ mine district ............................................... 54
Figure 5.3 Cross sections showing the traverse lines # 1, 2, and 3 ........................... 55
Figure 5.4 The main gallery at Kartaldağ and approximate positioning of the
samples taken. A: Picture is looking towards NW, B: Looking towards NE
(numbers labeled as KD represent sample no.) ..................................................... 58
Figure 5.5 Recent extension of the main gallery by Çanakkale Mining Co.
(Northeast of the main gallery) (KD8a, b, c representing samples taken) ............ 59
Figure 5.6 Quartz veins towards summit of Kartaldağ silicified vein ...................... 59
Figure 5.7 Photomicrograph of epidotized-chloritized hornblende, propylitic
alteration (Sample no. KD1-a) (Chl: Chlorite, Arg. Alt: Argillic alteration, Ep:
Epidote) ................................................................................................................. 65
Figure 5.8 Hand specimen photo of the sample KD1-a, propylitic alteration sample
............................................................................................................................... 66
Figure 5.9 Argillic alterations (Arg. Alt) within the dacite porphyry with typical
quartz-eye structure and plagioclase. (Sample no. KD1-a) (Plg: Plagioclase, Q:
Quartz) ................................................................................................................... 66
Figure 5.12 Result of SEM-EDX analysis of KD2 (propylitic alteration sample).
Chlorite – Smectite mixed layer is exposed with Mg, Fe, and Al peaks, Illite is
associated with K and Al peaks, Kaolin and Quartz (low temperature) display Si
and Al peaks .......................................................................................................... 68

xix
Figure 5.15 Argillic alterations on sample no.KD3-d. Arg. Alt: Argillic (illite-
dominated) alteration ............................................................................................. 70
Figure 5.17 Northeastern part of the main gallery in the quartz – kaolin alteration
(See opening to the main gallery, sampled as KD23, 24) ..................................... 71
Figure 5.18 Pervasive argillic alteration (illite, kaolin) and euhedral pyrite minerals.
Sample no.KD4-b, Arg. Alt. Argillic Alteration (illite and kaolin dominated) Py:
Pyrite ..................................................................................................................... 72
Figure 5.22 Result of SEM/EDX analysis of KD5-b (see Al and S peaks supporting
the existence of alunite, kaolinite and pyrite, and Cl peaks showing the existence
of zunyite (?) ......................................................................................................... 75
Figure 5.23 Result of SEM/EDX analysis of KD8-b (Al and Si contents representing
kaolinite and quartz) .............................................................................................. 75
Figure 5.24 SEM photomicrograph showing pyrophyllite and kaolinite crystals. K:
Kaolinite, Pyr: Pyrophyllite (?), Sample no. KD8-b ............................................. 76
Figure 5.25 Photomicrograph showing pyrite-alunite-quartz vein (sample KD5-c.
Al: Alunite, Py: Pyrite) .......................................................................................... 76
Figure 5.26 Photomicrograph of showing euhedral alunite crystals, A: crossed polar,
B: single polar (sample no. KD10, Al: Alunite) .................................................... 77
Figure 5.27 The field exposure of silicified ridges through which the ancient mining
operations were focused (a) ridge looking SE, (b) ridge looking NW from
Çataltepe ................................................................................................................ 79
Figure 5.28 Massive replacement of dacite porphyry with occasional alunite (pinkish
minerals) ................................................................................................................ 80
Figure 5.29 Vuggy quartz formed by leaching hornblende and plagioclase (refer to
insets for ghosts/pseudomorphs for leached minerals) .......................................... 80
Figure 5.30 Fine grained quartz (Q) crystallized around the vugs left behind the
leached out minerals during early silicification and alunite crystals (Al) displaying
infilling textures (Sample no. KD10) .................................................................... 81
Figure 5.31 Medium grained quartz vein formed during late silicification phase
cutting through the fine grained-massive quartz of early silicification (leaching)
phase (Sample no. KD5-c) .................................................................................... 81

xx
Figure 5.32 Early and late phases of silicification, massive and banded quartz
generations representing the phases, respectively (Sample no. KD7) .................. 82
Figure 5.33 Pervasive silicification (early phase) replaced by quartz vein (late
silicification) (Sample no. KD14) ......................................................................... 82
Figure 5.34 Photomicrograph showing early (fine grained, massive and vuggy) and
late (comb, banded) silicification (see vuggy quartz with euhedral pseudomorphs
of hornblende and plagioclase veined by late comb quartz) (Sample no. KD15) . 83
Figure 5.35 Pervasive leaching and vug generation (vugs not filled), early
silicification sample - KD13- ................................................................................ 83
Figure 5.36 Multi-banded, colloform quartz, late silicification sample (Sample no.
KD12) .................................................................................................................... 84
Figure 5.37 Vuggy quartz (early silicification phase) in sample no. KD15 .............. 84
Figure 5.38 Coarse grained quartz crystals with well developed growth zones
(Sample no. KD6) formed during late silicification phase .................................... 85
Figure 5.39 Pyrite concentrations along the margins of late silicification replacing
the early silicification (Sample no. KD5-c) Py: Pyrite .......................................... 86
Figure 5.40 Cataclastic deformation observed on pyrite (2nd group) (Sample no.
KD5-a) Py: Pyrite .................................................................................................. 87
Figure 5.41Pyrite and sphalerite minerals (intergrown) in sample KD5-c. Sph:
sphalerite, Py: Pyrite .............................................................................................. 88
Figure 5.42 Covellite and pyrite minerals in sample KD5-a. (Intergrown/replaced?)
Co: Covellite, Py: Pyrite ........................................................................................ 88
Figure 5.43 Covellite replacing pyrite. Co: Covellite, Py: Pyrite (Sample no.KD5-c)
............................................................................................................................... 89
Fig. 5.44 Azurite and malachite formations in the main gallery where KD8 series of
samples were collected .......................................................................................... 89
Figure 5.45 Alteration map of Madendağ mine district ............................................ 93
Figure 5.46 Photograph showing the micaschist as the host rock of the Madendağ
deposit (Sample no. MD-1) ................................................................................... 94
Figure 5.47 General view of the Vein #1 in Madendağ district within altered
micaschist .............................................................................................................. 94

xxi
Figure 5.48 Photograph illustrating the field exposure of an argillized and oxidized
micaschist (Sample no. MD6-1) ............................................................................ 95
Figure 5.49 Closed gallery opened by Astyra British Co. during 1914-1918 ........... 95
Figure 5.50 A gallery driven through the clay-altered micaschist at Meydan Tepe . 96
Figure 5.51 Dump # 1 area towards the north of Vein # 1 ........................................ 96
Figure 5.52 Photomicrograph of argillized schist (Sample no. MD6-2) showing clay-
altered muscovite ................................................................................................. 102
Figure 5.53 Result of XRD analysis of sample MD6-1. I: Illite, Q: Quartz (AD: Air-
dried, EG: Ethylene glycolated, 300 ºC and 500 ºC: Heated in oven (300 ºC) and
fired at 550 ºC) .................................................................................................... 103
Figure 5.54 Result of XRD analysis of sample MD6-12. I: Illite, Q: Quartz (AD:
Air-dried, EG: Ethylene glycolated, 300 ºC and 500 ºC: Heated in oven (300 ºC)
and fired at 550 ºC).............................................................................................. 103
Figure 5.55 Result of SEM/EDX analysis of MD6-1 showing illite ± kaolin (K, Al,
Si) and quartz (Si) peaks ..................................................................................... 104
Figure 5.56 Result of XRD analysis of sample no. MD - U.P. K: Kaolin, Q: α-Quartz
(AD: Air-dried, EG: Ethylene glycolated, 300 ºC and 500 ºC: Heated in oven (300
ºC) and fired at 550 ºC) ....................................................................................... 104
Figure 5.57 Result of XRD analysis of MD9-1 (calc-micaschist). Chl: Chlorite, I:
Illite, K: Kaolin, Q: Quartz (low temperature), Cc: Calcite (AD: Air-dried, EG:
Ethylene glycolated, 300 ºC and 500 ºC: Heated in oven (300 ºC) and fired at 550
ºC) ........................................................................................................................ 105
Figure 5.58 Result of SEM/EDX analysis of MD9-1 showing illite (K, Al, Si) ±
kaolin (Al, Si) chlorite (Mg, Fe, Al, Si), calcite (Ca), and quartz (Si) peaks ...... 105
Figure 5.59 Goethite infilling the fractures, crossed-polar (Sample no.MD6-1) Gth:
Goethite, Py: Pyrite, Hem: hematite .................................................................... 106
Figure 5.60 Continuation of Vein # 1 towards NE ................................................. 108
Figure 5.61 Vein # 2 from the northern side of Meydan Tepe ................................ 108
Figure 5.62 Silicified bladed calcite from the silicified rocks in the Madendag
deposit ................................................................................................................. 109
Figure 5.63 Open space filling, banded quartz (early phase silicification) within
massive quartz (note relict metamorphic (Met.) rock) (Sample no. MD6-1) ...... 109

xxii
Figure 5.64 Banded-comb quartz formations (early phase silicification) truncating
the schistosity planes (dotted lines) (Sample no. MD6-13) ................................ 110
Figure 5.65 Early phase silicification, banded-comb quartz vein (Sample no. MD12),
form Vein #2 location .......................................................................................... 110
Figure 5.66 Crustiform - banded and comb quartz crystals, early phase silicification
(Sample no. MD6-3) ............................................................................................ 111
Figure 5.67 Late phase silicification truncating the pyrite (disseminated) bearing
early phase silicification (Sample no. MD6-1) ................................................... 111
Figure 5.68 Hydrothermal breccia showing the late silicification (Sample no. MD8)
from Dump # 2 sampling area ............................................................................. 112
Figure 5.69 Relatively fine grained quartz crystals of late silicification phase veining
banded, coarse grained early phase (Sample no. MD9-2), from Dump # 2
sampling area ....................................................................................................... 112
Figure 5.70 Late phase silicification, quartz breccia veining comb-banded quartz
(early phase) (Sample no. MD9-2), from Dump # 2 location ............................. 113
Figure 5.71 Quartz breccia from the Dump # 1 area (early and late silicification
phases) (Sample no. MD17A and B) ................................................................... 113
Figure 5.72 Sample MD8 showing coarser, euhedral (low temperature) pyrites (Py)
and sphalerite (Sph) ............................................................................................. 114
Figure 5.73 Goethite infilling the fractures, Gth: Goethite (Sample no. MD6-1) ... 115
Figure 6.1 MORB normalized REE spider diagram showing the similarity between
the samples KD25 and KD18 .............................................................................. 117
Figure 6.2 Isocon diagrams showing the oxide and trace element variations between
the propylitic samples and least altered dacite porphyry sample (dashed lines are
the isocons, s is the slope) ................................................................................... 123
Figure 6.3 Isocon diagrams showing the oxide and trace element variations of the
samples from (A) quartz- kaolin (Sample no. KD3-d) and (B, C, and D)
pyrophyllite-alunite-quartz zone (Sample no. KD5-a, KD5-c, and KD8-c) (dashed
lines are the isocons, s is the slope) ..................................................................... 127
Figure 6.4 Isocon diagrams showing the oxide and trace element variations of
argillized (illite dominated) samples with respect to calc-micaschist host rock
(dashed lines are the isocons, s is the slope) ....................................................... 136

xxiii
Figure 6.5 Isocon diagrams showing the oxide and trace element variations of
argillized (illite dominated) samples with respect to calc-micaschist host rock
(Samples from Vein #1 area, dashed lines are the isocons, s is the slope) .......... 139
Figure 6.6 Comparison of the δ18O values of Kartaldağ and Madendağ samples with
those from various rocks and water sources (KD: Kartaldağ, MD: Madendağ)
(Rollinson, 1993) ................................................................................................. 144
Figure 7.1 Primary fluid inclusion textures trapped within quartz crystals (Goldstein
and Reynolds, 1994) ............................................................................................ 148
Figure 7.2 Representative mineral grain displaying the types of the fluid inclusions
among the growth zones (defined by the distribution of primary fluid inclusions).
s: secondary fluid inclusions, ps: pseudosecondary fluid inclusions, p: primary
fluid inclusions (Goldstein and Reynolds, 1994) ................................................ 148
Figure 7.3 Sample photomicroscopy for the sample MD9-2 .................................. 152
Figure 7.4 Sample Photomicroscopy for the sample KD6 ...................................... 153
Figure 7.5 Sample photomicroscopy for the sample KD7 ...................................... 154
Figure 7.6 Homogenization temperature (Th ºC) ranges determined for the fluid
inclusion populations (FIP) found in sample MD9-2 .......................................... 156
Figure 7.7 Homogenization temperature (Th ºC) ranges determined for the fluid
inclusion populations (FIPs) in sample KD6 ...................................................... 158
Figure 7.8 Homogenization temperature (Th ºC) ranges determined for the fluid
inclusion populations (FIPs) in sample KD7 ...................................................... 159

1
CHAPTER 1
1. INTRODUCTION
1.1 Purpose and Scope
Western Anatolia is considered to be an important region within the framework of
Tethyan metallogenic belt from the Balkans to Iran. Biga Peninsula hosting
especially epithermal type deposits is regarded as an important component of this
belt. Within the Biga Peninsula, Çanakkale is a metallogenic province hosting
several epithermal and porphyry systems. The porphyry systems are usually localized
within the Çan area, and usually co-exist with epithermal occurrences. The
epithermal systems are more wide spread, and are recognized as high-sulfidation and
low-sulfidation types.
This thesis is concerned with the genetic investigation and comparison of two
epithermal gold deposits (Madendağ and Kartaldağ ancient gold mines) in Çanakkale
from the perspective of a possible differentiation into high- and low-sulfidation type
deposits. To accomplish this goal, field, petrographic, geochemical, isotopic and
fluid inclusion studies were conducted on the samples from wall rocks and altered
(mineralized) rocks.
1.2 Geographic Setting
Kartaldağ and Madendağ deposits (both are abandoned) are located in Biga
Peninsula of western Anatolia, Turkey. The UTM coordinates outlining the study
area are in between 462000 – 467000 Easting and 4427000 – 4434000 Northing
coordinates in h17 d4 quadrangle of Turkey (Fig. 1.1). Kartaldağ deposit is situated
55 km southwest of Çanakkale (~6 km south of Terziler village), and accessible
through the main from Çanakkale-Çan highway. Madendağ mine is located 50 km

2
southwest of Çanakkale and ~3 km south of the Terziler village. The distance on
topographic map between Madendağ and Kartaldağ mine is nearly 6 km.

Figu
re 1
.1 G
eogr
aphi
c se
tting
of t
he st
udy
area
3

4
1.3 Methods of Study
The thesis study was conducted through two main stages, a) field studies, b)
laboratory studies.
a) Field studies were carried out in two field campaigns between September
2008 and October 2009. In the first field campaign, systematic sampling and
mapping studies including revising present maps of the study area were
accomplished. In the second field campaign, geological works focused more on
alteration mapping and sampling for the fluid inclusion studies. In the study
area, sampling was performed from several distinct locations for both
Madendağ and Kartaldağ mine districts and they were explained in detail in the
“Ore Deposit Geology” chapter of the present study.
b) Laboratory studies consist basically of petrographical, geochemical, fluid
inclusion and geochronological studies. Thin and polished sections of selected
samples for both Madendağ and Kartaldağ mine areas were examined to
identify the mineral assemblage and the textural features of the fresh wall rocks
and altered rocks, which are in turn used to define wall rock alteration type.
Subsequently, XRD (X-Ray Powder Diffraction), SEM/EDX (Scanning
Electron Microscopy/Energy Dispersive X-ray spectroscopy) analyses were
performed to accompany petrographical identification of the alteration
characteristics. Then, the wall rock (fresh and altered) samples were dated by
Ar/Ar methodology to link the petrography, alteration and local geology.
Together with the petrographical and geochronological data, whole rock
geochemistry, stable isotope (oxygen and sulfur), and fluid inclusion studies of
the selected samples representing two mineralization sites were utilized for
completion of the data accomplished.

5
Among the laboratory studies;
i) Petrographical studies were performed in the Geological Engineering Departments
of Middle East Technical University (METU), Muğla University, and Ankara
University. 83 thin sections (75 for the ancient mine areas, 8 for the local geology)
and 20 polished sections were prepared in the sample preparation laboratory of
Department of Geological Engineering, METU. Transmitted and reflected light
microscopes equipped with cameras were used for the mineralogic and petrographic
identifications. The petrographical studies enabled selection of samples for
geochemical and more detailed analyses including XRD, SEM/EDX and
geochronology.
ii) XRD analyses of selected 13 samples were undertaken in the XRD laboratory of
Geological Engineering Department of METU following a sample preparation stage.
During sample preparation, 1 random and 4 oriented sample powders (< 2 μm in
grain size) were prepared for each sample. Random samples were prepared by
placing the sample powders on glass slide holders (dry, random < 170 mesh (~63
μm) samples). Oriented samples were prepared by first subjecting the sample
powders to acid treatment to eliminate their carbonate and iron contents (Moore and
Reynolds, 1997); treated sample powders were then placed on thin sections (oriented,
wet samples of clay fraction). These oriented samples were X-rayed under air-dried;
ethylene glycolated (overnight at 60 ºC); heated in oven (300 ºC) and fired at 550 ºC
in furnace in order to identify different clay mineral groups qualitatively. During the
XRD analysis, standard 2- theta (degree) data were collected by using Rigaku
MiniFlex II X-ray diffractometer. The XRD result for each sample is plotted by
using software package of Rigaku Miniflex II.
iii) SEM/EDX studies of 5 selected samples were carried out in the SEM facility of
Central Laboratory and SEM laboratory of the Metallurgical & Materials
Engineering (METE) Department of METU. Monitoring of prepared (crushed, air-
dried, and reduced to sizes about 1 cm) samples was realized by using the devices of
QUANTA 400F Field Emission SEM (Central Laboratory, METU) and JSM-6400

6
Electron Microscope (JEOL) equipped with NORAN System 6 X-ray Microanalysis
System & Semafore Digitizer (METE-METU). Both morphological and
compositional information were gathered about the samples via these microscopes
combined with EDX equipments.
iv) 40Ar /39Ar geochronology was carried out at the The Pacific Centre for Isotopic
and Geochemical Research (PCIGR) of the University of British Columbia (Canada),
on hornblende, biotite, and sericite separates gathered from the fresh magmatic and
altered rocks. A total of 5 samples selected from two deposits (1 sample from the
altered metamorphic rock, 2 samples from the fresh and altered volcanic rocks, 2
samples from the fresh and weakly altered plutonic rocks were crushed, washed in
deionized water, dried at room temperature, and sieved to obtain the size fraction
between 0.25 mm and 0.15 mm. Mineral separates in an irradiation capsule with
similar-aged samples and neutron flux monitors (Fish Canyon Tuff sanidine (FCs,
28.02 ± 0.16 Ma, Renne et al., 1998) were irradiated at the McMaster Nuclear
Reactor in Hamilton, Ontario. The samples were analyzed at PCIGR by the Laser-
Equipped Noble Gas Mass Spectrometer-Micromass VG 5400. All measurements
were corrected for total system blank, mass spectrometer sensitivity, mass
discrimination, radioactive decay during and subsequent to irradiation, as well as
interfering Ar from atmospheric contamination and the irradiation of Ca, Cl and K
The plateau and correlation ages were calculated using Isoplot version 3.09 (Ludwig,
2003). Errors are quoted at the 2-sigma (95% confidence) level and are propagated
from all sources except mass spectrometer sensitivity and age of the flux monitor.
v) Whole rock geochemistry analyses were performed on 24 samples containing
magmatic, metamorphic and altered rock samples in the ALS Laboratories, Canada.
Analyses were carried out based on the commercial geochemical package named as
CCP-PKG01”Complete Characterization”. This package combines a number of
methods: 1) ME-ICP06 method (uses Inductively Coupled Plasma - Atomic
Emission Spectroscopy (ICP-AES)) for the major elements, 2) ME-MS81 method
(uses Inductively Coupled Plasma - Mass Spectroscopy (ICP - MS)) for the trace
elements including the rare earth element suite, 3) Leco Methods (analytical method

7
for total C: Infrared Spectroscopy, for total S: Leco sulphur analyzer) for the carbon
and sulphur contents, 4) ME-MS4 method (uses Inductively Coupled Plasma - Mass
Spectroscopy (ICP - MS)) for the volatile, Au related trace elements after an aqua
regia digestion, and 5) ME-4ACD81 method (uses Inductively Coupled Plasma -
Atomic Emission Spectroscopy (ICP - AES)) for the base metals after a four-acid
digestion.
iv) Stable isotope measurements were carried out in the Stable Isotope Research Unit
of Scottish Universities Environmental Research Center (SUERC), England.
Hand-picked quartz separates from the 6 silicified samples were analyzed for their
oxygen isotope ratios using a CAMECA IMS-4f Ion Microprobe at the University of
Edinburg (located 40 miles east of SUERC laboratory) using the technique described
in detail by Graham et al., (1996). Analytical precision using this technique is +1 ‰.
For S-isotope analyses, a total of 2 pyrite separates from mineralized, crushed
samples were hand-picked. A portion of each pyrite separate was classified between
the size fractions of coarse (>100 mm) and fine (<100 mm). A few milligrams of
each aggregate and size separate was combusted with Cu2O at high temperature
(1075 0C) in vacuo to produce SO2 (Robinson and Kusakabe, 1975) and purified to
obtain the average δ34S value of the bulk sample in a VG SIRA II © isotope ratio
mass spectrometer. The precision of the isotopic measurements was about 0.2 ‰
(1σ).
vii) Fluid inclusion studies were performed on the polished thin-sections (80-90 mm
in thickness) in Fluid Inclusion Technologies (FIT) laboratory, Oklahoma, USA. For
both Kartaldağ and Madendağ areas, a total of 6 sections were prepared from the
quartz separates, and were studied for their petrographic features. The sections were
examined in both planes light and under UV illumination. Fluid inclusion
assemblages were identified according to their presence, relationship to the host,
consistency of visual parameters (e.g. apparent vapor/liquid ratio) and applicability
for determining required information such as homogenization temperatures and

8
salinities. As a result of petrographic studies, 3 out of 6 sections were found to be
suitable for microthermometric analyses. A Fluid Inclusion Inc. modified U.S.G.S. -
type gas-flow heating/freezing stage was used to measure the aqueous inclusion
homogenization temperatures, final melting temperatures, and salinities.
1.4 Layout of Thesis
In this thesis, two abandoned gold mines from the Madendağ and Kartaldağ deposits,
within Çanakkale were studied for a genetic investigation and comparison of two
epithermal types. To accomplish this goal, a literature survey was followed by field,
laboratory, and data evaluation studies.
Following this chapter (Chapter 1) which introduces the aim and scope of the thesis,
as well as the geographic setting and methodology, information about the tectonic
setting and regional geology of western Anatolia and Biga Peninsula are given in
Chapter 2. An overview on the epithermal deposits, their general characteristics
combined with the previous studies on the epithermal deposits known to occur in the
Biga Peninsula constitute the subject of Chapter 3. In Chapter 4, local geology is
presented, including field observations and correlations with the previous studies.
Chapter 5 focused mainly on the ore deposit geology on the basis of mineralogic-
petrographic features of the alteration zones and mineralization. Chapter 6 is
concerned with the alteration geochemistry and stable isotope compositions, and
geochronological characteristics of fresh magmatic rocks and altered rocks. In
chapter 7, fluid inclusion studies are presented and the distinguishing features
(including both petrographic and microthermometric analyses) are summarized for
both areas. Finally, the discussions and the conclusive remarks of the whole thesis
are outlined in the Chapter 8.

9
CHAPTER 2
2. TECTONIC SETTING AND REGIONAL GEOLOGY
The study area is regionally located in the northern part of the West Anatolian region
within the Sakarya zone which represents one of the paleotectonic units of Turkey.
Metamorphic basement of the area is intruded by several episodes of post-collisional
granitoids and extension-related volcano-plutonic bodies.
2.1 Western Anatolia: Tectonic Setting and Geologic Outline
Western Anatolia comprises an integral segment of the Eastern Mediterranean belt.
Geodynamic evolution of the Eastern Mediterranean belt is described basically
within the framework of the plate tectonic movements resulting from the closure of
the NeoTethys Ocean along the Aegean-Cyprian subduction zone and the subsequent
continental collision of Anatolian and Afro-Arabian plates in eastern Anatolia and in
the Caucasus (Dewey and Şengör, 1979; Taymaz et al., 2007). Presently, the western
Anatolian region is undergoing an extensional regime represented by a number of E-
W and NE-SW trending grabens and is referred to as “West Anatolian Extensional
Province" (Fig. 2.1). The province is bounded by the structural systems of the
Aegean–Cyprian subduction zone in the south-southwest, the dextral North
Anatolian Fault System (NAFS) in the north and the dextral Tuzgölu Fault System
(TFZ) in the east (Fig. 2.1).
Being one of the active components of the Eastern Mediterranean region, West
Anatolian extensional province is an area of interest, the tectonics of which is still a
debatable subject of a number of studies that have been recently summarized by
Bozkurt (2001), Güleç and Hilton (2006). The commonly accepted models for the
presently active extension in western Anatolia are follows:

10
1) In most of the published papers (Dewey and Şengör, 1979; Şengör,
1979, 1987; Şengör et al., 1985; Taymaz et al., 1991; Görür et al.,
1995), the westward tectonic escape (since the middle-late Miocene) of
the Anatolian block along North Anatolian Fault Zone (NAFZ) and East
Anatolian Fault Zone (EAFZ) as a consequence of the northward
subduction of Arabian plate underneath the Anatolian plate is proposed
as the main driving mechanism of the extension.
2) In connection with the subduction (since about the late Oligocene)
along the Aegean-Cyprian trench, back arc extension related geological
model is claimed by the studies of McKenzie, 1972, 1978; Le Pichon
and Angelier, 1979; Jackson and McKenzie, 1988; Meulenkamp et al.,
1988; Taymaz et al., 1990; Kissel and Laj, 1998; Okay and Şatır, 1999)
3) A gravitational or orogenic collapse model - proposed by Seyitoğlu et
al., 1992; Seyitoğlu and Scott, 1996- is claiming that the main cause for
the Aegean and western Anatolian extension is the spreading and
thinning of the over-thickened crust since the closure of the Neo-Tethys
recorded back to the late Oligocene.
4) An episodic, two - stage extensional model (Koçyiğit et al., 1999;
Bozkurt, 2000, 2003; Bozkurt and Sözbilir, 2004) of the Aegean and
Anatolian region combines the ideas that concern both the orogenic
collapse as a first stage (since about the late Oligocene) and the tectonic
escape (since late Miocene) as a finalizing stage of the extension.
5) The differential velocity of convergence across the African plate (the
convergence of Greece being faster than Cyprus and Anatolia)
constitutes the reason for the north- northwestern velocity increase
towards the Aegean region and so for the extensional regime (Doglioni
et al., 2002).

11
The paleotectonic evolution of western Anatolia is associated with a number of
Mesozoic-Cenozoic closures of Neo-Tethyan oceanic branches and related micro
continental collisions, as well as subsequently occurring post-orogenic events
(Şengör and Yılmaz, 1981; Bozkurt and Mittwede, 2001; Okay et al. 2001; Dilek and
Pavlides, 2006; Robertson and Mountrakis, 2006). Specifically, openings and
closures of the Neo-Tethyan oceanic basins have played the role to characterize the
nature and the location of the paleotectonic and neotectonic units confined to distinct
representative suture zones (e.g İzmir-Ankara-Erzincan, Intra-Pontide, Inner Tauride,
Antalya and Bitlis-Zagros sutures, Okay and Tüysüz, 1999) in the area.
Figure 2.1 Simplified map showing the tectonic setting of western Anatolia within
the overall framework of the neotectonic units of Turkey (Bozkurt, 2001)
Western Anatolia comprises two major paleo-tectonic units, Sakarya zone in the
north and the Menderes Massif in the south, the boundary of which is defined by
İzmir-Ankara suture (Fig.2.2). The study area is located within the Sakarya zone and
the regional geology of the study is given in the following sections within the overall
framework of the Sakarya zone.

12
Figure 2.2 The map showing the major paleo-tectonic units of western Anatolia (Bozkurt and Oberhänsli, 2001)
2.2 Biga Peninsula: Regional Geology
The study area lies within the Biga Peninsula that constitutes the western end of the
Sakarya Zone (Fig. 2.2). The rock units outcropping in the Biga Peninsula can be
grouped as Pre-Tertiary and Tertiary units (Fig. 2.3, 2.4), and correlate with the
“Ezine Zone” of Okay et al. (1991). Ezine Zone is composed of three NE-SW
trending rock associations: a) Karadağ metamorphics, b) Denizgören Ophiolite, and
c) Çamlıca metamorphics.
In this section, regional rock associations of the Biga Peninsula are explained on the
basis of their ages as Pre-Tertiary - basement rocks, and Tertiary - overlying rocks.
While basement rocks are mainly composed of metamorphics, overlying units are
formed by Eocene-Miocene marine sediments, Eocene and Oligo-Miocene granitoids
Study area
100 km

13
and their volcanic equivalents together with Late Miocene - Pliocene volcanics and
siliciclastic sedimentary rocks (Fig. 2.3, 2.4).
Figure 2.3 Regional geologic map of Biga Peninsula (modified from Okay and Satır, 2000)
Study area

14
2.2.1 Pre-Tertiary – Basement Rocks The lowermost geologic unit of Biga Peninsula is the Paleozoic, high-grade
metamorphic rocks (phyllite, amphibolite, marble, metaperidotite, and gneiss)
referred to as either the Kazdağ Massif (Bingöl et al., 1973; Duru et al., 2004) or
Kazdağ Group (Okay et al., 1991) or Kazdağ metamorphic complex (Okay and Satır,
2000). This Paleozoic metamorphic basement is tectonically overlain by the Triassic
Karakaya Complex (Fig 2.3). The metamorphic rocks of the Karakaya Complex
(metabasites, marbles, schist, and phyllites) are generally metamorphosed in
greenschist facies (Bozkurt and Mittwede, 2001; Okay and Göncüoğlu, 2004) The
Karakaya Complex is unconformably overlain by the Jurassic-Lower Cretaceous
sedimentary rocks and Upper Cretaceous-Paleocene subduction-accretion mélanges
(Okay and Satır, 2000). In addition to these units, Okay et al. (1991) and Okay and
Satır (2000) distinguished another metamorphic unit in the pre-Tertiary basement of
Biga Peninsula which is entitled as Çamlıca metamorphics (micaschists) that seem to
be tectonically overlain -in places- by ultramafic bodies. The Çamlıca metamorphics
with serpentinite slivers are also the common rock types exposed in the study area
forming the Pre-Tertiary basement rocks in this thesis. Çamlıca metamorphics are
considered as an overlying unit of the Kazdağ massif by Kalafatçıoğlu (1963) and
Bilgin (1999), while Şengün and Çalık, (2007) and Şengün et al. (2010) suggest that
the Çamlıca metamorphics are equivalent of the İznik metamorphics in Armutlu
Peninsula. On the other hand, Göncüoğlu (1995), Göncüoğlu et al. (1997), Okay and
Satır (2000), Beccaletto (2003), and Beccaletto and Jenny (2004) propose that
Çamlıca metamorphics have affinities with the Rhodope and Serbo-Macedonian
Massifs of Bulgaria and Greece.
The Çamlıca metamorphics extend from the north and northeastern part of Ezine to
west of Karabiga and covers an area of nearly 500 km2 in the Biga Peninsula (Fig.
2.4). As investigated separately by Okay et al. (1991) as well, the Çamlıca
micaschists in the north of Ezine differ from the micaschists outcropping to the west
of Karabiga and called recently as Kemer micaschists (Bonev and Beccaletto, 2005,
2007). While reference section of the Çamlıca metamorphics (or micaschists) is
defined on the highway between Ezine to Çanakkale to the northeast of the Ezine,

15
close to the Çamlıca village, Kemer micaschists are entitled from the Kemer village
on the Marmara sea coast. The çamlıca micaschists, outcropping in the north of
Ezine, is structurally bounded by two faults, i) 33 km long, reverse Ovacık fault in
the north, and ii) poorly exposed Karıncalı fault in the south (Okay and Satır, 2000).
In the north of Ezine, Şengün and Çalık (2007) grouped the Çamlıca metamorphics
basically into three tectonostratigraphic units as i) Andıktaşı, ii) Dedetepe, and iii)
Salihler formations. Andıktaşı formation is made up of metavolcanics and
metapelite; Dedetepe formation, which is seen in the study area, is composed of
muscovite - quartz schist, chlorite - muscovite - quartz schist, garnet - micaschist
garnet-chlorite-micaschist, calc-schist, amphibolite, and marbles; Salihler formation
is, as an uppermost stratigraphic unit, formed by chlorite phyllite, calc-schist, and
marble (Şengün and Çalık, 2007). According to the index metamorphic minerals,
they are thought to be metamorphosed initially in eclogite facies and affected by the
facies of amphibolite and greenschist from the core to the margins of a regional
large-scaled anticline.

16
Figure 2.4 Geological map of northern Ezine showing the study area (from Okay and Satır, 2000)

17
2.2.2 Tertiary rocks of the Biga Peninsula The sedimentary, volcanic and volcano-sedimentary rocks (Tertiary in age) overlying
the pre-Tertiary basement in the Biga Peninsula are called overlying rocks in this
thesis, along with the Eocene and Oligo-Miocene granitoids.
2.2.2.1 Neogene sedimentary sequences
These consist of Eocene-Miocene marine sediments and Miocene-Pliocene
continental sediments (Fig. 2.3). The Eocene to Miocene sedimentary rocks within
the Biga Peninsula, predominantly marine type, include conglomerate, sandstone,
siltstone, mudstone, marl, calc-arenite, and oolitic and neritic limestones, whereas
Miocene-Pliocene continental sedimentary rocks include conglomerate, sandstone,
and mudstone.
2.2.2.2 Cenozoic volcanism
Following the closure of Neo-Tethyan Ocean between Sakarya continent and
Anatolide-Tauride platform during Late Paleoecene-Early Miocene (Bozkurt and
Mittwede, 2001), beginning of the post collisional regime (Latest Early Eocene,
Yılmaz et al., 1995; Genç and Yılmaz, 1995) is regarded as the controlling
mechanism for the extensive Eocene – Miocene magmatism in the Biga Peninsula.
Regarding the genesis of the Cenozoic volcanism in Biga Peninsula, the proposed
models commonly accept two types of volcanic associations; i) Middle Eocene -
Miocene calc-alkaline associations, and ii) Late Miocene alkaline associations
(Güleç, 1991; Aldanmaz, 2000; Yılmaz et al., 2001; Altunkaynak, 2007;
Altunkaynak and Genç, 2008). While the former group suggests a subduction and
collision-related interplay in the process (Yılmaz et al., 2001; Altunkaynak, 2007;
Dilek and Altunkaynak, 2009), the latter favors the present extensional regime
(Güleç, 1991; Aldanmaz, 2000; Yılmaz et al., 2001).

18
2.2.2.3 Granitoids of the Biga Peninsula
In the recent studies by Altunkaynak (2007) and Karacık et al. (2008), the granitoids
in Biga Peninsula are grouped into two as i) Marmara and ii) suture zone (i.e., Izmir
Ankara Erzincan Suture Zone) granitoids that intruded into Paleozoic-Mesozoic
metamorphic basement of Sakarya continent. Marmara granitoids are mostly
composed of monzogranite, granodiorite, and granite, while suture zone granitoids
are classified generally as diorite, quartz diorite, granodiorite, and syenite.
Plutonic rocks in Biga Peninsula are grouped into two, by Altunkaynak (2007) and
Altunkaynak and Genç, (2008), as the products of i) Eocene, and ii) Oligo-Miocene
magmatism (Fig. 2.5). They show calc-alkaline, high-K calc-alkaline and
shoshonitic, affinities (Altunkaynak and Genç, 2008). According to the geochemical
constraints, they are regarded as the evolutionary products of melts derived from
subduction-influenced lithospheric mantle. While Eocene plutons are exemplified by
Fıstıklı, Karabiga, Kapıdağ in the north and Orhaneli, Topuk, Göynükbelen,
Gürgenyayla, Kuşçayır in the south, Miocene granitoids are represented by Evciler,
Çataldağ, Kestanbol, Ilıca-Şamlı, Eybek (Fig. 2.5) (Genç, 1998; Altunkaynak 2007).

19
Figure 2.5 Simplified geological map of Altunkaynak (2007) showing the
distribution of Eocene and Oligo-Miocene granitoids of NW Turkey (1: Kestanbol Pluton, 2: Kuşçayır Pluton, 3: Evciler Pluton, 4: Karabiga Pluton, 5: Eybek
Granodiorite, 6: Kapıdağ Granitoid, 7: Ilıca - Şamlı Granodiorite, 8: Çataldağ Granodiorite, 9: Fıstıklı Granitoids, 10: Orhaneli Granitoid, 11: Topuk Granitoid, 12:
Göynükbelen Granitoid, 13: Gürgenyayla Granitoid)
1
2
3
4
5
6
7 8
9
10
28º
11 12
13

20
CHAPTER 3
3. EPITHERMAL DEPOSITS: AN OVERVIEW
3.1 General Characteristics of Epithermal Deposits
The term epithermal was first defined by Lindgren (1922, 1933) as a term in which
“epi” means shallow, “thermal” refers to heated fluid. Epithermal deposits are
formed in an environment that is shallow in depth and typically hosting deposits of
Au, Ag, and base metals formed at low temperatures (200- 300 C). They are related
to intrusive and eruptive igneous rocks forming veins at shallow depths (maximum
depth of 1 km) that contain open-cavity filling textures and source of “bonanza”
metals/deposits (Berger and Henley, 1989).
Epithermal deposits generally form at the top of magma-related hydrothermal
systems but their development is strongly affected by fluids of external origin
(meteoric water). Presently, it is accepted that the weakly saline (<1 to ~5-15 wt %
NaCl eqv.) fluids at slightly higher temperatures (200-300°C) and at pressures less
than a few hundred bars are predominantly responsible for the formation of
epithermal deposits. Basically, ore bearing fluids forming such systems have a low
temperature range of 50 to 300 C; usually between 160 and 270 C, and low to
moderate pressures < 500 bar or depths equivalent to 1 – 1.5 km (Pirajno, 2009).
Epithermal associated ore minerals are generally native gold, native silver, electrum,
argentite, sulfosalts, tellurides, and selenides, and often the sulfides, namely, pyrite,
sphalerite, galena, and chalcopyrite. Gangue minerals are quartz, amethyst,
chalcedony, pyrite, carbonates (e.g. calcite), barite, rhodochrosite, adularia, and
fluorite.

21
Open space filling textures (typical for the low pressure environments) such as comb
structure, crustification, symmetrical and colloform banding, crystal-lined vugs, and
hydrothermal breccias are common and distinctive features for the epithermal
systems. Hydrothermal alteration is commonly widespread especially in the upper
portions of the epithermal vein systems and alteration products include quartz,
adularia, illite, chlorite, alunite, kaolinite and/or dickite and sericite (Hedenquist et
al., 2000; Deb, 2008).
Based on alteration mineralogy and fluid chemistry, epithermal deposits are
classified genetically into two end-members as low sulfidation (LS) or adularia-
sericite type and high sulfidation (HS) or acid-sulfate type. A transition type,
intermediate sulfidation (IS) systems, is defined as a subtype of the low sulfidation
systems (Hedenquist et al., 2000; Hedenquist and Sillitoe, 2003). The dominant
factor used for the nomenclature of the types differs widely such as fluid chemistry,
oxidation, sulfidation, and alteration mineralogy (Table 3.1).
Table 3.1 Nomenclature used for the two end-member epithermal environments (modified from Hedenquist et al., 2000; Hedenquist and Sillitoe, 2003)
LS HS Reference
Au-Q veins in andesite and rhyolite Ag-Au, Ag, Au-Te, and Au-Se veins.
Base metal veins with Au, Ag, Cinnabar, stibnite veins
Au-Alunite Lindgren,1922,1933
Alkaline Acid Sillitoe,1977 Low Sulfur High Sulfur Bonham,1986,1988
Adularia-Sericite Acid Sulfate Hayba et al., 1985 Heald et al., 1987
Low Sulfidation High Sulfidation Hedenquist,1987 Adularia-Sericite Alunite-Kaolinite Berger and Henley, 1989
Type 1 adularia - sericite
Type 2 adularia – sericite
- Albino and Margolis,1991
High sulfide + base metal, low
sulfidation
Low sulfide + base metal, low sulfidation
High Sulfidation Sillitoe, 1989, 1993
Intermediate Sulfidation
Low Sulfidation High Sulfidation Hedenquist et al., 2000;

22
LS and HS deposits exhibit certain differences summarized as follows: Low
sulfidation type epithermal systems are characterized by: i) the predominance of
reduced S species (HS-, H2S), ii) sericite, intermediate argillic and chloritic alteration
with adularia (K-feldspar), and thus, known to be formed by near-neutral pH, S-poor
(low sulfur) and reduced fluids. High sulfidation type, on the other hand, is
characterized by: 1) the presence of a significant component of oxidized S species
(H2SO4-, SO3-2, SO2(g)), 2) advanced argillic assemblage, dominated by alunite (K-
sulfate) and pyrophyllite at deeper levels, and, therefore, known to be formed by
acidic (low pH), S-rich (high sulfur), oxidized fluids. Intermediate sulfidation type
combines some of the distinct features of both types. It is dominated by sphalerite,
galena, tetrahedrite, tennantite, chalcopyrite, and sericite (other than adularia)
indicating higher temperatures (probably higher formation depths) than low
sulfidation type and generally associated with calc-alkaline andesite-dacite volcanics.
Indeed, low, intermediate, and high sulfidation refer to the oxidation potential and
sulfur fugacity of the fluid that deposited the sulfides; not to the S content of the
sulfides (Einaudi et al., 2003) (Fig. 3.1). Phase diagram of log fS2 versus temperature
yield the zones of certain sulfidation states, from very low and low, through
intermediate, to high and very high, which are reflecting distinct compositional areas
such as arc volcanic rocks, high temperature volcanic fumaroles, magmatic
hydrothermal, and geothermal areas.

23
Figure 3.1 f S2–T phase diagram showing the sulfide minerals in epithermal deposits defining the sulfidation states (Hedenquist and Sillitoe, 2003)
There is no clear relation that typifies the connection between the epithermal deposits
and their sedimentary hosts, but it is universally recognized that such deposits are
generally associated with volcano-plutonic environments either in the form of near
surface veins and stockworks or disseminations. Subaerial volcanism and intrusion of
calc-alkaline magmas that range from basaltic andesite through andesite and dacite to
rhyolite compositions constitute the probable host rocks and related tectonic settings
of epithermal deposits (Fig. 3.2).

24
Figure 3.2 Tectonic settings of gold-rich epigenetic mineral deposits (Groves et al., 1998)
Similar to the porphyry deposits, global distribution of epithermal deposits reflect the
genetic linkage to the magmatic centers, especially along the Circum Pacific Belt
(Fig. 3.3). Best – known examples of epithermal deposits are generally in Cenozoic
age, but there are Paleozoic and Mesozoic examples as well (Simmons et al., 2005).
Cenozoic epithermal deposits located in Italy, Turkey, Spain, and the Carpathians
comprise the examples of epithermal related deposits in the Alpine-Himalayan
orogenic belt. Since the ancient examples of epithermal systems are exposed to
erosion and thus not preserved to recent times, well known epithermal deposits are
all in Cenozoic age.

25
Figure 3.3 Global distribution of epithermal and intrusion related Au deposits (Taylor, 2007)
According to Hayba et al., 1985, the epithermal systems can be differentiated on the
basis of their proximity to a heat source. While high sulfidation systems develop
above or as a lateral offset of a porphyry system at the subvolcanic depths, low
sulfidation systems evolve at a slower rate, relatively away from the heat source. A
diagrammatic view of high and low sulfidation systems are illustrated in the study of
Hedenquist and Lowenstern (1994) (Figure 3.4). This diagram shows the physico-
chemical environments of the geothermal and volcanic hydrothermal systems related
to the epithermal systems. In this illustration, near neutral pH and reduced, relatively
deeper boiling fluids below the geothermal environment, form the low sulfidation
deposit in equilibrium with the wall rocks. In the opposite site, near the volcanic-
hydrothermal centers, highly oxidizing, acidic fluids yield the high sulfidation
deposit which is thought to occur faster than the low sulfidation counterpart.

26
Figure 3.4 Sketch view displaying the formations of two end-member epithermal deposits and their relation with the subvolcanic source (Hedenquist and Lowenstern,
1994; Hedenquist et al., 1996, 2000) Hydrothermal alteration shows both similarities and differences among the low and
high sulfidation types. In the low sulfidation type, due to the neutral and reduced
fluids, wall rocks (hosting mineralization) have alteration mineralogy characteristic
for neutral environment. Following an ore vein towards the wall rocks, argillic
(mostly illite, smectite, kaolin, and adularia), sericitic (sericite, pyrite, quartz), and
propylitic (chlorite, calcite, epidote, and albite) alterations are observed generally.
On the other hand, high sulfidation deposits, being formed by an acidic, oxidizing
fluid, display the advanced argillic, argillic, sericitic, and propylitic alterations from
the margins of the vuggy ore zone towards the wall rocks. Advanced argillic
alteration is mainly composed of alunite, kaolinite, dickite, pyrophyllite, whereas
argillic alteration includes kaolin and smectite group clay minerals. Vuggy ore zone
refers to the early leached zone formed by this acidic, highly oxidizing fluid influx.
Typical hydrothermal minerals that form these alteration assemblages are
summarized in the Figure 3.5 with their pH values and commonly observed
temperatures ranges. Given alteration minerals characterize typical epithermal

27
environment, thus the related epithermal ore deposit, and are examined as alkaline,
neutral, and acidic based on the thermal stabilities.
Figure 3.5 Thermally induced hydrothermal minerals in the epithermal ore zone (White and Hedenquist, 1995; Hedenquist et al., 2000)
3.1.1 Low Sulfidation (LS) type epithermal deposits Low sulfidation type epithermal deposits are generally associated with the volcanic
rocks of andesite-rhyodacite and bimodal rhyolite-basalt. Deposit form might be
veins, stockworks, and/or disseminations. Ore textures can be crustiform banding
(Fig. 3.6), combs, and hydrothermal breccias. Alteration and gangue mineralogy is
summarized commonly with the minerals of sericite, carbonates (e.g. calcite), kaolin,
smectite, illite, pyrite, quartz, chalcedony, and rhodochrosite. When the deposition
occurs at the shallow depths (0-300 m), mostly colloform chalcedonic formations
with abundant calcite, illite, and adularia are observed; when it is developed under
deeper conditions (300-500 m), gangue and alteration mineralogy changes into the
assemblage of quartz, carbonate, rhodochrosite, sericite, adularia ± barite ± anhydrite

28
± hematite ± chlorite. Cinnabar, stibnite, pyrite/marcasite-arsenopyrite, galena,
sphalerite (generally Fe-rich), chalcopyrite, and tetrahedrite minerals are common
sulfides typified with the low sulfidation systems.
Figure 3.6 Crustiform and colloform banding and comb textured ore at the McLaughlin mine, California, USA (Deb, 2008)
As previously stated, the low sulfidation state minerals that formed by reduced,
neutral-pH waters are in equilibrium with the host rock alteration minerals and the
fluid is characterized by low salinity (0-4 wt %), and low temperature (150-300 ºC)
and pressure.
Alteration and mineralization style of LS type is modeled by Hedenquist et al. (2000)
(Fig. 3.7) basically showing that a steam heated chalcedonic blanket covers (i.e.
overlying cover) the low sulfidation ore zone which is composed of disseminated and
vein ores. Mineral based alteration of the host rock diverging from the vein is divided
into three as sericite/illite ± adularia, smectite/mixed layered clay ± chlorite, and
calcite ± epidote.
In LS epithermal deposits, boiling is widely accepted as the critical process to
deposit high concentration of Au from bisulfide complexes due to gas loss (see the
reaction 1 below) (Fig. 3.8)
Au(HS)2
- + H+ + 0.5H2(aq) = Au(s) + 2H2S(g) (rxn.1)

29
Figure 3.7 General model created for the LS alteration style (Hedenquist et al.,
2000) As in the case of the geothermal systems - active counterpart of the low sulfidation
epithermal systems-, the concentration of CO2 and the salinity degree in solution are
the principal controls on pH. Therefore, mechanisms including boiling and loss of
CO2 to the vapor result in an increase in the pH which, in turn, gives rise to the
formation of adularia from illite depending on their stability. Additionally, the
deposition of calcite, mostly developed as a late stage alteration product, occurs due
to the loss of CO2. Boiling is the process that explains the common occurrence of
adularia and bladed calcite seen as gangue minerals in low sulfidation ore veins
(Hedenquist et al., 2000; Cooke and Simmons, 2000). Bladed calcite formations are
often accompanied by the quartz pseudomorphs. Evidences known for the boiling are
hydrothermal breccias, steam-heated blankets, adularia, and bladed calcite, two of
which (first two evidences) can be grouped as indirect; other two (last two evidences)
as direct evidences.

30
Figure 3.8 A sketch displaying the boiling process in the low sulfidation systems (Cooke and Simmons, 2000)
3.1.2 High Sulfidation (HS) type epithermal deposits
High sulfidation type epithermal deposits are related to volcanic rocks of andesite-
rhyodacite, dominated by calc-alkaline magmas. Deposit forms are generally
veinlets, dissemination, and hydrothermal breccia. Vuggy quartz hosts replacements,
late veins, minor stockworks, and hydrothermal breccias comprise the common ore
textures. Alteration styles are dominated by the silicic (vuggy) quartz-alunite (Fig.
3.9), pyrophyllite-dickite-sericite. Enargite-luzonite, covellite, pyrite, chalcopyrite,
bornite, and chalcocite are the common sulfides formed in such epithermal systems.
Figure 3.9 The silicic vuggy host in Summitville HS deposit, Colorado, USA (Deb,
2008)
(0. 01 g / t)

31
Alteration and mineralization style of HS type is modeled and displayed in Figure
3.10. This model is based on a hypogene acidic fluid derived from the volcanic-
hydrothermal environment, leaching the rock, creating a core of residual, commonly
vuggy silica (crystallizes to quartz). These silicic zones comprise the core of an
advanced argillic alteration and represent an aquifer channel for a subsequent ore
(e.g. Au and Ag) bearing fluid.
In detail, the fluids ascending through a discontinuity (mostly a fault) interact with
groundwater to form highly acidic solutions. These solutions decompose and
dissolve the surrounding rock leaving only silica behind, often in a sponge-like
texture known as vuggy silica. Gold and sometimes copper rich brines that also
ascend from the magma then precipitate their metals within these vuggy silica
formations. If the acidic fluids encountered a broad permeable body of rock unit,
vuggy silica zone can even be larger enough to host large bulk-tonnage
mineralization with lower grades. After forming the core of the alteration zone, the
acidic fluids are progressively neutralized by the wall rock the further they move
away from the fault. The rocks in turn are altered by the fluids into progressively
more neutral-stable minerals from the assemblages of advanced argillic through
argillic to propylitic alterations (Fig. 3.10) (Hedenquist et al., 1994; Hedenquist et
al., 2000; Cooke and Simmons, 2000).
Figure 3.10 Diagrammatic alteration model created for HS epithermal deposits (Hedenquist et al., 1994; Hedenquist et al., 2000)

32
For the HS epithermal deposits, mixing is thought to be the most accepted
mechanism for the ore deposition as proved by many isotopic evidences (Cooke and
Simmons, 2000). Precipitation of the metals (e.g. Au) derived from the magma and
transported by the acidic fluids is believed to occur while the fluids mix with the
groundwater which in turn causes the decrease in the solubility of Au (or any other
precious and base metals related with such physicochemical environments) (see the
example reaction 2 below).
AuHS(aq) + 4H2O(l) = Au(s) + SO4
-2(aq) + 2H+ + 3.5H2(aq) (rxn.2)
A two stage genetic model (Fig. 3.11) is proposed for the evolution of the HS
deposits (White, 1991; Rye, 1993; Hedenquist et al., 1994a; Arribas, 1995) in which
stage A considers the alteration, whereas stage B involves the two ore deposition
hypothesis. As shown in the Figure 3.11, high temperature magmatic volatiles
(including the vapors of SO2, HCl, and H2S etc.) derived from a shallow intrusion
encounter with the ascending heated ground water to generate acid sulfate high
sulfidation fluids (with the temperatures of 200-350 ºC, pH values of 0-2, and
salinities of 2-5 wt % NaCl eqv.) which causes the strong leaching of the wall rocks
and, in turn, causes porous residual silica (vuggy quartz) and advanced argillic
alteration (e.g. alunite, pyrophyllite). In the main ore-deposition stage, i) absorption
of high pressured vapor at depth or ii) mixing with the shallow cooler meteoric water
of the ore bearing hypersaline liquid come into consideration. Both hypotheses of ore
deposition stage explain the low salinity and magmatic – meteoric characteristics of
the high sulfidation ore fluids.

33
Figure 3.11 HS alteration and ore deposition model based on the previous model of White, 1991 (Arribas, 1995; Cooke and Simmons, 2000)
3.2 Epithermal Deposits in Turkey
Regarding the tectonic setting of Turkey, Turkish epithermal systems tend to occur in
two regions: northeastern and western Turkey (Yiğit, 2009) (Fig. 3.12). While Late
Cretaceous to Eocene submarine and subaerial volcanic rocks are hosting the
epithermal mineralization in NE Turkey, Neogene subaerial rock associations
(generally volcanic rocks) comprise the host rocks for the western epithermal
mineralization. Main base and precious metals associated with Turkish epithermal
deposits are Au, Ag, Hg, Pb, Zn, and Sb.
In western Turkey, especially the N-S trending extension related magmatism, though
its genesis is still under debate, is thought to control the structural setting that enables
the emplacements of the volcanic and plutonic rocks (Fytikas et al., 1984; Güleç,
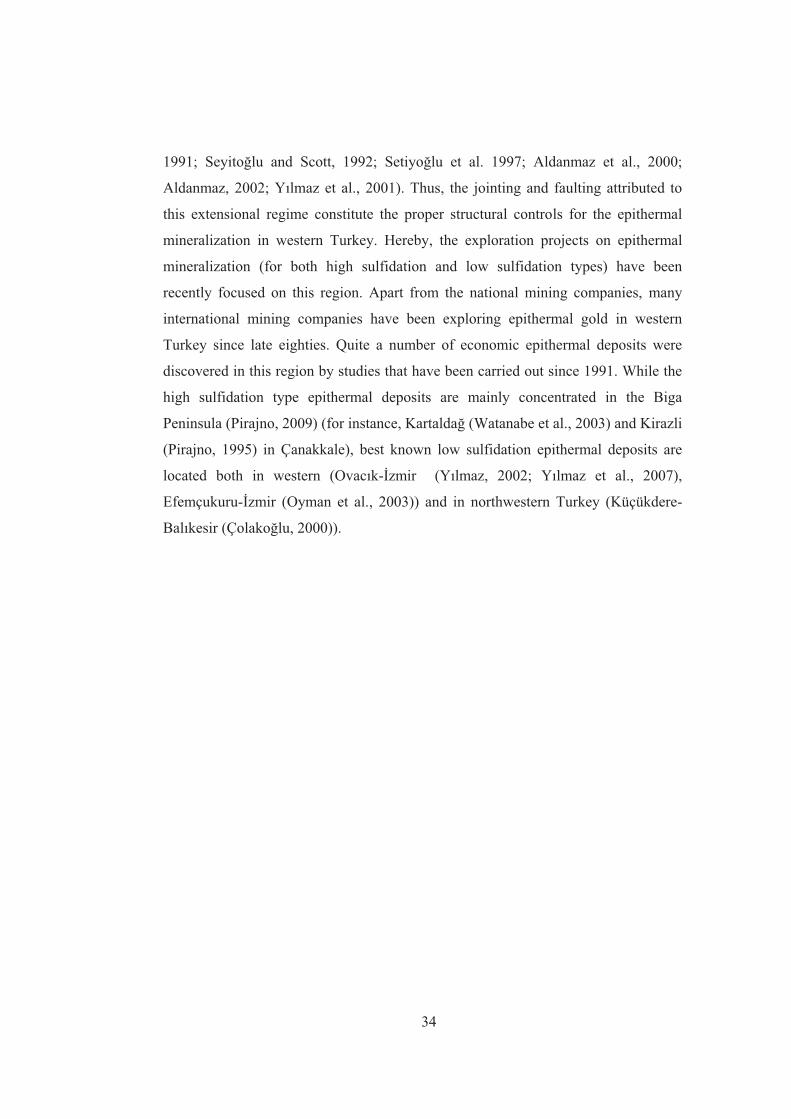
34
1991; Seyitoğlu and Scott, 1992; Setiyoğlu et al. 1997; Aldanmaz et al., 2000;
Aldanmaz, 2002; Yılmaz et al., 2001). Thus, the jointing and faulting attributed to
this extensional regime constitute the proper structural controls for the epithermal
mineralization in western Turkey. Hereby, the exploration projects on epithermal
mineralization (for both high sulfidation and low sulfidation types) have been
recently focused on this region. Apart from the national mining companies, many
international mining companies have been exploring epithermal gold in western
Turkey since late eighties. Quite a number of economic epithermal deposits were
discovered in this region by studies that have been carried out since 1991. While the
high sulfidation type epithermal deposits are mainly concentrated in the Biga
Peninsula (Pirajno, 2009) (for instance, Kartaldağ (Watanabe et al., 2003) and Kirazli
(Pirajno, 1995) in Çanakkale), best known low sulfidation epithermal deposits are
located both in western (Ovacık-İzmir (Yılmaz, 2002; Yılmaz et al., 2007),
Efemçukuru-İzmir (Oyman et al., 2003)) and in northwestern Turkey (Küçükdere-
Balıkesir (Çolakoğlu, 2000)).

Figu
re 3
.12
Dis
tribu
tion
of th
e ep
ither
mal
dep
osits
and
pro
spec
ts o
f Tur
key
show
ing
Mad
enda
ğ an
d K
arta
ldağ
dep
osits
(fro
m Y
iğit,
200
9)
35

36
3.3 Biga Peninsula: Previous Studies
The distribution of the epithermal systems in Biga Peninsula is associated with
Eocene to Pliocene volcanic and plutonic rocks overlying the Paleozoic (mostly)
metamorphic basement (see Chapter 2). Concerning the tectonic and magmatic
history of the Biga Peninsula, the nature (calc-alkaline/alkaline) of the host rocks
seems to control the type of the deposits in terms of alteration styles and capability of
metal transport. Since the ancient times (e.g. ancient Troy), dating back to nearly
3200 BC with the archeological evidences, many of the epithermal deposits in
Çanakkale and the surroundings were exploited and the present study presents two
examples of those ancient abandoned mines.
Previous studies regarding the epithermal deposits in the Biga Peninsula are
summarized under the headings of high (HS) and low (LS) sulfidation types in
Tables 3.2 and 3.3, respectively.

Tab
le 3
.2 K
now
n H
S ty
pe e
pith
erm
al d
epos
its w
ith th
eir p
rinci
pal f
eatu
res i
n B
iga
Peni
nsul
a (s
uper
scrip
t num
bers
refe
r to
the
refe
renc
es)
Dep
osit
Nam
e Pr
ovin
ce
Prec
ious
/ B
ase
Met
al
Hos
t roc
k A
ge o
f the
hos
t ro
ck
Ore
text
ure
Min
eral
res
erve
and
/or
reso
urce
with
ave
rage
gr
ades
R
efer
ence
Kar
tald
ağ
(Ser
çele
r)
Çan
akka
le
Au,
Ag
Dac
ite
porp
hyry
Eoce
ne (p
rese
nt
stud
y), M
ioce
ne
(1)
Vei
ns, b
recc
ias
50 0
00 t
with
1.3
8 g/
t Au
and
29.5
g/t
Ag
Wat
anab
e et
al.,
20
03 (1
) , JIC
A,
1989
Kira
zlı
Çan
akka
le
Au,
Cu,
A
g A
ndes
ite,
Dac
ite
Olig
o-M
ioce
ne
Stoc
kwor
ks,
brec
cias
, di
ssem
inat
ion,
re
plac
emen
ts
10 9
00 t,
20
g/t A
u in
the
high
gr
ade
oxid
e zo
ne(2
) , 31
6 00
0 oz
Au(3
) , 5,2
95,0
00 o
z A
g (3
)
Yiğ
it, 2
006
(2) ,
2009
; Pira
jno,
19
95; 2
009,
A
lam
os G
old
Inc.
, w
eb R
elea
se, 2
009
(3)
Hal
ilağa
Ç
anak
kale
A
u, C
u A
ndes
ite
Olig
ocen
e?
Stoc
kwor
ks,
vein
s 0.
50 g
/t A
u an
d 0.
53 %
Cu
in th
e po
rphy
ry z
one
Yiğ
it, 2
009
Ağı
dağ
ı (D
eli a
nd
Bab
a de
posi
ts)
Çan
akka
le
Au,
Ag,
V
olca
nic
rock
O
ligoc
ene
Dis
sem
inat
ions
an
d br
ecci
as
1.8
Moz
Au
(4) a
nd 1
2.3
Moz
Ag
(4) , 9
91 0
00 o
z A
u (in
dica
ted)
(3)
and
5,37
1,00
0 oz
Ag
(indi
cate
d)
(3)
Yiğ
it, 2
006
(4) ,
2009
, Ala
mos
Gol
d In
c., 2
009
(3)
Ked
itaşı
Ç
anak
kale
A
u A
ndes
ite
Mio
cene
V
uggy
silic
a zo
ne, v
eins
14
g/t
Au
(wes
t) an
d <1
g/t
Au
(eas
t) (5
) , 1 M
oz A
u re
sour
ce (6
)
Elda
rado
Gol
d C
o.
2005
(5) , Y
iğit,
20
09 (6
)
Pire
ntep
e Ç
anak
kale
A
u A
ndes
ite,
Dac
ite?
Olig
o-M
ioce
ne?
Vei
ns
1.79
g/t
Au
in o
ne d
rill h
ole
(6)
Yiğ
it, 2
009
(6)
Kuş
çayı
r Ç
anak
kale
A
u, C
u,
Mo
Gra
nodi
orite
po
rphy
ry a
nd
ande
site
vo
lcan
ics
Eoce
ne
Stoc
kwor
ks,
repl
acem
ents
, an
d br
ecci
a zo
nes
Ave
rage
0.4
g/t
Au(7
) Y
ılmaz
, 200
3(7) ;
Wat
anab
e et
al.,
20
03
Doğ
ancı
lar
Çan
akka
le
Au,
Cu
And
esite
O
ligo-
Mio
cene
St
ockw
orks
, br
ecci
atio
n 10
g/t
Au
and
2.8
% C
u in
B
akırl
ık v
ein
Pira
jno,
200
9
37

Tab
le 3
.3 K
now
n LS
type
epi
ther
mal
dep
osits
with
thei
r prin
cipa
l fea
ture
s in
Big
a Pe
nins
ula
Dep
osit
Nam
e Pr
ovin
ce
Prec
ious
/ B
ase
Met
al
Hos
t roc
k A
ge o
f the
hos
t ro
ck
Ore
text
ures
M
iner
al r
eser
ve
and/
or r
esou
rce
with
gr
ade
Ref
eren
ce
Mad
enda
ğ (A
kbab
a)
Çan
akka
le
Au
Mic
asch
ist
Pale
ozoi
c B
recc
ia z
ones
, st
ockw
orks
, vei
ns
15 0
00 t
poss
ible
rese
rve
at 5
.8 g
/t A
u
MTA
199
3; Y
iğit,
20
06; W
atan
abe
et
al.,
2003
Şahi
nli
(Lap
seki
) Ç
anak
kale
A
u, A
g V
olca
nics
and
sc
hist
Pale
ozoi
c an
d Pa
leoc
ene-
Eoce
ne
Vei
ns
7.5
Mt a
t 8.5
g/t
Au
Yıld
ırım
and
C
engi
z, 2
004
Küç
ükde
re
(Hav
ran)
B
alık
esir
Au
And
esite
po
rphy
ry
Mio
cene
V
eins
, bre
ccia
15
00 M
t. of
ore
with
5.0
g/
t Au
and
11.8
g/t
Ag
Çol
akoğ
lu, 2
000;
W
atan
abe
et a
l.,
2003
Kıs
acık
(A
yvac
ık)
Çan
akka
le
Au
Dac
ite,
rhyo
daci
te,
ande
site
M
ioce
ne
Bre
ccia
, sto
ckw
orks
, an
d al
tera
tion
zone
s 56
537
Mt a
t 0,5
5 g/
t Au
Yiğ
it, 2
009
İvrin
di
(Kın
ık)
Bal
ıkes
ir A
u A
ndes
ite
Mio
cene
D
isse
min
atio
ns,
brec
cia
Und
er p
roje
ct
Wat
anab
e et
al.,
20
03
Küç
ükku
yu
(Avc
ılar)
Ç
anak
kale
A
u A
ndes
itic
tuff
M
ioce
ne
Vei
ns, b
recc
ia z
ones
-
-
38

39
CHAPTER 4
4. LOCAL GEOLOGY
4.1 Rock Units
The rock units exposed within the study area by which two ore deposits are hosted,
are integral parts of the regional metamorphic and ophiolitic rocks, collectively
termed as the Pre-Tertiary rocks (see Chapter 2), and overlying Tertiary volcanic,
plutonic and volcanoclastic rocks. The pre-Tertiary units are also termed as the
basement rocks in this study. These include Paleozoic metamorphic rocks and
overlying ophiolitic rocks of Late Cretaceous age. Tertiary rocks include middle
Eocene granodiorite, middle Eocene dacite, Eocene-Oligocene tuff, Oligocene-
Miocene andesite, Miocene siliciclastic sedimentary rocks, and Quaternary alluvium
(Fig. 4.1; Fig. 4.2).
4.1.1 Pre-Tertiary Rocks
The basement in the study area is represented by micaschists widely exposed as the
most common rock type defined within the Çamlıca metamorphics (Okay et al.,
1991) elsewhere (Fig. 4.1 and Fig. 2.4). An occasional ophiolitic sliver is also
exposed in the Madendağ mine area.
A great majority of the Çamlıca metamorphics (over 80 %) consist mainly of quartz-
micaschists that are grey, brownish yellow, greenish brown, partly oxidized, and well
foliated (Fig. 4.3). Similar to the definitions by Okay and Satır (2000), and
observations based on petrographical analyses, the micaschists, particularly those
exposed in the northern part of study area, are grouped into two types; as quartz-
micaschist (Fig. 4.4) and calc-micaschist (Fig. 4.5). Quartz-micaschist is composed
dominantly of metamorphic quartz (equigranular and medium grained), muscovite

40
and minor amounts of chlorite, sericite, and opaque minerals, whereas calc-
micaschist is composed of metamorphic quartz, muscovite, sericite, and calcite.
Unlike those in the quartz-micaschist, muscovite and metamorphic quartz in calc-
schist, are subhedral to euhedral and perfectly crystallized along the foliation planes
(Fig. 4.5).
Calcite in calc-micaschist is coarse grained (Fig. 4.5) and generally displays gliding
and deformation twinning.
Apart from the yellowish calc-micaschists and the quartz-micaschists observed in the
study area, the presence of one to ten meters thick bodies of black and yellow
marble, white meta-quartzite, and albite-chlorite schist units are reported by Okay et
al. (1991).
The quartz-micaschist in the study area is tectonically overlain by two serpentinite
bodies; green, brownish green in color (Fig. 4.6). The serpentinites are said to be
associated with the Denizgören ophiolite (Şengün and Çalık, 2007).

41
Fi
gure
4.1
Geo
logi
cal m
ap o
f the
are
a co
verin
g M
aden
dağ
and
Kar
tald
ağ a
ncie
nt m
ines
(Mod
ified
from
Dön
mez
et a
l, 20
08)

42
Figure 4.2 Tectonostratigraphic section of the study area (Not to scale)
Figure 4.3 Field photo showing grey to greenish grey, slightly oxidized quartz-micaschist (Çamlıca metamorphics)
Late
Late
Early
Early
Late
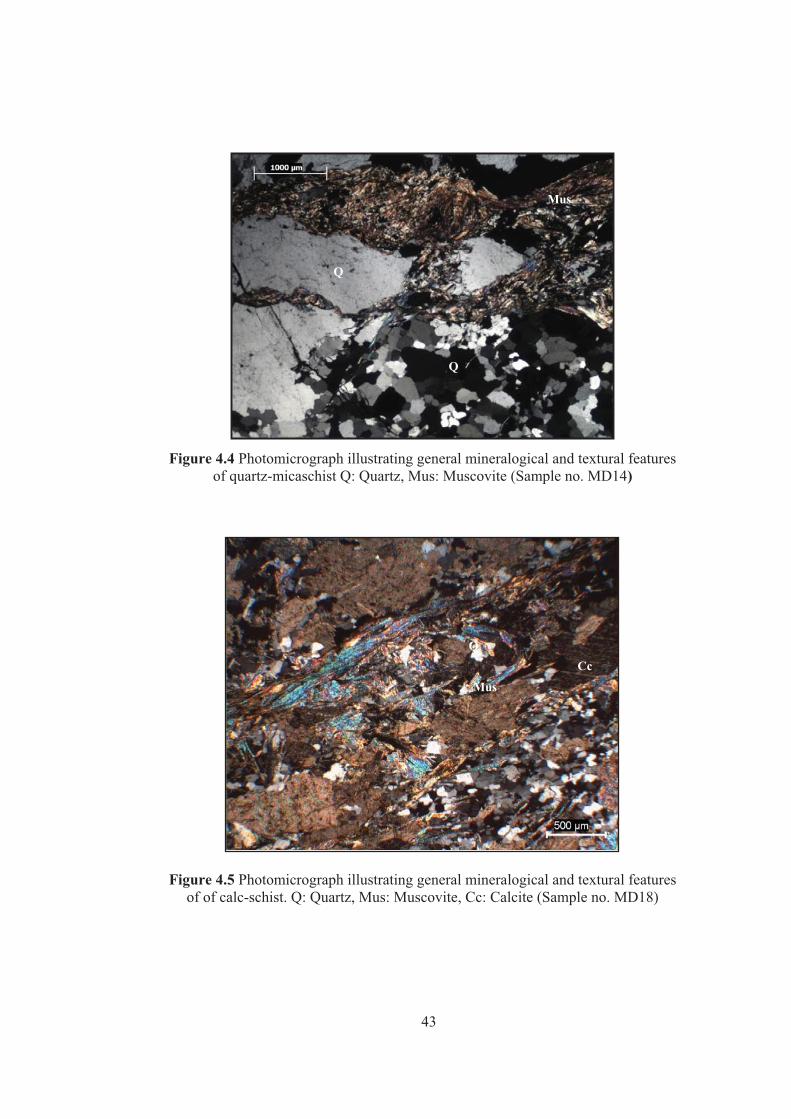
43
Figure 4.4 Photomicrograph illustrating general mineralogical and textural features
of quartz-micaschist Q: Quartz, Mus: Muscovite (Sample no. MD14)
Figure 4.5 Photomicrograph illustrating general mineralogical and textural features of of calc-schist. Q: Quartz, Mus: Muscovite, Cc: Calcite (Sample no. MD18)
Met. Q.
Musc. Cc.
Q
Mus
Cc
Q
Mus
Q

44
Figure 4.6 Serpentinized ultramafic rock (mostly harzburgite) outcropping in the vicinity of Çiftlikdere village
An initial eclogite-facies metamorphism with a peak metamorphism temperature of
~510 oC and an intensively overprinting greenschist-facies metamorphism have been
reported by Okay and Satır (2000) for the Çamlıca metamorphics which is assumed
to be a clue that these units are belonging to the Rhodope metamorphic complex
(Beccelatto, 2003).
In the present study, Ar-Ar dating is carried out on a sericite separate taken from
micaschist and yielded an age of 55 Ma (Kuşcu, 2008; unpublished data; Table 4.1)
probable clue for resetting by regional Eocene magmatic heating.
4.1.2 Tertiary rocks
The cover rocks include Middle Eocene granodiorite and dacitic rocks at the bottom
followed by tuffaceous rocks (ignimbrite, acidic lavas and block ash flows), and
followed by volcanic and volcanoclastic and pyroclastic rocks, and overlying
sedimentary rocks. According to a recent work by Dönmez et al. (2008), the rock
units in the study area and surroundings are named as Yeniköy Volcanics (dacite),
Şahinli Formation (genereally Eocene basaltic volcanoclastics), Hallaçlar Volcanics

45
(Upper Oligocene-Lower Miocene occasionally altered andesitic rocks), and
Gazhanedere Formation (Middle Miocene sandstone, mudstone, pebblestone).
The dacitic rocks, the next unit in the sequence, are generally crop out at the eastern
parts of the mapped area (Fig. 4.1), and occur as NNW trending outcrop. The dacitic
rocks in the field occur as intensely altered rocks with light grey to green in color,
and show generally holocrystalline porphyritic texture (Fig. 4.7). Therefore, these
rocks were termed as dacite porphyry. The petrographical analyses showed that they
consist of mineral assemblage including hornblende (euhedral-subhedral and coarse
to medium grained), chlorite, biotite (fine grained), quartz, plagioclase (generally
argillized, coarse, and twinned albite minerals), opaque minerals ± epidote. The
dacitic rocks are important in that they act as one of the host rocks of mineralization
in the study area, and its detailed alteration mineralogy is given in Chapter 5 (Ore
Deposit Geology). The field macroscopic features and textural, mineralogical and
compositional characteristics suggest that they have close resemblance to the
Yeniköy volcanics defined by Dönmez et al. (2008). The Yeniköy volcanics of
Oligocene age are described as porphyritic andesite lavas and pyroclastic rocks
including greenish grey, coarse grained amphibole and pyroxene, and are moderately
chloritized and argillized. Yeniköy volcanics are covered by the “Stage 2-Oligocene
volcanics” of Altunkaynak and Genç (2008), which are also correlated with the
Oligocene volcanics of Ercan et al. (1995).
The Ar-Ar geochronology performed on the biotite separates from dacite unit in this
study yielded 42.19 ± 0.45 Ma (performed on fresh dacite porphyry) and 42.27 ±
0.96 Ma (performed on a weakly altered dacite sample) (Table 4.1). These ages
suggest a possible temporal and genetic (?) link between the Eocene granitoid
intrusions within the Biga Peninsula (Delaloye and Bingöl, 2000; Altunkaynak,
2007; Altunkaynak and Genç, 2008) and felsic to basic volcanism in the area.
In addition to the dacite porphyry, a small granitoid body is exposed to the eastern
part of the study area (Fig. 4.1). It is usually exposed within the low-lying areas
along the course of the main streams, and hard to recognize elsewhere (Fig. 4.1).

46
The contacts with the metamorphic rocks are characterized by pervasive
silicification accompanied by hydrothermal biotite-quartz and K-feldspar veinlets.
The granitoid consists dominantly of euhedral, coarse grained, and weakly altered
(chlorite and epidote) hornblende (up to 2 cm in dimension) (Fig. 4.8), coarse to
medium grained, twinned and zoned plagioclase, generally medium grained quartz,
euhedral to subhedral, brownish titanite, generally euhedral apatite and zircon,
tourmaline, and opaque minerals (Fig. 4.9). Based on these petrographical
characteristics, it is defined as granodiorite.
Figure 4. 7 Dacite porphyry outcrop and hand specimen photo (host rock of
Kartaldağ gold mine)
Ar-Ar geochronology of the biotite separates from the granodiorite yielded an age of
40.8 ± 0.36 Ma (Table 4.1). In addition to this data, a weakly altered (sericitized)
sample from the same granitoid yielded a sericite Ar/Ar age of 39.57 ± 0.47 Ma
(Table 4.1). These ages coincide with the dacite porphyry volcanism in the area.
Therefore, it is highly likely that dacite porphyry and granodiorite should be formed
during the same magmatic pulse that took place during Middle to Late Eocene in the
region.

47
Table 4.1 Results of the geochronologic analyses for the rock units in this study
Figure 4.8 Photograph showing granodiorite handspecimen. Hbl: Hornblende, Pl: Plagioclase (Sample no. KD-25)
Sample No. Rock Type Analytical Method Mineral Age (Ma)
MD-1a Micaschist 40Ar/39Ar Sericite 55 Ma
KD-18 Dacite porphyry 40Ar/39Ar Biotite 42.19 ± 0.45
KD-1a Weakly altered dacite porphyry
40Ar/39Ar Biotite 42.27 ± 0.96
KD-25 Granodiorite 40Ar/39Ar Hornblende 40.8 ± 0.45
KD-26 Weakly altered granodiorite
40Ar/39Ar Sericite 39.57 ± 0.47
Hbl
Pl
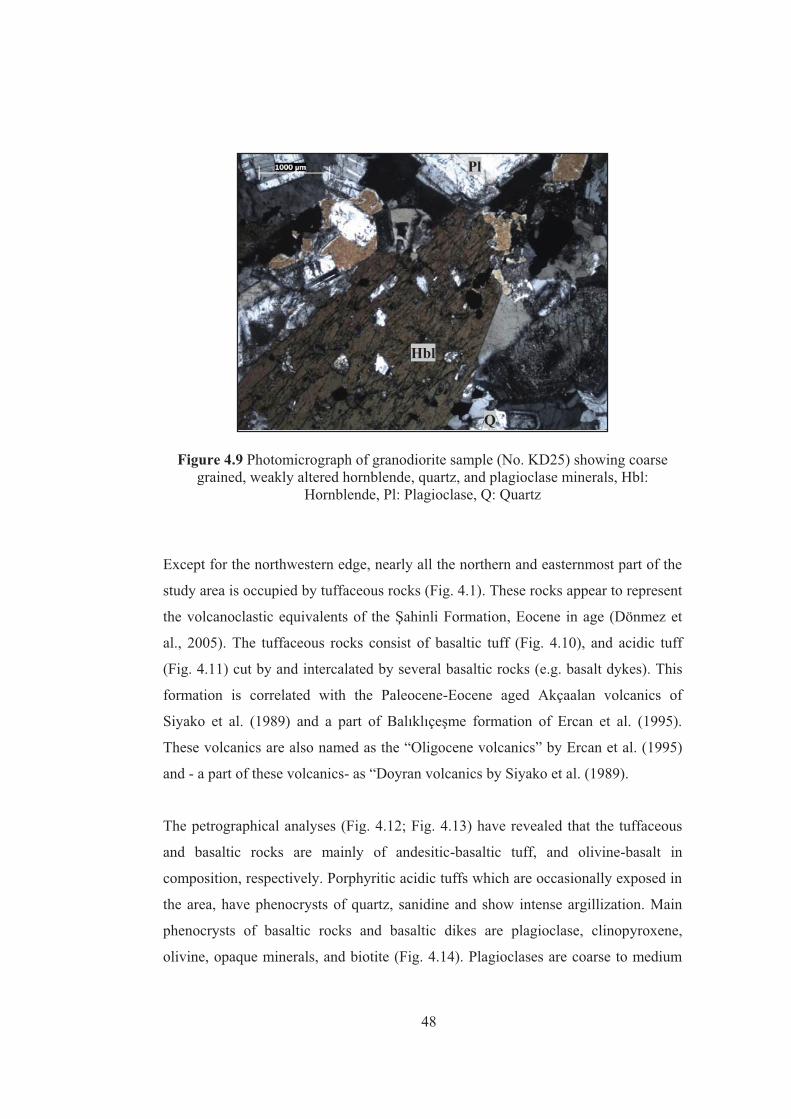
48
Figure 4.9 Photomicrograph of granodiorite sample (No. KD25) showing coarse grained, weakly altered hornblende, quartz, and plagioclase minerals, Hbl:
Hornblende, Pl: Plagioclase, Q: Quartz
Except for the northwestern edge, nearly all the northern and easternmost part of the
study area is occupied by tuffaceous rocks (Fig. 4.1). These rocks appear to represent
the volcanoclastic equivalents of the Şahinli Formation, Eocene in age (Dönmez et
al., 2005). The tuffaceous rocks consist of basaltic tuff (Fig. 4.10), and acidic tuff
(Fig. 4.11) cut by and intercalated by several basaltic rocks (e.g. basalt dykes). This
formation is correlated with the Paleocene-Eocene aged Akçaalan volcanics of
Siyako et al. (1989) and a part of Balıklıçeşme formation of Ercan et al. (1995).
These volcanics are also named as the “Oligocene volcanics” by Ercan et al. (1995)
and - a part of these volcanics- as “Doyran volcanics by Siyako et al. (1989).
The petrographical analyses (Fig. 4.12; Fig. 4.13) have revealed that the tuffaceous
and basaltic rocks are mainly of andesitic-basaltic tuff, and olivine-basalt in
composition, respectively. Porphyritic acidic tuffs which are occasionally exposed in
the area, have phenocrysts of quartz, sanidine and show intense argillization. Main
phenocrysts of basaltic rocks and basaltic dikes are plagioclase, clinopyroxene,
olivine, opaque minerals, and biotite (Fig. 4.14). Plagioclases are coarse to medium
Hbl
Pl
Q

49
grained, zoned, and generally euhedral. Calcite, chlorite and clay minerals are
observed as secondary (alteration) minerals.
Figure 4.10 Basaltic tuff (Şahinli Formation) exposed in the north of the study area
Figure 4.11 Photograph showing acidic tuff (oxidized) outcrop within the study area

50
Figure 4.12 Photomicrograph of andesitic-basaltic tuff unit. Ti: Titanite, Pl: Plagioclase
Figure 4.13 Photomicrograph of olivine basalt. Ol: Olivine, Pl: Plagioclase (Sample
no. MD2)
The andesitic and basaltic lavas and pyroclastics exposed mostly to the NE and SE of
the study area (Fig. 4.1) occur as overlying the older units. These are affected by
surface oxidation and weathering giving rise to white, yellow, brown, and reddish
Ti
Pl
Ol
Pl

51
brown exposures. The stratigraphic position, lithological characteristics of the
andesitic and basaltic lavas and pyroclastic rocks show some resemblance to
Hallaçlar volcanics (Krushensky, 1976) which is also correlated to the Nil and
Kirazlı volcanics of Ercan et al. (1995). The unit seems to be intensely altered in the
study area with brownish to reddish colored and/or stained fractures. The mineral
assemblage consists of coarse-medium grained, euhedral plagioclase, biotite,
pyroxene, K-feldspar, apatite, and opaque minerals in devitrified volcanic glass and
mineral microlites. Alteration and supergene assemblage is composed of calcite,
chlorite, hematite and goethite. In the north of Madendağ mine district, intensely
oxidized and altered outcrops are thought to belong to this volcanic group. Hand
specimen and thin section views of a sample (with brecciated texture) collected from
this area is shown in Fig. 4.14.
Figure 4.14 Handspecimen photo and photomicrograph of dacitic volcanic breccia. Quartz, Arg.: Argillic matrix, Lm: Limonite, Pl: Plagioclase (Sample no. MD-15)
The sedimentary rocks including siltstone, sandstone, mudstone, and pebblestone
which are partly preserved as local exposures to the NW and W of the study area are
collectively displayed as the siliciclastic sedimentary rocks in the local geology map
(Fig. 4.1). These Middle Miocene aged sedimentary rocks are known as the
Gazhanedere Formation (Dönmez et al., 2008) and can be correlated with the Sarıyar
member of Çanakkale Formation defined by Şentürk and Karaköse (1987).
Arg. Lm
Q

52
CHAPTER 5
5. ORE DEPOSITS: GEOLOGY AND ALTERATION PETROGRAPHY
5.1 Kartaldağ Gold Mine
The Kartaldağ gold mine is an ancient gold mine once mined by Trojans (Ancient
Troy). Information concerning the possible mining operations of Troy before 1914 is
not available. It was, then, operated by a British company called Astyra Gold
Mining, during 1914-1918 (Molly, 1961; Higgs, 1962a). Based on the exploration
studies, mainly drilling (K1B, K2B, K3B, K4B, and K7) and trenching, carried out
by the General Directorate of Mineral Research and Exploration (MTA) between the
years 1960-1962, a possible reserve of 50 000 ton (with an average grade of 1.38 g/t
Au) was assigned to the deposit (Higgs, 1962a; MTA, 1993; Watanabe et al., 2003).
The mineralized zone is developed along E-W, NE-SW trending faults with about
200 m vertical depth and reserve was estimated according to two-meter thick gold-
bearing zone. Gold grade can reach up to 5.5g/t Au and average grade of silver was
assigned to be 29.5 g/t Ag (Higgs, 1962a). Lens-shaped ore body is determined
within the E-W trending fault with N20º-30º strike and dips NW70º (JICA-Japan
International Cooperation Agency-, 1989). Presently, the license of the area called
“Serçeler” region is held by Çanakkale Mining Co. since 1987 (JICA, 1989). Some
of the old adits were re-opened by Çanakkale Mining Co., and a detailed exploration
survey was performed including geological mapping, alteration zonation, and
geochemical analysis.
5.1.1 Field Aspects
During the field studies carried out in the September 2008 and October 2009, a total
of 40 samples were collected from Kartaldağ gold mine. In order to identify the rock

53
units and the quartz veins outcropping in the area, 10 samples were collected from
the neighborhood of the main gallery (which now appears as a NW-trending
depression formed by the collapse of the ancient underground mining, Fig. 5.1.),
whereas 30 samples were systematically collected to represent the mineralogical
assemblage and textural variations across the alteration/mineralization zones (Table
5.1). The sampling was done along; i) a ~200 m long NE-SW- trending traverse
(named as traverse line #1, Fig. 5.2) towards the main gallery, ii) a ~125 m long
NNE-SSW- trending traverse (named as traverse line #2) crossing the main gallery,
and finally iii) a ~500 m traverse within the altered volcanic-plutonic rocks at the
southern part of the study area (Fig.5.2).
Figure 5.1 The main inclined gallery driven through the main quartz vein by the
Astyra Mining Co.
Samples were taken at almost 1 m intervals for the traverse line #1 (sample no.
KD1to KD4, Table 5.1); after the sample “KD2”, sampling interval was increased to
25 m on average (from 10 m to 33 m) (Fig.5.3) depending on the field observations.
≈ 4 m

54
Figure 5.2 Alteration map of Kartaldağ mine district
Serçiler
++

55
Figure 5.3 Cross sections showing the traverse lines # 1, 2, and 3

56
Traverse # 2 consist of two types of sampling campaigns as; sampling from the
tailings of the galleries opened by Çanakkale Mining Co. (sample no. KD5, KD6,
KD8, KD9, KD10, KD11; Table 5.1; Fig.5.3-a; Fig.5.4) and from NNE-SSW
trending line (sample no. KD7, KD12 to KD15, Table 5.1; Fig. 5.4) performed to see
the changes across the main gallery (Fig.5.3; Fig.5.4-b).
Traverse #3, (sample no. KD16 to KD19, Table 5.1) is drawn to show the transition
from almost fresh granodiorite (intrusive counterpart of the dacite porphyry) to clay-
altered dacite porphyry which is host rock for mineralization; samples were collected
randomly along this traverse to find out the possible mineralogical and alteration
systematics between the extrusive and intrusive rocks around the Kartaldağ deposit
(Fig. 5.3)
Along the traverse #1 (Fig. 5.3) a total of 13 samples were collected (Table 5.1);
from SW to NE direction, a color transition was observed from white spotted pale
green dacite porphyry (propylitized dacite) to strongly oxidized reddish altered
volcanic rock (pervasively argillized dacite).
Along traverse # 2, a total of 17 samples were collected from silicified (white to pale
yellow) and clay-altered (argillized) (red to yellow) volcanic rocks, i) along
approximately 15 m long segment transversing the main gallery (Fig. 5.3.), and ii)
from tailings of galleries (located southwest and northeast of the main gallery).
Samples from the tailings include altered, as well as mineralized samples. The
samples taken along the traverse, which transverses the main gallery, display textural
and mineralogical changes reflecting argillic and silicic alterations.
From the samples KD16 to KD19 along the traverse #3 (Fig. 5.3), a gradual change
is observed from (reddish) argillized dacite porphyry, through (greenish) propylitized
dacite porphyry, to slightly altered (most probably argillized) granodiorite.
Apart from the traverses, the alteration zones and rock units were also sampled
randomly where the alteration and/or textural characteristics are intriguing. Likewise,
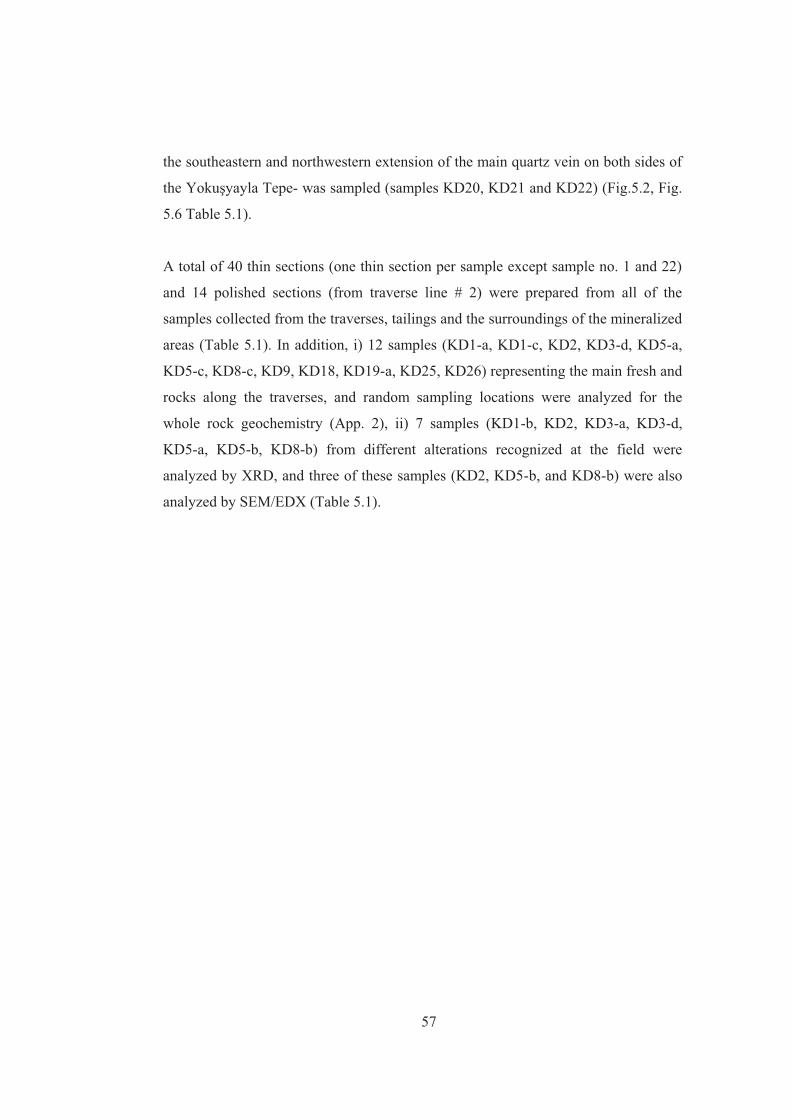
57
the southeastern and northwestern extension of the main quartz vein on both sides of
the Yokuşyayla Tepe- was sampled (samples KD20, KD21 and KD22) (Fig.5.2, Fig.
5.6 Table 5.1).
A total of 40 thin sections (one thin section per sample except sample no. 1 and 22)
and 14 polished sections (from traverse line # 2) were prepared from all of the
samples collected from the traverses, tailings and the surroundings of the mineralized
areas (Table 5.1). In addition, i) 12 samples (KD1-a, KD1-c, KD2, KD3-d, KD5-a,
KD5-c, KD8-c, KD9, KD18, KD19-a, KD25, KD26) representing the main fresh and
rocks along the traverses, and random sampling locations were analyzed for the
whole rock geochemistry (App. 2), ii) 7 samples (KD1-b, KD2, KD3-a, KD3-d,
KD5-a, KD5-b, KD8-b) from different alterations recognized at the field were
analyzed by XRD, and three of these samples (KD2, KD5-b, and KD8-b) were also
analyzed by SEM/EDX (Table 5.1).
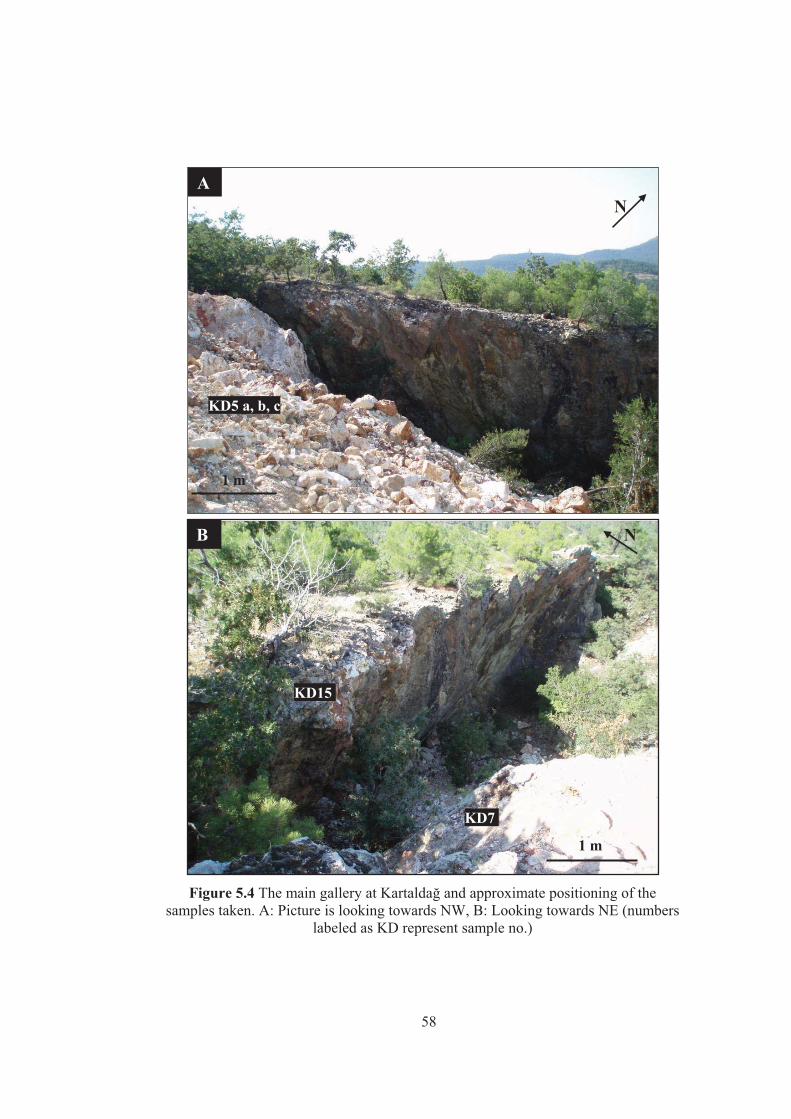
58
Figure 5.4 The main gallery at Kartaldağ and approximate positioning of the
samples taken. A: Picture is looking towards NW, B: Looking towards NE (numbers labeled as KD represent sample no.)
KD7
KD15
B N
1 m
1 m
KD5 a, b, c
N A

59
Figure 5.5 Recent extension of the main gallery by Çanakkale Mining Co.
(Northeast of the main gallery) (KD8a, b, c representing samples taken)
Figure 5.6 Quartz veins towards summit of Kartaldağ silicified vein
West
KD-22
Kartaldağ
KD8 a, b, c

Tab
le 5
.1 S
ampl
es c
olle
cted
in th
e K
arta
ldağ
min
e di
stric
t
Sam
ples
(ID
) Sa
mpl
ing
Loc
atio
n C
oord
inat
es
Ori
gina
l Roc
k T
ype
Fiel
d D
escr
iptio
n A
naly
tic M
etho
d M
ain
ID
Sub
ID
Nor
thin
g E
astin
g
KD
-1
KD
-1a
Trav
erse
#1
4428
345
4649
32
Dac
ite p
orph
yry
Gre
en to
whi
te c
olor
ed, d
acite
por
phyr
y Th
in se
ctio
n, w
hole
rock
ge
oche
mis
try, g
eoch
rono
logy
K
D-1
b Tr
aver
se #
1 44
2834
5 46
4932
D
acite
por
phyr
y G
reen
to w
hite
col
ored
, dac
ite p
orph
yry
Thin
sect
ion,
XR
D
K
D-1
c Tr
aver
se #
1 44
2834
5 46
4932
D
acite
por
phyr
y G
reen
to w
hite
col
ored
, dac
ite p
orph
yry
Thin
sect
ion,
who
le ro
ck
geoc
hem
istry
K
D-1
d Tr
aver
se #
1 44
2834
5 46
4932
D
acite
por
phyr
y G
reen
, yel
low
to w
hite
col
ored
, dac
ite
porp
hyry
Th
in se
ctio
n
KD
-2
Trav
erse
#1
4428
350
4649
52
Dac
ite p
orph
yry
Gre
en to
yel
low
col
ored
dac
ite p
orph
yry
show
ing
wea
ther
ing
and
alte
ratio
n Th
in se
ctio
n, X
RD
, SEM
/ED
X,
who
le ro
ck g
eoch
emis
try
KD
-3
KD
-3a
Trav
erse
#1
4428
369
4649
62
Dac
ite p
orph
yry
Gre
enis
h ye
llow
to w
hite
, arg
illac
eous
da
cite
por
phyr
y Th
in se
ctio
n, X
RD
K
D-3
b Tr
aver
se #
1 44
2836
9 46
4962
D
acite
por
phyr
y Y
ello
w to
whi
te a
rgill
aceo
us d
acite
po
rphy
ry
Thin
sect
ion
K
D-3
c Tr
aver
se #
1 44
2837
9 46
4986
D
acite
por
phyr
y Y
ello
w to
whi
te, a
rgill
ic d
acite
por
phyr
y Th
in se
ctio
n
K
D-3
d Tr
aver
se #
1 44
2838
4 46
5011
D
acite
por
phyr
y Y
ello
w to
whi
te a
rgill
ized
dac
ite
porp
hyry
Th
in se
ctio
n, X
RD
, who
le ro
ck
geoc
hem
istry
K
D-3
e Tr
aver
se #
1 44
2839
8 46
5030
D
acite
por
phyr
y Sl
ight
ly si
licifi
ed, y
ello
w –
whi
te,
argi
llic
daci
te p
orph
yry
Thin
sect
ion
KD
-4
KD
-4a
Trav
erse
#1
4428
404
4650
39
Dac
ite p
orph
yry
Arg
illic
± si
licifi
ed d
acite
por
phyr
y
Thin
sect
ion
K
D-4
b Tr
aver
se #
1 44
2840
4 46
5039
D
acite
por
phyr
y A
rgill
ic ±
silic
ified
dac
ite p
orph
yry
Th
in se
ctio
n
60

Tab
le 5
.1 (c
ont.)
Sam
ples
(ID
) Sa
mpl
ing
Loc
atio
n C
oord
inat
es
Ori
gina
l R
ock
Typ
e Fi
eld
Des
crip
tion
Ana
lytic
Met
hod
Mai
n ID
Su
b ID
N
orth
ing
Eas
ting
K
D-4
c Tr
aver
se #
1 44
2840
4 46
5039
D
acite
po
rphy
ry
Arg
illic
± si
licifi
ed d
acite
por
phyr
y sa
mpl
e Th
in se
ctio
n
KD
-5
KD
-5a
Trav
erse
#2
4428
419
4650
57
Qua
rtz v
ein
Silic
ified
and
arg
illiz
ed sa
mpl
e ta
ken
from
the
galle
ry (o
pene
d by
Çan
akka
le M
inin
g C
o.),
incl
udes
sulfi
des (
pyrit
e, sp
hale
rite
and
cove
llite
)
Thin
and
pol
ishe
d se
ctio
n,
XR
D, S
EM/E
DX
, who
le ro
ck
geoc
hem
istry
, sta
ble
isot
ope
(S)
K
D-5
b Tr
aver
se #
2 44
2841
9 46
5057
Q
uartz
vei
n In
tens
ely
silic
ified
sam
ple
take
n fr
om
Kar
tald
ağ g
alle
ry
Thin
and
pol
ishe
d se
ctio
n,
XR
D, S
EM/E
DX
K
D-5
c Tr
aver
se #
2 44
2841
9 46
5057
Q
uartz
vei
n Si
licifi
ed a
nd a
rgill
ized
sam
ple
take
n fr
om th
e K
arta
ldağ
gal
lery
Th
in a
nd p
olis
hed
sect
ion
KD
-6
Tr
aver
se #
2 44
2847
1 46
5099
Q
uartz
vei
n In
tens
ely
silic
ified
and
arg
illiz
ed sa
mpl
e sh
owin
g co
arse
qua
rtz c
ryst
als
Thin
sect
ion,
stab
le is
otop
e (O
), flu
id in
clus
ion
KD
-7
Tr
aver
se #
2 44
2845
8 46
5117
Q
uartz
vei
n Si
licifi
ed ±
arg
illiz
ed sa
mpl
e w
ith d
istin
ct
collo
form
ban
ded
appe
aran
ce
Thin
sect
ion,
flui
d in
clus
ion
KD
-8
KD
-8a
Trav
erse
#2
4428
587
4651
10
Qua
rtz v
ein
Arg
illiz
ed a
nd si
licifi
ed sa
mpl
e co
llect
ed fr
om
the
new
ly o
pene
d ga
llery
(by
Çan
akka
le M
in.
Co.
) in
north
east
ern
part
of th
e K
arta
ldağ
vei
n.
Coa
rse
pyrit
e m
iner
als a
re v
isib
le.
Thin
and
pol
ishe
d se
ctio
n
K
D-8
b Tr
aver
se #
2 44
2841
9 46
5057
Q
uartz
vei
n
Sam
ple
take
n fr
om n
ewly
ope
ned
galle
ry
loca
ted
in n
orth
east
ern
part
of m
ain
Kar
tald
ağ
vein
, coa
rse
sulfi
de (p
yrite
, sph
aler
ite)
form
atio
ns a
re v
isib
le
Thin
and
pol
ishe
d se
ctio
n,
XR
D, S
EM/E
DX
K
D-8
c Tr
aver
se #
2 44
2841
9 46
5057
Q
uartz
vei
n In
tens
ely
silic
ified
and
arg
illiz
ed sa
mpl
e (ta
ken
from
the
new
ly o
pene
d ga
llery
) con
tain
ing
abun
dant
vis
ible
pyr
ite
Thin
and
pol
ishe
d se
ctio
n,
who
le ro
ck g
eoch
emis
try,
stab
le is
otop
e (S
)
61

Tab
le 5
.1 (c
ont.)
Sam
ples
(ID
) Sa
mpl
ing
Loc
atio
n C
oord
inat
es
Ori
gina
l R
ock
Typ
e Fi
eld
Des
crip
tion
Ana
lytic
Met
hod
Mai
n ID
Su
b ID
N
orth
ing
Eas
ting
KD
-9
Tr
aver
se #
2 44
2850
4 46
5099
Q
uartz
vei
n Y
ello
wis
h w
hite
col
ored
, sili
cifie
d an
d ar
gilli
zed
sam
ple
Thin
sect
ion,
who
le ro
ck
geoc
hem
istry
, st
able
isot
ope
(O)
KD
-10
Tr
aver
se #
2 44
2848
7 46
5083
Q
uartz
vei
n A
rgill
ized
and
silic
ified
, pal
e ye
llow
(s
uper
gene
alte
ratio
n) sa
mpl
e Th
in se
ctio
n
KD
-11
Tr
aver
se #
2 44
2845
7 46
5045
Q
uartz
vei
n In
tens
ely
argi
llize
d an
d si
licifi
ed, w
hite
sam
ple
Thin
sect
ion,
stab
le is
otop
e (O
)
KD
-12
Tr
aver
se #
2 44
2847
4 46
5080
Q
uartz
vei
n Si
licifi
ed ±
arg
illiz
ed sa
mpl
e ta
ken
belo
w 2
m
of th
e sa
mpl
e K
D-7
, col
lofo
rm b
andi
ng is
di
stin
ctiv
e fe
atur
e Th
in se
ctio
n
KD
-13
Tr
aver
se #
2 44
2847
4 46
5080
Q
uartz
vei
n Si
licifi
ed ±
arg
illiz
ed sa
mpl
e Th
in a
nd p
olis
hed
sect
ion
K
D-1
4
Trav
erse
#2
4428
299
4650
83
Qua
rtz v
ein
Silic
ified
± a
rgill
ized
sam
ple
with
inte
nsiv
e lim
oniti
c co
ver
Thin
sect
ion
KD
-15
Tr
aver
se #
2 44
2830
5 46
5089
Q
uartz
vei
n B
row
n to
red
colo
red
silic
ified
and
oxi
dize
d sa
mpl
e Th
in se
ctio
n
KD
-16
Tr
aver
se #
3 44
2808
4 46
4900
D
acite
po
rphy
ry
Gre
en to
yel
low
ish,
arg
illiz
ed h
ost r
ock
sam
ple
Thin
sect
ion
KD
-17
Tr
aver
se #
3 44
2794
9 46
4957
D
acite
po
rphy
ry
Alte
red
(pro
babl
y, a
rgill
ized
) dac
ite sa
mpl
e Th
in se
ctio
n
KD
-18
Tr
aver
se #
3 44
2782
6 46
4997
D
acite
po
rphy
ry
Leas
t alte
red
(pro
babl
y, a
rgill
ized
) dac
ite
sam
ple
with
vis
ible
maf
ic m
iner
als
Thin
sect
ion,
who
le ro
ck
geoc
hem
istry
, geo
chro
nolo
gy
KD
-19
KD
19-a
Tr
aver
se #
3 44
2778
6 46
5337
G
rani
toid
A
lmos
t fre
sh (l
ow a
ltera
tion
degr
ee) g
rani
toid
sa
mpl
e w
ith c
oars
e gr
aine
d ho
rnbl
ende
and
m
ediu
m g
rain
ed fe
ldsp
ar
Thin
sect
ion,
who
le ro
ck
geoc
hem
istry
K
D19
-b
Trav
erse
#3
4427
786
4653
37
Gra
nito
id
Sam
ple
take
n fr
om th
e sa
me
loca
tion
with
K
D19
-a, i
nclu
des d
istin
ctiv
e m
afic
enc
lave
s Th
in se
ctio
n
62

Tab
le 5
.1 (c
ont.)
Sam
ples
(ID
) Sa
mpl
ing
Loc
atio
n C
oord
inat
es
Ori
gina
l R
ock
Typ
e Fi
eld
Des
crip
tion
Ana
lytic
Met
hod
Mai
n ID
Su
b ID
N
orth
ing
Eas
ting
KD
-21
Su
rrou
ndin
g un
it 44
2820
9 46
5406
Q
uartz
vei
n Si
licifi
ed ±
arg
illiz
ed, r
ed to
whi
te c
olor
ed
sam
ple
take
n fr
om th
e qu
artz
vei
n lo
cate
d ea
ster
n si
de o
f the
Kar
tald
ağ m
ine
Thin
sect
ion
KD
-22
Su
rrou
ndin
g un
it 44
2849
5 46
4593
Q
uartz
vei
n Si
licifi
ed a
nd a
rgill
ic a
ltere
d sa
mpl
e Th
in se
ctio
n
KD
-23
Su
rrou
ndin
g un
it 44
2834
9 46
4987
D
acite
po
rphy
ry
Gre
enis
h ca
rbon
atiz
ed sa
mpl
e ta
ken
from
the
wes
tern
mos
t par
t of t
he K
arta
ldağ
qua
rtz v
ein
Thin
sect
ion
K
D-2
4
Su
rrou
ndin
g un
it 44
2834
9 46
4987
D
acite
po
rphy
ry
Arg
illiz
ed sa
mpl
e ta
ken
from
the
wes
tern
mos
t par
t of t
he K
arta
ldağ
qua
rtz v
ein
Thin
sect
ion
KD
-25
Su
rrou
ndin
g un
it 44
3108
4 46
6707
G
rano
dior
ite
Fres
h (a
lmos
t) gr
anito
id o
utcr
op w
ith v
isib
le
horn
blen
de m
iner
als
Thin
sect
ion,
who
le ro
ck
geoc
hem
istry
, ge
ochr
onol
ogy
KD
-26
Su
rrou
ndin
g un
it 44
2795
7 46
4391
G
rano
dior
ite
Alte
red
(pro
babl
y, a
rgill
ized
) gra
nito
id
outc
rop
Thin
sect
ion,
who
le ro
ck
geoc
hem
istry
, ge
ochr
onol
ogy
63

64
5.1.2 Wall Rock Alteration During the field works held in two field campaigns, 4 main alterations were
recognized and mapped. These alterations are spatially oriented with respect to a
regional structure that displaced the dacite porphyry almost E-W to NW direction. In
general, the predominant alteration is argillic alteration that occurs as envelope to
main ore-bearing silicified rocks. The mineral assemblage necessary to define these
distinct alterations were identified using ordinary petrographic analyses of thin and
polished sections supplemented by XRD (X-Ray Powder Diffraction), SEM/EDX
(Scanning Electron Microscope/Energy Dispersive X-ray spectroscopy). From the
fresh (?) dacite porphyry to the main quartz vein, the alterations are mapped as
propylitic, quartz-kaolin, quartz-alunite -pyrophyllite, quartz vein and residual silica
(vuggy quartz).All these alteration types with their distinctive textures and mineral
assemblages are explained in detail as follows:
5.1.2.1 Propylitic Alteration
The propylitic alteration was recognized and mapped by tracing the exposures of
green-looking rocks (due to intense chlorite and epidote in the rock). In general, the
propylitic alterations restricted to the southern parts of the mapped area (Fig. 5.2),
are usually hosted by volcanic rocks. An almost arc to sub-spherical map pattern is
diagnostic for this alteration, and western and northern margins closely fit into the
lithological boundary of the dacite porphyry (Fig. 5.2). Thin and polished section,
XRD, and SEM/EDX studies of samples from the traverse #1 reveal characteristic
assemblage of propylitic alteration dominated by the minerals of chlorite-smectite
mixed layer, illite, carbonates (e.g. calcite), quartz (α-low temperature) with lesser
amounts of epidote and albite. Based on field observations and XRD analyses,
propylitic alteration extents along the traverse #1 for a distance of nearly 47 meters
and passes to quartz-kaolin alteration with the sample KD3-a towards NE direction.
The areal extent of propylitic alteration is spatially controlled by the volume of
exposure of dacite porphyry (Fig. 5.2) in the deposit area. It is observed that all
hornblendes of dacite porphyry were converted into chlorite, carbonates (e.g. calcite)
and/or epidote (Fig. 5.7; Fig. 5.8). The propylitic assemblage seems to be (spatially)

65
overlapping with argillic alteration (illite, smectite, and kaolin minerals); the latter
being intense in some samples (Fig. 5.9). Although argillization is rather widespread
in KD1 series of samples, this is highly likely to be argillic "overprint" of propylitic
alteration as evidenced by the XRD studies which revealed distinct propylitic
assemblage (i.e. chlorite, illite, smectite, calcite, quartz, and albite, Fig. 5.10 and Fig.
5.11), and petrographic analyses show intense carbonatization both on hornblendes
and groundmass. Furthermore, SEM/EDX studies on sample KD2 prove the
propylitic alteration both via the typical smectite and chlorite morphologies (mixed)
and the intensities of the Al, Mg, Fe and K concentrations (Fig. 5.12). Supergene
effect due to surface oxidation is seen as FeO staining in most of the fractures and
late, banded calcite veining (Fig. 5.13).
Figure 5.7 Photomicrograph of epidotized-chloritized hornblende, propylitic
alteration (Sample no. KD1-a) (Chl: Chlorite, Arg. Alt: Argillic alteration, Ep: Epidote)
Ep
Chl
Arg. Alt
Arg. Alt
Ep

66
Figure 5.8 Hand specimen photo of the sample KD1-a, propylitic alteration sample
Figure 5.9 Argillic alterations (Arg. Alt) within the dacite porphyry with typical quartz-eye structure and plagioclase. (Sample no. KD1-a) (Plg: Plagioclase, Q:
Quartz)
Q
Arg. Alt
Plg

67
Figure 5.10 Result of XRD analysis of KD1-b, propylitic alteration, Chl -Sm:
Chlorite - Smectite mixed layer, I: Illite, K: Kaolin, Chl: Chlorite, Q: Quartz (low temperature), Alb: Albite, Cc: Calcite (AD: Air-dried, EG: Ethylene glycolated, 300
ºC and 500 ºC: Heated in oven (300 ºC) and fired at 550 ºC)
Figure 5.11 Result of XRD analysis of KD2. Propylitic alteration; Chl & Sm: Chlorite – Smectite mixed layer, I: Illite, K: Kaolin, Q: Quartz (low temperature),
Alb: Albite (AD: Air-dried, EG: Ethylene glycolated, 300 ºC and 500 ºC: Heated in oven (300 ºC) and fired at 550 ºC)
Chl-Sm I
I K + Chl Q
Alb K +Chl
Chl -Sm I
I+Sm K+Chl
Q+ I Alb
K +Chl
Chl
Cc
Clay Fraction
Clay Fraction
Chl -Sm I
I+Sm
K +Chl
Q AD
EG
300 ºC
550 ºC
AD
EG
300 ºC
550 ºC

68
Figure 5.12 Result of SEM-EDX analysis of KD2 (propylitic alteration sample). Chlorite – Smectite mixed layer is exposed with Mg, Fe, and Al peaks, Illite is
associated with K and Al peaks, Kaolin and Quartz (low temperature) display Si and Al peaks
Figure 5.13 Supergene oxidation, supergene argillic overprint and late banded calcite (Sample no. KD1-c) (Cc: Calcite, Arg. Alt: Argillic alteration)
Cc Cc
Arg. Alt

69
5.1.2.2. Quartz-Kaolin Alteration
The quartz-kaolin alteration appears to be the most wide-spread alteration in the
deposit area enclosing quartz-alunite and vuggy quartz alterations. This alteration is
exposed within an area covering the northern half, and western, southwestern parts of
the mapped area (Fig. 5.2). Although this alteration was mapped as a single
alteration, the field works revealed that supergene argillic alterations - formed by the
leaching of the propylitic zone and disseminated sulfide-bearing (mostly pyrite)
dacitic rocks - are also observed either as large patches (more than 100 m long) or as
fracture-controlled oxidized bleached outcrops. These two are hard to map, and not
differentiated by petrographical and/or other means.
Quartz-kaolin alteration is best observed within the samples of KD3-a – e, KD4-a –
c, and KD22, KD23, along traverse line # 1 (Fig. 5.3-a; Table 5.1). The XRD studies
on the samples KD3-a (Fig. 5.14) and KD3-d (Fig.5.15; Fig. 5.16), revealed that
chlorite content decreases, while kaolin (most probably kaolinite) and α-quartz
increase towards NE – nearly towards the Kartaldağ main gallery. On the cross
section of traverse line #1 (Fig. 5.3.a), the observed thickness of the quartz-kaolin
alteration is about 145 meters, and then it passes into the silicified zone towards the
main gallery. To the north of the main gallery, the quartz-kaolin zone re-appears and
envelopes the silicified zone around the main gallery (Fig. 5.2, Fig. 5.17). Quartz-
kaolin alteration is defined based on an assemblage including kaolin, and quartz (low
temperature) as predominant constituent, and chlorite, illite, ± pyrophyllite as
occasional constituents. The petrographical analyses have shown that the matrix and
pheonocrystal assemblage (plagioclase and hornblende) of dacite porphyry were
pervasively altered to clay minerals (illite and kaolin). The minerals of illite, kaolin ±
pyrophyllite increase in abundance with the degree of argillization, particularly at
samples KD3-d, KD4-b (Fig.5.18), and KD4-c. A zone composed of illite is locally
seen as patches, or intensively over the whole section with hydrothermal quartz and
pyrite dissolution features, and sometimes with kaolinite on the groundmass. The
transition from argillic to advanced argillic alteration might be considered by using
information that confirms reasonable increase in pyrophyllite and pyrite content
determined in the sections of KD4 samples (Fig. 5.18).

70
Figure 5.14 Result of XRD analysis of KD3-a, sample of quartz-kaolin alteration
zone. Chl: Chlorite, I: Illite, K: Kaolin (possibly, kaolinite), Q: Quartz (low temperature) (AD: Air-dried, EG: Ethylene glycolated, 300 ºC and 500 ºC: Heated in
oven (300 ºC) and fired at 550 ºC)
Figure 5.15 Argillic alterations on sample no.KD3-d. Arg. Alt: Argillic (illite-dominated) alteration
Arg Alt
I Chl
I
K ± Chl
Chl
I + Q
K ± Chl
Clay Fraction
AD
EG
300 ºC
550 ºC

71
Figure 5.16 Result of XRD analysis of KD3-d, sample for quartz-kaolin alteration
zone. I: Illite, K: Kaolin (possibly, kaolinite), Q: Quartz (low temperature) (AD: Air-dried, EG: Ethylene glycolated, 300 ºC and 500 ºC: Heated in oven (300 ºC) and
fired at 550 ºC)
Figure 5.17 Northeastern part of the main gallery in the quartz – kaolin alteration (See opening to the main gallery, sampled as KD23, 24)
I
I K
K
I + Q
KD23, 24
Clay Fraction 300 ºC
550 ºC
AD
EG

72
Figure 5.18 Pervasive argillic alteration (illite, kaolin) and euhedral pyrite minerals. Sample no.KD4-b, Arg. Alt. Argillic Alteration (illite and kaolin dominated) Py:
Pyrite 5.1.2.3 Quartz-Alunite-Pyrophyllite Alteration
The quartz-alunite-pyrophyllite zone is characterized by pinkish to grayish-green
ridges with abundant euhedral alunite crystals accompanied by quartz. This alteration
is difficult to map in the field, but has common exposures at and around the
Kartaltepe and Yokusyayla hills. It is distinguished from the quartz-kaolin alteration
by the abundance of pinkish alunite crystals within the cavities and vugs of the
silicified rock. Although it forms an envelope around the main quartz vein, it is hard
to differentiate the silicified rocks from the quartz-alunite alteration at megascopic
scale since both occur as prominent ridges within the study area. Their differentiation
is mainly based on a simple test of abundance of alunite (pinkish) and/or clay
mineral.
This alteration is best exposed along the traverse # 2 (Fig. 5.3.b) characterized by the
minerals similar to that of advanced argillic alteration assemblage: pyrophyllite,
Arg. Alt
Py

73
kaolinite, alunite and α-quartz ± zunyite, accompanied by pyrite, covellite, and
sphalerite. At the southern part of the main gallery, Kartaldağ fault (possible normal
fault in Fig. 5.2) is interpreted to be the boundary for this alteration. The results of
XRD and SEM/EDX studies performed on samples collected from this zone are
presented in Fig. 5.19 - 23. Samples KD5 (KD5-a, b, and c), KD8 (KD8-a, b, and c),
KD10, and KD11 which are representative samples for alunite-pyrophyllite-quartz
zone, were collected from north and south walls of the main gallery re-opened by
Çanakkale Mining Co. Based on the field observations and petrographic analyses on
thin and polished sections, these samples were believed to be collected from the
silicified rocks (main quartz vein) of the Kartaldağ mine area, but the existence of
euhedral to subhedral alunite minerals developed in the ghosts of parental grains and
pyrite veinlets (Fig. 5.24 and 25) called for a detailed definition of this zone as
quartz- alunite-pyrophyllite alteration.
Figure 5.19 Result of XRD analyses of KD5-a showing pyrophyllite (Pyr), kaolinite (K), and α- quartz (Q) (AD: Air-dried, EG: Ethylene glycolated, 300 ºC and 500 ºC:
Heated in oven (300 ºC) and fired at 550 ºC)
Pyr Pyr K K Q Q
Clay fraction 300 ºC
550 ºC
AD
EG

74
Figure 5.20 Result of XRD analyses of KD5-b showing alunite (Al), kaolinite (K), and α- quartz (Q) (AD: Air-dried, EG: Ethylene glycolated, 300 ºC and 500 ºC:
Heated in oven (300 ºC) and fired at 550 ºC)
Figure 5.21 Result of XRD analyses of KD8-b showing pyrophyllite (Pyr), alunite (Al), kaolinite (K), and quartz-α (Q) (AD: Air-dried, EG: Ethylene glycolated, 300
ºC and 500 ºC: Heated in oven (300 ºC) and fired at 550 ºC)
Clay fraction
Pyr
K K
Al Pyr Pyr Q
Clay fraction
K Q K Q Al Al
300 ºC
550 ºC
AD
EG
300 ºC
550 ºC
AD
EG
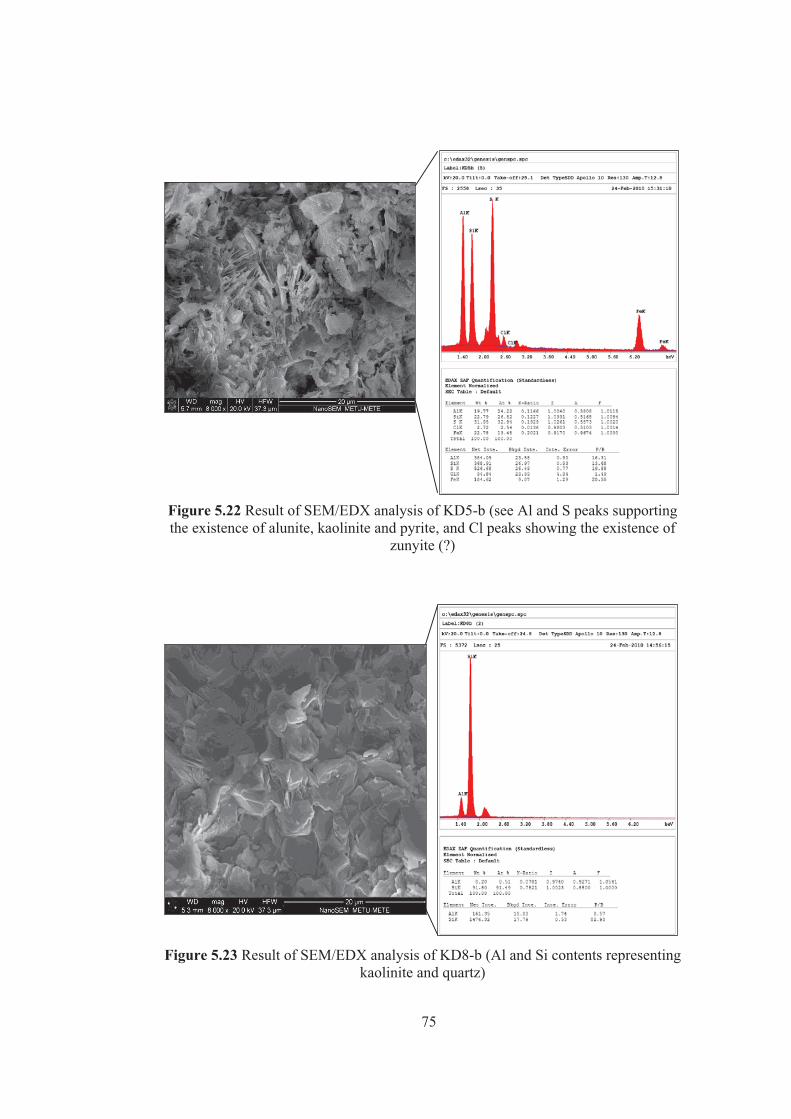
75
Figure 5.22 Result of SEM/EDX analysis of KD5-b (see Al and S peaks supporting the existence of alunite, kaolinite and pyrite, and Cl peaks showing the existence of
zunyite (?)
Figure 5.23 Result of SEM/EDX analysis of KD8-b (Al and Si contents representing kaolinite and quartz)

76
Figure 5.24 SEM photomicrograph showing pyrophyllite and kaolinite crystals. K:
Kaolinite, Pyr: Pyrophyllite (?), Sample no. KD8-b
Figure 5.25 Photomicrograph showing pyrite-alunite-quartz vein (sample KD5-c.
Al: Alunite, Py: Pyrite)
Al
Al
Py
Py
500 μm
K
Pyr

77
Figure 5.26 Photomicrograph of showing euhedral alunite crystals, A: crossed polar,
B: single polar (sample no. KD10, Al: Alunite)
A
Al
Al
Al
B
Al

78
5.1.2.4 Vuggy Quartz / Pervasive Silicification
The silicified ridges, trending almost E-W to NW direction and forming an accurate
shape from the Yokusyayla to Çataltepe hills, are termed as vuggy quartz/pervasive
silicification (Fig. 5.27a and b). Silicification is represented by two most common
hydrothermal quartz textures such as massive replacement (Fig. 5.28) and vuggy
textures (Fig. 5.29). These are accompanied by sporadic banded, comb, and
colloform textures. The petrographic analyses and cross-cutting relationships enabled
recognition of two different quartz generations within the silicification and vuggy
quartz as; i) early and ii) late phase silicification. The early phase (massive)
silicification refer to massive or vuggy quartz generation, very fine to medium
grained, and resulted in precipitation of commonly subhedral quartz and massive
replacement of the pheonocrystal assemblage and matrix of volcanic host. The
pheonocrystal assemblage is no more persistent and kept as vugs and
ghosts/pseudomorphs left behind due to intense leaching (e.g., hornblende and
plagioclase) (Fig. 5.30). These vugs and ghosts are also lined with fine grained
euhedral quartz crystals referred to as vuggy quartz. This is a very diagnostic
criterion for pervasive leaching of the host rocks due to very acidic fluids forming
the high sulfidation epithermal systems. The late phase silicification refer to
silicification and quartz generation , coarse to medium grained, banded, comb,
sometimes colloform, and generally zoned quartz crystals truncating early phase
massive silicification (Fig. 5.31).
The term “pervasive silicification” refers to the core of residual zone of Kartaldağ
epithermal system where all leaching and boiling processes – typical for epithermal
systems - occurred. Traverse # 2 is a good line of section where the internal structure,
and mineralogical assemblage and textural variations within this alteration can be
observed. The internal compositional change and textural changes are best detected
along a 15 m long segment of traverse #2 from sample KD7 to KD15 (see Figure
5.3-b). In many samples along this segment, both early and late silicification phases
co-exist (Fig. 5.32, 33, and 34) with a clear cross cutting relationship. In some
samples, though, only early phase silicification or late silicification textures are
recorded (Fig. 5.35, 36, 37, and 38).

79
(a)
(b)
Figure 5.27 The field exposure of silicified ridges through which the ancient mining operations were focused (a) ridge looking SE, (b) ridge looking NW from Çataltepe
Kartaldağ
Collapsed Galery

80
Figure 5.28 Massive replacement of dacite porphyry with occasional alunite (pinkish minerals)
Figure 5.29 Vuggy quartz formed by leaching hornblende and plagioclase (refer to
insets for ghosts/pseudomorphs for leached minerals)
81
Figure 5.30 Fine grained quartz (Q) crystallized around the vugs left behind the leached out minerals during early silicification and alunite crystals (Al) displaying
infilling textures (Sample no. KD10)
Figure 5.31 Medium grained quartz vein formed during late silicification phase cutting through the fine grained-massive quartz of early silicification (leaching)
phase (Sample no. KD5-c)
500 μm
Early Silicification
Late silicification
Al
Q
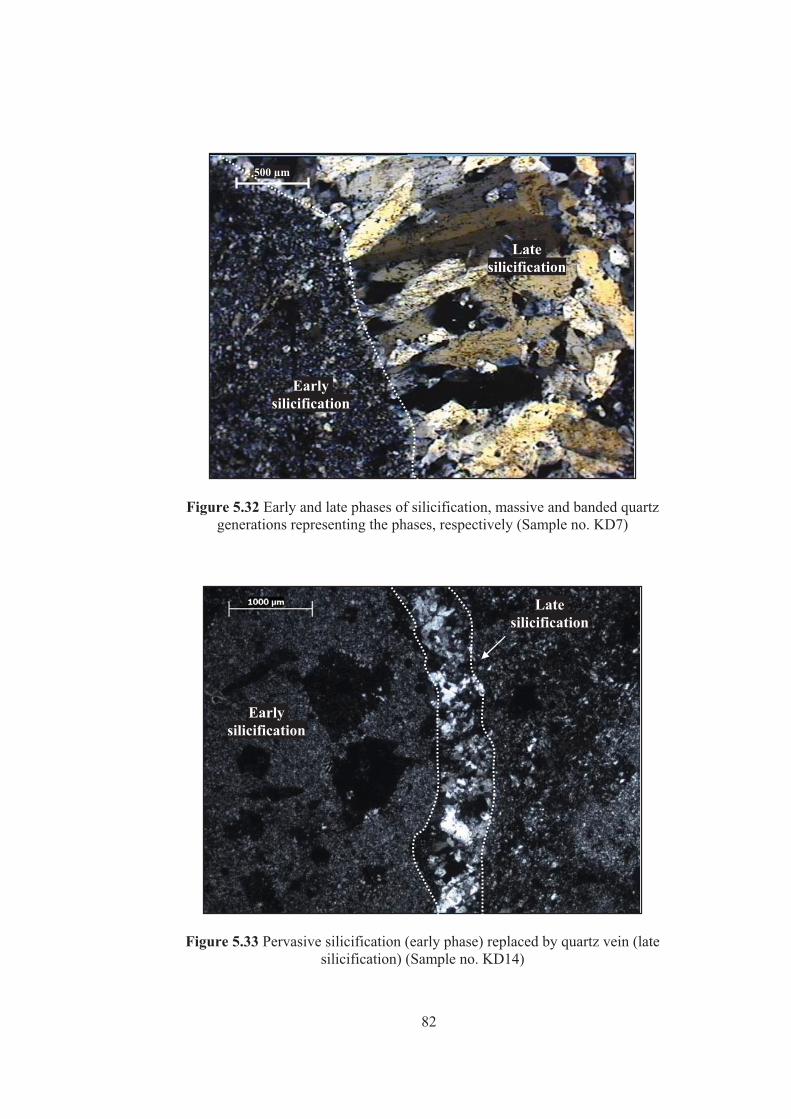
82
Figure 5.32 Early and late phases of silicification, massive and banded quartz generations representing the phases, respectively (Sample no. KD7)
Figure 5.33 Pervasive silicification (early phase) replaced by quartz vein (late silicification) (Sample no. KD14)
500 μm
Late silicification
Early silicification
Early silicification
Late silicification

83
Figure 5.34 Photomicrograph showing early (fine grained, massive and vuggy) and late (comb, banded) silicification (see vuggy quartz with euhedral pseudomorphs of
hornblende and plagioclase veined by late comb quartz) (Sample no. KD15)
Figure 5.35 Pervasive leaching and vug generation (vugs not filled), early
silicification sample - KD13-

84
Figure 5.36 Multi-banded, colloform quartz, late silicification sample (Sample no.
KD12)
Figure 5.37 Vuggy quartz (early silicification phase) in sample no. KD15

85
Figure 5.38 Coarse grained quartz crystals with well developed growth zones (Sample no. KD6) formed during late silicification phase
5.1.3 Ore Petrography In order to identify the ore and gangue mineral assemblages and supergene minerals
for the Kartaldağ deposit, 11 polished samples were prepared in the laboratory of
Department of Geological Engineering, METU and examined by reflected light
microscopy in Geological Engineering Departments of Ankara and Muğla
Universities. The samples from which polished sections were prepared are KD5-a (3
polished sections), KD5-b, KD5-c, KD8-b, KD8-c (3 polished sections), and KD13.
They were selected on the basis of the possible content of sulfide and supergene
formations.
The primary ore minerals in the Kartaldağ deposit are pyrite, covellite, and
sphalerite. Pyrites can be grouped broadly into two as i) subhedral, fine grained
crystals within veinlets or as dissemination, ii) euhedral, fine to medium grained
disseminated crystals. First group of pyrites are generally seen on the margins of
early and late silicification (Fig. 5.39), with a common occurrence within the early
phase silicification close to margins of late quartz veins. Second group, on the other

86
hand, are seen generally as disseminations within the quartz crystals formed during
the late silicification phase. These exhibit textural features suggesting a cataclastic
deformation (Fig. 5.40).
Figure 5.39 Pyrite concentrations along the margins of late silicification replacing the early silicification (Sample no. KD5-c) Py: Pyrite
Early silicification
Late silicification
Py

87
Figure 5.40 Cataclastic deformation observed on pyrite (2nd group) (Sample no. KD5-a) Py: Pyrite
Blue, medium-fine grained covellite and light gray, fine grained sphalerite are seen
generally as either replacing or intergrown with pyrite formations (Figures 5.41 to
43). Covellite formations might have changed from chalcopyrite which was present
as overprinting minerals on pyrite minerals (Fig. 5.42).
Hematite, goethite, jarosite, malachite, and azurite (Fig. 5.44) are seen as common
supergene minerals in the Kartaldağ mineralization system.
Py

88
Figure 5.41Pyrite and sphalerite minerals (intergrown) in sample KD5-c. Sph:
sphalerite, Py: Pyrite
Figure 5.42 Covellite and pyrite minerals in sample KD5-a. (Intergrown/replaced?)
Co: Covellite, Py: Pyrite
Co
Py
Sph
Py

89
Figure 5.43 Covellite replacing pyrite. Co: Covellite, Py: Pyrite (Sample no.KD5-c)
Fig. 5.44 Azurite and malachite formations in the main gallery where KD8 series of samples were collected
Co
Py

90
5.2 Madendağ Gold Mine
The Madendağ gold mine was operated by a British company- Astyra Gold Mining
Co. during 1914-1918 (Molly, 1961; Higgs, 1962b; JICA, 1989), at the same period
with Kartaldağ gold mine. The mine was being operated even before 1914 by
Trojans, but there is no written evidence for period of ancient Troy’ mining
activities. MTA initiated a series geological survey in the Madendağ area in 1958.
Based on the surveys between 1960-62, a small reserve of 15 000 ton (possible
reserve) at 5.8-6.8 g/t Au was estimated by means of tunneling and drilling studies
(Higgs, 1962b; MTA, 1993; Watanabe et al., 2003). As reported by MTA (1989),
Tüprag-joint Venture Company of Eurogold Co. have explored the silicified zone in
the andesitic pyroclastics to the west of the old Madendağ mine and used the
methods of trenching and drilling in the exploration program. JICA, on the other
hand, has performed the exploration studies in the andesitic rocks in the north of old
underground operations (JICA, 1989). Trenching at 50m interval, grid drilling and
heavy mineral study of the soil of the silicified and argillized zones have been
performed during those studies and the existence of gold grains was recorded (JICA,
1989).
5.2.1 Field Aspects
The Madendağ gold deposit is hosted by strongly clay-altered mica-schist overlain
by dacite flows and intruded by subvolcanic dacite domes. The known mineralization
is strictly confined to three vein-breccia system in more or less E-W to WNW-ESE
direction (Fig.5.45). There also occur quartz veins oblique (N-S) to the main ore-
bearing zone. The operations by Astyra Mining appear to be focused on argillic
alterations (at vein no. 2 zone, Fig. 5.45) between two silicified vein-breccia systems.
Field works performed during the thesis study included alteration mapping and
sampling. The alteration mapping focused mainly on outlining the areal extent of the
silicified rocks, clay altered metamorphic and volcanic rocks. However, the
vegetation and soil cover obscured mapping of the entire area.

91
The Paleozoic micaschist (Fig 5.46) units are identified as the host rock of Madendağ
mineralization based on the locations that the quartz veins are observed. The contacts
between schist and dacitic rocks in the study area are not clearly observed due to
intense argillic alteration and oxidation. However, the field mapping showed that the
metamorphics are usually exposed to the western part, while dacite dominates to the
eastern part of the silicified ridges. The micaschist is intensely folded and brecciated
particularly within the deposit site. The dacitic rocks are generally exposed within
low-lying areas along the valleys.
The sampling was carried out in conjunction with mapping, and a total of 36 samples
were collected separately from dumps/tailings, altered rocks around the dumps, main
silicified ridges (dump #1, vein #1, vein #2, dump #2, 28), and surrounding units (8
samples) (Table 5.2). A total of 18 samples were collected from vein #1 (Fig. 5.45),
4 samples from vein #2 area. From Dump #1 and #2 areas a total of 6 samples
(tailing samples) were chosen randomly.
Vein #1 (Fig. 5.47) with two smaller quartz veins crossing the argillized and oxidized
schist (Fig. 5.48) are regarded as the main ore-bearing horizons for the Madendağ
hydrothermal system. A series of systematic sampling (i.e. rock chip samples
traversing whole vein and the wall rocks) was carried out in order to obtain
mineralogical and textural variations among the veins and altered host rock
(argillized schist), contact zones. From WSW to ENE, the samples of MD6-1 - MD6-
14 were taken from the main ore-bearing horizon (Fig. 5.45 and 47). The length of
the sampling section along this outcrop is nearly 19.60 meters and average spacing
between each sample is 1 meter. Although there were several adits and shafts in the
district, the dumps appear to be washed or eroded away. Therefore, the sampling at
Dump # 2 left behind after mining operations by Astyra Gold Mining Co, is
particularly important since this corresponds to one of the most preserved
dump/tailing to better understand what was mined, and which were the wall rocks, in
front of the adit (Fig. 5.49). The samples MD9-1, MD9-2 were collected from the
dump #2. The next sampling was carried out at a dump/tailings site close to an
inclined gallery (Fig. 5.50) at the 340 m level up on the Meydan Tepe (Fig. 5.45), in

92
the vicinity of old trenches by MTA (1960-62). The brecciated sample -MD8- was
taken from this area.
The Dump #1 and Vein # 2 were sampled during second field campaign in October
2009. There are several drill holes in the vicinity of Dump #1 by MTA (JICA, 1989)
and drilling locations are shown in Fig. 5.45. 3 samples (MD-17a and 17b, and MD-
U.P.) were collected from this area (Fig. 5.51). Several isolated to continuous
silicified rocks are exposed in the vicinity of the Dump#1 close to Gökçekaya Tepe
(Fig. 5.45). Vein # 2 sampling was performed along the strike of the quartz vein
(approximately 780 m in length and 50 m in height) located on summit regions of
Meydan Tepe (Fig. 5.45). The samples named as MD12, MD13, and MD14 were
taken from vein area.
A total of 35 thin and 6 polished sections were prepared in the sample preparation
laboratories of Department of Geological Engineering, METU. 12 samples (MD2,
MD3, MD6-1, MD6-4, MD6-8, MD6-14, MD6-Ust, MD7, MD9-1, MD12, MD13,
MD18) were analyzed for the whole rock geochemistry, and 7 samples (MD-1,
MD6-1, MD6-2, MD6-12, MD9-1, and MD-U.P.) from the alteration zones were
analyzed for the clay mineralogy by XRD (from which MD6-1 and MD9-1 were also
analyzed by SEM/EDX).

93
Figure 5.45 Alteration map of Madendağ mine district

94
Figure 5.46 Photograph showing the micaschist as the host rock of the Madendağ deposit (Sample no. MD-1)
Figure 5.47 General view of the Vein #1 in Madendağ district within altered micaschist
Argillized schist
Quartz vein
Argillized schist
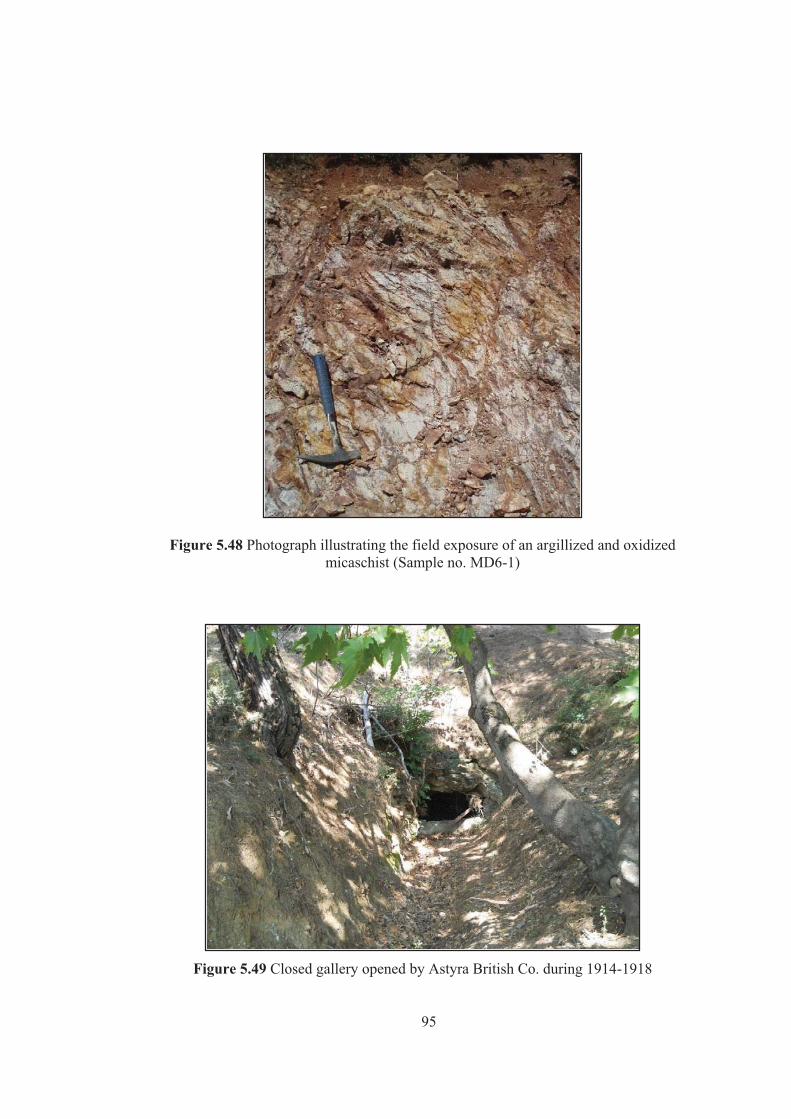
95
Figure 5.48 Photograph illustrating the field exposure of an argillized and oxidized micaschist (Sample no. MD6-1)
Figure 5.49 Closed gallery opened by Astyra British Co. during 1914-1918
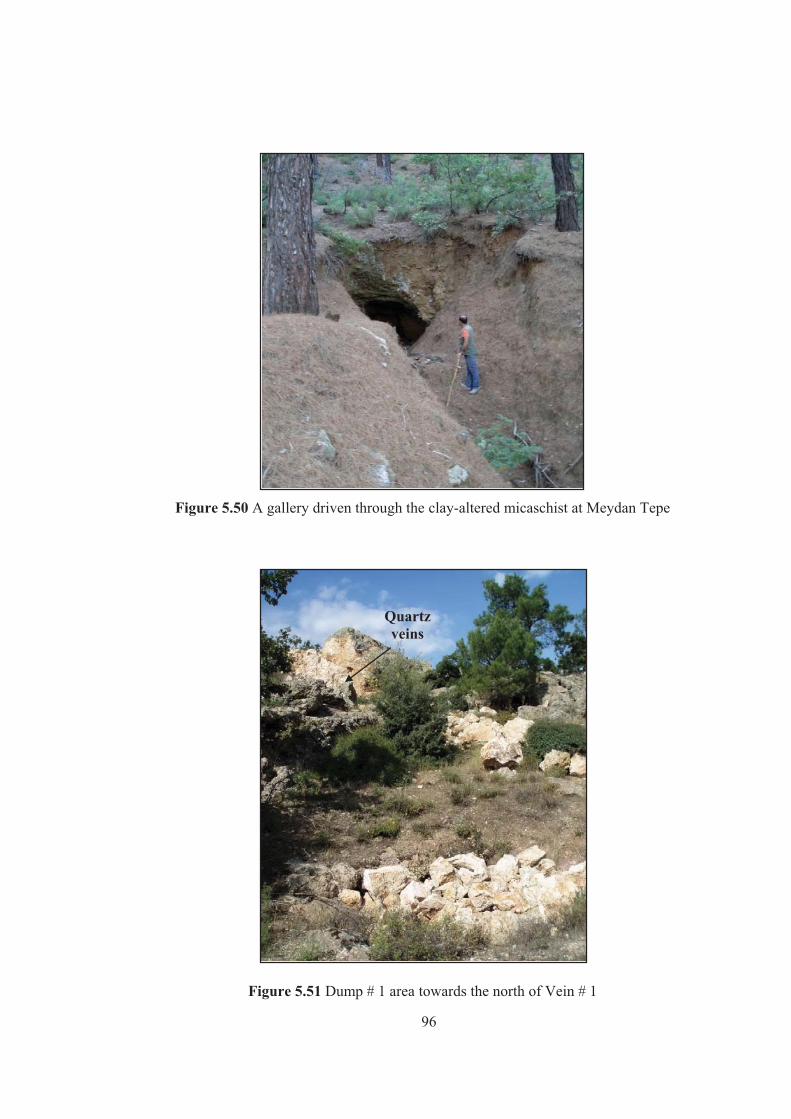
96
Figure 5.50 A gallery driven through the clay-altered micaschist at Meydan Tepe
Figure 5.51 Dump # 1 area towards the north of Vein # 1
Quartz veins

Tab
le 5
.2 S
ampl
es c
olle
cted
in th
e M
aden
dağ
min
e di
stric
t
Sam
ples
(ID
) Sa
mpl
ing
Loc
atio
n C
oord
inat
es
Ori
gina
l Roc
k T
ype
Fiel
d D
escr
iptio
n A
naly
tic M
etho
d M
ain
ID
Sub
ID
Nor
thin
g E
astin
g
MD
-1
Su
rrou
ndin
g U
nit
4433
971
4624
22
Mic
asch
ist
Alte
red
pale
gra
y to
gre
en, i
nten
sely
ox
idiz
ed sc
hist
sam
ple
Thin
sect
ion,
XR
D,
geoc
hron
olog
y
M
D-1
a Su
rrou
ndin
g U
nit
4433
971
4624
22
Mic
asch
ist
Silic
ified
schi
st sa
mpl
e ta
ken
from
a
cont
act b
etw
een
smal
l qua
rtz v
ein
and
schi
st u
nits
Th
in se
ctio
n
MD
-2
Su
rrou
ndin
g U
nit
4433
602
4626
09
Bas
alt
Sam
ple
take
n fr
om a
-4-5
m th
ick-
ba
salt
dyke
Th
in se
ctio
n, w
hole
rock
ge
oche
mis
try
MD
-3
Su
rrou
ndin
g U
nit
4433
430
4625
69
Dac
ite o
r R
hyod
acite
In
tens
ely
alte
red
daci
te p
orph
yry
Thin
sect
ion,
who
le ro
ck
geoc
hem
istry
M
D-4
Su
rrou
ndin
g U
nit
4433
307
4628
94
Dac
itic
rock
In
tens
ely
alte
red,
ligh
t gra
y to
gre
en
volc
anic
rock
Th
in se
ctio
n
MD
-5
Su
rrou
ndin
g U
nit
4433
002
4631
67
Dac
itic
rock
Si
licifi
ed v
olca
nic
rock
sam
ple
Thin
and
pol
ishe
d se
ctio
n
MD
-6
MD
-6-1
V
ein
# 1
4433
687
4628
54
Qua
rtz v
ein
Red
, bro
wn
to y
ello
w, s
trong
ly
wea
ther
ed, a
ltere
d sc
hist
sam
ple
Thin
and
pol
ishe
d, se
ctio
n,
who
le ro
ck g
eoch
emis
try, X
RD
, SE
M/E
DX
M
D-6
-2
Vei
n #
1 44
3368
7 46
2854
Q
uartz
vei
n C
onta
ct z
one
of a
smal
l qua
rtz v
ein
and
alte
red
schi
st
Thin
sect
ion,
XR
D, s
tabl
e is
otop
e (O
isot
ope)
M
D-6
-3
Vei
n #
1 44
3368
7 46
2854
Q
uartz
vei
n Sa
mpl
e re
pres
entin
g a
-1,2
0 m
thic
k-
quar
tz v
ein
Thin
and
pol
ishe
d, se
ctio
n
M
D-6
-4
Vei
n #
1 44
3368
7 46
2854
Q
uartz
vei
n B
row
n to
ligh
t yel
low
alte
red
schi
st
Thin
sect
ion,
who
le ro
ck
geoc
hem
istry
M
D-6
-5
Vei
n #
1 44
3368
7 46
2854
Q
uartz
vei
n C
onta
ct z
one
of g
ross
(6.5
m in
th
ickn
ess)
qua
rtz v
ein
and
alte
red
schi
st
Thin
sect
ion
97

Tab
le 5
.2 (c
ont.)
Sam
ples
(ID
) Sa
mpl
ing
Loc
atio
n C
oord
inat
es
Ori
gina
l Roc
k T
ype
Fiel
d D
escr
iptio
n A
naly
tic M
etho
d M
ain
ID
Sub
ID
Nor
thin
g E
astin
g
M
D-6
-6
Vei
n #
1 44
3368
7 46
2854
Q
uartz
vei
n Y
ello
wis
h co
ntac
t zon
e of
gro
ss (6
.5 m
in
thic
knes
s) q
uartz
vei
n an
d al
tere
d sc
hist
Th
in se
ctio
n
M
D-6
-7
Vei
n #
1 44
3368
7 46
2854
Q
uartz
vei
n G
ross
, 6.5
m th
ick,
oxi
dize
d, re
d to
bro
wn
quar
tz v
ein
Thin
sect
ion
M
D-6
-8
Vei
n #
1 44
3368
7 46
2854
Q
uartz
vei
n G
ross
, 6.5
m th
ick,
oxi
dize
d, re
d to
bro
wn
quar
tz v
ein,
sam
ple
take
n fr
om ~
1 m
no
rthea
st o
f MD
6-7
Thin
sect
ion,
who
le
rock
geo
chem
istry
,
M
D-6
-9
Vei
n #
1 44
3368
7 46
2854
Q
uartz
vei
n G
ross
, 6.5
m th
ick,
oxi
dize
d, re
d to
bro
wn
quar
tz v
ein,
take
n fr
om ~
1 m
nor
thea
st o
f M
D6-
8 Th
in se
ctio
n
M
D-6
-10
Vei
n #
1 44
3368
7 46
2854
Q
uartz
vei
n G
ross
, 6.5
m th
ick,
oxi
dize
d, re
d to
bro
wn
quar
tz v
ein,
take
n fr
om ~
1 m
nor
thea
st o
f M
D6-
8 Th
in se
ctio
n
M
D-6
-11
Vei
n #
1 44
3368
7 46
2854
Q
uartz
vei
n Y
ello
wis
h, si
licifi
ed a
nd a
rgill
ized
schi
st
Thin
sect
ion
M
D-6
-12
Vei
n #
1 44
3368
7 46
2854
Q
uartz
vei
n N
orth
east
ern
cont
act z
one
of g
ross
qua
rtz
vein
and
alte
red
schi
st
Thin
sect
ion,
XR
D
M
D-6
-13
Vei
n #
1 44
3368
7 46
2854
Q
uartz
vei
n Sa
mpl
e ta
ken
from
the
north
east
ern
cont
act
of g
ross
qua
rtz v
ein
and
argi
llic
schi
st
Thin
sect
ion
M
D-6
-14
Vei
n #
1 44
3368
7 46
2854
Q
uartz
vei
n La
st sa
mpl
e fo
r the
syst
emat
ic sa
mpl
ing
in
Vei
n #
1 lo
catio
n. B
row
nish
, alte
red
schi
st
sam
ple
Thin
sect
ion,
who
le
rock
geo
chem
istry
M
D6-
UST
V
ein
# 1
4433
687
4628
54
Dac
itic
volc
anic
br
ecci
a
Sam
ple
repr
esen
ting
an o
utcr
op o
f 3-4
m
thic
k an
d ox
idiz
ed, r
ed to
bro
wn
mat
rix
acco
mpa
nies
dar
k gr
ains
Thin
sect
ion,
who
le
rock
geo
chem
istry
98

Tab
le 5
.2 (c
ont.)
Sam
ples
(ID
) Sa
mpl
ing
Loc
atio
n
Coo
rdin
ates
O
rigi
nal R
ock
Typ
e
Fiel
d D
escr
iptio
n
Ana
lytic
Met
hod
M
ain
ID
Sub
ID
Nor
thin
g E
astin
g
MD
-7
Su
rrou
ndin
g U
nit
4431
412
4630
56
Dac
ite o
r R
hyod
acite
A
ltere
d da
citic
vol
cani
c ro
ck o
utcr
oppe
d w
ithin
the
schi
st u
nits
Th
in se
ctio
n, w
hole
rock
ge
oche
mis
try
MD
-8
D
ump
# 2
4431
295
4630
18
Qua
rtz v
ein
Hyd
roth
erm
al b
recc
ia sa
mpl
e ta
ken
from
31
7 m
leve
l of M
eyda
n Te
pe, o
pen
galle
ry
Thin
and
pol
ishe
d, se
ctio
n,
stab
le is
otop
e (O
isot
ope)
MD
-9
MD
-9-1
D
ump
# 2
4431
782
4629
81
Mic
asch
ist
Alte
red,
ligh
t gre
y to
gre
en, v
itreo
us, c
alc-
m
icas
chis
t sam
ple
Thin
sect
ion,
who
le ro
ck
geoc
hem
istry
, XR
D,
SEM
/ED
X
M
D-9
-2
Dum
p #
2 44
3178
2 46
2981
Q
uartz
vei
n H
ydro
ther
mal
bre
ccia
sam
ple
take
n fr
om th
e ta
iling
s of c
lose
d ga
llery
, whi
te q
uartz
gra
ins
are
seen
with
in b
lack
silic
ified
mat
rix
Thin
and
pol
ishe
d, se
ctio
n,
fluid
incl
usio
n
MD
-10
V
ein
# 2
4430
262
4624
42
Qua
rtz v
ein
Sam
ple
take
n fr
om 4
14 m
. lev
el o
f Mey
dan
Tepe
, a re
pres
enta
tive
quar
tz v
ein
(50
m
leng
th a
nd 2
0-30
m h
eigh
t)
Thin
sect
ion,
stab
le is
otop
e (O
isot
ope)
MD
-11
V
ein
# 1
4432
780
4628
55
Dac
ite o
r R
hyod
acite
Sam
ple
take
n fr
om ~
5 m
abo
ve th
e V
ein
# 1
syst
emat
ic sa
mpl
ing
loca
tion,
from
oxi
dize
d an
d ar
gilli
zed
outc
rop
Thin
sect
ion
MD
-12
V
ein
# 2
4431
780
4628
79
Qua
rtz v
ein
Rep
rese
ntin
g ~1
20 m
in n
orth
– so
uth
and
~50
m h
igh
outc
rop
of q
uartz
vei
n, fr
om th
e no
rther
nmos
t par
t of M
eyda
n Te
pe
Thin
sect
ion,
who
le ro
ck
geoc
hem
istry
MD
-13
V
ein
# 2
4431
680
4628
77
Qua
rtz v
ein
Silic
ified
sam
ple
take
n fr
om n
early
mid
dle
of th
e V
ein
# 2
Thin
sect
ion,
who
le ro
ck
geoc
hem
istry
MD
-14
V
ein
# 2
4431
088
4629
57
Qua
rtz v
ein
Silic
ified
sam
ple
take
n fr
om th
e no
rther
n pa
rt of
Vei
n #
2 Th
in se
ctio
n
99
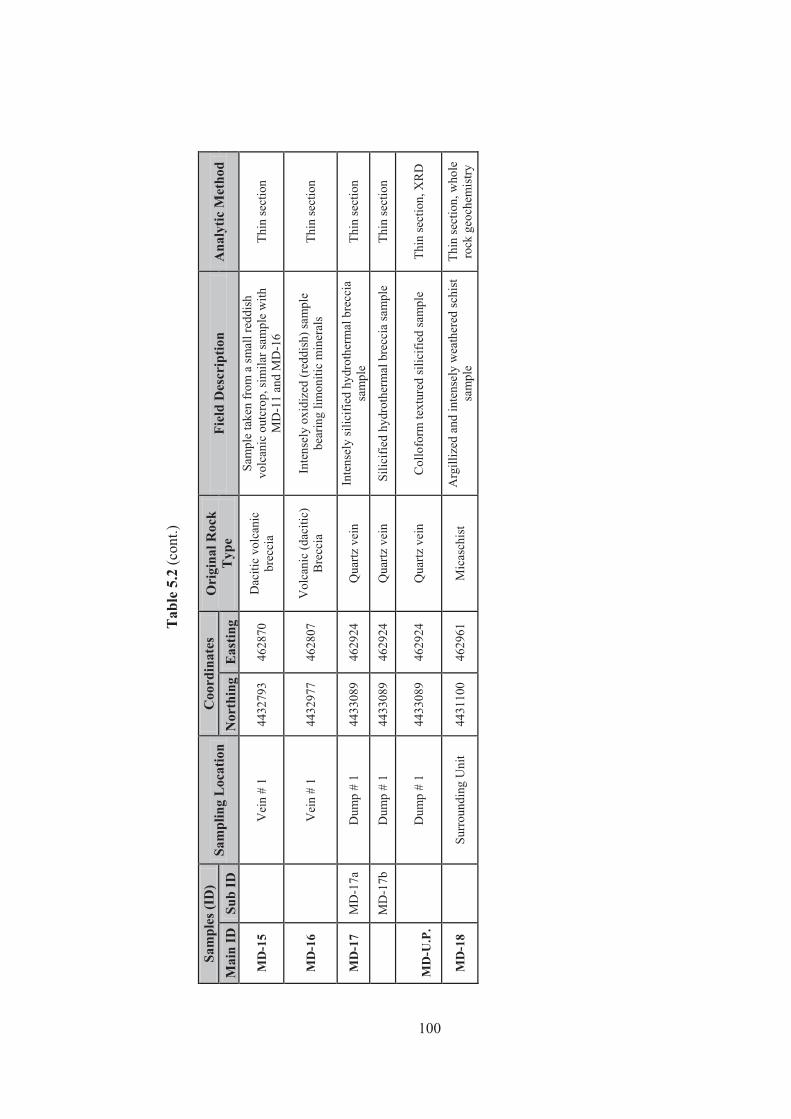
Tab
le 5
.2 (c
ont.)
Sam
ples
(ID
) Sa
mpl
ing
Loc
atio
n C
oord
inat
es
Ori
gina
l Roc
k T
ype
Fiel
d D
escr
iptio
n A
naly
tic M
etho
d M
ain
ID
Sub
ID
Nor
thin
g E
astin
g
MD
-15
V
ein
# 1
4432
793
4628
70
Dac
itic
volc
anic
br
ecci
a
Sam
ple
take
n fr
om a
smal
l red
dish
vo
lcan
ic o
utcr
op, s
imila
r sam
ple
with
M
D-1
1 an
d M
D-1
6 Th
in se
ctio
n
MD
-16
V
ein
# 1
4432
977
4628
07
Vol
cani
c (d
aciti
c)
Bre
ccia
In
tens
ely
oxid
ized
(red
dish
) sam
ple
bear
ing
limon
itic
min
eral
s Th
in se
ctio
n
MD
-17
MD
-17a
D
ump
# 1
4433
089
4629
24
Qua
rtz v
ein
Inte
nsel
y si
licifi
ed h
ydro
ther
mal
bre
ccia
sa
mpl
e Th
in se
ctio
n
M
D-1
7b
Dum
p #
1 44
3308
9 46
2924
Q
uartz
vei
n Si
licifi
ed h
ydro
ther
mal
bre
ccia
sam
ple
Thin
sect
ion
M
D-U
.P.
D
ump
# 1
4433
089
4629
24
Qua
rtz v
ein
Col
lofo
rm te
xtur
ed si
licifi
ed sa
mpl
e Th
in se
ctio
n, X
RD
MD
-18
Su
rrou
ndin
g U
nit
4431
100
4629
61
Mic
asch
ist
Arg
illiz
ed a
nd in
tens
ely
wea
ther
ed sc
hist
sa
mpl
e Th
in se
ctio
n, w
hole
ro
ck g
eoch
emis
try
100

101
5.2.2. Wall Rock Alterations
The wall rock, micaschist has been subjected to moderate to intense silicification and
argillic alterations mostly in E-W direction. The silicification is the most prominent
alteration as continuous ridges enclosed by argillic alteration. Two main (nearly)
parallel veins characterize the silicification, and the area between the two is occupied
by argillic alteration. The present adits, trenches and shafts appear to be opened
between these two forming a zigzag pattern from south to north.
The mineral assemblage and textural characteristics of the wall rock alterations in the
Madendağ district were examined through an integrated study of field aspects, thin
and polished sections prepared from systematically collected samples, XRD,
SEM/EDX analysis.
There are broadly two types of wall rock alterations; argillic alteration (illite and
kaolin-dominated) and silicification. The order of alteration zonation (from argillic to
silicic) can especially be followed in local sampling area, Vein #1 (sample set MD6,
Fig. 5.45) Silicification with typical epithermal quartz textures such as comb and
colloform banded quartz (which are generally characteristic for the evolving
hydrothermal conditions) are observed in both gallery and vein areas.
5.2.2.1 Argillic Alteration
The argillic alteration is the most widespread alteration observed dominantly in
micaschists (Fig. 5.52), as well as in dacitic and andesitic rocks in the district. Based
on XRD and SEM/EDX analysis data, argillic alteration is classified into two groups
as kaolin-rich argillic alteration and illite-rich argillic alteration. Samples of MD6
series (Fig. 5.53), which were collected in a systematically crossing the vein #1,
display the transition from illite-rich argillization in schists to kaolin-rich
argillization towards the quartz veins. Along the cross section of Vein #1, alteration
mineralogy can be summarized as hydrothermal α-quartz, illite, kaolin and pyrite
(Fig. 5.53, 54, and 55).

102
Argillic alteration observed in Dump # 1 area consists dominantly of kaolin and
hydrothermal quartz, which is referred to as quartz-kaolin zone (Fig. 5.56), whereas
in Dump # 2 area, illite is the predominant constituent together with chlorite (Fig.
5.57 and 58). The difference in argillic alteration might be result of composition
differences of the wall rocks in the north and south of Madendağ epithermal system.
If the clay mineralogy is taken into account, chlorite and illite for the schist; kaolin
for the andesitic/dacitic volcanic breccia samples (Hallaçlar volcanics) are
recognizable. Besides, the association of illite-chlorite away from the quartz veins,
and quartz-kaolin or montmorillonite close to quartz veins is very common for
epithermal systems.
Figure 5.52 Photomicrograph of argillized schist (Sample no. MD6-2) showing clay-altered muscovite
Altered muscovites
500 μm

103
Figure 5.53 Result of XRD analysis of sample MD6-1. I: Illite, Q: Quartz (AD: Air-dried, EG: Ethylene glycolated, 300 ºC and 500 ºC: Heated in oven (300 ºC) and
fired at 550 ºC)
Figure 5.54 Result of XRD analysis of sample MD6-12. I: Illite, Q: Quartz (AD: Air-dried, EG: Ethylene glycolated, 300 ºC and 500 ºC: Heated in oven (300 ºC) and
fired at 550 ºC)
I
I
I & Q
Q
300ºC
550ºC
AD
EG
300ºC
550ºC
AD
EG
Clay fraction
Q
I
I
I & Q
Clay fraction

104
Figure 5.55 Result of SEM/EDX analysis of MD6-1 showing illite ± kaolin (K, Al,
Si) and quartz (Si) peaks
Figure 5.56 Result of XRD analysis of sample no. MD - U.P. K: Kaolin, Q: α-Quartz (AD: Air-dried, EG: Ethylene glycolated, 300 ºC and 500 ºC: Heated in oven (300
ºC) and fired at 550 ºC)
K K
Q Q
300 ºC
550 ºC
AD
EG Clay fraction
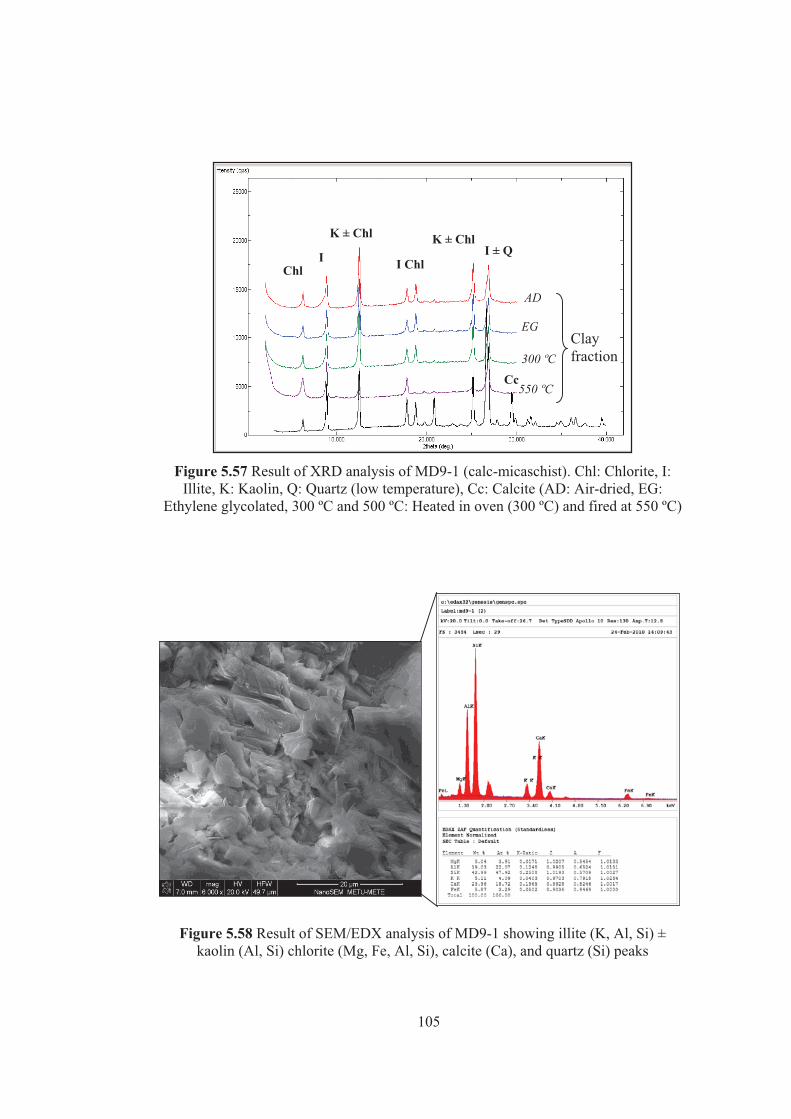
105
Figure 5.57 Result of XRD analysis of MD9-1 (calc-micaschist). Chl: Chlorite, I:
Illite, K: Kaolin, Q: Quartz (low temperature), Cc: Calcite (AD: Air-dried, EG: Ethylene glycolated, 300 ºC and 500 ºC: Heated in oven (300 ºC) and fired at 550 ºC)
Figure 5.58 Result of SEM/EDX analysis of MD9-1 showing illite (K, Al, Si) ±
kaolin (Al, Si) chlorite (Mg, Fe, Al, Si), calcite (Ca), and quartz (Si) peaks
Chl I
K ± Chl K ± Chl I ± Q
I Chl
Cc
300 ºC
550 ºC
AD
EG Clay fraction

106
The petrographic analyses of samples from the argillic alteration have revealed that it
is also accompanied by quartz crystals, fine to coarse grained and both metamorphic
and hydrothermal in nature. Quartz crystals of metamorphic origin are observed in
the least altered samples from schist, conformable with the foliation planes and
generally medium grained. The hydrothermal quartz crystals, on the other hand, are
observed in the rocks with little or no foliation plane, and their sizes change from
fine to coarse, and are associated with pyrite. Pyrites are very fine to fine grained,
euhedral to subhedral. They are generally disseminated, or observed as infilling the
fractures. They also occur as oxidized grains resulting in dark red, black colored
staining and/or bleaching (altered to goethite) (Fig. 5.59). Oxide-hydroxide staining
features-effect of supergene alteration- is observed together with the argillic products
and is especially common in the Vein #1 area. In the sections, where chlorite and
illite are detected, euhedral and medium to coarse grained calcite crystals become
dominant.
Figure 5.59 Goethite infilling the fractures, crossed-polar (Sample no.MD6-1) Gth:
Goethite, Py: Pyrite, Hem: hematite
Hem
Gth
Py

107
5.2.2.2 Silicification
Silicification is not spatially wide spread as the argillic alteration. However, it is the
main ore-bearing alteration at which past mining operations was focused. This
alteration is commonly exposed at the summit and eastern skirts of the Meydan Tepe
and Gökçekaya Tepe. Two main silicified ridges are said to be prominent in the
Meydan Tepe area, and these are almost parallel to each other. The ridges consist of
silicified breccia and massive silicification (Fig. 5.60; 5.61). The dump/tailings in
front of the galleries and trenches have shown that there are two main types of
silicification; pyrite-quartz (as massive or brecciated) and quartz-only (banded-comb
textured). The pyrite-bearing silicified rocks also exhibit ghost blades (quartz after
calcite-type or silicification after bladed calcite; Fig. 5.62).
Silicification is characterized by two distinct phases of quartz generations; as early
and late phases of silicification. Early phase silicification is identified by its clear
crosscutting relationship with the foliation planes of the micaschist. Quartz crystals
formed during this phase are characterized by colloform, comb and banded textures
(Fig. 5.63 to 5.66), typical for low sulfidation epithermal deposits. They are generally
medium to coarse grained and occasionally very fine grained truncating the
schistosity planes (Fig. 5.64). Given that pyrites and their alteration products are
limited to the hydrothermal quartz generations; early phase is accompanied with
pyrite disseminations (Fig.5.67). Late phase of silicification (Fig 5.68-5.71) is
characterized by the hydrothermally brecciated samples showing occasionally the
typical brecciation texture of jig-saw puzzle. The temporal and spatial relationships
between early and late silicification phases are illustrated in the Figure 5.67 to Figure
5.71.

108
Figure 5.60 Continuation of Vein # 1 towards NE
Figure 5.61 Vein # 2 from the northern side of Meydan Tepe
Vein # 1
North

109
Figure 5.62 Silicified bladed calcite from the silicified rocks in the Madendag
deposit
Figure 5.63 Open space filling, banded quartz (early phase silicification) within massive quartz (note relict metamorphic (Met.) rock) (Sample no. MD6-1)
Relict Met. rock

110
Figure 5.64 Banded-comb quartz formations (early phase silicification) truncating the schistosity planes (dotted lines) (Sample no. MD6-13)
Figure 5.65 Early phase silicification, banded-comb quartz vein (Sample no. MD12), form Vein #2 location

111
Figure 5.66 Crustiform - banded and comb quartz crystals, early phase silicification
(Sample no. MD6-3)
Figure 5.67 Late phase silicification truncating the pyrite (disseminated) bearing early phase silicification (Sample no. MD6-1)
Pyrites

112
Figure 5.68 Hydrothermal breccia showing the late silicification (Sample no. MD8)
from Dump # 2 sampling area
Figure 5.69 Relatively fine grained quartz crystals of late silicification phase veining banded, coarse grained early phase (Sample no. MD9-2), from Dump # 2 sampling
area
Late silicification
phase
Early silicification
phase
Late phase silicification

113
Figure 5.70 Late phase silicification, quartz breccia veining comb-banded quartz (early phase) (Sample no. MD9-2), from Dump # 2 location
Figure 5.71 Quartz breccia from the Dump # 1 area (early and late silicification phases) (Sample no. MD17A and B)
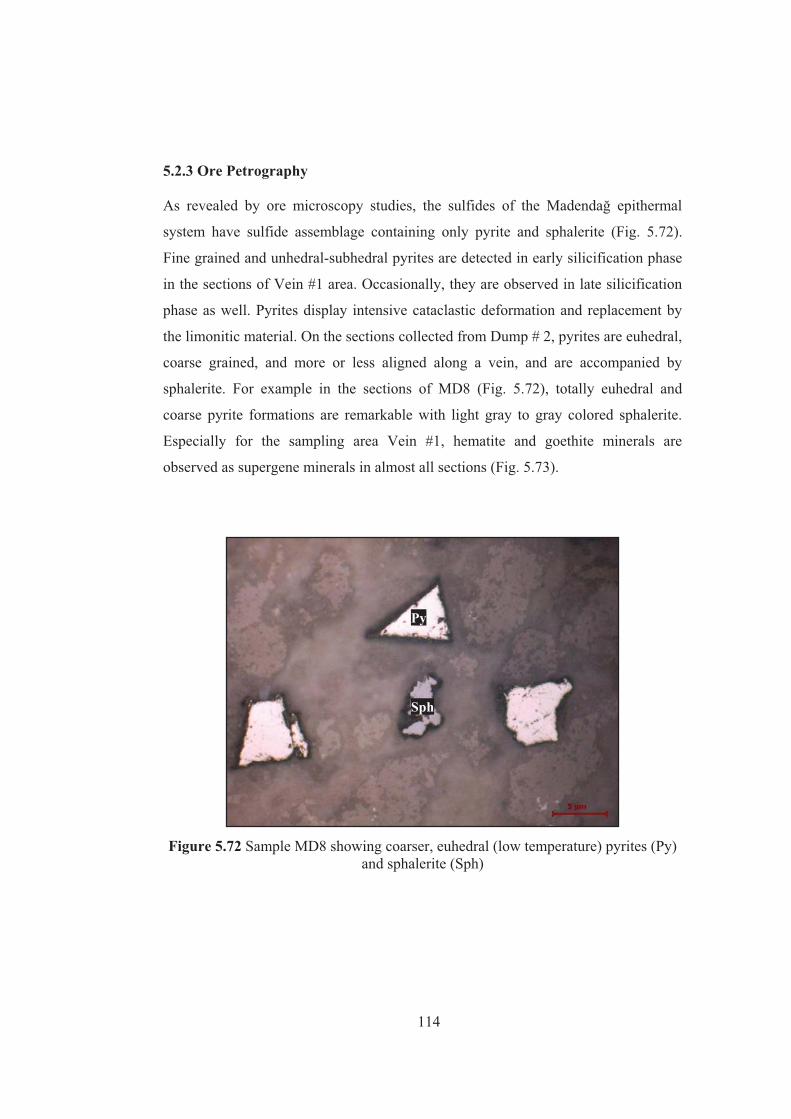
114
5.2.3 Ore Petrography As revealed by ore microscopy studies, the sulfides of the Madendağ epithermal
system have sulfide assemblage containing only pyrite and sphalerite (Fig. 5.72).
Fine grained and unhedral-subhedral pyrites are detected in early silicification phase
in the sections of Vein #1 area. Occasionally, they are observed in late silicification
phase as well. Pyrites display intensive cataclastic deformation and replacement by
the limonitic material. On the sections collected from Dump # 2, pyrites are euhedral,
coarse grained, and more or less aligned along a vein, and are accompanied by
sphalerite. For example in the sections of MD8 (Fig. 5.72), totally euhedral and
coarse pyrite formations are remarkable with light gray to gray colored sphalerite.
Especially for the sampling area Vein #1, hematite and goethite minerals are
observed as supergene minerals in almost all sections (Fig. 5.73).
Figure 5.72 Sample MD8 showing coarser, euhedral (low temperature) pyrites (Py)
and sphalerite (Sph)
Py
Sph

115
Figure 5.73 Goethite infilling the fractures, Gth: Goethite (Sample no. MD6-1)
Gth
Gth

116
CHAPTER 6
6. ORE DEPOSITS: ALTERATION GEOCHEMISTRY AND STABLE ISOTOPE COMPOSITIONS
6.1. Alteration Geochemistry
In the present study, altered rocks of the Kartaldağ and Madendağ districts, together
with the least altered magmatic and metamorphic rocks (totally 24 samples), were
analyzed for their whole rock geochemistry. The analyses were carried out at ALS
laboratories (Canada) based on the methods described in Chapter 1 (Tables 6.1 and
6.2). According to the major, trace and Rare Earth Element (REE) compositions of
the representative samples from the main alteration zones (distinguished on the basis
of alteration petrography studies), isocon diagrams (i.e. best-fit isocons) were
plotted. In the following isocon diagrams, the oxide and trace element distributions
of the protoliths hosting the Kartaldağ and Madendağ mineralization were compared
with the distributions in the altered rocks.
Best-fit isocons were plotted by using the software called Geochemical Data Toolkit
(GCDkit) 2.3 written in R language. They were constructed to estimate (and/or
calculate) the bulk gain (above the isocon) and losses (below the isocon) of the
elements associated with main alteration assemblages and are passing through the
selected immobile oxide and trace element concentrations as well as the origin. Thus,
the relative mobility (gain or loss) of an interested individual element is calculated
based on the slope of these isocons. Commonly, Al2O3, TiO2, Y, Zr, and Nb are
considered as the immobile constituents in the altered rocks (MacLean, 1990).
Although Al2O3 is selected as the immobile oxide in most hydrothermal alteration
study (MacGeehan and MacLean, 1980; Robinson, 1984), in this study, owing to the
intense argillization, TiO2 was chosen instead of Al2O3. Thus the isocons were
established and discussed based on the TiO2 concentrations.

117
6.1.1 Alteration Geochemistry of Kartaldağ Deposit
The representative samples of propylitic, quartz-kaolin, quartz-alunite-pyrophyllite
and massive silicification zones versus least altered dacite porphyry and granodiorite
of Kartaldağ mine district are listed with their whole rock geochemistry in Table 6.1.
As can be seen from Table 6.1, dacite porphyry and granodiorite have similar
geochemical compositions, suggesting a genetic relation between the two such that
the granodiorite represents the plutonic equivalent of the dacite porphyry (Fig. 6.1).
Since the dacite porphyry (not the granodiorite) is determined as the host rock for the
Kartaldağ mineralization system, KD18 was selected as the original (least altered)
rock sample for the isocon analyses despite its rather high loss on ignition value.
Figure 6.1 MORB normalized REE spider diagram showing the similarity between the samples KD25 and KD18

Tab
le 6
.1 R
epre
sent
ativ
e ch
emic
al a
naly
ses o
f alm
ost f
resh
and
alte
red
sam
ples
from
Kar
tald
ağ M
ine
Dis
trict
(oxi
des a
nd S
and
C in
wt %
, tra
ce a
nd ra
re e
arth
ele
men
ts in
ppm
) (bo
ld v
alue
s wer
e us
ed to
con
stru
ct is
ocon
dia
gram
s)
A
ltera
tion
Lea
st a
ltere
d m
agm
atic
roc
ks
Prop
yliti
c al
tera
tion
Qua
rtz-
Kao
lin
Qua
rtz
- Alu
nite
Py
roph
yllit
e M
assi
ve
silic
ifica
tion
*Met
hod
**Sa
mpl
e K
D18
K
D19
-a
KD
25
KD
26
KD
1-a
KD
1-c
KD
2 K
D3-
d K
D5-
a K
D5-
c K
D8-
c K
D9
ME-ICP06
SiO
2 62
,5
60,9
60
,6
62
64
58,9
65
,6
73,6
95
,5
66,9
48
,8
74,4
Al 2O
3 15
,2
15,2
5 16
,15
15
15,7
5 14
,65
16,5
15
,6
1,41
10
,45
11,3
15
,25
Fe2O
3 4,
2 4,
09
6,08
4,
13
4,48
4,
19
4,25
0,
8 1,
48
8,67
16
,4
2,19
CaO
3,
55
5,39
5,
6 4,
26
3,41
7,
04
0,45
0,
03
0,05
0,
02
0,03
0,
04
MgO
1,
8 1,
4 2,
43
1,29
1,
48
1,86
1,
9 0,
79
0,01
0,
01
<0,0
1 <0
,01
Na 2
O
3,01
2,
69
3,02
3,
49
3,22
2,
3 1,
97
0,05
0,
03
0,15
0,
26
0,03
K2O
1,
54
1,82
3
1,78
2,
3 1,
71
2,33
4,
49
0,06
0,
61
1,43
0,
05
Cr 2
O3
<0,0
1 <0
,01
<0,0
1 <0
,01
<0,0
1 <0
,01
0,01
<0
,01
<0,0
1 <0
,01
<0,0
1 <0
,01
TiO
2 0,
46
0,39
0,
56
0,42
0,
45
0,43
0,
45
0,49
0,
02
0,29
0,
22
0,41
MnO
0,
07
0,11
0,
13
0,09
0,
09
0,14
0,
13
0,01
<0
,01
<0,0
1 <0
,01
<0,0
1
P 2O
5 0,
31
0,27
0,
29
0,25
0,
27
0,24
0,
24
0,05
0,
21
0,19
0,
23
0,24
SrO
0,
04
0,06
0,
07
0,05
0,
06
0,05
0,
04
<0.0
1 0,
07
0,05
0,
09
0,12
BaO
0,
05
0,07
0,
07
0,05
0,
09
0,07
0,
07
0,05
0,
04
0,04
0,
08
0,05
LOI
6,31
7,
8 2,
06
6,5
2,97
7,
86
5,63
3,
45
1,34
11
,6
19,9
7,
04
Tota
l 99
10
0 10
0 99
,3
98,6
99
,4
99,6
99
,4
100
99
98,7
99
,8
*see
Cha
pter
1 fo
r det
ails
**
Sam
ples
KD
18: d
acite
por
phyr
y, K
D19
-a: g
rano
dior
ite, K
D25
: gra
nodi
orite
, KD
26: a
ltere
d gr
anod
iorit
e
118

Tab
le 6
.1 (c
ont.)
A
ltera
tion
Lea
st a
ltere
d m
agm
atic
roc
ks
Prop
yliti
c al
tera
tion
Qua
rtz-
Kao
lin
Qua
rtz
- Alu
nite
-Py
roph
yllit
e M
assi
ve
silic
ifica
tion
*Met
hod
**Sa
mpl
e K
D18
K
D19
-a
KD
25
KD
26
KD
1-a
KD
1-c
KD
2 K
D3-
d K
D5-
a K
D5-
c K
D8-
c K
D9
ME-MS81
Ba
421
524
565
412
753
599
553
415
321
299
624
399
Ce
38,2
46
,5
60,2
47
,3
49,5
49
,9
102,
5 51
,1
8,9
30,4
30
,5
50,7
Cr
10
10
10
10
10
20
10
10
20
10
10
10
Cs
4,19
7,
67
7,17
9,
51
10,1
16
,2
6,91
8,
77
0,13
0,
11
0,07
0,
09
Dy
2,4
2,59
3,
69
2,65
3,
11
2,82
2,
64
2,76
0,
18
0,37
0,
41
0,74
Er
1,43
1,
62
2,27
1,
72
1,88
1,
74
1,64
1,
75
0,05
0,
32
0,26
0,
66
Eu
0,95
0,
96
1,2
1,01
1,
12
0,98
0,
82
0,94
0,
16
0,36
0,
42
0,54
Ga
15,1
15
16
,4
14,7
15
,8
15
16,6
16
,2
7,8
43,6
33
,3
38,9
Gd
2,94
3,
22
4,66
3,
32
3,74
3,
42
3,13
3,
32
0,42
1,
4 1,
4 1,
93
Hf
3,4
3,2
3,6
3,1
3,4
3 3,
1 3,
6 <0
.2
2,3
1,8
3,1
Ho
0,5
0,55
0,
78
0,58
0,
66
0,59
0,
54
0,59
0,
03
0,08
0,
08
0,18
La
20,1
25
,8
30,8
26
,1
27,9
26
,5
21,7
29
,4
4,2
16,4
17
,3
26
Lu
0,24
0,
26
0,37
0,
3 0,
32
0,29
0,
29
0,29
<0
,01
0,08
0,
08
0,15
Nb
5,3
6,7
7,6
7,2
7,7
7,3
7,7
8,5
0,3
4,8
4 7
Nd
15,2
17
23
,6
17,6
19
,9
18,3
17
17
,5
3,5
10,9
10
,6
17,9
Pr
4,28
5,
03
6,55
5,
15
5,71
5,
36
4,86
5,
26
0,98
3,
21
3,17
5,
35
Rb
55,8
63
,3
100
67
76,7
68
,1
94
233
0,9
1,3
1,8
0,5
Sm
2,97
3,
28
4,64
3,
27
3,83
3,
58
3,19
3,
24
0,54
1,
9 1,
72
2,81
*s
ee C
hapt
er 1
for d
etai
ls
** S
ampl
es K
D18
: dac
ite p
orph
yry,
KD
19-a
: gra
nodi
orite
, KD
25: g
rano
dior
ite, K
D26
: alte
red
gran
odio
rite
119

Tab
le 6
.1 (c
ont.)
A
ltera
tion
Lea
st a
ltere
d m
agm
atic
roc
ks
Prop
yliti
c al
tera
tion
Qua
rtz-
Kao
lin
Qua
rtz
– A
luni
te
Pyro
phyl
lite
Mas
sive
si
licifi
catio
n *M
etho
d **
Sam
ple
KD
18
KD
19-a
K
D25
K
D26
K
D1-
a K
D1-
c K
D2
KD
3-d
KD
5-a
KD
5-c
KD
8-c
KD
9
ME-MS81
Sn
1 1
1 1
1 1
1 1
2 16
12
1
Sr
295
496
611
394
508
468
308
9,8
575
443
715
899
Ta
0,5
0,6
0,8
0,6
0,7
0,6
0,6
0,8
<0,1
0,
4 0,
3 0,
6
Tb
0,44
0,
47
0,68
0,
49
0,57
0,
5 0,
44
0,49
0,
06
0,11
0,
12
0,19
Th
8,8
11,1
15
,3
12
12,7
5 11
,2
12,1
5 10
,95
2,65
7,
91
7,54
12
,3
Tl
<0,5
<0
,5
0,6
0,7
0,6
<0.5
0,
7 2,
2 <0
,5
<0,5
<0
,5
<0,5
Tm
0,21
0,
25
0,35
0,
27
0,29
0,
26
0,25
0,
26
<0,0
1 0,
05
0,04
0,
12
U
2,78
2,
54
4,38
3,
87
3,62
2,
41
2,49
3,
56
0,6
2,91
2,
42
4,6
V
79
67
132
71
70
68
76
68
17
93
104
136
W
2 2
2 1
2 2
2 2
1 3
3 5
Y
13,1
14
,4
20,1
15
,4
18,3
16
11
,8
15,5
0,
5 2
1,9
4,2
Yb
1,4
1,61
2,
16
1,85
1,
89
1,72
1,
8 1,
73
0,03
0,
48
0,37
0,
94
Zr
131
124
134
118
134
118
124
143
4 90
72
12
6
ME-MS42
As
2,8
1,1
11
3,6
1,1
1,3
17,9
47
,2
44
22,5
21
3 45
,4
Bi
0,16
0,
33
0,13
0,
07
0,02
0,
03
0,06
0,
27
4,99
4,
76
31,8
2,
83
Hg
<0,0
05
<0,0
05
0,00
5 0,
006
<0,0
05
<0,0
05
0,01
1 0,
009
1,18
0,
072
0,06
2 0,
379
Sb
0,22
0,
11
0,32
0,
25
0,14
0,
27
0,65
1,
74
3,42
6,
65
24,2
12
,9
Se
0,3
0,3
0,3
0,5
0,3
0,3
0,4
1,1
22,1
6,
8 71
,9
12,3
*s
ee C
hapt
er 1
for d
etai
ls
** S
ampl
es K
D18
: dac
ite p
orph
yry,
KD
19-a
: gra
nodi
orite
, KD
25: g
rano
dior
ite, K
D26
: alte
red
gran
odio
rite
120

Tab
le 6
.1 (c
ont.)
A
ltera
tion
Lea
st a
ltere
d m
agm
atic
roc
ks
Prop
yliti
c al
tera
tion
Qua
rtz-
Kao
lin
Qua
rtz
– A
luni
te
Pyro
phyl
lite
Mas
sive
si
licifi
catio
n *M
etho
d **
Sam
ple
KD
18
KD
19-a
K
D25
K
D26
K
D1-
a K
D1-
c K
D2
KD
3-d
KD
5-a
KD
5-c
KD
8-c
KD
9
Te
0,02
0,
03
0,03
0,
04
0,03
0,
04
0,05
0,
17
2,45
1,
06
4,81
2,
6 C
-IR
07
C
0,72
1,
14
0,12
0,
87
0,3
1,18
<0
.01
<0.0
1 <0
.01
<0.0
1 <0
.01
0,01
C-I
R08
S
0,02
0,
01
0,05
0,
01
<0.0
1 <0
.01
0,02
0,
01
0,32
7,
93
16,2
5 0,
16
ME-4ACD81
Ag
<0,5
<0
,5
<0,5
<0
,5
<0,5
<0
,5
<0,5
<0
,5
10,1
1,
5 5,
3 13
,3
Cd
<0,5
<0
,5
<0,5
<0
,5
<0,5
<0
,5
<0,5
<0
,5
<0,5
<0
,5
<0,5
<0
,5
Co
8 6
12
6 7
8 10
1
3 16
25
<1
Cu
1 10
21
11
9
7 15
6
22
270
737
26
Mo
<1
<1
<1
<1
<1
<1
<1
<1
2 <1
<1
<1
Ni
7 3
3 1
5 4
25
<1
7 32
80
<1
Pb
17
18
19
16
16
13
14
11
859
428
1120
55
5
Zn
55
51
62
57
63
55
85
8 4
6 9
<2
*see
Cha
pter
1 fo
r det
ails
**
Sam
ples
KD
18: d
acite
por
phyr
y, K
D19
-a: g
rano
dior
ite, K
D25
: gra
nodi
orite
, KD
26: a
ltere
d gr
anod
iorit
e
121

122
6.1.1.1 Element Mobility during Propylitic Alteration of Dacite Porphyry
Based on their petrographic properties, three samples were selected as the
representative samples of the propylitic zone (sample no. KD1-a, KD1-c, KD2). The
element mobility is examined via the isocon diagrams (Fig.6.2) and the gains and
losses of the elements are summarized in Table 6.2.
Regarding the isocon diagrams, a value of about 93%-98% for the slope implies
almost no total mass change in the rock. The feature most apparent from the isocon
diagrams (Fig. 6.2) and Table 6.2 is the enrichment of all the samples in K2O and
MnO, and in Ba and Rb which are the trace elements associated with K (due to their
similar ionic properties). The K-enrichment seems to correlate with the presence of
illite in these samples (as revealed by alteration petrography studies-Chapter 5) and
is likely to reflect the influence of illite dominated argillic alteration zone
neighboring the propylitic zone. Regarding the MgO, FeOt, CaO and NaO, which are
supposed to be typically increasing for propylitic alteration, the observations from
Fig. 6.2 and their relevant interpretations are as follows:
i) MgO shows slight enrichment in samples KD1-c and KD2, but depletion in sample
KD-1a. FeOt, like MgO, show enrichment in two samples (KD1-a and KD2). The
increase in MgO in sample KD2, accompanied by an increase in FeOt, seems to
correlate with the presence of chlorite-smectite mixed layered clay mineral in this
sample as detected by XRD studies (see Chapter 5).
ii) CaO is enriched in KD1-c, while depleted in KD2. Enrichment in KD1-c seems to
be conformable with the mineral assemblage of propylitic zone (Chapter 5) and is
also likely to have been caused by late calcite formation (commonly in the form of
veining) overprinting the propylitic alteration, as observed petrographically in this
sample, while the depletion in KD2 might be the result of leaching of Ca from the
breakdown of the Ca-rich minerals like hornblende in the protolith.
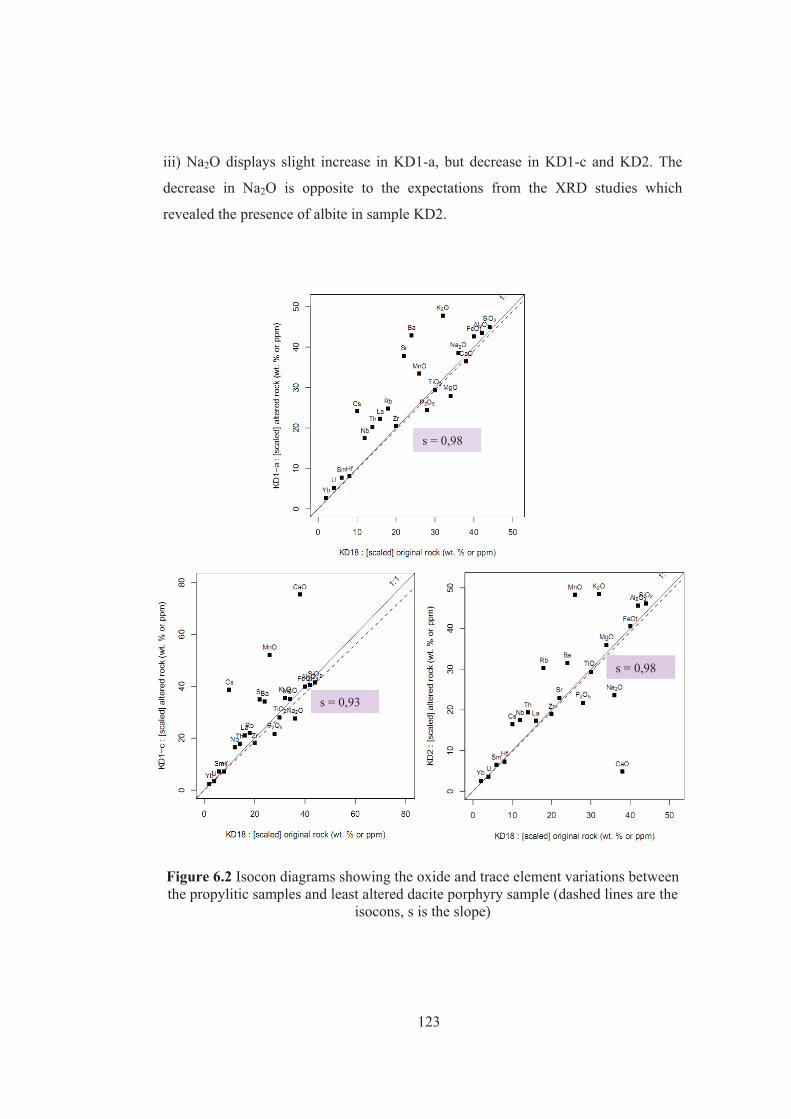
123
iii) Na2O displays slight increase in KD1-a, but decrease in KD1-c and KD2. The
decrease in Na2O is opposite to the expectations from the XRD studies which
revealed the presence of albite in sample KD2.
Figure 6.2 Isocon diagrams showing the oxide and trace element variations between the propylitic samples and least altered dacite porphyry sample (dashed lines are the
isocons, s is the slope)
s = 0,98
s = 0,93
s = 0,98
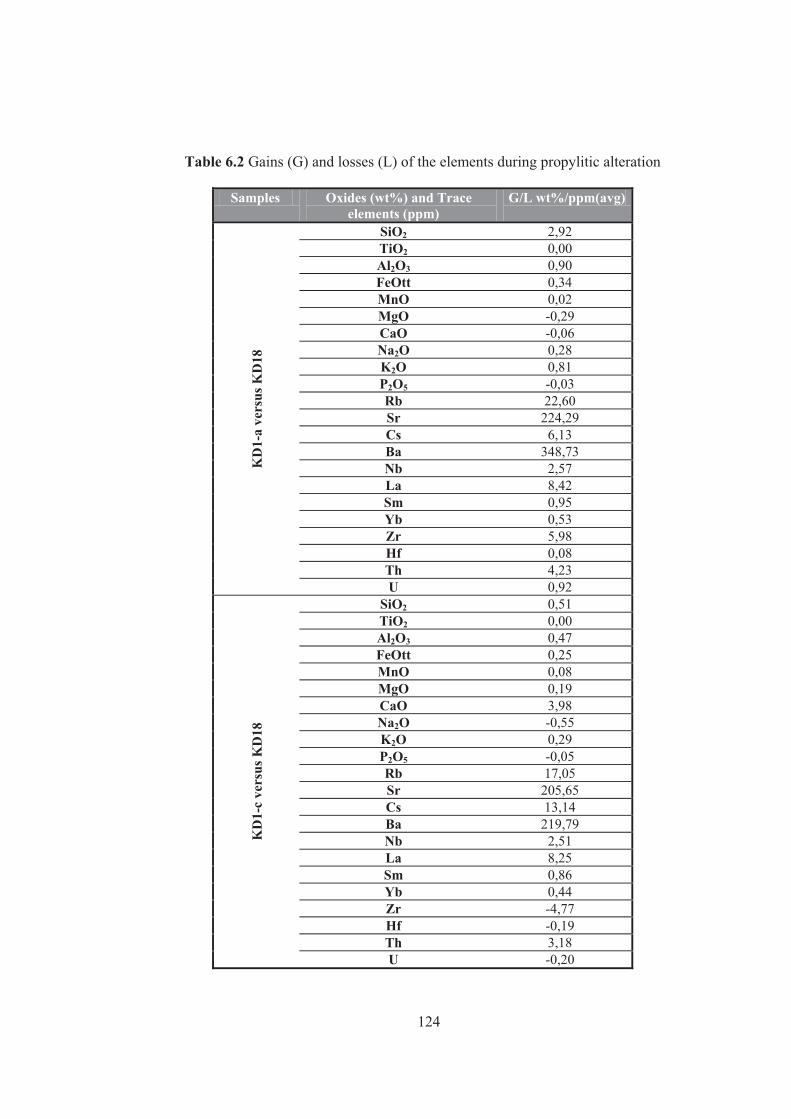
124
Table 6.2 Gains (G) and losses (L) of the elements during propylitic alteration
Samples Oxides (wt%) and Trace elements (ppm)
G/L wt%/ppm(avg)
KD
1-a
vers
us K
D18
SiO2 2,92 TiO2 0,00 Al2O3 0,90 FeOtt 0,34 MnO 0,02 MgO -0,29 CaO -0,06 Na2O 0,28 K2O 0,81 P2O5 -0,03 Rb 22,60 Sr 224,29 Cs 6,13 Ba 348,73 Nb 2,57 La 8,42 Sm 0,95 Yb 0,53 Zr 5,98 Hf 0,08 Th 4,23 U 0,92
KD
1-c
vers
us K
D18
SiO2 0,51 TiO2 0,00 Al2O3 0,47 FeOtt 0,25 MnO 0,08 MgO 0,19 CaO 3,98 Na2O -0,55 K2O 0,29 P2O5 -0,05 Rb 17,05 Sr 205,65 Cs 13,14 Ba 219,79 Nb 2,51 La 8,25 Sm 0,86 Yb 0,44 Zr -4,77 Hf -0,19 Th 3,18 U -0,20

125
Table 6.2 (cont.)
6.1.1.2 Element Mobility during Quartz - Kaolin and Quartz -Alunite- Pyrophyllite Alterations Quartz-kaolin zone is represented by sample KD3-d and quartz -alunite- pyrophyllite
zone by KD-5a, KD-5c and KD-8c (Table 6.1). According to the isocon (KD3-d
versus KD18) diagram (Fig. 6.3, A) constructed for the quartz-kaolin zone, a slope
about 1, 07 suggest a slight increase in the total mass of the rock. It is clearly seen
that the SiO2 and K2O are the oxides enriched in the altered sample conformable with
the findings (quartz and illite) from XRD and EDX studies. Since gained oxides
suggest the presence of the alteration minerals like illite (K2O) and quartz (SiO2),
mostly, “quartz-kaolin” term used for this alteration may be changed into the quartz-
kaolin-illite zone. Depletion in MnO, P2O5, MgO, FeOt, CaO, and Na2O, compared
with the least altered sample (KD-18), confirms the replacement of the minerals of
Samples Oxides (wt%) and Trace elements (ppm)
G/L wt%/ppm(avg)
KD
2 ve
rsus
KD
18
SiO2 4,56 TiO2 0,00 Al2O3 1,67 FeOtt 0,13 MnO 0,06 MgO 0,14 CaO -3,09 Na2O -1,00 K2O 0,84 P2O5 -0,06 Rb 40,29 Sr 19,84 Cs 2,87 Ba 144,29 Nb 2,57 La 2,08 Sm 0,29 Yb 0,44 Zr -4,24 Hf -0,23 Th 3,62 U -0,23

126
plagioclase and hornblende by the clay minerals. In the case of the trace element
distributions, Rb, Cs, Nd, La, and Th are the gained elements, whereas Sr and Ba
comprise the depleted elements during the quartz-kaolin alteration.
Regarding the quartz -alunite- pyrophyllite alteration, the slopes of isocons (Fig. 6.3
B, C, and D), ranging between 4 % and 63 %, point to significant loss in the total
mass of the rock during alteration. Enrichment in SiO2, P2O5, FeOt, and Al2O3, along
with Sr and Ba, suggests that the the zone of alteration is dominated by quartz and
aluminum silicates (e.g. kaolinite and pyrophyllite). Furthermore, the considerably
high S content in sample KD5-c and KD-8c (Table 6.1), is in conformity with the
presence of alunite (as well as pyrite, covellite and sphalerite) as determined by
petrographic studies. The comparatively higher S, Cu, FeOt and Al2O3
concentrations in sample KD-5c and KD-8c (compared to KD-5a) can be attributed
to the relatively higher amounts of covellite (CuS), pyrite (FeS2), kaolin (mostly
kaolinite) and the sulfates (e.g. alunite) in these samples.
A summary of the gains and losses of the elements during these alterations (quartz -
alunite- pyrophyllite and kaolin) is given in Table 6.3.

127
Figure 6.3 Isocon diagrams showing the oxide and trace element variations of the samples from (A) quartz- kaolin (Sample no. KD3-d) and (B, C, and D) pyrophyllite-
alunite-quartz zone (Sample no. KD5-a, KD5-c, and KD8-c) (dashed lines are the isocons, s is the slope)
B
C D
A
s = 1, 07
s = 0,04
s = 0,63
s = 0,48

128
Table 6.3 Gain (G) and losses (L) of the elements during Quartz-Kaolin (sample no. KD3-d) and Pyrophyllite-Alunite-Quartz (samples no. KD5-a, 5-c, and 8-c)
alterations Samples Oxides (wt%) and Trace
elements (ppm) G/L wt%/ppm(avg)
KD
3-d
vers
us K
D18
SiO2 6.59 TiO2 0.00 Al2O3 -0.56 FeOtt -3.10 MnO NA MgO -1.06 CaO -3.52 Na2O -2.96 K2O 2.68 P2O5 -0.26 Rb 162.93 Sr -285.80 Cs 4.04 Ba -31.41 Nb 2.68 La 7.50 Sm 0.07 Yb 0.22 Zr 3.24 Hf NA Th 1.48 U 0.56
KD
5-a
vers
us K
D18
SiO2 2134.00 TiO2 0.00 Al2O3 17.23 FeOtt 26.85 MnO NA MgO -1.57 CaO -2.40 Na2O -2.32 K2O -0.16 P2O5 4.52 Rb -35.10 Sr 12930.00 Cs -1.20 Ba 6962.00 Nb 1.60 La 76.50 Sm 76.50 Yb -0.71 Zr -39.00 Hf NA Th 52.15 U 11.02

129
Table 6.3 (cont.)
Samples Oxides (wt%) and Trace elements (ppm)
G/L wt%/ppm(avg)
KD
5-c
vers
us K
D18
SiO2 43.62 TiO2 0.00 Al2O3 1.38 FeOtt 8.60 MnO NA MgO -1.78 CaO -3.52 Na2O -2.77 K2O -0.57 P2O5 -0.01 Rb -53.74 Sr 407.69 Cs -4.02 Ba 53.28 Nb 2.31 La 5.91 Sm 0.04 Yb -0.64 Zr 11.76 Hf NA Th 3.75 U 1.84
KD
8-c
vers
us K
D18
SiO2 39.54 TiO2 0.00 Al2O3 8.43 FeOtt 27.08 MnO NA MgO -1.78 CaO -3.49 Na2O -2.47 K2O 1.45 P2O5 0.17 Rb -52.04 Sr 1200.00 Cs -4.04 Ba 883.73 Nb 03.06 La 16.07 Sm 0.63 Yb -0.63 Zr 19.55 Hf NA Th 6.97 U 2.28

130
6.1.2 Alteration Geochemistry of Madendağ Deposit In the Madendağ district, altered rocks can be broadly grouped into two as silicified
and argillized (illite dominated) rocks. Almost fresh and least altered host rocks of
the Madendağ mineralization are listed in the Table 6.4 with their altered
counterparts. To estimate the element mobility during the argillization and
silicification of the host rock -calc-micaschist (sample no. MD9-1) -representative
samples for the related alteration zones were selected and their relationship was
discussed by using isocon diagrams as in the case of Kartaldağ. Especially the
samples of the Vein # 1 (sample no. MD6-1, 6-4, 6-8, and 6-14) and of the Vein #2
(MD12 and MD13) were presumed to be the precursor samples for the isocon
analyses to gather the elemental transition from the argillized micaschist to the quartz
veins truncating micaschist.
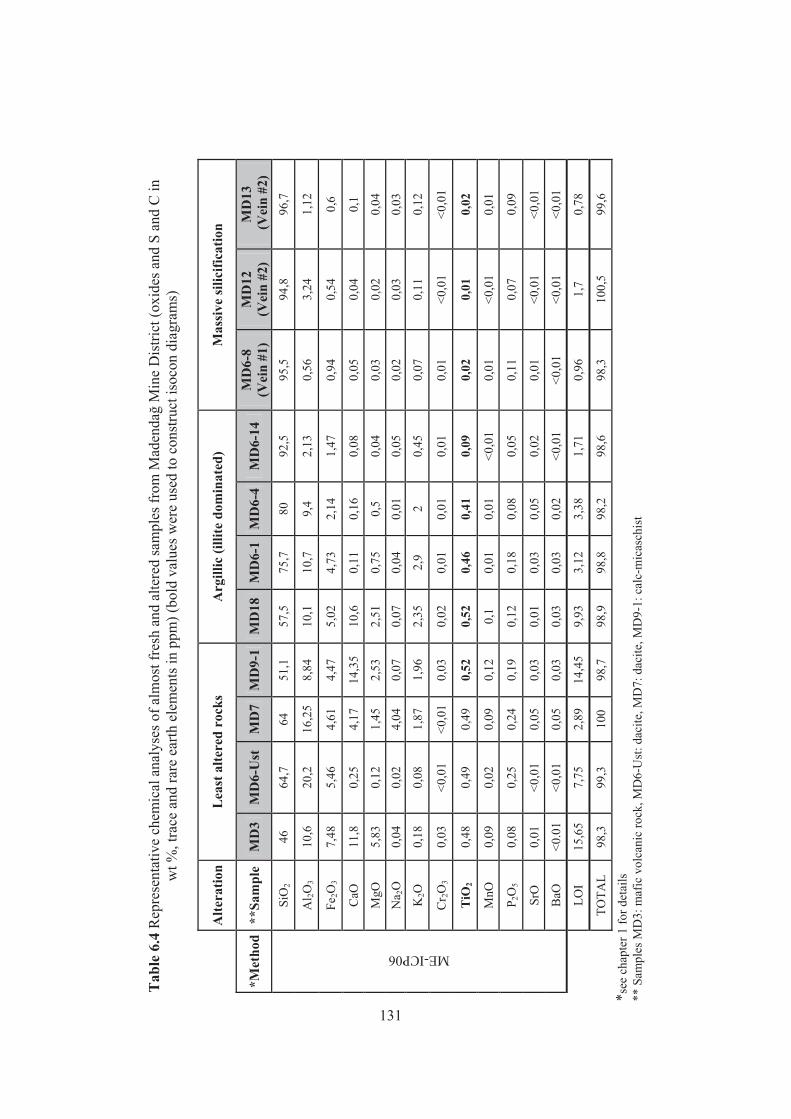
Tab
le 6
.4 R
epre
sent
ativ
e ch
emic
al a
naly
ses o
f alm
ost f
resh
and
alte
red
sam
ples
from
Mad
enda
ğ M
ine
Dis
trict
(oxi
des a
nd S
and
C in
w
t %, t
race
and
rare
ear
th e
lem
ents
in p
pm) (
bold
val
ues w
ere
used
to c
onst
ruct
isoc
on d
iagr
ams)
A
ltera
tion
Lea
st a
ltere
d ro
cks
Arg
illic
(illi
te d
omin
ated
) M
assi
ve si
licifi
catio
n
*Met
hod
**Sa
mpl
e M
D3
MD
6-U
st
MD
7 M
D9-
1 M
D18
M
D6-
1 M
D6-
4 M
D6-
14
MD
6-8
(Vei
n #1
) M
D12
(V
ein
#2)
MD
13
(Vei
n #2
)
ME-ICP06
SiO
2 46
64
,7
64
51,1
57
,5
75,7
80
92
,5
95,5
94
,8
96,7
Al 2O
3 10
,6
20,2
16
,25
8,84
10
,1
10,7
9,
4 2,
13
0,56
3,
24
1,12
Fe2O
3 7,
48
5,46
4,
61
4,47
5,
02
4,73
2,
14
1,47
0,
94
0,54
0,
6
CaO
11
,8
0,25
4,
17
14,3
5 10
,6
0,11
0,
16
0,08
0,
05
0,04
0,
1
MgO
5,
83
0,12
1,
45
2,53
2,
51
0,75
0,
5 0,
04
0,03
0,
02
0,04
N
a 2O
0,
04
0,02
4,
04
0,07
0,
07
0,04
0,
01
0,05
0,
02
0,03
0,
03
K2O
0,
18
0,08
1,
87
1,96
2,
35
2,9
2 0,
45
0,07
0,
11
0,12
Cr 2
O3
0,03
<0
,01
<0,0
1 0,
03
0,02
0,
01
0,01
0,
01
0,01
<0
,01
<0,0
1
TiO
2 0,
48
0,49
0,
49
0,52
0,
52
0,46
0,
41
0,09
0,
02
0,01
0,
02
MnO
0,
09
0,02
0,
09
0,12
0,
1 0,
01
0,01
<0
,01
0,01
<0
,01
0,01
P 2O
5 0,
08
0,25
0,
24
0,19
0,
12
0,18
0,
08
0,05
0,
11
0,07
0,
09
SrO
0,
01
<0,0
1 0,
05
0,03
0,
01
0,03
0,
05
0,02
0,
01
<0,0
1 <0
,01
BaO
<0
.01
<0,0
1 0,
05
0,03
0,
03
0,03
0,
02
<0,0
1 <0
,01
<0,0
1 <0
,01
LO
I 15
,65
7,75
2,
89
14,4
5 9,
93
3,12
3,
38
1,71
0,
96
1,7
0,78
TOTA
L 98
,3
99,3
10
0 98
,7
98,9
98
,8
98,2
98
,6
98,3
10
0,5
99,6
*see
cha
pter
1 fo
r det
ails
**
Sam
ples
MD
3: m
afic
vol
cani
c ro
ck, M
D6-
Ust
: dac
ite, M
D7:
dac
ite, M
D9-
1: c
alc-
mic
asch
ist
131

Tab
le 6
.4 (c
ont.)
A
ltera
tion
Lea
st a
ltere
d ro
cks
Arg
illic
(illi
te d
omin
ated
) M
assi
ve si
licifi
catio
n
*Met
hod
**Sa
mpl
e M
D3
MD
6-U
st
MD
7 M
D9-
1 M
D18
M
D6-
1 M
D6-
4 M
D6-
14
MD
6-8
(Vei
n #1
) M
D12
(V
ein
#2)
MD
13
(Vei
n #2
)
ME-MS81
Ba
23,2
12
,3
403
248
287
221
135,
5 43
,3
29,1
16
,6
12,6
Ce
16,4
20
,4
40,5
46
,5
47
42,1
50
,5
11,5
1,
4 1,
5 6,
7
Cr
180
30
20
190
150
70
80
50
50
20
20
Cs
1,5
1,21
2,
45
6,64
6,
68
15,7
5 13
,4
2,76
4,
77
4,47
4,
71
Dy
2,31
1,
58
2,58
3,
63
3,2
2,76
2,
81
1,12
0,
11
0,2
0,26
Er
1,39
0,
93
1,51
2,
09
1,8
1,73
1,
88
0,59
0,
08
0,13
0,
13
Eu
0,64
0,
37
0,96
0,
98
0,97
0,
86
0,69
0,
23
0,06
0,
05
0,19
Ga
9 19
,5
16
11,8
13
,5
16
12
2,4
1,2
1,8
1,2
Gd
2,23
1,
62
3,07
4,
11
4,16
3,
34
3,15
1,
03
0,1
0,13
0,
57
Hf
1,2
4,5
3,2
2,6
2,6
3,5
3,3
0,6
<0.2
<0
.2
0,2
Ho
0,51
0,
32
0,54
0,
76
0,64
0,
59
0,62
0,
21
0,02
0,
04
0,04
La
7,7
7,8
21,4
24
,4
25,4
21
,3
26,8
5
0,7
0,8
3,4
Lu
0,2
0,18
0,
25
0,3
0,3
0,26
0,
27
0,07
0,
01
0,02
0,
01
Nb
2,4
7,1
5,6
9,4
9,3
10,5
9,
8 2
1,5
0,3
0,4
Nd
8,6
8,3
15,8
20
,3
21,1
19
18
,1
5,8
0,6
0,6
3
Pr
2,1
2,26
4,
55
5,59
5,
7 4,
87
5,37
1,
57
0,18
0,
16
0,82
Rb
6,8
2,9
60,9
86
,4
99,3
17
1,5
111
10,6
4,
7 5,
9 7,
9
Sm
2,06
1,
65
3,05
4,
24
4,17
3,
75
3,25
1,
04
0,11
0,
16
0,64
*see
cha
pter
1 fo
r det
ails
**
Sam
ples
MD
3: m
afic
vol
cani
c ro
ck, M
D6-
Ust
: dac
ite, M
D7:
dac
ite, M
D9-
1: c
alc-
mic
asch
ist
132

Tab
le 6
.4 (c
ont.)
A
ltera
tion
Lea
st a
ltere
d ro
cks
Arg
illic
(illi
te d
omin
ated
) M
assi
ve si
licifi
catio
n
*Met
hod
**Sa
mpl
e M
D3
MD
6-U
st
MD
7 M
D9-
1 M
D18
M
D6-
1 M
D6-
4 M
D6-
14
MD
6-8
(Vei
n #1
) M
D12
(V
ein
#2)
MD
13
(Vei
n #2
)
ME-MS81
Sn
1 1
1 2
2 2
2 2
<1
<1
<1
Sr
57,1
11
,9
388
240
42,8
25
2 43
8 14
1,5
45,1
17
,6
8,1
Ta
0,2
0,6
0,5
0,7
0,8
0,8
0,7
0,1
0,1
<0.1
<0
.1
Tb
0,38
0,
28
0,47
0,
63
0,59
0,
51
0,49
0,
19
0,02
0,
03
0,07
Th
1,91
7,
91
9,39
7,
46
8,08
4,
61
7,55
3,
16
0,18
0,
25
0,36
Tl
<0,5
<0
,5
<0,5
0,
6 0,
6 1,
6 1,
3 0,
8 <0
,5
<0,5
<0
,5
Tm
0,2
0,14
0,
23
0,33
0,
28
0,27
0,
27
0,07
0,
01
0,01
<0
,01
U
0,88
1,
59
2,71
1,
28
1,21
1,
64
1,36
0,
41
0,09
0,
07
0,3
V
148
58
75
66
77
72
49
14
<5
5 8
W
4 4
1 2
1 28
7
1 2
<1
1
Y
11,6
8,
4 13
,3
19,9
16
,9
15,2
16
,2
5,4
0,6
1,3
1,2
Yb
1,25
1,
04
1,52
1,
86
1,85
1,
71
1,68
0,
43
0,07
0,
12
0,09
Zr
42
177
130
99
98
138
133
25
6 4
9
ME-MS42
As
59,1
14
,1
4,7
55,6
69
,5
88,7
9,
9 14
1 14
0 25
,5
11,6
Bi
0,03
0,
15
0,03
0,
3 0,
25
0,37
0,
11
1,38
0,
18
0,23
0,
11
Hg
0,15
2 0,
007
<0,0
05
0,00
5 0,
005
0,06
5 0,
029
0,15
2 0,
975
0,06
2 0,
023
Sb
0,93
9,
04
0,51
0,
97
0,85
22
,2
5,67
44
,9
22,3
16
,5
2,99
Se
2,4
<0.2
0,
4 0,
4 0,
4 3,
5 0,
6 7,
1 4,
7 0,
2 0,
2
Te
0,99
<0
.01
0,05
0,
16
0,11
0,
21
0,1
0,65
1,
6 3,
1 2,
21
*see
cha
pter
1 fo
r det
ails
**
Sam
ples
MD
3: m
afic
vol
cani
c ro
ck, M
D6-
Ust
: dac
ite, M
D7:
dac
ite, M
D9-
1: c
alc-
mic
asch
ist
133

Tab
le 6
.4 (c
ont.)
A
ltera
tion
Lea
st a
ltere
d ro
cks
Arg
illic
(illi
te d
omin
ated
) M
assi
ve si
licifi
catio
n
*Met
hod
**Sa
mpl
e M
D3
MD
6-U
st
MD
7 M
D9-
1 M
D18
M
D6-
1 M
D6-
4 M
D6-
14
MD
6-8
(Vei
n #1
) M
D12
(V
ein
#2)
MD
13
(Vei
n #2
) C
-IR
07
C
4,43
0,
01
<0.0
1 3,
37
2,41
0,
02
0,05
0,
02
0,01
0,
01
0,05
C-I
R08
S
3,64
0,
02
<0,0
1 0,
01
<0,0
1 0,
02
0,05
0,
49
0,13
<0
,01
<0,0
1
ME-4ACD81
Ag
<0,5
<0
,5
<0,5
<0
,5
<0,5
1,
9 <0
,5
3 8
1,6
0,8
Cd
<0,5
<0
,5
<0,5
<0
,5
<0,5
<0
,5
<0,5
<0
,5
<0,5
<0
,5
<0,5
Co
25
3 9
18
20
1 1
3 1
1 1
Cu
45
9 16
41
46
17
24
33
8
14
4
Mo
<1
1 <1
<1
<1
24
2
237
13
5 3
Ni
63
8 10
16
3 11
6 10
9
6 5
4 4
Pb
<2
9 17
7
12
56
53
776
8 7
7
Zn
29
26
60
82
76
12
19
8 11
8
6 *s
ee c
hapt
er 1
for d
etai
ls
** S
ampl
es M
D3:
maf
ic v
olca
nic
rock
, MD
6-U
st: d
acite
, MD
7: d
acite
, MD
9-1:
cal
c-m
icas
chis
t
134

135
6.1.2.1 Element Mobility during Argillic (Illite Dominated) Alteration of the Micaschist
Sample no. MD6-1, MD6-4, MD18 and MD6-14 are used as the representative
samples of the argillized zone to construct the isocon diagrams (Fig. 6.4) against the
least altered (host) micaschist, MD9-1. In the sample MD6-1, there is depletion in
Na2O, MnO, MgO, CaO with Th, and enrichment in SiO2, K2O, Al2O3, FeOt, and all
other trace elements, which in turn represent the enrichment in illite, quartz, and
pyrite, while the leaching of the depleted elements (Ca, Mg, Na, Mn, P) as a result of
breakdown of the respective mineral phases (calcite, chlorite, plagioclase) in the
micaschist. In the sample MD6-4 in addition to the depleted elements in MD6-1,
P2O5, FeOt, and Ba contents are also decreasing. The relative concentration
similarity (slope = 1) between the sample MD18 and MD9-1 is because MD18 is
least altered compared to other samples; it is slightly enriched in K2O, FeOt, Al2O3,
SiO2, Ba, and Rb and depleted in P2O5, CaO, and Sr. In the sample MD6-14, in
which silicification is more abundant, SiO2 constituent is more enriched compared
with other oxides. It is depleted only in MgO and CaO suggesting the leaching of
these elements due to the breakdown of the schist composition (biotite, chlorite, and
calcite).
A summary of the gains and losses of the elements during argillic alteration is
presented in Table 6.5.

136
Figure 6.4 Isocon diagrams showing the oxide and trace element variations of argillized (illite dominated) samples with respect to calc-micaschist host rock
(dashed lines are the isocons, s is the slope)
s = 0,88 s = 0,79
s = 1,00
s = 0,17

137
Table 6.5 Gain (G) and losses (L) of the elements during argillic alteration (sample no. MD6-1, MD18, MD6-4, and MD6-14)
Samples Oxides (wt%) and Trace
elements (ppm) G/L wt%/ppm(avg)
MD
6-1
vers
us M
D9-
1 SiO2 34.47 TiO2 0.00 Al2O3 3.26 FeOt 0.79 MnO -0.11 MgO -1.68 CaO -14.23 Na2O -0.02 K2O 1.32 P2O5 0.01 Rb 107.47 Sr 44.87 Cs 11.16 Ba 1.83 Nb 2.47 La -0.32 Sm 0.00 Yb 0.07 Zr 57.00 Hf 1.36 Th -2.25 U 0.57
MD
6-4
vers
us M
D9-
1
SiO2 50.36 TiO2 0.00 Al2O3 3.08 FeOt -1.58 MnO -0.11 MgO -1.90 CaO -14.15 Na2O -0.06 K2O 0.58 P2O5 -0.09 Rb 54.38 Sr 315.51 Cs 10.36 Ba -76.15 Nb 3.03 La 9.59 Sm -0.12 Yb 0.27 Zr 69.68 Hf 1.59 Th 2.12 U 0.44

138
Table 6.5 (cont.)
Samples Oxides (wt%) and Trace elements (ppm)
G/L wt%/ppm(avg)
MD
18 v
ersu
s MD
9-1
SiO2 6.40 TiO2 0.00 Al2O3 1.26 FeOt 0.49 MnO NA MgO -0.02 CaO -3.75 Na2O 0.00 K2O 0.39 P2O5 -0.07 Rb 12.90 Sr -197.20 Cs 0.04 Ba 39.00 Nb -0.10 La 1.00 Sm -0.07 Yb -0.01 Zr -1.00 Hf NA Th 0.62 U -0.07
MD
6-14
ver
sus M
D9-
1
SiO2 483.34 TiO2 0.00 Al2O3 3.47 FeOt 3.62 MnO NA MgO -2.30 CaO -13.89 Na2O 0.22 K2O 0.64 P2O5 0.10 Rb -25.16 Sr 577.56 Cs 9.31 Ba 2.18 Nb 2.16 La 4.49 Sm 1.77 Yb 0.62 Zr 45.44 Hf NA Th 10.80 U 1.09

139
6.1.2.2 Element Mobility during Silicic Alteration (Silicification) of the Micaschist Silicified samples in the Vein #1 (sample no. MD6-8) and Vein #2 (MD12 and
MD13) were used to plot the isocon diagrams (Fig. 6.5) against the micaschist host.
The considerably small values of the isocon slopes suggest significant loss in the
total mass of the rock (see Table 6.6 for gains and losses of elements). SiO2 is the
most enriched constituent in all samples (MD6-8, 12, and 13) as predictable. With
the exception of a slight depletion in CaO, all the other oxides and trace elements are
enriched in the silicified zone.
Figure 6.5 Isocon diagrams showing the oxide and trace element variations of argillized (illite dominated) samples with respect to calc-micaschist host rock
(Samples from Vein #1 area, dashed lines are the isocons, s is the slope)
s = 0,04 s = 0,02
s = 0,04

140
Table 6.6 Gain (G) and losses (L) of the elements during silicic alteration (sample no. MD6-8, MD12, and MD13)
Samples Oxides (wt%) and Trace
elements (ppm) G/L wt%/ppm(avg)
MD
6-8
vers
us M
D9-
1 SiO2 2431.90 TiO2 0.00 Al2O3 5.72 FeOt 17.97 MnO NA MgO -1.75 CaO -13.05 Na2O 0.45 K2O -0.14 P2O5 2.67 Rb 35.80 Sr 932.60 Cs 117.38 Ba 508.60 Nb 29.60 La -6.20 Sm -1.38 Yb -0.04 Zr 57.00 Hf NA Th -2.78 U 1.06
MD
12 v
ersu
s MD
9-1
SiO2 4878.50 TiO2 0.00 Al2O3 159.64 FeOt 21.24 MnO NA MgO -1.49 CaO -12.27 Na2O 1.49 K2O 3.76 P2O5 3.45 Rb 220.40 Sr 675.20 Cs 225.80 Ba 615.20 Nb 6.20 La 17.20 Sm 4.08 Yb 4.38 Zr 109.00 Hf NA Th 5.54 U 2.36

141
Table 6.6 (cont.) 6.2 Stable Isotope Compositions
Stable isotope studies in the epithermal deposits commonly focus on the oxygen (O),
hydrogen (H), and sulfur (S) isotopes because of the abundance of these constituents in
such systems. Based on the compositions, the hydrothermal activities affecting the
development of the related deposits are traced and modeled. To determine the source
regions of aqueous and gaseous constituents in the mineralizing fluid and to estimate the
paleohydrology, S and C isotopes, which are consistent with the magmatic origin, and H
and O isotopes are used to interpret the water compositions, so the source characteristics
(Cooke and Simmons, 2000). Commonly, oxygen in quartz, adularia, alunite, sericite,
Samples Oxides (wt%) and Trace elements (ppm)
G/L wt%/ppm(avg) M
D13
ver
sus M
D9-
1
SiO2 2463.10 TiO2 0.00 Al2O3 20.28 FeOt 10.01 MnO NA MgO -1.49 CaO -11.75 Na2O 0.71 K2O 1.16 P2O5 2.15 Rb 119.00 Sr -29.40 Cs 115.82 Ba 79.60 Nb 1.00 La 64.00 Sm 12.40 Yb 0.48 Zr 135.00 Hf NA Th 1.90 U 6.52

142
calcite, and clay minerals, S in pyrite and related sulfosalts and sulfides, and C in
carbonates are chosen as the main concern for the stable isotope studies.
In this study, the oxygen isotope analyses were conducted on quartz separates collected
from silicified zones for both areas. The sulfur isotopic composition is limited to a single
composite (pyrite) sample representing mixture of KD5-c and KD8-b from Kartaldağ
area. In Madendağ area, since all the pyrite separates (hand-picked under the
microscope) were including and/or turned totally to goethite, suitable sample could not
be found for S-isotope analysis. Table 6.7 summarizes the results of stable isotope
analyses for both areas.
Table 6.7 Representative oxygen and sulfur isotope analyses results of the silicified samples from Madendağ and Kartaldağ mine districts
District Sample Mineral δ18O (*SMOW) Silicification stage
δ34S (**V-CDT)
Mad
enda
ğ
MD6-2 Quartz 9,55 Early -
MD10 Quartz 13,00 Early -
MD8 Quartz 18,19 Late -
MD6-1 Pyrite (?) ***N
Kar
tald
ağ
KD9 Quartz 7,93 Early -
KD11 Quartz 8,33 Early -
KD6 Quartz 8,95 Late -
KD5-c & KD8-c Pyrite - - -4.8
*Standard Mean Ocean Water **V-CDT: Vienna - Canyon Diablo Troilite ***N: Negligible

143
6.2.1 Oxygen Isotope Compositions of Kartaldağ and Madendağ Districts
In order to obtain information about the silicification stages and source characteristics of
the fluids that formed alteration and mineralization in both districts, quartz crystals were
used. The samples were selected on the basis of relative time of formation of
silicification phases at each district. Therefore, a special care was given to sample early
and late silicification phases that formed the main quartz veins and/or silicified ridges at
both districts. In the Kartaldağ deposit, quartz separates from the samples KD9, KD11,
and KD6 were analyzed for their oxygen isotope compositions. The first two of these
separates are from veins formed during early silicification phase, and yielded δ18O
values of 7.93 and 8.33 per mil, respectively, whereas sample KD6, which is obtained
from a vein of the late silicification phase, has a δ18O value of 8.95 per mil (Table 6.7).
The composition of the Kartaldağ samples is compared in Fig. 6.5 with those
characteristic for various rocks and water sources. As can be seen from Fig. 6.6
Kartaldağ samples are within the range defined by magmatic rocks and waters, and
hence suggest an essentially magmatic origin for the hydrothermal fluid responsible for
silicification. Although there is a small increase in the δ18O value from early to late stage
silicification in the Kartaldağ samples, it is rather difficult (with the limited amount of
data) to comment on the possible contribution from other (sedimentary) sources towards
the later stages of the silicification process.
Similar to the Kartaldağ district, for the characterization of the silicification stages and
source characteristics of the fluids, three samples (MD6-2, MD10, and MD8) were
selected in the Madendağ district. Oxygen isotopes of quartz separate from veins of the
early silicification phase (MD6-2 and MD10) yielded δ18O values of 9.55 and 13.00 per
mils, whereas separates from veins of late silicification phase (MD8) returned δ18O
value of 18.19 per mil. Based on the source regions shown in Figure 6.6 and regarding
the host rock characteristics, the ore bearing fluid in Madendağ appears to have been
affected by a metamorphic source, at least towards the late stages of silicification. It
should also be noted, however, that the difference in the early and late silicification may

144
be the result of a possible boiling process which is common to most of the low
sulfidation type epithermal deposits. Such boiling processes are evidenced indirectly by
brecciation via hydraulic fracturing. In fact, the sample representing the late stage in
Madendağ is a brecciated sample (MD-8). The proposed boiling process could have
enriched the heavy oxygen isotopes in the late stage hydrothermal solution due to
separation of a gas phase from the original fluid.
Figure 6.6 Comparison of the δ18O values of Kartaldağ and Madendağ samples with
those from various rocks and water sources (KD: Kartaldağ, MD: Madendağ) (Rollinson, 1993)
KD MD

145
6.2.2 Sulphur Isotope Compositions of Kartaldağ and Madendağ Deposits
As explained above, S-isotope analyses could be performed only for a single
(composite) pyrite sample separated from sample no. KD5-c & KD8-c from Kartaldağ
mine area. In the Madendağ area, sample MD6-1 from the Vein #1 area was selected as
the representative samples but since all the pyrite separates (hand-picked under the
microscope) were including and/or turned totally to goethite no data could be obtained
for that sample. (All trials on these separates yielded with negligible sulfur isotope
compositions).
Regarding the Kartaldağ sample the δ34S value (relative to V-CDT) is -4.8 per mil. This
value is compared in Figure 6.7 with the ranges characteristic for various sulphur
reservoirs. As appears from Fig. 6.7, the S-isotope composition of the Kartaldağ sample
is within the range defined by volcanic and granitic rocks, but the possibility of
contribution from sedimentary sources (characterized essentially by negative δ34S
values) can not be ruled out.
Figure 6.7 δ34S value of Kartaldağ samples and various rocks and water sources (KD:
Kartaldağ) (Rollinson, 1993)
KD

146
CHAPTER 7
7. FLUID INCLUSIONS
7.1. Fluid Inclusion Analyses
For the fluid inclusion analyses, samples MD9-2 from the Madendağ, and KD6 and KD7
from the Kartaldağ mine areas were selected. Samples from the Madendağ area
represent a hydrothermally brecciated sample from Dump # 2, whereas samples of
Kartaldağ area are from the main silicified core (main gallery). All fluid inclusion
information was gathered from the quartz minerals within the quartz veins and
pervasively silicified rocks. Homogenization temperatures and salinities belonging to
these aqueous inclusions were determined and presented in Fluid Inclusion
Microthermometry part of this chapter.
Fluid inclusions are basically defined as the fluids (liquid, gas) trapped in the minerals
when they form. Fluid inclusions are the key solutions to gather information about the
ancient temperatures, pressures, and fluid compositions on the basis of salinity,
homogenization temperatures, freezing temperatures, and isotopic ratios such as oxygen
and hydrogen. Similar to the stable isotope studies performed for the identification of the
ore-bearing fluid’ characteristics, fluid inclusion analyses provide valuable information
about the origin and evolution of an ore-bearing fluid and, consequently, deposition
mechanisms (i.e. chemical and physical environments) of the mineralization system.
Especially in studies focused on epithermal systems and their hydrothermal evolution,
quartz crystals bearing millions of fluid inclusions play important role to obtain
information about the precious and base metal bearing fluids. At the room temperature,
epithermal inclusions typically contain only two phases as liquid, generally low salinity
H2O liquid and a vapor bubble (Bodnar et al., 1985). In the epithermal environments,

147
calcite, quartz, sphalerite, and fluorite minerals are studied mostly because of their
abundance in such systems and their handiness to study inclusions trapped in them.
Roedder (1984) first described the trapping mechanisms of the fluid inclusions within
minerals and some of them are explained as i) fluid inclusions in the irregularities
formed during growing of a mineral or ii) fluid inclusions formed in a crack developed
after growth of a mineral grain. Basically, fluid inclusions are classified into three as
primary, secondary, and pseudosecondary inclusions in which primary inclusions (Fig.
6.1) form generally on the growth zones of the minerals or as an isolated occurrence,
secondary inclusions form within the microstructures (after the crystal growth is
complete) (Goldstein and Reynolds, 1994). Pseudosecondary inclusions, on the other
hand, are trapped during the crystal growth which may be enveloped by an additional
growth zone. The visual representation of these three types of inclusions is given in
Figure 6.2. They can involve sometimes only one phase (generally liquid water,
methane, air etc.), sometimes two phases (generally, water and vapor H2O, CO2 etc.),
and sometimes three phases such as halite, gaseous water and liquid water.

148
Figure 7.1 Primary fluid inclusion textures trapped within quartz crystals (Goldstein and
Reynolds, 1994)
Figure 7.2 Representative mineral grain displaying the types of the fluid inclusions among the growth zones (defined by the distribution of primary fluid inclusions). s: secondary fluid inclusions, ps: pseudosecondary fluid inclusions, p: primary fluid
inclusions (Goldstein and Reynolds, 1994)
p
p

149
7.2 Fluid Inclusion Petrography
In order to understand the paragenetic relation between the quartz crystals and the
aqueous fluid inclusions, six quartz polished-thin sections were examined under both
plane light and UV illumination. Fluid inclusion assemblages were identified according
to their presence, relationship to the host, consistency of visual parameters (e.g.,
apparent liquid/vapor ratio) and applicability for determining the microthermometric
information. Studied fluid inclusion assemblages revealed three types of fluid inclusions
in the selected three quartz samples (sample no. MD9-2, KD6, and KD7): primary (p),
secondary (s), and pseudosecondary (ps). Petrographical features of the fluid inclusion
populations (FIP) within the representative quartz crystals in the samples are presented
in Table 7.1, 7.2, and 7.3.
Table 7.1 Fluid inclusion petrography of sample MD9-2
FI Population n (# of FI) Description
1 4 Primary fluid inclusions in early silicification phase
2 7 Primary fluid inclusions in early silicification phase
3 20 Secondary and pseudosecondary fluid inclusions in early silicification phase
4 5 Secondary and pseudosecondary fluid inclusions in early silicification phase
5 1 Secondary fluid inclusions in early silicification phase 6 3 Secondary fluid inclusions in early silicification phase
7 1 Secondary fluid inclusions in late silicification phase
8 1 Secondary fluid inclusions in late silicification phase
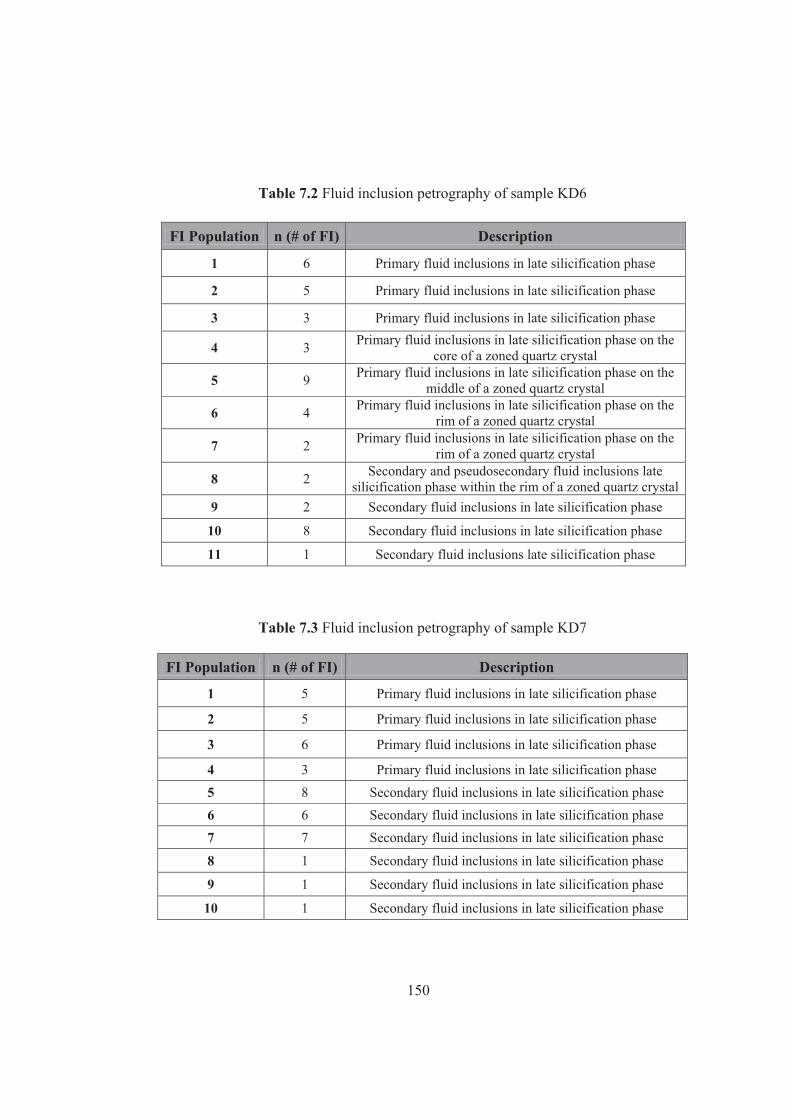
150
Table 7.2 Fluid inclusion petrography of sample KD6
Table 7.3 Fluid inclusion petrography of sample KD7
FI Population n (# of FI) Description
1 5 Primary fluid inclusions in late silicification phase
2 5 Primary fluid inclusions in late silicification phase
3 6 Primary fluid inclusions in late silicification phase
4 3 Primary fluid inclusions in late silicification phase 5 8 Secondary fluid inclusions in late silicification phase 6 6 Secondary fluid inclusions in late silicification phase 7 7 Secondary fluid inclusions in late silicification phase
8 1 Secondary fluid inclusions in late silicification phase
9 1 Secondary fluid inclusions in late silicification phase
10 1 Secondary fluid inclusions in late silicification phase
FI Population n (# of FI) Description
1 6 Primary fluid inclusions in late silicification phase
2 5 Primary fluid inclusions in late silicification phase
3 3 Primary fluid inclusions in late silicification phase
4 3 Primary fluid inclusions in late silicification phase on the core of a zoned quartz crystal
5 9 Primary fluid inclusions in late silicification phase on the middle of a zoned quartz crystal
6 4 Primary fluid inclusions in late silicification phase on the rim of a zoned quartz crystal
7 2 Primary fluid inclusions in late silicification phase on the rim of a zoned quartz crystal
8 2 Secondary and pseudosecondary fluid inclusions late silicification phase within the rim of a zoned quartz crystal
9 2 Secondary fluid inclusions in late silicification phase
10 8 Secondary fluid inclusions in late silicification phase
11 1 Secondary fluid inclusions late silicification phase

151
In sample MD9-2, which is hydrothermally brecciated quartz, six fluid inclusion (FI)
populations are found in early silicification phase and two FI populations in the late
silicification phase (Table 7.1). Generally two phases (a gaseous state bubble within a
liquid phase) are observed with a commonly consistent vapor/liquid (V/L) ratio.
Photomicrograph identifying a representative inclusion population in the sample MD9-2
is presented herein along with a low power photograph for general rock identification
(Fig. 7.3).
In the samples KD6 and KD7, eleven and ten fluid inclusion populations were found
respectively (Table 7.2 and 7.3). Since sample KD6 includes coarse grained, zoned
quartz crystals, fluid inclusion studies were performed so as to represent those on the
rim, core and middle of the crystal. While in KD6 seven populations are displaying the
primary inclusions, in KD7 four populations are primary. The fluid inclusions in KD6
are relatively bigger (3-7 μm in size) and irregularly shaped (Fig. 7.4) with variable V/L
ratio, whereas KD7 includes FI populations that have more consistent V/L ratio (Fig.
7.5).All populations for both samples represent late stage silicification observed for
Kartaldağ mineralization.

152
Figure 7.3 Sample photomicroscopy for the sample MD9-2

153
Figure 7.4 Sample Photomicroscopy for the sample KD6

154
Figure 7.5 Sample photomicroscopy for the sample KD7

155
7.3 Fluid Inclusion Microthermometry
Microthermometric analyses were carried out for each population to determine the,
homogenization temperatures (Th aq), final (ice) melting temperatures (Tm aq), and
salinity values (wt %). Salinities were interpreted from the table prepared by Bodnar
et al. (1992) in NaCl – H2O system.
Analyses performed for sample MD9-2 (Table 7.4) show that primary and high
temperature secondary/pseudo-secondary inclusions in early phase quartz have
homogenization temperatures (Th) of 235-285ºC; with most in the 240-255ºC range
for the Madendağ district (Fig. 7.6). Salinities are low at 0.0-0.7 weight percent (i.e.
wt % NaCl eqv.).
Low temperature secondary aqueous inclusions both in early and late phase quartz
from the silicified rocks in the Madendağ have Th in the range 90-130ºC, with
somewhat bimodal distribution at 90-98ºC and 128-130ºC (Fig. 7.6). Salinities could
not be measured, due to metastable phase behavior, but are inferred to be quite low.
These secondary inclusions may represent external conditions attending waning
stages of a cooling system.
Table 7 .4 Microthermometric analysis results of the fluid inclusion populations the Madendag district in sample MD9-2 (number in parentheses indicates the number of
inclusions measured, N/A is not available)
*Population # Th aq (°C) Tm aq (°C) Salinity (wt % )
1 (p, early) 250-255 (4) metastable N/A
2 (p, early) 235-255 (7) 0 to -0.2 0.0-0.4
3 (s/ ps, early) 265-285 (20) 0 to -0.2 0.0-0.4
4(s/ ps, early) 240-250 (5) 0 to -0.4 0.0-0.7
5 (sec, early) 130 (1) metastable N/A *p: primary, ps: pseudo-secondary, s: secondary inclusions; early-late: phases of silicification

156
Table 7.4 (cont.) *Population # Th aq (°C) Tm aq (°C) Salinity (wt % )
6 (sec, early) 90-95 (3) N/A N/A
7 (sec, late) 128 (1) N/A N/A
8 (sec, late) 98 (1) metastable N/A *p: primary, ps: pseudo-secondary, s: secondary inclusions; early-late: phases of silicification
Figure 7.6 Homogenization temperature (Th ºC) ranges determined for the fluid
inclusion populations (FIP) found in sample MD9-2
Primary and high temperature secondary/pseudo-secondary inclusions in the late
phase, growth-zoned euhedral quartz from the Kartaldağ district in sample KD6 have
Th dominantly in the range of 245-285ºC, although values as low as 135ºC were
measured (Table 7.5 and Fig. 7.7). A transect from core to rim did not reveal any
drastic temperature changes, although there is some evidence of oscillatory high
temperature (Fig. 7.7). Salinities are low at 0.0-1.7 wt % salt. Salinity appears to
decrease slightly from core (c) to rim (r) (1.1-1.7 vs. 0.0-1.4 wt % NaCl eqv.).
Th (0C) distribution of sample MD9-2
0
50
100
150
200
250
300
FI Populations
Th
(0 C) r
ange
Min Th 250 235 265 240 130 90 128 98
Max Th 255 255 285 250 130 95 128 98
1 2 3 4 5 6 7 8
Primary FIP

157
Secondary aqueous inclusions in late phase quartz cement have bimodal measured
Th of 110-140ºC and 215-220ºC (Fig. 7.7). Salinities are 0.0-1.4 weight percent salt.
Table 7.5 Microthermometric analysis results of the fluid inclusion populations for
the Kartaldag district in sample KD6 (number in parentheses indicates the number of inclusions measured, N/A is not available)
*Population # Th aq (°C) Tm aq (°C) Salinity (wt %)
1 (p, late) 275-285 (6) 0 to -1.0 0.0-1.7
2 (p, late) 185-200 (5) metastable N/A 3 (p, late) 135-140 (3) metastable to -0.6 1.1
4 (p, c, late) 260-275 (3) -0.6 to -1.0 1.1-1.7
5 (p, m, late) 245-255 (9) -0.6 to -1.0 1.1-1.7
6 (p, r, late) 255-267 (4) 0 to -0.8 0.0-1.4 7 (p, r, late) 270-277 (2) 0 to -0.8 0.0-1.4 8 (s/ps, late) 270-279 (2) 0 to -0.8 0.0-1.4
9 (s, late) 110-120 (2) metastable N/A
10 (s, late) 215-220 (8) metastable to 0.0 0,0 11 (s, late) 140 (1) -0,8 1.4
*p: primary, ps: pseudo-secondary, s: secondary inclusions; early-late: phase of silicification, c: core, m: middle, r: rim of the crystal
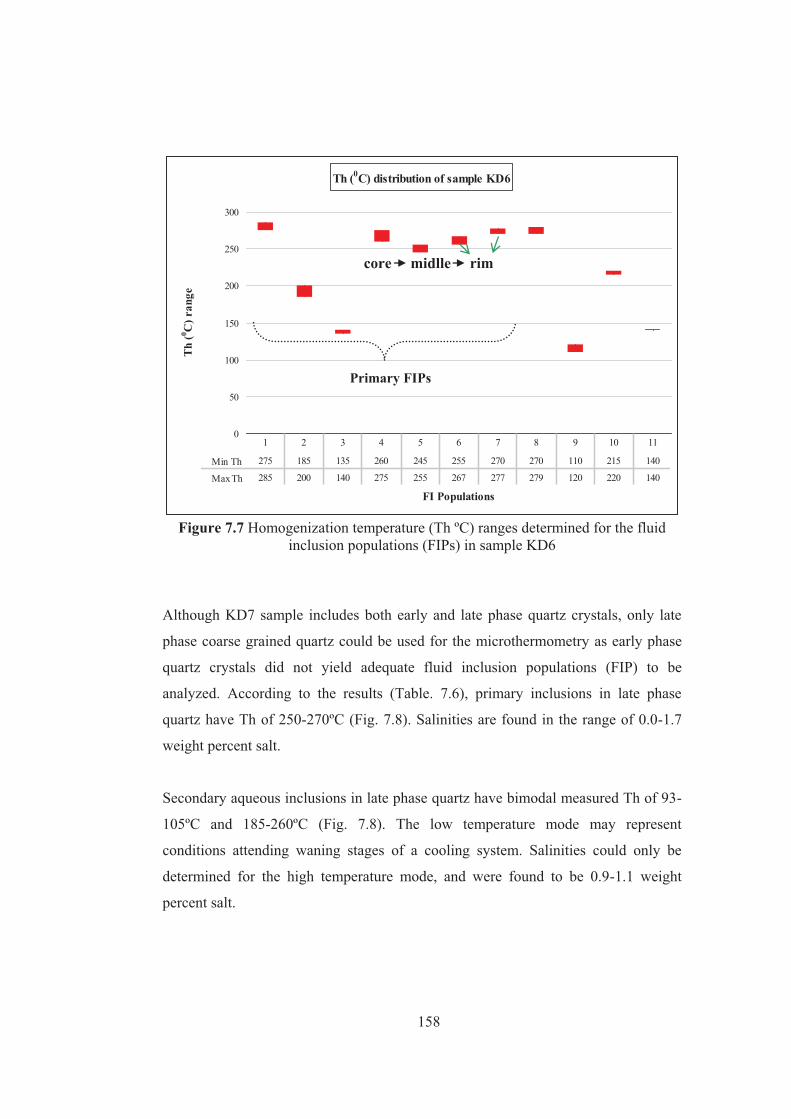
158
Figure 7.7 Homogenization temperature (Th ºC) ranges determined for the fluid
inclusion populations (FIPs) in sample KD6
Although KD7 sample includes both early and late phase quartz crystals, only late
phase coarse grained quartz could be used for the microthermometry as early phase
quartz crystals did not yield adequate fluid inclusion populations (FIP) to be
analyzed. According to the results (Table. 7.6), primary inclusions in late phase
quartz have Th of 250-270ºC (Fig. 7.8). Salinities are found in the range of 0.0-1.7
weight percent salt.
Secondary aqueous inclusions in late phase quartz have bimodal measured Th of 93-
105ºC and 185-260ºC (Fig. 7.8). The low temperature mode may represent
conditions attending waning stages of a cooling system. Salinities could only be
determined for the high temperature mode, and were found to be 0.9-1.1 weight
percent salt.
Th (0C) distribution of sample KD6
0
50
100
150
200
250
300
FI Populations
Th
(0 C) r
ange
Min Th 275 185 135 260 245 255 270 270 110 215 140
Max Th 285 200 140 275 255 267 277 279 120 220 140
1 2 3 4 5 6 7 8 9 10 11
Primary FIPs
core midlle rim

159
Table 7 .6 Microthermometric analyze results of the fluid inclusion populations found in sample KD7 (number in parentheses indicates the number of inclusions
measured, N/A is Not Available)
*Population # Th aq (°C) Tm aq (°C) Salinity (wt %) 1 (p, late) 250-267 (5) -0.7 to -1.0 1.2-1.7 2 (p, late) 250-265 (5) -0.4 to -0.8 0.7-1.4
3 (p, late) 255-270 (6) -0.4 to -1.0 0.7-1.7
4 (p, late) 260-270 (3) 0 to -0.4 0.0-0.7 5 (s, late) 250-260 (8) metastable N/A 6 (s, late) 185-200 (6) metastable to -0.6 1,1 7 (s, late) 235-245 (7) metastable to -0.5 0,9
8 (s, late) 95 (1) N/A N/A 9 (s, late) 93 (1) N/A N/A
10 (s, late) 105 (1) N/A N/A *p: primary, s: secondary inclusions; early-late: phases of silicification
Figure 7.8 Homogenization temperature (Th ºC) ranges determined for the fluid
inclusion populations (FIPs) in sample KD7
Th (0C) distribution of sample KD7
0
50
100
150
200
250
300
FI Populations
Th
(0 C) r
ange
Min Th 250 250 255 260 250 185 235 95 93 105
Max Th 267 265 270 270 260 200 245 95 93 105
1 2 3 4 5 6 7 8 9 10
Primary FIPs
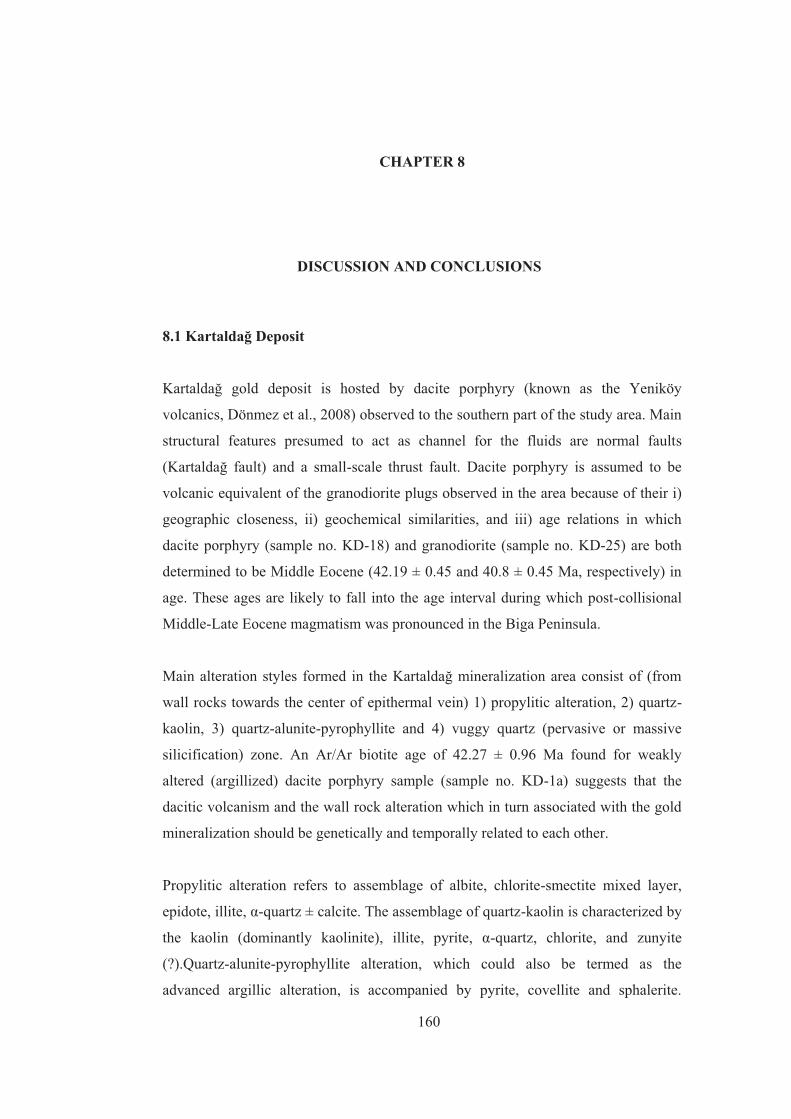
160
CHAPTER 8
8. DISCUSSION AND CONCLUSIONS
8.1 Kartaldağ Deposit
Kartaldağ gold deposit is hosted by dacite porphyry (known as the Yeniköy
volcanics, Dönmez et al., 2008) observed to the southern part of the study area. Main
structural features presumed to act as channel for the fluids are normal faults
(Kartaldağ fault) and a small-scale thrust fault. Dacite porphyry is assumed to be
volcanic equivalent of the granodiorite plugs observed in the area because of their i)
geographic closeness, ii) geochemical similarities, and iii) age relations in which
dacite porphyry (sample no. KD-18) and granodiorite (sample no. KD-25) are both
determined to be Middle Eocene (42.19 ± 0.45 and 40.8 ± 0.45 Ma, respectively) in
age. These ages are likely to fall into the age interval during which post-collisional
Middle-Late Eocene magmatism was pronounced in the Biga Peninsula.
Main alteration styles formed in the Kartaldağ mineralization area consist of (from
wall rocks towards the center of epithermal vein) 1) propylitic alteration, 2) quartz-
kaolin, 3) quartz-alunite-pyrophyllite and 4) vuggy quartz (pervasive or massive
silicification) zone. An Ar/Ar biotite age of 42.27 ± 0.96 Ma found for weakly
altered (argillized) dacite porphyry sample (sample no. KD-1a) suggests that the
dacitic volcanism and the wall rock alteration which in turn associated with the gold
mineralization should be genetically and temporally related to each other.
Propylitic alteration refers to assemblage of albite, chlorite-smectite mixed layer,
epidote, illite, α-quartz ± calcite. The assemblage of quartz-kaolin is characterized by
the kaolin (dominantly kaolinite), illite, pyrite, α-quartz, chlorite, and zunyite
(?).Quartz-alunite-pyrophyllite alteration, which could also be termed as the
advanced argillic alteration, is accompanied by pyrite, covellite and sphalerite.

161
Pervasive or massive silicification is composed of fine to medium grained quartz
crystals displaying mostly vuggy quartz textures typical for the high sulfidation
epithermal systems. Euhedral pseudomorphs of the parental grains such as
plagioclase and hornblende minerals appear to form the vugs during pervasive
leaching of the dacite porphyry. Based on relative cross-cutting relationships of
quartz textures, dacitic host rock is noticed to have experienced at least two phases of
silicification as early and late silicification, which are likely to have formed by
(adiabatic) boiling process throughout the hydrothermal evolution. The textural
characteristics of the quartz crystals formed at each phase is different such that early
silicification exhibits the vuggy quartz texture with fine grained quartz crystals,
whereas late phase silicification is characterized by colloform, banded, growth-
zoned, commonly euhedral coarse grained quartz crystals, and occurs as an overprint
on the vuggy quartz. Concerning the depth where these textures were observed,
banded, colloform, coarse grained zoned quartz formations (late phase silicification)
might indicate the level above the boiling zone, whereas vuggy quartz formations
(and possible brecciation at depth) with base metal deposition might specify the
presence of rapidly cooling boiling zone.
Isocon plots constructed for Kartaldağ alterations suggest the followings:
In the propylitic alteration, enrichment in K2O and MnO, and in Ba and Rb
which are the trace elements associated with K are most striking features.
In Quartz – Kaolin zone, the enrichment in SiO2 and K2O in the altered
sample is conformable with the findings (quartz and illite) from the XRD and
SEM/EDX studies. Depletion in MnO, P2O5, MgO, FeOt, CaO, and Na2O,
compared with the least altered sample (KD-18), confirms the replacement of
the minerals of plagioclase and hornblende by the clay minerals.
In quartz-alunite- pyrophyllite alteration, enrichment in SiO2, P2O5, FeOt, and
Al2O3, along with Sr and Ba, suggests that the zone of alteration is dominated
by quartz and aluminum silicates (e.g. kaolinite and pyrophyllite).

162
Furthermore, higher S, Cu, FeOt and Al2O3 concentrations seem to be
associated with the dominance of covellite (CuS), pyrite (FeS2), kaolin
(mostly kaolinite) and the sulfates (e.g. alunite).
Oxygen isotope analysis performed on the quartz separates representing early and
late silicification phases yield δ18O (relative to SMOW) values of 7.93 and 8.33 per
mil, and of 8.95 per mil, respectively. Since these values plot within the range of
magmatic-water dominated area, Kartaldağ mineralization might have been formed
by essentially magmatic waters, but increasing δ18O value from early to late
silicification points to a possible contribution from other (e.g. sedimentary) sources
as well. Additionally, the sulfur isotope analysis performed on a composite pyrite
sample (separated from two different specimens) yield δ34S value (relative to V-
CDT) of -4.8 per mil, which in turn gives the idea of a possible magmatic origin for
sulfur.
Fluid inclusion petrography, at room temperature, reveal the presence of two phases
as liquid and vapor (both probably H2O). Vapor phase in the inclusions do not
generally display necking morphology, suggesting that the vapor was not introduced
during a healing process but was trapped during the formation of the inclusion.
Furthermore, in some samples, liquid-rich inclusions are also observed together with
vapor-rich inclusions in a single quartz crystal, which is stated in the literature
(Bodnar et al., 1985) to be an evidence of the contemporaneous formation of those
two types via the boiling fluid. Microthermometric analysis show that the primary
fluid inclusion populations determined in the late silicification samples have the
homogenization temperature range of 135-285ºC (dominantly of 250-285ºC) and
generally low salinity values at 0.0-1.7 wt % NaCl eqv. Therefore, it can be said that
the late stage silicification seems to have formed mostly at moderate temperatures
and from low salinity fluids. Since there is no FIP data representing the early stage
silicification, fluid genesis for this stage is unknown. Given that the late silicification
probably represents the level above the boiling zone, the mineralization at/below the
boiling level might have occurred at even higher temperatures (>285ºC).
163
The Kuşçayırı Au-Cu deposit (Bayramiç, Çanakkale), a high sulfidation epithermal
type mineralization, hosted by calc-alkaline Miocene volcanics (Yılmaz, 2003) to the
south of the Kartaldağ deposit has nearly the same structural control, and a similar
alteration petrography as the Kartaldağ deposit. Although there is not enough
information locating the Au distribution both laterally and vertically in Kartaldağ
deposit, geological closeness and similar alteration styles may suggest they might be
part of a magmatic-hydrothermal system or in a broader sense they might have a
similar fluid genesis and nature. However, relatively higher salinity (35–50 wt%
NaCl eqv.) values and temperature range (330–450 ºC) found for the fluid inclusions
in quartz samples in Kuşçayırı deposit strongly disagree with the same fluid genesis
or hydrothermal evolution with the Kartaldag with a moderate temperature of 250-
285ºC and a very low salinity of 0.0-1.7 wt% NaCl eqv.
8.2 Madendağ Deposit
Madendağ gold deposit is located nearly 20 km northwest to the Kartaldağ mine, is
hosted by micaschist units mainly observed western part of the study area.
Micaschist units outcropping in this area are known as the Çamlıca micaschist (or
Çamlıca metamorphics) (Okay et al., 1991) in the literature. Two veins and two
dump areas were identified as the representative sampling locations where the
brecciation lenses seem to act as main structural features. An Ar/Ar (sericite) age of
55 Ma on a mica-schist sample (sample no. MD1-a) possibly points to a
metamorphism age during that time interval.
Alteration types for Madendağ mineralization is defined basically as argillic and
silicic alterations. Argillic alteration observed on the micaschist is classified into two
groups as i) kaolin-rich argillic alteration with chlorite and ii) illite-rich argillic
alteration, and is dominantly characterized by hydrothermal α-quartz, illite, kaolin
and pyrite. Silicification, on the other hand, is observed as two distinct phases of
quartz formations, which are grouped as early and late phases of silicification. While
early silicification phase is identified by its crosscutting relation with foliation planes

164
of the schist with coarse to medium grained, colloform, comb and banded quartz
textures (typical for the low sulfidation epithermal systems), late silicification phase
is characterized by the hydrothermally brecciated samples showing occasionally the
typical brecciation texture of jig-saw puzzle. Similar to Kartaldağ mineralization, the
observation of certain quartz textures at different places/levels (early phase textures
in the surface outcrops, and late phase textures in the dump areas) may be related
with the presence of a possible boiling zone.
According to the isocon plots of illite-dominated argillic alteration, commonly Na2O,
MnO, MgO, CaO, and Th are the depleted, and SiO2, K2O, Al2O3, FeOt oxides and
nearly all trace elements are the enriched constituents, which are in turn related with
the formations of illite, quartz, and pyrite in this zone. In the silicification zone, as
expected, SiO2 is the most enriched constituent along with significant loss of the total
rock mass. The base metal enrichment seems to be associated with early silicification
phase, especially in the sample MD6-14.
The oxygen isotope analyses performed to distinguish the source region of the
mineralizing fluid show that the quartz separates of early silicification yield δ18O
values (relative to SMOW) of 9.55 and 13.00 per mils, whereas those of late
silicification show δ18O value of 18.19 per mil. Regarding both the host rock nature
and the source regions defined for these values, ore bearing fluid in Madendağ
deposit is thought to have been affected mostly by a possible metamorphic source
and the increase in δ18O values suggest the expected boiling process at depth.
The petrographic features of FI populations show that the inclusions are dominantly
liquid-rich (probably liquid H2O), and occasionally one-phase (liquid), and are
irregularly shaped with medium to small sizes (5-15 μm). In two-phase inclusions,
the vapor phase seems to be primary (not necking) which may point to a possible
boiling origin as in the case of Kartaldağ mineralization. Microthermometric analysis
carried out on a brecciated sample (including both early and late phase silicification
stages) of the Madendağ mineralization, primary fluid inclusion populations found in
early silicification phase show the homogenization temperature (Th) range of 235-

165
255 ºC, with the data gathered from those of secondary and pseudosecondary FI
populations, the range may extend to 235-285 ºC. Salinity values determined for this
sample yield the range of 0.0-0.7 wt % (NaCl eqv.). The homogenization
temperatures and the salinity values suggest moderate temperatures and low salinity
fluids for the early silicification and the possibly associated ore bearing stage.
If Madendağ deposit is compared with the Şahili/Teşpih Dere intermediate style
epithermal deposits (Yılmaz et al., 2010) hosted by the Upper Oligocene volcanics in
Lapseki, Çanakkale region (to the northeast of the Madendağ (or Akbaba)
mineralization), it is observable that the base metal content and fluid evolution in
terms of the temperature and salinity ranges (average: 276 °C on quartz and 259 °C
on sphalerite, < 7 wt % NaCl eqv.) are different compared to the findings in this
study (235-255 ºC temperature range on quartz and 0.0-0.7 wt % NaCl eqv.). This
show both a similarity in fluid nature and a significant difference in salinity which is
in turn related with the metal bearing and transport capacity of the fluids in these
hydrothermal systems. While in the Şahinli and Teşbih Dere mineralization,
polymetallic deposition with a variety of clay minerals sensitive to a wide range of
temperature and pH conditions is stated to be formed, in the Madendağ deposit,
limited base metal content is associated with limited alteration styles. Besides, the
vein textures and temporal association of vein and breccia facies defined in Sahinli
are lacking in the Madendag, and this suggests that these two deposits have different
fluid evolution and genesis.
8.3 Concluding Remarks
Major concluding remarks figured out from this thesis study are summarized as
follows:
� In the Kartaldağ mine district, the advanced argillic alteration (quartz -
alunite- pyrophyllite alteration) covers and/or envelopes the pervasively
silicified zone (core of residual part of the system), and wall rock (Middle-
Late Eocene dacite porphyry) alteration can be traced from propylitic at the

166
margins to massive silicification at the center of the mineralized system. This
may be stated as evidence that fluid (ore bearing) was channel through a
single conduit close to or within the massive-vuggy quartz zone.
� The temporal and spatial association of alterations, zoning patterns,
predominant clay mineral compositions being pyrophyllite, kaolinite and
alunite, vuggy quartz texture, and covellite, pyrite, sphalerite ore minerals can
be taken as the key minerals supportive of an argument that the Kartaldağ
epithermal gold mineralization is formed by a low pH-oxidizing fluid.
� In addition to the alteration petrography in the Kartaldağ epithermal system,
stable isotope compositions (i.e., δ18O and δ34S values) and the temperature
range (dominantly 250-285ºC) suggest a magmatic origin for a possible ore
bearing (Au?, Ag, Cu, Pd, Mo, Zn) fluid which is recently accepted to be
associated with the high sulfidation epithermal systems (Hedenquist and
Lowenstern, 1994).
� Regarding the quartz textures and the associated base metal concentrations,
early silicification phase (in the Kartaldağ mine) containing mostly fined
grained vuggy quartz can be stated to have controlled the mineralization
possibly through a boiling process.
� In the Madendağ mine district, the limited types of wall rock (dominantly
micaschist) alterations (argillic and silicic) may refer to a simple mineralizing
system encompassing boiling process which may be evidenced with
hydrothermal breccia samples in dump areas.
� Being formed at a near-neutral pH condition, illite, kaolin, chlorite, calcite,
and α-quartz may suggest that the argillic alteration in the Madendağ
mineralization is formed in a low sulfidation epithermal environment.
� The presence of the colloform, comb and banded quartz formations in early

167
phase silicification reflects the low temperature conditions in Madendağ
mineralizing system. The temperature range (235-255 ºC) estimated from the
primary FIP in comb, banded and brecciated quartz samples can be regarded
as a support for this argument. The occurrence of banded quartz along with
comb quartz and bladed calcite-ghost blades may be indicative of boiling in
the system.
� Although the oxygen isotope compositions of Madendağ samples suggest a
metamorphic contribution (conformable with the composition of the host
rock), the ore forming fluid is thought to be related with the Kartaldağ system
(i.e. an essentially magmatic origin overprinted by meteoric fluids) because
of the geographic closeness of, and nearly the same temperature ranges
obtained from the primary fluid inclusion populations in both mineralizing
systems.
� The absence of advanced argillic zone (particularly alunite), vuggy quartz,
and limited base metal content suggest that Madendağ mineralization is not a
high-sulfidation type epithermal system defined in the literature.
Additionally, the difference in salinity values of Kartaldağ (0.0 to 1.7 wt %)
and Madendağ (0.0 to 0.7 wt %) systems reflect both low salinity fluids, but
with a slight decrease in the latter. In this respect, Madendağ gold mine
appears to reflect a mineralizing system that can be regarded as a low-
sulfidation type epithermal deposit.
� For further studies, more sulfur isotope studies will be carried out for genesis
for the Madendağ sulfide deposition This will help to solve genetic link
between Kartaldağ and Madendağ epithermal systems. The evolutionary
relation along with the fluid origins between two deposits may be further
understood with oxygen and hydrogen analyses on the fluid inclusions in
quartz generations obtained petrographically. Clay minerals which are
observed abundant in both deposits can be used to strengthen the
understanding of the source regions for the oxygen isotope compositions,

168
particularly in the Madendağ deposit. In addition, the temporal and spatial
distribution of Au deposition in both deposits should be determined in by
means of further chemical and petrographical analyses. It is recommended
further studies on the ore microscopy to identify the distribution of Au with
related base metals and relation between Au and possible Au bearing quartz
generations. Recommended studies would also be used in interpreting the
possible genetic relation with other epithermal deposits (e.g. Kuşçayırı and
Şahinli mineralization) in Biga Peninsula.

169
REFERENCES
Alamos Gold Inc., 2009, Ağı Dağı and Kirazlı Mineral Resources, (online)
Available, http://www.alamosgold.com/our-mines-projects/agi-dagi-kirazli project/reserves and-resources August, August 19, 2010
Albino, G.V., and Margolis, J., 1991, Differing styles of adularia-sericite epithermal deposits—contrasts in geologic setting and mineralogy [abs.]: Geological Society of America Abstracts with Program, v. 23, no. 5, p.A230
Aldanmaz, E., 2002, Mantle source characteristics of alkali basalts and basanites in an extensional intracontinental plate setting, western Anatolia, Turkey: Implications for multi-stage melting: International Geology Review, v.44, p. 440-457
Aldanmaz, E., Pearce, J.A., Thirlwall, M.F., and Mitchell, J.G., 2000, Petrogenetic evolution of late Cenozoic volcanism and Geothermal Research, v. 102, p. 67-95
Altunkaynak, Ş., and Genç, C., 2008, Petrogenesis and time-progressive evolution of the Cenozoic continental volcanism in the Biga Peninsula, NW Anatolia (Turkey), Lithos, v. 102, p. 316-340
Altunkaynak, Ş., 2007, Collision-driven slab break off magmatism in northwestern
Anatolia, Turkey, Journal of Geology, Vol. 115, 2007, p. 63-82
Arribas, A., 1995, Characteristics of High-Sulfidation Epithermal Deposits, and Their relation to Magmatic Fluid, in Thompson, J.F.H., eds, In Magmas, Fluids, and Ore Deposits, Mineralogical Association of Canada Short Course v.23, p.419-453
Beccaletto, L., and Jenny, C., 2004. Geology and Correlation of the Ezine Zone: A Rhodope Fragment in NW Turkey? Turkish Journal of Earth Sciences, v.13, p.145-176
Beccaletto, L., 2003. Geology, correlations and geodynamic evolution of the Biga
Peninsula, Northwest Turkey, University of Lousanne, PhD Thesis, 146.p

170
Berger, B.R., and Henley, R.W., 1989, Advances in the understanding of epithermal gold-silver deposits, with special reference to the western United States: Economic Geology Monograph, v.6, p.405-423
Bilgin, İ., 1999, Ezine (Çanakkale) Ofiyolit ve Metamorfitlerinin Petrolojisi. Institute of Natural and Applied Sciences, İstanbul University, İstanbul, PhD Thesis, 152 p (unpublished) (in Turkish)
Bingöl, E., Akyürek, B., and Korkmazer, B., 1973, Biga Yarımadası’nın Jeolojisi ve Karakaya Formasyonu’nun bazı özellikleri, MTA 50. Anniversary, Proceedings, p. 71-77
Bodnar, R.J., Cline, J.S., Rimstidt, J.D., 1992, Numerical simulation of fluid flow
and silica transport and deposition in boiling hydrothermal solutions: application to epithermal gold deposits, Journal of Geophysical Research, v. 97, p. 9085-9103
Bodnar, R.J., Reynolds, T.J., Kuehn, C.A., 1985, Fluid inclusion systematics in
epithermal systems, in Berger, B.R. and Bethke, P.M., eds, Geology and Geochemistry of Epithermal Systems: Society of Economic geologists, Reviews in Economic Geology, v. 2, p. 73-97
Bonev, N., Beccaletto, L., 2007, From syn- to post-orogenic Tertiary extension in the north Aegean region: constraints on the kinematics in the eastern Rhodope Thrace, Bulgaria Greece and the Biga Peninsula, NW Turkey, Geological Society, London, Special Publications, v. 291, p.113-142
Bonev, N., Beccaletto, L., 2005, Northeastward ductile shear in the Kemer micaschists, Biga Peninsula (NW Turkey), in Taymaz, T., ed., International Symposium on the Geodynamics of Eastern Mediterranean: Active Tectonics of the Aegean Region, Tubitak, Istanbul, Turkey, Abstracts 65
Bonham, H.F., Jr., 1988, Models for volcanic-hosted precious metal deposits; A
review, in Schafer, R.W., Cooper, J.J., and Vikre, P.G., eds., Bulk Mineable Precious Metal Deposits of the Western United States: Geological Society of Nevada, p.259-271
Bonham, H.F., Jr., 1986, Models for volcanic-hosted epithermal precious metal
deposits: A review, Volcanism, hydrothermal systems and related mineralization, International Volcanological Congress, Symposium 5, Hamilton, New Zeeland, University of Auckland Centre for Continuing

171
Education, Proceedings, v.5, p.13-18
Bozkurt, E., and Sözbilir, H., 2004. Tectonic evolution of the Gediz Graben: field evidence for an episodic, two-stage extension in western Turkey, Geological Magazine, v.141, p.63-79
Bozkurt, E. 2001, Neotectonics of Turkey -a synthesis, Geodinamica Acta (Paris) v.
14, p. 3-30 Bozkurt, E., and Mittwede, S. K., 2001, Introduction to the Geology of Turkey-A
synthesis, International Geology Review, v. 43, p. 578-594
Bozkurt, E., and Oberhänsli, R., 2001, Menderes Massif (western Turkey): structural, metamorphic and magmatic evolution: a synthesis. International Journal of Earth Sciences, v.89, p.679-708
Bozkurt, E., 2000, Timing of extension on the Büyük Menderes Graben, western
Turkey and its tectonic implications. in Bozkurt, E., Winchester, J.A., Piper, J.D.A. ,eds., Tectonics and Magmatism in Turkey and the Surrounding Area: Geological Society, London, Special Publications , v.173, p.385-403
Cooke, D.R., and Simmons, S.F., 2000, Characteristics and genesis of epithermal
gold deposits: Reviews in Economic Geology, v. 13, p. 221-244
Çolakoğlu, A.R., 2000, The Characteristics of Küçükdere Epithermal (Havran-Balıkesir) Gold Vein, Geological Bulletin of Turkey, v. 43, p.99-100
Delaloye, M. and Bingöl, E., 2000, Granitoids from western and northwestern Anatolia: geochemistry and modeling of geodynamic evolution. International Geology Reviews, v.42, p.241-268
Dewey, J.F. and Şengör, A.M.C., 1979, Aegean and surrounding regions complex multiplate and continuum tectonics in a convergent zone, Geol. Soc. Am. Bul., v.90, p.84-92
Dilek, Y., and Altunkaynak, Ş., 2009, Geochemical and temporal evolution of Cenozoic magmatism in western Turkey: Mantle response to collision, slab breakoff, and lithospheric tearing in an orogenic belt, Geological Society, London, Special Publications, v.311, p.213-233

172
Dilek, Y., Pavlides, S., 2006, Postcollisional Tectonics and Magmatism in the Mediterranean Region and Asia, Geological society of America, Special Publication v.409, 645 p
Doglioni, C., Agostini, S., Crespi, M., Innocenti, F., Manetti, P., Riguzzi, F., Savaşçın, M.Y., 2002, On the extension in western Anatolia and the Aegean Sea, Virtual Explorer, v.8, p.169-183
Dönmez, M., Akçay, A.E., Duru, M., Ilgar, A., Pehlivan, Ş., 2008, 1:100 000 Ölçekli Türkiye Jeoloji Haritaları No.101 (Çanakkale – H17 Paftası), MTA publication, 27 p (in Turkish)
Deb, M., 2008, Epithermal Gold Deposits: Their Characteristics and Modeling, (online), Available psdg.bgl.esdm.go.id/makalah/Bandung-Gold-Mihir.pdf, August 23, 2010
Duru, M., Pehlivan, Ş., Şentürk, Y., Yavaş, F., Kar, H., 2004, New Results on the Lithostratigraphy of the Kazdağ Massif in Northwest Turkey, Turkish Journal of Earth Sciences (Turkish J. Earth Sci.), v. 13, p. 177-186
Einaudi, M.T., Hedenquist, J.W., and İnan, E.E., 2003, Sulfidation state of hydrothermal fluids: The porphyry-epithermal transition and beyond, in Simmons, S.F, and Graham, I.J., eds., Volcanic, geothermal and ore-forming fluids: Rulers and witnesses of processes within the Earth: Society of Economic Geologists and Geochemical Society, Special Publication v.10, p.285-313
Eldarado Gold Corporation, 2005, Annual Information Form, (online) Available http://www.eldoradogold.com/i/pdf/2005AIF.pdf , August 22, 2010
Ercan, T., Satır, M., Steinitz, G., Dora, A., Sarıfakioğlu, E., Adis, C., Walter, H.J.
and Yıldırım, T., 1995, Biga Yarımadası ile Gökçeada Bozcaada ve Tavşalı adalarındaki (KB Anadolu) Tersiyer Volkanizmasının özellikleri: MTA Bulletin, v.117, p.55-86 (in Turkish)
Fytikas, M., Innocenti, F., Manetti, P., Mazuoli, R., Peccerillo, A., and Villari, L.,
1984, Tertiary to Quaternary evolution of volcanics in the Aegean region, in Dixon, J.E., and Robertson, A.H.F., eds, The geological evolution of the Eastern Mediterranean: Geological Society of London Publication v.17, p.687-699

173
Genç, S.C., 1998, Evolution of the Bayramiç Magmatic Complex, Northwestern Anatolia, Journal of Volcanology and Geothermal Research, v. 85, p.233-249
Genç, Ş.C., and Yılmaz, Y., 1995, Evolution of the Triassic continental margin,
northwest Anatolia, Tectonophysics, v.243, p.193-207
Goldstein, R. H., and Reynolds, T. J., 1994, Systematics of fluid inclusions in diagenetic minerals: SEPM (Society for Sedimentary Geology), Short Course 31, 199 p
Göncüoğlu, M.C., Dirik, K., and Kozlu, H., 1997, Pre-Alpine and Alpine terranes in Turkey: explanatory notes to the terrane map of Turkey: in Papanikolaou, D. and Sassi, F.P., eds., IGCP Project nº276; Paleozoic domains and their alpidic evolution in the Tethys: Annales Geologiques des Pays Helleniques, p. 515-536
Göncüoğlu, M.C., 1995. Rock units and geodynamic evolution of the Central
Sakarya Terrane and its correlation with the Serbo-Macedonian Terrane: XV Congress of the Carpato-Balkan Geol.Assoc., Athens, Programme and Abstract, p.14
Graham, C. M., Valley, J. W., and Winter, B. L., 1996, Ion microprobe analysis of 18O/16O in authigenic and detrital quartz in the St. Peter sandstone, Michigan Basin and Wisconsin Arch, USA: Contrasting diagenetic histories. Geochim. Cosmochim. Acta, v.60, p.5101–5116
Groves, D.I., Goldfarb, R.J., Gebre-Mariam, M., Hagemann, S.G., Robert, F., 1998, Orogenic gold deposits: A proposed classification in the context of their crustal distribution and relationship to other gold deposit types, Ore Geology Reviews, v.13, p.7-27
Güleç, N., and Hilton, D.R., 2006. Helium and Heat Distribution in Western Anatolia, Turkey: Relationship to Active Extension and Volcanism, in Dilek, Y. and Pavlides, S., eds., Post-Collisional Tectonics and Magmatism in the Eastern Mediterranean Region, GSA Special Paper no. 409, Geological Society of America, p.305-319
Güleç, N., 1991, Crust-mantle interaction in western Turkey: implications from Sr-
Nd isotope geochemistry of Tertiary and Quaternary volcanics, Geological Magazine, v.128, p.417-435

174
Hayba, D.O., Bethke, P.M., Heald, P., and Foley, N.K., 1985, Geologic, mineralogic and geochemical characteristics of volcanic-hosted epithermal precious-metal deposits, Reviews in Economic Geology, v.2, p.129-167
Heald, P., Hayba, D.O., and Foley, N.K., 1987, Comparative anatomy of volcanic-
hosted epithermal deposits: Acid-sulfate and adularia-sericite types: Economic Geology, v.82, p.1-26
Hedenquist, J.W. and Sillitoe, R.H., 2003, Linkages between volcanotectonic settings, ore-fluid compositions, and epithermal precious metal deposits, in Simmons, S.F., Graham, I., eds, Volcanic, geothermal, and ore-forming fluids; rulers and witnesses of processes within the Earth. Special Publication, Society of Economic Geologists, Ore Geology Reviews, v.10, p 315-343
Hedenquist, J.W., Arribas M., A., and Gonzalez-Urien, E., 2000, Exploration for
epithermal gold deposits, in Hagemann, S.G., Brown, P.E., eds, Gold in 2000, Reviews in Economic Geology, v.13, p.245-277
Hedenquist, J.W., Izawa, E., Arribas, A., Jr., White N.C., 1996, Epithermal gold
deposits: Styles characteristics, and exploration: Poster and booklet, Resource Geology Special Publication, p.1-17 (with translations to Spanish, French, Japanese, and Chinese)
Hedenquist, J. W. and Lowenstein, J. B., 1994, The role of magmas in the formation
of hydrothermal ore deposits, Nature, v.370, p.519–527 Hedenquist, J.W., Matsuhisa, Y., Izawa, E., White, N.C., Giggenbach, W.F., Aoki,
M., 1994, Geology, geochemistry, and origin of high sulfidation cu-au mineralization in Nansatsu district, Japan, Economic Geology, v.89, p. 1-30
Hedenquist, J.W., 1987, Mineralization associated with volcanic-related
hydrothermal systems in the Circum-Pacific Basin: Circum Pacific Energy and Mineral Resources Conference, 4th, Singapore, August 1986, Transactions, p. 513-524
Higgs., R., 1962a, The Geology of The Kartaldağ Gold Prospect, Çanakkale, MTA
Mine Investigation Report no.3450, 175 p
Higgs., R., 1962b, The Geology of The Madendağ Gold Prospect, Çanakkale, MTA

175
Mine Investigation Report no.3863, 95 p JICA (Japan International Cooperation Agency), 1991, Report on the mineral
exploration in Çanakkale area republic of Turkey, MTA Consolidated Report no.9391, 188 p
Jackson, J., and McKenzie, D., 1988, The relationship between plate motions and seismic moment tensors, and the rates of active deformation in the Mediterranean and Middle East, Geophysical Journal, Royal Astronomical Society, v.93, p.45–73
Kalafatçıoğlu, A., 1963, Ezine civarının ve Bozcaada'nın jeolojisi, kalker ve serpantinlerinin yaşı, MTA Bulletin, Publication. no.60, p.61-70 (in Turkish)
Karacık, Z., Yılmaz, Y., Pearce, J.A., and Ece, Ö.I., 2008, Petrochemistry of the
south Marmara granitoids, northwest Anatolia, Turkey, International Journal of Earth Sciences, v.97, p.1181-1200
Kissel, C., and Laj, C., 1988, The Tertiary Geodynamical Evolution of the Aegean
Arc: a Paleomagnetic Reconstruction, Tectonophysics, v.146, p.183-201 Koçyiğit, A., Yusufoğlu, H., Bozkurt, E., 1999, Evidence from the Gediz graben for
episodic two-stage extension in western Turkey, Journal of the Geological Society, London, v.156, p.605-616
Krushensky, R.D., 1976, Neogene Calc-alkaline extrusive and intrusive rocks of the
Karalar Yeşiller area, Northwest Anatolia, Turkey, Bulletin Volcanologique, v.40, p.336-360
Le Pichon, X., and Angelier, J., 1979, The Hellenic arc and Trench system: a key to
the neotectonic Evolution of the Eastern Mediterranean Area: Tectonophysics, v.60, p.1-42
Lindgren, W., 1933, Mineral deposits, 4th edition: New York, McGraw Hill Book
Company, 930 p Lindgren, W., 1922, A suggestion for the terminology of certain mineral deposits:
Economic Geology, v. 17, p. 292-294

176
Ludwig, K.R., 2003. Mathematical-statistical treatment of data and errors for Th-230/U geochronology, Uranium-Series Geochemistry, Reviews in Mineralogy and Geochemistry, v.52, p.631-656
Macgeehan, P. J.; Maclean, W. H., 1980, An Archean sub-seafloor geothermal system, ‘calc-alkali’ trends, and massive sulfide genesis, Nature, v.286, p.767-771
MacLean, W.H., 1990, Mass change calculations in altered rock series, Mineralium
Deposita, v.25, p. 44-49 Mckenzie, D.P., 1978, Active Tectonics of the Alpine-Himalayan Belt: The Aegean
Sea and Surroundings Regions (Tectonics of the Aegean Region), Geophys. J. R. Astr. Soc., v.55, p.217-254
McKenzie, D.P., 1972, Active tectonics of the Mediterranean region, Geophys. J. R.
Astr. Soc., v.30, p.109-185 Meulenkamp, J.E., Wortel, W.J.R., Van Wamel, W.A., Spakman, W., and
Hoogerduyn, Stratıng, E, 1988, On the Hellenic subduction zone and geodynamic evolution of Crete in the late middle Miocene, Tectonophysics, v.146, p.203-215
Molly, E.W., 1961, Türkiye Batısında Altın ve Platin Aramaları (1960-1961), MTA
publication no. 2841 (in Turkish and French)
Moore, D. and R.C. Reynolds, Jr., 1997, X-Ray Diffraction and the Identification and Analysis of Clay Minerals, 2nd ed., Oxford University Press, New York, 378 p.
MTA, 1993, Gold and Silver Inventory of Turkey, MTA publication no.198, 46 p. (in Turkish)
Okay, A.I. and Göncüoğlu, M.C., 2004, The Karakaya Complex: A Review of Data
and Concepts. Turkish Journal of Earth Sciences, v.13, p.77-95 Okay A.I., Tansel, İ., and Tüysüz, O., 2001, Obduction, subduction and collision as
reflected in the Upper Cretaceous-Lower Eocene sedimentary record of western Turkey. Geological Magazine, v.138, p.117-142

177
Okay, A.I. and Satır, M., 2000, Upper Cretaceous eclogite facies metamorphic rocks from the Biga Peninsula, northwest Turkey. Turkish Journal of Earth Sciences, v.9, p.47-56
Okay, A. I., and Tüysüz, O., 1999, Tethyan sutures of northern Turkey, in Durand,
B., Jolivet, L., Horvath, D., and Serranne, M., eds., The Mediterranean basins: Tertiary extension within the Alpine orogen: geological Society of London, Special Publication, no. 156, p. 475-515
Okay, A.I., Siyako, M., and Bürkan, K.A., 1991, Geology and tectonic evolution of
the Biga Peninsula, northwest Turkey Bulletin of the Technical University of İstanbul, v.44, p.191-256
Oyman T., Minareci F., Piskin Ö., 2003, Efemcukuru B-rich epithermal gold deposit (Izmir, Turkey), Ore Geology Reviews 23, 35–53
Pirajno, F., 2009, Hydrothermal processes and mineral systems, Dordrecht; London, Springer, Geological Survey of Western Australia, 1250 p
Pirajno, F., 1995, Volcanic Hosted Epithermal Systems in Northwest Turkey, South
African Journal of Geology, v.98, p.13-24 Renne, P.R., Karner, B.D., Ludwig, K.R., 1998, Radioisotope Dating: Enhanced:
Absolute Ages Aren't Exactly, Science, v.282, p.1840-1841 Robertson, A.H.F. and Mountrakis, D., 2006, Tectonic development of the Eastern
Mediterranean region: an introduction, in Robertson, A.H.F. and Mountrakis, D., eds., Tectonic development of the Eastern Mediterranean region, Geological Society Special Publication, v. 260, p.1-9
Robinson, B.W., Kusakabe, M., 1975, Quantitative preparation of sulfurdioxide for
34S/ 32S analyses, from sulfides by combustion with cuprous oxide, Anal. Chem., v.47, p.1179-1181
Robinson, D. J., 1984, Silicate facies iron-formation and strata-bound alteration:
Tuffaceous exhalites derived by mixing evidence from Mn garnet-stilpnomelane rocks at Redstone, Timmins, Ontario: Economic Geology, v.79, p. 1796-1817

178
Roedder, E., 1984, The fluids in salt, American Mineralogist, v.69, p.413-439
Rollinson, H.R., 1993, Using Geochemical Data: Evaluation, Presentation, Interpretation, Longman, UK, 352 p
Rye, R.O., 1993, The evolution of magmatic fluids in the epithermal environment:
the stable isotope perspective, Economic Geology, v.88, p.733-753 Seyitoğlu and Scott, 1996, The age of Alaşehir graben (west Turkey) and its tectonic
implications, Geological Journal, v.31, p.1-11
Seyitoğlu, G., Scott, B.C., Rundle, C.C., 1992, Timing of Cenozoic extensional tectonics in west Turkey. Journal of the Geological Society, London, v.149, 533-538
Seyitoğlu, G., Scott, B.C., 1992, Late Cenozoic volcanic evolution of the
northeastern Aegean region, Journal of Volcanology and Geothermal Research, v.54, p. 157-176
Sillitoe,R.H.,1993,Giant and bonanza gold deposits in the epithermal environment, in
Whiting, B.H., Mason, R., Hodgson, C.J., eds., Giant ore deposits, Soc. Econ Geol. Spec. Pub. v.l2, p.125–156
Sillitoe, R. H., 1989, Gold deposits in the Western Pacific Island Arcs: The magmatic connection, Economic Geology, Monograph 6, p.274–291
Sillitoe, R.H., 1977, Metallic mineralization affiliated to subaerial volcanism: a
review, Geological Society, London, Special Publications, v.7, p.99-116 Simmons, A.T., Tosdal, R.M., Baker, D.E.L., Friedman, R.M. and Ullrich, T.D.,
2005, Late Cretaceous Volcano-Plutonic Arcs in Northwestern British Columbia: Implications for Porphyry and Epithermal Deposits, in Geological Fieldwork 2004, Grant, B. and Newell, J.M., eds., B.C. Ministry of Energy Mines and Petroleum Resources, Paper RR15, p.347-360
Siyako, M., Bürkan, K., Okay, A.I., 1989, Biga ve Gelibolu yarımadalarının Tersiyer
jeolojisi ve hidrokarbon olanakları. Türkiye Petrol Jeologları Derneği Bülteni, v.1, p.183-199 (in Turkish)

179
Şengör, A.M.C., 1987, Tectonics of the Tethysides: orogenic collage development in a collisional setting, Ann. Rev. Earth Planet. Sc., v.15, p.213-244
Şengör, A. M. C., Görür, N. and Şaroğlu, F., 1985, Strike-slip deformation basin
formation and sedimentation: Strike-slip faulting and related basin formation in zones of tectonic escape: Turkey as a case study, in Biddle, K.T. and Christie-Blick, N., eds., Strike-slip faulting and basin formation. Society of Economic Paleontologists and Mineralogist, Special Publication, v.37, p.227-264
Şengör, A. M. C., and Yılmaz, Y., 1981, Tethyan evolution of Turkey: A plate tectonic approach, Tectonophysics, v 75, p. 181-241
Şengör, A.M.C., 1979. Mid-Mesozoic closure of the Permo-Triassic Tethys and its
implications, Nature, v.279, p.590-593 Şengün, F., Yigitbas, E. and Tunç, İ.O., 2010, Geology and Tectonic Emplacement
of Eclogite and Blueschist, Biga Peninsula, Northwest Turkey, Turkish Journal of Earth Sciences, doi: 10.3906/yer-0912-75 (in print)
Şengün, F. and Çalık, A. 2007, Çamlıca Metamorfitlerinin (Biga Yarımadası, KB Türkiye) Metamorfizma Özellikleri ve Korelasyonu, Türkiye Jeoloji Bülteni, v.50, p.1-16 (in Turkish)
Şentürk, K. and Karaköse, C., 1987, Çanakkale Boğazı ve dolayının jeolojisi, MTA
report No. 9333(unpublished) Taymaz, T., Jackson, J.A., and Westaway, R., 1990, Earthquake Mechanisms in the
Hellenic Trench near Crete, Geophysical Journal International-Oxford, v.102, p.695-731
Taymaz, T., Wright, T., Yolsal, S., Tan, O., Fielding, E.and Seyitoğlu, G., 2007,
Source characteristics of June 6, 2000 Orta-Çankırı (Central Turkey) earthquake: a synthesis of seismological, geological and geodetic (InSAR) observations, and internal deformation of Anatolian plate, in The Geodynamics of the Aegean and Anatolia, Taymaz, T., Yılmaz, Y., Dilek, Y., eds., The Geological Society of London, Special Publications Book, v.291, p.259-290
Taymaz, T., Jackson, J.A. and McKenzie, D., 1991, Active Tectonics of the North
and Central Aegean Sea. Geophysical Journal International-Oxford, v.106, p.433-490

180
Taylor, B.E., 2007, Epithermal gold deposits, in Goodfellow, W.D., ed., Mineral Deposits of Canada: A Synthesis of Major Deposit-Types, District Metallogeny, the Evolution of Geological Provinces, and Exploration Methods: Geological Association of Canada, Mineral Deposits Division, Special 5, p. 113-139
Watanabe, Y., Murakami, H., Cengiz, İ., Sari, R., Küçükefe., S., and Yıldırım, S., 2003, Study on Hydrothermal Deposits and Metallogeny in Western Turkey: Progress Report No.1 (interim report), 60 p
White, N.C., and Hedenquist, J.W., 1995, Epithermal gold deposits: Styles, characteristics, and exploration: Society of Economic Geologists Newsletter, no. 23, p.9-13
White, N.C., 1991, High sulfidation epithermal gold deposits: Characteristics and a
model for their origin, Geological Survey of Japan Report 277, p.9-20 White N.C., and Hedenquist J. W., 1990, Epithermal environments and styles of
mineralization: Variations and their causes, and guidelines for their exploration: Journal of Geochemical Exploration, v.36, p.445-474
Yıldırım, S., and Cengiz, İ., 2004, Şahinli (Lapseki-Çanakkale) Au-Ag Sahasının Jeoloji ve Jeokimyası, (online) Available, http: //www. hititmadencilik. com. /son/makaleler, August 23, 2010 (in Turkish)
Yılmaz, H., Oyman, T., Sönmez, F.N., Arehart, G.B., and Billor, Z., 2010,
Intermediate sulfidation epithermal gold-base metal deposits in Tertiary subaerial volcanic rocks, Sahinli/Tespih Dere (Lapseki/Western Turkey), Ore Geology Reviews, v. 37, p.236–258
Yılmaz, H., Oyman, T., Arehart, G.A., Çolakoğlu, R., and Billor, Z., 2007, Low-
sulfidation type Au–Ag mineralization at Bergama, Izmir, Turkey, Ore Geology Reviews, v.32, p.81-124
Yılmaz, H., 2003, Exploration at the Kuşçayırı Au (Cu) prospect and its implications
for porphyry-related mineralization in western Turkey, Journal of Geochemical Exploration, v.77, p.133–150
Yılmaz, H., 2002, Ovacık gold deposit: An example of quartz-adularia- type gold
mineralization in Turkey: Economic Geology, v.97, p.1829-1839

181
Yılmaz, Y., Genç, Ş.C., Yiğitbaş, E., Bozcu, M., Yılmaz, K., 1995, Geological Evolution, of the late Mesozoic continental margin of Northwestern Anatolia, Tectonophysics, v. 243, p.155-171
Yılmaz, Y., Genç, S.C., Karacık, Z., and Altunkaynak, Ş., 2001, Two contrasting magmatic associations of NW Anatolia and their tectonic significance: Journal of Geodynamics, v.31, p.243-271
Yiğit, Ö., 2009, Mineral deposits of Turkey in relation to Tethyan Metallogeny: implications for future mineral exploration, Economic Geology, v.104, p.19-51 Yiğit, Ö., 2006, Gold in Turkey—a missing link in Tethyan metallogeny, Ore
Geology Reviews, v. 228, p.147-179