genetic linkage
TRANSCRIPT

GENETIC LINKAGE
• Genes on nonhomologous chromosomes assort independently during meiosis.
• Genes on the same chromosome are said to exhibit linkage and are called linked genes.
• Linked genes, and hence the phenotypic characters they control, are inherited together because they are located on the same chromosome.
• Modern understanding of genetic linkage came from the work of Thomas Morgan. Morgan showed that two recessive genes in Drosophila melanogaster; white eye (w) and miniature wing (m) are X-linked.
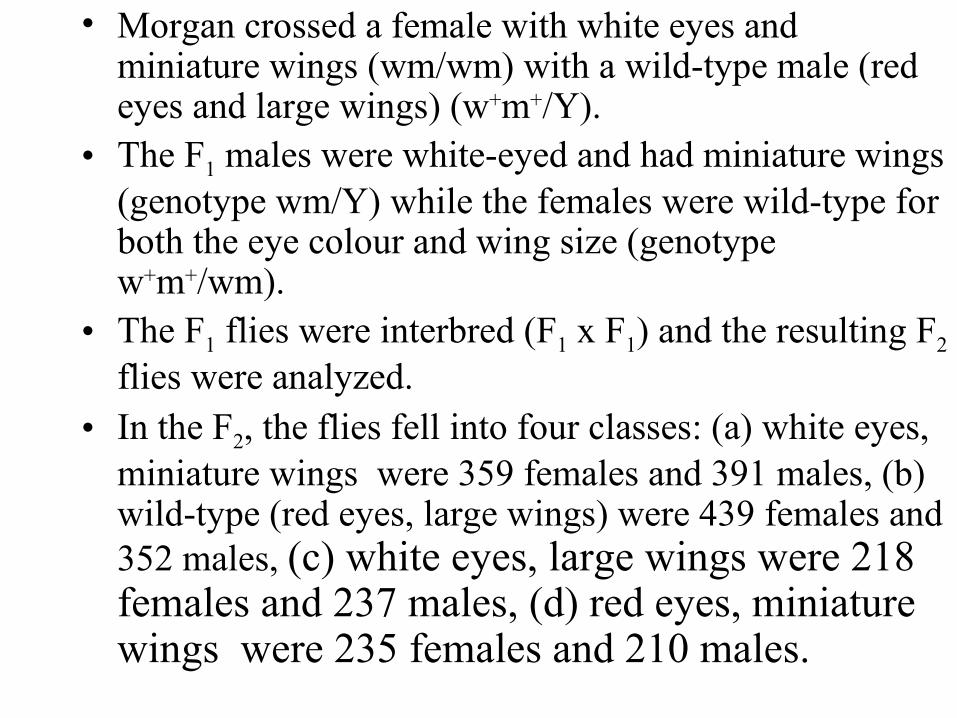
• Morgan crossed a female with white eyes and miniature wings (wm/wm) with a wild-type male (red eyes and large wings) (w+m+/Y).
• The F1 males were white-eyed and had miniature wings (genotype wm/Y) while the females were wild-type for both the eye colour and wing size (genotype w+m+/wm).
• The F1 flies were interbred (F1 x F1) and the resulting F2 flies were analyzed.
• In the F2, the flies fell into four classes: (a) white eyes, miniature wings were 359 females and 391 males, (b) wild-type (red eyes, large wings) were 439 females and 352 males, (c) white eyes, large wings were 218 females and 237 males, (d) red eyes, miniature wings were 235 females and 210 males.

• In the F2 the most frequent phenotypic classes in both sexes were the grandparental phenotypes (class a and b).
• The genotypes or phenotypes of the original parents are referred to as parental classes.
• There were also flies with the nonparental phenotypic combinations (class c and d). Nonparental combinations of linked genes are called recombinants.
• To explain for the recombinants he proposed that in meiosis, exchange of genes had occurred between the two X chromosomes of the F1 females. Since males are hemizygous, no such genetic exchange occurred between X and Y chromosomes.
• The production of recombinants results from physical exchanges between homologous chromosomes during meiotic prophase I.
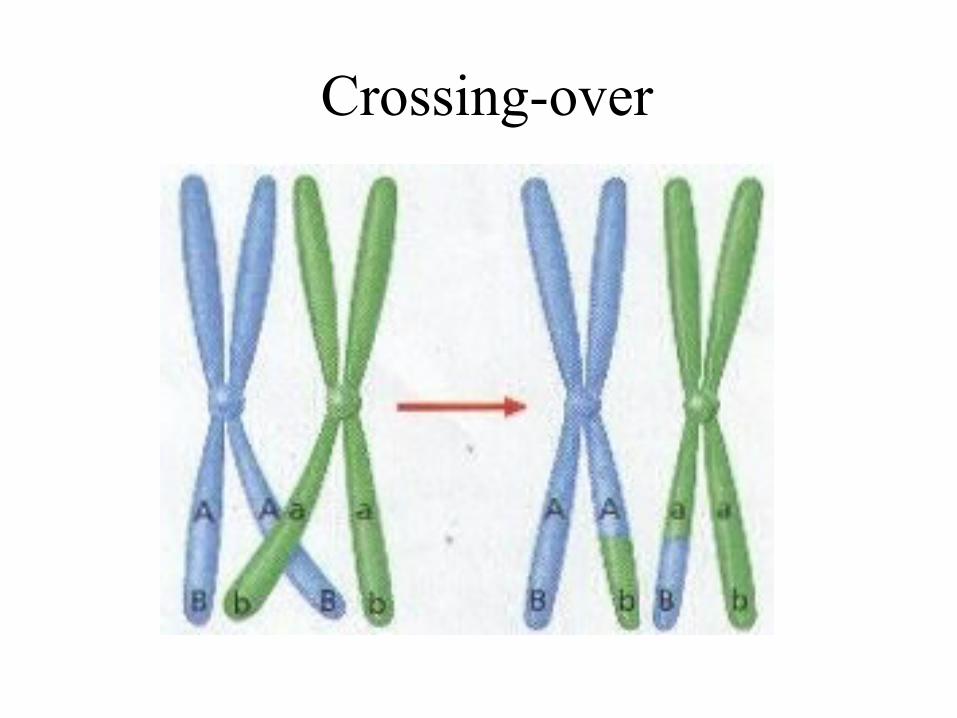
Crossing-over

• Crossing-over is the reciprocal exchange of chromosome parts at corresponding positions along homologous chromosomes by symmetrical breakage and rejoining. Crossing-over is the event that leads to genetic recombination between linked genes.
• Morgan’s conclusion was that during meiosis, alleles of some genes assort together because they lie near each other on the same chromosome.
• In many cases, two alleles inherited from one parent show a strong tendency to stay together as do those from the other parent. This phenomenon is called linkage.
• The closer two genes are on the chromosome, the more likely they are to remain together during meiosis.

Construction of genetic maps• Genetic mapping is the process that uses genetic
experiment to determine the relative position of genes on chromosomes in eukaryotic organisms.
• A genetic map gives the order in which genes are arranged along a chromosome and the spacing between them on the same chromosome.
• The map distance between two genes is based on the frequency of recombination between the two genes. The recombination frequency is an approximation of the frequency of crossovers between the two genes.
• The frequency of crossing-over, and hence recombinants, for linked genes is characteristic of the gene pairs involved e.g. for the white eye (w) and miniature wing (m) which are X-linked the frequency of crossing-over is 36.9%

• The frequency of recombinants for two linked genes is the same regardless of how alleles of the two genes involved are arranged on homologous chromosomes.
• In an individual doubly heterozygous for the w and m alleles, the alleles can be arranged in two ways; an arrangement called coupling (or the cis configuration) w+m+/wm in which the two wild type alleles are on one homolog or an arrangement called repulsion (or the trans configuration) w+m/wm+ in which each homolog carries the wild-type allele.

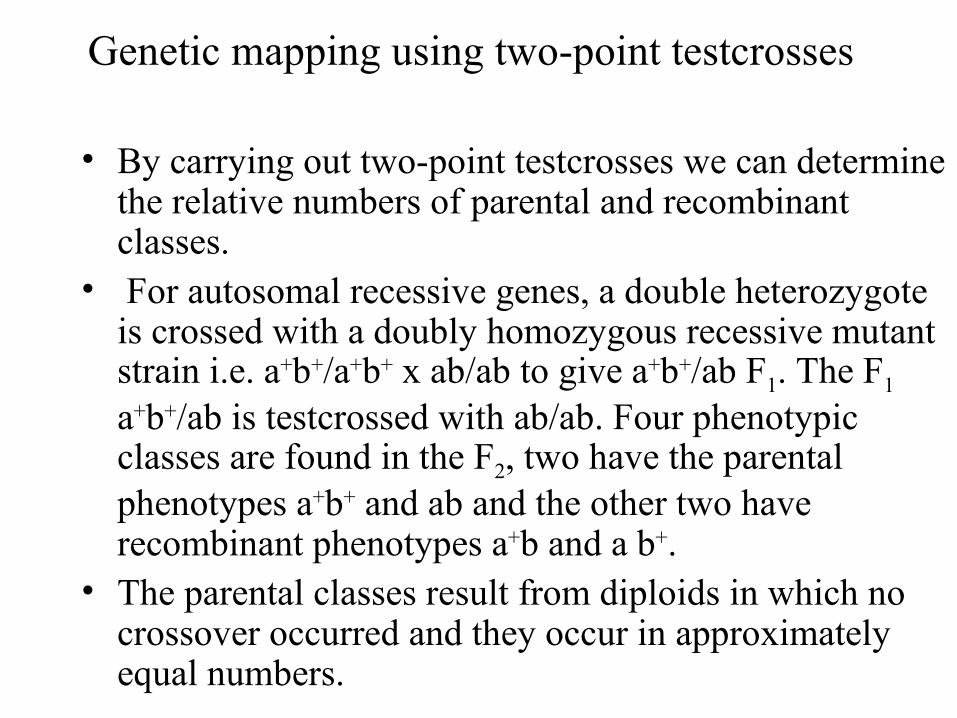
Genetic mapping using two-point testcrosses
• By carrying out two-point testcrosses we can determine the relative numbers of parental and recombinant classes.
• For autosomal recessive genes, a double heterozygote is crossed with a doubly homozygous recessive mutant strain i.e. a+b+/a+b+ x ab/ab to give a+b+/ab F1. The F1 a+b+/ab is testcrossed with ab/ab. Four phenotypic classes are found in the F2, two have the parental phenotypes a+b+ and ab and the other two have recombinant phenotypes a+b and a b+.
• The parental classes result from diploids in which no crossover occurred and they occur in approximately equal numbers.

• The recombinant classes derive from diploids in which a single crossover event has occurred between homologous chromosomes. They also occur in approximately equal numbers.
• Because a single crossover event occurs more rarely than no crossing-over, an excess of parental phenotypes over recombinants in the progeny of a testcross indicates linkage between the genes involved.
• For X-linked recessive genes, a double heterozygous female is testcrossed with a hemizygous male carrying the recessive allele (i.e. a+b+/ab x ab/Y).
• For any testcross, the percentage of recombinants in the progeny cannot exceed 50%. If the genes are assorting independently, an equal number of recombinants and parentals are expected, hence the frequency of recombinants is 50% and the genes involved are unlinked.

• Genes may be unlinked in two ways: the genes may be on different chromosomes or the genes may be on the same chromosome but lie far apart that at least one crossover is certain to occur between them.
• The characteristic crossover frequencies for linked genes can be related to the physical distances separating the genes on the chromosome.
• The percentage of recombinant is used as a quantitative measure of the genetic distance between two gene pairs on a genetic map.
• The distance between two genes is measured in map units. The map unit (mu) is also called a centimorgan (cM).
• A crossover frequency of one percent between two genes is defined as one map unit. That is, one map unit is the distance between gene pairs for which one product out of 100 (1%) is recombinant.

• Before beginning any experiment to construct a genetic map, geneticists must show that the genes under consideration are linked.
• A way to test for linkage is to analyze the results of crosses to see whether the number of offspring in different phenotypic classes deviate significantly from the ratios expected from independent assortment of genes.
• The best cross to use is the testcross, a cross of one individual with unknown genotype with another individual homozygous recessive for all genes involved.
• A chi-square (χ2) test can be used to determine if the observed numbers significantly deviate from the expectation.

• In Drosophila, b is a recessive autosomal mutation which, when homozygous, results in black body colour, and vg is a recessive autosomal mutation which, when homozygous, results in flies with vestigial (short, crumpled) wings. Wild-type flies have grey bodies and normal (long, uncrumpled) wings. True-breeding black, normal wing (b/b vg+/vg+) flies were crossed with true-breeding grey, vestigial wing (b+/b+ vg/vg) flies. F1 grey, normal (b+/b vg+/vg) female flies were testcrossed to black, vestigial (b/b vg/vg) male flies. The testcross progeny were:
- 283 grey-normal, 1,294 grey-vestigial, 1,418 black-normal and 241black-vestigial.
- Use the χ2 test to test the hypothesis that the two genes are unlinked.

• If the two genes are unlinked, then a testcross should result in a 1:1:1:1 ratio of the four phenotypic classes.
• A significant deviation from this ratio in the direction of too many parental types and too few recombinant types would suggest that the two genes are linked.
• The chi-square test can be used to make a decision on the significance of the deviation. The calculation of chi-square is shown in the Table below. Given the total number of progeny (3,236) and the hypothesis under evaluation (1:1:1:1 ratio), the expected number of progeny for each phenotypic class is 809. The chi-square value is
χ2 = ΣD2/E; where D is the deviation(O-E) and E is the expected value.

Calculation of chi-square
χ2 = 1,489.993,2363,236Total
398.79322,624-568809241Black-vestigial
458.44370,8816098091,418Back-normal
290.76235,2254858091,294Grey-vestigial
342.00276,676-526809283Grey-normal
D2/ED2Deviation (D)
Expected number (E)
Observed number (O)
Phenotypes

• The χ2 value and the degree of freedom (df) (n-1, n being the number of phenotypic classes) are used with a table of χ2 probabilities to determine the probability (P) that the deviation of the observed values from the expected values is due to chance. If P is greater than 5% (P > 0.05), the deviation is statistically not significant. If P is less or equal to 5% (P ≤ 0.05), the deviation is statistically significant, not due to chance alone.
• For our example, χ2 = 1,490, with 3 df, the P value is much lower than 0.001. Thus, we reject the hypothesis of independent assortment, and think of an alternative hypothesis that the genes are linked.

• Since the genes are linked, we can calculate the genetic distance between the two genes and construct a genetic map.
• The map distance between two genes is indirectly indicated by the frequency of recombination between the two genes, which is an approximation of the frequency of crossovers between the two genes.
• To get the recombination frequency, we calculate the percentage of recombinant types;
• Percent recombinant = (number of recombinants /total number of progeny) x 100.
• The value for the percentage of recombinants is usually converted directly into map units (mu).

• For our example, the recombinants are the grey- normal (283) and black-vestigial (241) progeny. The parentals are the grey-vestigial (1,294) and back-normal (1,418).
• Hence, the number of recombinants is 524 and the total number of progeny is 3,236.
• Percent recombinants = (524/3,236) x 100 = 16.19%.
• Thus, the two genes are 16.2 mu or 16.2 cM apart.
b 16.2 cM vg

Double crossovers
• For low recombination fraction (less than 10%), 1 map unit (1 cM) equals 1% recombination frequency. For distance greater than this, there is an appreciable chance that more than one crossover will occur between loci.
• If two crossovers occur the event is called a double crossover.
• A single crossover between linked genes generates half parental and half recombinant gametes whereas a double crossover gives only parental types.

Effects of double crossovers in genetic mapping
• Double crossovers does not result in recombination of the allelic pairs, so only parental progeny are produced. The same progeny would result if there was no crossing over between the two chromatids.
• The double crossover event does not generate recombinants, thus the result of the two crossovers are uncounted.
• Since genetic map distance is derived from the average frequency of crossing over occurring between linked genes, the estimate of map distance between two genes will be low.

• If no multiple crossovers occurs between linked genes, there will be a direct linear relationship between genetic map distance and recombination frequency.
• When genes are far apart, the incidence of multiple crossovers causes the recombination frequency to be an underestimate of the genetic map distance.
• Double crossovers occur rarely within distances of 10 mu or less, and they occur more frequently in greater physical distances for certain chromosome regions.
• One way to get accurate map distance is to study closely linked genes.
• Another efficient way is to use a three point testcross involving three genes within a relatively short section of a chromosome.

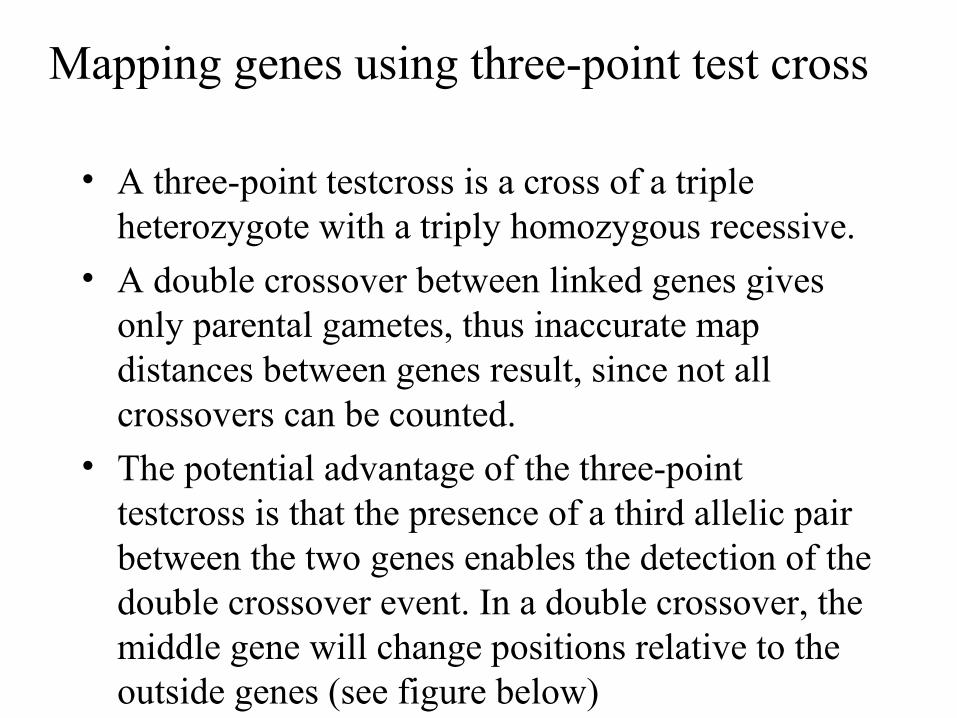
Mapping genes using three-point test cross
• A three-point testcross is a cross of a triple heterozygote with a triply homozygous recessive.
• A double crossover between linked genes gives only parental gametes, thus inaccurate map distances between genes result, since not all crossovers can be counted.
• The potential advantage of the three-point testcross is that the presence of a third allelic pair between the two genes enables the detection of the double crossover event. In a double crossover, the middle gene will change positions relative to the outside genes (see figure below)


• In the figure above, a two-strand double crossover event between genes ‘a’ and ‘c’ is detected by the recombination of the B/b allelic pair in relation to the other two allelic pairs.
• If the mutant genes in the cross are all recessive, a typical three-point testcross will be: a+b+c+/abc x abc/abc.
• In a testcross involving sex-linked genes, the female is the heterozygous strain (assuming that the female is the homogametic sex) and the male is hemizygous for the recessive alleles.

Example
• In Drosophila the non-wild type alleles for eye colour, cross-wing vein and wing edge are v (vermilion eyes), cv (cross veinless wings) and ct (cut wing edges), respectively. A cross was made between the homozygous doubly recessive flies of genotype v+ cv ct/v+ cv ct and homozygous singly recessive flies of genotype v cv+ ct+/v cv+ ct+. From this cross triply heterozygous progeny of genotype v cv ct/v+ cv+ ct+ were obtained and the females of this genotype were testcrossed to triple recessive males of genotype v cv ct/v cv ct. The progeny types and their numbers are shown below. From these data calculate the map distance between genes.

5v+ cv ct+8
3v cv+ ct7
94v+ cv+ ct+6
89v cv ct5
40v+cv+ ct4
45v cv ct+3
592v+ cv ct2
580v cv+ ct+1
Number observedGenotypeClass

• Step 1: Determine the parental genotypes, recombinant genotypes from single crossover and double crossover
- The most frequently observed classes (i.e class 1 and 2) are the parental types. Parental genotypes are v cv+ ct+ and v+ cv ct.
- The frequency of a double crossover in a region is expected to be lower than the frequency of a single crossover, hence, double-crossover genotypes are the least frequent class found. Class 7 and 8 are recombinants from double crossover gametes.
- Class 3 to 6 are recombinants from single crossover gametes.

• Step 2: Determine the gene order - To determine the gene order we must first
determine which gene is in the centre.- Recall that a double crossover event involving the
same two chromatids changes the orientation of the gene in the centre of the sequence with respect to the two flanking allelic pairs.
- By comparing the parental genotypes (v cv+ ct+ and v+ cv ct) and the genotypes of double crossover gametes (v cv+ ct and v+ cv ct+), we see that the gene that changed its orientation is ct and this gene must be in the centre.
- Therefore, the gene order is v ct cv. The gene order for all classes can now be rewritten as follows:

Recombinants (double crossovers)5v+ ct+ cv8
Recombinants (double crossovers)3v ct cv+7
Recombinants (single crossovers in region v – ct)
94v+ ct+ cv+6
Recombinants (single crossovers in region v – ct)
89v ct cv5
Recombinants (single crossovers in region ct – cv)
40v+ ct cv+4
Recombinants (single crossovers in region ct – cv)
45v ct+ cv3
Parentals592v+ ct cv2
Parentals580v ct+ cv+1
TypeNumber observed
GenotypesClass

• Map distances can now be calculated. The frequency of crossover is computed between two genes at a time.
• Recombination frequency between gene v and ct = (single crossovers in region v-ct + double crossovers/ total number of progeny) x 100
• = ((89 + 94 + 3+5)/1448)x 100 = 13.2%• The map distance between genes v and ct is 13.2 mu • Recombination frequency between gene ct and cv = (single crossovers in region ct-cv + double crossovers/ total number of progeny) x 100
• = ((45 + 40 + 3+5)/1448)x 100 = 6.4%• The map distance between genes ct and cv is 6.4 mu• To compute the distance between v and cv we add the two
map distances (v–ct + ct-cv), which is 13.2 + 6.4 = 19.6 mu• We can now construct the genetic linkage map for the three
genes

Genetic linkage map of the v ct cv region of the chromosome
v 13.2 mu ct 6.4 mu cv

Interference and Coincidence
• The map distances can tell us about the chromosomal recombination. The map distance of 13.2 mu between genes v and ct means that 13.2% of the gametes should result from crossing-over between the two gene loci. Similarly, the map distance of 6.4 mu between genes ct and cv means that 6.4% of the gametes should result from crossing-over between the two gene loci.
• However, double crossover progeny typically do not appear as often as the map distances between genes lead us to expect.
• Once a crossing-over event has occurred in part of the meiotic tetrad, the probability of another crossing-over event occurring nearby is reduced.

• This is probably by physical interference caused by the breaking and rejoining of the chromatids.
• This phenomenon is called chiasma interference or chromosomal interference.
• The interference is expressed as a coefficient of coincidence.
• Coefficient of coincidence = observed double crossover frequency/expected double crossover frequency.
• Interference = 1 - Coefficient of coincidence.• To compute the expected double crossover
frequency we use the product rule: the probability of two independent events occurring simultaneously is equal to the product of the individual probabilities of two single events.

• Thus, the probability of two crossovers (double crossover) occurring between the genes is equal to the product of the probabilities of the two events occurring separately.
• Expected double crossover frequency = (map distance for region I/100) x (map distance for region II/100).
• In our example, expected double crossover frequency = (13.2/100) x (6.4/100) = 0.0084.
• Observed double crossover frequency = (3+5)/1448 = 0.0055.
• The coefficient of coincidence is 0.0055/0.0084 = 0.655.
• The interference is 1 – 0.655 = 0.345.

• A coincidence of one means that in a given region all double crossovers occurred that were expected on the basis of two independent events, there is no interference, so the interference value is zero.
• If the coefficient of coincidence is zero, none of the expected double crossovers occurred, there is total interference, so the interference value is one.
• In the example above, the interference value is 0.345 (i.e. 34.5%), meaning that only 65.5% of the expected crossovers occurred in the cross.