genetic selection using genetic...
TRANSCRIPT
2004 BEEF CATTLE SHORT COURSE 7
Genetic Selection Using Genetic MarkersGary R. HansenAssistant Professor
North Florida Research and Education CenterUF/IFAS
Marianna, FL
With recent advancements in biotechnology,genetic selection of beef cattle has entered the 21st
century. Cattle producers now have the ability toassess the genetic makeup of an individual animalthrough the use of genetic markers. Using a tissuesample (hair, blood, muscle, etc.), cattle can betested to see if they carry certain genes and whetherthe allelic combinations within the gene will havea net positive or negative influence when the geneis expressed in the animal. This type of technologywill have widespread economic impact on the cattleindustry. Using genetic markers will help to speedup selection of animals for traits that are difficultto measure due to expensive data collection as wellas traits that are measured only in one sex ormeasured late in the life of an animal. Basic geneticprinciples must be understood to have anunderstanding of the use of genetic markers.
Chromosomes are long thread-like strands ofDNA located in the nucleus that contain the codeto make proteins, enzymes, hormones, etc. Genesare a discrete segment of a chromosome. Theunique nucleotide sequence within a genedetermines its specific biological role. Many genescode for protein products while others are involvedin metabolic and developmental events. Othersgenes regulate when different genes will beexpressed or not expressed depending upondifferent metabolic pathways synthesized in theanimal. Alleles are alternate forms of genes.Animals that have the same allele at a given locusare homozygotes (BB, bb) while animals withdifferent alleles at the same locus are heterozygotes(Bb). Mutations of a single nucleotide, called asingle nucleotide polymorphism (SNP) can affectthe expression of a gene, especially if the mutationtakes place in a coding region. These types ofmutations lead to a specific nucleotide sequencethat give rise to easily detectable gene markers that
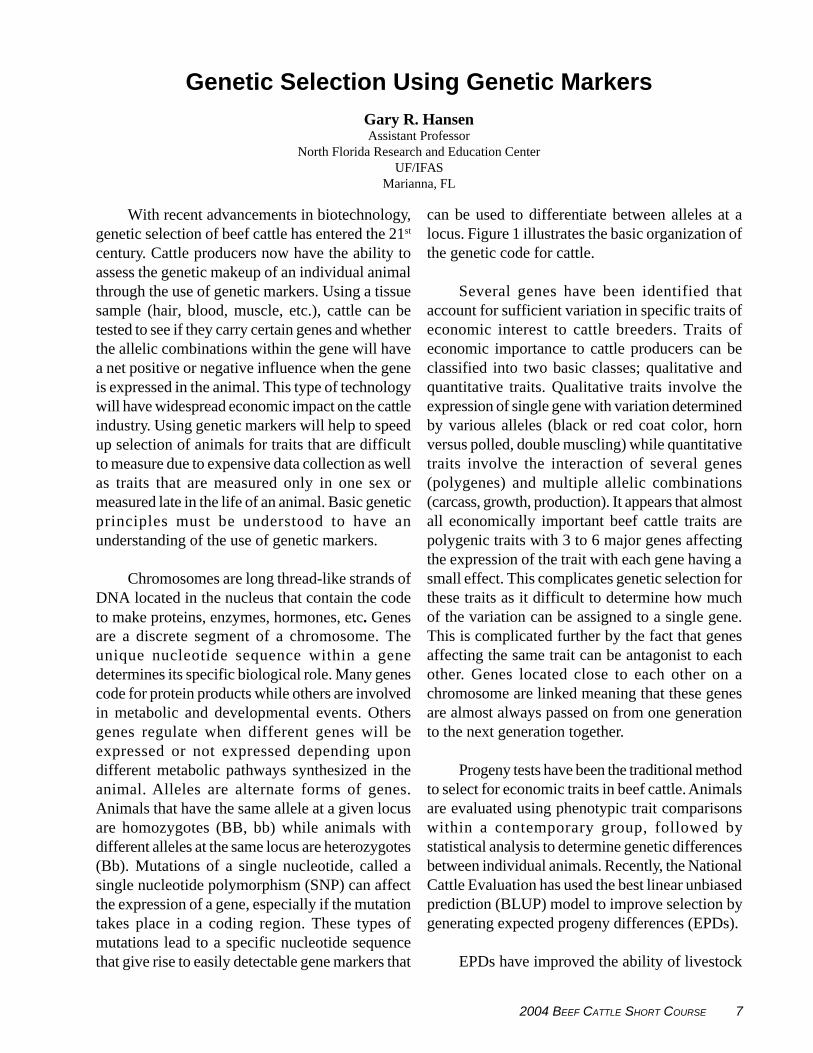
can be used to differentiate between alleles at alocus. Figure 1 illustrates the basic organization ofthe genetic code for cattle.
Several genes have been identified thataccount for sufficient variation in specific traits ofeconomic interest to cattle breeders. Traits ofeconomic importance to cattle producers can beclassified into two basic classes; qualitative andquantitative traits. Qualitative traits involve theexpression of single gene with variation determinedby various alleles (black or red coat color, hornversus polled, double muscling) while quantitativetraits involve the interaction of several genes(polygenes) and multiple allelic combinations(carcass, growth, production). It appears that almostall economically important beef cattle traits arepolygenic traits with 3 to 6 major genes affectingthe expression of the trait with each gene having asmall effect. This complicates genetic selection forthese traits as it difficult to determine how muchof the variation can be assigned to a single gene.This is complicated further by the fact that genesaffecting the same trait can be antagonist to eachother. Genes located close to each other on achromosome are linked meaning that these genesare almost always passed on from one generationto the next generation together.
Progeny tests have been the traditional methodto select for economic traits in beef cattle. Animalsare evaluated using phenotypic trait comparisonswithin a contemporary group, followed bystatistical analysis to determine genetic differencesbetween individual animals. Recently, the NationalCattle Evaluation has used the best linear unbiasedprediction (BLUP) model to improve selection bygenerating expected progeny differences (EPDs).
EPDs have improved the ability of livestock
8 MANAGEMENT ISSUES AND INDUSTRY CHALLENGES IN DEFINING TIMES
G.R. Hansen
producers to affect change in their herds; however,caution must be exercised to insure properlybalanced trait selection is taking place. Under thesetypes of selection systems, progress is limited dueto expense of data collection, time betweenidentification and subsequent gene introduction inthe breeding population, and generation interval.This is complicated further in traits that are lowlyheritable (fertility, disease resistance), classifiedonly in one sex (milk production, scrotalcircumference), measured late in an individual’slife (stayability), or evaluated postmortem (carcasstraits) (Bourdon, 1988; Hohenboken, 1988). Genemarkers allow for identification of animals at birthwith the right combination of alleles for traits whereselection is difficult. Selection using geneticmarkers would decrease the time needed tointrogress desired genes into a herd of selectedanimals. Marker assisted selection is used toidentify specific regions of chromosomes wheregenes affecting quantitative traits are located (Davisand DeNise, 1998). Markers closely associate with
From Merial. Available at: http://us.igenity.com/pdfs/IGN-03-3003-FUNC-GEN_US.pdf, Accessed March 12,2004.
Figure 1. The basic genetic structure of chromosomes and genes found in beef cattle.
a gene (indirect test) or within the gene (direct test)have been identified. Several have becomecommercially available for cattle producers to usein their genetic selection programs.
Molecular Genetics
Research in molecular genetics has led totechniques that allow for identification and directmanipulation of genes that influence economictraits. Most of the knowledge about gene structureand function has been obtained throughrecombinant DNA technologies (Snustad andSimmons, 1999). Recombinant DNA approachesbegin with cloning the gene through insertion of aDNA sequence into a cloning vector. This allowsfor multiple copies of the gene to be replicated andallows for other molecular techniques that candetermine gene structure and function. Collins(1992) defined two methods to clone genes ofinterest: functional cloning and positional cloning.Functional cloning identifies a gene through its role
2004 BEEF CATTLE SHORT COURSE 9
Genetic Selection Using Genetic Markers
in the biochemical pathways of the organism ofinterest without regard to chromosomal mapposition. Positional cloning identifies genes solelyby chromosomal map position without knowinggene function (Wicking and Williamson, 1991;Paterson and Wing 1993). Positional cloning makesuse of evenly distributed polymorphic markers inthe genetic map. Markers are used to locate geneposition in a chromosomal region. As new markersare added, map resolution is refined revealing theexact location of the gene. This has lead to thediscovery of genetic markers to aid in the selectionof genes of economic importance.
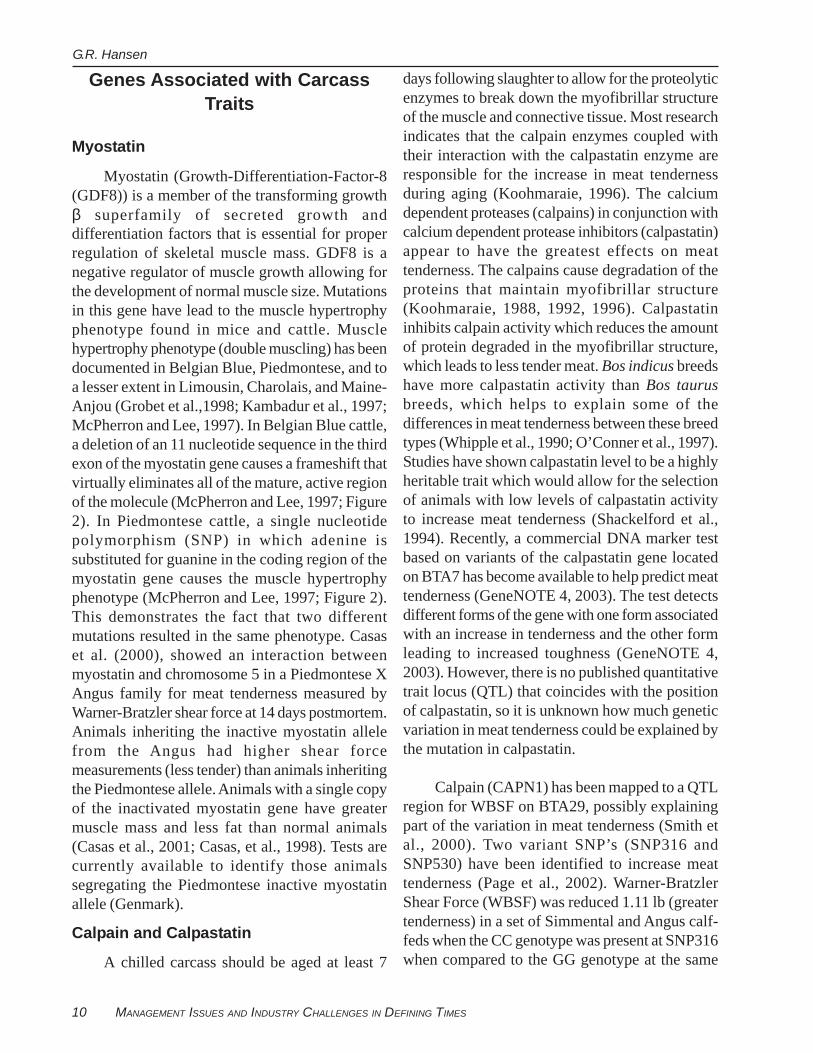
Currently there are several companies thatmarket gene tests to determine the genotype forspecific traits in beef cattle. Listed in Table 1 arecompanies that have genetic tests and the specificgenes they are able to test for.
Genetic markers are only tools that can helpimprove the accuracy of genetic selection. Geneticmarkers can be used to fix genes within a cow herd,however single trait selection should be avoidedas this leads to non-functional cattle. Cautionshould be exercised when using markers in geneticselection as relationships with other economicallyimportant genes is usually unknown.
Table 1. Current DNA markers commercially available for use in genetic selection in beef cattle.
Company Name Available Markers Gene Identity/ Location Trait Cost
a Website
Genetic Solutions GeneSTAR Tenderness Calpastatin-BTA 7 Meat Tenderness N/A www.geneticsolutions.com.au GeneSTAR Tenderness 2 Calpastatin-BTA 7
+Calpain 1- BTA29 Meat Tenderness $75.00
GeneSTAR Marbling Thryroglobin-TG5 Meat Quality $55.00 Frontier Beef Systems TenderGENE Calpain 1-BTA29 Meat Tenderness $35.00 www.frontierbeefsystems.com DoubleBLACK N/A Black Coat Color $38.00 Genmark Coat Color N/A Black Coat Color $39.00 www.genmarkag.com Myostatin-Peidmontese Myostatin-BTA2 Retail Yield/
Meat Tenderness $25.00
Merial Igenity-L Leptin-BTA4 Appetite Regulation/ Energy Utilization
$60.00 www.igenity.com
aCosts at time of publication and are subject to change. Contact company for current prices and volume discounts.
bGeneSTAR
® is a registered trademark of Genetic Solutions.
cTenderGENE
® and DoubleBLACK
® are registered trademarks of Frontier Beef Systems.
dIgenity-L
® is a registered trademark of Merial.
Source: Pollak, 2004.
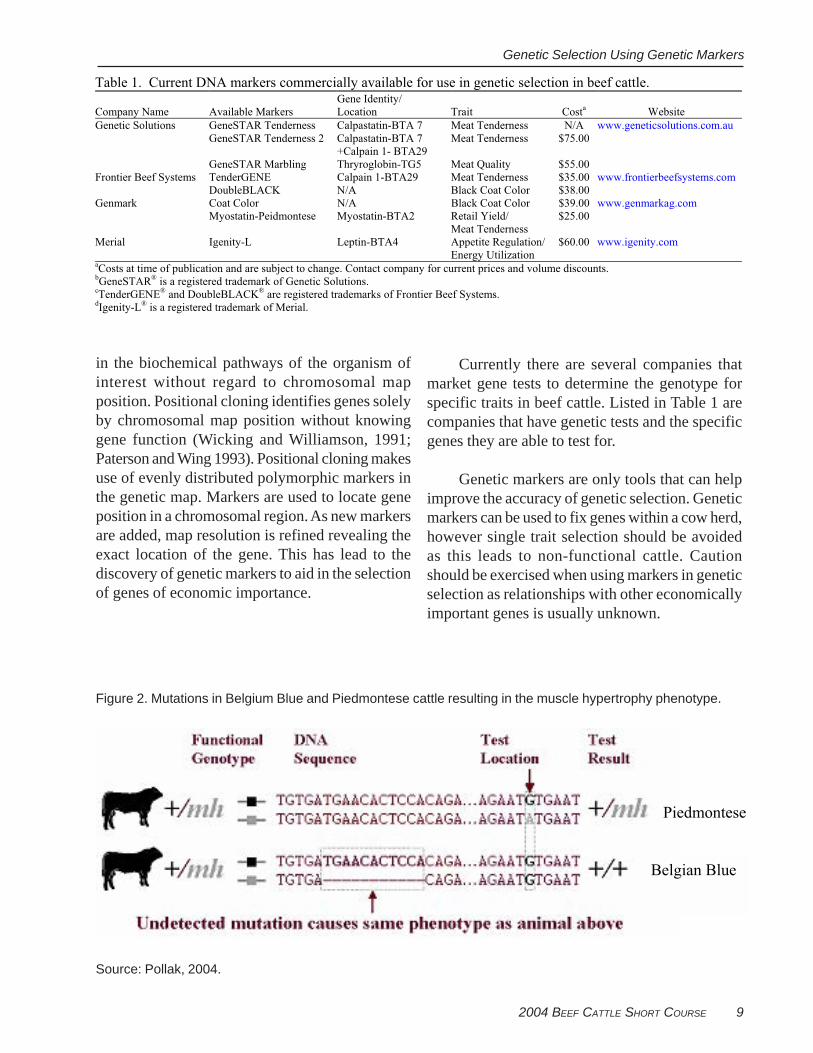
Figure 2. Mutations in Belgium Blue and Piedmontese cattle resulting in the muscle hypertrophy phenotype.
Belgian Blue
Piedmontese
10 MANAGEMENT ISSUES AND INDUSTRY CHALLENGES IN DEFINING TIMES
G.R. Hansen
Genes Associated with CarcassTraits
Myostatin
Myostatin (Growth-Differentiation-Factor-8(GDF8)) is a member of the transforming growthβ superfamily of secreted growth anddifferentiation factors that is essential for properregulation of skeletal muscle mass. GDF8 is anegative regulator of muscle growth allowing forthe development of normal muscle size. Mutationsin this gene have lead to the muscle hypertrophyphenotype found in mice and cattle. Musclehypertrophy phenotype (double muscling) has beendocumented in Belgian Blue, Piedmontese, and toa lesser extent in Limousin, Charolais, and Maine-Anjou (Grobet et al.,1998; Kambadur et al., 1997;McPherron and Lee, 1997). In Belgian Blue cattle,a deletion of an 11 nucleotide sequence in the thirdexon of the myostatin gene causes a frameshift thatvirtually eliminates all of the mature, active regionof the molecule (McPherron and Lee, 1997; Figure2). In Piedmontese cattle, a single nucleotidepolymorphism (SNP) in which adenine issubstituted for guanine in the coding region of themyostatin gene causes the muscle hypertrophyphenotype (McPherron and Lee, 1997; Figure 2).This demonstrates the fact that two differentmutations resulted in the same phenotype. Casaset al. (2000), showed an interaction betweenmyostatin and chromosome 5 in a Piedmontese XAngus family for meat tenderness measured byWarner-Bratzler shear force at 14 days postmortem.Animals inheriting the inactive myostatin allelefrom the Angus had higher shear forcemeasurements (less tender) than animals inheritingthe Piedmontese allele. Animals with a single copyof the inactivated myostatin gene have greatermuscle mass and less fat than normal animals(Casas et al., 2001; Casas, et al., 1998). Tests arecurrently available to identify those animalssegregating the Piedmontese inactive myostatinallele (Genmark).
Calpain and Calpastatin
A chilled carcass should be aged at least 7
days following slaughter to allow for the proteolyticenzymes to break down the myofibrillar structureof the muscle and connective tissue. Most researchindicates that the calpain enzymes coupled withtheir interaction with the calpastatin enzyme areresponsible for the increase in meat tendernessduring aging (Koohmaraie, 1996). The calciumdependent proteases (calpains) in conjunction withcalcium dependent protease inhibitors (calpastatin)appear to have the greatest effects on meattenderness. The calpains cause degradation of theproteins that maintain myofibrillar structure(Koohmaraie, 1988, 1992, 1996). Calpastatininhibits calpain activity which reduces the amountof protein degraded in the myofibrillar structure,which leads to less tender meat. Bos indicus breedshave more calpastatin activity than Bos taurusbreeds, which helps to explain some of thedifferences in meat tenderness between these breedtypes (Whipple et al., 1990; O’Conner et al., 1997).Studies have shown calpastatin level to be a highlyheritable trait which would allow for the selectionof animals with low levels of calpastatin activityto increase meat tenderness (Shackelford et al.,1994). Recently, a commercial DNA marker testbased on variants of the calpastatin gene locatedon BTA7 has become available to help predict meattenderness (GeneNOTE 4, 2003). The test detectsdifferent forms of the gene with one form associatedwith an increase in tenderness and the other formleading to increased toughness (GeneNOTE 4,2003). However, there is no published quantitativetrait locus (QTL) that coincides with the positionof calpastatin, so it is unknown how much geneticvariation in meat tenderness could be explained bythe mutation in calpastatin.
Calpain (CAPN1) has been mapped to a QTLregion for WBSF on BTA29, possibly explainingpart of the variation in meat tenderness (Smith etal., 2000). Two variant SNP’s (SNP316 andSNP530) have been identified to increase meattenderness (Page et al., 2002). Warner-BratzlerShear Force (WBSF) was reduced 1.11 lb (greatertenderness) in a set of Simmental and Angus calf-feds when the CC genotype was present at SNP316when compared to the GG genotype at the same
2004 BEEF CATTLE SHORT COURSE 11
Genetic Selection Using Genetic Markers
location. The CG genotype was intermediateindicating that the genotypes are additive. At thesame time, WBSF was increased 0.68 lbs whenthe AA genotype was present at SNP530 whencompared to the GG genotype. Animals with theCC genotype for SNP316 and GG genotype forSNP530 had WBSF values that were approximately1.8 lbs less than animals with the GG genotype forSNP316 and AA genotype for SNP530 (Pollack,2004). Genetic tests have been developed thatidentify various variants of calpain (GeneSTARTenderness2, TenderGENE) and calpastatin(GeneSTAR Tenderness) genes.
Leptin
The leptin protein has been implicated in theregulation of appetite, energy utilization, and fatpartitioning in cattle. Leptin is an important partof a negative feedback system that regulates insulin,glucocorticoids, and the sympathetic nervoussystem.
Variants (alleles) of a SNP in exon 2 of theleptin gene appear to be associated with variationin carcass traits in beef cattle. One SNP (cc at basepair 130) leads to higher levels of carcass fat whileanother (tt at base pair 73 and 57) is associatedwith lean tissue growth. A single nucleotide switch(cytosine versus thymine) leads to an amino acidswitch (arginine versus cysteine) which code fordifferent leptin proteins in the animal. Whencystosine (cc) is present at a critical point on theDNA of both chromosomes, the leptin proteinproduced is recognized by specific receptors in thehypothalamus which signals the body to suppressappetite and modify fat metabolism. If thymine (tt)is present at the critical point on the DNA then theleptin protein is structurally different and is largelyunrecognized by the normal receptors in the brain.The negative feedback is silenced leading toreduced efficiency in appetite and energy regulation(Merial®, 2004).
Animals with the cc genotype tend to havehigher lean tissue growth where as animals withthe tt genotype tend to have higher marbling scores.The frequency of the variant alleles in various beef
cattle breeds are listed in Table 2. Notice that Britishbreeds (higher levels of marbling and carcass fat)have a higher frequency of the t allele whileContinental breeds (higher levels of lean tissuegrowth) have a higher frequency of the c allele.The frequency of homozygous animals for the tallele in the British breeds was considerably higherthan in the Continental breeds. This would beexpected since British breeds tend to have highermarbling scores and higher yield grades thanContinental breeds.
Table 2. Frequency of the c and t alleles at the leptin SNP locus in beef breeds.
Breed t Allele frequency
C Allele frequency
Lepin-tt proportion
Angus 58% 42% 30% Hereford 55% 45% 32% Charolais 34% 66% 10% Simmental 32% 68% 10%
Source: http://sask.usask.ca/~schmutz/meat.html, 2004.
Commercially available genetic markers willbe briefly discussed. Many of the markers have onlyrecently become available so validation is still anongoing process. Producers should realize thatenvironment also plays an important role on howgenes are expressed. Different genes are expressedat different times in the production environment.Production environment can also affect to whatextent a gene is expressed. Producers should alsoconsider which animals to test. Animals that willhave a large genetic contribution to the herd (herdsires, donor cows, artificial insemination sires, etc.)should be considered as candidates for genetictesting. Caution should be exercised before cullinganimals based solely on a single genetic test.
GeneSTAR® MarblingThe GeneSTAR® Marbling test for variants
of the thryoglobin TG5 gene. Animals are classifiedas 0, 1, or 2 STAR animals depending on whichalleles are present at the locus. Studies show thatanimals with 2 versus 0 STAR increased marblingscore 9 to 14 points with an accompanying 16-19%increase in animals grading choice. Animalsclassified as 1 STAR animal were intermediate. Use
12 MANAGEMENT ISSUES AND INDUSTRY CHALLENGES IN DEFINING TIMES
G.R. Hansen
of GeneSTAR® Marbling is dependent on finishend point with the greatest improvement in cattlethat are in the Select/Choice transition. Use of thismarker would be most beneficial to cattle producersworking to supply cattle that will be sold inalliances or on grids that place high premiums onquality grade and it appears to work best in cattlethat are fed for a longer duration. Since the geneticcomponent of marbling is controlled by severalgenes, 0 STAR animals need to be evaluated usingother parameters (marbling EPD, %IMF EPD,leptin, etc.) to determine which individuals shouldbe selected as breeding stock. In some instances,bulls with high EPD’s for marbling have genotypedas 0 STAR with the GeneSTAR® Marbling test.
GeneSTAR® TendernessGeneStar® Tenderness is commercial DNA
marker test marketed by Genetic Solutions and is
based on variants of the calpastatin gene locatedon chromosome 7. The test detects different formsof the gene with one form associated with anincrease in tenderness and the other form leadingto increased toughness (GeneNOTE 4, 2003).Calpastatin is a naturally occurring enzyme thatinhibits calpain, another naturally occurringenzyme involved with meat tenderization as it agespostmortem. GeneSTAR® Tenderness is nowmarketed in combination with CAPN1 (calpainSNP316) as GeneSTAR® Tenderness2.
GeneSTAR® Tenderness2GeneSTAR® Tenderness2 is a second
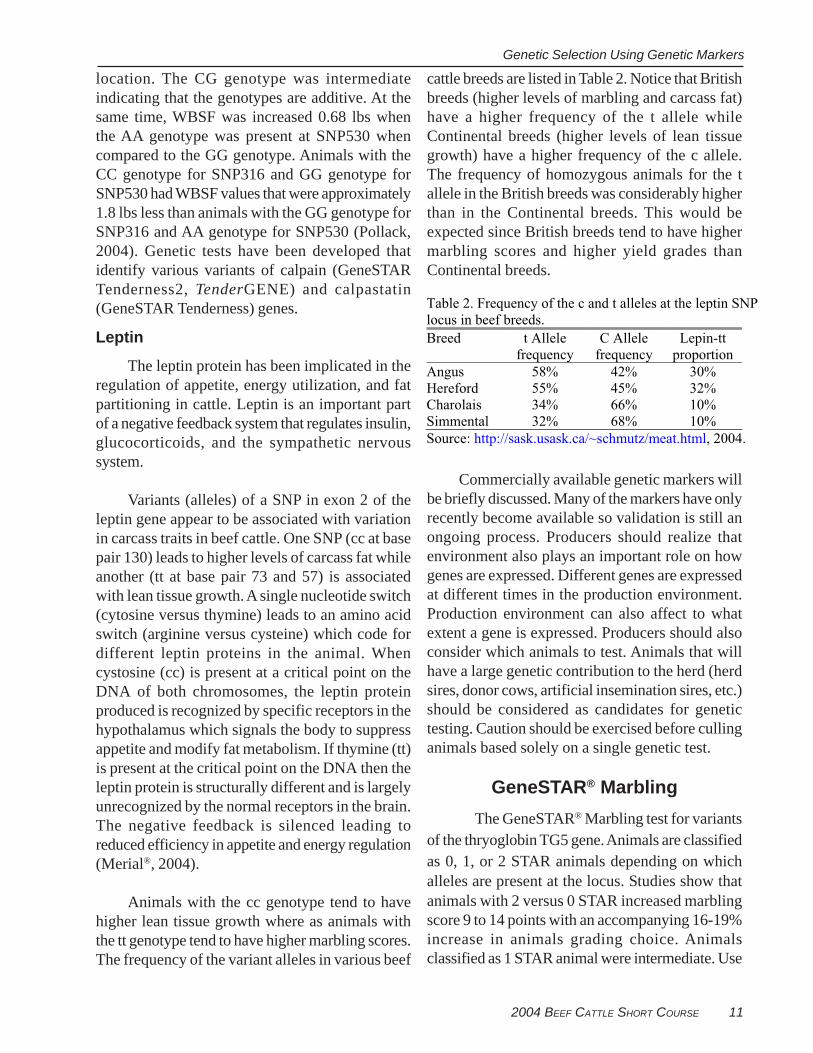
generation DNA marker test that is marketed byGenetic Solution which is a combination of theGeneStar® Tenderness (calpastatin) and a recent testdeveloped by Meat and Animal Research Center(MARC) for CAPN 1 (calpain SNP316). The testmeasures whether an animal has alleles for the twogenes associated with tender or tough muscle.Figure 3 shows that animals with four favorablealleles (4 STAR) for the two genes, will havereduced WBSF when compared to animals withless favorable alleles. Animals with 0 favorablealleles had lower WBSF than animal with 1 or 2favorable alleles. This could be due to the smallsample size of this treatment group as well as othergenes with favorable alleles, for WBSF could bebeing expressed in these animals.
Only two trials, one in straightbred Angus andone in straightbred Santa Gertrudis, have lookedat the combined effects of the calpastatin andcalpain DNA markers. Further research will be
Figure 3. Expected reduction in WBSF in Angus andSanta Gertrudis cattle with various levels of favorablealleles.
Source: GeneNOTE 7.
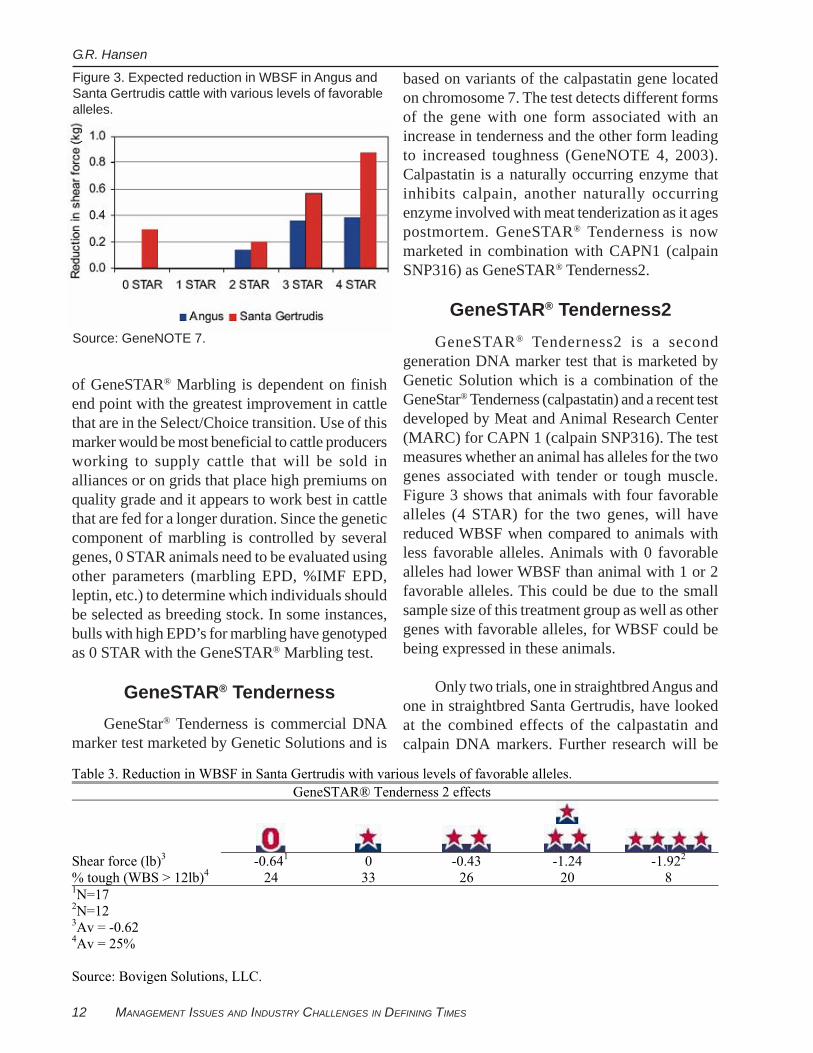
Table 3. Reduction in WBSF in Santa Gertrudis with various levels of favorable alleles.
GeneSTAR® Tenderness 2 effects
Shear force (lb)3 -0.641 0 -0.43 -1.24 -1.922 % tough (WBS > 12lb)4 24 33 26 20 8 1N=17 2N=12 3Av = -0.62 4Av = 25% Source: Bovigen Solutions, LLC.
2004 BEEF CATTLE SHORT COURSE 13
Genetic Selection Using Genetic Markers
needed to validate the combined effects of thesemarkers. The results of the Santa Gertrudis trialare summarized in Table 3.
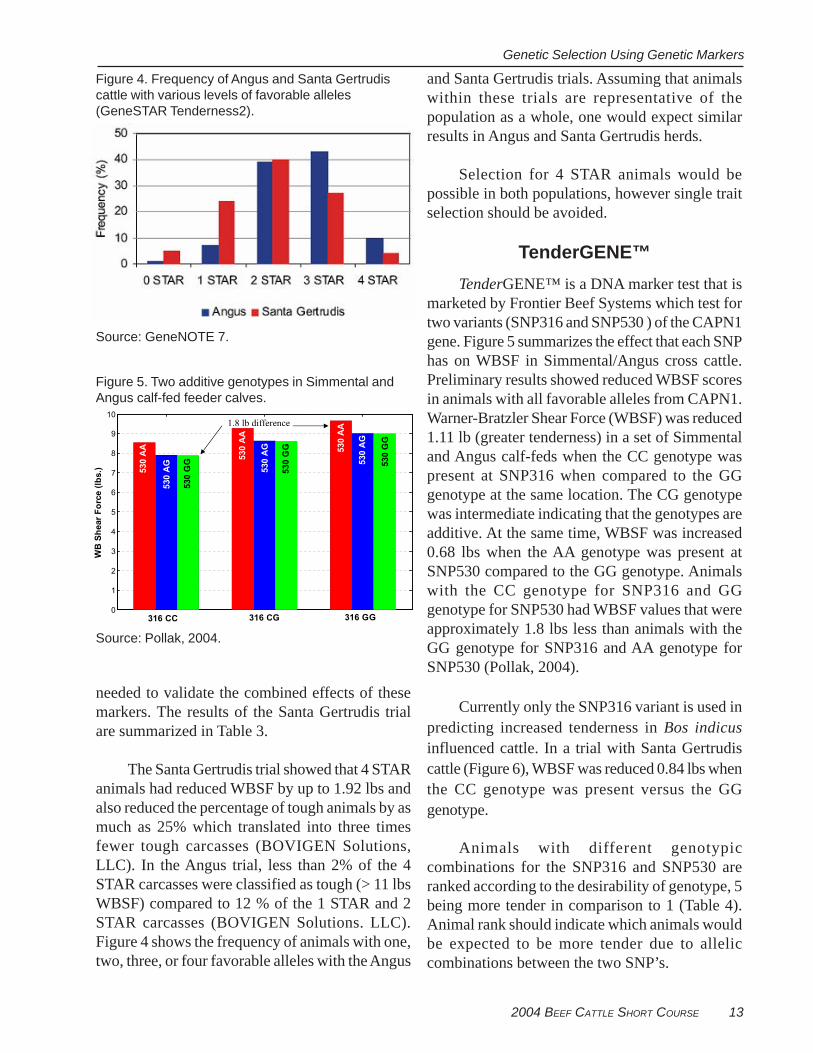
The Santa Gertrudis trial showed that 4 STARanimals had reduced WBSF by up to 1.92 lbs andalso reduced the percentage of tough animals by asmuch as 25% which translated into three timesfewer tough carcasses (BOVIGEN Solutions,LLC). In the Angus trial, less than 2% of the 4STAR carcasses were classified as tough (> 11 lbsWBSF) compared to 12 % of the 1 STAR and 2STAR carcasses (BOVIGEN Solutions. LLC).Figure 4 shows the frequency of animals with one,two, three, or four favorable alleles with the Angus
Figure 4. Frequency of Angus and Santa Gertrudiscattle with various levels of favorable alleles(GeneSTAR Tenderness2).
Source: GeneNOTE 7.
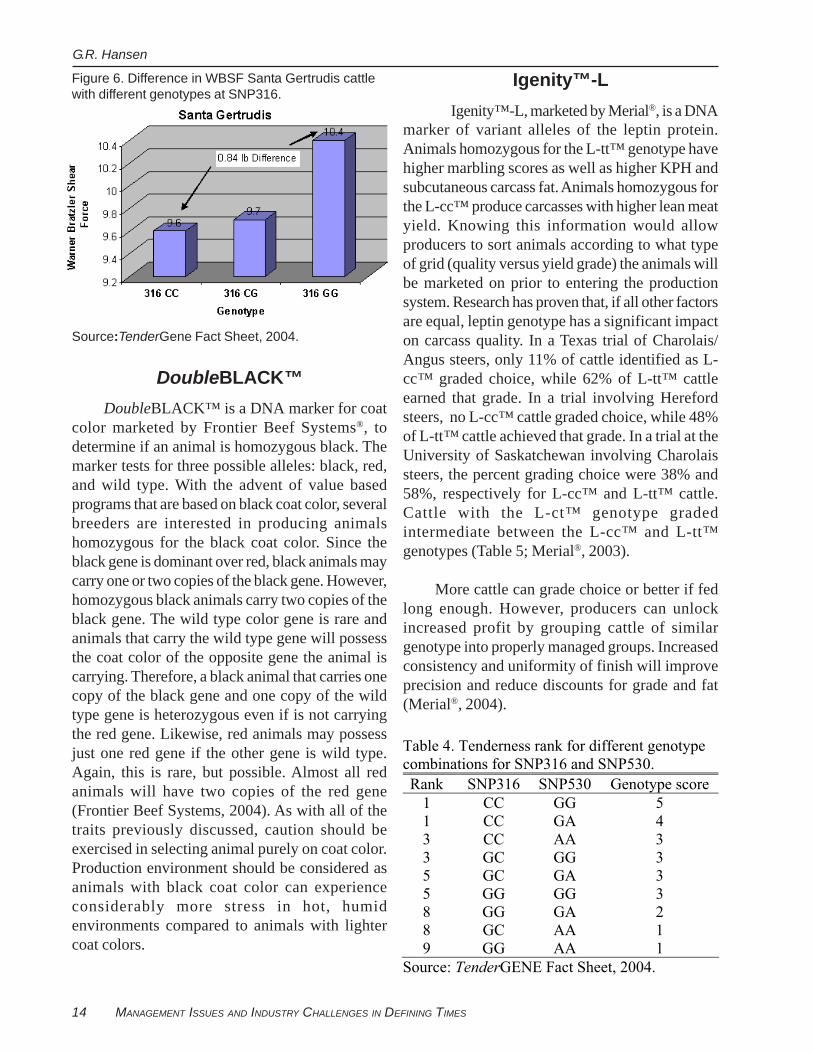
Figure 5. Two additive genotypes in Simmental andAngus calf-fed feeder calves.
Source: Pollak, 2004.
and Santa Gertrudis trials. Assuming that animalswithin these trials are representative of thepopulation as a whole, one would expect similarresults in Angus and Santa Gertrudis herds.
Selection for 4 STAR animals would bepossible in both populations, however single traitselection should be avoided.
TenderGENE™TenderGENE™ is a DNA marker test that is
marketed by Frontier Beef Systems which test fortwo variants (SNP316 and SNP530 ) of the CAPN1gene. Figure 5 summarizes the effect that each SNPhas on WBSF in Simmental/Angus cross cattle.Preliminary results showed reduced WBSF scoresin animals with all favorable alleles from CAPN1.Warner-Bratzler Shear Force (WBSF) was reduced1.11 lb (greater tenderness) in a set of Simmentaland Angus calf-feds when the CC genotype waspresent at SNP316 when compared to the GGgenotype at the same location. The CG genotypewas intermediate indicating that the genotypes areadditive. At the same time, WBSF was increased0.68 lbs when the AA genotype was present atSNP530 compared to the GG genotype. Animalswith the CC genotype for SNP316 and GGgenotype for SNP530 had WBSF values that wereapproximately 1.8 lbs less than animals with theGG genotype for SNP316 and AA genotype forSNP530 (Pollak, 2004).
Currently only the SNP316 variant is used inpredicting increased tenderness in Bos indicusinfluenced cattle. In a trial with Santa Gertrudiscattle (Figure 6), WBSF was reduced 0.84 lbs whenthe CC genotype was present versus the GGgenotype.
Animals with different genotypiccombinations for the SNP316 and SNP530 areranked according to the desirability of genotype, 5being more tender in comparison to 1 (Table 4).Animal rank should indicate which animals wouldbe expected to be more tender due to alleliccombinations between the two SNP’s.
0
1
2
3
4
5
6
7
8
9
10
WB
Sh
ear
Fo
rce (
lbs.)
316 CG 316 GG316 CC
530 A
A
530 A
A
530 A
A
530 A
G
530 A
G
530 A
G
530 G
G
530 G
G
530 G
G
1.8 lb difference
14 MANAGEMENT ISSUES AND INDUSTRY CHALLENGES IN DEFINING TIMES
G.R. Hansen
DoubleBLACK™DoubleBLACK™ is a DNA marker for coat
color marketed by Frontier Beef Systems®, todetermine if an animal is homozygous black. Themarker tests for three possible alleles: black, red,and wild type. With the advent of value basedprograms that are based on black coat color, severalbreeders are interested in producing animalshomozygous for the black coat color. Since theblack gene is dominant over red, black animals maycarry one or two copies of the black gene. However,homozygous black animals carry two copies of theblack gene. The wild type color gene is rare andanimals that carry the wild type gene will possessthe coat color of the opposite gene the animal iscarrying. Therefore, a black animal that carries onecopy of the black gene and one copy of the wildtype gene is heterozygous even if is not carryingthe red gene. Likewise, red animals may possessjust one red gene if the other gene is wild type.Again, this is rare, but possible. Almost all redanimals will have two copies of the red gene(Frontier Beef Systems, 2004). As with all of thetraits previously discussed, caution should beexercised in selecting animal purely on coat color.Production environment should be considered asanimals with black coat color can experienceconsiderably more stress in hot, humidenvironments compared to animals with lightercoat colors.
Figure 6. Difference in WBSF Santa Gertrudis cattlewith different genotypes at SNP316.
Source:TenderGene Fact Sheet, 2004.
Table 4. Tenderness rank for different genotype combinations for SNP316 and SNP530.
Rank SNP316 SNP530 Genotype score
1 CC GG 5 1 CC GA 4 3 CC AA 3 3 GC GG 3 5 GC GA 3 5 GG GG 3 8 GG GA 2 8 GC AA 1 9 GG AA 1
Source: TenderGENE Fact Sheet, 2004.
Igenity™-LIgenity™-L, marketed by Merial®, is a DNA
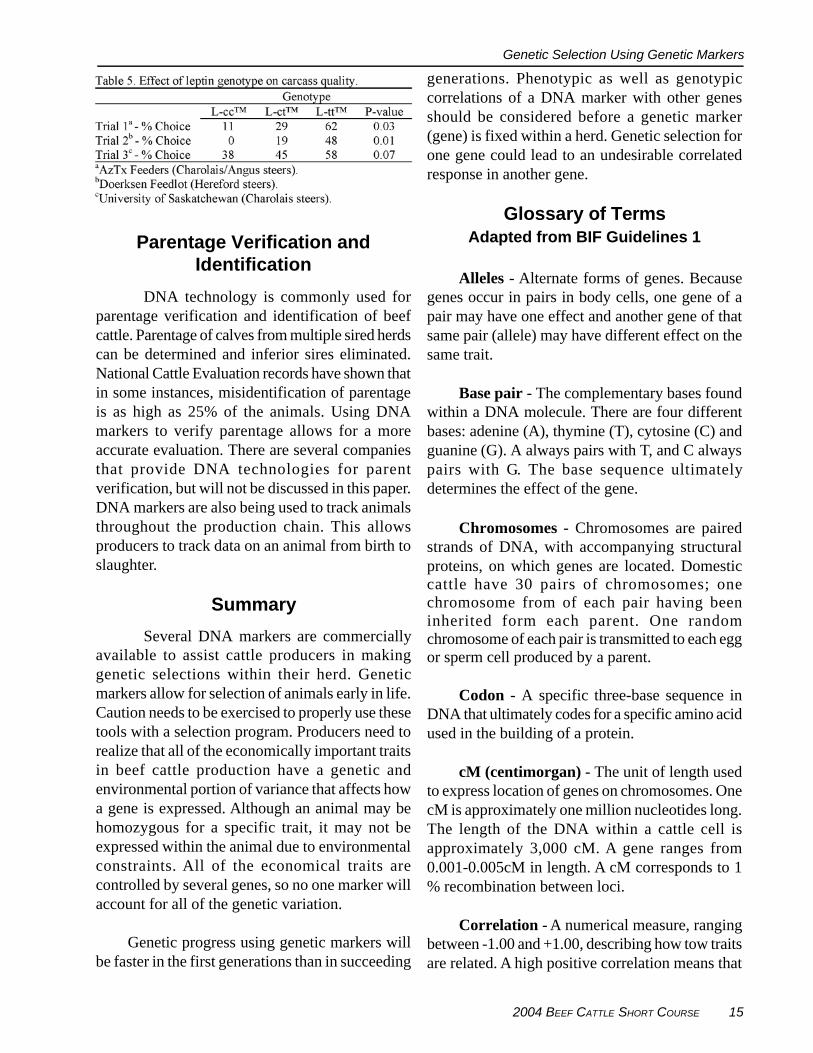
marker of variant alleles of the leptin protein.Animals homozygous for the L-tt™ genotype havehigher marbling scores as well as higher KPH andsubcutaneous carcass fat. Animals homozygous forthe L-cc™ produce carcasses with higher lean meatyield. Knowing this information would allowproducers to sort animals according to what typeof grid (quality versus yield grade) the animals willbe marketed on prior to entering the productionsystem. Research has proven that, if all other factorsare equal, leptin genotype has a significant impacton carcass quality. In a Texas trial of Charolais/Angus steers, only 11% of cattle identified as L-cc™ graded choice, while 62% of L-tt™ cattleearned that grade. In a trial involving Herefordsteers, no L-cc™ cattle graded choice, while 48%of L-tt™ cattle achieved that grade. In a trial at theUniversity of Saskatchewan involving Charolaissteers, the percent grading choice were 38% and58%, respectively for L-cc™ and L-tt™ cattle.Cattle with the L-ct™ genotype gradedintermediate between the L-cc™ and L-tt™genotypes (Table 5; Merial®, 2003).
More cattle can grade choice or better if fedlong enough. However, producers can unlockincreased profit by grouping cattle of similargenotype into properly managed groups. Increasedconsistency and uniformity of finish will improveprecision and reduce discounts for grade and fat(Merial®, 2004).
2004 BEEF CATTLE SHORT COURSE 15
Genetic Selection Using Genetic Markers
Parentage Verification andIdentification
DNA technology is commonly used forparentage verification and identification of beefcattle. Parentage of calves from multiple sired herdscan be determined and inferior sires eliminated.National Cattle Evaluation records have shown thatin some instances, misidentification of parentageis as high as 25% of the animals. Using DNAmarkers to verify parentage allows for a moreaccurate evaluation. There are several companiesthat provide DNA technologies for parentverification, but will not be discussed in this paper.DNA markers are also being used to track animalsthroughout the production chain. This allowsproducers to track data on an animal from birth toslaughter.
Summary
Several DNA markers are commerciallyavailable to assist cattle producers in makinggenetic selections within their herd. Geneticmarkers allow for selection of animals early in life.Caution needs to be exercised to properly use thesetools with a selection program. Producers need torealize that all of the economically important traitsin beef cattle production have a genetic andenvironmental portion of variance that affects howa gene is expressed. Although an animal may behomozygous for a specific trait, it may not beexpressed within the animal due to environmentalconstraints. All of the economical traits arecontrolled by several genes, so no one marker willaccount for all of the genetic variation.
Genetic progress using genetic markers willbe faster in the first generations than in succeeding
generations. Phenotypic as well as genotypiccorrelations of a DNA marker with other genesshould be considered before a genetic marker(gene) is fixed within a herd. Genetic selection forone gene could lead to an undesirable correlatedresponse in another gene.
Glossary of TermsAdapted from BIF Guidelines 1
Alleles - Alternate forms of genes. Becausegenes occur in pairs in body cells, one gene of apair may have one effect and another gene of thatsame pair (allele) may have different effect on thesame trait.
Base pair - The complementary bases foundwithin a DNA molecule. There are four differentbases: adenine (A), thymine (T), cytosine (C) andguanine (G). A always pairs with T, and C alwayspairs with G. The base sequence ultimatelydetermines the effect of the gene.
Chromosomes - Chromosomes are pairedstrands of DNA, with accompanying structuralproteins, on which genes are located. Domesticcattle have 30 pairs of chromosomes; onechromosome from of each pair having beeninherited form each parent. One randomchromosome of each pair is transmitted to each eggor sperm cell produced by a parent.
Codon - A specific three-base sequence inDNA that ultimately codes for a specific amino acidused in the building of a protein.
cM (centimorgan) - The unit of length usedto express location of genes on chromosomes. OnecM is approximately one million nucleotides long.The length of the DNA within a cattle cell isapproximately 3,000 cM. A gene ranges from0.001-0.005cM in length. A cM corresponds to 1% recombination between loci.
Correlation - A numerical measure, rangingbetween -1.00 and +1.00, describing how tow traitsare related. A high positive correlation means that
16 MANAGEMENT ISSUES AND INDUSTRY CHALLENGES IN DEFINING TIMES
G.R. Hansen
as one trait increases, the other one usually does aswell. For example, cattle with higher than averageyearling weight generally will have larger maturesize as well. When traits are negatively correlated,if one is above average, the other is likely to bebelow the average. For example, as birth weight ofa calf increases, calving ease is likely to decrease.A near zero correlation between traits means thereis no particular relationship between them.
DNA - Deoxyribonucleic acid a long double-stranded nucleic acid molecule arranged as a doublehelix: the main constituent of the chromosome, itcarries genes as segments along its strands.
Exon - Those regions of a gene in which thenucleotide sequence actually codes for a biologicalrelevant product.
Gene - A gene is a discrete segment of theDNA molecule, located at a specific site (its locus)on a specific chromosome pair. It is the basicphysical unit of heredity, a linear sequence ofnucleotides along a segment of DNA that providesthe coded instructions for synthesis of RNA.Which, when translated into protein, leads to theexpression of hereditary character. Two copies ofeach gene exist in each nucleated diploid cell in ananimal. Only one gene of each pair is randomlytransmitted to the offspring through the gamete.The unique nucleotide sequence of each genedetermines its specific biological role. Many genesspecify the amino acid sequence of a proteinproduct. Others produce gene products that areinvolved in controlling metabolic anddevelopmental events.
Gene Marker - A specific sequence ofnucleotides that is easily detectable and can be usedto differentiate among alleles at a locus. A smallunique sequence of DNA whose specific locationon a chromosome is known.
Genetic Antagonism - A genetic correlationin which desirable genetic change in one of the traitsis accompanied by an undesirable change in theother. For example, because of the positive genetic
correlation between milk yield potential and cowmaintenance requirement, selection for increasedmilk would also lead to increased feed cost formaintenance.
Genetic Correlations - Correlations betweenbreeding values for two traits that arise becausesome of the same genes affect both of them. Whentwo traits (weaning and yearling weight forexample) are positively genetically correlated,successful selection for one trait will result in anincrease in the other trait as well. When two traitsare negatively genetically correlated (birth weightand calving ease for example) successful selectionfor one trait will result in a decrease in the other.This is sometimes referred to as a geneticantagonism between traits.
Genetic Map - The order of DNA markerson a chromosome and distance between them.
Genome - The entire complement of DNAcharacteristic to individuals of a species.
Genotype - The two alleles present at a locusin an individual, for a locus with only two alleles,three genotypes are possible. For example, at thepolled/horned locus in cattle, two common allelesare P (the dominant allele preventing growth ofhorns) and p (the recessive allele allowing horngrowth). The three possible genotypes are PP(homozygous dominant), Pp (heterozygous orcarrier) and pp (homozygous recessive).
Heritability - The proportion of thedifferences among cattle, measured or observed,that is transmitted, on average, to their offspring.Heritability of different traits may vary from zeroto one. The higher the heritability of a trait, themore accurately individual performance predictsbreeding value and the more rapid should be theresponse to selection of that trait.
Heritability estimate - An estimate of theproportion of the total phenotypic variationbetween individuals for a certain trait that is due totransmissible genetic merit. It is the proportion of
2004 BEEF CATTLE SHORT COURSE 17
Genetic Selection Using Genetic Markers
total variation for a trait caused by differencesamong individuals in breeding value.
Indicator trait - Traits that do not have directeconomic importance, but aid in the prediction ofeconomically important traits.
Intron - DNA whose nucleotide sequencedoes not code for a product. An intron is transcribedbut is excised and not translated. Therefore, it doesnot affect the sequence of sub-units in the geneproduct.
Linkage - The occurrence of two or more lociof interest on the same chromosome within 50 cMlinkage distance of one another.
Locus - The specific location of a gene on achromosome.
Marker Assisted Selection (MAS) - The useof genetic markers to select for specific alleles atlinked QTL’s and therefore specific traits.
Microsatellite - A type of genetic marker. Itis composed of repeating nucleotide sequences withDNA that are locus specific and variable in thenumber of times the sequence is repeated.
Nucleotide - The subunit of DNA composedof a five carbon sugar, one of four nitrogenous bases(adenine, thymine, cytosine, or guanine) and aphosphate group.
Phenotype - The visible or measurableexpression of a character; weaning weight,postweaning gain, or reproduction for example. Formost traits, phenotype is influenced by bothgenotype and environment. The relative degree towhich phenotypic variation among individuals iscaused by transmissible genetic effects is theheritability of a trait.
Phenotypic Correlation - The net correlationbetween two traits caused both by genetic factorsand environmental factors simultaneouslyinfluencing both traits.
Qualitative Traits - Those traits in whichthere is sharp distinction between phenotypes, suchas black versus red or polled versus horned. Onlyone or a few pairs of genes are involved in theexpression of many qualitative traits.
Quantitative Traits - Those traits, such asweaning weight, in which there is no sharpdistinction in the range of phenotype, with a gradualvariation form one extreme to the other. Usually,many gene pairs are involved as well asenvironmental influences affect variation in suchtraits.
Quantitative Trait Loci (QTL) - A genelocus that has an effect on a quantitative trait. Oftenthe actual nucleotide sequence is unknown, soselection is based upon genotype at a linked genemarker.
Transcription - The process by which anRNA copy is made from a gene.
Translation - The process by whichribosomes use the nucleotide sequence in RNA tosynthesize protein.
Variance - Variance is a statistic thatnumerically describes the differences amongindividuals for a trait in a population. Withoutvariation, no genetic progress would be possible,since genetically superior animals would not bedistinguishable from genetically inferior ones.
Literature Cited
BIF Guideline 1. 1996. Available athttp://www.beefimprovement.org/guidelines.html. Accessed August 24, 2003.
Bovigen Solution, LLC. GeneSTAR TendernessMarker. Available athttp://www.bovigensolutions.com/html/tender.html.
18 MANAGEMENT ISSUES AND INDUSTRY CHALLENGES IN DEFINING TIMES
G.R. Hansen
Bourdon, R. M. 1988. Bovine Nirvana- From thealternative forms of the myostatin gene.J. Anim. Sci. 79:845-860.
Casas, E., S. D. Shackelford, J. W. Keele, R. T.Stone, S. M. Kappes, and M. Koohmaraie.2000. Quantitative trait loci affecting growthand carcass composition of cattle segregatingalternate forms of myostatin. J. Anim. Sci.78:560-569.
Casas, E, J. W. Keele, S. D. Shackelford, M.Koohamraie, T. S. Sonstegard, T. P. L. Smith,S. M. Kappes, and R. T. Stone. 1998.Association of the muscle hypertrophy locuswith carcass traits in beef cattle. J. Anim. Sci.76:468-473.
Collins, F. S. 1992. Positional cloning: Let’s notcall it reverse anymore. Nature Genet. 1:3-6.
Davis, G. P., and S. K. DeNise. 1998. The impactof genetic markers on selection. J. Anim. Sci.76:2331-2339.
Frontier Beef Systems. DoubleBLACK™.Availablehttp://www.frontierbeefsystems.com.Accessed March 12, 2004.
GeneNOTE 4, 2003. GeneSTAR® Tenderness -The first commercial gene marker test for beeftenderness. Available athttp://www.geneticsolutions.com.au/content/products_c1.asp?name=NavPH_GeneSTAR.Accessed Jan. 17, 2003.
GeneNOTE 7, 2004. GeneSTAR®.Tenderness2 -A new, enhanced DNA marker test for twoimportant tenderness genes. Available athttp://www.geneticsolutions.com.au/content/gproducts_c1.asp?name=NavPH_GeneSTAR.Accessed March 12, 2004.
Grobet, L., D. Poncelet, L. J. Royo, B. Brouwers,D. Pirottin, C. Michaux, F. Menissier, M.Zanotti, S. Dunner, and M. Georges. 1998.
Molecular definition of allelic series ofmutations disrupting the myostatin functionand causing double-muscling in cattle. Mamm.Genome 9:210-213.
Hohenboken, W. D. 1988. Bovine Nirvana-Fromthe perspective of an experimentalist. J. Anim.Sci. 66:1885-1891.
Kambadur, R., M. Sharma, T. P. L. Smith, and J.J. Bass. 1997. Mutations in myostatin (GDF8)in double-muscled Belgian Blue andPiedmontese cattle. 1997. GenomeResearch7:910-915.
Koohmaraie, M. 1996. Biochemical factorsregulating the toughening and tenderizationprocess of meat. Meat Sci. 43:S193-S201.
Koohmaraie, M. 1992. Role of neutralproteinases in postmortem muscle proteindegradation and meat tenderness. Proc. Recip.Meat Conf. 45:63-71.
Koohmaraie, M. 1988. The role of endogenousprotease in meat tenderness. Proc. Recip. MeatConf. 41:89-100.
McPherron, A. C., and S-J. Lee. 1997. Doublemuscling in cattle due to mutations in themyostatin gene. Proc. Natl. Acad. Sci. (USA)94:12457-12461.
Merial®. 2004. Available at:http://us.igenity.com/pdfs/IGN-03-3003-FUNC-GEN_US.pdf. Accessed March 12,2004.
Merial®. 2004. IGENITY™ L test results for thebeef producer. Available at http://www.igenity.com.Accessed March 12, 2004.
Merial®. 2003. IGENITY testing services.Available at http://www.igenity.com. Accessed. March 12, 2004.
2004 BEEF CATTLE SHORT COURSE 19
Genetic Selection Using Genetic Markers
O’Conner, S. F., J. D. Tatum, D. M. Wulf, R. D.Green, and G. C. Smith. 1997. Genetic effectson beef tenderness in Bos indicus and Bostaurus cattle. J. Anim. Sci. 75:1822-1830.
Page, B. T., E. Casas, M. P. Heaton, N. G. Cullen,D. L. Hyndman, C. A. Morris, A. M.Crawford, T. L. Wheeler, M. Koohmaraie, J.W. Keele, and T. P. L. Smith. 2002. Evaluationof single-nucleotide polymorphisms in CAPN1for association with meat tenderness in cattle.J. Anim. Sci. 80:3077-3085.
Paterson, A. H., and R. A. Wing. 1993. Genomemapping in plants. Current Opin. Biotech -no l. 4:142-147.
Pollak, E. J. 2004. Validation of DNA testing forcarcass traits. Powerpoint presentation, BrownBagger Series, National Beef CattleEvaluation Consortium. February, 9, 2004.
Shackelford, S. D., M. Koohmaraie, L. V.Cundiff, K. E. Gregory, G. A. Rohrer, and J.W. Savell. 1994. Heritabilities and phenotypicand genetic correlations for bovine postrigorcalpastatin activity, intramuscular fat content,Warner-Bratzler shear force, retail productyield and growth rate. J. Anim. Sci. 72:857-863.
Smith, T. P. L., E. Casas, C. E. Rexroad, III, S.M. Kappes, and J. W. Keele. 2000. BovineCAPN1 maps to a region of BTA29 containinga quantitative trait locus for meat tenderness.J. Anim Sci. 78:2589-2594.
Snustad, D.P., and M. J. Simmons. 1999.Principles of Genetics. 2nd ed. John Wiley &Sons, Inc., New York, NY.
TenderGENE Fact Sheet. 2004. Available athttp://www.frontierbeefsystems.com/tendergene.html. Accessed March 12, 2004.
Wicking, C., and B. Williamson. 1991. Fromlinked marker to gene. Trends Genet. 7:288-293.
Whipple, G., M. Koohmaraie, M. E. Dikeman, J.D. Crouse, M. C. Hunt, and R. D. Klemm.1990. Evaluation of attributes that affectlongissimus muscle tenderness in Bos taurusand Bos indicus Cattle. J. Anim. Sci. 68:2716-2728.
20 MANAGEMENT ISSUES AND INDUSTRY CHALLENGES IN DEFINING TIMES
G.R. Hansen
Notes: