genetic studies on usefulness of gene markers in duroc pig
TRANSCRIPT
Genetic studies on usefulness of gene markers in Genetic studies on usefulness of gene markers in Genetic studies on usefulness of gene markers in Genetic studies on usefulness of gene markers in
Duroc pig population improved by closed nucleus Duroc pig population improved by closed nucleus Duroc pig population improved by closed nucleus Duroc pig population improved by closed nucleus
breeding systembreeding systembreeding systembreeding system
2013. 122013. 122013. 122013. 12
Kensuke HIROSEKensuke HIROSEKensuke HIROSEKensuke HIROSE
ContentsContentsContentsContents
GGGGeneral introduction eneral introduction eneral introduction eneral introduction ...1 ...1 ...1 ...1
CHAPTER 1. CHAPTER 1. CHAPTER 1. CHAPTER 1. Breeding experiment on the development strain in Breeding experiment on the development strain in Breeding experiment on the development strain in Breeding experiment on the development strain in Duroc Duroc Duroc Duroc
pigspigspigspigs
1111----1. Introduction …61. Introduction …61. Introduction …61. Introduction …6
1111----2. Materials and Methods …72. Materials and Methods …72. Materials and Methods …72. Materials and Methods …7
1111----2222----1. Animals 1. Animals 1. Animals 1. Animals …7 …7 …7 …7
1111----2222----2. Selection methods …82. Selection methods …82. Selection methods …82. Selection methods …8
1111----2222----3. Mating methods …103. Mating methods …103. Mating methods …103. Mating methods …10
1111----3. Results and Discussion …113. Results and Discussion …113. Results and Discussion …113. Results and Discussion …11
1111----3333----1. Change of selection traits 1. Change of selection traits 1. Change of selection traits 1. Change of selection traits …11 …11 …11 …11
1111----3333----2. Genetic parameter of selected triats …122. Genetic parameter of selected triats …122. Genetic parameter of selected triats …122. Genetic parameter of selected triats …12
1111----3333----3. The relationship and inbreeding coefficient …143. The relationship and inbreeding coefficient …143. The relationship and inbreeding coefficient …143. The relationship and inbreeding coefficient …14
1111----4. Implications …144. Implications …144. Implications …144. Implications …14
1111----5. Figures and Tables 5. Figures and Tables 5. Figures and Tables 5. Figures and Tables …15 …15 …15 …15
CHAPTER 2.CHAPTER 2.CHAPTER 2.CHAPTER 2. A A A Association of ssociation of ssociation of ssociation of porcine beta 3porcine beta 3porcine beta 3porcine beta 3----adrenergic receptor gene adrenergic receptor gene adrenergic receptor gene adrenergic receptor gene
((((ADRB3ADRB3ADRB3ADRB3) gene ) gene ) gene ) gene with with with with production traits in Duroc pigsproduction traits in Duroc pigsproduction traits in Duroc pigsproduction traits in Duroc pigs
2222----1. 1. 1. 1. IntroductionIntroductionIntroductionIntroduction …20 …20 …20 …20
2222----2. 2. 2. 2. Materials and MethodsMaterials and MethodsMaterials and MethodsMaterials and Methods …21 …21 …21 …21
2222----2222----1. Animals and data collection …211. Animals and data collection …211. Animals and data collection …211. Animals and data collection …21
2222----2222----2. Genotyping …222. Genotyping …222. Genotyping …222. Genotyping …22
2222----2222----3. Statistical analysis …233. Statistical analysis …233. Statistical analysis …233. Statistical analysis …23
2222----3.Results 3.Results 3.Results 3.Results …24 …24 …24 …24
2222----3333----1. 1. 1. 1. ADRB3ADRB3ADRB3ADRB3 gene allelic frequencies …24 gene allelic frequencies …24 gene allelic frequencies …24 gene allelic frequencies …24
2222----3333----2. 2. 2. 2. Association of genotypes with economic traitsAssociation of genotypes with economic traitsAssociation of genotypes with economic traitsAssociation of genotypes with economic traits …24 …24 …24 …24
2222----4. 4. 4. 4. DiscussionDiscussionDiscussionDiscussion …25 …25 …25 …25

2222----5. Figures and 5. Figures and 5. Figures and 5. Figures and Tables …29Tables …29Tables …29Tables …29
CHAPTER 3.CHAPTER 3.CHAPTER 3.CHAPTER 3. Association of Association of Association of Association of porcineporcineporcineporcine class 3 phosphoinositide class 3 phosphoinositide class 3 phosphoinositide class 3 phosphoinositide----3333----kinase kinase kinase kinase
((((PIK3C3PIK3C3PIK3C3PIK3C3) gene with production traits in Duroc pigs) gene with production traits in Duroc pigs) gene with production traits in Duroc pigs) gene with production traits in Duroc pigs
3333----1. 1. 1. 1. IntroductionIntroductionIntroductionIntroduction …35 …35 …35 …35
3333----2. 2. 2. 2. Materials and Materials and Materials and Materials and MethodsMethodsMethodsMethods …37 …37 …37 …37
3333----2222----1. 1. 1. 1. Animals and data collectionAnimals and data collectionAnimals and data collectionAnimals and data collection …37 …37 …37 …37
3333----2222----2. 2. 2. 2. GenotypingGenotypingGenotypingGenotyping …37 …37 …37 …37
3333----2222----3. 3. 3. 3. Statistical analysisStatistical analysisStatistical analysisStatistical analysis …38 …38 …38 …38
3333----3. Results 3. Results 3. Results 3. Results …40 …40 …40 …40
3333----3333----1.1.1.1. PIK3C3 PIK3C3 PIK3C3 PIK3C3 gene gene gene gene alleleallelealleleallele frequencies frequencies frequencies frequencies …40 …40 …40 …40
3333----3333----2. 2. 2. 2. Association of genotypes with economic traits Association of genotypes with economic traits Association of genotypes with economic traits Association of genotypes with economic traits …41 …41 …41 …41
3333----3333----3. 3. 3. 3. Comparison of statistical model fitnessComparison of statistical model fitnessComparison of statistical model fitnessComparison of statistical model fitness …41 …41 …41 …41
3333----4. 4. 4. 4. DiscussionDiscussionDiscussionDiscussion …42 …42 …42 …42
3333----5. Figures and Tables …465. Figures and Tables …465. Figures and Tables …465. Figures and Tables …46
CHAPTER 4. Association of porcineCHAPTER 4. Association of porcineCHAPTER 4. Association of porcineCHAPTER 4. Association of porcine VertninVertninVertninVertnin((((VRTNVRTNVRTNVRTN) gene with production ) gene with production ) gene with production ) gene with production
traits in Duroc pigstraits in Duroc pigstraits in Duroc pigstraits in Duroc pigs
4444----1. 1. 1. 1. IntroductionIntroductionIntroductionIntroduction …52 …52 …52 …52
4444----2. 2. 2. 2. Materials and MethodsMaterials and MethodsMaterials and MethodsMaterials and Methods …54 …54 …54 …54
4444----2222----1. 1. 1. 1. Animals and data collectionAnimals and data collectionAnimals and data collectionAnimals and data collection …54 …54 …54 …54
4444----2222----2. 2. 2. 2. GenotypingGenotypingGenotypingGenotyping …55 …55 …55 …55
4444----2222----3. 3. 3. 3. StatisticStatisticStatisticStatistical analysisal analysisal analysisal analysis …55 …55 …55 …55
4444----3. Results …583. Results …583. Results …583. Results …58
4444----3333----1111....VRTNVRTNVRTNVRTN allele frequencies allele frequencies allele frequencies allele frequencies …58 …58 …58 …58
4444----3333----2. 2. 2. 2. Association of Association of Association of Association of VRTNVRTNVRTNVRTN genotype and economic traitsgenotype and economic traitsgenotype and economic traitsgenotype and economic traits …58 …58 …58 …58
4444----3333----3. 3. 3. 3. Association of Association of Association of Association of VRTNVRTNVRTNVRTN genotype and body composition traitsgenotype and body composition traitsgenotype and body composition traitsgenotype and body composition traits
…59 …59 …59 …59
4444----3333----4. 4. 4. 4. Additive and dominant effects of Additive and dominant effects of Additive and dominant effects of Additive and dominant effects of VRTNVRTNVRTNVRTN on each trai on each trai on each trai on each trait …59t …59t …59t …59

4444----3333----5. 5. 5. 5. Comparison of the statistical model fitnessComparison of the statistical model fitnessComparison of the statistical model fitnessComparison of the statistical model fitness …60 …60 …60 …60
4444----4.4.4.4.DiscussionDiscussionDiscussionDiscussion …60 …60 …60 …60
4444----5. Figures and Tables …645. Figures and Tables …645. Figures and Tables …645. Figures and Tables …64
CHAPTER 5.CHAPTER 5.CHAPTER 5.CHAPTER 5. Evaluation of effects of multiple candidate genes ( Evaluation of effects of multiple candidate genes ( Evaluation of effects of multiple candidate genes ( Evaluation of effects of multiple candidate genes (LEPLEPLEPLEP, , , ,
LEPRLEPRLEPRLEPR, , , , MC4RMC4RMC4RMC4R, , , , PIK3C3PIK3C3PIK3C3PIK3C3, and , and , and , and VRTNVRTNVRTNVRTN) on production traits in ) on production traits in ) on production traits in ) on production traits in
Duroc pigsDuroc pigsDuroc pigsDuroc pigs
5555----1. 1. 1. 1. IntroductionIntroductionIntroductionIntroduction …71 …71 …71 …71
5555----2. 2. 2. 2. Materials and MethodsMaterials and MethodsMaterials and MethodsMaterials and Methods …73 …73 …73 …73
5555----2222----1. Animals and data collection1. Animals and data collection1. Animals and data collection1. Animals and data collection …73 …73 …73 …73
5555----2222----2. 2. 2. 2. Genotyping Genotyping Genotyping Genotyping of of of of LEPLEPLEPLEP, , , , LEPRLEPRLEPRLEPR, , , , MC4RMC4RMC4RMC4R, , , , PIK3C3PIK3C3PIK3C3PIK3C3, and , and , and , and VRTNVRTNVRTNVRTN …73…73…73…73
5555----2222----3. 3. 3. 3. Statistical analysisStatistical analysisStatistical analysisStatistical analysis …74 …74 …74 …74
5555----3. Results …783. Results …783. Results …783. Results …78
5555----3333----1. 1. 1. 1. Generational allelicGenerational allelicGenerational allelicGenerational allelic and and and and genotypicgenotypicgenotypicgenotypic frequenciesfrequenciesfrequenciesfrequencies …78 …78 …78 …78
5555----3333----2. 2. 2. 2. Effects of Effects of Effects of Effects of single genes on pig prosingle genes on pig prosingle genes on pig prosingle genes on pig production traitsduction traitsduction traitsduction traits …78 …78 …78 …78
5555----3333----3. 3. 3. 3. Combination effects on pig production traitsCombination effects on pig production traitsCombination effects on pig production traitsCombination effects on pig production traits …79 …79 …79 …79
5555----3333----4. 4. 4. 4. Comparison of statistical model fitnessComparison of statistical model fitnessComparison of statistical model fitnessComparison of statistical model fitness …80 …80 …80 …80
5555----4. 4. 4. 4. DiscussionDiscussionDiscussionDiscussion …81 …81 …81 …81
5555----5. Figures and Tables 5. Figures and Tables 5. Figures and Tables 5. Figures and Tables …85 …85 …85 …85
GGGGeneral discussion …96eneral discussion …96eneral discussion …96eneral discussion …96
AAAAcknowledgment …101cknowledgment …101cknowledgment …101cknowledgment …101
References …102References …102References …102References …102
Summary Summary Summary Summary …124 …124 …124 …124

1
General IntroductionGeneral IntroductionGeneral IntroductionGeneral Introduction
In recent years, business performance in Japanese pig industry
have been deteriorated by increasing production costs due to higher feed
prices and imports of low price pork from abroad, and pig herd size in
Japan which recorded 12 million heads in 1989 is a steadily decreasing
every year. It is required the efficiency of pig productivity by improving
of feeding and management technology and breeding pigs that have
superior genetic talent in order to stabilize the domestic pig production
management.
The methods of pig breeding scheme conducted in Japan are mainly
distinguished between open nucleus breeding system and closed nucleus
breeding system. Open nucleus breeding system is the method conducted
by the improvement of desired traits of the population with introducing
genetic resources continuously from other populations, which is mainly
performed in private breeders in Japan. On the other hands, closed
nucleus breeding systems is uniquely developed in Japan, which is mainly
performed in public breeders such as local governmental institute or
National Agricultural Co-operative (ZEN-NOH). The closed nucleus
breeding scheme is performed by repeating the selection superior pigs
through about five generations in the isolated population, in which new
genetic resources are not introduced from other populations. “Strain
development” is one of nucleus breeding system, the pig lines produced by
this method is named “Strain pigs” which have highly genetic identity.
In any case, the traits for improvement are mainly production traits
(ex. growth rate, backfat thickness, loin eye muscle area, or intramuscular
fat content), fertility traits (e.g. total number born, number of born alive),

2
body composition (e.g. leg soundness), meat quality (e.g. softness,
tenderness), or anti-disease traits. These traits are quantitative traits
influenced by many genes that have complicated relationship, therefore, it
is usual for improvement of these traits that the selection of individuals is
performed on base of the values called an estimated breeding value (EBV)
which is calculated by average of all additive genetic effects relate with
the traits.
In modern breeding works, most genetic progress for quantitative
traits in livestock has been performed by predicting the EBVs derived
from phenotype without knowledge of each gene that affects the trait.
EBVs are calculated by means of statistical model such as BLUP (Best
linear unbiased prediction) method. BLUP is the method that predicts
individual breeding values from only phenotypic value, environmental
effects and pedigree information, which treat the genetic architecture of
each genetic loci relate with quantitative traits of interest as a ”black
box”. Breeding method like this has been implemented to genetic
improvement in main livestock species, and genetic progress of various
traits was actually succeeded.
Recently, many approach that implicate genetic evaluation of
individuals by not only phenotype-based method, but by gaining insight
into the “black box” of quantitative traits with using molecular genetic
information have been investigated in order to increase selection accuracy
and decreasing generation intervals.
To date, these techniques for finding genes and QTL, in particular
the candidate gene approach, have resulted in revealing partially inside of
the black box and discovered several genes or markers that are available
3
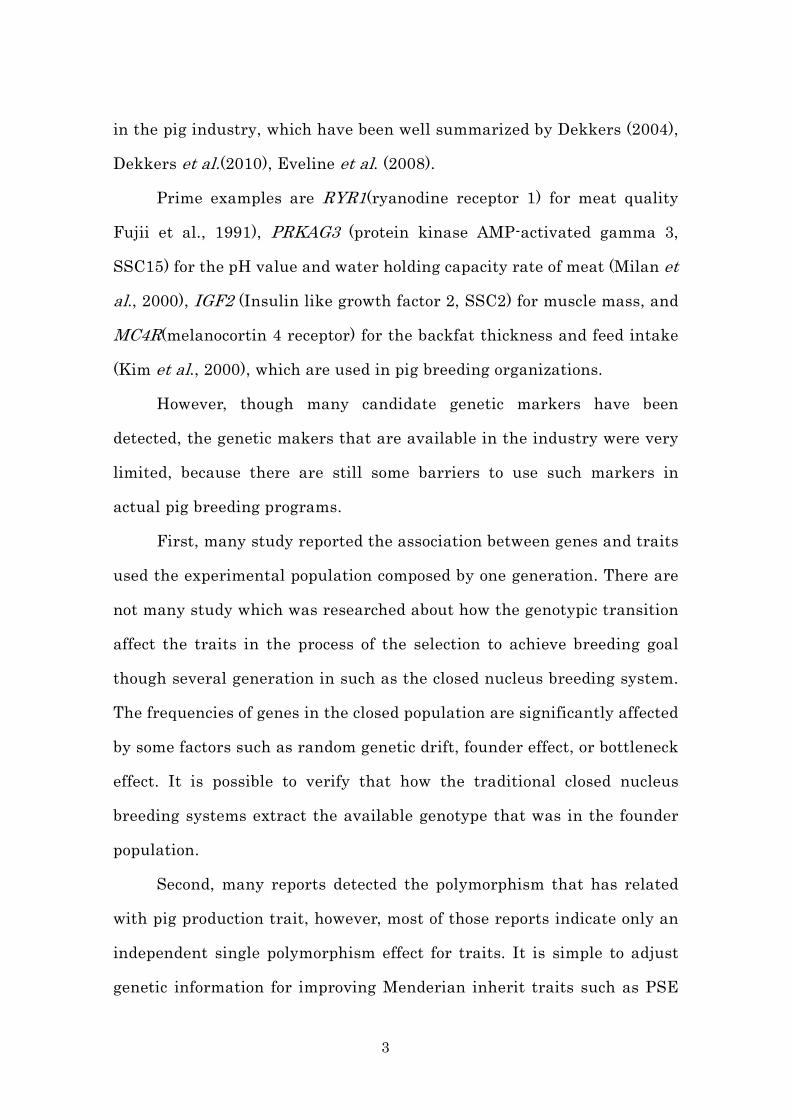
in the pig industry, which have been well summarized by Dekkers (2004),
Dekkers et al.(2010), Eveline et al. (2008).
Prime examples are RYR1(ryanodine receptor 1) for meat quality
Fujii et al., 1991), PRKAG3 (protein kinase AMP-activated gamma 3,
SSC15) for the pH value and water holding capacity rate of meat (Milan et
al., 2000), IGF2 (Insulin like growth factor 2, SSC2) for muscle mass, and
MC4R(melanocortin 4 receptor) for the backfat thickness and feed intake
(Kim et al., 2000), which are used in pig breeding organizations.
However, though many candidate genetic markers have been
detected, the genetic makers that are available in the industry were very
limited, because there are still some barriers to use such markers in
actual pig breeding programs.
First, many study reported the association between genes and traits
used the experimental population composed by one generation. There are
not many study which was researched about how the genotypic transition
affect the traits in the process of the selection to achieve breeding goal
though several generation in such as the closed nucleus breeding system.
The frequencies of genes in the closed population are significantly affected
by some factors such as random genetic drift, founder effect, or bottleneck
effect. It is possible to verify that how the traditional closed nucleus
breeding systems extract the available genotype that was in the founder
population.
Second, many reports detected the polymorphism that has related
with pig production trait, however, most of those reports indicate only an
independent single polymorphism effect for traits. It is simple to adjust
genetic information for improving Menderian inherit traits such as PSE
4
which was induced by RYR1 gene by excluding or fixing a specific allele at
single loci. In contrast, production traits such as backfat thickness or
growth rate are quantitative traits were controlled by many genes and
highly influenced by environment. Therefore, using multiple candidate
markers simultaneously enable to establish more effective breeding
methods. Although many genetic markers related to one trait were
detected, each marker was detected in different population (breeds,
strains) that was genetically separated, and there were few reports that
evaluated multiple genetic effect of marker in one population.
Thirdly, most association studies performed by using some genes
involve additive and dominance effect independently, but there are a few
investigations that consider interaction effect between the genes.
Große-Brinkhaus et al. (2010) showed that the significance of epistatic
QTL pairs associated with various traits such as meat quality, carcass
composition in Duroc × Pietrain population. Fixing specific alleles does not
always lead to establish efficient breeding program, because quite a few
negative interaction effects between the loci that related quantitative
traits was reported in the studies using various animals (Carlborg et al.
2003; Duthie et al. 2010; Hager et al. 2012). Therefore, it is very important
to choose more appropriately model to predict individual genetic value.
However, there are few reports regarding the combination effect and
interaction effect of multiple candidate genes.
The aims of this study were to evaluate genetic effect of genes that
might affect productive traits in the Duroc population improved by closed
nucleus breeding system, and to establish the breeding scheme by adding
genotype information. In Chapter 2, we analyzed the association of

5
ADRB3 that is reported to affect energy metabolisms in human or mouse
between pig production traits. In Chapter 3, we investigated the
relationship between PIK3C3 gene polymorphisms and economic traits in
a Duroc population. We also tested the usefulness of PIK3C3 genotyping
for estimating the breeding values of porcine productive traits in
statistical models. In Chapter 4, we investigated the relationship between
the VRTN genotype and economic and body composition traits in a Duroc
population. In Chapter 5, we evaluate combination and interaction effect
between five genes (LEP, LEPR, MC4R, PIK3C3, and VRTN) that might
affect productive traits in Duroc population, and compared the
mathematical models that include the multiple gene effects.
Duroc pigs used entirely in this study were from a line selected
through five generations at Central Research Institute for Feed and
Livestock ZEN-NOH (Hokkaido, Japan) from 2004 to 2010. Whole
improvement scheme and selection criteria of this population were
described in Chapter 1.

6
CCCCHAPTER 1.HAPTER 1.HAPTER 1.HAPTER 1. Breeding experiment on the development strain in Breeding experiment on the development strain in Breeding experiment on the development strain in Breeding experiment on the development strain in Duroc Duroc Duroc Duroc
pigspigspigspigs
1111----1. 1. 1. 1. IIIIntroductionntroductionntroductionntroduction
In Japanese commercial pig farm, it is commonly used three way
cross method as pig producing system in order to take advantage of hybrid
vigour effect (heterosis) obtained from genetic differences that exist within
breeds.
Three way cross system utilize three strains generally based on pure
breeds, and these strains were classified into dam line and sire line
depending on application. Dam line has been developed by selecting for
fertility traits such as prolificacy (Number of total piglets or piglets born
alive per litter) and mothering ability (Number of piglets weaned per sow
per year). On the other hand, sire line has been developed by selecting
primarily for growth rate and meat quality.
Two breeds (Landrace and Large White) that have excellent fertility
traits are generally used as sire line, and Duroc breed that have excellent
meat quality traits is used as sire line in Japan. Thus, it is usually
practiced by crossing Duroc as terminal boar F1 hybrid sows obtained by
multiplying Landrace and Large White to produce commercial pig in the
Japanese three way cross system, because this combination can capitalize
maximally advantage of heterosis, balance the fertility traits and the
production traits.
And we encourage utilizing the pig strain improved by closed
nucleus breeding system as terminal boar, because that have high genetic
uniformity and can stably supply the high quality meat that market

7
demands. Recently, terminal boars that have more superior productive
traits such as high growth rate or high meat quality than previous strain
are quite required. The aim of this development strain experiment is to
produce a Duroc strain to be used as terminal sire that have excellent
talent to contribute efficient meat production and superior meat quality.
Therefore, we configured improvement goal to increase average daily gain
(ADG) in test period from 30kg live weight to 90kg live weight, backfat
thickness (BFT), and intramuscular fat content in the loin muscle (IMF) at
90kg live weight, without changing the size of loin eye muscle area (EMA)
comparing our previous Duroc strain.
1111----2. Materials and Methods2. Materials and Methods2. Materials and Methods2. Materials and Methods
1111----2222----1.1.1.1.AnimalsAnimalsAnimalsAnimals
The number of animals at each selection stage in each generation
was shown in Table 1. First, 28 boars (three boars were introduced by
semen) and 52 gilts were introduced as a base population in 2004. These
resources were derived from Japanese breeding company, foreign breeding
farms, and local government experimental stations. This strain was
improved by closed nucleus breeding program, thereby new resources have
not been introduced from other population after being introduced as base
population.
The piglets at first generation were introduced by cesarean delivery
under SPF (specific pathogen free) condition. After second generation,
piglets were produced by natural farrowing from selected parents in
previous generation.
We divided the population into two further groups (the first and
8
second groups) after the third generation (G3) to allow more effective
improvements with more animals per generation. The first and second
groups were produced from the first and second sets of offspring after the
second generation, respectively. Average 15 boars and 55 gilts were
selected in the first group, and average 6 boars and 26 gilts were selected
in the second group at each generation. In addition, five boars were
selected from the 20 boars in the first group after considering their genetic
performance and pedigree for crossing in the second group at third and
fourth generation. These were used in the second group to prevent
separation of the genetic relationship between the two groups. As half of
boars used for crosses in the second group were consistent in first group,
these two groups were considered as one same line in each generation. The
6th generation was the final generation of this closed nucleus population
and it was created using boars and gilts selected from both the first and
second groups of the fifth generation.
1111----2222----2. 2. 2. 2. Selection methodSelection methodSelection methodSelection methodssss
All sows fallowed within a three-month period, thereby average of
500 piglets in first group and average of 200 piglets in second group were
obtained in each generation. In the first selection test, at seven weeks of
age, piglets that showed leg weakness and/or slow growth were removed
from the population. In each generation, average of 230 piglets (first
group) and 100 piglets (second group) were passed the first selection, and
they were supplied for performance test. Performance tests began when
body weight reached 30 kg and ended at approximately 90 kg. ADG over
the test period was calculated as weight gained divided by days elapsed.

9
At approximately 90 kg live weight, BFT and EMA were measured at a
half-body-length position using a real time B-mode ultrasound scanner
(SSD-500 ALOKA Co., Ltd. Tokyo, Japan). Computer software (SigmaScan
Pro 5.0, Systat, Inc., Richmond, CA, USA) was used to determine the EMA.
Subsequently, a biopsy was taken from loin muscle at a position half way
along the body and about 6.5 cm from the vertebral centerline. Crude fat
content in sampled loin tissue was used as a measured of IMF. We
detected high correlation coefficient between the intramuscular fat
content sampled by needle biopsy method and that content sampled from
the approximately 100g loin meat block at the 7th vertebrae in previous
study(r = 0.916, n = 30, p = 0.005, unpublished data). So we used
intramuscular fat content sampled by needle biopsy method as an
indicator for improving the intramuscular fat content in the whole loin
muscle. Only boars and gilts were measured these traits, but barrows
(about one barrow per litter) were also measured these traits except IMF.
All animals were provided unlimited access to food and water during
the test period by following our Institute’s guidelines for animal
management, and they were reared in performance testing pens with
group feeding in a concrete-floored building (Figure1). All pens were set in
a windless building and room temperature was kept approximately 18℃
by air condition system except summer.
We used genetic and phenotypic parameters from our other Duroc
line when predicting the BVs of the first generation, because we could not
estimate accurate values for this population based on the limited numbers
of animals in the first generation. From the second generation onwards,
these parameters were obtained based on performance test data for this

10
population. The BVs of each trait were calculated according to a best
linear unbiased predictor (BLUP) of multiple traits animal model using
the PEST3.1 program (Groeneveld et al., 1992) after estimating genetic
parameters using the VCE3.2 program (Groeneveld., 1996). Generation,
sex, and lineage effects were used as fixed effects, while the additive
genetic effect and error were included as random effects. Subsequently,
the aggregate BVs were calculated by multiplying the relative economic
weights by the predicted BV for each trait. The relative economic weights
were obtained based on the genetic parameter of traits and the relative
economic value of each trait using the method proposed by Hazel (1943).
However, it was impossible to predict an accurate relative economic value
for each trait, in which case we defined selection procedure to achieve our
desired genetic gain by using the method of linear programming
techniques rather than predicting the relative economic values. We
calculated the relative selection index weights to maximize the genetic
gains of ADG and IMF with keeping the size of EMA at first generation.
Consequently, the aggregate BV (H) was calculated from the following
equation:
H = 0.518 × BVADG + 29.799 × BVBF + 6.592 × BVEMA +
65.318 × BVIMF.
Animals that produce the next generation were selected by
considering their aggregate BV, the proportion of pigs, and their pedigree
in each generation.
1111----2222----3. Mating methods3. Mating methods3. Mating methods3. Mating methods
The coefficients of inbreeding and relationship in this population

11
were calculated by using pedigree from the base population with ‘CoeFR’
software (Satoh., 2000).
In order to make the all selected pigs have relationship each other at
fifth generation and to prevent consanguine mating such as full-sib or
half-sib mating, the mating in each generation was performed under
considering the relationship coefficients between couples.
1111----3. Results and Discussion3. Results and Discussion3. Results and Discussion3. Results and Discussion
1111----3333----1. Change of selection traits1. Change of selection traits1. Change of selection traits1. Change of selection traits
Selection to improve economic traits such as the average ADG, BFT,
and IMF content in this Duroc population was conducted by our breeding
program through five generations, finally, 20 boars and 61 gilts were
selected at fifth generation. The results of phenotypic and breeding values
for each trait are shown in Table 2. Average phenotypic values of the ADG
and BFT of boars at the fifth generation significant increased by 44g/day,
0.21cm compared with first generation, respectively. But phenotypic value
of IMF decreased 0.31%. The each breeding value of ADG, BFT, and IMF
at the fifth generation significantly increased by 82 g/day, 0.32cm, and
0.83% compared with those of the first generation, respectively. Therefore,
these values showed that improved gains had been established according
to improvement goal. In this experiment, the trend of breeding value for
IMF did not conformed to that of the phenotypic value through
generations. However, it was not clear the reason in this study.
Average phenotypic value of EMA of boars at fifth generation was
about the same as fifth generation’s one. The BVEMA decreased slightly
by 0.3 cm2 compared with that of the first generation. The improvement

12
goal of loin EMA was to maintain the size of the first generation. Although
there was statistically significant difference in BVEMA between first and
fifth generation, this change in BVEMA did not affect in actual meat
production. Therefore, the loin EMA improvement was fairly successful in
this experiment.
1111----3333----2. Genetic parameter of selected traits2. Genetic parameter of selected traits2. Genetic parameter of selected traits2. Genetic parameter of selected traits
Table 3 shows that genetic parameters in this population estimated
by using all phenotypic and pedigree data at fifth generation. All
heritability estimates for trait and genetic correlations between traits
showed highly significant difference in Wald tests (Table 3). Heritability
estimates for ADG, BFT, and EMA were mostly moderate (0.43, 0.65, and
0.24, respectively), but that value for IMF was low (0.13). Estimates of
heritability for ADG and BFT in our Duroc line were in range of reports
(ADG; 0.03 - 0.49, BFT; 0.12 - 0.74) listed by Clutter. (2010). Present
estimate of heritability for EMA was lower than other Japanese Duroc
line (0.45) reported by Suzuki et al. (2005), but that was equivalent to
other Duroc population (0.25) reported by Salces et al. (2006). We
analyzed IMF of samples collected by biopsy method in this experiment,
but there has been no describes about porcine IMF collected by our
method. Heritability estimates depend on the methods of measuring
traits, therefore we could not directly compare between present
heritability estimate for IMF and that value in other populations.
Ciobanu et al. (2010) reported the average heritability of IMF was
moderate (0.50), and Suzuki et al. (2005) also estimated that the
heritability for IMF was 0.39 in Duroc population. Those estimates were
13
analyzed by the phenotypic values collected from carcass. Our
heritability estimate for IMF was lower than those values. It may be due
to difference of sampling methods.
Estimates of genetic correlation of ADG with BFT and IMF were
positive and moderate (0.25 and 0.37). Meanwhile genetic correlation
estimate between ADG and EMA was negative (-0.12). Present result
suggests that improvement ADG increase fat deposition such as BFT and
IMF in this population. There were quite variable in the reports of
genetic correlation of ADG with BFT and EMA, ranging from negative
and moderate positive (Lo et al., 1992; Kuhlers et al., 2001; Suzuki et al.,
2005; Clutter., 2010). It appears that its variety may be due to pig breeds
or strain. Lo et al. (1992) and Suzuki et al. (2005) estimated that the
genetic correlation between ADG and BFT in Duroc line was 0.21 and
0.34, respectively, which are similar to the results from present study.
For the genetic correlation between ADG and IMF in Duroc, Suzuki et al.
(2005) estimated that it was 0.23, which was comparatively lower than
our present results. Furthermore, the genetic correlation between BFT
and IMF in the present experiment was 0.63, which was higher than
previous reports. For example, Newcom et al. (2005) and Suzuki et al.
(2005) reported that the estimates of genetic correlation between BFT
and IMF were 0.24 and 0.36, respectively. Those estimates were
calculated by using phenotypic IMF value obtained from carcass.
Therefore, the difference between our results and theirs may be due to
measuring sample methods.
The estimate of genetic correlation between ADG and EMA in
present experiment (-0.12) was very similar to the result (-0.09) in
14
Japanese Duroc line by Suzuki et al. (2005), but not to the result (0.24) in
Duroc line of United States by Lo et al. (1992). The genetic correlation
estimates between BFT and EMA has generally shown negative, for
example, -0.56 (Lo et al., 1992), -0.45(Suzuki et al., 2005), -0.31(Kuhlers
et al., 2001), and -0.31 (Salces et al., 2006). Similar to these studies, our
present result also showed negative (-0.24).
1111----3333----3. The relationship and inbreeding coefficient3. The relationship and inbreeding coefficient3. The relationship and inbreeding coefficient3. The relationship and inbreeding coefficient
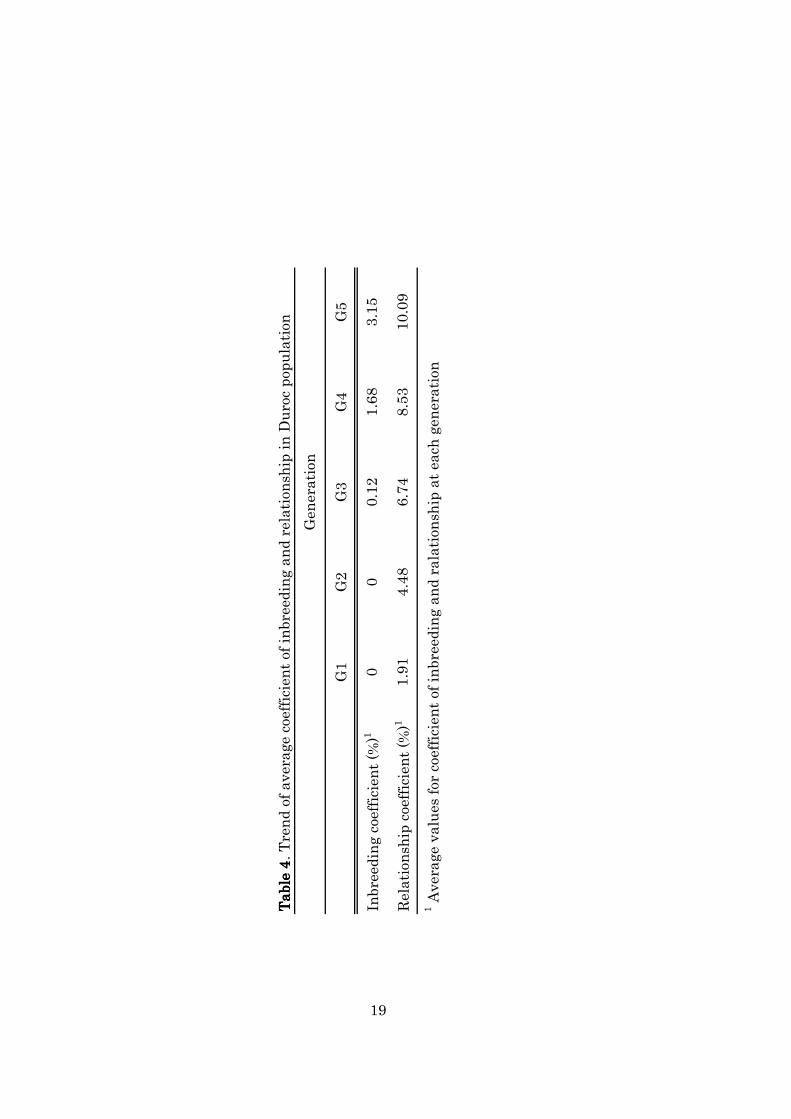
Table 4 shows that the trend of average coefficients of inbreeding
and relationship from first to fifth generation. Those values in this
population increased through the generation by conducting organized
mating. An average inbreeding coefficient of selected pigs at fifth
generation was 3.02%, and average relationship coefficient among those
pigs was 10.09%. All selected pig at fifth generation had relationship
each other.
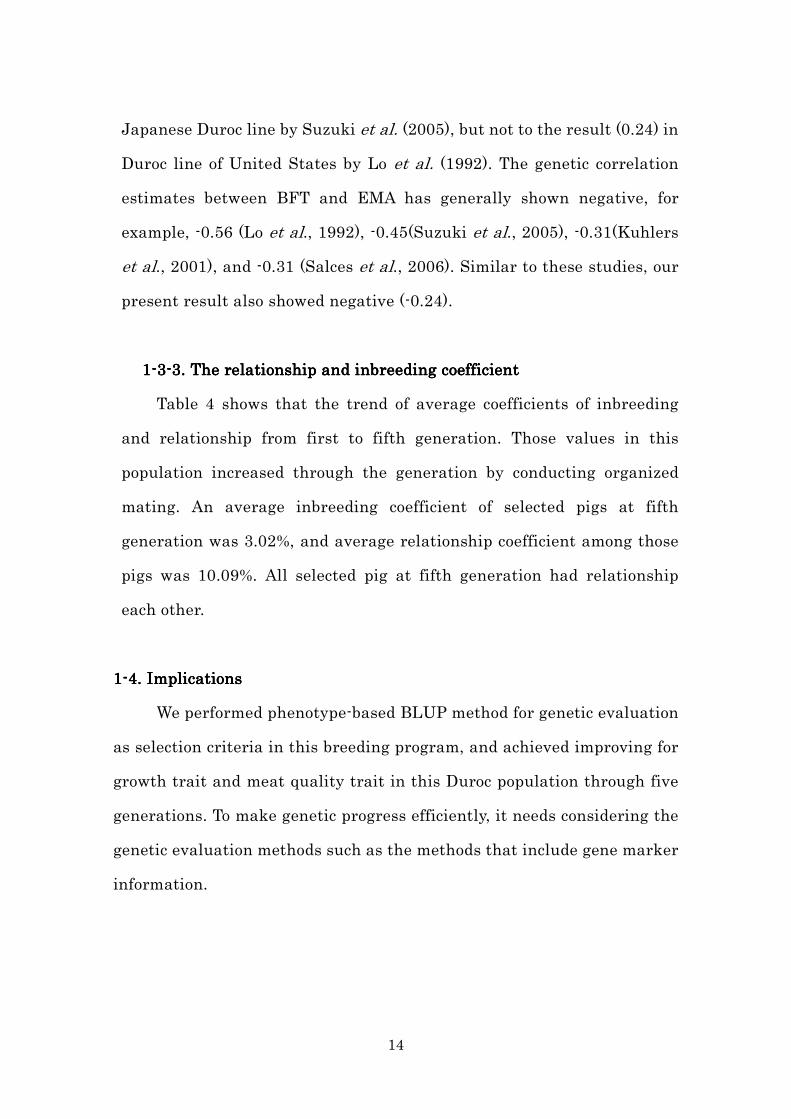
1111----4.4.4.4. ImplicationImplicationImplicationImplicationssss
We performed phenotype-based BLUP method for genetic evaluation
as selection criteria in this breeding program, and achieved improving for
growth trait and meat quality trait in this Duroc population through five
generations. To make genetic progress efficiently, it needs considering the
genetic evaluation methods such as the methods that include gene marker
information.
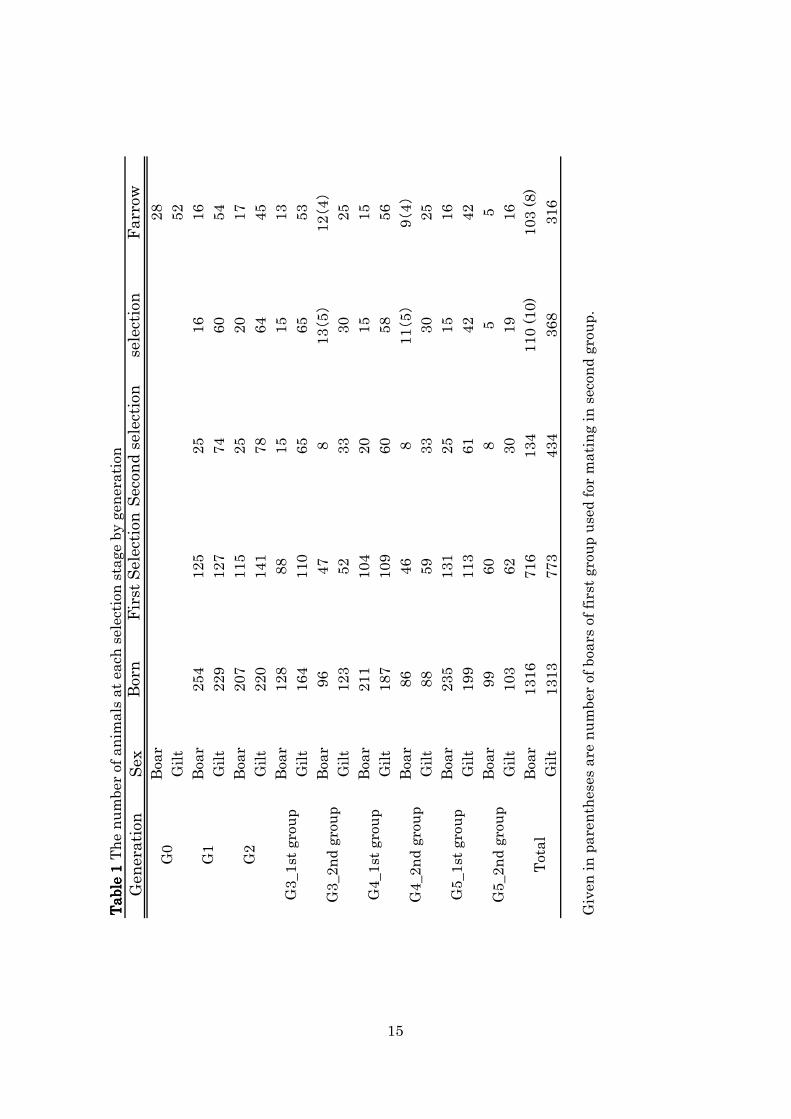
Table 1
Table 1
Table 1
Table 1 The number of anim
als at each selection stage by generation
Generation
Sex
Born
First Selection
Second selection
selection
Farrow
Boar
28
Gilt
52
Boar
254
125
25
16
16
Gilt
229
127
74
60
54
Boar
207
115
25
20
17
Gilt
220
141
78
64
45
Boar
128
88
15
15
13
Gilt
164
110
65
65
53
Boar
96
47
813(5)
12(4)
Gilt
123
52
33
30
25
Boar
211
104
20
15
15
Gilt
187
109
60
58
56
Boar
86
46
811(5)
9(4)
Gilt
88
59
33
30
25
Boar
235
131
25
15
16
Gilt
199
113
61
42
42
Boar
99
60
85
5
Gilt
103
62
30
19
16
Boar
1316
716
134
110 (10)
103 (8)
Gilt
1313
773
434
368
316
Given in parentheses are number of boars of first group used for m
ating in second group.
G1
G2
15
G4_1st group
G4_2nd group
G5_1st group
G0
G5_2nd group
Total
G3_1st group
G3_2nd group
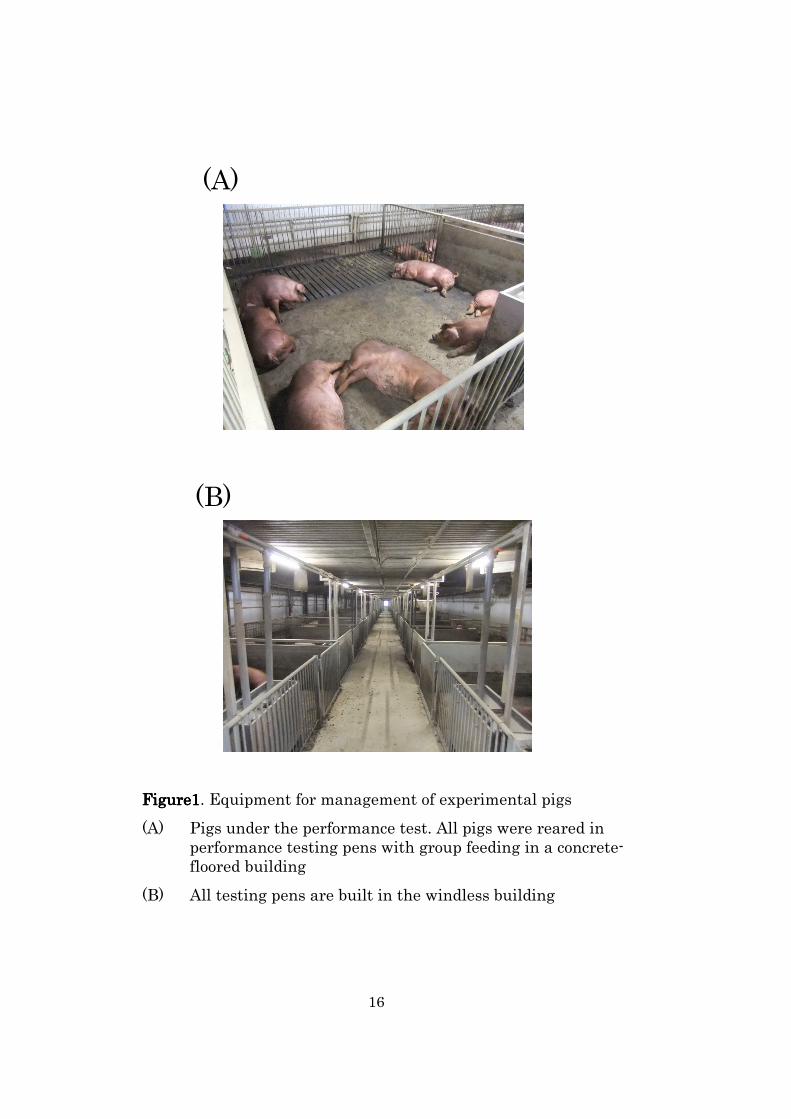
Figure1Figure1Figure1Figure1. Equipment for management of experimental pigs
(A) Pigs under the performance test. All pigs were reared in performance testing pens with group feeding in a concrete-floored building
(B) All testing pens are built in the windless building
(A)
(B)
16

Table
2Table
2Table
2Table
2 T
he tr
end for
phen
otypic a
nd b
reed
ing v
alu
es in D
uro
c pop
ula
tion
1
MW
ADG
BF
EM
AIM
FBVADG
BVBFT
BVEM
ABVIM
F(k
g)
(kg/d
ay)
(cm
)(cm
2)
(%)
(kg/d
ay)
(cm
)(cm
2)
(%)
Boa
rs1
95.0
(5.1
)972 (114)
1.4
5 (0.3
1)
36.5
(3.8
)4.8
3 (1.3
4)
-41 (70)
-0.0
7 (0.2
2)
0.4
(1.1
)0.0
2 (0.5
7)
297.8
(6.2
)992 (79)
1.4
4 (0.2
9)
37.9
(3.8
)4.7
0 (2.0
0)
-25 (43)
0.0
1 (0.1
9)
0.4
(1.2
)0.2
3 (0.7
3)
397.2
(6.2
)1042 (93)
1.5
2 (0.2
9)
38.2
(4.0
)4.5
1 (1.5
1)
-5 (52)
0.0
7 (0.1
9)
0.6
(1.3
)0.4
4 (0.5
3)
495.4
(5.0
)1014 (95)
1.5
0 (0.2
7)
36.6
(3.6
)3.9
6 (1.0
8)
11 (56)
0.1
5 (0.2
0)
0.2
(1.3
)0.5
8 (0.5
4)
594.8
(5.0
)1016 (101)
1.6
6 (0.3
2)
36.5
(3.0
)4.5
2 (1.4
3)
41 (59)
0.2
5 (0.2
1)
0.1
(1.0
)0.8
5 (0.5
7)
P3
<0.0
01
<0.0
01
<0.0
01
0.1
08
0.0
97
<0.0
01
<0.0
01
0.0
12
<0.0
01
Gilts
193.9
(4.4
)906 (98)
1.6
7 (0.3
9)
37.9
(3.9
)5.3
0 (1.3
7)
-44 (62)
-0.0
9 (0.2
6)
0.6
3 (1.1
)-0
.06 (0.5
8)
294.5
(4.6
)929 (83)
1.5
9 (0.3
2)
38.4
(3.6
)5.1
1 (1.9
5)
-27 (47)
-0.0
2 (0.2
3)
0.5
(1.2
)0.1
8 (0.7
4)
395.5
(5.3
)975 (88)
1.7
8 (0.3
4)
38.5
(3.7
)4.7
1 (1.2
5)
-8 (46)
0.0
9 (0.2
2)
0.6
(1.2
)0.3
9 (0.5
3)
494.7
(4.2
)970 (94)
1.7
3 (0.3
1)
37.0
(3.2
)4.7
4 (1.5
0)
15 (55)
0.1
5 (0.2
1)
0.3
(1.3
)0.6
5 (0.5
9)
593.0
(3.6
)956 (95)
1.9
3 (0.3
5)
36.1
(3.3
)5.0
6 (1.4
8)
37 (57)
0.2
7 (0.2
2)
-0.1
(1.0
)0.8
0 (0.6
5)
P3
<0.0
01
<0.0
01
<0.0
01
<0.0
01
0.1
76
<0.0
01
<0.0
01
<0.0
01
<0.0
01
Barr
ows
1-
--
--
--
--
296.6
(6.4
)1010 (92)
1.7
0 (0.3
5)
37.8
(4.1
)-
-23 (51)
-0.0
4 (0.2
4)
0.4
(1.3
)0.2
3 (0.4
9)
396.8
(7.2
)1068 (105)
1.9
6 (0.3
5)
39.2
(4.4
)-
-2 (57)
0.1
3 (0.2
2)
0.7
(1.1
)0.4
0 (0.4
6)
494.0
(3.8
)1049 (107)
1.8
6 (0.3
8)
36.3
(3.4
)-
20 (64)
0.1
7 (0.2
4)
0.2
(1.4
)0.6
7 (0.3
8)
593.4
(4.1
)1014 (90)
2.0
1 (0.3
3)
35.7
(3.7
)-
34 (52)
0.2
9 (0.2
3)
0.0
(1.0
)0.8
4 (0.4
3)
P3
0.0
01
0.8
21
<0.0
01
0.1
4-
<0.0
01
<0.0
01
<0.0
01
<0.0
01
Tot
al
194.4
(4.8
)939 (111)
1.5
6 (0.3
7)
37.2
(3.9
)5.2
4 (1.6
0)
-43 (66)
-0.0
8 (0.2
4)
0.5
(1.1
)-0
.02 (0.5
8)
296.1
(5.7
)966 (89)
1.5
5 (0.3
3)
38.2
(3.7
)4.9
4 (1.9
7)
-25 (46)
-0.0
1 (0.2
2)
0.4
(1.2
)0.2
0 (0.7
0)
396.3
(6.0
)1014 (100)
1.7
0 (0.3
6)
38.5
(3.9
)4.6
2 (1.3
7)
-6 (50)
0.0
9 (0.2
1)
0.6
(1.2
)0.4
1 (0.5
2)
494.9
(4.5
)999 (100)
1.6
5 (0.3
3)
36.7
(3.4
)4.3
6 (1.3
7)
14 (57)
0.1
5 (0.2
1)
0.2
(1.3
)0.6
2 (0.5
5)
593.8
(4.4
)991 (101)
1.8
2 (0.3
7)
36.2
(3.2
)4.8
2 (1.4
8)
39 (57)
0.2
7 (0.2
2)
0.0
(1.0
)0.8
3 (0.5
9)
P (G2-G
5)4
<0.0
01
<0.0
01
<0.0
01
<0.0
01
0.0
30
<0.0
01
<0.0
01
<0.0
01
<0.0
01
1 M
ean v
alu
es. Giv
en in p
are
nth
eses
are
S.D
.
4P
(G2-G
5) valu
es w
ere es
tim
ate
d b
y G
LM
to co
mpare
bet
wee
n 2
nd g
ener
ation
and 5
th g
ener
ation
, baca
use
ther
e wer
e no data
for
barr
ows at 1st
gen
eration
gen
eration
2 M
W:m
esure
men
t wei
ght, A
DG: Aver
age daily g
ain
; BFT: Back
fat th
icknes
s; E
MA: Eye m
usc
le a
rea; IM
F: In
tram
usc
ula
r fa
t co
nte
nt,
BVADG:B
reed
ing v
alu
e of
ADG, BVBFT:B
reed
ing v
alu
e of
BFT, BVEM
A: Bre
edin
g v
alu
e of
EM
A, BVIM
F:B
reed
ing v
alu
e of
IM
F3 P
valu
es w
ere es
tim
ate
d b
y G
LM
to co
mpare
bet
wee
n 1
st g
ener
ation
and 5
th g
ener
ation
.
17
Phen
otypic v
alu
es2
Bre
edin
g v
alu
es3
Sex

AD
G2
BF
T2
EM
A2
IMF
2
AD
G0.4
3±
0.0
30.2
5±
0.0
3-0
.12
±0.0
40.3
7±
0.1
0
P3
0.1
4×
10
-47
0.7
9×
10
-18
0.2
7×
10
-20.2
2×
10
-3
BF
T0.6
5±
0.0
3-0
.23
±0.0
40.6
3±
0.0
8
P3
0.4
2×
10
-50.8
9×
10
-10
0.3
4×
10
-16
EM
A0.2
4±
0.0
3-0
.23
±0.0
7
P3
0.1
2×
10
-16
0.1
0×
10
-2
IMF
0.1
3±
0.0
2
P3
0.8
0×
10
-12
1 D
iagon
al:
heri
tabil
ity ±
sta
nd
ard
err
or;
Above d
aig
on
al:
gen
eti
c co
rrela
tion
± s
tan
dard
err
or
2 A
DG
: A
vera
ge d
ail
y g
ain
; B
FT
: B
ack
fat
thic
kn
ess
; E
MA
: E
ye m
usc
le a
rea; IM
F: In
tram
usc
ula
r fa
t co
nte
nt
3W
ald
test
resu
lts
for
each
maxim
um
lik
eli
hood
est
imate
s of
gen
eti
c p
ara
mete
r
18
Table
3T
able
3T
able
3T
able
3.R
est
rict
ed
maxim
um
lik
lih
ood
est
imate
s of
gen
eti
c p
ara
mete
r betw
een
sele
cted
tra
its1
G1
G2
G3
G4
G5
Inbreeding coefficient (%
)10
00.12
1.68
3.15
Relationship coefficient (%
)11.91
4.48
6.74
8.53
10.09
1 Average values for coefficient of inbreeding and ralationship at each generation
Table 4
Table 4
Table 4
Table 4. Trend of average coefficient of inbreeding and relationship in Duroc population
Generation
19
20
CHAPTER CHAPTER CHAPTER CHAPTER 2222. . . . Association of porcine beta 3Association of porcine beta 3Association of porcine beta 3Association of porcine beta 3----adrenergic receptor (adrenergic receptor (adrenergic receptor (adrenergic receptor (ADRB3ADRB3ADRB3ADRB3) ) ) )
gene with production traits in Duroc pigsgene with production traits in Duroc pigsgene with production traits in Duroc pigsgene with production traits in Duroc pigs
2222----1. Introduction1. Introduction1. Introduction1. Introduction
Genetic association studies test is analyzing correlation between
genetic variation and traits in order to identify candidate genes or
genome regions that contribute to a specific trait. Implicating this
method in livestock, it is generally used the genes which had been
revealed those physiological function in another species such as mouse
or human. Single-nucleotide polymorphisms (SNPs) are the most widely
tested markers in association studies, but microsatellite markers,
insertion/deletions, variable-number tandem repeats (VNTRs), and
copy-number variants (CNVs) are also used. Many associations with
polymorphisms in candidate genes have been confirmed in various
livestock.
Growth and energy metabolism are important characteristics in
animal production. Adipose tissue has been the focus of recent efforts to
identify candidate genes involved in energy metabolism, especially in
studies concerning human obesity, because adipose tissue plays a crucial
part in regulating the storage and mobilization of energy (Perusse et al.,
2005). The β3-adrenergic receptors (ADRB3s) are guanine
nucleotide-binding protein-coupled receptors predominantly found on the
surface of adipocytes, and are major mediators of lipolytic and
thermogenic effects in brown and white adipose tissue (Nahmias et al.,
1991; Arch & Kaumann., 1993).
An amino acid substitution [Trp 64→Arg] in human ADRB3 has

21
been examined by various authors (reviewed in Strosberg, 2000). Some of
those studies suggested that people with the Trp64→Arg substitution may
have an increased capacity to gain weight and may tend to have a lower
resting metabolic rate (Kadowaki et al., 1995). Others have reported that
this mutant allele may accelerate the onset of non-insulin-dependent
diabetes mellitus by altering the balance of energy metabolism in visceral
adipose tissue (Silver et al., 1997; Masuo et al., 2005). In domestic animals,
Forrest et al (2003, 2006, 2007) identified that variation in the ovine
ADRB3 locus was associated with the cold-related mortality rate in lambs.
Such findings suggest that variation in domestic animals ADRB3 may
affect economically important traits, such as fat deposition and
thermogenesis, thereby influencing growth and meat quality.
The porcine ADRB3 gene has two exons (Figure 2), and five
polymorphic haplotypes have been identified (Tanaka et al., 2007). Among
these, insertion or deletion polymorphisms of thymine in exon 2 (c.1211
T(5_6)) were interesting because this variation resulted in a frameshift.
The allele with a direct repeat of five thymine bases (T5) coded 407 amino
acids compared with 405 amino acids for the allele with a direct repeat of
six thymine bases (T6). In this study, we assessed T5 and T6 variations in
ADRB3 in Duroc pigs and analyzed the association of these variations
with several animal production traits.
2222----2. Materials and Methods2. Materials and Methods2. Materials and Methods2. Materials and Methods
2222----2222----1. Animals and data collection1. Animals and data collection1. Animals and data collection1. Animals and data collection
The pig population used in this study was a pure Duroc strain that
was part of an improvement program by nucleus breeding system at the
22
Central Research Institute for Feed and Livestock ZEN-NOH (Hokkaido,
Japan). Data in this part were collected from 735 Duroc pigs in first group
of three generations from first to third.
The details of selection criteria, selection methods, and data
collection methods were described in Chapter 1. In this part, we analyzed
the phenotypic values and breeding values of four production traits (ADG,
BFT, EMA, and IMF). All animals were provided unlimited access to food
and water during the experimental period, and all experiments were
performed in accordance with our institutional guidelines for animal
management.
2222----2222----2. Genotyping2. Genotyping2. Genotyping2. Genotyping
Genomic DNA was extracted from tail tissue clips from each
individual using a DNeasy Blood and Tissue Kit (Qiagen Inc, Hilden,
Germany). All animals were genotyped for the T5-T6 ADRB3
polymorphisms the using PCR-restriction fragment-length polymorphism
(PCR-RFLP) method described by Tanaka et al. (2007). Mismatch primer
sets (forward: 5′-CCATTTTCAGGGCTTCCTGGGGCCTT-3′, reverse:
5′-GCCACTTGGTAAGGAATTCCCCCTT-3′) were used for PCR detection.
The PCR conditions were as follows: denaturation at 94°C for 5 min, 33
cycles of amplification at 94°C for 1 min, 54°C for 1 min, 72°C for 45 s, and
a final extension step at 72°C for 10 min. For the PCR-RFLP assays, 2 µL
of the PCR products was used for restriction digestion with 5 U of XagI
(Fermentas Inc., Glen Burnie, MD, USA) in 10x digestion buffer added to
a total volume of 10 µL. (Figure 3).
23
2222----2222----3. Statistical analyses3. Statistical analyses3. Statistical analyses3. Statistical analyses
The GLM procedure of MINITAB (Version14.12.2, Minitab Inc.,
State College, PA, USA) was used to obtain least squares means of ADG,
BF, EM, and IMF to account for the fixed effects of ADRB3genotype at
each sex, and to test significance of the results. Both additive and
dominance effects of the ADRB3 alleles were estimated with MINITAB
using its REG procedure. The additive effect of alleles was defined as −1, 0,
and 1 for homozygous (T5/T5, T6/T6) and heterozygous (T5/T6) genotypes.
The dominant model was defined as −1, 1, and 1 for T5/T5, T5/T6, T6/T6,
while the recessive model was defined as 1, 1, and −1 for T5/T5, T5/T6,
T6/T6, respectively. The linear model used to analyze the data was as
follows:
Yijk = µ + Genotypej + Generationk + βWeightijk + eijk
where, Yijk is the phenotypic value of each trait, µ is the overall
mean for each trait, Genotypej is the effect of ADRB3 genotype,
Generationk is the effect of generation, Weightijk is the weight
measurement , β is the covariate of the weight measurement and eijk is the
random residual effect.
For analysis of breeding values of each trait, both the fixed effects of
sex and generations and the covariates between measurement weight and
each trait were included in the BLUP model, An ANOVA with genotype as
the independent variable was used to analyze the association of genotype
with breeding value of each trait. The relative contributions of the ADRB3
genotypes to the variance of the traits’ breeding values were estimated by

24
PEST3.1 program and used the ADRB3 genotypes as the fixed effect.
2222----3. Results3. Results3. Results3. Results
2222----3333----1.1.1.1. ADRB3 ADRB3 ADRB3 ADRB3 gene allelic frequenciesgene allelic frequenciesgene allelic frequenciesgene allelic frequencies
The genotypic and allelic frequencies for the T5 and T6 ADRB3 gene
polymorphisms are presented in Table 5. There was no significant
difference in genotype distribution between each sex (χ2 = 6.882, df = 4, p =
0.142).
2222----3333----2. Association of genotypes with economic traits 2. Association of genotypes with economic traits 2. Association of genotypes with economic traits 2. Association of genotypes with economic traits
Table 6 shows the phenotypic values of the measured traits for the
ADRB3 genotypes. There was no evidence of an effect of these
polymorphisms on ADG, BFT, and IMF in this study. However, the ADRB3
genotype was significantly associated with EMA in gilts (Table 6).
T6-homozygote gilts had a significantly higher mean EMA (40.6 ± 0.6 cm2)
than the T5-homozygote (38.1 ± 0.4 cm2, p = 0.002) and the heterozygotes
(38.8 ± 0.3 cm2, p = 0.034). Although the differences did not reach
statistical significance, T6-homozygous boars and barrows had tendencies
toward larger EMA than that of T5-homozygous boars and barrows (Table
6). Therefore, as analyzing in total pigs, the ADRB3 genotype was
significantly associated with EMA (p= 0.002).
Figure 4 shows a histogram of the EMA of gilts per ADRB3
genotypes. The median EMA of the T6-homozygotes (39.8 cm2) was larger
than that of the T5-homozygotes (37.7 cm2) and the heterozygotes (38.7
cm2). Similarly, the mode of the EMA of T6-homozygotes (39.2 cm2) was
larger than that in T5-homozygotes (38.8 cm2) and heterozygotes (35.3

25
cm2). There was no significant difference in variance of eye muscle area
between each genotype (Bartlett’s test, χ2 = 0.05, p = 0.976). ADRB3
genotypic frequencies were significantly different between upper 20% and
lower 20% of EMA values in gilts (χ2 = 12.78, df = 2, p = 0.0017; two-tailed
Fisher’s exact test). The results indicate that ADRB3 polymorphisms may
affect EMA.
Table 7 shows data related to the breeding value of EMA (BVEMA).
A highly significant association was detected between ADRB3 genotypes
and BVEMA (p = 0.002); the BVEMA of T6-homozygotes (0.83 cm2) was
larger than that in both the T5-homozygotes (−0.37 cm2) and the
heterozygotes (0.11 cm2). The contribution of the ADRB3 genotypes to the
variance of the BVEMA was 25.4%. These results suggest that T6 is a
female specific quantitative trait locus (QTL) allele that can increase EMA
in the period prior to achievement of a 90 kg body weight in Duroc pigs.
2222----4. Discussion4. Discussion4. Discussion4. Discussion
The T6 allelic frequency was 56.7% in our Duroc population. Tanaka
et al. (2007) reported a 12.5% T6 frequency in another Duroc line, and
Chikuni et al. (2008) reported that the frequency of T6 allele was only
2.1% in Duroc × Jinhua crossbred. Furthermore, T6 has been reported to
be a minor allele in European breeds of pigs. The results indicate
substantial differences in ADRB3 allelic frequencies among breeds and
lines.
In this study, porcine ADRB3 thymine polymorphism was examined
to determine whether performance traits in pigs were associated with T5
and/or T6 ADRB3 genotypes. In our Duroc line, T6-homozygote gilts had a
26
significantly larger EMA (p = 0.003) than T5-homozygous and
heterozygote gilts. A significant effect on EMA was detected in gilts. In
boars and barrows, we did not detect any association between performance
traits and T5/T6 ADRB3 genotype. Rodríguez et al. (2001) reported that
sex - related differences at expression of some different adrenogic receptor
that include beta-1, -2, -3 adrenogic receptor were found in the rat’s brown
adipose tissue. In their study, the levels of beta 3-adrenogic receptor
expression in male rats were higher than in females in the situation of
overfeeding. Therefore, the difference of ADRB3 genotypes might be
associated with expression of porcine beta 3 adrenogic receptor in the
muscle of female pigs. Moreover, sex specific associations between QTL
alleles and performance traits have been previously reported in pigs. For
example, de Oliveira Peixoto et al. (2006) demonstrated that Leptin
genotypes were associated with average daily weight gain and feed
conversion in male, but not female. Our present results suggest that the
T5/T6 ADRB3 polymorphism is the location of a female specific QTL allele
that can increase EMA by the time of achievement of a 90 kg body weight.
These results indicate that ADRB3 can be useful as a genetic marker
when improving to the loin eye muscle area in Duroc pigs.
The exact mechanisms of how ADRB3 polymorphisms lead the
differences in EMA are unknown. One possible mechanism would be
differential regulation of receptor activities by the mutations. We expected
that the T5/T6 ADRB3 polymorphisms would affect energy metabolism
and fatness in pigs. However, there was no association between ADRB3
genotypes and fat deposition or rate of growth. Cieslak et al. (2009) also
detected no correlation with fat deposition in Polish multi-breed panel (e.g.

27
Landrace, Duroc, Pietrain and so on). In humans, ADRB3 polymorphisms
have been linked to increased body mass indices, obesity, and more
recently to dietary and nutrients preferences in adults (Emorine et al.,
1989; Clement et al., 1995). On the other hand, the effects of ADRB3
polymorphisms on obesity and weight gain are reported to very small in
children (Cecil et al., 2007). In this study, assessments were done between
the time when the pigs were approximately 30 kg body weight to when
they reached an approximate 90 kg body weight; an elapsed time of about
120 days. In piggeries, most pigs are butchered for meat by the age of six
months, i.e. prior to reaching maturity. We were unable to determine the
effects of porcine T5/T6 ADRB3 polymorphisms on fat deposition and
growth traits in matured pigs.
The effects of QTL alleles have been reported to shift among breeds
and populations. For example, alleles of the porcine melanocortin-4
receptor (MC4R) gene were associated with growth and fatness traits in
Landrace, Large White, and synthetic pig lines that had been generated
by crossing Large White and Duroc pigs (Kim et al., 2000;
Hernández-Sánchez et al., 2003; Houston et al., 2004). In contrast, studies
on a Large White × Wild Boar reference family did not reveal any
significant effects of MC4R variants (Park et al., 2002). One reason for the
contrasting results may be genetic interaction between different QTLs.
Recent literature indicates that genetic interactions involving ADRB3 and
other loci influence human obesity (Corella et al., 2001; Mentuccia et al.,
2002; Cecil et al., 2007). In our study, the T6 allele is associated with
increased pig EMA. This is the first study to report a relationship between
porcine ADRB3 variants and productive traits. As only one Duroc

28
population was assessed, studies on other breeds and populations are
needed in order to clarify the effects of T5/T6 ADRB3 polymorphism on the
porcine productive traits.

Exon1
Exon2
Figure 2
Figure 2
Figure 2
Figure 2. The position of mutation for gen
otyping ADRB3gene in this study. The protein coding
sequences are indicated by dark-stained boxes. . The numbering of base position was adhered to
the reference NC_010457 (Sus scrofa 10.2; g.55482168..g.55484072, chromosom
e 15) sequence.
The mutation in exon region were identified based on Genbankaccession no. NM_001099927.1.
Arrow
show
s the position of c1211 T(5_6).
1196bp
28bp
681bp
c.1211 T(5_6)
29

Figure 3Figure 3Figure 3Figure 3. Genotyped patterns of polymorphism digested by restriction enzymXagI in the exon2 of the porcine ADRB3 gene on a 3.0% agarose gel. The genotypes indicate under lanes of the gel. The M is a 100-bp DNA Ladder molecular size mark (Toyobo, Osaka, Japan).
T5/T5 T5/T6 T5/T5 T5/T6 T6/T6 T5/T6 T6/T6 M
100
200
300
bp
30

T5/T5 T5/T6 T6/T6 T5 T6Boar 16.1 53.6 30.3 42.9 57.1(323) (52) (173) (98) (277) (369)Gilt 17 51 32 42.3 57.7(359) (61) (183) (115) (305) (413)Barrow 30.2 41.5 28.3 50.9 49.1(53) (16) (22) (15) (54) (52)Total 17.6 51.4 31 43.3 56.7(735) (129) (378) (228) (636) (834)
1 Percentage of each genotype. Given in parentheses are number of pigs.2 Percentage of each allele. Given in parentheses are number of alleles.
Table 5Table 5Table 5Table 5 Genotypic and allelic frequencies of the T5 and T6 ADRB3gene polymorphism
Genotypic frequency1 Allelic frequency2
31

Table
6T
able
6T
able
6T
able
6 A
ssoc
iati
on b
etw
een p
orci
ne
AD
RB
3 p
olym
orphis
m a
nd e
conom
ic t
rait
s in
Duro
c pig
s
T5/T
5T
5/T
6T
6/T
6
(N)
(N)
(N)
1003 ±
7998 ±
13
1004 ±
11
1010 ±
16
(323)
(52)
(173)
(98)
933 ±
6932 ±
11
939 ±
8917 ±
15
(359)
(61)
(183)
(115)
1033 ±
92
1058 ±
26
1025 ±
22
1025 ±
25
(53)
(16)
(22)
(15)
964c4
984±7
986±6
970±9
(735)
(129)
(378)
(228)
1.4
4 ±
0.0
21.4
6 ±
0.0
31.4
6 ±
0.0
21.4
2 ±
0.0
4(3
23)
(52)
(173)
(98)
1.6
9 ±
0.0
21.6
5 ±
0.0
31.6
9 ±
0.0
31.6
7 ±
0.0
4(3
59)
(61)
(183)
(115)
1.7
7 ±
0.0
41.8
6 ±
0.1
01.7
1 ±
0.0
81.8
7 ±
0.0
9(5
3)
(16)
(22)
(15)
1.5
8±0.0
11.6
3±0.0
21.6
4±0.0
21.6
3±0.0
3(7
35)
(129)
(378)
(228)
37.2
± 0
.337.0
± 0
.437.4
± 0
.337.8
± 0
.6(3
23)
(52)
(173)
(98)
39.0
± 0
.238.1
± 0
.4a
38.8
± 0
.3a
40.6
± 0
.6b
(359)
(61)
(183)
(115)
37.9
± 0
.638.2
± 1
.337.4
± 1
.140.3
± 1
.3(5
3)
(16)
(22)
(15)
38.2
±0.2
37.4
±0.4
38.0
±0.3
39.2
±0.4
(735)
(129)
(378)
(228)
4.3
5 ±
0.1
84.3
5 ±
0.1
84.5
4 ±
0.1
63.8
7 ±
0.2
3(1
76)
(36)
(82)
(58)
4.7
5 ±
0.1
64.7
5 ±
0.1
64.7
0 ±
0.1
34.8
7 ±
0.2
2(2
28)
(38)
(115)
(75)
4.6
3±0.0
74.5
3±0.1
24.6
0±0.1
04.2
3±0.1
5(4
04)
(74)
(197)
(133)
1 A
DG
: A
ver
age
daily g
ain
; B
F: B
ack
fat
thic
knes
s; E
MA
: E
ye
musc
le a
rea; IM
F: In
term
usc
ula
r fa
t co
nte
nt.
2 M
ean v
alu
es (±SE
) of
all p
igs
in e
ach
sex
.
* : si
gnific
ant
diffe
rence
(P
< 0
.05), **
: h
ighly
sig
nific
ant
diffe
rence
(P
< 0
.01).
0.2
09
0.6
8±0.2
2**
0.4
4±0.1
8*
0.8
3±0.2
5**
3.1
9±5.2
0
0.0
0±0.0
20.0
0±0.0
1-0
.00±0.0
2
-5.1
7±4.7
00.0
2±3.8
4
Barr
ow0.3
2
Gilt
0.8
07
3 L
east
square
mea
n v
alu
es (±SE
). D
iffe
rent
lett
ers
den
otin
g s
ignific
ant
diffe
rence
bet
wee
n g
enot
ypes
. G
iven
in p
are
nth
eses
are
num
ber
of pig
s.
AD
G(g
/day)
BF
T(c
m)
EM
A (cm
2)
IMF
(%
)
Tot
al
Tot
al
Tot
al
0.1
0±0.0
9T
otal
Tra
its1
Sex
Tot
al2
Gen
otype3
Barr
ow0.5
49
-10.1
±17.5
P
Eff
ect4
Addit
ive
Dom
inant
Rec
essi
ve
3.0
± 5
.71.2
± 7
.2
-13.6
±6.1
*
Boa
r0.8
27
2.2
± 7
.9
Gilt
0.4
32
-10.2
±6.7
-2.2
±5.0
-16.4
±14.8
-6.5
±14.7
-0.0
0±0.0
2-0
.02±0.0
2-0
.02±0.0
2
0.0
1 ±
0.0
3
-0.0
4±0.0
60.0
5 ±
0.0
5
0.0
1 ±
0.0
2-0
.00±0.0
2G
ilt
0.6
41
Boa
r0.6
35
0.4
1 ±
0.3
7
Barr
ow0.3
21
0.0
1 ±
0.0
7
0.8
88
0.0
1 ±
0.1
1
0.2
8 ±
0.3
4
Gilt
0.0
03
1.2
2 ±
0.3
6**
0.2
6 ±
0.2
7
0.6
6 ±
0.2
7*
1.0
2 ±
0.3
3**
Boa
r0.5
2
-0.0
7±0.1
0
1.0
9 ±
0.9
1
0.0
57
-0.1
8±0.1
5
0.5
19
0.0
02
4 A
ddit
ive
effe
ct: T
5/T
5 =
−1, T
5/T
6 =
0, T
6/T
6 =
1. D
omin
ant
mod
el e
ffec
t: T
5/T
5 =
−1, T
5/T
6 a
nd T
6/T
6 =
1. R
eces
sive
mod
el e
ffec
t: T
5/T
5 a
nd T
5/T
6= −
1, T
6/T
6 =
1.
0.0
2 ±
0.1
3
32
0.3
1 ±
0.1
3
0.0
8 ±
0.0
2-0
.02±0.1
0
0.2
0 ±
0.7
81.3
1 ±
0.7
4
Boa
r
-0.0
1±0.0
7

05
10
15
20
25
30
35
40
26
28
30
32
34
36
38
40
42
44
46
48
50
52
Eye M
usc
le A
rea(
cm
2)
Number of gilts
T5/T
5
T5/T
6
T6/T
6
Figure 4.
Figure 4.
Figure 4.
Figure 4.Distribution of loin eye muscle area in gilts per ADRB3genotype. Histogram
represents loin eye muscle area m
easured in the middle of pigs’body length in 95 kg gilts at 2
cm2intervals. Mode of loin eye muscle area indicated by arrow
heads. There was no significant
difference in variance of eye muscle area between genotype (Bartlett’s test, χ
2= 0.05, p= 0.976).
33

Table
7T
able
7T
able
7T
able
7 A
ssoc
iati
on b
etw
een p
orci
ne
AD
RB
3 p
olym
orphis
m a
nd b
reed
ing v
alu
e of
eye
musc
le a
rea (cm
2)
T5/T
5T
5/T
6T
6/T
6
BV
EM
A735
0.0
4 ±
0.0
6−0.3
7±
0.1
1a
0.0
1 ±
0.0
1b
0.8
3 ±
0.1
5c
0.0
02
1 M
ean v
alu
es(±
SE
) of
all p
igs.
2 L
east
square
mea
n v
alu
es (±SE
). D
iffe
rent
lett
ers
den
otin
g s
ignific
ant
diffe
rence
bet
wee
n g
enot
ypes
.
34
PT
rait
nT
otal1
Gen
otype2

35
CHAPTER 3:CHAPTER 3:CHAPTER 3:CHAPTER 3: Association of Association of Association of Association of porcineporcineporcineporcine class 3 phosphoinositide class 3 phosphoinositide class 3 phosphoinositide class 3 phosphoinositide----3333----kinase kinase kinase kinase
((((PIK3C3PIK3C3PIK3C3PIK3C3) gene with production traits in Duroc pigs) gene with production traits in Duroc pigs) gene with production traits in Duroc pigs) gene with production traits in Duroc pigs
3333----1.1.1.1.IIIIntroductionntroductionntroductionntroduction
The genetic improvements have been driven by measuring
phenotypes of selection candidate traits and predicting genetic values
based on phenotypes in the nucleus population. Although this method has
led to increase the performance of several traits, the phenotype-based
approaches suffer from several important limitation, for instance, meat
quality traits cannot be measured only through the slaughter of animals.
It is required for developing new molecular genetics by using individual’s
genotype to overcome the limitations and establish more efficient
evaluating method.
Many studies have detected various genetic markers that have
potential to associated with production traits, but the number of publicly
available genetic marker in the industry are still very limited. It is
required the evaluation for practical availability of these genetic markers
in commercial pig population.
Class 3 phosphoinositide-3-kinase (PIK3C3) is a member of the
phosphoinositide 3-kinase family, which is involved in both
receptor-mediated signal transduction and intracellular trafficking
(Shepherd et al., 1998; Czech & Corvera., 1999; Prasad et al., 2002;
Stopkova et al., 2004). The porcine PIK3C3 gene (GeneBank accession no.
NM_001012956) is composed of 109 kbp and 25 exons (Figure 5) and has
been mapped at 117.948 Mb on SSC 6 in Sscrofa10.2
(http://www.ncbi.nlm.nih.gov/gene/503700). Several quantitative trait loci

36
(QTL) affecting the growth rate, amount of backfat (BF) thickness, and
other production traits in this area have been identified by many
researchers (Bidanel et al., 2001; Óvilo et al., 2000, 2002; Sato et al., 2003;
Yue et al., 2003; Zhang et al., 2007).
Kim et al. (2005b) sequenced full-length porcine PIK3C3 cDNA and
found five SNPs (C339G, C1401T, A2058G, A2256G, and C2604T; the
number indicates the position of the SNP in the PIK3C3 cDNA coding
region) between Korean native and Large White pigs. All five SNPs are
synonymous substitutions. Using the F2 generation between Korean
native boars and Landrace sows, they also analyzed SNP C2604T, which is
located on exon 24 and is associated with growth and fat deposit traits,
and found that the C allele had a positive and significant effect on fat
content. Furthermore, a study was performed based on a resource family
between two breeds with a large phenotypic difference. However, the
correlation between PIK3C3 gene polymorphisms and economic traits has
not been investigated in Duroc populations.
The effects of genotype, even if it has not responsible mutation, have
been reported to shift among breeds and populations. For example, the
porcine melanocortin-4 receptor (MC4R) gene were associated with growth
and fatness traits in Landrace, Large White, and synthetic pig lines (Kim
et al., 2000; Hernández-Sánchez et al., 2003; Houston et al., 2004). In
contrast, studies on a Large White × Wild Boar reference family did not
reveal any significant effects of MC4R variants (Park et al., 2002). In
addition, although Gerbens et al. (1999) detected that an allele of H-FABP
gene had increasing effect on intramuscular fat in the loin in one Duroc
population, Uemoto et al. (2007) indicated that the allele had opposite
37
effect on intramuscular fat in other Duroc population. Therefore, the
effects of the C2604T SNP in PIK3C3 polymorphism are need to be
determined before utilizing this gene as a genetic marker for our breeding
program in Duroc.
In this study, we investigated the relationship between PIK3C3 gene
polymorphisms and economic traits in a Duroc population. We also tested
the usefulness of PIK3C3 genotyping for estimating the breeding values of
porcine productive traits in statistical models.
3333----2. 2. 2. 2. MMMMaterials and aterials and aterials and aterials and MMMMetetetethodshodshodshods
3333----2222----1. 1. 1. 1. Animals and data collectionAnimals and data collectionAnimals and data collectionAnimals and data collection
The pig population used in this study was a pure Duroc strain that
was part of an improvement program by nucleus breeding system at the
Central Research Institute for Feed and Livestock ZEN-NOH (Hokkaido,
Japan). The details of data collection methods, selection criteria, and
selection methods in this strain were described in Chapter1.
In this part, we analyzed the four production traits (ADG, BFT,
EMA, and IMF) that were collected from 739 Duroc pigs across three
generations from second to fourth generation. All animals were provided
unlimited access to food and water during the experimental period, and all
experiments were performed in accordance with our institutional
guidelines for animal management.
3333----2222----2. 2. 2. 2. GenotypingGenotypingGenotypingGenotyping
Genomic DNA was extracted from tail tissue clips of each pig using
the DNeasy Blood and Tissue Kit (Qiagen, Inc., Hilden, Germany). All
38
animals were genotyped for the T–C PIK3C3 polymorphism using the
PCR-restriction fragment length polymorphism (PCR-RFLP) method as
described by Kim et al (2005a). Primer sets (forward: 5′-ATTTCGTC
TAGACCTGTCCG-3′, reverse: 5′-TGAATCTGTTCTACCACCGC-3′) were
used for PCR detection. The PCR reaction was performed in reaction mix
(total volume 25 µL) containing 25 ng of genomic DNA, 12.5 µL of GoTaq®
Green Master Mix (Promega Corp., Madison, WI, USA), and 0.25 µmol of
each PCR primer. The PCR conditions were as follows: denaturation at
94°C for 5 min, 35 cycles of amplification at 94°C for 30 s, 57°C for 30 s,
72°C for 30 s, and a final extension step at 72°C for 10 min. For the
PCR-RFLP assays, 10 µL of the PCR products was used for restriction
digestion with 10 U of Hpy8I (Fermentas Inc., Glen Burnie, MD, USA) in
1x digestion buffer added to a total volume of 14 µL (Figure 6).
3333----2222----3. 3. 3. 3. Statistical analysisStatistical analysisStatistical analysisStatistical analysis
We used the Minitab GLM procedure (Version 14.12.2; Minitab Inc.,
State College, PA, USA) in order to analyze the effect of genotype. The
following linear model was used to analyze the data:
Yijk = µ + Sexi + Generationj + Genotypek + βWeightijk + eijk,
where Yijk is the phenotypic value of each trait, µ is the overall mean
for each trait, Sexi is the effect of gender, Genotypej is the effect of PIK3C3
genotype, Generationk is the effect of generation, β is the regression
coefficient of the covariate weight measurement for each trait, Weightijk is
the covariate of the measurement weight, and eijk is the random residual

39
effect. BFT and EMA correlated with the measurement weight; therefore,
these traits were analyzed using the weight measurement as a covariate.
Additive and dominance effects of the PIK3C3 alleles were estimated
using Minitab using the REG procedure. The additive effect of the alleles
was defined as −1, 0, and 1 for homozygous (T/T, C/C) and heterozygous
(T/C) genotypes. The dominant model was defined as −1, 1, and 1 for T/T
and T/C/C/C, whereas the recessive model was defined as 1, 1, and −1.
In order to investigate whether it was available for estimating
breeding value considering the PIK3C3 genotype in the mathematical
model, we compared the Akaike’s information criterion (AIC) of the each
model. AIC was defined as −2 log (maximum likelihood) +2 (number of
independently adjusted parameters within the model) (Akaike, 1974,
1987), and the model with the minimum AIC value was considered the
suitable model. AIC was obtained using GenStat (Version 8.1.0.152; VSN
International Ltd., Hempstead, UK) using the restricted maximum
likelihood (REML) method (Patterson & Thompson, 1971).
The mathematical model used for the analysis was as follows:
Model A (containing the genotype model)
Yijk = µ + Sexi + Generationj + Genotypek + βWeightijk + Sirel (Daml) + eijk
Model B (Null model)
Yijk = µ + Sexi + Generationk + βWeightijk + Sirel (Daml)+ eijk,
where Yijk is the phenotypic value of each trait, µ is the overall mean
for each trait, Sexi is the effect of gender, Genotypej is the effect of the

40
PIK3C3 genotype, Generationk is the effect of generation, β is the
regression coefficient of the covariate weight for each trait, Weightijk is the
covariate of the weight measurement, Sirel (Daml) is the random effect of
the lth sire or dam, and eijk is the random effect of residual error. In a
population bred using the closed nucleus breeding system, the effect of
sire should be considered when examining the effect of genotype on traits.
Therefore, we used the effect of sire as a random effect in the REML model.
The dam model was used instead of the sire model for calculating IMF
because the variance component estimated by REML using the sire model
did not converge. The heritability of each trait was calculated
simultaneously with the variance component estimated by model A.
3333----3. 3. 3. 3. RRRResultsesultsesultsesults
3333----3333----1.1.1.1. PIK3C3 PIK3C3 PIK3C3 PIK3C3 gene gene gene gene alleleallelealleleallele frequencies frequencies frequencies frequencies
The allelic and genotypic frequencies for the T and C PIK3C3 gene
polymorphisms are presented in Table 8. The T and C allele frequencies
were 32.1% and 67.9%, and the T/T, C/T, and C/C allele frequencies were
7.4%, 49.3%, and 43.3%, respectively. Kim et al. (2005b) reported that the
C allele frequency was 72.5% in 20 Duroc pigs, and there was no difference
between their results and those obtained in this study (χ2 = 0.374, df = 1, p
= 0.541). Although there was no significant difference in genotype
distribution between genders (χ2 = 0.967, df = 4, p = 0.915), the C/C
genotype frequency increased through the generations, and there was a
significant difference between each generation (χ2 = 26.841, df = 4, p <
0.001). Particularly, the frequencies of C/C genotype (54.8%) and C allele
(75.2%) at fourth generation significantly increased from second

41
generation (C/C genotype ; 43.3%, C allele ; 67.9%).
3333----3333----2. 2. 2. 2. Association of genotypes with economic traits Association of genotypes with economic traits Association of genotypes with economic traits Association of genotypes with economic traits
Table 9 shows the phenotypic values of the measured traits for the
PIK3C3 genotypes. Pigs with the C/C genotype exhibited larger ADG, BFT,
and IMF than those with the T/T and C/T genotypes in each gender (Table
9). Pigs with the C/C genotype exhibited lower EMA than those with the
T/T and C/T genotypes in each gender (Table 9).
The PIK3C3 genotype was significantly associated with ADG (P =
0.002), BFT (p < 0.001), EMA (p < 0.001), and IMF content (p = 0.049). The
homozygous C/C pigs had a significantly higher mean DG (1018 ± 6 g/day)
than the pigs with T/T (977 ± 12 g/day, p = 0.0047) and C/T genotypes
(1000 ± 5 g/day, p = 0.0263). Pigs with the C/C genotype had a significantly
higher mean BFT (1.72 ± 0.02 cm) than those with the T/T (1.57 ± 0.04 cm,
p = 0.0013) and C/T genotypes (1.64 ± 0.02 cm, p = 0.0014). Pigs with the
C/C genotype had a significantly lower mean EMA (36.8 ± 0.2 cm2) than
those with the T/T genotype (37.8 ± 0.5 cm2, p = 0.0162). Pigs with the T/T
genotype had a significantly lower mean IMF (3.88 ± 0.32%) than those
with the C/C (4.71 ± 0.12%, p = 0.0103) and C/T genotypes (4.70 ± 0.13%, p
= 0.0086). These results suggest that the C allele have increasing effects
on ADG, BFT, and IMF in the period prior to 90 kg body weight in Duroc
pigs.
3333----3333----3333. . . . Comparison of statistical model fitnessComparison of statistical model fitnessComparison of statistical model fitnessComparison of statistical model fitness
Table 10 showed the AIC values of each trait estimated by the two
different models. The AIC values in the model A that estimated by

42
applying the PIK3C3 genotype for production traits (ADG, BFT, EMA, and
IMF) were smaller than those in model B that estimated by not including
the PIK3C3 genotype.
Table 11 shows the Wald test results for fixed effects in the REML
variance components analysis using model A.
The PIK3C3 gene genotype had a highly significant effect on BF (p =
0.004), EMA (p < 0.001), and IMF (p = 0.045). Although the effect of the
PIK3C3 genotypic did not reach statistical significance for DG, the P value
was marginally significant (p = 0.051).
The estimated heritability of each trait by the sire model (four times
the sire component variance ratio) ranged from 0.265 to 0.541.
3333----4. 4. 4. 4. DDDDiscussioniscussioniscussioniscussion
The Duroc population used in this study was a line established to
improve economic traits such as average ADG, BFT, and IMF content
using a closed nucleus breeding system for four generations. At the fourth
generation, the ADG, BFT, and IMF breeding values increased 41 g/day,
0.19 cm, and 0.30%, respectively, compared with those at the second
generation.
Although we did not consider the PIK3C3 genotype for animal
selection, the C allele frequency significantly increased through three
generations (Table 8). This result suggests that the C allele is enriched by
the phenotype-based approach to genetic improvement for fat deposition
and growth traits.
It is usually used the BLUP method to predict individual’s breeding
values for improving quantitative traits such as ADG and BFT in the

43
livestock. Selecting an appropriately fixed and random effect is very
important before adopting the BLUP method in order to evaluate genetic
value more correctly (Fukawa et al., 2001). Wada and Kashiwagi (1990)
suggested that the AIC value is a useful indicator for choosing a model to
calculate breeding values by BLUP method. In this study, AIC values of
the model that in including the PIK3C3 genotypes were smaller than
those estimated without considering the PIK3C3 genotype in each trait.
Accordingly, our results indicate that the PIK3C3 genotype can influence
the model fitness and that it is worth considering the PIK3C3 genotype to
construct a more appropriate model for genetic evaluation.
Association analysis showed that the PIK3C3 gene polymorphism
had significant effects on multiple production traits in our Duroc
population. Pigs with the C/C genotype had higher ADG, BFT, and IMF
and less EMA than those with the T/T genotype. In this study, there were
gender related differences for PIK3C3 effect on all traits in case of
analyzing by each sex. For example, a significant effect for PIK3C3
genotypes on ADG was detected on gilts in this study, whereas the
PIK3C3 effect did not reach significance in boars and barrows. As
described in Chapter 3, some genes that show gender variations in gene
expression or genotype effect have been previously reported (de Oliveira
Peixoto et al. 2006; Rodríguez et al. 2001). Therefore, the levels of effect
caused by PIK3C3 genotypes on traits might be difference in gender.
However, the ranks of least square mean values for each PIK3C3
genotype in each trait were conformed at all sex in the present study. Pigs
with the C/C genotype had a higher mean values for ADG, BFT, IMF and
lower mean value for EMA than those with the T/T and C/T genotypes in

44
all sex. These results suggest that PIK3C3 might play an important role
in both fat deposition and muscle development in pigs.
However, as the C2604T SNP in PIK3C3 is a synonymous
substitution, it must be considered whether this point mutation directly
leads to such differences in multiple traits or is a result of linkage
disequilibrium with other mutations.
QTL related to fatness and meat quality traits, such as
intramuscular fat content (IMF) (de Koning et al., 1999; de Koning et al.,
2000; Gerbens et al., 1999, 2000; Grindflek et al., 2001; Lee et al., 2012;
Ovilo et al., 2000; Uleberg et al., 2005), and backfat thickness (BFT) (Lee
et al., 2012; Malek et al., 2001; Ovilo et al. 2002; Szyda et al., 2003; Soma
et al., 2011) have been detected on SSC6. In particular, Ovilo et al. (2002)
detected a significant backfat related QTL at the area, which containing
S0228 maker whose place was identified nearby PIK3C3 gene (Kim et al.
2005a). In addition, QTL related productivity traits, such as average
daily weight gain (ADG)(Sato et al., 2003) and the size of eye muscle area
(EMA)(Edwards et al., 2008a, b) have also been identified on SSC6.
Thus, additional DNA sequence analysis is required to unravel all
possible nucleotide polymorphisms on and around the porcine PIK3C3
locus and to survey linkage disequilibrium blocks on SSC6 at this region.
The effects of PIK3C3 genotype on production traits detected in an
experimental cross of Korean native breeds and Landrace breeds (Kim et
al. 2005) and those in Duroc breeds of this study showed same result,
which suggest that the SNP C2604T on exon 24 in PIK3C3 might be
linkage disequilibrium with functional mutation. Therefore, although
C2604T is silent mutation and can not influence directly on the traits, it

45
has potential as a genetic marker for implicating in pig breeding
program.
As only this study and Kim et al. (2005) indicated that the
relationship between PIK3C3 and pig production traits, this RFLP
mutation may be linkage equilibrium with the functional mutation in
population-wide until now. Therefore, the effect of allele might be depend
on other population, it needs to preliminary research the correlation
between marker and the traits before incorporating into breeding
program.

Exon24
Exon23
Exon1
Exon2
Exon25
15bp
6777bp
126bp
5053bp
91bp
5’UTR
c.2604C>T
189bp
68bp
72bp
3530bp
Figure 5
Figure 5
Figure 5
Figure 5. The position of mutation for genotyping PIK3C3gene in this study. The protein coding
sequences and untranslatedregion are indicated by dark-stained boxes and grey-stained box,
respectively. The numbers of base sequence were taken from the reference NC_010448 (Sus
scrofa 10.2; g.117947967..g.118097705, chromosom
e 6) sequence. The mutation in exon region
was identified based on Genbankaccession no. NM_001012956.2. Arrow
show
s the position of
c2604C>T mutation.
46

Figure 6Figure 6Figure 6Figure 6. Genotyped patterns of polymorphism at c.2604C>T mutation of porcine PIK3C3 gene digested by restriction enzym Hpy8I on a 3.0% agarose gel. The genotypes indicate under lanes of the gel. Allele C produced 67- and 35-bp fragments, and allele T produced a 102-bp fragment. The heterozygote has both allele C and allele T fragments. The M is a 100-bp DNA Ladder molecular size mark (Fermentas Inc., Glen Burnie, MD, USA).
C/C C/C C/T C/T C/T T/T T/T M
100
200
300
bp
47
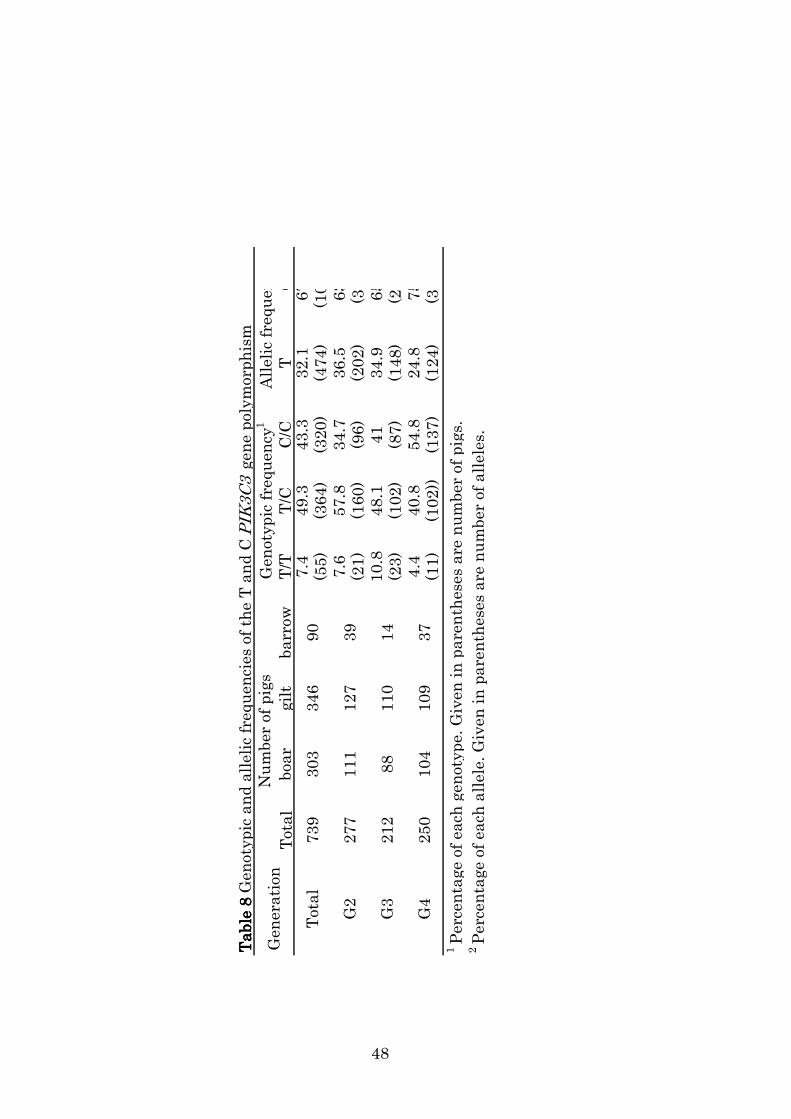
Table 8
Table 8
Table 8
Table 8 Genotypic and allelic frequencies of the T and C PIK
3C3 gene polymorphism
Total
boar
gilt
barrow
T/T
T/C
C/C
TC
7.4
49.3
43.3
32.1
67.9
(55)
(364)
(320)
(474)
(1004)
7.6
57.8
34.7
36.5
63.5
(21)
(160)
(96)
(202)
(352)
10.8
48.1
41
34.9
65.1
(23)
(102)
(87)
(148)
(276)
4.4
40.8
54.8
24.8
75.2
(11)
(102))
(137)
(124)
(376)
1 Percentage of each genotype. Given in parentheses are number of pigs.
2 Percentage of each allele. Given in parentheses are number of alleles.
739
303
346
Generation
Number of pigs
Total
110
Genotypic frequency
1Allelic frequency
90
39
G2
277
111
127
48
14
G4
250
104
109
37
G3
212
88
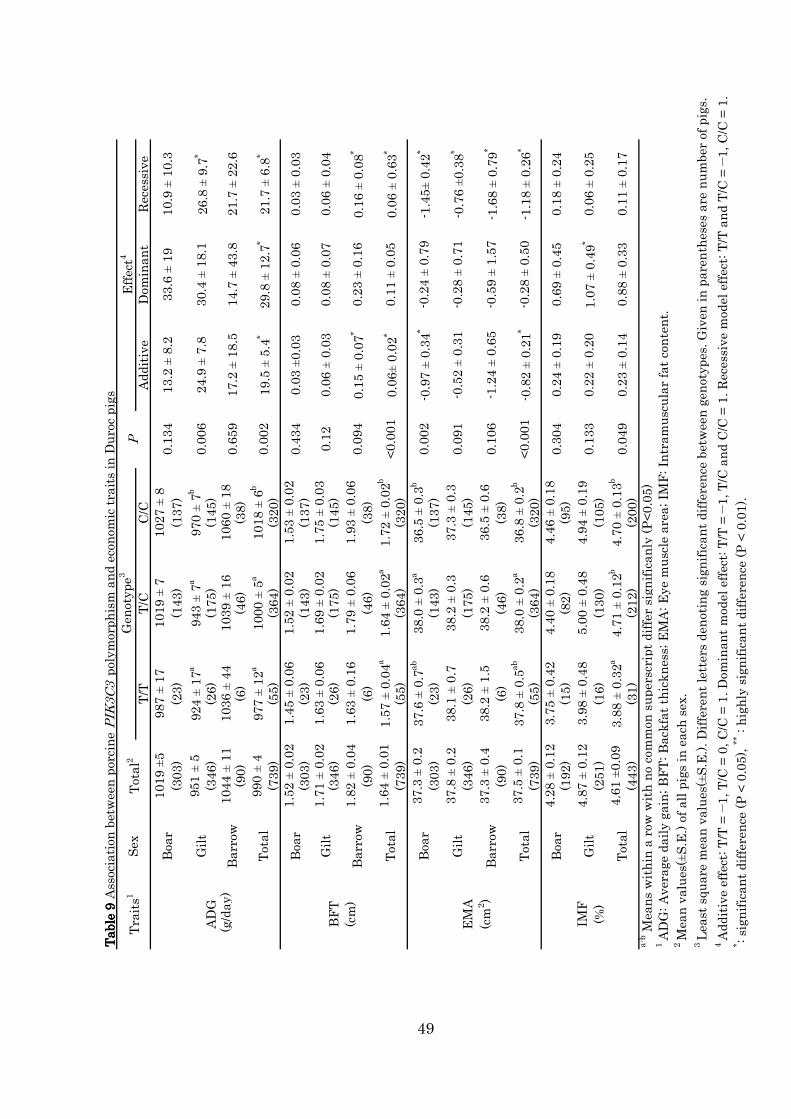
Table 9
Table 9
Table 9
Table 9 Association between porcine PIK3C3 polymorphism and economic traits in Duroc pigs
T/T
T/C
C/C
Additive
Dominant
Recessive
1019 ±5
987 ± 17
1019 ± 7
1027 ± 8
(303)
(23)
(143)
(137)
951 ± 5
924 ± 17a
943 ± 7a
970 ± 7b
ADG
(346)
(26)
(175)
(145)
(g/day)
1044 ± 11
1036 ± 44
1039 ± 16
1060 ± 18
(90)
(6)
(46)
(38)
990 ± 4
977 ± 12a
1000 ± 5a
1018 ± 6b
(739)
(55)
(364)
(320)
1.52 ± 0.02
1.45 ± 0.06
1.52 ± 0.02
1.53 ± 0.02
(303)
(23)
(143)
(137)
1.71 ± 0.02
1.63 ± 0.06
1.69 ± 0.02
1.75 ± 0.03
BFT
(346)
(26)
(175)
(145)
(cm)
1.82 ± 0.04
1.63 ± 0.16
1.79 ± 0.06
1.93 ± 0.06
(90)
(6)
(46)
(38)
1.64 ± 0.01
1.57 ± 0.04a
1.64 ± 0.02a
1.72 ± 0.02b
(739)
(55)
(364)
(320)
37.3 ± 0.2
37.6 ± 0.7ab
38.0 ± 0.3a
36.5 ± 0.3b
(303)
(23)
(143)
(137)
37.8 ± 0.2
38.1 ± 0.7
38.2 ± 0.3
37.3 ± 0.3
EMA
(346)
(26)
(175)
(145)
(cm2)
37.3 ± 0.4
38.2 ± 1.5
38.2 ± 0.6
36.5 ± 0.6
(90)
(6)
(46)
(38)
37.5 ± 0.1
37.8 ± 0.5ab
38.0 ± 0.2a
36.8 ± 0.2b
(739)
(55)
(364)
(320)
4.28 ± 0.12
3.75 ± 0.42
4.40 ± 0.18
4.46 ± 0.18
(192)
(15)
(82)
(95)
IMF
4.87 ± 0.12
3.98 ± 0.48
5.00 ± 0.48
4.94 ± 0.19
(%)
(251)
(16)
(130)
(105)
4.61 ±0.09
3.88 ± 0.32a
4.71 ± 0.12b
4.70 ± 0.13b
(443)
(31)
(212)
(200)
1 ADG: Average daily gain; BFT: Backfat thickness; EMA: Eye muscle area; IMF: Intramuscular fat content.
2 Mean values(±S.E.) of all pigs in each sex.
3 Least square mean values(±S.E.). Different letters denoting significant difference between genotypes. Given in parentheses are number of pigs.
4 Additive effect: T/T = −1, T/C = 0, C/C = 1. Dominant model effect: T/T = −1, T/C and C/C = 1. Recessive model effect: T/T and T/C = −1, C/C = 1.
* : significant difference (P < 0.05), ** : highly significant difference (P < 0.01).
49
Gilt
0.133
0.22 ± 0.20
Total
0.049
0.23 ± 0.14
0.24 ± 0.19
13.2 ± 8.2
a-b Means within a row with no common superscript differ significanly (P<0.05)
Boar
0.304
1.07 ± 0.49*
-1.18 ± 0.26*
0.18 ± 0.24
Total
<0.001
-0.82 ± 0.21*
-0.28 ± 0.50
0.88 ± 0.33
0.11 ± 0.17
-0.28 ± 0.71
0.06 ± 0.25
0.69 ± 0.45
-0.76 ±0.38*
-1.68 ± 0.79*
Barrow
0.106
-1.24 ± 0.65
-0.59 ± 1.57
Gilt
0.091
-0.52 ± 0.31
0.06 ± 0.63*
Boar
0.002
-0.97 ± 0.34*
-0.24 ± 0.79
-1.45± 0.42*
Total
<0.001
0.06± 0.02*
0.11 ± 0.05
0.06 ± 0.04
0.16 ± 0.08*
Barrow
0.094
0.15 ± 0.07*
0.23 ± 0.16
Gilt
0.12
0.06 ± 0.03
0.08 ± 0.07
21.7 ± 6.8*
Boar
0.434
0.03 ±0.03
0.08 ± 0.06
0.03 ± 0.03
Total
0.002
19.5 ± 5.4*
29.8 ± 12.7*
21.7 ± 22.6
Gilt
0.006
24.9 ± 7.8
30.4 ± 18.1
Barrow
0.659
17.2 ± 18.5
26.8 ± 9.7*
14.7 ± 43.8
Traits1
Sex
Total2
Genotype3
PEffect4
Boar
0.134
33.6 ± 19
10.9 ± 10.3

Table 10
Table 10
Table 10
Table 10 Com
parison of Akaike’s Information Criterion values obtained two alternative models for each trait
ADG
BFT
EMA
IMF
Model A
18769
2431
4034
1844
Model B
28788
2437
4047
1848
1 Model A :
Fixed effects : Generation, sex, and genotype of PIK3C3
Random
effect : Sire (except for IM
F), Dam (for IM
F)
Covariate : End test weight (BFT and EMA)
2 Model B :
Fixed effects : Generation and sex
Random
effect : Sire (except for IM
F), Dam(for IMF)
Covariate : End test weight (BFT and EMA)
Traits
50
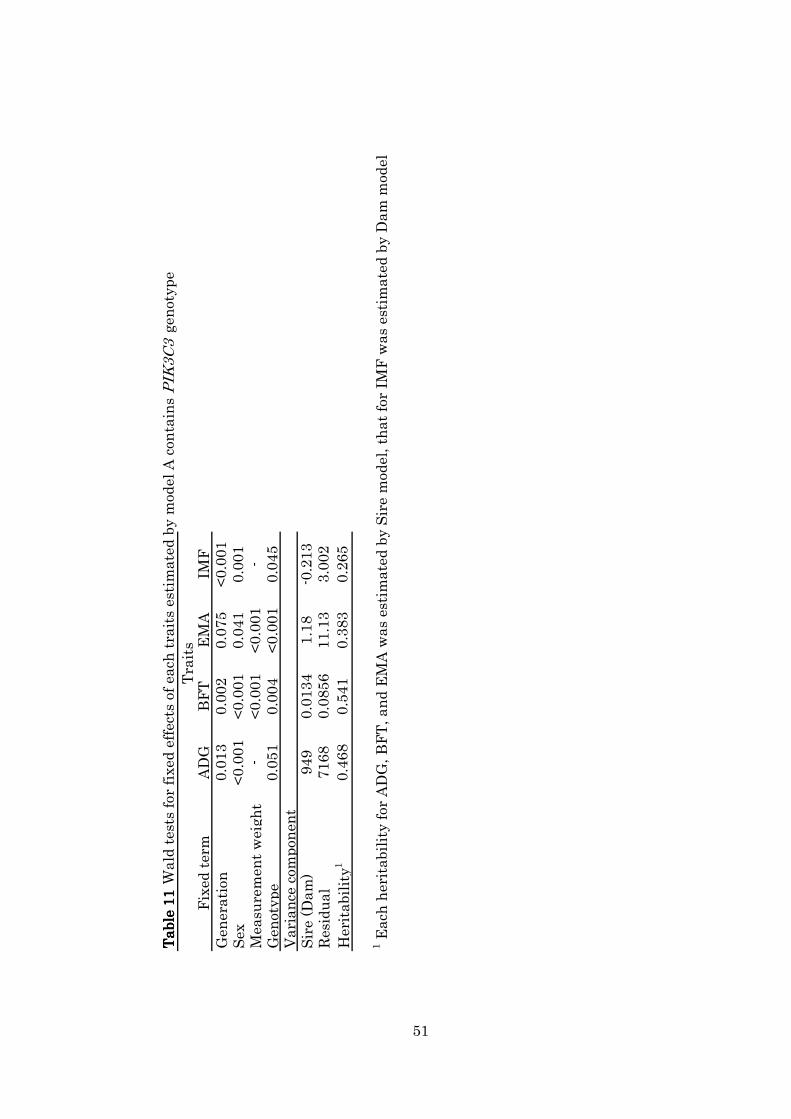
Table 11
Table 11
Table 11
Table 11 Wald tests for fixed effects of each traits estimated by model A contains PIK3C3 genotype
Fixed term
ADG
BFT
EMA
IMF
Generation
0.013
0.002
0.075
<0.001
Sex
<0.001
<0.001
0.041
0.001
Measurement weight
-<0.001
<0.001
-Genotype
0.051
0.004
<0.001
0.045
Sire (Dam)
949
0.0134
1.18
-0.213
Residual
7168
0.0856
11.13
3.002
Heritability1
0.468
0.541
0.383
0.265
1 Each heritability for ADG, BFT, and EMA was estimated by Sire model, that for IMF was estimated by Dam model
Traits
Variance component
51

52
CHAPTER 4.CHAPTER 4.CHAPTER 4.CHAPTER 4. Association of Association of Association of Association of porcineporcineporcineporcine vertnin ( vertnin ( vertnin ( vertnin (VRTNVRTNVRTNVRTN) gene with production ) gene with production ) gene with production ) gene with production
traits in Duroc pigstraits in Duroc pigstraits in Duroc pigstraits in Duroc pigs
4444----1. 1. 1. 1. IIIIntroductionntroductionntroductionntroduction
The national improvement goal of sire line in Japan has been based
on Japanese carcass grading regulations. For example, the national
improvement goal of backfat thickness of carcass was configured at 2.0cm,
because the backfat thickness at the prime grade was defined the range
within 1.3 cm above and 2.4 cm bellow. At the same time, the carcass
length that correlates with backfat thickness have been also improved to
be assumed a fixed form. These improvement goals was set to be high
quality and uniformly sized of domestic pork carcass.
The total number of thoracic and lumbar vertebrae varies among
pigs. Wild boars have 19 vertebrae, whereas European commercial breeds
have 21–23 vertebrae. The number of vertebrae is correlated with carcass
length, back rib contents, loin meat contents and backfat thickness. In
case of pig shipment in same weight, it is possible that changing carcass
length by the number of vertebrae might lead change the size of loin eye
muscle area.
Recently, the needs for carcass traits are not constant, for example,
some farmer desired the pig that can produce rich lean meat rate and well
productivity, and other farmer desired the pig that can produce high meat
quality, unless have less productivity. For responding the request of
customers, pig breeding companies have been supplied the boars and sows
by selecting body style, however, it is not correctly reflected the genetic
talent by only body style-based selection. For evaluation of genetic talents

53
such as fat deposition traits or carcass length, it is prefer to add the
individual’s the vertebral number data, however, measuring it at living
individuals are very cumbersome and complicated.
A quantitative trait locus (QTL) affecting vertebral number was
initially detected on Sus scrofa chromosome 1 (SSC1) in an experimental
F2 family crossing of a Göttingen miniature male pig and two Meishan
female pigs (Wada et al., 2000). A second QTL was identified in another F2
family resulting from a cross between Asian and European breeds, where
the F2 family had both SSC7 and SSC1 QTLs (Mikawa et al., 2005). A gene
encoding an orphan nuclear receptor (NR6A1) was identified as being
responsible for the SSC1 locus (Mikawa et al. 2007). However, genetic
variation in NR6A1 was not detected in European commercial breed pigs
until recently, when Mikawa et al. (2011) detected a 41-kb conserved
region associated with the vertebrae number-increase allele (Q) of the
SSC7 QTL in European commercial breed pigs. A gene encoding a
hypothetical protein responsible for controlling the vertebral number was
found in that region and was named vertnin (VRTN). VRTN has two exons
(Figure 7), and there are three haplotypes of European VRTN consist of
two major alleles [Q and wild-type allele, (Wt)] and one minor wild-type
allele (Wt') that has been detected only in one landrace population. There
are only nine candidate polymorphism sites, which makes genotyping of
porcine VRTN feasible. VRTN has an additive effect on the vertebral
number. The average vertebral numbers in the Wt/Wt, Wt/Q, and Q/Q
genotypes in commercial meat pigs are 20.63, 21.18, and 21.65,
respectively (Mikawa et al., 2011). The vertebral number in pigs is
generally associated with body size, which may affect meat productivity
54
and reproductive performance. The length of the loin muscle is negatively
correlated with the loin eye muscle area (EMA) and backfat thickness (BF)
(Bereskin & Steele., 1988; Hicks et al., 1998; Stewart & Schinckel., 1989).
Therefore, variations in VRTN may affect phenotypic traits, such as the
growth rate, fat deposition, and body composition. However, correlations
between the VRTN genotype and economic traits have yet to be
investigated.
In this study, we determined the relationship between the VRTN
genotype and economic and body composition traits in a Duroc population
improved by a closed nucleus breeding system.
4444----2. 2. 2. 2. MMMMaterials and Methodsaterials and Methodsaterials and Methodsaterials and Methods
4444----2222----1. 1. 1. 1. Animals and data collectionAnimals and data collectionAnimals and data collectionAnimals and data collection
The Duroc pig population used in this study was kept at the Central
Research Institute for Feed and Livestock ZEN-NOH (Hokkaido, Japan)
by following the Institute’s guidelines for animal management. The details
of data collection methods, selection criteria, and selection methods of this
strain were described in Chapter 1.
In this part, we analyzed the phenotypic production traits (ADG,
BFT, EMA, IMF) that were collected from 1414 Duroc pigs through four
generations, from the second to fifth generation. Furthermore, we
measured four body composition traits at the same time when measuring
previous four production traits.
Body length (BL) was measured as the length from the root of the
tail to the root of the ears. Body height (BH) was measured at wither
height. Chest circumference (CC) was measured around the chest, while
55
the circumference of the foreleg cannon bone (CF) was measured around
the cannon bone of the left front leg.
4444----2222----2. 2. 2. 2. GenotypingGenotypingGenotypingGenotyping
Genomic DNA was extracted from tail tissue clippings of each pig
using the DNeasy Blood and Tissue Kit (Qiagen, Inc., Hilden, Germany) or
the QuickGene DNA Tissue Kit (Fujifilm, Inc., Tokyo, Japan). All animals
were genotyped for the previously identified haplotypes NV107
(g.24801_24802insAA), NV123 (g.20311_20312 ins291, which means
insertion of a 291 nucleotide sequence between g.20311 and g.20312), and
NV149 (g.11051A>T) (Mikawa et al., 2011) by PCR amplification along
with sequence-specific primers. Primer sets were designed based on the
AB554652 sequence, as shown in Table 12. The PCR reaction was
performed using a reaction mix (15 µL total volume) containing 25 ng of
genomic DNA, 7.5 µL of AmpliTaq Gold®360 Master Mix (Applied
Biosystems, Foster City, CA, USA), and 0.15–0.3 µmol/L of each PCR
primer. The PCR conditions were as follows: denaturation at 94°C for 9
min, 35 cycles of amplification at 94°C for 30 s, 57°C for 30 s, 72°C for 30 s,
and a final extension step at 72°C for 10 min (Figure 8).
4444----2222----3. 3. 3. 3. Statistical analysisStatistical analysisStatistical analysisStatistical analysis
Associations between the VRTN genotype and traits were evaluated
using the least squares method of the Minitab general linear model
(Version 14.12.2; Minitab Inc., State College, PA, USA). The following
linear model was used to analyze the data:
56
Model A
Yijkl = µ + Sexi + Genotypej + Generationk+ Groupl + βWeightijkl +
eijkl
where,Yijkl is the phenotypic value of each trait, µ is the overall mean
for each trait, Sexi is the effect of gender, Genotypej is the effect of the
VRTN genotype, Generationk is the effect of generation, Groupl is the
effect of group, β is the regression coefficient of the covariate weight
measurement for each trait, Weightijkl is the covariate of the measurement
weight, and eijkl is the random residual effect. BFT and EMA were
correlated with the measurement weight, and therefore these traits were
analyzed using weight measurement as a covariate.
The BV predicted using a previous multiple-animal model (BLUP)
for the trait was analyzed statistically when there was a significant
association between the VRTN genotype and each trait. The BLUP model
used in this program included the additive effect of polygene as a random
effect, with gender, generation, and group as fixed effects, as well as the
covariates between measurement weight and each trait. ANOVA with
genotype as the independent variable and BV as the dependent variable
was used to analyze the association between the VRTN genotype and the
BV. This ANOVA analysis was executed only for BVs of traits that had
significant associations with the VRTN genotype.
Additive or dominant effects of VRTN were evaluated with the
Qxpak program (Perez-Enciso & Mitsztal., 2004) using the following
Model:
57
Model B
Yijkl = µ + Sexi + Genotypej + Generationk + Groupl + βWeightijkl +
uijkl + eijkl
where, Genotypej represents the single locus of the VRTN genotypic
effect, which is partitioned into additive (a) and dominance (d) effects. We
conducted this analysis for the additive and dominance effects (a + d) and
for only additive effects (a). uijkl is the infinitesimal genetic effect of ijkl
animals, which is distributed as N (0, Aσu2) (A is the numerator
relationship matrix). Pedigrees of the base population of animals were
traced back for the first generation in this population to produce the
numerator relationship matrix. Thus, total 1,744 animals were used in
this analysis, including animals that had not been genotyped. Likelihood
ratio tests were performed by removing the VRTN genotypic effects from
the model, while nominal P values were obtained by assuming a
chi-squared distribution for the likelihood ratio test. The proportion of
additive genetic variance accounted for by the genotypic effect of VRTN
gene was calculated as:
variance percentage = [2pq(a + d(p-q))2]/VA
where p and q were allelic frequencies for allele Wt and allele Q,
respectively, and VA was the additive genetic variance of the trait obtained
from animal model analysis ignoring VRTN genetic effects (Falconer.,
1989) .
58
We compared Akaike’s information criterion (AIC) values of the
mathematical model for the full Model A and the model where the VRTN
genotypic effect was removed from Model A in order to evaluate the more
suitable model. In this study, we calculated AIC value by using GenStat
software (Version 8.1.0.152; VSN International Ltd., Hempstead, UK)
with the restricted maximum likelihood (REML) method (Patterson &
Thompson., 1971).
4444----3. 3. 3. 3. ResultsResultsResultsResults
4444----3333----1111....VRTNVRTNVRTNVRTN allele frequencies allele frequencies allele frequencies allele frequencies
Table 13 shows the allelic and genotypic frequencies for the Wt and
Q VRTN polymorphisms. The allelic and genotypic frequencies of VRTN
changed from the second generation to the fifth, while the Wt allele and
the Wt/Wt genotype increased significantly according to Pearson’s
chi-square test (χ2 = 6.163, df = 1, p = 0.013; χ2 = 7.962, df = 2, p = 0.019,
respectively).
5555----3333----2. 2. 2. 2. Association of Association of Association of Association of VRTNVRTNVRTNVRTN genotype and economic traitsgenotype and economic traitsgenotype and economic traitsgenotype and economic traits
Table 14 shows the phenotypic values of the measured traits for each
VRTN genotype. The VRTN genotype was significantly associated with
the IMF content (p = 0.003). Pigs with the Wt/Wt genotype had a
significantly higher mean IMF (5.22 ± 0.16%) than those with the Q/Q
genotype (4.79 ± 0.13%, p = 0.013). This effect was observed only in boars
(Wt/Wt: 5.06 ± 0.19%, Q/Q: 4.38 ± 0.14%, p = 0.008), whereas the
differences in gilts were not statistically significant (Wt/Wt: 5.22 ± 0.18%,
Q/Q: 5.02 ± 0.12%, p = 0.543). There was no evidence of any effects of the

59
VRTN genotype on other traits such as ADG, BFT, or loin EMA.
We evaluated the association only between the BVIMF and VRTN
genotypes because there was a significant association only in the
phenotypic IMF value. There was a highly significant difference (p =
0.005) among VRTN genotypes with respect to the BVIMF. The BVIMF for
the Wt/Wt genotype was larger than that for the Q/Q genotype.
4444----3333----3. 3. 3. 3. Association of Association of Association of Association of VRTNVRTNVRTNVRTN genotype and body composition traitsgenotype and body composition traitsgenotype and body composition traitsgenotype and body composition traits
Table 15 shows the phenotypic values of the body composition traits
for each VRTN genotype. The VRTN genotype was significantly associated
with BL in boars, gilts, barrows, and the total population (p = 0.021, 0.015,
0.001, 0.001, respectively). Significant differences between the VRTN
genotype and other traits (e.g., BH and CC) were detected in some cases,
but in one gender only, while the differences were not statistically
significant at the overall population level.
4444----3333----4. 4. 4. 4. Additive and dominant effects of Additive and dominant effects of Additive and dominant effects of Additive and dominant effects of VRTNVRTNVRTNVRTN on each trait on each trait on each trait on each trait
Table 16 shows the additive and dominant effects of VRTN on
economic traits and body composition traits. The VRTN genotype did not
significantly affect IMF in the additive and dominance models (p = 0.117),
but it had a significant association in the additive model (p = 0.046). There
was a highly significant association of BL in both the additive and
dominance models (p < 0.001) and the additive model only (p < 0.001). For
CF, there was a significant association between the additive and
dominance models (p = 0.012) in all animals. However, for the traits,
which were related with VRTN genotype, the proportion of additive

60
genetic variance accounted for by VRTN genotypes were not high (Table
16).
4444----3333----5. 5. 5. 5. Comparison of the statistical model fitnessComparison of the statistical model fitnessComparison of the statistical model fitnessComparison of the statistical model fitness
The AIC values estimated when using the VRTN genotype for IMF
were smaller than those estimated when not using the VRTN genotype
(AIC = 1618.8 and 1624.5, respectively). The VRTN genotype had a highly
significant effect on IMF (p = 0.045) in the Wald test results using the
VRTN genotype as a fixed effect, in the REML variance components
analysis.
4444----4. 4. 4. 4. DDDDiscussioniscussioniscussioniscussion
This association analysis suggests that the porcine VRTN genotype
had an effect on the phenotypic value of IMF and BL in Duroc. Wt/Wt
pigs tend to have a higher IMF content and a shorter BL compared with
Q/Q pigs. In this study, we detected a significant effect on IMF in only
boar. Fat deposition in pig have gender bias, boars have generally less
backfat thickness and intramuscular fat content in the loin than gilt,
because some gene expression pattern during fat development is different
in sex. Therefore, VRTN might relate with such as gene that has sex
specific effect. The IMF breeding value was significantly greater in
Wt/Wt pigs compared with Q/Q pigs, because even though it did not reach
statistical significance, Wt/Wt gilts had greater IMF phenotypic value
than Q/Q gilts. Furthermore, the Wt allele frequency increased,
suggesting that it was probably synchronized with an increase in the
average breeding value for the IMF content through four generations
61
(from the second to the fifth). This also suggests that VRTN may affect
intramuscular fat deposition.
IMF is related to meat quality, and numerous taste panel studies
have demonstrated that IMF is positively associated with juiciness, flavor,
and tenderness (De Vol et al., 1988; Wood et al., 1988; Fernandez et al.,
1999; Lonergan et al., 2002). The present study suggests that VRTN could
be a useful genetic marker for improving meat quality in Duroc
population.
Stewart and Schinckel (1989) reported that the pig carcass length
was positively correlated with the total lean content and negatively
correlated with the BFT. The VRTN genotype affected the IMF, but it did
not significant affect the BFT in this study. Some studies have reported
that genes are involved in the regulation of fat deposition in muscle
without affecting fat deposition elsewhere. For example, the H-FABP
(Gerbens et al., 2000) and SREBF1 (Chen et al., 2008) genotypes are
associated with the IMF without affecting the BFT in pigs. The functional
effect of VRTN remains unclear, but our results indicate that VRTN may
be involved in the regulation of fat deposition in muscles.
There was a significant difference between the VRTN genotype and
the phenotypic value of CF. The circumference of the foreleg might be
influenced by various components such as the size of cannon bone or the
muscle content around cannon bone. It needs to further research in order
to clarify the relationship between the VRTN genotype and the
circumference of the foreleg.
Although the proportion of additive genetic variance for IMF
accounted for by VRTN genotypes were not high, the AIC value that
62
includes the VRTN genotype effect showed smaller than that without
considering the VRTN genotype effect. The model with the minimum AIC
value was considered the suitable model. This result suggests that it is
useful to consider the VRTN genotype in a mathematical model for
predicting more accurate breeding value of IMF in this Duroc population.
Several studies have detected QTLs related to IMF on SSC7, which is
the chromosomal locus where VRTN is located in crossbred populations.
Sato et al. (2003, 2006) detected a significant QTL affecting IMF on SSC7
in a Meishan × Duroc F2 resource population, while Bidanel et al. (1998)
also detected a significant QTL affecting IMF in a Meishan × Large White
crossbred pig population. However, the positions of these QTL do not
overlap with that of VRTN. Uemoto et al. (2008) detected no significant
QTLs for IMF on SSC7 in a pure Duroc population, while Sanchez et al.
(2007) detected no QTLs for IMF in a Duroc × Landrace cross population.
The difference between the current results and those of previous studies
may be attributable to the differences in the genetic background of the
populations used in the different investigations. We did not perform a QTL
analysis for this population, but we are now executing a genome-wide
association study for this Duroc population. In this ongoing analysis, we
have detected an area in SSC7 that have potential to correlate with IMF
(data not shown). The association between that area and the VRTN
genotype remains unclear, but the processing of this genome-wide
association study might detect a genetic mutation on SSC7 that is related
to IMF content.
The present results suggest that one VRTN allele might produce an
increase of 0.54 cm in terms of BL in a 90kg live weight animal. Mikawa
63
et al. (2011) reported that the Q allele of VRTN increased the vertebral
number with an additive effect of 0.51 in a meat-pig population. The
average length of each vertebra is generally about 3-4 cm in 90kg live
weight Duroc pigs; thus, the Q allele may increase the BL by
approximately 1.5-2.0 cm, which is very different from our result.
Therefore, the VRTN genotype may affect the length of each vertebra.
Moreover, BL in this study was defined by measuring the distance
between the base of the tail to the top of the head, which included
thoracic, lumbar, cervical, and sacral vertebrae. Therefore, the VRTN
genotype may simultaneously affect the lengths of cervical and sacral
vertebrae. Moreover, Uemoto et al. (2008) detected significant QTLs on
SSC7 that affected the thoracic vertebrae number or carcass length.
However, there were differences in the QTL genotypic heritability and
the residual polygenic heritability for each QTL. This suggests that
vertebral number is not always consistent with the body length. Further
investigations involving measurements of carcasses traits are needed to
confirm the relationship between the VRTN genotype, carcass length,
and vertebrae number. We performed analysis using only one Duroc
population. In future, other breeds and populations should be studied to
clarify the effects of VRTN on porcine productive traits, particularly fat
deposition.

g.24801_2
4802in
sAA
(NV107)
g.20311_2
0312 ins2
91
(NV123)
g.11051A>T
(NV149)
Exon
1(5’U
TR)
Exon
2 (3’U
TR)
Figure
7Figure
7Figure
7Figure
7. The pos
ition of muta
tion
for
gen
otypin
g V
RTN
gen
e in
this stu
dy. The pro
tein
cod
ing
sequen
ces and u
ntranslatedre
gions are
indicated by dark
-sta
ined
box
es and gre
y-sta
ined
box
, re
spec
tively. The number
s of base
seq
uen
ce in each
reg
ion wer
e ta
ken
fro
m the re
fere
nce
NC_0
10449 (Sus sc
rofa
10.2; g.10345706..g.103467076, ch
romos
ome 7 ) seq
uen
ce. The muta
tion
in
intron
reg
ion w
as iden
tified
base
d on G
enbankacces
sion
no. A
B554652.1. Arrow
s sh
ow the
pos
ition of g.11051A>T, g20311_2
0312in
s291, g.24801_2
4802in
sAA m
uta
tion
, re
spec
tively.
152bp
6419bp
1bp
2098bp
901bp
64
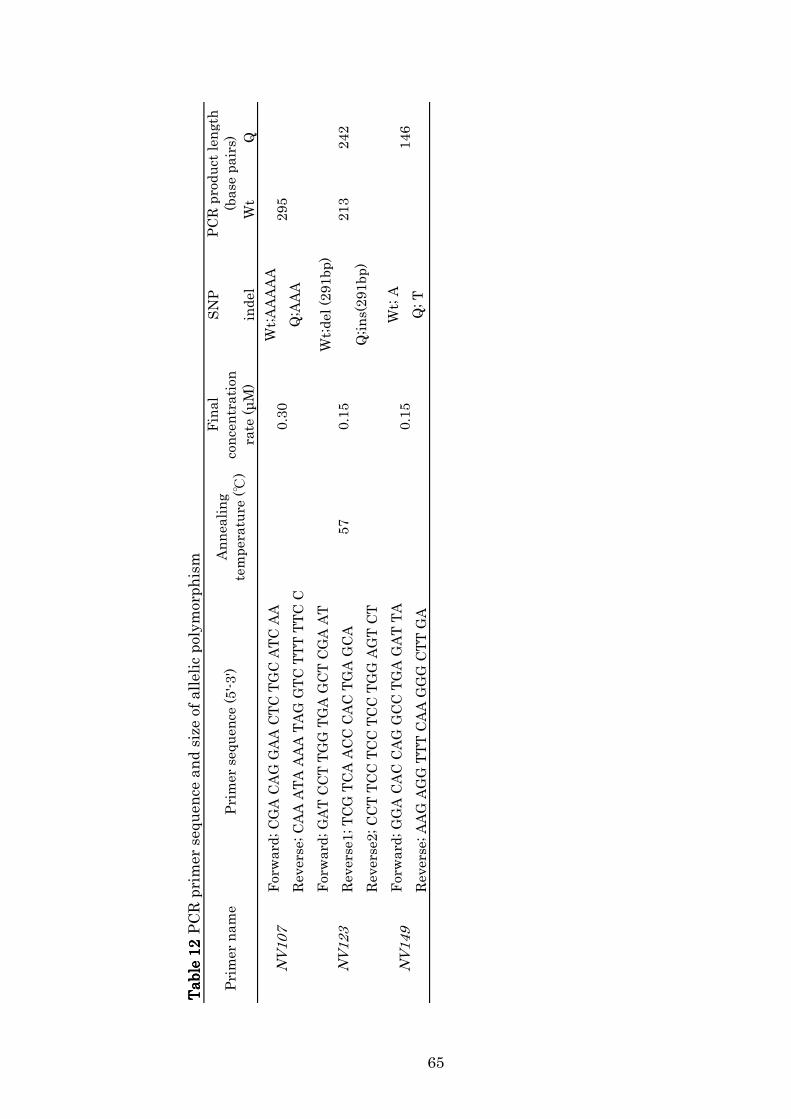
Table 12
Table 12
Table 12
Table 12 PCR primer sequence and size of allelic polymorphism
SNP
indel
Wt
Q
Forward; CGA CAG GAA CTC TGC ATC AA
Wt;AAAAA
Reverse; CAA ATA AAA TAG GTC TTT TTC C
Q;AAA
Forward; GAT CCT TGG TGA GCT CGA AT
Reverse1; TCG TCA ACC CAC TGA GCA
Reverse2; CCT TCC TCC TCC TGG AGT CT
Forward; GGA CAC CAG GCC TGA GAT TA
Wt; A
Reverse; AAG AGG TTT CAA GGG CTT GA
Q; T
NV149
0.15
Primer sequence (5'-3')
Final
concentration
rate (µM)
PCR product length
(base pairs)
Annealing
temperature (℃)
57
Wt;del (291bp)
Q;ins(291bp)
65
146
NV107
0.30
NV123
0.15
213
242
295
Primer name
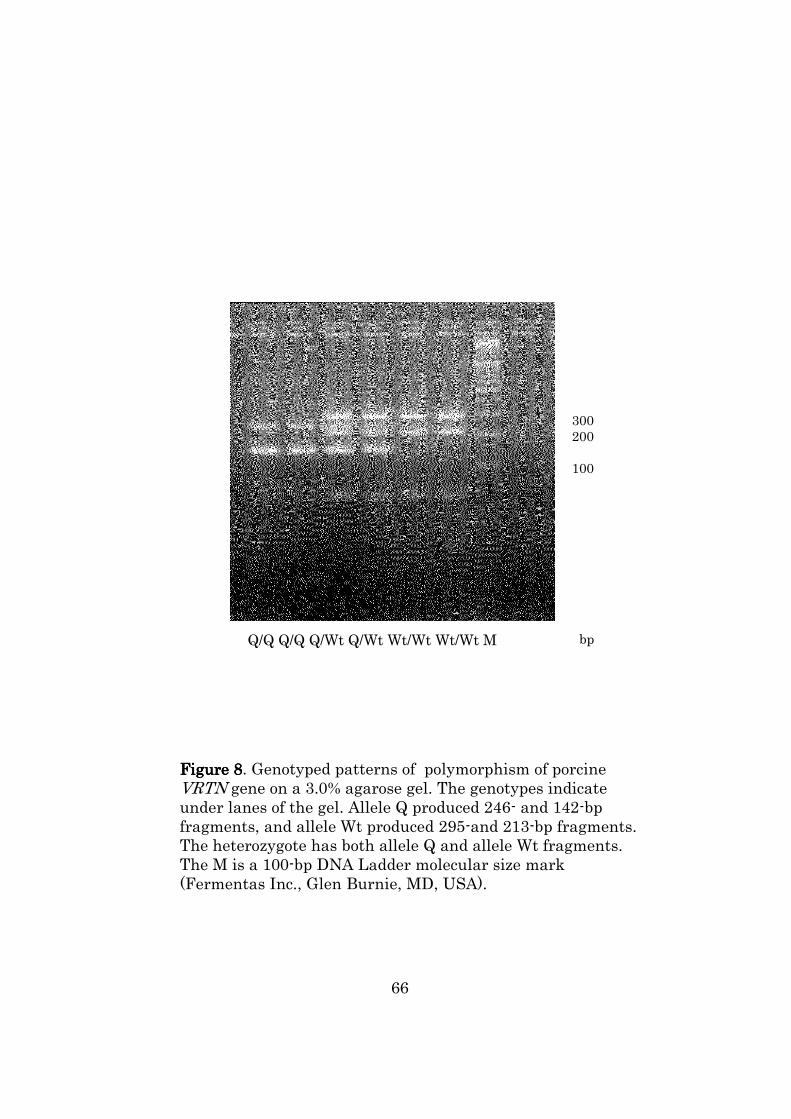
Q/Q Q/Q Q/Wt Q/Wt Wt/Wt Wt/Wt M
Figure 8Figure 8Figure 8Figure 8. Genotyped patterns of polymorphism of porcine VRTN gene on a 3.0% agarose gel. The genotypes indicate under lanes of the gel. Allele Q produced 246- and 142-bp fragments, and allele Wt produced 295-and 213-bp fragments. The heterozygote has both allele Q and allele Wt fragments. The M is a 100-bp DNA Ladder molecular size mark (Fermentas Inc., Glen Burnie, MD, USA).
300200
100
bp
66

Table13
Table13
Table13
Table13 Genotypic and allelic frequencies of the Wt and Q gene polymorphism
Total
boar
gilt
barrow
Wt/Wt
Wt/Q
Q/Q
Wt
Q14.9
51.1
34.0
40.4
59.6
(210)
(722)
(481)
(1142)
(1684)
12.7
46.6
40.6
36.0
64.0
(36)
(132)
(115)
(204)
(362)
16.6
47.4
36.0
40.3
59.7
(57)
(163)
(124)
(277)
(411)
13.9
54.9
31.1
41.4
58.6
(50)
(194)
(115)
(294)
(424)
15.9
53.7
30.4
42.8
57.2
(67)
(226)
(128)
(355)
(477)
1 Percentage of each genotype. Given in parentheses are number of pigs.
2 Percentage of each allele. Given in parentheses are number of alleles.
58
G5
421
190
173
49
G3
344
131
165
G4
366
154
163
630
Generation
Number of pigs
Genotypic frequency
1
1414
588
67
Allelic frequency
2
48
196
G2
283
113
129
41
Total

Table14Table14Table14Table14 Association between VRTN genotype and economic traits in Duroc pigs
W/W W/Q Q/Q
1017 ± 4 1008±10 1006±6 1012±7(588) (95) (300) (193)959 ± 4 951±9 960±6 955±7
ADG (630) (96) (321) (213) (g/day) 1035 ± 7 1068±23 1023±10 1034±12
(196) (20) (101) (75) 994 ± 3 1000±7 998±4 1000±5(1414) (211) (722) (481)
1.54 ± 0.01 1.51±0.03 1.52±0.02 1.52±0.02(588) (95) (300) (193)
1.77 ± 0.01 1.83±0.03 1.76±0.02 1.75±0.02BFT (630) (96) (321) (213)(cm) 1.90 ± 0.03 1.92±0.08 1.85±0.04 1.90±0.04
(196) (20) (101) (75)1.70 ± 0.01 1.75±0.02 1.72±0.01 1.72±0.02(1414) (210) (722) (481)
37.2 ± 0.2 37.4±0.4 37.5±0.2 37.1±0.3(587) (95) (300) (192)
37.4 ± 0.1 37.8±0.4 37.6±0.2 37.3±0.3EMA (628) (96) (321) (211)
(cm2) 37.1 ± 0.3 38.6±0.9 36.7±0.4 37.7±0.5(195) (20) (101) (74)
37.3 ± 0.1 37.7±0.3 37.4±0.2 37.3±0.2(1410) (210) (722) (481)
4.35 ± 0.07 5.06±0.19a 4.61±0.11ab 4.38±0.14b
(397) (61) (216) (120)IMF 4.88 ± 0.07 5.22±0.18 5.15±0.10 5.02±0.12(%) (486) (72) (252) (162)
4.60 ± 0.05 5.22±0.16a 4.99±0.12ab 4.79±0.13b
(883) (133) (468) (282)BVIMF Total 0.43 ± 0.98 0.54 ± 1.10b 0.48 ± 0.99 ab 0.32 ± 0.91a
(%) (1414) (211) (722) (481)
Gilt
Boar
Barrow 0.058
Total 0.317
3 Least square mean values(±S.E.). Different letters denoting significant differencebetween genotypes. Given in parentheses are number of pigs.
Total 0.013
0.005
a-b Means within a row with no common superscript differ significanly (P <0.05)
Total
0.543
1 ADG: Average daily gain; BFT: Backfat thickness; EMA: Eye muscle area; IMF:Intramuscular fat content; BVIMF: Breeding value of intramuscular fat content.2 Mean values(±S.E.) of all pigs in each sex.
Gilt 0.105
Boar 0.008
Total 0.326
0.823
0.523
Gilt 0.346
Barrow 0.545
Gilt 0.647
Barrow 0.171
P
Boar
68
0.941
Boar 0.926
Traits1 Sex Total2Genotype3
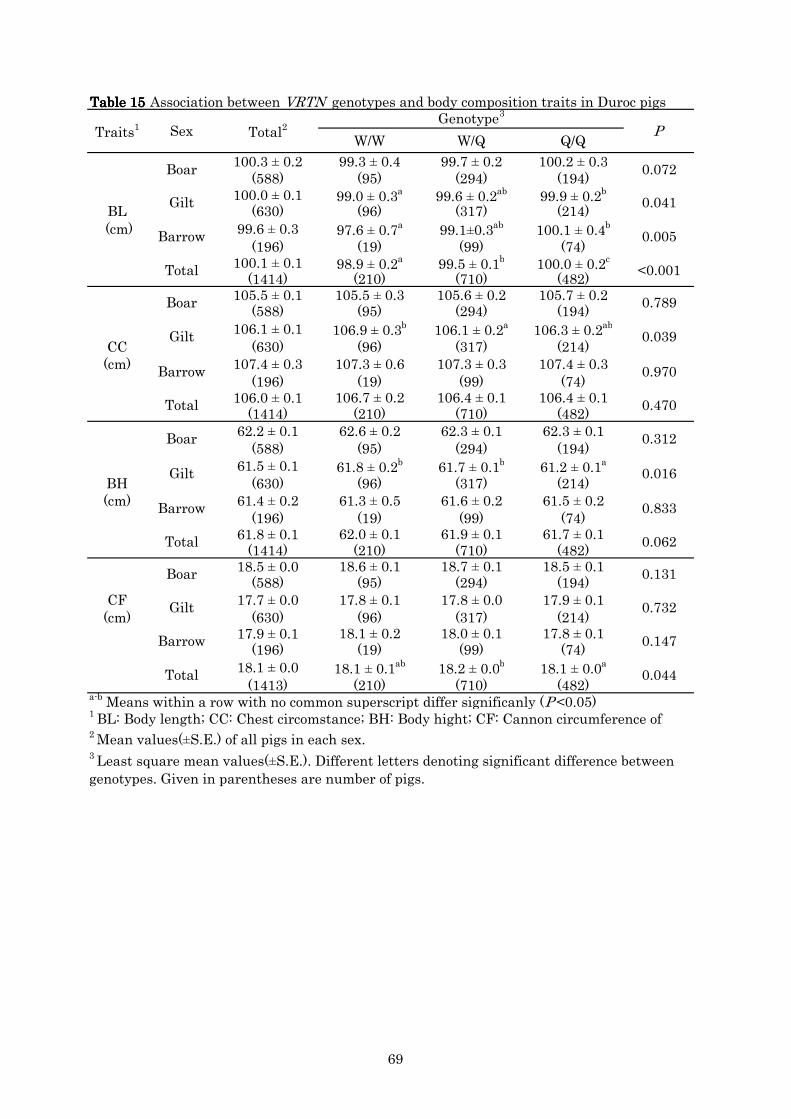
Table 15Table 15Table 15Table 15 Association between VRTN genotypes and body composition traits in Duroc pigs
W/W W/Q Q/Q
100.3 ± 0.2 99.3 ± 0.4 99.7 ± 0.2 100.2 ± 0.3(588) (95) (294) (194)
100.0 ± 0.1 99.0 ± 0.3a 99.6 ± 0.2ab 99.9 ± 0.2b
BL (630) (96) (317) (214) (cm) 99.6 ± 0.3 97.6 ± 0.7a 99.1±0.3ab 100.1 ± 0.4b
(196) (19) (99) (74)100.1 ± 0.1 98.9 ± 0.2a 99.5 ± 0.1b 100.0 ± 0.2c
(1414) (210) (710) (482)105.5 ± 0.1 105.5 ± 0.3 105.6 ± 0.2 105.7 ± 0.2
(588) (95) (294) (194)106.1 ± 0.1 106.9 ± 0.3b 106.1 ± 0.2a 106.3 ± 0.2ab
CC (630) (96) (317) (214)(cm) 107.4 ± 0.3 107.3 ± 0.6 107.3 ± 0.3 107.4 ± 0.3
(196) (19) (99) (74)106.0 ± 0.1 106.7 ± 0.2 106.4 ± 0.1 106.4 ± 0.1
(1414) (210) (710) (482)62.2 ± 0.1 62.6 ± 0.2 62.3 ± 0.1 62.3 ± 0.1
(588) (95) (294) (194)61.5 ± 0.1 61.8 ± 0.2b 61.7 ± 0.1b 61.2 ± 0.1a
BH (630) (96) (317) (214)(cm) 61.4 ± 0.2 61.3 ± 0.5 61.6 ± 0.2 61.5 ± 0.2
(196) (19) (99) (74)61.8 ± 0.1 62.0 ± 0.1 61.9 ± 0.1 61.7 ± 0.1
(1414) (210) (710) (482)18.5 ± 0.0 18.6 ± 0.1 18.7 ± 0.1 18.5 ± 0.1
(588) (95) (294) (194)CF 17.7 ± 0.0 17.8 ± 0.1 17.8 ± 0.0 17.9 ± 0.1
(cm) (630) (96) (317) (214)17.9 ± 0.1 18.1 ± 0.2 18.0 ± 0.1 17.8 ± 0.1
(196) (19) (99) (74)18.1 ± 0.0 18.1 ± 0.1ab 18.2 ± 0.0b 18.1 ± 0.0a
(1413) (210) (710) (482)
2 Mean values(±S.E.) of all pigs in each sex.3 Least square mean values(±S.E.). Different letters denoting significant difference betweengenotypes. Given in parentheses are number of pigs.
Total 0.044
1 BL: Body length; CC: Chest circomstance; BH: Body hight; CF: Cannon circumference of
0.062
Barrow 0.147
a-b Means within a row with no common superscript differ significanly (P <0.05)
Gilt 0.732
Boar 0.131
Total 0.470
Boar 0.312
Barrow 0.833
Total
0.041
Barrow 0.005
Gilt 0.016
Boar 0.789
Gilt 0.039
Barrow
Total <0.001
0.970
Traits1 Sex Total2Genotype3
P
Boar 0.072
Gilt
69
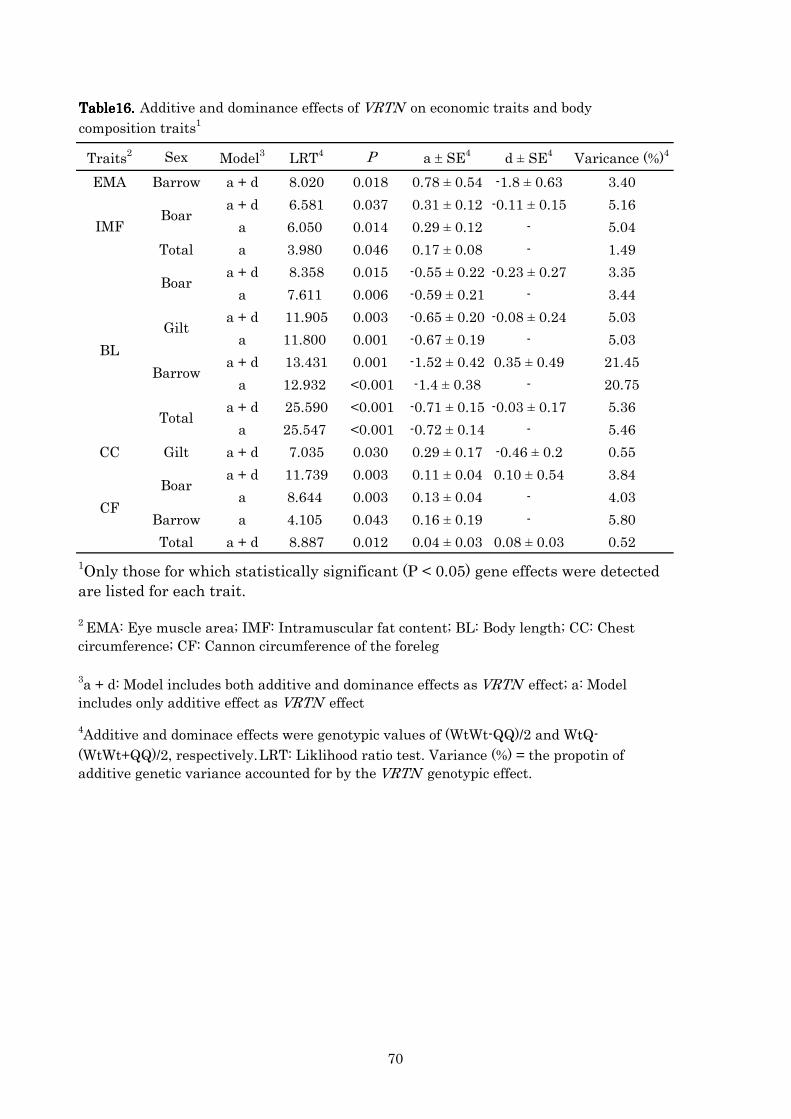
Traits2 Sex Model3 LRT4 P a ± SE4 d ± SE4 Varicance (%)4
EMA Barrow a + d 8.020 0.018 0.78 ± 0.54 -1.8 ± 0.63 3.40
a + d 6.581 0.037 0.31 ± 0.12 -0.11 ± 0.15 5.16
a 6.050 0.014 0.29 ± 0.12 - 5.04
Total a 3.980 0.046 0.17 ± 0.08 - 1.49
a + d 8.358 0.015 -0.55 ± 0.22 -0.23 ± 0.27 3.35
a 7.611 0.006 -0.59 ± 0.21 - 3.44
a + d 11.905 0.003 -0.65 ± 0.20 -0.08 ± 0.24 5.03
a 11.800 0.001 -0.67 ± 0.19 - 5.03
a + d 13.431 0.001 -1.52 ± 0.42 0.35 ± 0.49 21.45
a 12.932 <0.001 -1.4 ± 0.38 - 20.75
a + d 25.590 <0.001 -0.71 ± 0.15 -0.03 ± 0.17 5.36
a 25.547 <0.001 -0.72 ± 0.14 - 5.46
CC Gilt a + d 7.035 0.030 0.29 ± 0.17 -0.46 ± 0.2 0.55
a + d 11.739 0.003 0.11 ± 0.04 0.10 ± 0.54 3.84
a 8.644 0.003 0.13 ± 0.04 - 4.03
Barrow a 4.105 0.043 0.16 ± 0.19 - 5.80
Total a + d 8.887 0.012 0.04 ± 0.03 0.08 ± 0.03 0.52
CF
Boar
1Only those for which statistically significant (P < 0.05) gene effects were detectedare listed for each trait.
2 EMA: Eye muscle area; IMF: Intramuscular fat content; BL: Body length; CC: Chestcircumference; CF: Cannon circumference of the foreleg
4Additive and dominace effects were genotypic values of (WtWt-QQ)/2 and WtQ-
(WtWt+QQ)/2, respectively. LRT: Liklihood ratio test. Variance (%) = the propotin ofadditive genetic variance accounted for by the VRTN genotypic effect.
BL
Table16.Table16.Table16.Table16. Additive and dominance effects of VRTN on economic traits and body
composition traits1
Boar
Gilt
Barrow
IMFBoar
Total
3a + d: Model includes both additive and dominance effects as VRTN effect; a: Modelincludes only additive effect as VRTN effect
70
71
CHPTERCHPTERCHPTERCHPTER 5555 Evaluation of effects of multiple candidate genes ( Evaluation of effects of multiple candidate genes ( Evaluation of effects of multiple candidate genes ( Evaluation of effects of multiple candidate genes (LEPLEPLEPLEP, , , , LEPRLEPRLEPRLEPR, , , ,
MC4RMC4RMC4RMC4R, , , , PIK3C3PIK3C3PIK3C3PIK3C3, and , and , and , and VRTNVRTNVRTNVRTN) on production traits in Duroc pigs) on production traits in Duroc pigs) on production traits in Duroc pigs) on production traits in Duroc pigs
5555----1. 1. 1. 1. IIIIntroductionntroductionntroductionntroduction
Use of molecular genetic information can enhance livestock breeding
programs by increasing selection accuracy and decreasing generation
intervals (Dekkers. 2004). Many studies have reported an association
between gene polymorphisms and desirable traits in pig production, which
have become available on porcine QTL database (PigQTLdb
http://www.animalgenome.org/cgi-bin/QTLdb/SS/index). For example,
several dozen of candidate gene (CTSD, FTO, GHRH, HMGA1, HMGA2,
IGF2, LEP, LEPR, MC4R. PIK3C3 and so on) was reported as genetic
markers might be related with backfat thickness. However, most studies
evaluated only single gene effects. Production traits such as backfat
thickness (BFT) and growth rate are typical quantitative traits under the
control of multiple genes. Thus, it is important to elucidate combination or
interaction effects between multiple candidate genes for establishing more
effective breeding methods in pigs because there are relatively few reports
regarding this. Moreover, in most studies, the association between gene
polymorphisms and traits was investigated within limited experimental
crosses, such as a Duroc × Pietrain population composed of only one
generation. Genetic improvement of the pig strain is generally conducted
through several generations, thereby the pig population has more complex
genetic structure than that of experimental population. It is more
available to verify genetic effect in actual breeding population in order to
incorporating genetic effect into actual breeding program.
72
In the present study, we selected previously reported polymorphisms
of LEP, LEPR, and MC4R gene.
The porcine Leptin (LEP) gene (GeneBank accession no.
NM_213840) is composed of 38 kbp and 5 exons (Figure 9) and has been
mapped at 21.201 Mb on SSC18 in the Ensembl genome browser 70: Sus
scrofa comparative genomic database (Sscrofa10.2;
http://www.ncbi.nlm.nih.gov/gene/396832). Leptin receptor (LEPR) gene
(GeneBank accession no. NM_001024587) on SSC 6 (positional data has
not yet been added to Sscrofa10.2)is composed of 80 kbp and 20 exons
(Figure 10). Melanocortin 4 receptor (MC4R) gene (GeneBank accession no.
NM_214173) is composed of 2.8 kbp and 2 exons (Figure 11) and has been
mapped at 2at 178.553 Mb on SSC1 in Sscrofa10.2
(http://www.ncbi.nlm.nih.gov/gene/397359). These genes reportedly have
significant effects on pig production traits (Kim et al. 2000; Kennes et al.
2001; Obilio et al. 2002; Chen et al. 2004; Munoz et al. 2009, 2011;
Rodriguez et al. 2010; Uemoto et al. 2012). Furthermore, we added two
loci; class 3 phosphoinositide 3-kinase (PIK3C3) and vertnin (VRTN),
whose correlations for traits were detected in chapter 4 and 5.
Furthermore, we analyzed the effects of multigenic combination and
interaction effects between the five loci linked to four production traits,
which were average daily weight gain (ADG), backfat thickness (BFT),
size of loin eye muscle area (EMA), and intramuscular fat content (IMF) in
the loin, in five generations of a Duroc pig population improved using a
closed nucleus breeding system.

73
5555----2. Materials and Methods2. Materials and Methods2. Materials and Methods2. Materials and Methods
5555----2222----1. Animals and data collection1. Animals and data collection1. Animals and data collection1. Animals and data collection
The Duroc pig population used in this study was maintained at the
Central Research Institute for Feed and Livestock ZEN-NOH (Hokkaido,
Japan) from 2004 to 2010. A complete description of this population was
previously provided in the Chapter 1.
In this study, we analyzed the phenotypic values of four production
traits (ADG, BFT, EMA, IMF) that were collected from 1,414 Duroc pigs
from the second to fifth generation of this strain. All animals were
provided unlimited access to food and water during the experimental
period, and all experiments were performed in accordance with our
institutional guidelines for animal management.
5555----2222----2. 2. 2. 2. GenotypinGenotypinGenotypinGenotyping g g g of of of of LEPLEPLEPLEP, , , , LEPRLEPRLEPRLEPR, , , , MC4RMC4RMC4RMC4R, , , , PIK3C3PIK3C3PIK3C3PIK3C3, and , and , and , and VRTNVRTNVRTNVRTN
Genomic DNA was extracted from tail tissue clippings of each pig
using the DNeasy Blood and Tissue Kit (Qiagen, Inc., Hilden, Germany) or
QuickGene DNA Tissue Kit (Fuji Photo Film Co., Ltd., Tokyo, Japan).
Genotyping of the LEP (c.3469T>C), MC4R (c.1426A>G), and
PIK3C3 (c.2604C>T) polymorphisms were performed using the
polymerase chain reaction–restriction fragment length polymorphism
(PCR–RFLP) method as described by Stratil et al. (1997), Kim et al. (2000),
and Kim et al. (2005), respectively (Table 17, Figure9 and 10). To genotype
the LEPR polymorphism c.2002C>T in exon14, we developed a novel
miss-match PCR–RFLP method using miss-match PCR primers (forward
on exon 14 and reverse on intron 14) from the S. scrofa Ensembl genomic
database (Sscrofa10.2; Ensembl gene ID, NW_003540913). These

74
miss-match primers were set to create a new ApeKI restriction site in the
allele C. The PCR conditions were as follows: denaturation at 94°C for 9
min; 33 cycles of amplification at 94°C for 30 s, 57°C for 30 s, 72°C for 30 s;
and a final extension step at 72°C for 10 min. The 133-bp amplicon was
digested using the restriction endonuclease ApeKI (New England BioLabs,
Inc., Ipswich, MA, USA). The amplicon from the c.2002 C allele, but not
that from the T allele, contained an ApeKI cleavage site (Table 17,
Figure11). We also added VRTN genotype data as reported by Hirose et al.
(2012).
5555----2222----3. 3. 3. 3. Statistical analysisStatistical analysisStatistical analysisStatistical analysis
To evaluate the genotypic trend and allelic frequency in this
population, Pearson’s chi-square test was performed between the second
and fifth generation animals. As LEPR and PIK3C3 were located on the
same chromosome (SSC6), we measured the level of linkage
disequilibrium of alleles at the two loci. The coefficient of linkage
disequilibrium (D), standardized disequilibrium coefficients (D′), and
squared allele-frequency correlations (r2) was estimated using the
Expectation-Maximization (EM) algorithm and the likelihood ratio test
(LRT) (Montgomery et al., 1996).
In the present study, we evaluated the associations between each
genotype and trait in our mixed-inheritance animal model. The snp_ad
option of Qxpak software (Perez-Enciso and Misztal. 2004) was used to
assess individual genotypes. The following model was used to analyze the
data:
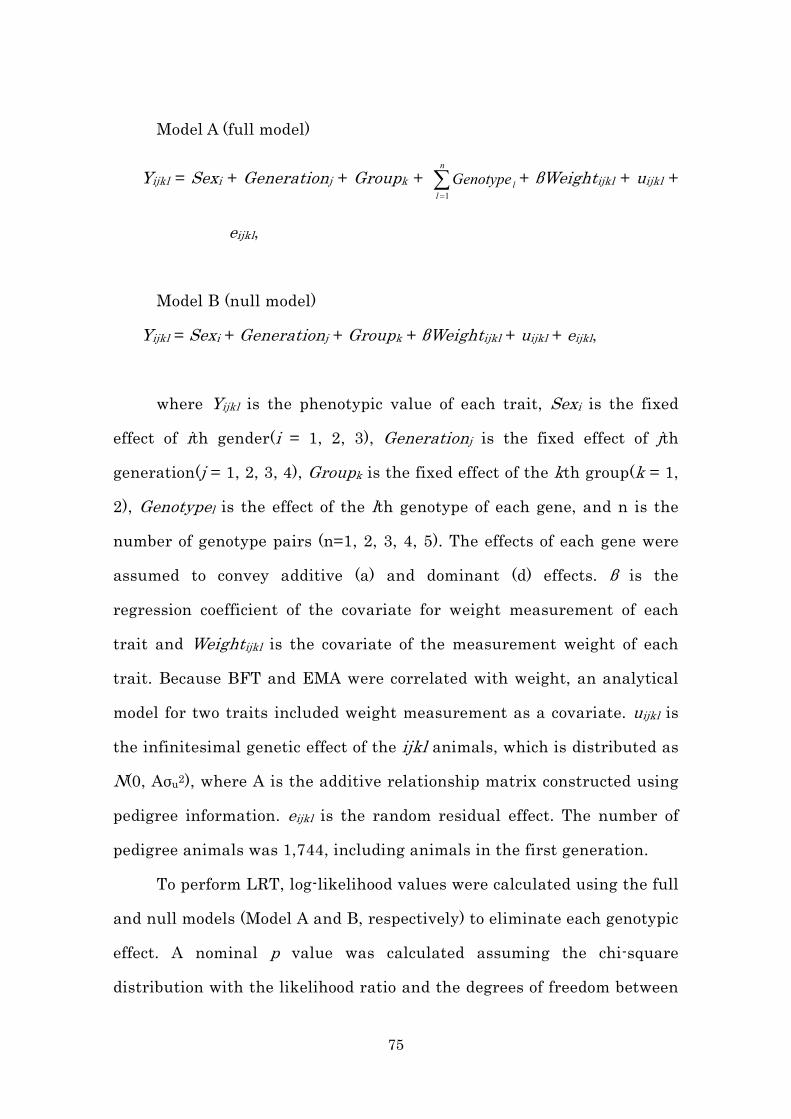
75
Model A (full model)
Yijkl = Sexi + Generationj + Groupk + ∑=
n
l
lGenotype1
+ βWeightijkl + uijkl +
eijkl,
Model B (null model)
Yijkl = Sexi + Generationj + Groupk + βWeightijkl + uijkl + eijkl,
where Yijkl is the phenotypic value of each trait, Sexi is the fixed
effect of ith gender(i = 1, 2, 3), Generationj is the fixed effect of jth
generation(j = 1, 2, 3, 4), Groupk is the fixed effect of the kth group(k = 1,
2), Genotypel is the effect of the lth genotype of each gene, and n is the
number of genotype pairs (n=1, 2, 3, 4, 5). The effects of each gene were
assumed to convey additive (a) and dominant (d) effects. β is the
regression coefficient of the covariate for weight measurement of each
trait and Weightijkl is the covariate of the measurement weight of each
trait. Because BFT and EMA were correlated with weight, an analytical
model for two traits included weight measurement as a covariate. uijkl is
the infinitesimal genetic effect of the ijkl animals, which is distributed as
N(0, Aσu2), where A is the additive relationship matrix constructed using
pedigree information. eijkl is the random residual effect. The number of
pedigree animals was 1,744, including animals in the first generation.
To perform LRT, log-likelihood values were calculated using the full
and null models (Model A and B, respectively) to eliminate each genotypic
effect. A nominal p value was calculated assuming the chi-square
distribution with the likelihood ratio and the degrees of freedom between

76
the number of parameters in the full and null models. To determine the
effect of each gene on the genotype, the proportion of additive genetic
variance of each gene was calculated as follows:
Variance percentage = [2pq (a + d(q − p))2]/VA,
where p and q are the allelic frequencies of each gene and VA is the
additive genetic variance of the trait obtained from the animal model
analysis, without considering the genetic effects of each gene (Falconar,
1989)
The epi_snp option of Qxpak software (Perez-Enciso and Misztal.,
2004) was used to evaluate the interactive effect of each gene. The
following model was assumed:
Model C (epitasis model)
Yijklm = Sexi + Generationj + Groupk + Genotype1l + Genotype2m +
Genotype1l*Genotype2m + βWeightijklm + uijklm + eijklm,
where Genotype1l and Genotype2m are single genotypic effects and
Genotype1l*Genotype2m is the interactive effect of two genotypes. These
interactive effect were assumed four epistatic effects (additive*additive,
additive*dominant, dominant*additive, dominant*dominant) as described
in Cockerham’s decomposition method (Cockerham., 1954). For this
analysis, LRTs were conducted to compare the epistasis and decreased
models (Models C and A), which were used to eliminate the interactive
effects of the models. Nominal p values were calculated according to the

77
chi-square distribution.
The false discovery rate (FDR) was considered as the threshold to
determine a significant LRT to account for the multiple tests used in this
study, and q values were calculated using R software (www.r-project.org/)
and the BH method (Benjamini and Hochberg., 1995). The FDR procedure
was separately for multiple genotype effect analysis (31 genotype
combinations × 4 traits = 124 tests) and for epistatic analysis (10 genotype
combinations × 4 traits = 40 tests).
We calculated Akaike’s information criterion (AIC) values for each
model to investigate whether the inclusion of some candidate gene effects
into the mathematical model could increase the accuracy of the model to
predict BVs of individual traits. Thus, we compared the difference in the
AIC value (∆AIC) of models A and B using the following equation (Akaike.,
1974):
∆AICAB=AICmldelA − AICmodelB
= −2logλA + 2npr − (−2logλB + 2npr′)
=−2(logλA − logλB) + 2npr − 2npr′
= −2logλA/λB + 2npr − 2npr′
= −2LRT + 2(npr − npr′),
where ∆AICAB is the difference in AIC values between Models A and
B, LRT is the log-likelihood ratio between Models A and B, and npr and
npr′ are the number of independently adjusted parameters within Models
A and B, respectively, thereby npr-npr’ shows the difference of genotype
pairs number within Models A and B.

78
5555----3. 3. 3. 3. RRRResultsesultsesultsesults
5555----3333----1. 1. 1. 1. Generational allelicGenerational allelicGenerational allelicGenerational allelic and and and and genotypicgenotypicgenotypicgenotypic frequenciesfrequenciesfrequenciesfrequencies
The allelic and genotypic frequencies for the four loci (LEP, LEPR,
MC4R, and PIK3C3) in each generation are presented in Table 18. Except
for LEP, the distributions of genotypic and allelic frequencies for these loci
in the fifth generation were significantly different from those in the second
generation (p < 0.05). The allelic frequencies of c.1426A in MC4R, c.2002T
in LEPR, and c.2604C in PIK3C3 in the fifth generation were increased
compared with those in the second generation.
5555----3333----2. 2. 2. 2. Effects of Effects of Effects of Effects of single genes on pig production traitssingle genes on pig production traitssingle genes on pig production traitssingle genes on pig production traits
In our study population, a non-random association of alleles at
LEPR and PIK3C3 was detected (p < 0.001). However, the values of D, D′,
and r2 showed extremely low levels (D = −0.038, D′ = 0.202, r2 = 0.032);
therefore, we treated each effect of LEPR and PIK3C3 independently.
Results obtained from association analysis fitting each gene effect
are included in Table 19. The LEPR and MC4R genotype effects were
pleiotropic and significantly influenced ADG and BFT. Similarly, PIK3C3
was associated with ADG and BFT. The effect of allele T in LEPR, allele G
in MC4R, and allele C in PIK3C3 increased ADG (p = 0.102 × 10⁻⁹, 0.859 ×
10−5, and 0.033, q = 0.506 × 10⁻⁹, 0.304 × 10⁻⁴, and 0.076, respectively) and
BFT (p = 5.18 × 10⁻³³, 9.14 × 10⁻⁵, and 0.015, q = 0.107 × 10⁻³⁰, 0.252 × 10⁻³,
and 0.036, respectively) when they were substituted for each opposite
allele. Only the independent dominant effect of LEPR on ADG resulted in
a value greater than that of its additive effect.

79
An additive genetic variance of 16.99% in ADG was attributed to
LEPR, MC4R, and PIK3C3 (7.62, 7.84, and 1.53%, respectively). Similarly,
the proportion of additive genetic variance on BFT by these three markers
was 22.51%, in which the contribution of LEPR (19.76%) was significantly
larger than that of MC4R (1.11%) and PIK3C3 (1.64%).
As shown in Table 19, LEP polymorphisms showed no effect on any
traits in this population. Although LEPR on IMF and PIK3C3 on EMA
induced marginally significant effects (p = 0.066 and 0.074, respectively),
both p values did not reach significance after FDR correction.
5555----3333----3. 3. 3. 3. Combination effects on pig production traitsCombination effects on pig production traitsCombination effects on pig production traitsCombination effects on pig production traits
The results obtained from the present association analysis of
combination effects on pig production traits are presented in Table 20. We
detected significant effects of all combinations of LEPR, MC4R, or PIK3C3,
with the exception of LEP/PIK3C3 on ADG and BFT. All p values indicated
significance after FDR correction.
The largest influence on the ADG and BFT phenotype was induced
by the genetic combination include LEPR, MC4R, PIK3C3, which was
consistent with the alleles that were most likely to independently increase
the phenotypic values. For IMF, only the genetic combination of
LEPR/VRTN showed a statistically significant association, but this
q-value did not reached significance after FDR correction. Lastly, we
detected no significant association between any genotype pairs and EMA.
Epistatic effects between all gene pairs on the production traits are
presented in Table 21. As shown, only the LEPR and PIK3C3 pair on EMA
reached significance (p = 0.026), however, this significance did not remain
80
after FDR correction.
5555----3333----4. 4. 4. 4. Comparison of statistical model fitnessComparison of statistical model fitnessComparison of statistical model fitnessComparison of statistical model fitness
The ∆AIC values between the full model, which included single gene
effects, and the null model, which did not, are presented in Table 19, and
comparative results between the models that produced more than two
gene effects and the null model are presented in Table 20. The ∆AIC
values between the epistasis and null models are presented in Table 21.
A comparison within the single gene effect models showed that the
∆AIC values of the model that included the effect of LEPR were the least
on both ADG and BFT and were extremely less compared with those of the
model that contained the effects of MC4R or PIK3C3.
An intermodel comparison showed that the ∆AIC values estimated
by applying the combination model of LEPR/MC4R/PIK3C3 (∆AIC =
−62.0) for ADG had the smallest value, whereas the model that included
LEPR/MC4R/PIK3C3/VRTN had the smallest value (∆AIC = −160.3) for
BFT.
The differences in the genetic effects on ADG induced by the
combination of LEPR-TT/MC4R-GG/PIK3C3–CC and a model containing
substitutions of each opposite allele was calculated for 131.4 g/day. For
BFT, the combination of LEPR-TT/MC4R-GG/PIK3C3-CC/VRTN-Wt/Wt
showed the largest value and the difference in genetic effects between the
combinations of the alleles and the combination of the opposite alleles
was 0.38 cm.
For EMA, although the ∆AIC value of the model that included the
effect of PIK3C3 was slightly negative (∆AIC =−1.2), the values of the

81
models that contained the effects of more than two genes were positive.
The ∆AIC value of the model that included the independent effects of
LEPR and PIK3C3 as well as the epistatic effects between those genes was
slightly negative (∆AIC = −1.1), however, this value was greater than that
of the model that included only the PIK3C3 genotype.
For IMF, only the ∆AIC value of the model that included LEPR, which
showed a marginally correlation, was slightly lesser than that of the null
model (∆AIC = −1.4).
5555----4. Discussion4. Discussion4. Discussion4. Discussion
The present study focused on combination effects of candidate genes
known to be associated with economically important production traits,
such as ADG and BFT, which were located in previously identified porcine
quantitative trait loci regions, to predict the genetic value of animals more
accurately.
The association analysis of single candidate genes demonstrated
that LEPR, MC4R, and PIK3C3 had pleiotropic effects on growth and fat
deposition. c.2002T of LEPR, c.1426G of MC4R, and c.2604C of PIK3C3
had positive additive effects on ADG and BFT in our Duroc pig population
(Table 19), which were in accordance with previous reports regarding
allelic effects on these pig production traits (Kim et al., 2000, 2005;
Houston et al., 2004; Ovilio et al., 2005, 2006; Bruun et al., 2006; Munoz
et al., 2009; Hirose et al., 2011; Uemoto et al. 2012). On the other hand,
we could not detect any significant correlation between the LEP genotype
and growth traits that had been reported in a Landrace strain (Kennes et
al., 2001). This discrepancy suggests that the effects of the LEP
82
c.3469T<C variants diverge depending on the genetic background.
BVs of ADG, BFT, and IMF of the fifth generation of the present
Duroc pig population significantly increased compared with those of the
first and second generations by improving our breeding program (Hirose
et al. 2012). The changes in allelic frequencies for each of the LEPR and
PIK3C3 in this population appeared to have responded to the selective
breeding (Table 18).
The present joint analysis determined that the genetic combinations
of LEPR/MC4R/PIK3C3 for ADG, LEPR/MC4R/PIK3C3/VRTN for BFT,
and LEPR/VRTN for IMF had the smallest AIC values. For BFT, the
combination effect of VRTN to the combination of LEPR/MC4R/PIK3C3,
in which each gene significantly influenced the phenotypic traits
described in this study, further enhanced the monitored pig production
parameters. However, the effect of VRTN alone did not reach statistical
significance but indicated a marginally influence (p = 0.066, data not
shown) on BFT in our previous study (Hirose et al. 2012). Thus, a
combination of the four genes analyzed herein might induce the smallest
AIC value. For IMF, the AIC value of the LEPR/VRTN effect was smaller
than that of the single LEPR effect. In our previous study, VRTN showed
a significant effect on IMF in an additive effect model and GLM
procedure (Hirose et al. 2012). Therefore, our results suggest that
combination effect of between LEPR and VRTN might be useful for
improving IMF in our Duroc population.
Although some models that included multiple genetic effects showed
higher LRT values than those with fewer genetic effects, they were less
adequate because of the higher AIC value in the present study. For

83
example, the LRT value of the LEPR/PIK3C3 model for ADG was higher
than that of the single LEPR model, but the AIC value of the former
model was higher than that of the latter. Moreover, the model that
included all genotype pairs showed the highest LRT values in this study,
but it did not showed the smallest AIC value. With regard to estimation
of the AIC value of the model, including more parameters leads to
increased AIC values. Therefore, the increased number of markers used
as parameters in the model includes some genes that affect the AIC value.
These results suggest that it is useful to construct a more appropriate
model to predict BVs by addition of other marker effects simultaneously.
Nonetheless, it is important to choose the marker combinations carefully,
even if each marker independently affects the traits because the model
fitness may become unfavorable depending on the combination of
markers.
We also detected marginally epistatic effects by LEPR/PIK3C3 on
EMA in this population. But this epistatic effect did not reach significance
after FDR correction. The presence of epistatic effect between LEPR and
PIK3C3 for EMA were not clear in this study. On the other hand, although
strong effects by LEPR, MC4R, and PIK3C3 on ADG and BFT were
detected in this study, they were independent. It is not clear about the
mechanisms of interactive effects between these genes in this study.
Therefore, further studies are needed in order to clarify the interactive
effects within the gene polymorphisms on the porcine productive traits.
In this study, we compared the models to select favorable model with
considering AIC value. However, some models had equivalent AIC value
in the present study. In this study, difference of AIC value between the
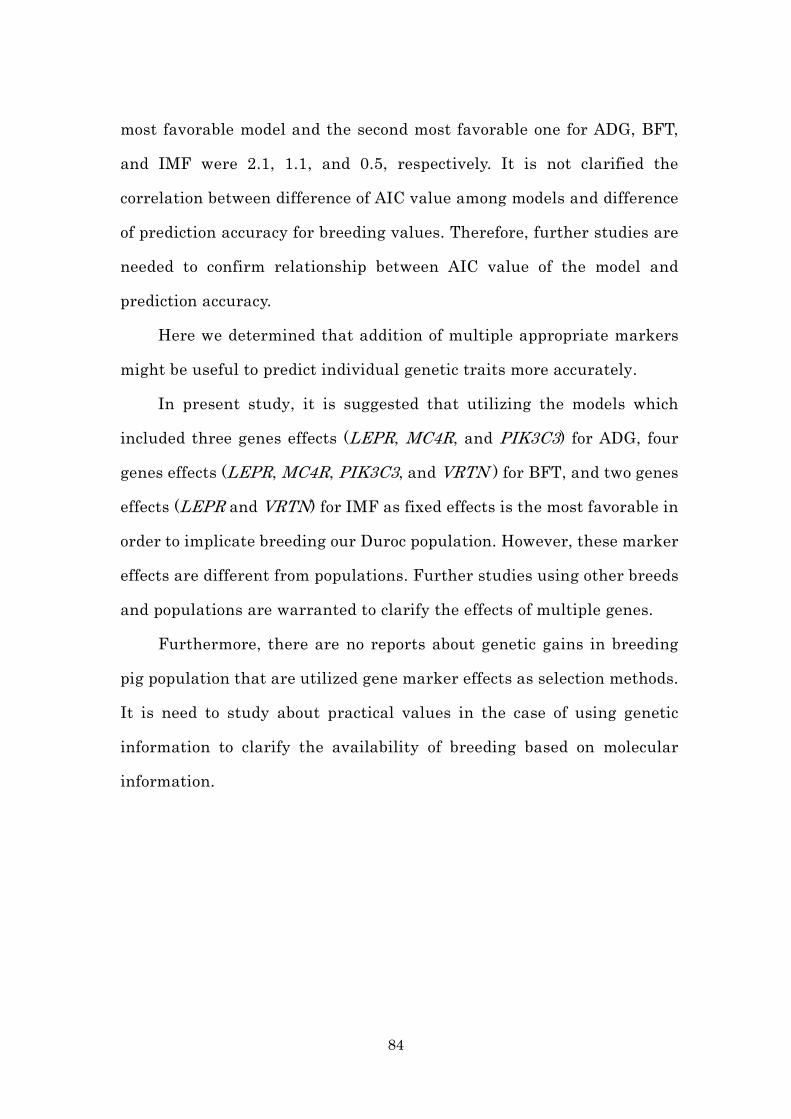
84
most favorable model and the second most favorable one for ADG, BFT,
and IMF were 2.1, 1.1, and 0.5, respectively. It is not clarified the
correlation between difference of AIC value among models and difference
of prediction accuracy for breeding values. Therefore, further studies are
needed to confirm relationship between AIC value of the model and
prediction accuracy.
Here we determined that addition of multiple appropriate markers
might be useful to predict individual genetic traits more accurately.
In present study, it is suggested that utilizing the models which
included three genes effects (LEPR, MC4R, and PIK3C3) for ADG, four
genes effects (LEPR, MC4R, PIK3C3, and VRTN ) for BFT, and two genes
effects (LEPR and VRTN) for IMF as fixed effects is the most favorable in
order to implicate breeding our Duroc population. However, these marker
effects are different from populations. Further studies using other breeds
and populations are warranted to clarify the effects of multiple genes.
Furthermore, there are no reports about genetic gains in breeding
pig population that are utilized gene marker effects as selection methods.
It is need to study about practical values in the case of using genetic
information to clarify the availability of breeding based on molecular
information.
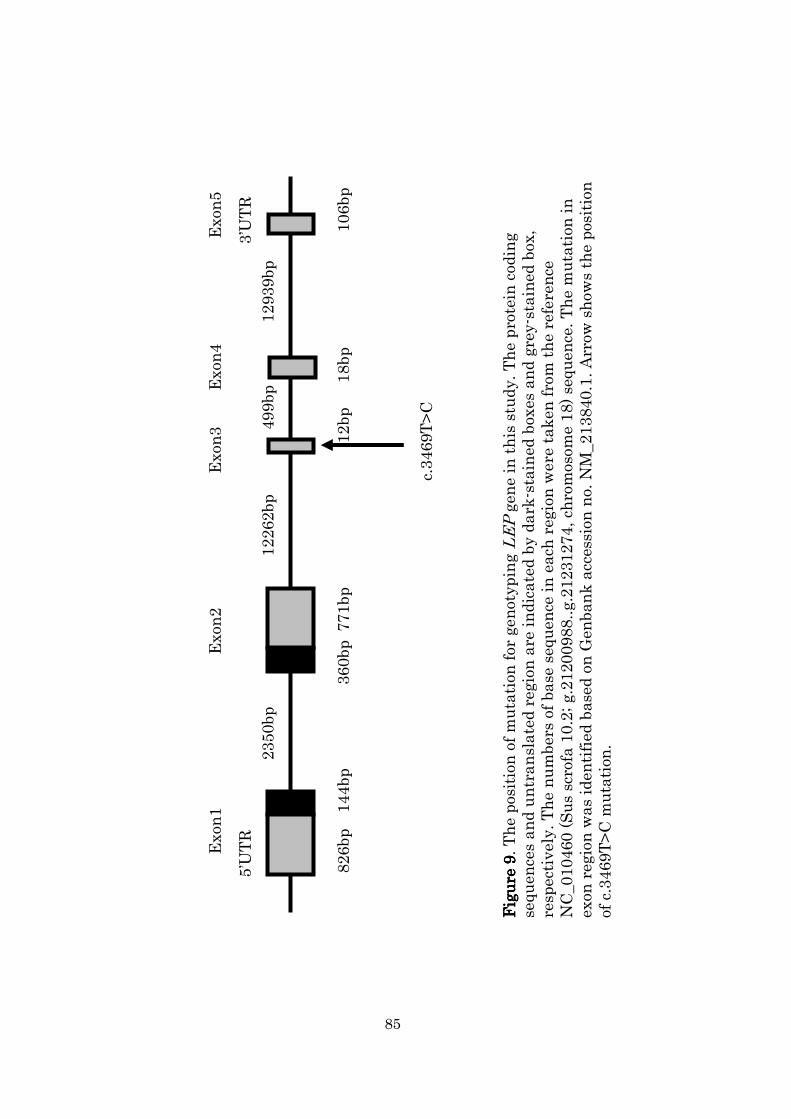
Exon1
Exon2
Exon3
Exon4
Exon5
Figure 9
Figure 9
Figure 9
Figure 9. The position of mutation for gen
otyping LEPgene in this study. The protein coding
sequences and untranslatedregion are indicated by dark-stained boxes and grey-stained box,
respectively. The numbers of base sequence in each region were taken from the reference
NC_010460 (Sus scrofa 10.2; g.21200988..g.21231274, chromosom
e 18) sequence. The mutation in
exon region was identified based on Genbankaccession no. NM_213840.1. Arrow
show
s the position
of c.3469T>C m
utation.
5’UTR
826bp
144bp
2350bp
771bp
12262bp
360bp
12bp
499bp
18bp
12939bp
106bp
c.3469T>C
3’UTR
85

Exon
15
Exon
14
Exon
3Exon
4Exon
20(3’UTR)
Figure 10
Figure 10
Figure 10
Figure 10. The position of mutation
for gen
otyping LEPRgen
e in this study. The protein coding
sequen
ces and untranslatedregion are indicated by dark-stained boxes and grey-stained box,
respectively. The numbers of base sequen
ce in each region were taken
from the reference
NW_003541095 (Sus scrofa 10.2; unplaced scaffold referen
ce) sequen
ce. The mutation
in exon
region
was iden
tified based on Gen
bankaccession
no. N
M_001024587. Arrow
show
s the position of
c2002C>T m
utation
.
3530bp
330bp
5163bp
83bp
217bp
3812bp
30bp
373bp
28781bp
13154bp
c.2002C>T
86
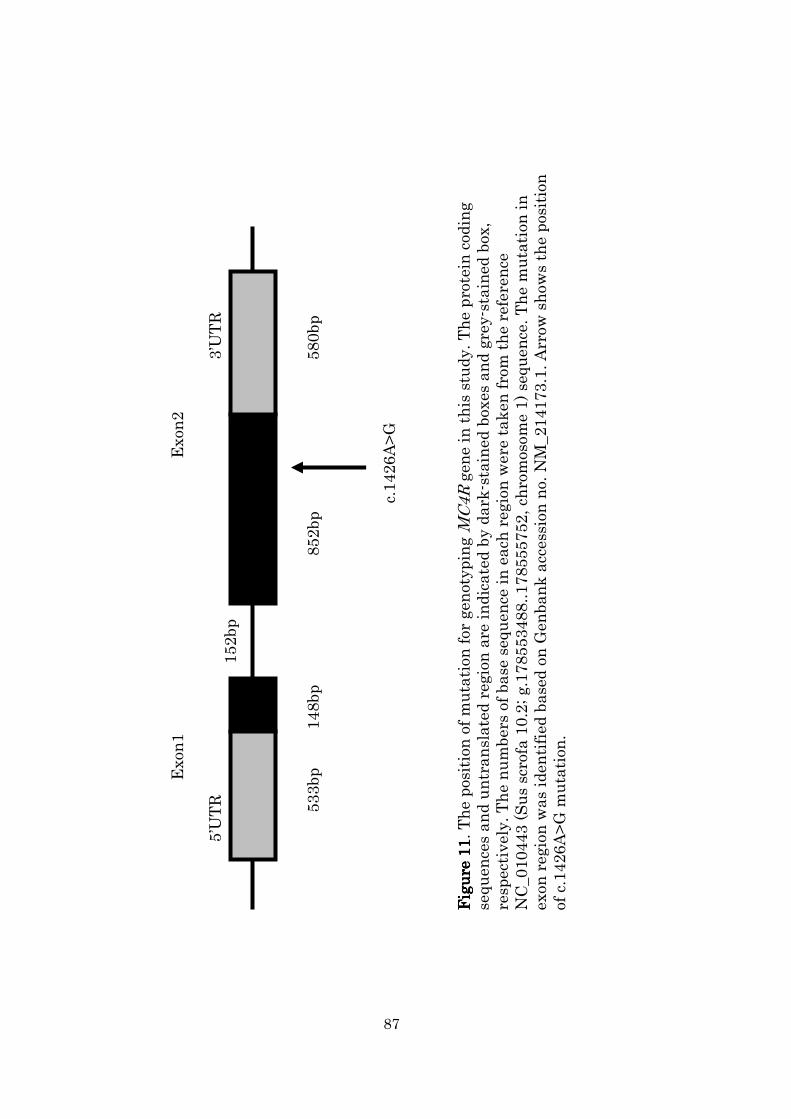
Exon1
Exon2
Figure 11
Figure 11
Figure 11
Figure 11. The position of mutation for gen
otyping M
C4Rgene in this study. The protein coding
sequences and untranslatedregion are indicated by dark-stained boxes and grey-stained box,
respectively. The numbers of base sequence in each region were taken from the reference
NC_010443 (Sus scrofa 10.2; g.178553488..178555752, chromosom
e 1) sequence. The mutation in
exon region was identified based on Genbankaccession no. NM_214173.1. Arrow
show
s the position
of c.1426A>G m
utation.
5’UTR
3’UTR
580bp
852bp
152bp
148bp
533bp
c.1426A>G
87
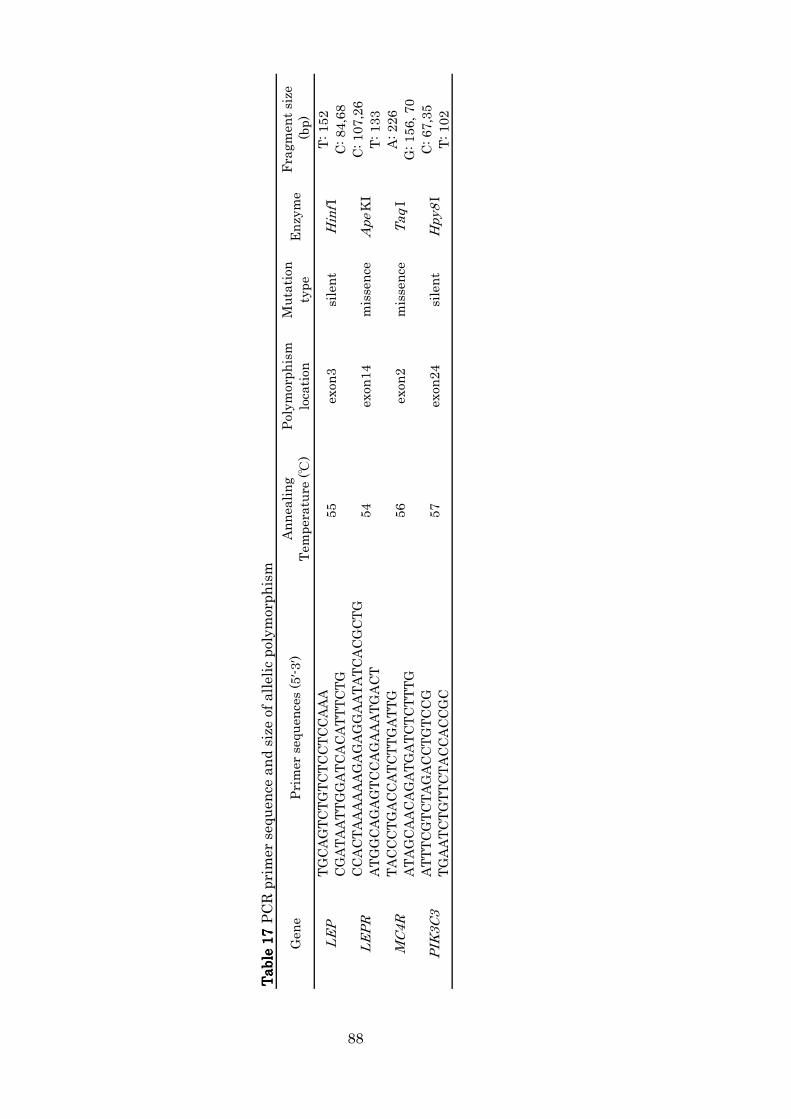
Table
17
Table
17
Table
17
Table
17
PC
R p
rim
er s
equ
ence
an
d s
ize
of a
llel
ic p
olym
orp
his
m
Gen
eP
rim
er s
equ
ence
s (5′-3′)
An
nea
lin
gT
emp
eratu
re (℃
)P
olym
orp
his
mlo
cati
onM
uta
tion
typ
eE
nzy
me
Fra
gm
ent
size
(bp
)
TG
CA
GT
CT
GT
CT
CC
TC
CA
AA
T: 152
CG
AT
AA
TT
GG
AT
CA
CA
TT
TC
TG
C: 84,6
8C
CA
CT
AA
AA
AA
GA
GA
GG
AA
TA
TC
AC
GC
TG
C: 107,2
6A
TG
GC
AG
AG
TC
CA
GA
AA
TG
AC
TT
: 133
TA
CC
CT
GA
CC
AT
CT
TG
AT
TG
A: 226
AT
AG
CA
AC
AG
AT
GA
TC
TC
TT
TG
G: 156, 70
AT
TT
CG
TC
TA
GA
CC
TG
TC
CG
C: 67,3
5T
GA
AT
CT
GT
TC
TA
CC
AC
CG
CT
: 102
88
Taq
I
PIK
3C
357
exon
24
sile
nt
Hp
y8I
MC
4R
56
exon
2
LE
P55
exon
3
LE
PR
54
exon
14
mis
sen
ce
mis
sen
ce
Hin
fIsi
len
t
Ap
eK
I

Figure 12Figure 12Figure 12Figure 12. Genotyped patterns of polymorphism at c.3469C>T mutation of porcine LEP gene digested by restriction enzymHinfI on a 3.0% agarose gel. The genotypes indicate under lanes of the gel. Allele T produced a 152-bp fragment, and allele C produced 84- and 68-bp fragments. The heterozygote has both allele T and allele C fragments. The M is a 100-bp DNA Ladder molecular size mark (Fermentas Inc., Glen Burnie, MD, USA).
T/T T/T T/C T/C C/C C/C M
300
200
100
bp
89
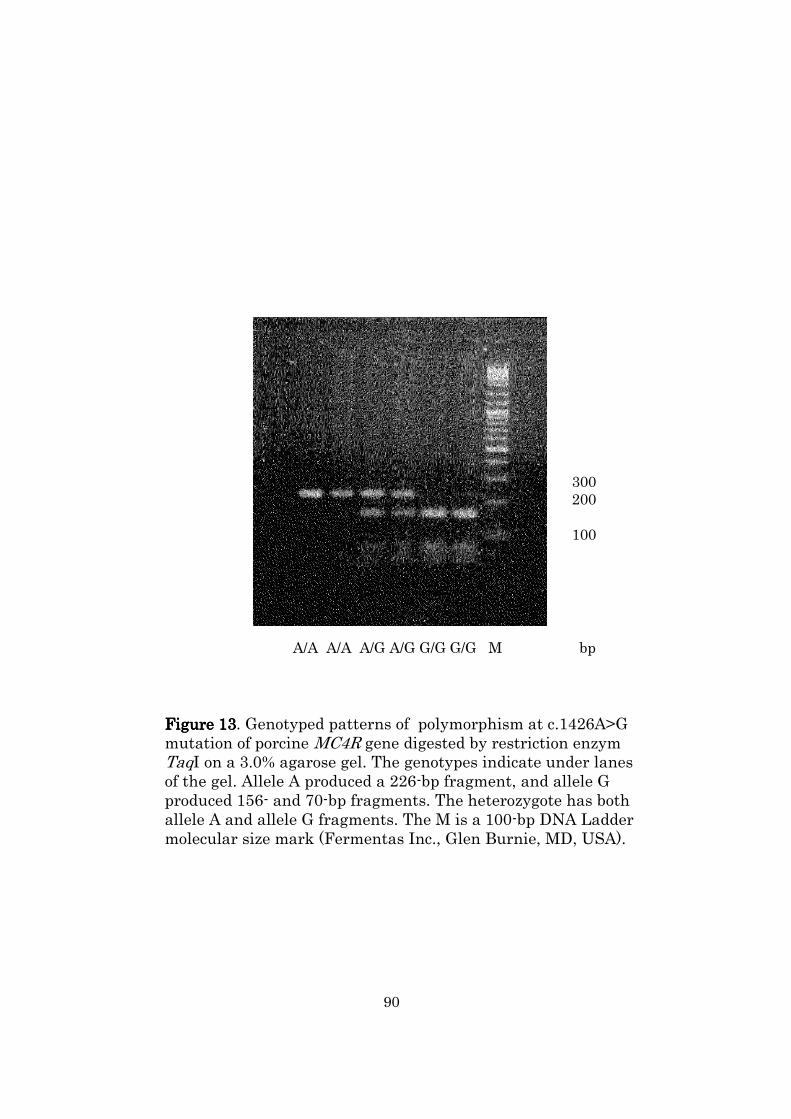
A/A A/A A/G A/G G/G G/G M
Figure 13Figure 13Figure 13Figure 13. Genotyped patterns of polymorphism at c.1426A>G mutation of porcine MC4R gene digested by restriction enzymTaqI on a 3.0% agarose gel. The genotypes indicate under lanes of the gel. Allele A produced a 226-bp fragment, and allele G produced 156- and 70-bp fragments. The heterozygote has both allele A and allele G fragments. The M is a 100-bp DNA Ladder molecular size mark (Fermentas Inc., Glen Burnie, MD, USA).
90
300200
100
bp
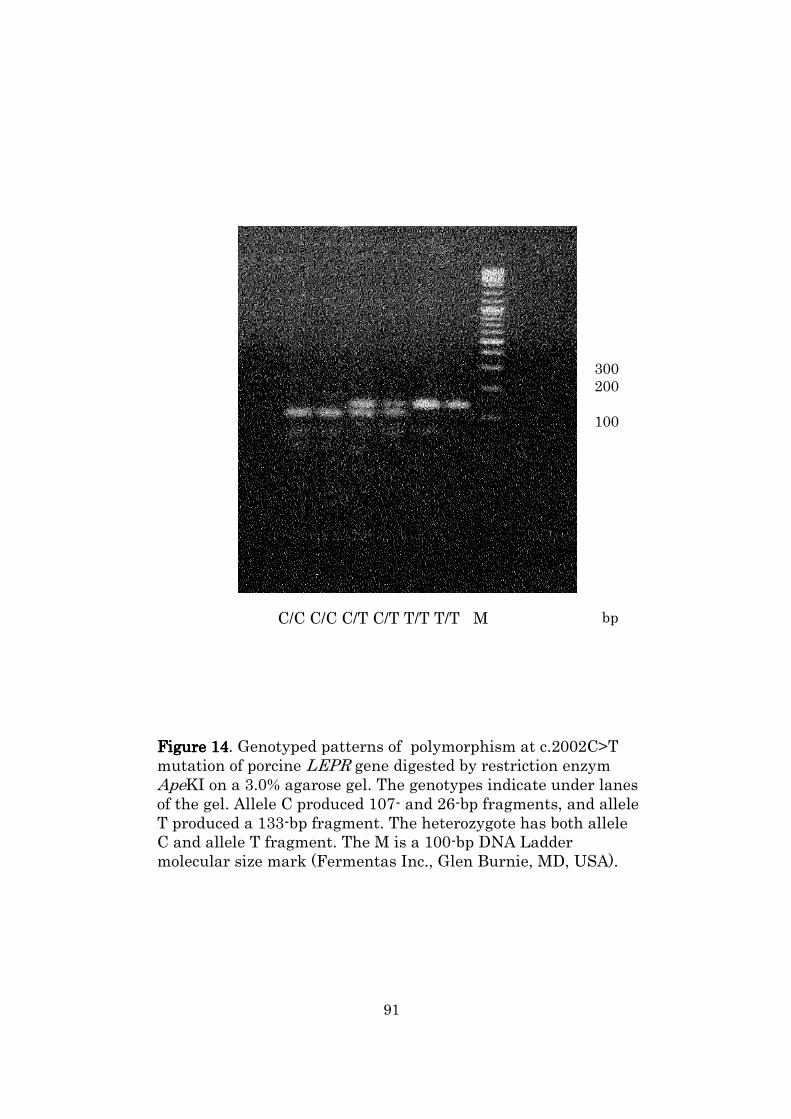
C/C C/C C/T C/T T/T T/T M
Figure 14Figure 14Figure 14Figure 14. Genotyped patterns of polymorphism at c.2002C>T mutation of porcine LEPR gene digested by restriction enzymApeKI on a 3.0% agarose gel. The genotypes indicate under lanes of the gel. Allele C produced 107- and 26-bp fragments, and allele T produced a 133-bp fragment. The heterozygote has both allele C and allele T fragment. The M is a 100-bp DNA Ladder molecular size mark (Fermentas Inc., Glen Burnie, MD, USA).
300200
100
bp
91

Table
18
Table
18
Table
18
Table
18
Nu
mber
of
an
imals
, gen
otyp
ic, an
d a
llel
ic f
requ
enci
es o
f m
ark
ers
in e
ach
gen
erati
on
Mark
erG
ener
ati
on
Tot
al
boa
rc
2p
gil
tbarr
owT
/T0.5
61
(793)
0.5
69
(161)
0.5
78
(199)
0.5
57
(204)
0.5
45
(229)
T/C
0.4
14
(585)
0.4
24
(120)
0.4
07
(140)
0.4
23
(155)
0.4
05
(170)
C/C
0.0
25
(35)
0.0
07
(2)
0.0
15
(5)
0.0
19
(7)
0.0
50
(21)
T (
q)
0.7
68
(2171)
0.7
81
(442)
0.7
82
(538)
0.7
69
(563)
0.7
48
(628)
C (
p)
0.2
32
(655)
0.2
19
(124)
0.2
18
(150)
0.2
31
(169)
0.2
52
(212)
C/C
0.1
08
(153)
0.1
98
(56)
0.1
34
(46)
0.0
77
(28)
0.0
55
(23)
C/T
0.4
55
(643)
0.5
30
(150)
0.5
20
(179)
0.4
45
(163)
0.3
59
(151)
T/T
0.4
37
(618)
0.2
72
(77)
0.3
46
(119)
0.4
78
(175)
0.5
87
(247)
C (
p)
0.3
36
(949)
0.4
63
(262)
0.3
94
(271)
0.2
99
(219)
0.2
34
(197)
T (
q)
0.6
64
(1879)
0.5
37
(304)
0.6
06
(417)
0.7
01
(513)
0.7
66
(645)
A/A
0.7
66
(1083)
0.7
14
(202)
0.7
27
(250)
0.7
35
(269)
0.8
62
(362)
A/G
0.2
26
(319)
0.2
83
(80)
0.2
62
(90)
0.2
51
(92)
0.1
36
(57)
G/G
0.0
08
(11)
0.0
04
(1)
0.0
12
(4)
0.0
14
(5)
0.0
02
(1)
A (
p)
0.8
79
(2485)
0.8
55
(484)
0.8
58
(590)
0.8
61
(630)
0.9
30
(781)
G (
q)
0.1
21
(341)
0.1
45
(82)
0.1
42
(98)
0.1
39
(102)
0.0
70
(59)
C/C
0.4
90
(693)
0.3
32
(94)
0.4
42
(152)
0.5
36
(196)
0.5
95
(250)
C/T
0.4
50
(636)
0.5
94
(168)
0.4
74
(163)
0.4
21
(154)
0.3
60
(151)
T/T
0.0
60
(85)
0.0
74
(21)
0.0
84
(29)
0.0
44
(16)
0.0
45
(19)
C (
p)
0.7
15
(2022)
0.6
29
(356)
0.6
79
(467)
0.7
46
(546)
0.7
75
(651)
T (
q)
0.2
85
(806)
0.3
71
(210)
0.3
21
(221)
0.2
54
(186)
0.2
25
(189)
Q/Q
0.3
40
(481)
0.4
06
(115)
0.3
60
(124)
0.3
11
(114)
0.3
05
(128)
Q/W
t0.5
11
(722)
0.4
66
(132)
0.4
74
(163)
0.5
49
(201)
0.5
38
(226)
Wt/
Wt
0.1
49
(210)
0.1
27
(36)
0.1
66
(57)
0.1
39
(51)
0.1
57
(66)
Q (
p)
0.5
96
(1684)
0.6
40
(362)
0.5
97
(411)
0.5
86
(429)
0.5
74
(482)
Wt
(q)
0.4
04
(1142)
0.3
60
(204)
0.4
03
(277)
0.4
14
(303)
0.4
26
(358)
1P
erce
nta
ge
of e
ach
gen
otyp
e an
d e
ach
all
ele.
Th
e n
um
ber
of
all
eles
is
giv
en i
n p
are
nth
eses
.2C
hi-
squ
are
tes
t fo
r gen
otyp
ic a
nd
all
elic
fre
qu
enci
es b
etw
een
G2 a
nd
G3
<0.0
01
All
elic
freq
uen
cy1
80.7
35
<0.0
01
92
VR
TN
Gen
otyp
ic
freq
uen
cy1
78.9
69
35.4
76
PIK
3C
3
Gen
otyp
ic
freq
uen
cy1
7.7
98
20.8
78
283
0.0
2
All
elic
freq
uen
cy1
6.0
96
0.0
14
<0.0
01
MC
4R
Gen
otyp
ic
freq
uen
cy1
46.8
3<
0.0
01
All
elic
freq
uen
cy1
<0.0
01
344
23.3
69
<0.0
01
LE
PR
Gen
otyp
ic
freq
uen
cy1
Nu
mber
of
pig
s
1414
All
elic
freq
uen
cy1
LE
P
Gen
otyp
ic
freq
uen
cy1
58
588
190
630
129
196
41
48
49
165
0.0
07
All
elic
freq
uen
cy1
2.0
62
0.1
51
9.8
48
163
173
113
131
154
G5
G2–G
5
366
420
Tot
al
G2
G3
G4
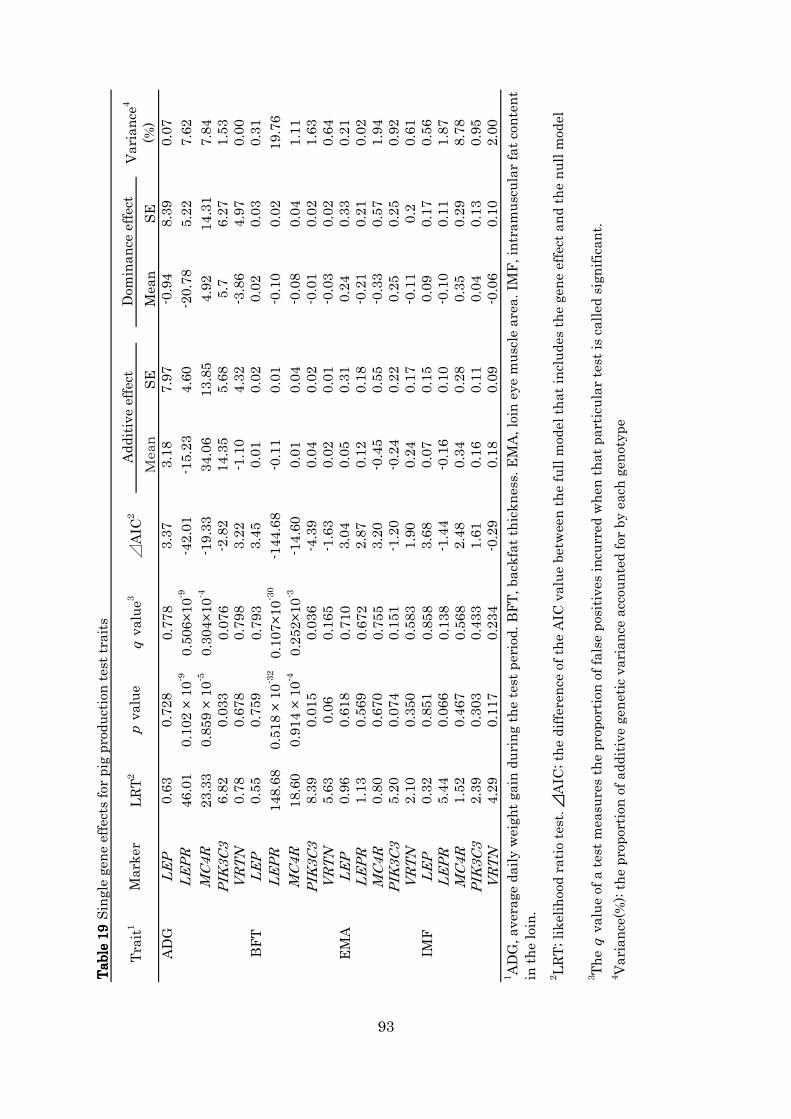
Table 19
Table 19
Table 19
Table 19 Single gene effects for pig production test traits
Mean
SE
Mean
SE
ADG
LEP
0.63
0.728
0.778
3.37
3.18
7.97
-0.94
8.39
0.07
LEPR
46.01
0.102 × 10⁻⁹
0.506×10⁻⁹
-42.01
-15.23
4.60
-20.78
5.22
7.62
MC4R
23.33
0.859 × 10⁻⁵
0.304×10⁻⁴
-19.33
34.06
13.85
4.92
14.31
7.84
PIK
3C3
6.82
0.033
0.076
-2.82
14.35
5.68
5.7
6.27
1.53
VRTN
0.78
0.678
0.798
3.22
-1.10
4.32
-3.86
4.97
0.00
BFT
LEP
0.55
0.759
0.793
3.45
0.01
0.02
0.02
0.03
0.31
LEPR
148.68
0.518 × 10⁻³²
0.107×10⁻³⁰
-144.68
-0.11
0.01
-0.10
0.02
19.76
MC4R
18.60
0.914 × 10⁻⁴
0.252×10⁻³
-14.60
0.01
0.04
-0.08
0.04
1.11
PIK
3C3
8.39
0.015
0.036
-4.39
0.04
0.02
-0.01
0.02
1.63
VRTN
5.63
0.06
0.165
-1.63
0.02
0.01
-0.03
0.02
0.64
EMA
LEP
0.96
0.618
0.710
3.04
0.05
0.31
0.24
0.33
0.21
LEPR
1.13
0.569
0.672
2.87
0.12
0.18
-0.21
0.21
0.02
MC4R
0.80
0.670
0.755
3.20
-0.45
0.55
-0.33
0.57
1.94
PIK
3C3
5.20
0.074
0.151
-1.20
-0.24
0.22
0.25
0.25
0.92
VRTN
2.10
0.350
0.583
1.90
0.24
0.17
-0.11
0.2
0.61
IMF
LEP
0.32
0.851
0.858
3.68
0.07
0.15
0.09
0.17
0.56
LEPR
5.44
0.066
0.138
-1.44
-0.16
0.10
-0.10
0.11
1.87
MC4R
1.52
0.467
0.568
2.48
0.34
0.28
0.35
0.29
8.78
PIK
3C3
2.39
0.303
0.433
1.61
0.16
0.11
0.04
0.13
0.95
VRTN
4.29
0.117
0.234
-0.29
0.18
0.09
-0.06
0.10
2.00
3The q value of a test measures the proportion of false positives incurred when that particular test is called significant.
4Variance(%
): the proportion of additive genetic variance accounted for by each genotype
Marker
LRT2
93
p value
Variance
4
(%)
1ADG, average daily weight gain during the test period. BFT, backfat thickness. EMA, loin eye muscle area. IM
F, intramuscular fat content
in the loin.
2LRT; likelihood ratio test. ⊿
AIC
; the difference of the AIC
value between the full m
odel that includes the gene effect and the null m
odel
q value3
⊿AIC
2Additive effect
Dom
inance effect
Trait1

Table 20Table 20Table 20Table 20 Combination effects of the genotype for pig production test traits 1
Gene1 Gene2 Gene3 Gene4 Gene5
ADG LEP LEPR 47.17 0.141 × 10⁻⁸ 0.672 × 10⁻⁸ -39.2 0.083
LEP MC4R 23.90 0.838 × 10⁻⁴ 0.258 × 10⁻³ -15.9 0.051
LEPR MC4R 67.88 0.635 × 10⁻¹⁴ 0.437 × 10⁻¹² -59.9 0.138
LEPR PIK3C3 44.95 0.407 × 10⁻⁸ 0.187 × 10⁻⁷ -37.0 0.061
LEPR VRTN 40.37 0.363 × 10⁻⁷ 0.150 × 10⁻⁶ -32.4 0.054
MC4R PIK3C3 31.29 0.267 × 10⁻⁵ 0.974 × 10⁻⁵ -23.3 0.070
MC4R VRTN 24.34 0.683 × 10⁻⁴ 0.202 × 10⁻³ -16.3 0.051
PIK3C3 VRTN 13.36 0.963 × 10⁻² 0.024 -5.4 0.023
LEP LEPR MC4R 68.91 0.682 × 10⁻¹² 0.403 × 10⁻¹¹ -56.9 0.142
LEP LEPR PIK3C3 45.98 0.299 × 10⁻⁷ 0.128 × 10⁻⁶ -34.0 0.064
LEP LEPR VRTN 41.25 0.259 × 10⁻⁶ 0.100 × 10⁻⁵ -29.2 0.057
LEP MC4R PIK3C3 31.88 0.172 × 10⁻⁴ 0.100 × 10⁻⁶ -19.9 0.070
LEP MC4R VRTN 24.78 0.376 × 10⁻³ 0.992 × 10⁻³ -12.8 0.051
LEP PIK3C3 VRTN 13.89 0.0309 0.072 -1.9 0.025
LEPR MC4R PIK3C3 74.01 0.613 × 10⁻¹³ 0.437 × 10⁻¹² -62.0 0.152
LEPR MC4R VRTN 68.59 0.795 × 10⁻¹² 0.448 × 10⁻¹¹ -56.6 0.136
LEPR PIK3C3 VRTN 45.27 0.413 × 10⁻⁷ 0.165 × 10⁻⁶ -33.3 0.059
MC4R PIK3C3 VRTN 32.67 0.121 × 10⁻⁴ 0.398 × 10⁻⁴ -20.7 0.071
LEP LEPR MC4R PIK3C3 75.06 0.478 × 10⁻¹² 0.297 × 10⁻¹¹ -59.1 0.156
LEP LEPR MC4R VRTN 69.45 0.632 × 10⁻¹¹ 0.327 × 10⁻¹⁰ -53.5 0.141
LEP LEPR PIK3C3 VRTN 53.16 0.100 × 10⁻⁷ 0.447 × 10⁻⁷ -37.2 0.089
LEP MC4R PIK3C3 VRTN 33.12 0.585 × 10⁻⁴ 0.177 × 10⁻³ -17.1 0.072
LEPR MC4R PIK3C3 VRTN 75.16 0.459 × 10⁻¹² 0.297 × 10⁻¹¹ -59.2 0.151
LEP LEPR MC4R PIK3C3 VRTN 76.02 0.300 × 10⁻¹¹ 0.162 × 10⁻¹⁰ -56.0 0.153
BFT LEP LEPR 149.59 0.249 × 10⁻³⁰ 0.238 × 10⁻²⁹ -141.6 0.206
LEP MC4R 19.12 0.744 × 10⁻³ 0.192 × 10⁻² -11.1 0.022
LEPR MC4 163.78 0.226 × 10⁻³³ 0.157 × 10⁻³³ -155.8 0.224
LEPR PIK3C3 152.62 0.560 × 10⁻³¹ 0.631 × 10⁻³¹ -144.6 0.178
LEPR VRTN 155.22 0.155 × 10⁻³¹ 0.155 × 10⁻³¹ -147.2 0.213
MC4R PIK3C3 28.05 0.122 × 10⁻⁴ 0.398 × 10⁻⁴ -20.1 0.038
MC4R VRTN 26.57 0.243 × 10⁻⁴ 0.753 × 10⁻⁴ -18.6 0.034
PIK3C3 VRTN 15.95 0.309 × 10⁻² 0.782 × 10⁻² -8.0 0.029
LEP LEPR MC4R 164.57 0.637 × 10⁻³² 0.113 × 10⁻³⁰ -152.6 0.219
LEP LEPR PIK3C3 153.42 0.146 × 10⁻²⁹ 0.113 × 10⁻²⁸ -141.4 0.198
LEP LEPR VRTN 156.43 0.337 × 10⁻³⁰ 0.298 × 10⁻²⁹ -144.4 0.213
LEP MC4R PIK3C3 28.55 0.741 × 10⁻⁴ 0.214 × 10⁻³ -16.5 0.037
LEP MC4R VRTN 27.34 0.125 × 10⁻³ 0.337 × 10⁻³ -15.3 0.035
LEP PIK3C3 VRTN 16.70 0.010 0.025 -4.7 0.028
LEPR MC4R PIK3C3 168.33 0.102 × 10⁻³² 0.316 × 10⁻³⁰ -156.3 0.213
LEPR MC4R VRTN 171.18 0.253 × 10⁻³³ 0.157 × 10⁻³¹ -159.2 0.225
LEPR PIK3C3 VRTN 159.65 0.702 × 10⁻³¹ 0.725 × 10⁻³⁰ -147.7 0.203
MC4R PIK3C3 VRTN 36.69 0.202 × 10⁻⁵ 0.759 × 10⁻⁵ -24.7 0.052
LEP LEPR MC4R PIK3C3 169.02 0.207 × 10⁻³¹ 0.257 × 10⁻³⁰ -153.0 0.217
LEP LEPR MC4R VRTN 172.26 0.433 × 10⁻³² 0.107 × 10⁻³⁰ -156.3 0.233
LEP LEPR PIK3C3 VRTN 160.74 0.112 × 10⁻²⁹ 0.926 × 10⁻²⁹ -144.7 0.211
LEP MC4R PIK3C3 VRTN 37.43 0.958 × 10⁻⁵ 0.330 × 10⁻⁴ -21.4 0.053
LEPR MC4R PIK3C3 VRTN 176.30 0.615 × 10⁻³³ 0.254 × 10⁻³¹ -160.3 0.226
LEP LEPR MC4R PIK3C3 VRTN 177.27 0.862 × 10⁻³² 0.134 × 10⁻³⁰ -157.3 0.232
IMF LEPR VRTN 9.872 0.043 0.096 -1.9 0.038
p value
2ADG, average daily weight gain during test period. BFT, backfat thickness. IMF, intramuscular fat content in theloin.
Genotype pairs
3LRT:likelihood ratio test. The q value of a test measures the proportion of false positives incurred when that
particular test is called significant. ⊿AIC: Diferrence between AIC of the model that includes genetic effects andthat of the exclusive model4Variance(%): the proportion of additive genetic variance accounted for by each genotype
q value3 ⊿AIC3 Variance4
(%)
1Only those pairs for which statiscally significant gene effects were detected are listed for each trait.
Trait2 LRT3
94

Genotype1 Genotype2
EMA LEPR PIK3C3 4.978 0.026 0.97
2EMA, Eye muscle area.
Table 21Table 21Table 21Table 21 Epistatic effects of genotype and the models that include epistaitc effects
for pig production test traits1
4The q value of a test measures the proportion of false positives incurred when that
particular test is called significant
q value4
1Only those pairs for which statiscally significant gene effects were detected are
3LRT = likelihood ratio test
Trait2 Genotype pairs
LRT3 p value
95
96
General Discussion
There have been numerous research to detect the genetic markers
relate with production traits, and it is provided that some examples of
genetic markers that have been available and/or used in pig breeding. But
examples of implement breeding program by using genetic markers in
commercial pig lines were limited, and the methods for incorporating
genetic markers into routine genetic evaluation scheme in pig breeding
organizations are not clear.
In this work, we implicated the investigation to detect genetic
markers on production traits and the evaluation the multiple effects of
genetic markers in commercial Duroc population developed by closed
nucleus breeding system. From first to third part, we researched the
association between gene polymorphism and pig production traits, and
detected that the polymorphism in ADRB3 might affect to eye muscle area
(Chapter 2), the polymorphism in PIK3C3 might effect to growth rate, fat
deposition, and eye muscle area (Chapter 3), and polymorphism in VRTN
might affect intramuscular fat content and body length (Chapter 4).
Thereby, these results suggest that such markers are useful in our Duroc
population.
The application strategies for incorporating marker data into
improvement program are depending on the maker data (as described
below), the traits (e.g. Low heritability traits, sex limited traits, or
slaughter traits), population (e.g. within-breed like a synthetic line, pure
breed line), and the breeding method (e.g. closed nucleus system, open
nucleus system). Therefore, for the purpose of the use of genetic markers
for selection, it needs to clarify the marker types and selection strategies.
97
Dekkers et al. (2004, 2010) distinguished that the genetic marker type for
three types, and selection strategies for four types.
About the genetic marker, Dekkers et al. (2004) defined below three
types.
1) Direct markers: loci that code for the functional mutation.
2) LD markers: loci that are in population-wide linkage
disequilibrium with the functional mutation.
3) LE markers: loci that are in population- wide linkage
equilibrium with the functional mutation in outbred
populations.
Direct markers can be the most useful marker in the three, but it is
difficult to identify, because its causality with quantitative traits is
difficult to prove and, as a result, a number of available examples are still
very limited. Whereas direct markers, LD markers have less degree,
which can be useful markers because there are consistent association
between genotype and phenotype. On the other hand, the LE markers can
be readily detected on a genome-wide basis by using experimental crosses,
and there are many examples of successful reports for detection of QTL
regions. However, it needs to reanalyze whether these previously reported
LE markers is available in other population before it is applied to actual
selection. Although we detected correlation between gene mutation of
ADRB3, PIK3C3, VRTN and pig production traits in this study, these
associations have been assessed in a few breeds and strain. Therefore, this
mutation should be considered as LE markers at present stage.
After that, it needs to decide when and how the maker data should

98
be incorporate into individual selection. Dekkers et al. (2010) proposed
that four strategies at the selection stage.
1) Strategy 1(Marker-alone selection); Selection on marker data or
marker-based BV alone.
2) Strategy 2 (Tandem selection); Selection of candidates on marker
genotype or marker-based BV, followed by selection on
phenotype-based BV.
3) Strategy 3 (Index selection); Simultaneous selection on a
combination of marker data and phenotype-based BV.
4) Strategy 4 (Preselection); Preselection on maker data at a young
age, followed by selection on phenotype-based BV
Most genetic improvement in pig is based on selection for economical
traits that are quantitative traits in pure breed in Japan. These traits are
dominated by numerous polygenes that have respective little effect.
Although several QTLs that may have relatively large effect were reported,
it is much limited the proportion of genetic variance accounted for by those
QTLs. Therefore, Index selection (Strategy3) is expected to be the most
advantageous for incorporating the marker information into genetic
evaluation in practical breeding program to combine selection on the
marker data with selection on the phenotype-based BV. It is because that
can capture the all QTL and polygenic effect, which include those are not
captured by the marker data (Dekkers et al., 2010). Fernando and
Grossman (1989) established the method that optimally combines marker
and phenotypic information, which is called MABLUP (Marker assisted

99
BLUP) and that could predict BV by directly incorporating genetic
markers in routine mixed-animal model BLUP.
In the approach of Fernando and Grossman (1989), LE maker data
was treated as random effect for each QTL in order to incorporate into
MABLUP model. On the other hand, Van Arendonk et al (1999) reported
that LD or direct marker data could be incorporated in existing genetic
evaluation procedures as fixed effects. However, the object of the
molecular genetics for improvement of livestock is not to identify the
responsible gene that can directly influence traits, but to select the
animals that have superior genetic talent from own population. Therefore,
it is sufficient to utilize the LE marker as the DNA marker, which
segregates in specific population for increasing selection efficiency,
particularly, in the inbreeding such as Japanese closed nucleus breeding
systems that have no genetic introduction from other populations except
for base population.
LE marker might not be completely consistent the traits at the early
generation in closed nucleus population, because animals in base
population are generally introduced from various strains and the genetic
background of individuals might be much different. However, Uemoto et al.
(2010) indicated that LE marker information might be available as
selection criteria by simultaneously using with polygenic breeding values
in the limited number of animals at early generation in the closed nucleus
breeding population, if the marker effect is sufficiently high.
Furthermore, the study in the chapter 5 suggested that simultaneous
addition of multiple appropriate markers might be useful to predict
individual genetic traits more accurately. Thus, our study suggests that
100
the two step strategy lead the efficient implicating the strain development
with using genetic marker, which is consisted by step 1; choosing the
appropriate markers at early generation, and step 2; predicting individual
genetic talent by phenotype based BLUP which include some marker
effects as fixed effect.
Circumstances surrounding the pork industry in Japan are
extremely severed, which is under the increase in production costs due to
higher feed, declining market price in increasing cheap imports pork. In
order to overcome this situation, there is a strong demand for the
development of technology that can improve efficiently pig strain that can
be produced safe delicious pork consumers expect at low cost.
In the breeding of pigs, the genetic evaluation under the
mathematical procedure after collecting traits data for several generations
has been conducted as the main method, regardless of large or small
population. However, recent techniques that can incorporate the genetic
information into practical breeding program and perform individual
genetic evaluation correctly have been developed. This study presented
important implications for efficiency improvement by breeding methods
using marker effects, even with not identifying the responsible gene.
Therefore, it is important that future improvements carried out breeding
using the information these markers.
The several parts of this study were published at Animal Science
Jornal 80, 624-630 (Chapter2), Animal Science Jornal 82, 46-51
(Chapter3), Animal Science Jornal 84, 213-221 (Chapter4), and Animal
Science Jornal 85, 198-206 (Chapter5).

101
Acknowledgement
My deepest appreciation goes to Prof. Tatsuya Takizawa who
provided carefully considered feedback and valuable comments.
The author also indebt to Prof. Kazuaki Tanaka who gave me
invaluable comments and warm encouragements.
I would like to thank Dr. Kazuo Fukawa, and Mr. Tetsuya Ito whose
comments and suggestions were innumerably valuable throughout the
course of my study.
To the staff, Mr. Teruhiro Izumita and Mr. Mikiya Sugawara at
Zen-noh Livestock co.ltd., I am grateful for helping me to support in some
experiments in this work.
I would like to express thank to Ms. Mariko Nakamura at Azabu
University, Dr. Takashi Awata, Dr. Satoshi Mikawa, Dr. Aisaku Arakawa
at National Institute of Agrobiological Sciences, Dr. Naohiko Okumura,
Ms. Naoe Kanaya, and Ms. Ayumi Mikawa at JATAFF Institute for
contributing to progress this work.
This study was performed as a pig breeding program in Central
Research Institute for Feed and Livestock, ZEN-NOH. The auther is
grateful to Mr. Masayuki Ueda, Mr. Yoich Hayashi, Mr. Takashi Sasaki,
Mr. Takeo Tachibana, and Dr. Go Noguchi for the approval and support for
this study.
And last, but not the least, I would like to thank my family; my wife,
Keiko, my parents, and my brothers for their continued support and warm
encouragements.

102
REFERENCES
Akaike, H. 1974. A new look at the statistical identification model. IEEE
Transactions on Automatic Control 19, 716-723.
Akaike, H. 1987. Factor analysis and AIC. Psychometrika 52, 317-332.
Arch, J. R. and Kaumann, A. J. 1993. Beta 3 and atypical
beta-adrenoreceptors. Medicinal Research Reviews 13, 663-729.
Bereskin, B. and Steele, N. C. 1988. Estimates of genetic parameters for
carcass measures of body composition and growth in swine.
Journal of Animal Science 66, 2498-2507.
Benjamini, Y. and Hochberg, Y. 1995. Controlling the false discovery rate:
a practical and powerful approach to multiple testing. Journal of
the Royal Statistical Society. Series B 57, 289-300.
Bidanel, J. P., Milan, D., Iannuccelli, N., Amigues, Y., Boscher, M. Y.,
Bourgeois, F., Caritez, J. C., Gruand, J., Roy, P. L., Lagant, H.,
Quintanilla, R., Renard, C., Gellin, J., Ollivier, L. and Chevalet,
C. 2001. Detection of quantitative trait loci for growth and
fatness in pigs. Genetics Selection Evolution 33, 289-309.
Bidanel, J.P., Milan, D. and Woloszyn, N. 1998. Mapping of QTLs in F2
crosses between Meishan and Large White pig breeds. In:

103
Proceedings of the XXVIth International Conference on Animal
Genetics. International Society for Animal Genetics, Auckland,
pp. 105.
Bruun, C.S., Jorgensen, C.B., Nielsen, V.H., Andersson, L. and Fredholm,
M., 2006. Evaluation of the porcine melanocortin 4 receptor
(MC4R) gene as a positional candidate for a fatness QTL in a
cross between Landrace and Hampshire. Animal Genetics 37,
359-362.
Cecil, J.E., Palmer, C.N., Fischer, B., Watt, P., Wallis, D.J., Murrie, I. and
Hetherington, M.M. 2007. Variants of the peroxisome
proliferator-activated receptor gamma- and beta-adrenergic
receptor genes are associated with measures of compensatory
eating behaviors in young children. The American Journal of
Clinical Nutrition 86, 167-173.
Chen, C.C., Chang, T. and Su, H.Y. 2004. Characterization of porcine
leptin receptor polymorphisms and their association with
reproduction and production traits. Animal Biotechnology 15,
89-102.
Chen, J., Yang, X.J., Xia, D., Chen, J., Wegner, J., Jiang, Z. and Zhao, R.Q.
2008. SREBF1 expression and genetic polymorphism
significantly affect intramuscular fat deposition in the
longissimus muscle of Erhualian and Sutai pigs. Journal of
104
Animal Science 86, 57-63.
Chikuni, K., Horiuchi, A., Ide, H., Shibata, M., Hayashi, T., Nakajima, I.,
Oe, M. and Muroya, S. 2008. Nucleotide sequence
polymorphisms of beta1-, beta2-, and beta3-adrenergic receptor
genes on Jinhua, Meishan, Duroc and Landrace pigs. Animal
Science Journal 79, 665-672.
Ciobanu, D.C., Lonergan, S.M. and Huff-Lonergan, E.J. 2011. Genetics of
meat quality and carcass traits. In: Rothschild, M.F. and
Ruvinsky, A. (eds), The genetics of the pig 2nd edn, 355-389.
CAB International, New York, NY.
Cieslak, J., Nowacka-Woszuk, J., Bartz, M., Fijak-Nowak, H., Grzes, M.,
Szydlowski, M. and Switonski,M. 2009. Association studies on
the porcine RETN, UCP1, UCP3 and ADRB3 genes
polymorphism with fatness traits. Meat Science 81, 551-554.
Clement, K., Vaisse, C., Manning, B.S., Basdevant, A., Guy-Grand B, Ruiz
J, Silver KD, Shuldiner AR, Froguel P, Strosberg AD. 1995.
Genetic variation in the beta 3-adrenergic receptor and an
increased capacity to gain weight in patients with morbid obesity.
The New England Journal of Medicine 333, 352- 354.
Clutter, A.C. 2010. Genetic of performance traits. In: Rothschild, M.F. and
Ruvinsky, A.. (eds), The genetics of the pig 2nd edn, 325-354.

105
CAB International, New York, NY.
Cockerham, C.C. 1954. An extension of the concept of partitioning
hereditary variance for analysis of covariances among relatives
when epistasis is present. Genetics 39, 859-882.
Corella, D., Guillen, M., Portoles, O., Sorli, J.V., Alonso, V., Folch, J. and
Saiz, C. 2001. Gender specific associations of the Trp64Arg
mutation in the beta3-adrenergic receptor gene with
obesity-related phenotypes in a Mediterranean population:
interaction with a common lipoprotein lipase gene variation.
Journal of Internal Medicine 250, 348-360.
Czech, M.P. and Corvera, S. 1999. Signaling mechanisms that regulate
glucose transport. The Journal of Biological Chemistry 274,
1865-1868.
de Koning, D. J., Rattink, A. P. Harlizius, B., van Arendonk, J.A.,
Brascamp, E.W. and Groenen. M.A. 2000. Genome-wide scan for
body composition in pigs reveals important role of imprinting.
Proceeding of National Academy Science. USA 97, 7947-7950.
de Koning, D. J., Janss, L. L., Rattink, A.P., van Oers, P.A., de Vries, B.J.,
M. A. Groenen, van der Poel, J.J., de Groot, P.N., Brascamp, E.W.
and van Arendonk, J.A. 1999. Detection of quantitative trait loci
for backfat thickness and intramuscular fat content in pigs (Sus
scrofa). Genetics 152, 1679-1690.

106
de Oliveira Peixoto J, Guimaraes, S.E.F., Lopes, P.S., Soares, M.A.M.,
Pires, A.V., Barbosa, M.V.G., Torres, R.D.A. and Silva, M.D.A.
2006. Associations of leptin gene polymorphisms with production
traits in pigs. Journal of Animal Breeding and Genetics 123,
378-383.
De Vol, D.L., McKeith, F.K., Bechtel, P.J., Novakofski, J., Shanks, R.D.
and Carr, T.R. 1988. Variation in composition and palatability
traits and relationships between muscle characteristics and
palatability in a random sample of pork carcasses. Journal of
Animal Science 66, 385-395.
Dekkers, J.C.M. 2004. Commercial application of marker- and
gene-assisted selection in livestock: Strategies and lessons.
Journal of Animal Science 82, 313-328.
Dekkers, J.C.M., Mathur, P.K. and Knol, E.F. 2010. Genetic improvement
of the pig. In: Rothschild, M.F. and Ruvinsky, A.. (eds), The
genetics of the pig 2nd edn, 391-425. CAB International, New
York, NY.
Duthie, C., Simm, G., Doeschl-Wilson, A., Kalm, E., Knap, P.W. and Roehe,
R. 2010. Epistatic analysis of carcass characteristics in pigs
reveals genomic interactions between quantitative trait loci
attributable to additive and dominance genetic effects. Journal

107
of Animal Science 88, 2219-2234.
Edwards, D.B., Ernst, C.W., Raney, N.E., Doumit, M.E., Hoge, M.D. and
Bates, R.O. 2008a. QTL mapping in an F2 Duroc × Pietrain
resource population: II. Carcass and meat quality traits. Journal
of Animal Science 86, 254-266.
Edwards, D.B., Ernst, C.W., Tenmpelman, R.J., Rosa, G.J.M., Raney, N.E.,
Hoge, M.D. and Bates RO. 2008b. QTL mapping in an F2 Duroc
× Pietrain resource population: I. Growth traits. Journal of
Animal Science 86, 241-253.
Emorine, L.J., Marullo, S., Briend-Sutren, M.M., Patey, G., Tate, K.,
Delavier-Klutchko, C. and Strosberg, A.D. 1989. Molecular
characterization of the human beta 3-adrenergic receptor.
Science 245, 1118-1121.
Eveline, M., Awemu, I., Kgwatalala, P. and Zhao, X. 2008. A critical
analysis of production-associated DNA polymorphisms. in the
genes of cattle, goat, sheep, and pig. Mammalian Genome 19,
591-617.
Falconer, D.S. 1989. Introduction to quantitative genetics, 3 edn. Harlow,
Longman scientific & Technical.
Fernandez, X., Monin, G., Talmant, A., Mourot, J. and Lebret, B. 1999.
108
Influence of intramuscular fat content on the quality of pig meat;
1. Composition of the lipid fraction and sensory characteristics of
m. longissimus lumborum. Meat Science 53, 59-65.
Fernando, R.L. and Grossman, M. 1989. Marker-assisted selection using
best linear unbiased prediction. Genetics Selection Evolution 21,
467-477.
Forrest, R.H., Hickford, J.G., Hogan, A. and Frampton, C. 2003.
Polymorphism at the ovine beta3-adrenergic receptor locus:
association with birth weight, growth rate, carcass composition
and cold survival. Animal Genetics 34, 19-25.
Forrest, R.H., Hickford, J.G.H. and Frampton, C. 2007. Polymorphism at
the ovine beta3-adrenergic receptor locus (ADRB3) and its
association with lamb mortality. Journal of Animal Science 85,
2801-2806.
Forrest, R.H., Hickford, J.G.H., Wynyard, J., Merrick, N., Hogan, A. and
Frampton, C. 2006. Polymorphism at the β3-adrenergic receptor
(ADRB3) locus of Merino sheep and its association with lamb
mortality. Animal Genetics 37, 465-468.
Fukawa, K., Sugiyama, T., Kusuhara, S., Kudoh, O. and Kameyama, K.
2001. Model selection and genetic parameter estimation for
performance traits, body measurement traits and leg score traits
109
in a closed population of Duroc pigs. Animal Science Journal 72,
97-106.
Fujii, J., Otsu, K., Zorzato, F., de Leon, S., Khanna, V.K., Weiler, J.E.,
O'Brien, P.J. and Maclennan, D.H. 1991. Identification of a
mutation in porcine ryanodin receptor associated with
malignant hyperthermia. Science 253, 448-451.
Gerbens, F., van Erp, A.J., Harders, F.L., Verburg, F.J., Meuwissen,T.H.,
Veerkamp, J.H. and te Pas, M.F. 1999. Effect of genetic variants
of the heart fatty acid-binding protein gene on intramuscular fat
and performance traits in pigs. Journal of Animal Science 77,
846-852.
Gerbens, F., de Koning,D.J., Harders, F.L., Meuwissen, T.H., Janss, L.L,
Groenen, M.A., Veerkamp, J.H., Van Arendonk,J.A. and te Pas,
M.F. 2000. The effect of adipocyte and heart fatty acid-binding
protein genes on intramuscular fat and backfat content in
Meishan crossbred pigs. Journal of Animal Science 78, 552-559.
Grindflek, E., Szyda, J., Liu, Z. and Lien, S. 2001. Detection of
quantitative trait loci for meat quality in a commercial slaughter
pig cross. Mammalian Genome 12, 299-304.
Groeneveld, E., Kovac, M., Wang, T. and Fernando, R.L. 1992. A
generalized computing procedure for setting up and general

110
purpose BLUP package for multivariate prediction and
estimation. Archiv fur Tierzucht 35, 399-412.
Groeneveld, E. 1996. REML VCE a multivariate multi model restricted
maximum likelihood (co) variance component estimation
package version 3.2 user’s guide. Institute of Animal Husbandry
and Animal Behavior, Federal Research Center of Agriculture,
Mariensee, Germany.
Große-Brinkhaus, C., Jonas, E., Bushbell, H., Phatsara, C., Tesfaye, D.,
Jungst, H., Looft, C., Schellander, K. and Tholen, E. 2010.
Epistatic QTL pairs associated with meat quality and carcass
composition traits in a Duroc × Pietrain population. Genetics
Selection Evolution 42, 39.
Hager, H., Cheverud, J.M. and Wolf, J.B. 2012 Genotype-dependent
responses to levels of sibling competition over maternal
resources in mice. Heredity 108,515-520.
Hazel, L.N. 1943. The Genetics basis for constructing selection indexes.
Genetics 2, 476-490.
Hernandez-Sanchez, J.H., Visscher, P., Plastow, G. and Haley, C. 2003.
Candidate gene analysis for quantitative traits using the
transmission disequilibrium test: the example of the
melanocortin 4-receptor in pigs. Genetics 164, 637-644.
111
Hicks, C., Satoh, M., Ishi, K., Kuroki, S. and Fujiwara, T. 1998. Estimates
of genetic parameter for daily gain and carcass traits in swine.
Animal Science Technology 69, 1094-1098.
Hirose, K., Mikawa, S., Okumura, N., Noguchi, G., Fukawa, K., Kanaya,
N., Mikawa, A., Arakawa, A., Ito, T., Hayashi, Y., Tachibana, F.
and Awata, T. 2012. Association of swine vertnin (VRTN) gene
with production traits in Duroc pigs improved using a closed
nucleus breeding system. Animal Science Journal 84, 213-221.
Hirose, K., Ito, T., Fukawa, K., Arakawa, A., Mikawa, S., Hayashi, Y.,
Tanaka, K. Evaluation of effects of multiple candidate genes
(LEP, LEPR, MC4R, PIK3C3, and VRTN) on production traits in
Duroc pigs. 2013. Animal Science Journal, doi:10.1111/asj.12134.
Hirose, K., Nakamura, M., Takizawa, T., Fukawa, K., Ito, T., Ueda, M,
Sasaki, T., Tanaka, K.: An insertion/deletion variant of a
thymine base in exon 2 of the porcine beta 3-adrenergic receptor
gene associated with loin eye muscle area. 2009. Animal Science
Journal 80, 624-630.
Hirose, K., Takizawa, T., Fukawa, K., Ito, T., Ueda, M., Hayashi, Y.,
Tanaka, K. 2011. Association of an SNP marker in exon 24 of a
class 3 phosphoinositide-3-kinase (PIK3C3) gene with
production traits in Duroc pigs. Animal Science Journal 82,
112
46-51.
Houston, R.D., Cameron, N.D. and Rance, K.A. 2004. A melanocortin
4-receptor (MC4R) polymorphism is associated with performance
traits in divergently selected large white pig populations.
Animal Genetics 35, 386-390.
Lee, K.T., Byun, M.J., Kang, K.S., Hwang, H., Park, E.W., Kim, J.M.,
Kim, T.H. and Lee, S.H. 2012. Single nucleotide polymorphism
association study for backfat and intramuscular fat content in
the region between SW2098 and SW1881 on pig chromosome 6.
Jouranal of Animal Science 90, 1081-1087.
Kadowaki, H., Yasuda, K., Iwamoto, K., Otabe, S., Shimokawa, K., Silver,
K., Waltston, J., Yoshinaga, H., Kosaka, K., Yamada, N., Saito,
Y., Hagura, R., Akanuma, Y., Shuldiner, A., Yazaki, Y. and
Kadowaki, T. 1995. A mutation in the beta 3-adrenergic receptor
gene is associated with obesity and hyperinsulinemia in
Japanese subjects. Biochemical and Biophysical Research
Communications 215, 555-660.
Kennes, Y.M., Murphy, B.D., Pothier, F. and Palin, M.F. 2001.
Characterization of swine leptin (LEP) polymorphisms and their
association with production traits. Animal Genetics 32, 215-218.
Kim, J.H., Choi, B.H., Lim, H.T., Park, E.W., Lee, S.H., Seo, B.Y., Cho,
113
I.C., Lee, J.G., Oh, S.J. and Jeon, J.T. 2005b. Characterization of
phosphoinositide-3-kinase, class 3 (PIK3C3) gene and
association tests with quantitative traits in pigs.
Asian-Australasian Journal of Animal Science 18, 1701-1707.
Kim, K.S., Larsen, N., Short, T., Plastow, G. and Rothschild, M.F. 2000. A
missense variant of the porcine melanocortin-4 receptor (MC4R)
gene is associated with fatness, growth, and feed intake traits.
Mammalian Genome 11, 131-135.
Kuhlers, D.L., Nadarajah, K., Jungst, S.B. and Anderson, B.L.. 2001.
Genetic selection for real-time ultrasound loin eye area in a
closed line of Landrace pigs. Livestock Production Science 72,
225-231.
Lo, L.L., MacLaren, D.G., McKeith, F.K., Fernando, R. L. and Novakofski,
J. 1992. Genetic analyses of growth, real-time ultrasound,
carcass, and pork quality traits in Duroc and Landrace pigs: II.
Heritabilities and correlations. Journal of Animal Science 70,
2387-2396.
Lonergan, E.H., Baas, T.J., Malek, M., Dekkers, J.C.M., Prusa, K. and
Rothschild, M.F. 2002. Correlations among selected pork quality
traits. Journal of Animal Science 80, 617-627.
Malek, M., Dekkers, J. C. M., Lee, H.K., Baas, T.J., Prusa, K., Lonergan,
114
E.H. and Rothschild, M.F. 2001. A molecular genome scan
analysis to identify chromosomal regions influencing economic
traits in the pig. II. Meat and muscle composition. Mammalian
Genome 12, 637-645.
Masuo, K., Katsuya, T., Fu, Y., Rakugi, H., Ogihara, T. and Tuck, M.L.
2005. Beta2- and beta3-adrenergic receptor polymorphisms are
related to the onset of weight gain and blood pressure elevation
over 5 years. Circulation 111, 3429-3434.
Mentuccia, D., Proietti-Pannunzi, L., Tanner, K., Bacci, V., Pollin, T.I.,
Poehlman, E.T., Shuldiner, A.R. and Celi, F.S. 2002. Association
between a novel variant of the human type 2 deiodinase gene
Thr92Ala and insulin resistance: evidence of interaction with the
Trp64Arg variant of the beta-3-adrenergic receptor. Diabetes 51,
880-883.
Mikawa, S., Hayashi, T., Nii, M., Shimanuki, S., Morozumi, T. and Awata,
T. 2005. Two quantitative trait loci on Sus scrofa chromosome 1
and 7 affecting number of vertebrae. Journal of Animal Science
83, 2247-2254.
Mikawa, S., Morozumi, T., Shimanuki, S., Hayashi, T., Uenishi, H.,
Domukai, M., Okumura, N. and Awata T. 2007. Fine mapping of
a swine quantitative trait locus for number of vertebrae and
analysis of an orphan nuclear receptor, germ cell number factor

115
(NR6A1). Genome Research 17, 586-593.
Mikawa, S., Sato, S., Nii, M., Morozumi, T., Yoshioka, G., Imaeda, N.,
Yamaguchi, T., Hayashi, T. and Awata, T. 2011. Identification of
a second gene associated with variation in vertebral number in
domestic pigs. BMC genetics 12, 5.
Milan, D., Jeon, J.T., Looft, C., Amarger, V., Theander, M., Robic, A.,
Rongel-Gaillard,C., Pauls, S., Iannuccelli,N., Rask, L., Ronne, L..,
Lundstrom, K., Reinsch, N., Gellin, J., Kalm, E., Le, Roy, P.,
Chandon, P. and Andersson, L.. 2000 A mutation in PRKAG3
associated with excess glycogen content in pig skeletal muscle.
Science 288, 1248-1251.
Montgomery, S., and Excoffier L. 1996. Testing for linkage disequilibrium
in genotypic data using the Expectation-Maximization algorithm.
Heredity 76, 377-383.
Munoz, G., Alcazar, E., Fernandez, A., Barragan, C., Carrasco, A.,de Pedro
E., Silio, L., Sanchez, J.L. and Rodriguez, M.C. 2011. Effects of
porcine MC4R and LEPR polymorphisms, gender and Duroc sire
line on economic traits in Duroc× Iberian crossbred pigs. Meat
Science 88, 169-173.
Munoz, G., Ovilo, C., Silio, L., Tomas, A., Noguera, J.L. and Rodriguez,
M.C. 2009. Single- and joint-population analyses of two

116
experimental pig crosses to confirm quantitative trait locion Sus
scrofa chromosome 6 and leptin receptor effects on fatness and
growth traits. Journal of Animal Science 87, 459-468.
Nahmias, C., Blin, N., Elalouf, J.M., Mattei, M.G., Strosberg, A.D. and
Emorine, L.J. 1991. Molecular characterization of the mouse
beta 3-adrenergic receptor: relationship with the atypical
receptor of adipocytes. EMBO Journal 10, 3721-3727.
Newcom, D.W., Baas, T. J., Schwab, C. R. and Stalder, K. J. 2005. Genetic
and phenotypic relationships between individual subcutaneous
backfat layers and percentage of longissimus intramuscular fat
in Duroc swine. Journal of Animal Science 83, 316-323.
Carlborg, Ö., Kerje, S., Schütz, K., Jacobsson, L., Jensen, P., and
Andersson, L., 2003. A global search reveals epistatic interaction
between QTL for early growth in the chicken. Genome Research
13, 413-421.
Ovilo, C., Oliver, A., Noguera, J.L., Clop, A., Barragan, C., Varona, L.,
Rodriguez, C., Toro, M., Sanchez, A., Perez-Enciso, M. and Silio,
L. 2002. Test for positional candidate genes for body composition
on pig chromosome 6. Genetics Selection Evolution 34, 465-479.
Ovilo, C., Perez-Enciso, M., Barragan, C., Clop, A., Rodriguez, C., Oliver,
M.A., Toro, M. and Noguera, J.L. 2000. A QTL for intramuscular

117
fat and backfat thickness is located on porcine Chromosome 6.
Mammalian Genome 11, 344-346.
Ovilo C, Fernandez A, Noguera JL, Barragan C, LetonR, Rodriguez C,
Mercade A, Alves E, Folch JM, VaronaL, Toro M. 2005. Fine
mapping of porcine chromosome 6QTL and LEPR effects on body
composition in multiple generations of an Iberian by Landrace
intercross. GeneticsResearch 85, 57-67.
Ovilo, C., Fernandez, A., Rodriguez, M.C., Nieto, M. and Silio, L. 2006.
Association of MC4R gene variants with growth, fatness, carcass
composition and meat and fat quality traits in heavy pigs. Meat
Science 73, 42-47.
Park, H.B., Carlborg, O., Marklund, S. and Andersson, L. 2002.
Melanocortin-4 receptor (MC4R) genotypes have no major effect
on fatness in a Large White × Wild Boar intercross. Animal
Genetics 33, 155-157.
Patterson, H.D. and Thompson, R. 1971. Recovery of inter-block
information when block sizes are unequal. Biometrika 58,
545-554.
Perez-Enciso, M., and Misztal, I. 2004. Qxpak: a versatile mixed model
application for genetical genomics and QTL analyses.
Bioinformatics 20, 2792-2798.
118
Perusse, L., Rankunen, T., Zeberi, A., Chagnon, Y.C., Weisnagel, S.J.,
Argyropoulos, G., Walts, B., Snyder, E.E. and Bouchard, C. 2005.
The human obesity gene map: the 2004 update. Obesity
Research 13, 381-490.
Prasad, S.V.N., Laporte, S.A., Chamberlain, D., Caron, M.G., Barak, L.
and Rockman, H.A. 2002. Phosphoinositide 3-kinase regulates
β2-adrenergic receptor endocytosis by AP-2 recruitment to the
receptor/β-arrestin complex. The Journal of Cell Biology 158,
563-575.
Rodríguez, E., Monjo, M., Rodríguez-Cuenca S., Pujol, E., Amengual, B.,
Roca, P., Palou, A. 2001. Sexual dimorphism in the adrenergic
control of rat brown adipose tissue response to overfeeding.
Pflügers Archiv 442, 396-403.
Rodriguez, M.C., Fernandez, A., Carrasco, C., Gracia, A., Gomez, E.,de
Mercado, E., Lopez, M.A., Ovilo, C. and Silio, L. 2010. Effect of
LEPR c.2002C>T polymorphism on growth and feed intake in
heavy Duroc × Iberian pigs. 9th World Congress on Genetics
applied to Livestock Production, Leipzig, Germany.
Salces, A. J., Seo, K.S., Cho, K.H., Kim, S. and Young Lee, Y.C. 2006.
Genetic parameter estimation of carcass traits of Duroc
predicted using ultrasound scanning modes. Asian-Australasian
Journal of Animal Science 19, 1379-1383.
119
Sanchez, M.P., Iannuccelli, N., Basso, B., Bidanel, J.P., Billon, Y.,
Gandemer, G., Gilbert, H., Larzul, C., Legault, C., Riquet, J.,
Milan, D. and Roy, P.L. 2007. Identification of QTL with effects
on intramuscular fat content and fatty acid composition in a
Duroc × Large White cross. BMC Genetics 8, 55.
Satoh, M. 2000. A program for computing inbreeding coefficients from
large data sets. Japanese Journal of Swine Science 37, 122-126.
Sato, S., Hasebe, H., Sato, S., Asahi, Y., Hayashi, T., Kobayashi, E.,
Sugimoto, Y. 2006. High-resolution physical mapping and
construction of a porcine contig spanning the intramuscular fat
content QTL. Animal Genetics 37, 113-120.
Sato, S., Oyamada, Y., Atsuji, K., Nade, T., Sato, S., Kobayashi, E.,
Mitsuhashi, T., Nirasawa, K., Komatsda, A., Saito, Y., Terai, S.,
Hayashi, T. and Sugimoto, Y. 2003. Quantitative trait loci
analysis for growth and carcass traits in a Meishan × Duroc F2
resource population. Journal of Animal Science 81, 2938-2949.
Shepherd, P.R., Withers, D.J. and Siddle, K. 1998. Phosphoinositide
3-kinase: the key switch mechanism in insulin signaling.
Biochemistry Journal 333, 471-490.
Silver, K., Mitchell, B.D., Walston, J., Sorkin, J.D., Stern, M.P., Roth, J.

120
and Shuldiner, A.R. 1997. TRP64ARG beta 3-adrenergic receptor
and obesity in Mexican Americans. Human Genetics 101,
306-311.
Soma, T., Uemoto, Y., Sato, S., Shibata, T., Kadowaki, H., Kobayashi, E.
and Suzuki, K. 2011. Genome-wide mapping and identification of
new quantitative trait loci affecting meat production, meat
quality, and carcass traits within a Duroc purebred population.
Journal of Animal Science 89, 601-608.
Stewert, T.S. and Schinckel, A.P. 1989. Genetic parameters for swine
growth and carcass traits. In: Young LD (ed.), Genetics of Swine,
pp.77-79. USDA-ARS, Nebraska.
Stopkova P, Saito T, Papolos D, Vevera J, Paclt I, Zukov I, Bersson BY,
Margolis BA, Strous RD, Lachman HM. 2004. Identification of
PIK3C3 promoter variant associated with bipolar disorder and
schizophrenia. Biological Psychiatry 55, 981-988.
Stratil A, Peelman L, Van Poucke M, Cepia S. 1997. A Hinf I PCR-RFLP at
the porcine leptin (LEP) gene. Animal Genetics 28, 371-372.
Strosberg AD, Gerhardt CC. 2000. Structure and function of the
β3-adrenoreceptor. In: Strosberg AD (ed.), Theβ3-adrenoreceptor,
pp. 1-19. Taylor & Francis, NewYork.

121
Suzuki, K., Kadowaki, H., Shibata, T., Uchida, H., and Nishida, A.
Selection for daily gain, loin-eye area, backfat thickness and
intramuscular fat based on desired gains over seven generations
of Duroc pigs. 2005. Livestock Production Science 97, 193-202.
Szyda, J., E. Grindflek, Z. Liu, and S. Lien. 2003. Multivariate mixed
inheritance models for QTL detection on porcine chromosome 6.
Genetic Research 81, 65-73.
Tanaka, K., Iwaki, Y., Takizawa, T., Murakami, M., Mannen, H., Maeda,
Y., Kurosawa, Y., Dang, V., Phith, L.C., Bouahom, B., Yamamoto,
Y., Daing, T. and Namikawa, T. 2007. The novel polymorphism
of the beta 3-adrenergic receptor gene and its distribution in
domestic pigs and wild boars in Asia. Animal Science Journal 78,
243-250.
Uemoto, Y., Suzuki, K., Kobayashi, E., Sato, S., Shibata, T., Kadowaki, H.
and Nishida, A. 2007. Effects of Heart Fatty Acid-binding
Protein Genotype on Intramuscular Fat Content in Duroc Pigs
Selected for Meat Production and Meat Quality Traits.
Asian-Australasian Journal of Animal Science 20, 622-626.
Uemoto, Y., Kikuchi, T., Nakano, H., Stato, S., Shibata, T., Kadowaki, H.,
Katoh, K., Kobayashi, E. and Suzuki K. 2012. Effects of porcine
leptin receptor gene polymorphisms on backfat thickness, fat
area ratios by image analysis, and serum leptin concentrations
122
in a Duroc purebred population. Animal Science Journal 83,
375-385.
Uemoto, Y. 2010. Study for implication of porcine QTL information in pig
improvement. PhD Thesis, Tohoku University, Sendai, Japan.
Uemoto, Y., Nagamine, Y., Kobayashi, E., Sato, S., Tayama, T., Suda, Y.,
Shibata, T. and Suzuki, K. 2008. Quantitative trait loci analysis
on Sus scrofa chromosome 7 for meat production, meat quality,
and carcass traits within a Duroc purebred population. Journal
of Animal Science 86, 2833-2839.
Uleberg, E., Wideroe, I.S., Grindflek, E., Szyda, J., Lien, S., and
Meuwissen, T.H. 2005. Fine mapping of a QTL for intramuscular
fat on porcine chromosome 6 using combined linkage and linkage
disequilibrium mapping. Journal of Animal Breeding and
Genetics 122, 1-6.
Van Arendonk, J. A. M., Bink, M. C. A. M., Bijma, P. M., Bovenhuis, H., de
Koning, D.J. and Brascamp, E.W. 1999. Use of molecular data
for genetic evaluation of livestock. From Jay Lush to Genomics:
Visions for Animal Breeding and Genetics. Dekkers, J.C.M.,
Lamont, S.J. and Rothschild, M.F. eds. Dept. Animal Science,
Iowa State University, Ames. USA.
Wada, Y., Akita, T., Awata, T., Furukawa, T., Sugai, N., Inage, Y., Ishii, K.,
123
Ito, Y., Kobayashi, E. and Kusumoto, H. 2000. Quantitative trait
loci (QTL) analysis in a Meishan × Gottingen cross population.
Animal Genetics 31, 376-384.
Wada, Y. and Kashiwagi, N. 1990. Selecting statistical models with
information statistics. Journal of Dairy Science 73, 3575-3582.
Wood, J.D., Enser, M., Moncrieff, C.B. and Kempster, A.J. 1988. Effects of
carcass fatness and sex on the composition and quality of pig
meat. Proceeding 34th International Congress of Meat Science
and Technology, Brisbane, Australia. 562-564.
Yue, G., Stratil, A., Kopecny, M., Schroffelova, D., Schroffel, J., Hojny, J.,
Cepica, S., Davoli, R., Zambonelli, P., Brunsch, C., Sternstein, I.,
Moser, G., Bartenschlager, H., Reiner, G. and Geldermann H.
2003. Linkage and QTL mapping for Sus scrofa chromosome 6.
Journal of Animal Breeding and Genetics 120, 45-55.
Zhang, J.H., Xiong, Y.Z., Zuo, B., Lei, M.G., Jiang, S.W., Li, F.E., Zheng,
R., Li, J.L. and Xu, D.Q. 2007. Quantitative trait loci for carcass
traits on pig chromosomes 4, 6, 7, 8 and 13. Journal of Applied
Genetics 48, 363-369.

124
SummarySummarySummarySummary
General iGeneral iGeneral iGeneral introductionntroductionntroductionntroduction
In recent years, the business performance in Japanese pig industry
have deteriorated by increasing production costs due to higher feed
prices and imports of low price pork from abroad, and pig herd size in
Japan which recorded 12 million heads in 1989 is a steadily decreasing
every year. It is required the efficiency of pig productivity by improving
of feeding and management technology, and breeding pigs that have
superior genetic talent in order to stabilize the domestic pig production
management.
For conducting improvements of breeding pigs, pure breed such as
Landrace, Large White, or Duroc have been mainly used in Japan. The
methods in breeding scheme are distinguished between open nucleus
breeding system and closed nucleus breeding system. Open nucleus
breeding system is the method conducted by the improvement of desired
traits of the population with introducing genetic resources continuously
from other populations, which is mainly performed in private breeders in
Japan. On the other hands, closed nucleus breeding systems is uniquely
developed in Japan, which is mainly performed in public breeders such as
local governmental institute or National Agricultural Co-operative
(ZEN-NOH). The closed nucleus breeding scheme is performed by
repeating the selection superior pigs through about five generations in the
isolated population, in which new genetic resources are not introduced
from other populations.
In any case, the traits for improvement are mainly quantitative
traits such as production traits, fertility traits, or meat quality, which are

125
dominated by numerous polygenes that have complicated relationship. In
modern breeding works, most genetic progress for quantitative traits in
livestock has been performed by predicting the genetic value which is
called an estimated breeding value that are calculated by means of
statistical model such as BLUP (Best linear unbiased prediction) method.
Recently, many approach that implicate genetic evaluation of
individuals by not only phenotype-based method, but by gaining insight
into the “black box” of quantitative traits with using molecular genetic
information have been investigated in order to increase selection accuracy
and decreasing generation intervals. Although many candidate genetic
markers have been detected, the genetic makers that are available in the
industry were very limited. The aims of this study were to evaluate
genetic effect of genes that might affect productive traits in the Duroc
population, and to establish the breeding scheme by adding genotype
information. Duroc pigs used entirely in this study were from a line
selected through five generations at Central Research Institute for Feed
and Livestock ZEN-NOH (Hokkaido, Japan) from 2004 to 2010.
CHAPTER 1. CHAPTER 1. CHAPTER 1. CHAPTER 1. BrBrBrBreeding experiments on strain deveeding experiments on strain deveeding experiments on strain deveeding experiments on strain development in Durocelopment in Durocelopment in Durocelopment in Duroc pigs pigs pigs pigs
The Strain development with Duroc was performed through five
generations to develop a line which has excellent production trait and
meat quality to be used as terminal sire. Average daily weight gain (ADG),
backfat thickness (BFT), and intramuscular fat content in the loin (IMF)
were configured as improvement traits in this population. The pigs were
selected mainly based on animal model BLUP of breeding value of each
traits. Average phenotypic values of the ADG and BFT of boars at the fifth

126
generation significant increased by 44g/day, 0.21cm compared with first
generation, respectively. But phenotypic value of IMF decreased 0.31%.
The each breeding value of ADG, BFT, and IMF at the fifth generation
significantly increased by 82 g/day, 0.32cm, and 0.83% compared with
those of the first generation, respectively. An average inbreeding
coefficient and average relationship coefficient of selected pigs at fifth
generation were 3.02%, 10.09%, respectively. And all selected pig at fifth
generation had relationship each other.
CHAPTER 2CHAPTER 2CHAPTER 2CHAPTER 2. . . . AAAAssociation of ssociation of ssociation of ssociation of porcine beta 3porcine beta 3porcine beta 3porcine beta 3----adrenergic receptor gene adrenergic receptor gene adrenergic receptor gene adrenergic receptor gene
((((ADRB3ADRB3ADRB3ADRB3) gene ) gene ) gene ) gene with with with with production traits in Duroc pigsproduction traits in Duroc pigsproduction traits in Duroc pigsproduction traits in Duroc pigs
An insertion/deletion variant of a thymine base (T5 and T6) in exon
2 of porcine beta 3-adrenergic receptor (ADRB3) gene has been described.
In the current study, we made an association study between the ADRB3
polymorphisms and production traits in 735 Duroc pigs. The allele
frequencies for the T5 and T6 alleles in our study population were 0.567
and 0.433, respectively. Any associations were not detected between
ADRB3 genotype and average daily weight gain during test period, or
backfat thickness and intramuscular fat content in either sex. However
the size of the loin eye muscle area (EMA) was significantly associated
with ADRB3 genotypes in gilts. T6-homozygous gilts had a 2.5cm2 higher
mean of EMA than T5-homozygous gilts. This association was not detected
in males. In addition, a multiple traits animal model best linear unbiased
predictor (BLUP) analysis revealed that the T6-homozygous genotype had
positive effects on breeding value of EMA. Accordingly, we suggest that
ADRB3 polymorphism has the potential to be an important genetic

127
marker for prediction of EMA in Duroc pigs.
CCCCHAPTER 3HAPTER 3HAPTER 3HAPTER 3. . . . Association of porcine class 3 phosphoinositideAssociation of porcine class 3 phosphoinositideAssociation of porcine class 3 phosphoinositideAssociation of porcine class 3 phosphoinositide----3333----kinase kinase kinase kinase
((((PIK3C3PIK3C3PIK3C3PIK3C3) gene with production traits in Duroc pigs) gene with production traits in Duroc pigs) gene with production traits in Duroc pigs) gene with production traits in Duroc pigs
A C↔T SNP on exon 24 of the porcine class 3 phosphoinositide - 3 -
kinase (PIK3C3) gene is considered a possible genetic marker for selecting
backfat (BF) thickness and carcass fat, although only one study has
published results on its effects by performing experiments on a single
resource family. In this chapter, we analyzed the association of this
PIK3C3 polymorphism with production traits in our Duroc line in order to
reveal the utility of this gene as a genetic marker. The C allele frequency
at fourth generation was 75.2%, and significantly increased from second
generation (63.5%). PIK3C3 polymorphism showed significant effects on
ADG, BFT, IMF, and EMA, and the C alleles have increase effect on ADG,
BFT, and IMF, and decrease effect on EMA. The predicted differences in
traits between the homozygous pigs of the C and T alleles were 40 g/day
for DG, 1.2 mm for BF, 0.44% for IMF, and 1.6 cm2 for EMA. Furthermore,
the statistical models for estimating the breeding values of each trait had
lower Akaike’s information criterion (AIC) values when adding PIK3C3
genotype information. We therefore confirmed that the c.2604C<T
polymorphism in PIK3C3 has the potential to be a genetic marker for
production traits in our Duroc line.
CHAPTER 4. Association of porcineCHAPTER 4. Association of porcineCHAPTER 4. Association of porcineCHAPTER 4. Association of porcine VertninVertninVertninVertnin((((VRTNVRTNVRTNVRTN) gene with production ) gene with production ) gene with production ) gene with production
traits in Duroc pigstraits in Duroc pigstraits in Duroc pigstraits in Duroc pigs
Vertebral number is related to body size in pigs, and many reports
128
have suggested presence of an association between body length and meat
production traits. Previous study revealed that variation in the vertebral
number of Western breed (Duroc, Landrace, and Large white) is strongly
associated with haplotype of Vertnin (VRTN) gene that is located on Sus
scrofa chromosome 7. However, the relationship between Q and Wt
haplotypes of VRTN gene and the production traits such as growth rate,
fat deposition, or meat quality have not been investigated. In this chapter,
we analyzed the association between the VRTN genotype and the
production and body composition traits in Duroc pigs. The VRTN genotype
was closely related to body length in a similar to previous studies, and the
Q/Q genotype individuals (100.0 cm) were longer than individuals with the
Wt/Q (99.5 cm) and Wt/Wt genotypes (98.9 cm). Intramuscular fat content
(IMF) in the longissimus muscle was significantly associated with the
VRTN genotype. The mean IMF of individuals with the wild-type genotype
(Wt/Wt) (5.22%) was greater than that of individuals with the Wt/Q
(4.99%) and Q/Q genotypes (4.79%). In addition, the Wt allele had a
positive effect on the IMF breeding value. No associations were observed
between the VRTN genotype and other production traits. These results
suggest VRTN has the potential to act as a genetic marker of IMF in
Duroc population.
CHAPTER 5. CHAPTER 5. CHAPTER 5. CHAPTER 5. Evaluation of effects of multiple candidate genes (Evaluation of effects of multiple candidate genes (Evaluation of effects of multiple candidate genes (Evaluation of effects of multiple candidate genes (LEPLEPLEPLEP, , , ,
LEPRLEPRLEPRLEPR, , , , MC4RMC4RMC4RMC4R, , , , PIK3C3PIK3C3PIK3C3PIK3C3, and , and , and , and VRTNVRTNVRTNVRTN) on ) on ) on ) on production traits in Duroc pigsproduction traits in Duroc pigsproduction traits in Duroc pigsproduction traits in Duroc pigs
Numerous studies have been detected the genetic marker for the
improvement of traits. Although several dozen of candidate genes were
detected as genetic marker might be related with backfat thickness, most

129
study reported single marker effect only. Production traits such as
average daily weight gain (ADG) or backfat thickness (BFT) are typical
quantitative traits under the control of multiple genes. In this chapter, we
evaluated single and combination effects of genetic variations of five
candidate loci (LEP, LEPR, MC4R, PIK3C3, and VRTN) on four
production traits (ADG, BFT, EMA, IMF) in 1414 Duroc pigs.
Polymorphisms in LEPR, MC4R, and PIK3C3 had significant single gene
effects on ADG and BFT. The additive genetic variance in ADG and BFT
(16.99% and 22.51%, respectively) was explained by genetic effects of
these three loci. No correlations were observed between the LEP genotype
and production traits in this study. There were no epistatic effects between
all selected combinations of loci pairs and analyzed traits, except for a pair
of LEPR and PIK3C3. A marginally epistatic effect on EMA was detected
between this loci pair, however, this effect did not reach statistical
significance after FDR correction. These results suggested that LEPR,
MC4R, PIK3C3, and VRTN may influence ADG and fat deposition
independently of each other loci. Furthermore, we compared the fitness of
the statistical models for predicting the breeding values that included
multiple gene effects by Akaike’s information criterion (AIC) values. The
models which included three genes effects (LEPR, MC4R, and PIK3C3) for
ADG, four genes effects (LEPR, MC4R, PIK3C3, and VRTN ) for BFT, and
two genes effects (LEPR and VRTN) for IMF as fixed effects showed the
most favorable in this study, respectively. This study suggested that
addition of multiple appropriate markers into mathematical model as
fixed effect might be useful to predict individual genetic traits more
accurately.

130
GGGGeneral discussioneneral discussioneneral discussioneneral discussion
Most genetic improvements in Japanese pig industry are based on
selection for economical traits in pure breed population such as Landrace,
Large White, or Duroc. These traits are quantitative traits dominated by
numerous polygenes that have respective little effect. Although several
QTLs that may have relatively large effect were reported, it is much
limited the proportion of genetic variance accounted for by those QTLs.
Therefore, index selection method which is called MABLUP (Marker-
Assisted BLUP) is expected to be the most advantageous for incorporating
the marker information into genetic evaluation in practical breeding
program to combine selection on the marker data with selection on the
phenotype-based BV. It is because that can capture the all QTL and
polygenic effect, which include those are not captured by the marker data.
Furthermore, it is sufficient to utilize the LE marker (loci shows linkage
equilibrium with the functional mutation in particular population) as the
DNA marker, which segregates in specific population for increasing
selection efficiency in the inbreeding such as Japanese closed nucleus
breeding systems that have no genetic introduction from other populations
except for base population. Present study in the Chapter 5 suggested that
simultaneous addition of multiple appropriate markers might be useful to
predict individual genetic traits more accurately. Thus, the present study
suggested that the two step strategy lead the efficient implicating the
strain development with using genetic marker, which is consisted by step
1; choosing the appropriate markers at early generation, and step 2;
predicting individual genetic talent by phenotype based BLUP which
include some marker effects as fixed effect. This study presented useful

131
genetic maker information and the statistical methods for incorporating
genetic marker effects into improvement pigs by closed nucleus breeding
scheme.