genetic variation in preferences for giving … variation in preferences for... · are grateful to...
TRANSCRIPT
GENETIC VARIATION IN PREFERENCES FOR GIVINGAND RISK TAKING∗
DAVID CESARINI
CHRISTOPHER T. DAWES
MAGNUS JOHANNESSON
PAUL LICHTENSTEIN
BJORN WALLACE
In this paper, we use the classical twin design to provide estimates of geneticand environmental influences on experimentally elicited preferences for risk andgiving. Using standard methods from behavior genetics, we find strong prima facieevidence that these preferences are broadly heritable and our estimates suggestthat genetic differences explain approximately twenty percent of individual vari-ation. The results thus shed light on an important source of individual variationin preferences, a source that has hitherto been largely neglected in the economicsliterature.
I. INTRODUCTION
Writing in 1875, the prolific Francis Galton concluded thefirst scientific inquiry into the behavior of twins by remarkingthat “There is no escape from the conclusion that nature prevailsenormously over nurture” (Galton 1875, p. 576). In fact, Galtonwas so taken with his results that he continued, “My only fear isthat my evidence seems to prove too much and may be discreditedon that account, as it seems contrary to all experience that nur-ture should go for so little.” Although his methodology would beconsidered dubious, if not flawed, by modern standards, Galton’swork laid the conceptual basis for behavior genetics (Bouchardand Propping 1993; Plomin et al. 2001a), the study of genetic and
∗This paper has benefited from discussions with Coren Apicella, SamuelBowles, Terry Burnham, Bryan Caplan, Tore Ellingsen, James Fowler, JonGruber, Garett Jones, Moses Ndulu, Matthew Notowidigdo, Niels Rosenquist,Paul Schrimpf, Steven Pinker, Tino Sanandaji, Orjan Sandewall, Vernon Smithand Robert Ostling. Thanks to Larry Katz and six anonymous referees for veryhelpful comments. We thank the Jan Wallander and Tom Hedelius Foundation,the Swedish Research Council, and the Swedish Council for Working Life andSocial Research for financial support. The Swedish Twin Registry is supported bygrants from the Swedish Research Council, The Ministry for Higher Educationand Astra Zeneca. Rozita Broumandi and Camilla Bjork at the Swedish Twin Reg-istry responded to a number of queries, for which we are grateful. Patrik Ivert,Niklas Kaunitz and Benjamin Katzeff provided excellent research assistance. Weare grateful to a number of colleagues, especially Hakan Jerker Holm and FredrikCarlsson, for help with subject recruitment outside Stockholm. The paper wascompleted while David Cesarini was visiting the Research Institute of IndustrialEconomics in Stockholm; he gratefully acknowledges their hospitality.
C© 2009 by the President and Fellows of Harvard College and the Massachusetts Institute ofTechnology.The Quarterly Journal of Economics, May 2009
809
810 QUARTERLY JOURNAL OF ECONOMICS
environmental influences on variation in human behavior. Todayample evidence for the importance of genetic influences (“nature”)on variation in human behavioral traits has amassed. However,the debate about the rather nebulous concepts “nature” and “nur-ture” still rages.
In economics, there is a small but growing research fieldusing behavior genetic techniques. The seminal paper is dueto Taubman (1976), who employed the twin design to estimatethe heritability of earnings for U.S. males. Later papers in thisprocession, based on either twins or adoptees, include Behrmanand Taubman (1989), Sacerdote (2002, 2007), Plug and Vijver-berg (2003), Bjorklund, Lindahl, and Plug (2006), and Bjorklund,Jantti, and Solon (2007). In short, these studies find that both “na-ture” and “nurture” are important determinants of life outcomesand uniformly corroborate the importance of genetic influences oneducational attainment and earnings.1
Some recent work in economics also focuses on the issue ofintergenerational transmission of preferences. Cipriani, Giuliani,and Jeanne (2007) report mother–son correlations for contribu-tions in a standard public goods game and find no significantassociations, interpreting this as evidence that peer effects in-fluence contributions. Dohmen et al. (2006), on the other hand,use survey evidence on attitudinal questions and find modest in-tergenerational correlations in self-reported trust and risk atti-tudes. Naturally, these papers suffer from the limitation that itis impossible to separately identify genetic (parents passing ongenes for a certain trait to their biological children) and culturaltransmission.
In this paper, we move beyond the computation of intergen-erational correlations and offer a direct test of the hypothesisthat economic preferences are under genetic influence. We elicitpreferences experimentally with a subject pool of twins recruitedfrom the population-based Swedish Twin Registry. The virtue ofthis approach is that by comparing monozygotic (MZ) twins, whoshare the same set of genes, to dizygotic (DZ) twins, whose genesare imperfectly correlated, we can estimate the proportion of vari-ance in experimental behavior due to genetic and to shared andunique environmental effects. The measures of economic prefer-ences that we use are based on de facto observed experimental
1. For an extensive collection of essays on the intergenerational transmissionof economic opportunity, see the volume edited by Bowles, Gintis, and OsborneGroves (2005).
GENETIC VARIATION IN PREFERENCES 811
behavior under controlled circumstances with financial incentivesattached to performance. For risk taking, we also present somesupplementary survey-based evidence derived from hypotheticalquestions that have been behaviorally validated (Dohmen et al.2005, 2006).
This paper is the first to use the twin methodology to study(i) experimentally elicited risk preferences and (ii) giving behaviorin a dictator game. Outside economics, two papers have used thetwin methodology to shed light on individual variation in the ul-timatum game (Wallace et al. 2007) and the trust game (Cesariniet al. 2008). Two other previous papers used twins as a subjectpool (Loh and Elliott 1998; Segal and Hershberger 1999) but theexperiments therein were designed to test whether cooperationvaried by genetic relatedness, as predicted by inclusive fitnesstheory (Hamilton 1964). Therefore, twins played against their co-twins, and consequently it is not possible to estimate heritabilityfrom these studies.
We find strong evidence that preferences for risk takingand giving are broadly heritable. Our point estimates from thebest-fitting models suggest that approximately twenty percentof individual variation can be explained by genetic differences.Furthermore, our results suggest only a modest role for com-mon environment as a source of variation. We argue that thesignificance of these results extends well beyond documentingan important, but hitherto largely ignored, source of preferenceheterogeneity. For example, although it is widely accepted thatparent–offspring correlations in isolation cannot be used to dis-criminate between theories of genetic and cultural transmission,much economic research is carried out under the presumptionthat genetic transmission is small enough so that it can be safelyignored. Such an assumption is not consistent with our findings.
Importantly, the estimates we report are in line with thebehavior genetics literature, where survey based studies havedocumented substantial genetic influences on variation in eco-nomically relevant abilities, preferences, and behaviors such as in-telligence (Bouchard et al. 1990), personality (Jang, Livesley, andVernon 1996), addiction (True et al. 1997), prosociality (Rushtonet al. 1986; Rushton 2004), sensation seeking (Stoel, De Geus,and Boomsma 2006), religiosity (Bouchard et al. 1999; Kirk et al.1999; Koenig et al. 2005), political preferences (Alford, Funk, andHibbing 2005), and political participation (Fowler, Dawes, andBaker 2008). The remainder of this paper is structured as follows:
812 QUARTERLY JOURNAL OF ECONOMICS
in Sections II and III, we describe the method and the experi-ments used in detail; in Section IV, we report the results; and inSection V, we discuss our findings. Section VI concludes.
II. DATA COLLECTION
II.A. Subject Recruitment
The study was undertaken in collaboration with the SwedishTwin Registry at Karolinska Institutet.2 The registry, which isthe largest twin registry in the world, has been described in de-tail elsewhere (Lichtenstein et al. 2006). All of our invitees weresame-sex twin pairs that had previously participated in the Web-based survey STAGE, an acronym for “the Study of Twin Adults:Genes and Environment.” This survey was administered betweenNovember 2005 and March 2006 to all twins born in Sweden be-tween 1959 and 1985, and it attained a response rate of 61%. Itsprimary purpose was to study environmental and genetic influ-ences on a number of diseases (Lichtenstein et al. 2006), but italso contains self-reported data on marital, employment, and fer-tility status, as well as information on the frequency of twin con-tact. To allow further examination of the effects of our methodsof recruitment on the representativeness of our sample, we alsomerged the STAGE cohort with a specially requested data set ofsocioeconomic and demographic variables compiled by StatisticsSweden.
In a first recruitment effort, during the summer and fall of2006, a total of 658 twins (71 DZ and 258 MZ pairs) participatedin the Swedish cities of Stockholm, Gothenburg, Uppsala, Malmo,Lund, Linkoping, Norrkoping, Helsingborg, Orebro, Vasteras, andKristianstad. Due to the relatively small sample of DZ twins, asecond round of data collection took place in February 2008. BothMZ and DZ twins were invited to participate, but DZ twins werepursued somewhat more vigorously, with personalized invitationsand reminders sent to those who did not respond. This recruitmenteffort was successful in augmenting the sample size of DZ twins,and the complete data set comprises 920 twins: 141 DZ pairs and319 MZ pairs. A vast majority of subjects, approximately 80%, arefemale. For the second data collection round, twins were recruitedin the cities of Stockholm, Gothenburg, Uppsala, Malmo, Lund,
2. The study and subject recruitment were approved by the Ethics Committeefor Medical Research in Stockholm.
GENETIC VARIATION IN PREFERENCES 813
Helsingborg, Orebro, Vaxjo, Vasteras, Jonkoping, Borlange, andUmea. In all of the experimental sessions a condition for partic-ipation was that both twins in a pair be able to attend the samesession. Moreover, invitations were extended only to twins whowere both domiciled in the same city or its surrounding areas. Zy-gosity was resolved by questionnaire items that have been shownto have a reliability of somewhere between 95% and 98% (Licht-enstein et al. 2006).
II.B. Experimental Procedures
When subjects arrived at an experimental session they wereseated apart and given general instructions orally. They wereasked not to talk to one another during the experiment and toalert the experimenter if they had any questions (questions wererare and were answered in private). Subjects were also told aboutthe strong norm against deception in experimental economics.After having filled out a form with information for the adminis-tration of payments, subjects were given instructions for the firstexperiment (the modified dictator game; see below). There were notime constraints, so when all participants finished making theirdecisions, the next set of instructions was handed out. Subjectsparticipated in a total of five different experiments. The exper-iment phase was followed by a short questionnaire with surveyquestions, a personality test, and a test of cognitive ability. Onaverage, experimental sessions lasted a little more than an hourand average earnings were SEK 325 (exchange rate; $1 is aboutSEK 6).
II.C. Giving
We used a modified dictator game to measure preferences forgiving (“altruism”).3 In a standard dictator game (Forsythe et al.1994), a subject decides how to split a sum of money between her-self and another person (see Camerer [2003] for an overview ofdictator game results). A variant of this approach first used byEckel and Grossman (1996) is that the subject decides how to al-locate a sum of money between herself and a charity. As donations
3. Independently, Bardsley (2007) and List (2007) have shown that augment-ing the choice set of the dictator to allow him or her to take money from thepartner dramatically reduces generosity. This suggests that people’s behavior inthe standard dictator game is sensitive to cues about social norms in experimentalsettings. Regardless of one’s favored interpretation of giving in dictator games, wewill provide evidence suggesting that such giving is heritable.
814 QUARTERLY JOURNAL OF ECONOMICS
to charity may be related to empathy and altruism more stronglythan donations in the standard dictator game, we opted for thisapproach. Fong (2007) has shown that empathy is a more im-portant motivation for dictator game giving when recipients areperceived to be in great need (in their case welfare recipients). Inthe present study subjects decided how to allocate SEK 100 (about$15) between themselves and a charity called “Stadsmissionen.”Stadsmissionen’s work is predominantly focused on helping thehomeless in Sweden. All subjects responded to the dictator gamequestion and are included in the analysis below (319 MZ pairsand 141 DZ pairs).
II.D. Risk Taking
To measure risk aversion, subjects were presented with sixchoices, each between a certain payoff and a 50/50 gamble for SEK100 (about $15). The certain payoffs were set to SEK 20, 30, 40,50, 60, or 80. After subjects had made their six choices, one ofthese was randomly chosen for payoff by rolling a die. The gamblewas resolved with a coin toss in front of the participants. The mea-sure of risk aversion determines seven intervals for the certaintyequivalent of the gamble. A similar question has been used byHolt and Laury (2002). Nineteen subjects provided inconsistentresponses (2% of the total sample), and these were dropped (leav-ing 307 MZ pairs and 135 DZ pairs for the analysis).4 We referto this measure as risk aversion and it is our primary measure ofrisk preferences.
We supplement this first measure of risk preferences withtwo hypothetical questions designed to measure risk attitudes.The first question, which we denote risk investment, asks thesubjects to assume that they have won SEK 1 million on a lot-tery and that they are then given the opportunity to invest someof this money in a risky asset with an equal probability of dou-bling the investment or losing half the investment. Subjects canthen choose between six different levels of investments: SEK 0,200,000, 400,000, 600,000, 800,000, or 1 million. This question issimilar to the question with real monetary payoffs, but involvesmuch larger (although hypothetical) stakes. The second question,
4. An inconsistent response is one in which the certainty equivalent is notuniquely defined; that is, an individual who chooses SEK 20 rather than thegamble in the first question and then chooses the gamble rather than SEK 30 inthe second question. Such behavior is a strong indication that the subject eitherhas misunderstood the question, or has failed to take it seriously.

GENETIC VARIATION IN PREFERENCES 815
risk assessment, measures general risk attitudes on a 0–10 scale,where 0 is complete unwillingness to take risks and 10 is completewillingness to take risks. This scale question measures generalrisk attitudes rather than monetary risk attitudes. Dohmen et al.(2005) showed that all of these three measures of risk attitudesare significantly related to each other, and established the behav-ioral validity of the two hypothetical questions with respect to realrisk taking.
III. TWIN METHODOLOGY
Comparing the behavior of identical and nonidentical twins isa form of quasi-controlled experiment. MZ and DZ twins differ intheir genetic relatedness. If a trait is heritable, then it must be thecase that the correlation in MZ twins is higher than the correlationin DZ twins. We start by examining the MZ and DZ correlations.Such an examination serves two purposes. A number of authors(Loehlin 1965; Goldberger 1977, 1979), have noted that movingfrom a crude comparison of correlations to a full-fledged variancedecomposition requires making some strong independence andfunctional form assumptions. A first purpose is therefore to ex-amine whether a significant difference in correlations exists. Thisserves as a diagnostic of whether the traits in question are undergenetic influence. Second, as explained below, the workhorse mod-els in behavior genetics do imply certain restrictions on the MZand DZ correlations. Correlations that fall significantly outsidethe space of permissible correlations are therefore an indicationof model misspecification and the raw correlations can be used totest for such misspecification. To explain why, it is necessary to in-troduce some basic concepts from behavior genetics (see Chapter 3in Neale and Maes [2004]). By phenotype, we simply mean the ob-served outcome variable. The location of a gene on a chromosomeis known as a locus. Alleles are the alternative forms of a gene thatmay occupy the same locus on a chromosome. Finally, the geno-type of an individual is the alleles he or she has at a locus. Supposethat the phenotype of twin j ∈ {1, 2} in family i can be written asthe sum of four independent influences,
χi j = Cij + Eij + Aij + Dij,(1)
where Cij is the common environmental factor, Eij is the individ-ually experienced unique environment factor, Aij is an additive
816 QUARTERLY JOURNAL OF ECONOMICS
genetic factor, and Dij is a dominance factor. Common envi-ronmental influences are defined as those influences shared byboth twins, for example the home environment, so that Ci1 = Ci2.Unique environmental influences, by contrast, are defined as en-vironmental experiences idiosyncratic to each twin.
Behavior geneticists distinguish between additive genetic ef-fects and dominance effects. For an intuitive illustration of thedifference, consider the simple case where there are two possiblealleles, a1 and a2, so that each individual, getting one allele fromeach parent, has genotype (a1, a1), (a1, a2), or (a2, a2). Dominanceis then present whenever the effect of having genotype (a1, a2) isnot equal to the mean effect of genotypes (a1, a1) and (a2, a2). Inother words, dominance can be thought of as an interaction effect.
Because the influences are assumed to be independent, themodel predicts that the covariance in MZ twins is equal to
COVMZ = σ 2A + σ 2
D + σ 2C,(2)
because identical twins share the same genes and were rearedtogether. The phenotypic covariance between DZ twins is derivedin Mather and Jinks (1977) as
COVDZ = 12σ 2
A + 14σ 2
D + σ 2C .(3)
The coefficients of genetic relatedness for DZ twins in equa-tion (3) thus imply that DZ twins share half the additive geneticeffects and a quarter of the dominance effects.
Notice that parameters of this model cannot be identifiedwith twin data alone, because we have one equation less thanthe number of parameters to be estimated. This ambiguity is typ-ically resolved in twin research by assuming that all gene actionis additive, so that σ 2
D = 0. Behavior geneticists distinguish be-tween broad heritability, defined as (σ 2
A + σ 2D)/(σ 2
A + σ 2D + σ 2
C + σ 2E),
and narrow heritability, defined simply as σ 2A/(σ 2
A + σ 2D + σ 2
C + σ 2E).
The identifying restriction that σ 2D equals zero can be tested by
examining whether ρDZ is at least half of ρMZ, and the greatestdifference in correlation allowed by the model arises when σ 2
C = 0and σ 2
A = 0, in which case ρMZ is four times greater than ρDZ.In our empirical analysis, we start by comparing the corre-
lations of MZ and DZ twins using the bootstrap. Letting NMZbe the number of complete MZ pairs, we draw NMZ pairs withreplacement 1,000 times and calculate both parametric and
GENETIC VARIATION IN PREFERENCES 817
nonparametric correlation each time. We proceed analogously forDZ twins and then create a 1,000×1 vector where the DZ corre-lation is subtracted from the MZ correlation for each draw. Thisgives a distribution for the difference in correlations between thetwo samples. The p-value for the test of the hypothesis that thetwo correlations are equal is then the number of negative en-tries in the vector divided by 1,000. The use of a one-sided testis theoretically justified in our case because the notion that theDZ correlation could be greater than the MZ correlation is not aparticularly interesting alternative hypothesis. We also use thesame bootstrap technique to test the hypothesis that the DZ cor-relation is at least half as large as the MZ correlation. The re-sult of the latter exercise will inform our choice of identifyingrestrictions.
For our two main outcome variables, we estimate mixed-effects Bayesian ACE models.5 We report results treating outcomevariables as continuous as well as ordinal. Using the same nota-tion as previously, the model is written as
y∗i j = χi j,(4)
where χi j is the sum of genetic, shared environment, and unsharedenvironment random effects. For MZ twins the latent variable isthe sum of three random effects,
χMZi j = Ai + Ci + Eij,(5)
where Ai is the family genetic factor, Ci is the family-shared envi-ronment factor, and Eij is the individually experienced unsharedenvironment factor. For DZ twins the latent variable is a functionof four random effects variables,
χDZi j = A1i + A2i j + Ci + Eij,(6)
where A1i is the family genetic factor shared by both twins, A2i jis the individually inherited genetic factor that is unique to eachtwin, and Ci and Eij are the same as for MZ twins. In the contin-uous models, we take the outcome variables in the experiment to
5. Researchers have increasingly used Bayesian methods, implemented usingMarkov chain Monte Carlo (MCMC) algorithms, to estimate the variance compo-nents in ACE models. The likelihood functions in genetic models often presentcomputational challenges for maximum likelihood approaches because they con-tain high-dimension integrals that cannot be evaluated in closed form and thusmust be evaluated numerically. For a detailed discussion of Bayesian ACE models,we refer to van den Berg, Beem, and Boomsma (2006).
818 QUARTERLY JOURNAL OF ECONOMICS
be y∗i j . In the ordered models, the outcome variables are instead
modeled under the assumption that y∗i j is not directly observed.
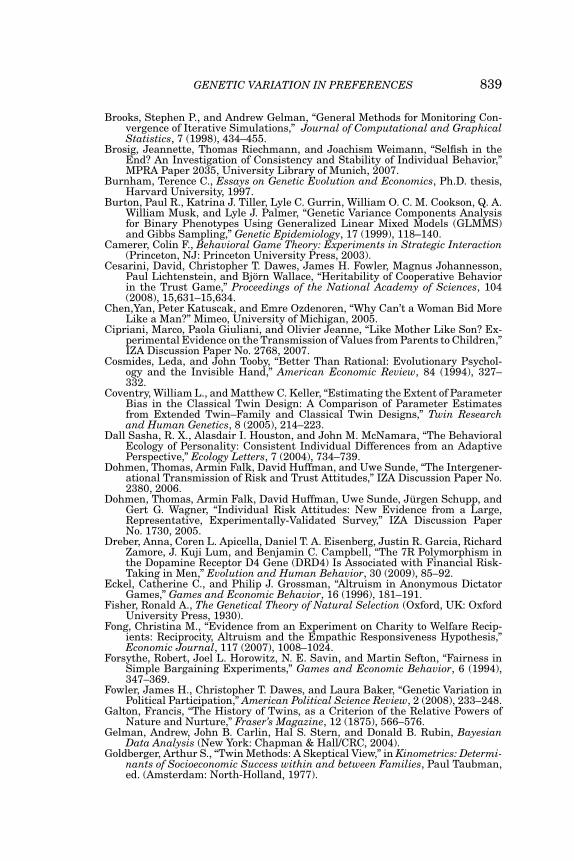
Instead, the observed variable yij is assumed to be one of k + 1ordered categories separated by k thresholds that are estimatedas part of the model. The three risk measures naturally fall intocategories, and hence these categories are used in the analysis. Avisual inspection of Figure I shows that the distribution of dicta-tor game responses is roughly trimodal, with peaks at the threefocal points: donating the entire endowment, donating half the en-dowment, or keeping the entire endowment. Approximately 80%of responses are in one of those three categories. Consequentlywe construct an ordinal variable where individuals who donatebetween 0 and 33 are coded as 0, individuals who donate between33 and 66 are coded as 1, and individuals who donate more than66 are coded as 2. We use the variances of the random effectsto generate estimates of heritability, common environment, andunique environment. Because the underlying components are notconstrained, the estimated proportions can range anywhere from0 (the component has no effect on variance) to 1 (the componentis solely responsible for all observed variance).
Replicating the methods used in this literature, we assumethat our unobserved random effects are normally distributed andindependent:
A ∼ N(0, σ 2
A
),(7)
A1 ∼ N(0, σ 2
A/2),(8)
A2 ∼ N(0, σ 2
A/2),(9)
C ∼ N(0, σ 2
C
),(10)
E ∼ N(0, σ 2
E
).(11)
The variance of A1, the family genetic effect for DZ twins,is fixed to be half the variance of A, the family genetic effect forMZ twins, reflecting the fact that MZ twins on average sharetwice as many genes as DZ twins. Moreover, DZ twins are alsoinfluenced by individually specific genes A2 that are drawn fromthe same distribution as the shared genes, because on averagehalf their genes are shared and half are not. These assump-tions about the genetic variance help to distinguish shared genesfrom the shared environment variable C, which is assumed tohave the same variance for both MZ and DZ twin families, andthe residual unique environment variable, E, from which a unique
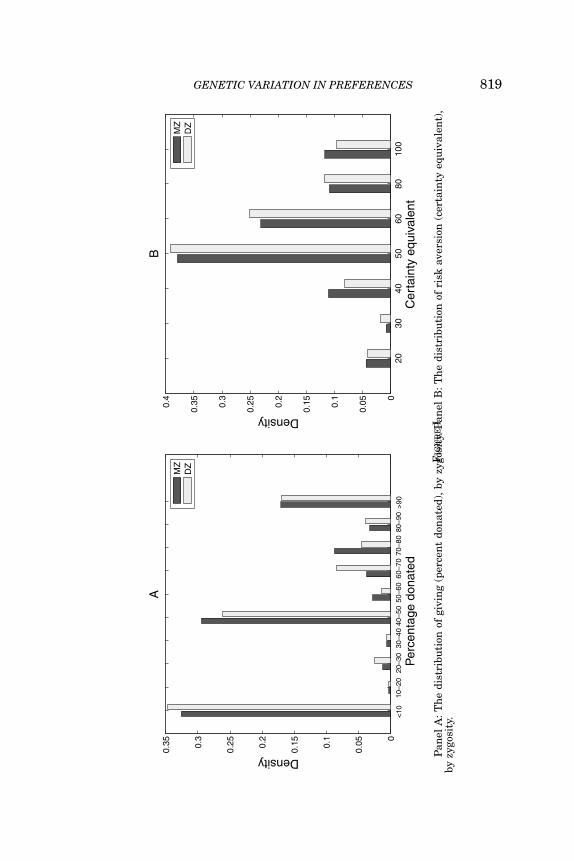
GENETIC VARIATION IN PREFERENCES 819
<10
10–2
020
–30
30–4
040
–50
50–6
060
–70
70–8
080
–90
>90
0
0.050.
1
0.150.
2
0.250.
3
0.35
Density
A
M
ZD
Z
2030
4050
6080
100
0
0.050.
1
0.150.
2
0.250.
3
0.350.
4
Cer
tain
ty e
quiv
alen
tP
erce
ntag
e do
nate
d
Density
B
M
ZD
Z
FIG
UR
EI
Pan
elA
:Th
edi
stri
buti
onof
givi
ng
(per
cen
tdo
nat
ed),
byzy
gosi
ty.P
anel
B:T
he
dist
ribu
tion
ofri
skav
ersi
on(c
erta
inty
equ
ival
ent)
,by
zygo
sity
.

820 QUARTERLY JOURNAL OF ECONOMICS
draw is made for each individual. The contribution of a vari-ance component is simply estimated as σ 2
i /(σ 2E + σ 2
A + σ 2C), where
i ∈ {A, C, E}.6We estimate three types of models in addition to the ACE
model. An AE model accounts for only heritability and commonenvironment, a CE model accounts for only common and uniqueenvironment, and an E model accounts for only unique environ-ment. Procedurally, the difference between the ACE model andthese submodels is that one or more variances are restricted toequal zero. Estimating submodels allows testing whether the pa-rameter restriction results in a significant deterioration in fit.For example, in the AE model, the random effect for the com-mon environment is not estimated. To compare the fit of ACE,AE, CE, and E models we used the deviance information criterion(DIC), a Bayesian method for model comparison analogous to theAkaike information criterion (AIC) in maximum likelihood esti-mation. Models with smaller DIC are considered to have betterout-of-sample predictive power (Gelman et al. 2004). The DIC isdefined as the sum of deviance (Dbar), a measure of model fit, andthe effective number of parameters (pD), which captures modelcomplexity.7
In our Markov chain Monte Carlo procedure we use vague,or flat, prior distributions to ensure that they do not drive ourresults. For the thresholds, τi, we use a mean-zero normal distri-bution with variance 1,000,000, and for the precision parametersassociated with σ 2
A, σ 2E, and σ 2
C , we use a Pareto distribution with
6. If we tried to estimate all three components of variance simultaneously inthe ordered model, it would not be identified, so we fix the variance of the unsharedenvironment σ 2
E to be one.7. Letting θ be the parameter vector, y the data, p the likelihood function, and
f (y) a standardizing term which is a function of the data alone, the deviance isdefined as
D(θ ) = −2 ln(p(y | θ )) + 2 ln f (y).
Then Dbar is defined as
Dbar = Eθ (D(θ )),
and pD is defined as
pD = Dbar − D(θ ),
where θ is the expectation of θ. The deviance information criterion can then becalculated as
DIC = pD + Dbar
For further details, see Spiegelhalter et al. (2002).
GENETIC VARIATION IN PREFERENCES 821
TABLE IEXPERIMENTAL BEHAVIOR
MZ twins DZ twins p-value
Giving Mean 53.60 54.43 .77S.D. 37.27 37.94n 638 282
Risk aversion Mean 52.38 51.88 .71S.D. 18.53 17.80n 625 276
Risk investment Mean 30.25 33.19 .08S.D. 21.22 21.28n 638 279
Risk assessment Mean 4.98 5.25 .07S.D. 1.98 1.96n 636 279
Notes. The p-value is for the test of the hypothesis that the mean of the MZ and DZ distributions are thesame. Standard errors are adjusted to take nonindependence into account (Liang and Zeger 1986).
shape parameter equal to 1 and scale parameter equal to 0.001,which is the equivalent of putting a uniform (0, 1,000) prior onthe variances. A Pareto distribution has proven to work well forvariance components in genetic models (Burton et al. 1999; Scur-rah, Palmer, and Burton 2000). In addition, we use convergencediagnostics to make sure that the stationary posterior distribu-tion has been reached. To ensure that the models converged totheir target posterior distribution, we began sampling from thejoint posterior distribution after convergence was established us-ing the Brooks and Gelman (1998) statistic (values of less than1.1 on all parameters indicate convergence). For all of the modelsthe “burn-in” period was 100,000 iterations and the chains werethinned by 100.
IV. RESULTS
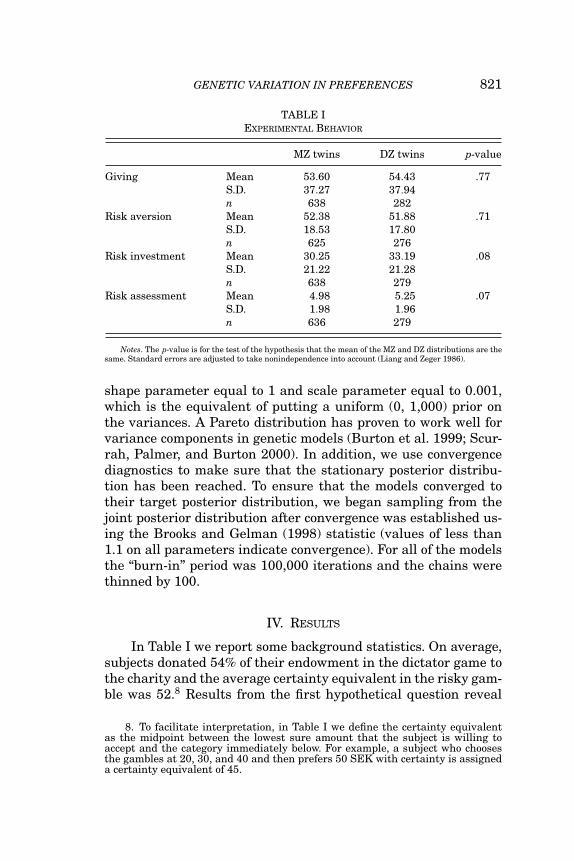
In Table I we report some background statistics. On average,subjects donated 54% of their endowment in the dictator game tothe charity and the average certainty equivalent in the risky gam-ble was 52.8 Results from the first hypothetical question reveal
8. To facilitate interpretation, in Table I we define the certainty equivalentas the midpoint between the lowest sure amount that the subject is willing toaccept and the category immediately below. For example, a subject who choosesthe gambles at 20, 30, and 40 and then prefers 50 SEK with certainty is assigneda certainty equivalent of 45.

822 QUARTERLY JOURNAL OF ECONOMICS
that subjects invest on average 31% of their endowment. Finally,on a scale from 0 to 10, subjects report an average willingness totake risks of just above 5. Tests of equality for all four variables failto reject the null hypothesis that the MZ and DZ means are equalat the 5% level. To give an impression of individual variation inresponses, in Figure I we plot histograms of the distributions forrisk aversion and giving, separately, for DZ and MZ twins. A visualinspection reveals that there is ample variation in responses andfails to lend much support to the hypothesis that the frequencydistributions vary by zygosity. Histograms and scatterplots for thesurvey-based risk measures are provided in Figures A1 and A2 inthe Online Appendix.
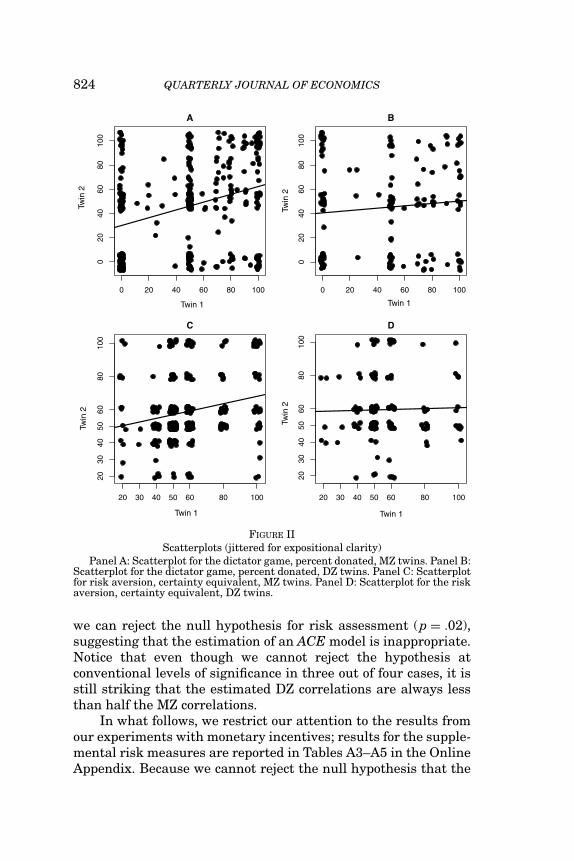
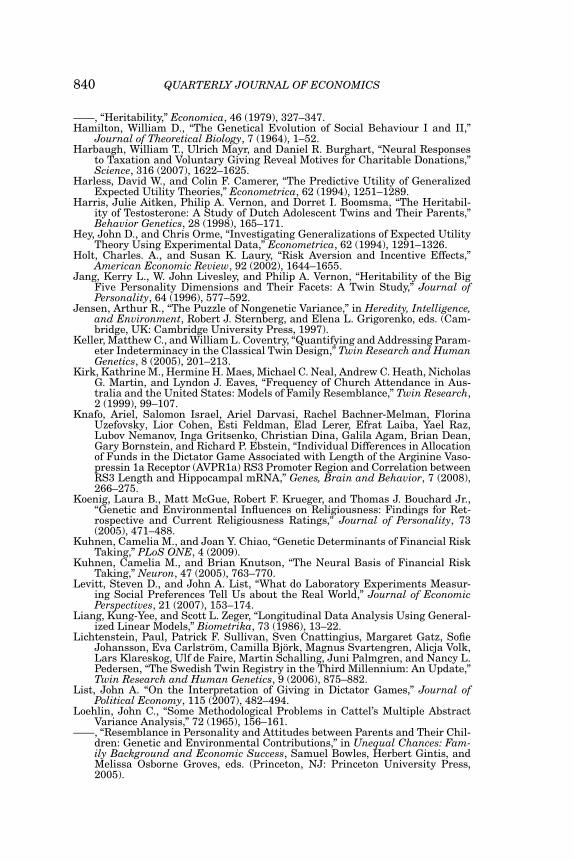
In Table II, we report parametric and nonparametric corre-lations for MZ and DZ twins. Pearson correlations do not dif-fer appreciably from Spearman correlations. These correlationsconvey a lot of information, and because a purely environmentalmodel cannot account for any differences between MZ and DZ cor-relations, they serve as a preliminary diagnostic of whether thepreferences in question are in part under genetic influence. Forgiving, the Spearman correlation is .319 for MZ twins and .106 forDZ twins, consistent with a genetic effect. Similarly, for risk aver-sion, the Spearman correlation is .222 for MZ twins and .025 forDZ twins, whereas for risk investment, the corresponding figuresare .264 and .096. However, for risk assessment, the separationis larger, with an MZ correlation of .367 and a DZ correlation of−.034. As the sample size is smaller for DZ twins, these correla-tions are estimated with less precision, yielding wider confidenceintervals. Yet, when the equality of the correlations is tested us-ing the bootstrap, the one-sided p-value is less than 2% for giving,risk aversion, and risk assessment. Though the MZ correlationis also higher than the DZ correlation for risk investment, thehypothetical investment question, the difference is not significantat 5% (p = .07). The robust separation of MZ and DZ correlationsis illustrated in Figure II, where we plot the response of twin 1against the response of twin 2 separately for MZ and DZ twins.Hence, the evidence is very compelling that genes do contributeto phenotypic variation in both giving and risk aversion.
We also used the same bootstrapping method to test thenull hypothesis that the DZ correlation is at least half the MZcorrelation, as implied by the ACE specification. For neitherrisk aversion (p = .16), risk investment (p = .36), nor giving(p = .30) can we reject the null hypothesis. On the other hand,

GENETIC VARIATION IN PREFERENCES 823
TA
BL
EII
PA
RA
ME
TR
ICA
ND
NO
NP
AR
AM
ET
RIC
CO
RR
EL
AT
ION
SF
OR
MZ
AN
DD
ZT
WIN
PA
IRS
p-va
lue
MZ
twin
pair
sD
Ztw
inpa
irs
ofdi
ff.
Giv
ing
Spe
arm
an.3
19**
*(.
211–
.426
).1
06(−
.067
–.29
2).0
15P
ears
on.3
17**
*(.
208–
.424
).0
99(−
.075
–.27
9).0
13n
319
141
Ris
kav
ersi
onS
pear
man
.222
***
(.11
8–.3
41)
.025
(−.1
50–.
189)
.020
Pea
rson
.222
***
(.09
9–.3
42)
.024
(−.1
35–.
179)
.024
n30
713
5R
isk
inve
stm
ent
Spe
arm
an.2
64**
*(.
149–
.364
).0
96(−
.077
–.27
7).0
66P
ears
on.3
04**
*(.
177–
.408
).1
10(−
.079
–.31
5).0
57n
319
139
Ris
kas
sess
men
tS
pear
man
.367
***(
.266
–.46
8)−.
034
(−.2
17–.
148)
.001
Pea
rson
.384
***
(.28
0–.4
81)
−.04
3(−
.237
–.13
9).0
01n
317
139
Not
es.
***,
**,
*si
gnifi
can
tly
diff
eren
tfr
omze
roat
1%,
5%,
and
10%
leve
ls.
All
resu
lts
are
boot
stra
pped
.p-
valu
esar
eon
e-si
ded.
95%
con
fide
nce
inte
rval
sw
ith
inpa
ren
thes
es.
824 QUARTERLY JOURNAL OF ECONOMICS
0 20 40 60 80 100
020
4060
8010
0
A
Twin
2
0 20 40 60 80 1000
2040
6080
100
B
Twin 1
C
20 30 40 50 60 80 100
2030
4050
6080
100
D
20 30 40 50 60 80 100
2030
4050
6080
100
Twin
2
Twin
2
Twin
2
Twin 1
Twin 1 Twin 1
FIGURE IIScatterplots (jittered for expositional clarity)
Panel A: Scatterplot for the dictator game, percent donated, MZ twins. Panel B:Scatterplot for the dictator game, percent donated, DZ twins. Panel C: Scatterplotfor risk aversion, certainty equivalent, MZ twins. Panel D: Scatterplot for the riskaversion, certainty equivalent, DZ twins.
we can reject the null hypothesis for risk assessment (p = .02),suggesting that the estimation of an ACE model is inappropriate.Notice that even though we cannot reject the hypothesis atconventional levels of significance in three out of four cases, it isstill striking that the estimated DZ correlations are always lessthan half the MZ correlations.
In what follows, we restrict our attention to the results fromour experiments with monetary incentives; results for the supple-mental risk measures are reported in Tables A3–A5 in the OnlineAppendix. Because we cannot reject the null hypothesis that the
GENETIC VARIATION IN PREFERENCES 825
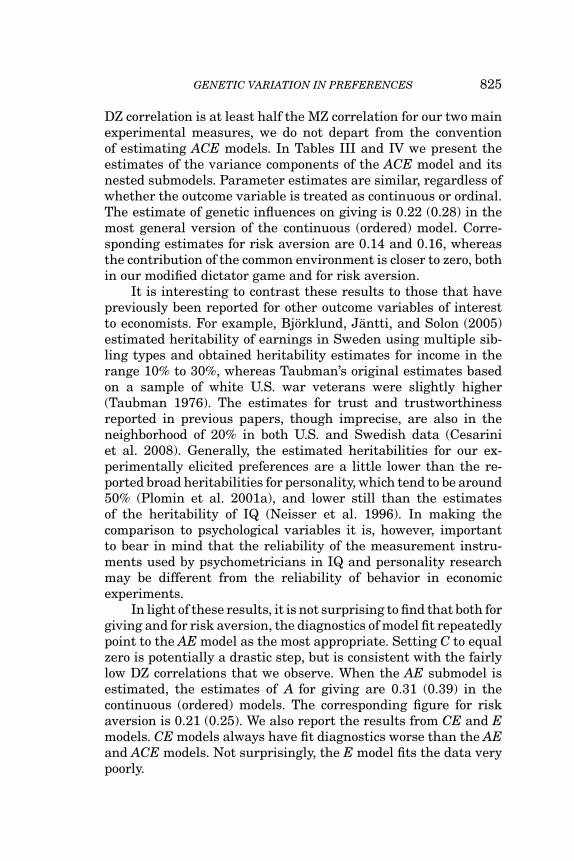
DZ correlation is at least half the MZ correlation for our two mainexperimental measures, we do not depart from the conventionof estimating ACE models. In Tables III and IV we present theestimates of the variance components of the ACE model and itsnested submodels. Parameter estimates are similar, regardless ofwhether the outcome variable is treated as continuous or ordinal.The estimate of genetic influences on giving is 0.22 (0.28) in themost general version of the continuous (ordered) model. Corre-sponding estimates for risk aversion are 0.14 and 0.16, whereasthe contribution of the common environment is closer to zero, bothin our modified dictator game and for risk aversion.
It is interesting to contrast these results to those that havepreviously been reported for other outcome variables of interestto economists. For example, Bjorklund, Jantti, and Solon (2005)estimated heritability of earnings in Sweden using multiple sib-ling types and obtained heritability estimates for income in therange 10% to 30%, whereas Taubman’s original estimates basedon a sample of white U.S. war veterans were slightly higher(Taubman 1976). The estimates for trust and trustworthinessreported in previous papers, though imprecise, are also in theneighborhood of 20% in both U.S. and Swedish data (Cesariniet al. 2008). Generally, the estimated heritabilities for our ex-perimentally elicited preferences are a little lower than the re-ported broad heritabilities for personality, which tend to be around50% (Plomin et al. 2001a), and lower still than the estimatesof the heritability of IQ (Neisser et al. 1996). In making thecomparison to psychological variables it is, however, importantto bear in mind that the reliability of the measurement instru-ments used by psychometricians in IQ and personality researchmay be different from the reliability of behavior in economicexperiments.
In light of these results, it is not surprising to find that both forgiving and for risk aversion, the diagnostics of model fit repeatedlypoint to the AE model as the most appropriate. Setting C to equalzero is potentially a drastic step, but is consistent with the fairlylow DZ correlations that we observe. When the AE submodel isestimated, the estimates of A for giving are 0.31 (0.39) in thecontinuous (ordered) models. The corresponding figure for riskaversion is 0.21 (0.25). We also report the results from CE and Emodels. CE models always have fit diagnostics worse than the AEand ACE models. Not surprisingly, the E model fits the data verypoorly.

826 QUARTERLY JOURNAL OF ECONOMICS
TA
BL
EII
IR
ES
ULT
SO
FT
HE
AC
EM
OD
EL
AN
DIT
SN
ES
TE
DS
UB
MO
DE
LS
FO
RG
IVIN
G
AC
EA
EC
EE
Con
tin
uou
sA
0.22
(0.0
5,0.
36)
0.31
(0.2
1,0.
40)
——
C0.
09(0
.01,
0.23
)—
0.25
(0.1
6,0.
33)
—E
0.70
(0.6
0,0.
79)
0.69
(0.6
0,0.
79)
0.75
(0.6
7,0.
84)
1.00
(1.0
0–1.
00)
Dba
r4,
719
4,70
64,
783
5,04
3p
D22
7.3
234.
918
4.8
2.0
DIC
4,94
64,
941
4,96
85,
045
Ord
ered
A0.
28(0
.06,
0.46
)0.
39(0
.27,
0.51
)—
—C
0.11
(0.0
1,0.
30)
—0.
32(0
.21,
0.43
)—
E0.
61(0
.50,
0.73
)0.
61(0
.49,
0.74
)0.
68(0
.57,
0.79
)1.
00(1
.00–
1.00
)D
bar
1,69
31,
688
1,76
12,
023
pD
236.
023
8.7
189.
82.
0D
IC1,
929
1,92
71,
951
2,02
5
Not
es.
Ais
the
gen
etic
con
trib
uti
on;C
isth
eco
mm
onen
viro
nm
ent
con
trib
uti
on;
Eis
the
un
iqu
een
viro
nm
ent
con
trib
uti
on.D
bar:
Dev
ian
ce.p
D:E
ffec
tive
nu
mbe
rof
para
met
ers.
DIC
:Bay
esia
nde
vian
cein
form
atio
ncr
iter
ion
.95%
cred
ible
inte
rval
sw
ith
inpa
ren
thes
es.

GENETIC VARIATION IN PREFERENCES 827
TA
BL
EIV
RE
SU
LTS
OF
TH
EA
CE
MO
DE
LA
ND
ITS
NE
ST
ED
SU
BM
OD
EL
FO
RR
ISK
AV
ER
SIO
N
AC
EA
EC
EE
Con
tin
uou
sA
0.14
(0.0
2,0.
27)
0.21
(0.1
1,0.
31)
——
C0.
07(0
.00,
0.18
)—
0.17
(0.0
8,0.
26)
—E
0.80
(0.6
9,0.
89)
0.79
(0.7
0,0.
89)
0.83
(0.7
4,0.
93)
1.00
(1.0
0–1.
00)
Dba
r7,
713
7,70
77,
752
7,91
4p
D16
0.8
163.
913
0.6
2.0
DIC
7,87
37,
871
7,88
37,
916
Ord
ered
A0.
16(0
.01,
0.30
)0.
25(0
.14,
0.36
)—
—C
0.09
(0.0
1,0.
22)
—0.
20(0
.10,
0.30
)—
E0.
75(0
.65,
0.86
)0.
75(0
.64,
0.86
)0.
80(0
.70,
0.90
)1.
00(1
.00–
1.00
)D
bar
2,76
02,
752
2,80
42,
985
pD
181.
418
6.3
149.
15.
9D
IC2,
941
2,93
82,
953
2,99
1
Not
es.
Ais
the
gen
etic
con
trib
uti
on;C
isth
eco
mm
onen
viro
nm
ent
con
trib
uti
on;
Eis
the
un
iqu
een
viro
nm
ent
con
trib
uti
on.D
bar:
Dev
ian
ce.p
D:E
ffec
tive
nu
mbe
rof
para
met
ers.
DIC
:Bay
esia
nde
vian
cein
form
atio
ncr
iter
ion
.95%
cred
ible
inte
rval
sw
ith
inpa
ren
thes
es.
828 QUARTERLY JOURNAL OF ECONOMICS
IV.A. Equal Environment Assumption
Critics of the classical twin design cite a number of allegedfailures of the equal environment assumption, including that MZtwins are more likely to interact, and that parents, on average,give MZ twins more similar treatment (Pam et al. 1996). Indeed,Bjorklund, Jantti, and Solon (2005) have shown, using a data setwith nine different sibling types, that estimates of the variancecomponents in income do change substantially when the equalenvironment assumption is relaxed. In the context of researchon personality and IQ, the evidence is, however, fairly convincingthat any bias that arises from the equal environment assumptionis not of first order. Most importantly, for measures of person-ality and cognitive ability, studies of MZ and DZ twins rearedapart tend to produce estimates of heritability similar to thoseusing twins reared together (Bouchard 1998). Because studies oftwins reared apart do not rely on the equal environments as-sumption, it is unlikely that the assumption is a major source ofbias. Second, although it is true that MZ twins report a higherfrequency of contact with one another than DZ twins, twin sim-ilarity has been shown to cause greater contact rather than viceversa (Posner et al. 1996). Other studies have failed to find a sig-nificant relationship between similarity and contact. For example,one large study found that frequency of contact is not correlatedwith similarity in social attitudes (Martin et al. 1986). Third, theclaim that the greater similarity of MZ twins is due to more uni-form parental influences rests on fairly weak empirical ground.Measures of the degree of similarity in parental treatment turnout to not be correlated with similarity in IQ or other personal-ity measures (Bouchard et al. 1990). Also, in the relatively rarecases where parents miscategorize their twins as MZ instead ofDZ (or the converse), differences in cognitive ability and personal-ity persist (Bouchard and McGue 2003). Finally, we note that ourestimated Cs are very low, and it would appear that the Bayesianestimator, if anything, overstates the importance of shared envi-ronment compared to other standard estimators.9
9. It is clear by inspection that a method of moments estimator would producenonsensical negative estimates of common environment. When continuous ACEmodels are estimated using maximum likelihood in MPLUS (Muthen and Muthen2006) and bootstrapping the standard errors, estimated Cs are always equal tozero, and the estimated heritabilities are 0.21 for risk aversion, 0.31 for giving,0.29 for risk investment, and 0.35 for risk assessment. All estimates of A aresignificant at the 5% level.
GENETIC VARIATION IN PREFERENCES 829
IV.B. Measurement Error
In the simplest case, where the studied preference is observedwith mean zero random error, we can think of the unique environ-ment component as being composed of two terms, Eij = E∗
i j + εi j ,where εi j is a mean zero variable with variance σ 2
ε and is i.i.d.across time. Under these assumptions, it is easy to show that theestimates of A and C need to be scaled up by a factor of 1/(1 − σ 2
ε ).For example, under the conservative assumption of a retest corre-lation of .8, this would imply a σ 2
ε of .2, and therefore the estimatesof A and C would need to be scaled up by 25%, that is, to some-where between 0.18 and 0.41 for A in our ACE models. There issurprisingly little evidence on test–retest stability in economic ex-periments. One recent paper (Brosig, Riechmann, and Weimann2007) examined the temporal stability of individual behavior inmodified dictator and prisoner’s dilemma games and found thatindividual behavior is unstable across time in a given game. How-ever, the authors used a concept of stability that is not easilymapped to an estimate of σ 2
ε . Other papers have estimated errorrates from identical responses to items, typically finding reversalrates on the order of 10%–20% (Harless and Camerer 1994; Heyand Orme 1994).
IV.C. Representativeness
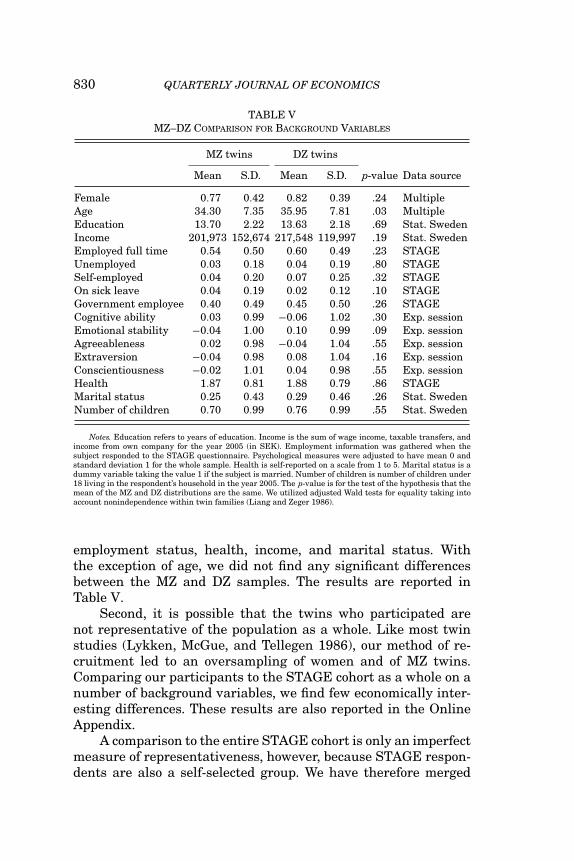
Compared to most experimental work, our sample is an im-provement in terms of representativeness because we draw oursubjects from a population-based registry and not a pool of collegestudents. Yet it is important to establish the “selectivity” of oursample. In particular, three questions arise. First, are the MZand DZ twins who agree to participate drawn from similar envi-ronments? Second, to what extent does our method of samplinglead to overrecruitment of subjects with certain characteristics?If any such characteristics are associated with heritability, thenestimates of variance components will be biased. Third, in light ofthe fairly skewed ratio of MZ twins to DZ twins in our sample, arethere any reasons to believe that this has affected our estimates?
A basic assumption of the ACE model is that MZ twins andDZ twins are drawn from the same environment. We have al-ready demonstrated that in terms of experimental outcomes, theMZ and DZ distributions appear to be the same. To further inves-tigate this hypothesis, we conducted a battery of tests for equal-ity of background variables including gender, years of education,
830 QUARTERLY JOURNAL OF ECONOMICS
TABLE VMZ–DZ COMPARISON FOR BACKGROUND VARIABLES
MZ twins DZ twins
Mean S.D. Mean S.D. p-value Data source
Female 0.77 0.42 0.82 0.39 .24 MultipleAge 34.30 7.35 35.95 7.81 .03 MultipleEducation 13.70 2.22 13.63 2.18 .69 Stat. SwedenIncome 201,973 152,674 217,548 119,997 .19 Stat. SwedenEmployed full time 0.54 0.50 0.60 0.49 .23 STAGEUnemployed 0.03 0.18 0.04 0.19 .80 STAGESelf-employed 0.04 0.20 0.07 0.25 .32 STAGEOn sick leave 0.04 0.19 0.02 0.12 .10 STAGEGovernment employee 0.40 0.49 0.45 0.50 .26 STAGECognitive ability 0.03 0.99 −0.06 1.02 .30 Exp. sessionEmotional stability −0.04 1.00 0.10 0.99 .09 Exp. sessionAgreeableness 0.02 0.98 −0.04 1.04 .55 Exp. sessionExtraversion −0.04 0.98 0.08 1.04 .16 Exp. sessionConscientiousness −0.02 1.01 0.04 0.98 .55 Exp. sessionHealth 1.87 0.81 1.88 0.79 .86 STAGEMarital status 0.25 0.43 0.29 0.46 .26 Stat. SwedenNumber of children 0.70 0.99 0.76 0.99 .55 Stat. Sweden
Notes. Education refers to years of education. Income is the sum of wage income, taxable transfers, andincome from own company for the year 2005 (in SEK). Employment information was gathered when thesubject responded to the STAGE questionnaire. Psychological measures were adjusted to have mean 0 andstandard deviation 1 for the whole sample. Health is self-reported on a scale from 1 to 5. Marital status is adummy variable taking the value 1 if the subject is married. Number of children is number of children under18 living in the respondent’s household in the year 2005. The p-value is for the test of the hypothesis that themean of the MZ and DZ distributions are the same. We utilized adjusted Wald tests for equality taking intoaccount nonindependence within twin families (Liang and Zeger 1986).
employment status, health, income, and marital status. Withthe exception of age, we did not find any significant differencesbetween the MZ and DZ samples. The results are reported inTable V.
Second, it is possible that the twins who participated arenot representative of the population as a whole. Like most twinstudies (Lykken, McGue, and Tellegen 1986), our method of re-cruitment led to an oversampling of women and of MZ twins.Comparing our participants to the STAGE cohort as a whole on anumber of background variables, we find few economically inter-esting differences. These results are also reported in the OnlineAppendix.
A comparison to the entire STAGE cohort is only an imperfectmeasure of representativeness, however, because STAGE respon-dents are also a self-selected group. We have therefore merged

GENETIC VARIATION IN PREFERENCES 831
our experimental data with information on educational attain-ment, marital status, and income from Statistics Sweden and canthus further examine how our sample compares to the populationmean for the cohort born 1959 to 1985. The population marriagerate for women is 36% and is 29% for men. This is slightly higherthan what we observe in our experimental sample. For income,the population averages are close to those of our participants. Onaverage men earn 247,000 SEK, whereas our male subjects earn244,000 SEK. For women the corresponding figures are 181,000and 197,000. Finally, we find that the average years of educationin the cohort as a whole are 12.09 for men and 12.49 for women,which is slightly more than one year less than the average for ourexperimental sample.
The upshot of this discussion is that our method of samplingleads to mild overrecruitment of subjects who are younger thanaverage, are less likely to be married, and have fewer childrenon average. There is also modest overrecruitment of subjects withbetter than average educational attainment. Is this above-averageeducational attainment of our subjects a source for concern? Forinstance, it has been suggested that the heritability of intelligencemight be moderated by social stratum (Turkheimer et al. 2003),at least in children, and a similar argument might apply to theeffect of educational attainment on our outcome variables. To in-vestigate this, we modify the continuous version of our baselinemodel to allow for interaction between A and years of education.10
The fit of the new model is slightly better for risk aversion andslightly worse for the other three variables, suggesting that theinteraction between A and education should not be included. Forrisk aversion, heritability increased somewhat, to 0.21 (95% CI0.02, 0.39), compared to the baseline model.11
Finally, there is a third, more subtle way in which recruitmentbias may be affecting our estimates. A plausible explanation forthe overrecruitment of MZ twins is that because MZ twins arein more frequent contact with each other, it is easier for them tocoordinate on a date and time. The concern here is that coordina-tion costs, or willingness to participate more generally, might be
10. This model is χMZi j = Ai + β × Ai × Educationi j + Ci + Eij for MZ twins
and χDZi j = A1i + A2i j + β × (A1i + A2i j ) × Educationi j + Ci + Eij for DZ twins.
11. The DIC for the risk aversion, risk investment, risk assessment, anddictator game interaction models are 7,813, 3,881, 3,698, and 4,919, respectively.New baseline models were run to account for the fact that the interaction modelswere based on fewer observations due to missing values for the years of educationvariable. The baseline DICs are 7,824, 3,872, 3,695, and 4,915.
832 QUARTERLY JOURNAL OF ECONOMICS
associated with behavioral similarity. If so, this will inflate cor-relations, leading to an upward bias in the estimates of A andC. If this form of selection is more severe for MZ or DZ twins, itwill also bias the estimates of the relative importance of commonenvironmental and genetic influences. A reasonable proxy vari-able for costs of coordination is the frequency of contact betweentwins. Self-reported data on frequency of contact are available inSTAGE.12 When we compare twins who took part in our studywith those who did not, there is a practically and statisticallysignificant difference in the anticipated direction. MZ twins whoparticipated in the study report a frequency of contact of 260 in-teractions per year, whereas those who did not participate report234 interactions per year. The corresponding figures for DZ twinsare 199 and 155. These differences are highly significant. In otherwords, frequency of contact is a robust predictor of participation.The crucial question, however, is whether frequency of contact pre-dicts behavioral similarity. To test this, we regress the absolutevalue of the within-pair difference in giving and the three mea-sures of risk on the average self-reported frequency of contact.Controlling for zygosity, the coefficient on frequency of contact isnever significant. In other words, a reasonable proxy variable for“costs of coordination” does not seem to be related to behavioralsimilarity.
A second robustness test is to take variables that are avail-able for the STAGE cohort in its entirety and ask whether thereare any systematic differences between subjects who participatedin our experiments and those who did not, in terms of correlations.If correlations in health, income, years of education, and the nu-merous other variables we investigate are consistently higher inthe experimental sample, this would then suggest that these area self-selected group with greater concordance in general. The re-sults from this exercise are reported in Table A2 of the OnlineAppendix of this paper. There is no tendency for the patterns ofcorrelations to differ between the two groups.
12. We construct the frequency of contact variable as follows. Subjects whoreport at least one interaction (by e-mail, telephone, or letter) per day are assigneda value of 365. Subjects who report less than one interaction per day are simplyassigned a value equal to the number of interactions per year. Interestingly, fre-quency of contact also provides a falsification test of the basic twin model. Becausethis variable is the same for both twins in a pair, it cannot possibly be heritable. Ahigher MZ correlation than DZ correlation would then suggest that measurementerrors are more correlated in MZ twins. Fortunately, this turns out not to be thecase. In our experimental sample, the MZ correlation is .76 and the DZ correlationis .71. In STAGE as a whole, the correlations are .77 and .75.
GENETIC VARIATION IN PREFERENCES 833
IV.D. Genetic Nonadditivity
The models we use—like most behavior genetic models—assume that genes influence a trait in an additive manner. That is,the genetic effect is simply the sum of all individual effects. This isby far the most common way to achieve identification. It has longbeen known that the twin model suffers from parameter indeter-minacy when, for example, dominance effects are present becausethe number of parameters to be estimated exceeds the number ofindependently informative equations (Keller and Coventry 2005).The fact that our DZ correlations are less than half of the MZcorrelations could be the result of sampling variation. But it couldalso be an indication that there is some nonadditive genetic vari-ation present. For one of our risk measures, risk assessment, weare in fact able to reject the hypothesis that the DZ correlationis at least half the MZ correlation. In Table A5 of the Online Ap-pendix to this paper, we report the results of an ADE model andshow that this model fits the data better, as judged by the DICcriterion.
A more rigorous way to test for nonadditivity would be toextend the data set to include also sibling, parent–child, or evencousin data. Though our data do not contain such information,Coventry and Keller (2005) recently completed a major review ofall published parameter estimates using the extended family de-sign compared to classical twin design estimates derived from thesame data. The authors report that the estimates of broad heri-tability in twin studies are fairly accurate. However, the classicaltwin design overestimates the importance of additive genetic vari-ation and underestimates the importance of nonadditive geneticvariation. Evidence from studies of adoptees points in the samedirection. In a recent metastudy by Loehlin (2005), the authorreports average correlations of .13 for personality and .26 for atti-tudes in families with children reared by their biological parents.However, the correlations for personality and attitudes are .04and .07, respectively, between adopted children and their nonbi-ological parents, but .13 and .20 between adopted children andtheir biological parents (Loehlin 2005). Because only additive ge-netic variance is transmissible across generations (Fisher 1930),doubling the parent–child correlation produces an upper bound onthe estimate of narrow heritability. The fact that this upper boundis lower than estimates derived from twin studies reinforces thepoint that there is probably nonadditive variation in personality

834 QUARTERLY JOURNAL OF ECONOMICS
and attitudes. The low DZ correlations we observe suggest that asimilar situation obtains for economic preferences.
We thus concur with the conclusion in Coventry and Keller(2005), namely that the estimates from the classical twin designshould not be interpreted literally, but are nevertheless veryuseful because they produce reasonably accurate estimates ofbroad heritability, and hence of genes as a source of phenotypicvariation.
V. DISCUSSION
In this paper, we have used standard behavior genetic tech-niques to decompose variation in preferences for giving and risktaking into environmental and genetic components. We documenta significant genetic effect on risk taking and giving, with genesexplaining approximately twenty percent of phenotypic variationin the best-fitting models. The estimated effect of common envi-ronment, by contrast, is smaller. Though these results are clearlyin line with the behavior genetic literature (Turkheimer 2000), theimplications of these findings in the context of modern economicsmerit further comment.
In particular, it is important to exercise great care in inter-preting the estimates of variance components. Contrary to whatis sometimes supposed, they are estimates of the proportion ofvariance explained and thus do not shed any direct light on thedeterminants of average phenotype. This distinction is important.For instance, if genetic transmission in a studied population isuniform, then a trait that is primarily acquired through genesmight actually show low, or zero, heritability. The same argu-ment is true for common environment. A low estimated C couldsimply mean that there is little variation in how parents cultur-ally transmit preferences or values to their children. This caveatis especially important to bear in mind when interpreting heri-tability estimates from a study population such as ours, where itseems plausible to assume that environmental variation betweenfamilies is modest.
Like any other descriptive statistic, a heritability estimate isspecific to the population for which it is estimated, and, thoughour findings are probably informative about heritability in othermodern Western societies, we caution against further extrapola-tion. Variation in our study population is in all likelihood smallrelative to cross-country differences or historical environmental
GENETIC VARIATION IN PREFERENCES 835
differences that could potentially generate greater variation inrisk preferences and giving. Perhaps the most striking and in-tuitive illustration of this point comes from the study of income,which is moderately heritable in Sweden as well as in the UnitedStates (Bjorklund, Jantti, and Solon 2005; Taubman 1976). In re-cent centuries incomes have increased manifold, and even todayan individual’s country of origin is by far the most important deter-minant of that individual’s income (Sala-i-Martin 2006). In otherwords, a heritability statistic says little about the malleability ofa trait with respect to environmental interventions (Goldberger1979).
Caution should also be exercised in interpreting our estimateof unique environment (E), because it is not possible to sepa-rately identify unique environment and measurement error with-out knowledge of test–retest correlations (Plomin and Daniels1987; Plomin et al. 2001b). This is because if there is noise inthe elicitation of preferences, such noise will be subsumed underthe estimate of unique environmental effects.13 Further, a num-ber of important sources of unique environmental effects, such asaccidents, are nonsystematic in nature. The observation that thehuman genome could not possibly specify every synaptic connec-tion in the brain and that random events could lead to differentdevelopmental outcomes, even in genetically identical individu-als, falls into this category (Molenaar, Boomsma, and Dolan 1993;Jensen 1997).
Economists have traditionally expressed agnosticism aboutthe causal mechanisms behind individual differences in prefer-ences. Although choosing to overlook genetic explanations is oftenwell motivated on the grounds of parsimony, especially in stud-ies taking a historical or geographical perspective, our findings,combined with the preexisting behavior genetics literature, un-cover a unique and potentially important source of preferenceheterogeneity. Despite ample experimental evidence, the originsof individual behavioral variation in economic games have thus farremained elusive, and many attempts to find theoretically appeal-ing and empirically stable correlates to preferences elicited exper-imentally have yielded contradictory results (Camerer 2003). If
13. This result also has implications for the genome-wide association stud-ies that are currently under way, examining genetic variation across the humangenome and behavior in experimental games. Noise in the elicitation of, for in-stance, social preferences is likely to frustrate these efforts. Multiple measurementwould be one way of dealing with the problem.
836 QUARTERLY JOURNAL OF ECONOMICS
preferences are indeed under moderate genetic influence, any at-tempt to understand heterogeneity in preferences without takingthis into account will be incomplete.
Recently, much interest has been directed toward finding bi-ological or neurological correlates of experimental behavior. Ofcourse, this does not necessarily imply either causality or a ge-netically mediated association. However, the fact that many ofthe biological variables with known associations to individual dif-ferences in strategies or preferences are strongly heritable doeslend some support, if only circumstantial, to our findings. For in-stance, financial risk taking has been claimed to vary over themenstrual cycle in women (Broder and Hohmann 2003; Chen,Katuscak, and Ozdenoren 2005) and correlates both with facialmasculinity and with circulating testosterone levels in men (Api-cella et al. 2008). A number of imaging studies have also exploredthe neural correlates of both giving and financial risk taking.One study found activation in the striatum both on receivingmoney and on donating to charity (Moll et al. 2006). Another studyfound similar activation patterns and demonstrated enhanced ac-tivation when the charitable donation was voluntary (Harbaugh,Mayr, and Burghart 2007). In the context of financial risk tak-ing, Kuhnen and Knutson (2005) demonstrated that risk-seekingis associated with activation in the nucleus accumbens, whereasrisk aversion is associated with activation in the insula. In gen-eral, brain structure is under strong genetic influence, thoughthere are substantial regional differences in heritability (Thomp-son et al. 2001; Toga and Thompson 2005). The same is true forhormone levels (Harris, Vernon, and Boomsma 1998; Bartels et al.2003).
VI. CONCLUSIONS
In this paper, we have presented an empirical investigationinto the relative contributions of individual differences in genesand environment to observed variation in economic preferences forrisk and giving. Notwithstanding the fact that all twin siblings areof the same age and were raised together in the same family, ge-netically identical MZ twins still exhibit much greater similarityin their preferences for risk and giving than do DZ twins. Althoughour results do not allow us to be as assertive as Sir Francis Galton,they do suggest that humans are endowed with genetic variationin their proclivity to donate money to charity and to take risks.

GENETIC VARIATION IN PREFERENCES 837
By now there are a plethora of studies exploring the sources ofindividual variation in economic experiments and games, yet upuntil recently considerations of genetic influences have remainedrelatively absent. Here we have argued that this failure to con-sider genes obscures an important source of preference hetero-geneity. Ultimately, we hope that a better understanding of theunderlying individual genetic heterogeneity14 in economic prefer-ences and the adaptive pressures under which these preferencesevolved will lead to a more comprehensive economic science thatcan bridge some of the unexplained gaps between empirical dataand economic theory (Cosmides and Tooby 1994; Burnham 1997).
Finally, our findings suggest a number of directions for futureresearch. In recent years we have witnessed rapid advancement inthe field of molecular genetics, including the initial tentative stepstoward uncovering the complex genetic architecture underlyingvariation in individual personality and preferences. In fact, we areaware of one paper that has already uncovered a polymorphism onthe AVPR1a gene that is associated with generosity in the dictatorgame (Knafo et al. 2008). Two recent papers also report that car-riers of the 7R allele on the Dopamine Receptor D4 gene (DRD4)take greater financial risks in laboratory experiments (Dreberet al. 2009; Kuhnen and Chiao 2009). The identification of spe-cific genes, or more likely combinations of genes, associated withparticular traits holds promise for economic research. Most im-portantly, as noted by Benjamin et al. (2007), it will allow thestudy of interactions between genotypes and policies to better pre-dict the consequences of policy for individuals. A second directionfor future research is to look beyond the laboratory and insteadconsider field proxies for the underlying preferences. There arewell-known issues associated with the generalizability of labo-ratory findings (Levitt and List 2007), and documenting similargenetic influences in the field therefore ought to be a priority.A third, and perhaps most natural, direction is to try to dis-entangle additive and nonadditive genetic variation. We antici-pate that studies employing the extended family design will shedmore light on this issue. The fairly low DZ correlations we ob-serve provide some tentative, but far from conclusive, evidence fornonadditivity.
14. Genetic variation can be maintained in equilibrium for a number of rea-sons. For a discussion of this difficult subject in the context of personality differ-ences, see two recent papers by Dall, Houston, and McNamara (2004) and Penke,Denissen, and Miller (2007).
838 QUARTERLY JOURNAL OF ECONOMICS
DEPARTMENT OF ECONOMICS, MASSACHUSETTS INSTITUTE OF TECHNOLOGY
POLITICAL SCIENCE DEPARTMENT, UNIVERSITY OF CALIFORNIA AT SAN DIEGO
DEPARTMENT OF ECONOMICS, STOCKHOLM SCHOOL OF ECONOMICS
DEPARTMENT OF MEDICAL EPIDEMIOLOGY AND BIOSTATISTICS, KAROLINSKA INSTITUTET
DEPARTMENT OF ECONOMICS, STOCKHOLM SCHOOL OF ECONOMICS
REFERENCES
Alford, John R., Carolyn L. Funk, and John R. Hibbing, “Are Political OrientationsGenetically Transmitted?” American Political Science Review, 99 (2005), 153–167.
Apicella, Coren L., Anna Dreber Almenberg, Benjamin Campbell, Peter Gray,Moshe Hoffman, and Anthony C. Little, “Testosterone and Financial Risk-Taking,” Evolution and Human Behavior, 29 (2008), 384–390.
Bardsley, Nicholas, “Dictator Game Giving: Altruism or Artefact?” ExperimentalEconomics, doi 10.1007/s10683-007-9172-2, 2007.
Bartels, Meike, Stephanie M. Van den Berg, Frans Sluyter, Dorret I. Boomsmaa,and Eco J. C. de Geus, “Heritability of Cortisol Levels: Review and Simultane-ous Analysis of Twin Studies,” Psychoneuroendocrinology, 28 (2003), 121–137.
Behrman, Jere R., and Paul Taubman, “Is Schooling Mostly in the Genes? Nature–Nurture Decomposition Using Data on Relatives,” Journal of Political Econ-omy, 97 (1989), 1425–1446.
Benjamin, Daniel J., Christopher F. Chabris, Edward L. Glaeser, VilmundurGudnason, Tamara B. Harris, David Laibson, Lenore Launer, and ShaunPurcell, “Genoeconomics,” in Biosocial Surveys, Maxine Weinstein, James W.Vaupel, and Kenneth W. Wachter, eds. (Washington, DC: National AcademiesPress, 2007).
Bjorklund, Anders, Markus Jantti, and Gary Solon, “Influences of Nature andNurture on Earnings Variation: A Report on a Study of Various Sibling Typesin Sweden,” in Unequal Chances: Family Background and Economic Success,Samuel Bowles, Herbert Gintis, and Melissa Osborne Groves, eds. (Princeton,NJ: Princeton University Press, 2005).
——, “Nature and Nurture in the Intergenerational Transmission of SocioeconomicStatus: Evidence from Swedish Children and Their Biological and RearingParents,” Advances in Economic Analysis and Policy, 7 (2007), 1753–1753.
Bjorklund, Anders, Mikael Lindahl, and Erik Plug, “The Origins of Intergenera-tional Associations: Lessons from Swedish Adoption Data,” Quarterly Journalof Economics, 121 (2006), 999–1028.
Bouchard, Thomas J. Jr., “Genetic and Environmental Influences on Adult Intelli-gence and Special Mental Abilities,” Human Biology, 70 (1998), 257–279.
Bouchard, Thomas J. Jr., David T. Lykken, Matt McGue, Nancy L. Segal, and AukeTellegen, “Sources of Human Psychological Differences: The Minnesota Studyof Twins Reared Apart,” Science, 250 (1990), 223–228.
Bouchard, Thomas J. Jr., and Matt McGue, “Genetic and Environmental Influenceson Human Psychological Differences,” Journal of Neurobiology, 54 (2003), 4–45.
Bouchard, Thomas J. Jr., Matt McGue, David T. Lykken, and Auke Tellegen, “In-trinsic and Extrinsic Religiousness: Genetic and Environmental Influencesand Personality Correlates,” Twin Research, 2 (1999), 88–98.
Bouchard Thomas J. Jr., and Peter Propping, eds. Twins as a Tool of BehavioralGenetics: Report of the Dahlme Workshop on What Are the Mechanisms Medi-ating the Genetic and Environmental Determinants of Behavior? (Chichester,UK: John Wiley, 1993).
Bowles, Samuel, Herbert Gintis, and Melissa Osborne Groves, eds. UnequalChances: Family Background and Economic Success (Princeton, NJ: PrincetonUniversity Press, 2005).
Broder, Arndt, and Natalia Hohmann, “Variations in Risk Taking Behavior overthe Menstrual Cycle: An Improved Replication,” Evolution and Human Be-havior, 24 (2003), 391–398.
GENETIC VARIATION IN PREFERENCES 839
Brooks, Stephen P., and Andrew Gelman, “General Methods for Monitoring Con-vergence of Iterative Simulations,” Journal of Computational and GraphicalStatistics, 7 (1998), 434–455.
Brosig, Jeannette, Thomas Riechmann, and Joachism Weimann, “Selfish in theEnd? An Investigation of Consistency and Stability of Individual Behavior,”MPRA Paper 2035, University Library of Munich, 2007.
Burnham, Terence C., Essays on Genetic Evolution and Economics, Ph.D. thesis,Harvard University, 1997.
Burton, Paul R., Katrina J. Tiller, Lyle C. Gurrin, William O. C. M. Cookson, Q. A.William Musk, and Lyle J. Palmer, “Genetic Variance Components Analysisfor Binary Phenotypes Using Generalized Linear Mixed Models (GLMMS)and Gibbs Sampling,” Genetic Epidemiology, 17 (1999), 118–140.
Camerer, Colin F., Behavioral Game Theory: Experiments in Strategic Interaction(Princeton, NJ: Princeton University Press, 2003).
Cesarini, David, Christopher T. Dawes, James H. Fowler, Magnus Johannesson,Paul Lichtenstein, and Bjorn Wallace, “Heritability of Cooperative Behaviorin the Trust Game,” Proceedings of the National Academy of Sciences, 104(2008), 15,631–15,634.
Chen,Yan, Peter Katuscak, and Emre Ozdenoren, “Why Can’t a Woman Bid MoreLike a Man?” Mimeo, University of Michigan, 2005.
Cipriani, Marco, Paola Giuliani, and Olivier Jeanne, “Like Mother Like Son? Ex-perimental Evidence on the Transmission of Values from Parents to Children,”IZA Discussion Paper No. 2768, 2007.
Cosmides, Leda, and John Tooby, “Better Than Rational: Evolutionary Psychol-ogy and the Invisible Hand,” American Economic Review, 84 (1994), 327–332.
Coventry, William L., and Matthew C. Keller, “Estimating the Extent of ParameterBias in the Classical Twin Design: A Comparison of Parameter Estimatesfrom Extended Twin–Family and Classical Twin Designs,” Twin Researchand Human Genetics, 8 (2005), 214–223.
Dall Sasha, R. X., Alasdair I. Houston, and John M. McNamara, “The BehavioralEcology of Personality: Consistent Individual Differences from an AdaptivePerspective,” Ecology Letters, 7 (2004), 734–739.
Dohmen, Thomas, Armin Falk, David Huffman, and Uwe Sunde, “The Intergener-ational Transmission of Risk and Trust Attitudes,” IZA Discussion Paper No.2380, 2006.
Dohmen, Thomas, Armin Falk, David Huffman, Uwe Sunde, Jurgen Schupp, andGert G. Wagner, “Individual Risk Attitudes: New Evidence from a Large,Representative, Experimentally-Validated Survey,” IZA Discussion PaperNo. 1730, 2005.
Dreber, Anna, Coren L. Apicella, Daniel T. A. Eisenberg, Justin R. Garcia, RichardZamore, J. Kuji Lum, and Benjamin C. Campbell, “The 7R Polymorphism inthe Dopamine Receptor D4 Gene (DRD4) Is Associated with Financial Risk-Taking in Men,” Evolution and Human Behavior, 30 (2009), 85–92.
Eckel, Catherine C., and Philip J. Grossman, “Altruism in Anonymous DictatorGames,” Games and Economic Behavior, 16 (1996), 181–191.
Fisher, Ronald A., The Genetical Theory of Natural Selection (Oxford, UK: OxfordUniversity Press, 1930).
Fong, Christina M., “Evidence from an Experiment on Charity to Welfare Recip-ients: Reciprocity, Altruism and the Empathic Responsiveness Hypothesis,”Economic Journal, 117 (2007), 1008–1024.
Forsythe, Robert, Joel L. Horowitz, N. E. Savin, and Martin Sefton, “Fairness inSimple Bargaining Experiments,” Games and Economic Behavior, 6 (1994),347–369.
Fowler, James H., Christopher T. Dawes, and Laura Baker, “Genetic Variation inPolitical Participation,” American Political Science Review, 2 (2008), 233–248.
Galton, Francis, “The History of Twins, as a Criterion of the Relative Powers ofNature and Nurture,” Fraser’s Magazine, 12 (1875), 566–576.
Gelman, Andrew, John B. Carlin, Hal S. Stern, and Donald B. Rubin, BayesianData Analysis (New York: Chapman & Hall/CRC, 2004).
Goldberger, Arthur S., “Twin Methods: A Skeptical View,” in Kinometrics: Determi-nants of Socioeconomic Success within and between Families, Paul Taubman,ed. (Amsterdam: North-Holland, 1977).
840 QUARTERLY JOURNAL OF ECONOMICS
——, “Heritability,” Economica, 46 (1979), 327–347.Hamilton, William D., “The Genetical Evolution of Social Behaviour I and II,”
Journal of Theoretical Biology, 7 (1964), 1–52.Harbaugh, William T., Ulrich Mayr, and Daniel R. Burghart, “Neural Responses
to Taxation and Voluntary Giving Reveal Motives for Charitable Donations,”Science, 316 (2007), 1622–1625.
Harless, David W., and Colin F. Camerer, “The Predictive Utility of GeneralizedExpected Utility Theories,” Econometrica, 62 (1994), 1251–1289.
Harris, Julie Aitken, Philip A. Vernon, and Dorret I. Boomsma, “The Heritabil-ity of Testosterone: A Study of Dutch Adolescent Twins and Their Parents,”Behavior Genetics, 28 (1998), 165–171.
Hey, John D., and Chris Orme, “Investigating Generalizations of Expected UtilityTheory Using Experimental Data,” Econometrica, 62 (1994), 1291–1326.
Holt, Charles. A., and Susan K. Laury, “Risk Aversion and Incentive Effects,”American Economic Review, 92 (2002), 1644–1655.
Jang, Kerry L., W. John Livesley, and Philip A. Vernon, “Heritability of the BigFive Personality Dimensions and Their Facets: A Twin Study,” Journal ofPersonality, 64 (1996), 577–592.
Jensen, Arthur R., “The Puzzle of Nongenetic Variance,” in Heredity, Intelligence,and Environment, Robert J. Sternberg, and Elena L. Grigorenko, eds. (Cam-bridge, UK: Cambridge University Press, 1997).
Keller, Matthew C., and William L. Coventry, “Quantifying and Addressing Param-eter Indeterminacy in the Classical Twin Design,” Twin Research and HumanGenetics, 8 (2005), 201–213.
Kirk, Kathrine M., Hermine H. Maes, Michael C. Neal, Andrew C. Heath, NicholasG. Martin, and Lyndon J. Eaves, “Frequency of Church Attendance in Aus-tralia and the United States: Models of Family Resemblance,” Twin Research,2 (1999), 99–107.
Knafo, Ariel, Salomon Israel, Ariel Darvasi, Rachel Bachner-Melman, FlorinaUzefovsky, Lior Cohen, Esti Feldman, Elad Lerer, Efrat Laiba, Yael Raz,Lubov Nemanov, Inga Gritsenko, Christian Dina, Galila Agam, Brian Dean,Gary Bornstein, and Richard P. Ebstein, “Individual Differences in Allocationof Funds in the Dictator Game Associated with Length of the Arginine Vaso-pressin 1a Receptor (AVPR1a) RS3 Promoter Region and Correlation betweenRS3 Length and Hippocampal mRNA,” Genes, Brain and Behavior, 7 (2008),266–275.
Koenig, Laura B., Matt McGue, Robert F. Krueger, and Thomas J. Bouchard Jr.,“Genetic and Environmental Influences on Religiousness: Findings for Ret-rospective and Current Religiousness Ratings," Journal of Personality, 73(2005), 471–488.
Kuhnen, Camelia M., and Joan Y. Chiao, “Genetic Determinants of Financial RiskTaking,” PLoS ONE, 4 (2009).
Kuhnen, Camelia M., and Brian Knutson, “The Neural Basis of Financial RiskTaking,” Neuron, 47 (2005), 763–770.
Levitt, Steven D., and John A. List, “What do Laboratory Experiments Measur-ing Social Preferences Tell Us about the Real World,” Journal of EconomicPerspectives, 21 (2007), 153–174.
Liang, Kung-Yee, and Scott L. Zeger, “Longitudinal Data Analysis Using General-ized Linear Models,” Biometrika, 73 (1986), 13–22.
Lichtenstein, Paul, Patrick F. Sullivan, Sven Cnattingius, Margaret Gatz, SofieJohansson, Eva Carlstrom, Camilla Bjork, Magnus Svartengren, Alicja Volk,Lars Klareskog, Ulf de Faire, Martin Schalling, Juni Palmgren, and Nancy L.Pedersen, “The Swedish Twin Registry in the Third Millennium: An Update,”Twin Research and Human Genetics, 9 (2006), 875–882.
List, John A. “On the Interpretation of Giving in Dictator Games,” Journal ofPolitical Economy, 115 (2007), 482–494.
Loehlin, John C., “Some Methodological Problems in Cattel’s Multiple AbstractVariance Analysis,” 72 (1965), 156–161.
——, “Resemblance in Personality and Attitudes between Parents and Their Chil-dren: Genetic and Environmental Contributions,” in Unequal Chances: Fam-ily Background and Economic Success, Samuel Bowles, Herbert Gintis, andMelissa Osborne Groves, eds. (Princeton, NJ: Princeton University Press,2005).
GENETIC VARIATION IN PREFERENCES 841
Loh, Cheng Yin, and John M. Elliot, “Cooperation and Competition as a Functionof Zygosity in 7- to 9-Year-Old Twins,” Evolution and Human Behavior, 19(1998), 397–411.
Lykken, David T., Matthew K. McGue, and Auke Tellegen, “Recruitment Bias inTwin Research: The Rule of Two-Thirds Reconsidered,” Behavior Genetics, 17(1986), 343–362.
Martin, Nicholas G., Lyndon J. Eaves, Andrew C. Heath, Rosemary Jardine, LynnM. Feingold, and Hans J. Eysenck, “Transmission of Social Attitudes,” Pro-ceedings of the National Academy of Sciences, 83 (1986), 4364–4368.
Mather, Kenneth, and John L. Jinks, An Introduction to Biometrical Genetics(London: Chapman and Hall, 1977).
Molenaar, Peter C. M., Dorret I. Boomsma, and Conor V. Dolan, “A Third Sourceof Developmental Differences,” Behavior Genetics, 23 (1993), 519–524.
Moll, Jorge, Frank Krueger, Roland Zahn, Matteo Pardini, Ricardo de Oliveira-Souza, and Jordan Grafman, “Human Fronto-Mesolimbic Networks GuideDecisions about Charitable Donation,” Proceedings of the National Academyof Sciences, 103 (2006), 15,623–15,628.
Muthen, Linda K., and Bengt O. Muthen “Mplus. Statistical Analysis with LatentVariables. User’s Guide,” Version 4.1 (Los Angeles, CA: 2006).
Neale, Michael C., and Hermine H. M. Maes, Methodology for Genetic Studies ofTwins and Families (Dordrecht, the Netherlands: Kluwer Academic, 2004).
Neisser, Ulric, Gwyneth Boodoo, Thomas J. Bouchard Jr., A. Wade Boykin, NathanBrody, Stephen J. Ceci, Diane F. Halpern, John C. Loehlin, Robert Perloff,Robert J. Sternberg, and Susana Urbina, “Intelligence: Knowns and Un-knowns,” American Psychologist, 51 (1996), 77–101.
Pam, Alvin, Susan S. Kemker, Colin A. Ross, and R. Golden, “The Equal Envi-ronments Assumption in MZ–DZ Twin Comparisons: An Untenable Premiseof Psychiatric Genetics?” Acta Geneteticae Medicae Gemellologiae (Roma), 45(1996), 349–360.
Penke, Lars, Jaap J. A. Denissen, and Geoffrey F. Miller, “The Evolutionary Ge-netics of Personality,” European Journal of Personality, 21 (2007), 549–587.
Plomin, Robert, Kathryn Asbury, P. G. Dip, and Judith Dunn, “Why Are Childrenin the Same Family So Different? Unshared Environment a Decade Later,”Canadian Journal of Psychiatry, 46 (2001b), 225–233.
Plomin, Robert D., and Denise Daniels, “Why Are Children in the Same Family SoDifferent from Each Other?” Behavioral and Brain Sciences, 10 (1987), 1–16.
Plomin, Robert D., John C. DeFries, Gerald E. McClearn, and Peter McGuffin,Behavioral Genetics, 4th ed. (New York: Freeman, 2001a).
Plug, Erik, and Wim Vijverberg, “Schooling, Family Background, and Adoption: IsIt Nature or Is It Nurture?” Journal of Political Economy, 111 (2003), 611–641.
Posner, Samuel F., Laura Baker, Andrew Heath, and Nicholas G. Martin, “SocialContact and Attitude Similarity in Australian Twins,” Behavior Genetics, 26(1996), 123–133.
Rushton, J. Philippe, “Genetic and Environmental Contributions to Pro-social Atti-tudes: A Twin Study of Social Responsibility,” Proceedings of the Royal SocietyB, 271 (2004), 2583–2585.
Rushton, J. Philippe, David W. Fulker, Michael C. Neale, David K. B. Nias, andHans J. Eysenck, “Altruism and Aggression: The Heritability of IndividualDifferences,” Journal of Personality and Social Psychology, 50 (1986), 1192–1198.
Sacerdote, Bruce, “The Nature and Nurture of Economic Outcomes,” AmericanEconomic Review, 92 (2002), 344–348.
——, “How Large Are the Effects from Changes in Family Environment? A Studyof Korean American Adoptees,” Quarterly Journal of Economics, 122 (2007),119–157.
Sala-i-Martin, Xavier, “The World Distribution of Income: Falling Poverty and . . .Covergence, Period,” Quarterly Journal of Economics, 121 (2006), 351–397.
Scurrah, Katrina J., Lyle J. Palmer, and Paul R. Burton, “Variance ComponentsAnalysis for Pedigree-Based Censored Survival Data Using Generalized Lin-ear Mixed Models (GLMMs) and Gibbs Sampling in BUGS,” Genetic Epidemi-ology, 19 (2000), 127–148.
842 QUARTERLY JOURNAL OF ECONOMICS
Segal, Nancy L., and Scott L. Hershberger, “Cooperation and Competition betweenTwins: Findings from a Prisoner’s Dilemma Game,” Evolution and HumanBehavior, 20 (1999), 29–51.
Spiegelhalter, David J., Nicola G. Best, Bradley P. Carlin, and Angelika van derLinde, “Bayesian Measures of Model Complexity and Fit," Journal of the RoyalStatistical Society, Series B (Statistical Methodology, 64 (2002), 583–639.
Stoel, Reinoud D., Eco J. C. De Geus, and Dorret I. Boomsma, “Genetic Analysisof Sensation Seeking with an Extended Twin Design,” Behavior Genetics, 36(2006), 229–237.
Taubman, Paul, “The Determinants of Earnings: Genetics, Family, and Other En-vironments: A Study of White Male Twins,” American Economic Review, 66(1976), 858–870.
Thompson, Paul, Tyrone D. Cannon, Kathrine L. Narr, Theo van Erp, Veli-PekkaPoutanen, Matti Huttunen, Jouko Lonnqvist, Carl-Gustaf Standertskjold-Nordenstam, Jaakko Kaprio, Mohammad Khaledy, Rajneesh Dail, Chris I.Zoumalan, and Arthur W. Toga, “Genetic Influences on Brain Structure,” Na-ture Neuroscience, 4 (2001), 1–6.
Toga, Arthur W., and Paul M. Thompson, “Genetics of Brain Structure and Intel-ligence,” Annual Review of Neuroscience, 28 (2005), 1–23.
True, William R., Andrew C. Heath, Jeffrey F. Scherrer, Brian Waterman, JackGoldberg, Nong Lin, Seth A. Eisen, Michael J. Lyons, and Ming T. Tsuang,“Genetic and Environmental Contributions to Smoking,” Addiction, 92 (1997),1277–1288.
Turkheimer, Eric, “Three Laws of Behavior Genetics and What They Mean,” Cur-rent Directions in Psychological Science, 9 (2000), 160–164.
Turkheimer, Eric, Andreana Haley, Brian D’Onofrio, Mary Waldron, and I. Irv-ing Gottesman, “Socioeconomic Status Modifies Heritability of IQ in YoungChildren,” Psychological Science, 14 (2003), 623–628.
Van den Berg, Stepahnie M., Leo Beem, and Dorret I. Boomsma, “Fitting Ge-netic Models Using Markov Chain Monte Carlo Algorithms with Bugs,” TwinResearch and Human Genetics, 9 (2006), 334–342.
Wallace, Bjorn, David Cesarini, Paul Lichtenstein, and Magnus Johannesson,“Heritability of Ultimatum Game Responder Behavior,” Proceedings of theNational Academy of Sciences, 104 (2007), 15,631–15,634.