genome biology - medicinal genomics · the draft genome and transcriptome of cannabis sativa harm...
TRANSCRIPT

This Provisional PDF corresponds to the article as it appeared upon acceptance. Copyedited andfully formatted PDF and full text (HTML) versions will be made available soon.
The draft genome and transcriptome of Cannabis sativa
Genome Biology 2011, 12:R102 doi:10.1186/gb-2011-12-10-r102
Harm van Bakel ([email protected])Jake M Stout ([email protected])
Atina G Cote ([email protected])Carling M Tallon ([email protected])
Andrew G Sharpe ([email protected])Timothy R Hughes ([email protected])
Jonathan E Page ([email protected])
ISSN 1465-6906
Article type Research
Submission date 11 September 2011
Acceptance date 20 October 2011
Publication date 20 October 2011
Article URL http://genomebiology.com/2011/12/10/R102
This peer-reviewed article was published immediately upon acceptance. It can be downloaded,printed and distributed freely for any purposes (see copyright notice below).
Articles in Genome Biology are listed in PubMed and archived at PubMed Central.
For information about publishing your research in Genome Biology go to
http://genomebiology.com/authors/instructions/
Genome Biology
© 2011 van Bakel et al. ; licensee BioMed Central Ltd.This is an open access article distributed under the terms of the Creative Commons Attribution License (http://creativecommons.org/licenses/by/2.0),
which permits unrestricted use, distribution, and reproduction in any medium, provided the original work is properly cited.
1
The draft genome and transcriptome of Cannabis sativa
Harm van Bakel1, Jake M Stout2,4, Atina G Cote1, Carling M Tallon2, Andrew G Sharpe2,
Timothy R Hughes1,3* and Jonathan E Page2,4*
1Banting and Best Department of Medical Research and Terrence Donnelly Centre for
Cellular and Biomolecular Research, University of Toronto, 160 College St. Room 230,
Toronto, ON, M5S 3E1, Canada
2National Research Council of Canada, Plant Biotechnology Institute, 110 Gymnasium
Place, Saskatoon, SK, S7N 0W9, Canada
3Department of Molecular Genetics, University of Toronto, #4396 Medical Sciences
Building, 1 King’s College Circle, Toronto, ON, M5S 1A8 Canada
4Department of Biology, University of Saskatchewan, 112 Science Place, Saskatoon,
SK, S7N 5E2 Canada
*Correspondence: [email protected], [email protected]
2
Abstract
Background
Cannabis sativa has been cultivated throughout human history as a source of fiber, oil and food, and for
its medicinal and intoxicating properties. Selective breeding has produced cannabis plants for specific
uses, including high-potency marijuana strains and hemp cultivars for fiber and seed production. The
molecular biology underlying cannabinoid biosynthesis and other traits of interest is largely unexplored.
Results
We sequenced genomic DNA and RNA from the marijuana strain Purple Kush using shortread
approaches. We report a draft haploid genome sequence of 534 Mb and a transcriptome of 30,000
genes. Comparison of the transcriptome of Purple Kush with that of the hemp cultivar ‘Finola’ revealed
that many genes encoding proteins involved in cannabinoid and precursor pathways are more highly
expressed in Purple Kush than in ‘Finola’. The exclusive occurrence of ∆9-tetrahydrocannabinolic acid
synthase in the Purple Kush transcriptome, and its replacement by cannabidiolic acid synthase in ‘Finola’,
may explain why the psychoactive cannabinoid ∆9-tetrahydrocannabinol (THC) is produced in marijuana
but not in hemp. Resequencing the hemp cultivars ‘Finola’ and ‘USO-31' showed little difference in gene
copy numbers of cannabinoid pathway enzymes. However, single nucleotide variant analysis uncovered
a relatively high level of variation among four cannabis types, and supported a separation of marijuana
and hemp.
Conclusions
The availability of the Cannabis sativa genome enables the study of a multifunctional plant that occupies
a unique role in human culture. Its availability will aid the development of therapeutic marijuana strains
with tailored cannabinoid profiles and provide a basis for the breeding of hemp with improved agronomic
characteristics.
Keywords

3
Cannabaceae, cannabis, marijuana, hemp, genome, transcriptome, cannabinoid.

4
Background
One of the earliest domesticated plant species, Cannabis sativa L. (marijuana, hemp;
Cannabaceae) has been used for millennia as a source of fibre, oil- and protein-rich
achenes (“seeds”) and for its medicinal and psychoactive properties. From its site of
domestication in Central Asia, the cultivation of cannabis spread in ancient times
throughout Asia and Europe and is now one of the most widely distributed cultivated
plants [1]. Hemp fibre was used for textile production in China more than 6000 years BP
(before present) [2]. Archaeological evidence for the medicinal or shamanistic use of
cannabis has been found in a 2700-year old tomb in north-western China and a Judean
tomb from 1700 years BP [3,4]. Currently cannabis and its derivatives such as hashish
are the most widely consumed illicit drugs in the world [5]. Its use is also increasingly
recognized in the treatment of a range of diseases such as multiple sclerosis and
conditions with chronic pain [6,7]. In addition, hemp forms of cannabis are grown as an
agricultural crop in many countries.
Cannabis is an erect annual herb with a dioecious breeding system, although
monoecious plants exist. Wild and cultivated forms of cannabis are morphologically
variable, resulting in confusion and controversy over the taxonomic organization of the
genus (see [8] for review). Some authors have proposed a monotypic genus, C. sativa,
while others have argued that Cannabis is composed of two species, Cannabis sativa
and Cannabis indica, and some have included a third species, Cannabis ruderalis, in
5
the genus. In light of the taxonomic uncertainty, we use C. sativa to describe the plants
analyzed in this study.
The unique pharmacological properties of cannabis are due to the presence of
cannabinoids, a group of more than 100 natural products that mainly accumulate in
female flowers (“buds”) [9,10]. ∆9-Tetrahydrocannabinol (THC) is the principle
psychoactive cannabinoid and the compound responsible for the analgesic, antiemetic
and appetite-stimulating effects of cannabis [11,12]. Non-psychoactive cannabinoids
such as cannabidiol (CBD), cannabichromene (CBC) and ∆9-tetrahydrocannabivarin
(THCV), which possess diverse pharmacological activities, are also present in some
varieties or strains [13-15]. Cannabinoids are synthesized as carboxylic acids and upon
heating or smoking decarboxylate to their neutral forms; for example, ∆9-
tetrahydrocannabinolic acid (THCA) is converted to THC. Although cannabinoid
biosynthesis is not understood at the biochemical or genetic level, several key enzymes
have been identified including a candidate polyketide synthase and the two
oxidocyclases, THCA synthase (THCAS) and cannabidiolic acid (CBDA) synthase,
which form the major cannabinoid acids [16-18].
Cannabinoid content and composition is highly variable among cannabis plants. Those
with a high-THCA/low-CBDA chemotype are termed marijuana, whereas those with a
low-THCA/high-CBDA chemotype are termed hemp. There are large differences in the
minor cannabinoid constituents within these basic chemotypes. Breeding of cannabis
for use as a drug and medicine, as well as improved cultivation practices, has led to

6
increased potency in the past several decades with median levels of THC in dried
female flowers of ca. 11% by dry weight; levels in some plants exceed 23% [10,19].
This breeding effort, largely a covert activity by marijuana growers, has produced
hundreds of strains that differ in cannabinoid and terpenoid composition, as well as
appearance and growth characteristics. Patients report medical marijuana strains differ
in their therapeutic effects, although evidence for this is anecdotal.
Cannabis has a diploid genome (2n = 20) with a karyotype composed of nine
autosomes and a pair of sex chromosomes (X and Y). Female plants are homogametic
(XX) and males heterogametic (XY) with sex determination controlled by an X-to-
autosome balance system [20]. The estimated size of the haploid genome is 818 Mb for
female plants and 843 Mb for male plants, owing to the larger size of the Y chromosome
[21]. The genomic resources available for cannabis are mainly confined to
transcriptome information: NCBI contains 12,907 ESTs and 23 unassembled RNA-Seq
datasets of Illumina reads [22,23]. Neither a physical nor a genetic map of the cannabis
genome is available.
Here, we report a draft genome and transcriptome sequence of C. sativa Purple Kush
(PK), a marijuana strain that is widely used for its medicinal effects [24]. We compared
the genome of PK with that of the hemp cultivars ‘Finola’ and ‘USO-31’, and the
transcriptome of PK flowers with that of ‘Finola’ flowers. We found evidence for the
selection of cannabis for medicinal and drug (marijuana) use in the up-regulation of
7
cannabinoid ‘pathway genes’ and the exclusive presence of functional THCA synthase
(THCAS) in the genome and transcriptome of PK.
Results
Sequencing the C. sativa PK genome and transcriptome {2nd level subheading}
We obtained DNA and RNA samples from plants of PK, a clonally propagated
marijuana strain that may have been bred in California and is reportedly derived from an
“indica” genetic background [24]. Genomic DNA was isolated from PK leaves and used
to create six 2 ×100-bp Illumina paired-end libraries with median insert sizes of
approximately 200, 300, 350, 580 and 660 bp. Sequencing each of these libraries
produced >92 gigabase (Gb) of data after filtering of low-quality reads (see below),
which is equivalent to approximately 110× coverage of the estimated ~820 Mb genome.
To improve repeat resolution and scaffolding, we supplemented these data with four 2 ×
44-bp Illumina mate-pair libraries with a median insert size of approximately 1.8 kb and
two 2 × 44-bp libraries with a median insert size of approximately 4.6 kb, adding 16.3
Gb of sequencing data in 185 million unique mated reads. We also included eleven 454
mate-pair libraries with insert sizes ranging from 8 to 40 kb, obtaining >1.9 Gb of raw
sequence data (~2.3 × coverage of 820 Mb) and 2 M unique mated reads.
To characterize the cannabis transcriptome, we sequenced polyA+ RNA from a panel of
six PK tissues (roots, stems, vegetative shoots, pre-flowers (i.e. primordia) and flowers
(in early- and mid-stages of development)) obtaining >18.8 Gb of sequence. To

8
increase coverage of rare transcripts, we also sequenced a normalized cDNA library
made from a mixture of the six RNA samples, obtaining an additional 33.9 Gb. The
sequencing data obtained for the genomic and RNA-Seq libraries are summarized in
Table 1.
Assembling the C. sativa PK genome and transcriptome
We used different approaches for the de novo assembly of the PK genome
(SOAPdenovo [25]) and transcriptome (ABySS [26] and Inchworm [27]). To gauge the
success of the outputs, and to refine the assemblies, we used both traditional measures
(coverage, bases in assembly, N50, maximum contig size and contig count) as well as
comparisons between the assembled versions of the genome and transcriptome.
For the transcriptome, we used two different assemblers, ABySS and Inchworm, to
obtain the best possible coverage. Both assemblers were run on the individual tissue
datasets and normalized cDNA libraries, as well as the full set of RNA-Seq data
(summarized in Table 2). We used predicted splice junctions and the presence of
apparent coding regions to orient the assembled transcripts and to perform quality
control (QC). In general, Inchworm produced assemblies with a larger N50 than ABySS
(Table 2); however, we also observed many cases in which adjacent transcripts (e.g.
head-to-head transcripts that overlap in their termini) appeared to be merged.
Therefore, we considered only Inchworm transcripts with a single blastx hit covering at
least 70% of their length when merging assemblies. The filtered individual ABySS and
Inchworm assemblies were combined by first selecting the largest transcript among sets
9
of near-identical sequences from each assembly, followed by a second stage where
transcripts with blunt overlaps were joined. This second step resulted in a significant
improvement of transcript N50 from 1.65 to 1.80 kb (Table 2).
The final merged assembly contains 40,224 transcripts falling into 30,074 clusters of
isoforms (Table 3). We selected the transcript with the largest open reading frame
(ORF) as the representative for each cluster, resulting in a pruned assembly with an
N50 of 1.91 kb. Most representative transcripts (83%) have a blastx hit in other plants,
and the distribution of transcript classes, according to Panther [28], is nearly identical
between PK and Arabidopsis (Figure 1), as is the total number of transcripts and the
N50 (33,602 and 1.93 kb in Arabidopsis, respectively [29]). The total number of bases in
representative Arabidopsis transcripts is, however, somewhat larger (50 Mb, [29]) which
may indicate that some of the PK transcripts are partial or that genes are represented
by more than one non-contiguous fragments. We noted a 3’ end bias in the normalized
cDNA library, presumably due to the polyA priming step (data not shown). Moreover, by
combining near-identical transcripts during assembly merging and isoform clustering,
we likely collapsed transcripts of large multi-copy gene families. Indeed, applying our
isoform clustering algorithm to the Arabidopsis assembly reduces the total number of
bases to 44 Mb, which is mostly due to the loss of transposable element genes. Overall,
our assembled PK transcriptome is therefore very similar to the deeply characterized
Arabidopsis transcriptome, both in size and composition.

10
Our genome assembly procedure first involved a series of filtering steps to remove low-
quality reads, bacterial sequences (about 2% of all reads) and sequencing adapters.
Mate-pair libraries (454 and Illumina) were further processed to remove duplicate pairs
and unmated reads. We then assembled a small fraction of the Illumina data (1%)
together with the 454 data, to reconstruct the mitochondrial (approximately 450 kb) and
plastid (approximately 150 kb) genomes, and subsequently removed their highly
abundant DNA sequences. The remaining reads were assembled with SOAPdenovo,
resulting in a draft assembly that spans >786 Mb of the cannabis genome and includes
534 million bp (Table 3). The Illumina mate-pair libraries had a significant impact on the
assembly, increasing the N50 from 2 kb to 12 kb. Addition of the large-insert 454 data
increased this to 16 kb (24.9 kb for scaffolds containing genes). Between 73% and 87%
of the reads in each library could be mapped back to the draft genome (Table 1),
indicating that our assembly accounts for most of the bases sequenced. As an
additional measure of completeness, we also examined the proportion of the
transcriptome represented in the genome assembly. Over 94% of assembled transcripts
map to the draft genome over at least half of their length, and 83.9% of them are fully
represented; that is, all bases of the transcript can be mapped to genomic contigs.
Overall, 37.6 Mb (92.5%) of the complete transcriptome is accounted for in the genome
assembly (Figure 2), and over 68.9% of transcripts are fully encompassed by a single
scaffold. Thus, our draft genome assembly appears to represent a large majority of the
genic, non-repetitive C. sativa genome.
11
The assembled C. sativa PK genome and transcriptome (canSat3) can be downloaded
and browsed at a dedicated website [30]. The Cannabis Genome Browser combines the
genome assembly with the transcriptome annotations, and has tracks for RNA-Seq
data, single nucleotide variants (SNVs) and repeats.
Expression of the cannabinoid pathway in C. sativa PK tissues
Our first step in the functional analysis of the C. sativa genome was to examine the
relative expression of each of the 30,074 representative transcripts in the six PK
tissues, from which the RNA-Seq data were derived (Figure 3a). In metazoans (e.g.
humans), different organs and tissues have different physiological functions, and
consequently have unique gene expression profiles [31]. Therefore, many genes have a
highly restricted expression pattern. By contrast, in plants, different photosynthetic
tissues are often composed of a similar set of cell types. Moreover, photosynthetic
processes and primary metabolic pathways have widespread expression, and only a
minor proportion of transcripts appear to be uniquely expressed in a given cell type [32].
Consistent with these observations, we found all of the cannabis photosynthetic tissues
to have similar expression profiles (Figure 3a).
Nonetheless, flowers show a pattern of gene expression consistent with the
biosynthesis of cannabinoids and terpenoids in these organs. Cannabinoids are
prenylated polyketides that are synthesized from the short-chain fatty acid hexanoate
and geranyl diphosphate (GPP) [23,33]. The latter precursor, which is the substrate for
an aromatic prenyltransferase enzyme, is derived from the 2-C-methyl-D-erythritol 4-
12
phosphate (MEP) pathway [34,35,36] (see Figure 3b for details). We found that the
genes encoding cannabinoid pathway enzymes and also most of those encoding
proteins (e.g. hexanoate, MEP and GPP) involved in putative precursor pathways were
most highly expressed in the three stages of flower development (pre-flowers, and
flowers in early and mid-stage of development) (Figure 3c). This finding is consistent
with cannabinoids being synthesized in glandular trichomes, the highest density of
which is found on female flowers [37]. The production of THCA in marijuana strains
(such as PK) and CBDA in hemp, is due to the presence or absence of THCAS and
CBDA synthase (CBDAS) in these two chemotypes. Indeed, THCAS is highly
expressed in PK flowers of all stages, whereas CBDAS is absent (Figure 3c).
It is worth noting that of the 19 ‘pathway genes’ we analyzed, 18 were complete in the
transcriptome assembly, underscoring its quality. The transcript of the MDS gene (which
encodes a protein involved in the MEP pathway) was assembled in two fragments with
a blunt overlap of 48 nt, narrowly missing the merging threshold of 50 nt. This sequence
was resolved by merging the fragments manually. All ‘pathway genes’ are fully
represented in the draft genome and an overview of their genomic locations is provided
on the Cannabis Genome Browser website [30].
Comparison of the expression of cannabinoid pathway genes between marijuana (PK)
and hemp (‘Finola’)
Although there are differences in the morphology of marijuana and hemp strains, the
THC content of PK and other strains selected and bred for use as marijuana is

13
remarkably high. We investigated whether the high THC production in PK was
associated with increased gene expression levels of cannabinoid pathway enzymes,
relative to those in hemp. We performed RNA-Seq analysis on Finola flowers at the
mid-stage of development, generating a total of 18.2 M reads. ‘Finola’ is a short,
dioecious, autoflowering cultivar developed in Finland for oil seed production. It was
created by crossing early maturing hemp varieties from the Vavilov Research Institute
(St. Petersburg, Russia), ‘Finola’ might be derived from a “ruderalis” genetic background
[38]. It contains moderate amounts of CBDA in female flowers but very low amounts
(<0.3% by dry weight) of THCA. Figure 4a shows that the overall mid-flower transcript
profiles, expressed as RPKM (reads per kb per million reads), are similar between PK
and ‘Finola’; however, the entire cannabinoid pathway is expressed at higher levels in
PK than in ‘Finola’, with later steps increased as much as 15-fold (Figure 4a).
The difference in gene expression is not due to morphological variability between the
strains, such as in the size or proportion of trichomes. We examined the global
expression levels of trichome genes to account for possible differences in trichome
density between PK and ‘Finola’ flowers, by analyzing an RNA-Seq dataset obtained for
‘Finola’ glandular trichomes (from a separate study, data not shown). From a set of
the1000 most abundant transcripts, we selected 100 that had the greatest difference in
expression between the mid-flower stage and the maximum expression level found in
PK root, shoot or stem in the current study. This subset of genes should be highly
enriched for genes predominantly expressed in glandular trichomes (and indeed
contained all the cannabinoid and hexanoate ‘pathway genes’ expressed in ‘Finola’).
14
The median difference in expression level after excluding the cannabinoid genes is
shown as a dotted line in Figure 4a, and was used to adjust the expression differences
shown in Figure 4c. Even after accounting for global trichome differences, cannabinoid
pathway enzymes remain among several hundred obvious outliers. Outliers also include
several dozen transcription factors, including two Myb-domain proteins that have been
previously suggested to play a role in regulating processes in cannabis trichomes [23]
(Figure 4a). These data suggest that the increased production of cannabinoids in PK
may be due in part to an increase in expression of the biosynthetic genes.
Resequencing of the C. sativa ‘Finola’ genome reveals copy number changes in a PK
cannabinoid pathway related enzyme
To begin our search for the underlying causes of the differences between marijuana and
hemp, we sequenced the genome of ‘Finola’ (e.g. Illumina 100 nt paired-end reads,
200-500 bp inserts, at approximately 50× coverage of the estimated 820 Mb genome).
Plant genomes often contain many duplicated genes, and gene amplification represents
a well-documented mechanism for increasing expression levels [39]. Therefore, we first
asked whether there were apparent differences in copy number for the enzyme-
encoding gene set, using the median read depth (MRD) of genomic DNA-Seq reads
that could be uniquely mapped to transcripts as a proxy. Figure 4b illustrates that,
overall, there appear to be relatively few differences in gene MRD between PK and
‘Finola’. The exception to this is the much expanded coverage for AAE3, a gene
encoding an enzyme of unknown function in PK. AAE3 is similar to an Arabidopsis AAE
[TAIR:At4g05160] that has been shown to activate medium- and long-chain fatty acids
15
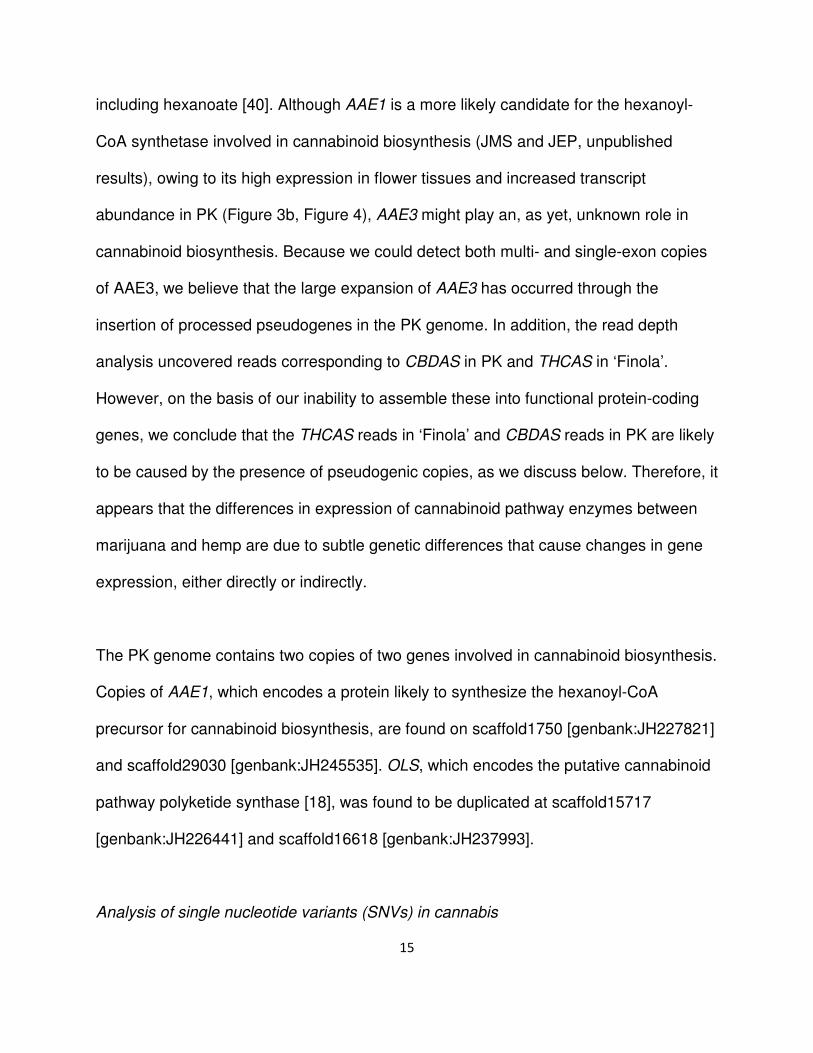
including hexanoate [40]. Although AAE1 is a more likely candidate for the hexanoyl-
CoA synthetase involved in cannabinoid biosynthesis (JMS and JEP, unpublished
results), owing to its high expression in flower tissues and increased transcript
abundance in PK (Figure 3b, Figure 4), AAE3 might play an, as yet, unknown role in
cannabinoid biosynthesis. Because we could detect both multi- and single-exon copies
of AAE3, we believe that the large expansion of AAE3 has occurred through the
insertion of processed pseudogenes in the PK genome. In addition, the read depth
analysis uncovered reads corresponding to CBDAS in PK and THCAS in ‘Finola’.
However, on the basis of our inability to assemble these into functional protein-coding
genes, we conclude that the THCAS reads in ‘Finola’ and CBDAS reads in PK are likely
to be caused by the presence of pseudogenic copies, as we discuss below. Therefore, it
appears that the differences in expression of cannabinoid pathway enzymes between
marijuana and hemp are due to subtle genetic differences that cause changes in gene
expression, either directly or indirectly.
The PK genome contains two copies of two genes involved in cannabinoid biosynthesis.
Copies of AAE1, which encodes a protein likely to synthesize the hexanoyl-CoA
precursor for cannabinoid biosynthesis, are found on scaffold1750 [genbank:JH227821]
and scaffold29030 [genbank:JH245535]. OLS, which encodes the putative cannabinoid
pathway polyketide synthase [18], was found to be duplicated at scaffold15717
[genbank:JH226441] and scaffold16618 [genbank:JH237993].
Analysis of single nucleotide variants (SNVs) in cannabis
16
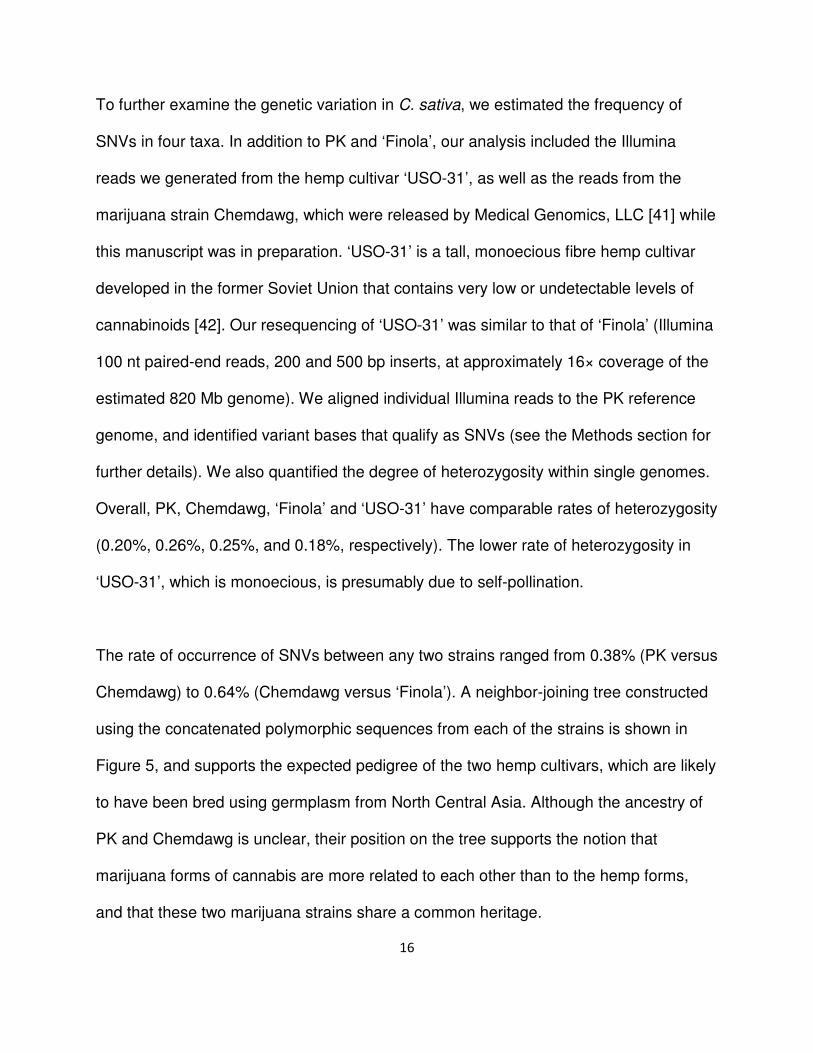
To further examine the genetic variation in C. sativa, we estimated the frequency of
SNVs in four taxa. In addition to PK and ‘Finola’, our analysis included the Illumina
reads we generated from the hemp cultivar ‘USO-31’, as well as the reads from the
marijuana strain Chemdawg, which were released by Medical Genomics, LLC [41] while
this manuscript was in preparation. ‘USO-31’ is a tall, monoecious fibre hemp cultivar
developed in the former Soviet Union that contains very low or undetectable levels of
cannabinoids [42]. Our resequencing of ‘USO-31’ was similar to that of ‘Finola’ (Illumina
100 nt paired-end reads, 200 and 500 bp inserts, at approximately 16× coverage of the
estimated 820 Mb genome). We aligned individual Illumina reads to the PK reference
genome, and identified variant bases that qualify as SNVs (see the Methods section for
further details). We also quantified the degree of heterozygosity within single genomes.
Overall, PK, Chemdawg, ‘Finola’ and ‘USO-31’ have comparable rates of heterozygosity
(0.20%, 0.26%, 0.25%, and 0.18%, respectively). The lower rate of heterozygosity in
‘USO-31’, which is monoecious, is presumably due to self-pollination.
The rate of occurrence of SNVs between any two strains ranged from 0.38% (PK versus
Chemdawg) to 0.64% (Chemdawg versus ‘Finola’). A neighbor-joining tree constructed
using the concatenated polymorphic sequences from each of the strains is shown in
Figure 5, and supports the expected pedigree of the two hemp cultivars, which are likely
to have been bred using germplasm from North Central Asia. Although the ancestry of
PK and Chemdawg is unclear, their position on the tree supports the notion that
marijuana forms of cannabis are more related to each other than to the hemp forms,
and that these two marijuana strains share a common heritage.
17
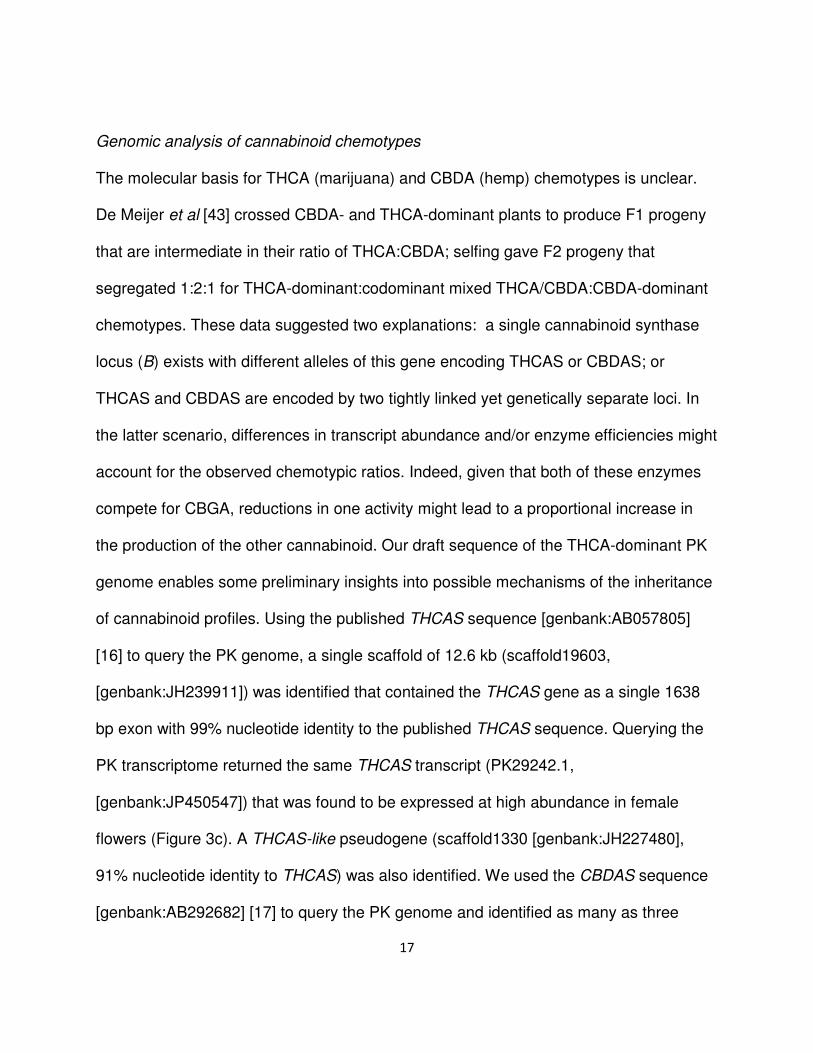
Genomic analysis of cannabinoid chemotypes
The molecular basis for THCA (marijuana) and CBDA (hemp) chemotypes is unclear.
De Meijer et al [43] crossed CBDA- and THCA-dominant plants to produce F1 progeny
that are intermediate in their ratio of THCA:CBDA; selfing gave F2 progeny that
segregated 1:2:1 for THCA-dominant:codominant mixed THCA/CBDA:CBDA-dominant
chemotypes. These data suggested two explanations: a single cannabinoid synthase
locus (B) exists with different alleles of this gene encoding THCAS or CBDAS; or
THCAS and CBDAS are encoded by two tightly linked yet genetically separate loci. In
the latter scenario, differences in transcript abundance and/or enzyme efficiencies might
account for the observed chemotypic ratios. Indeed, given that both of these enzymes
compete for CBGA, reductions in one activity might lead to a proportional increase in
the production of the other cannabinoid. Our draft sequence of the THCA-dominant PK
genome enables some preliminary insights into possible mechanisms of the inheritance
of cannabinoid profiles. Using the published THCAS sequence [genbank:AB057805]
[16] to query the PK genome, a single scaffold of 12.6 kb (scaffold19603,
[genbank:JH239911]) was identified that contained the THCAS gene as a single 1638
bp exon with 99% nucleotide identity to the published THCAS sequence. Querying the
PK transcriptome returned the same THCAS transcript (PK29242.1,
[genbank:JP450547]) that was found to be expressed at high abundance in female
flowers (Figure 3c). A THCAS-like pseudogene (scaffold1330 [genbank:JH227480],
91% nucleotide identity to THCAS) was also identified. We used the CBDAS sequence
[genbank:AB292682] [17] to query the PK genome and identified as many as three
18
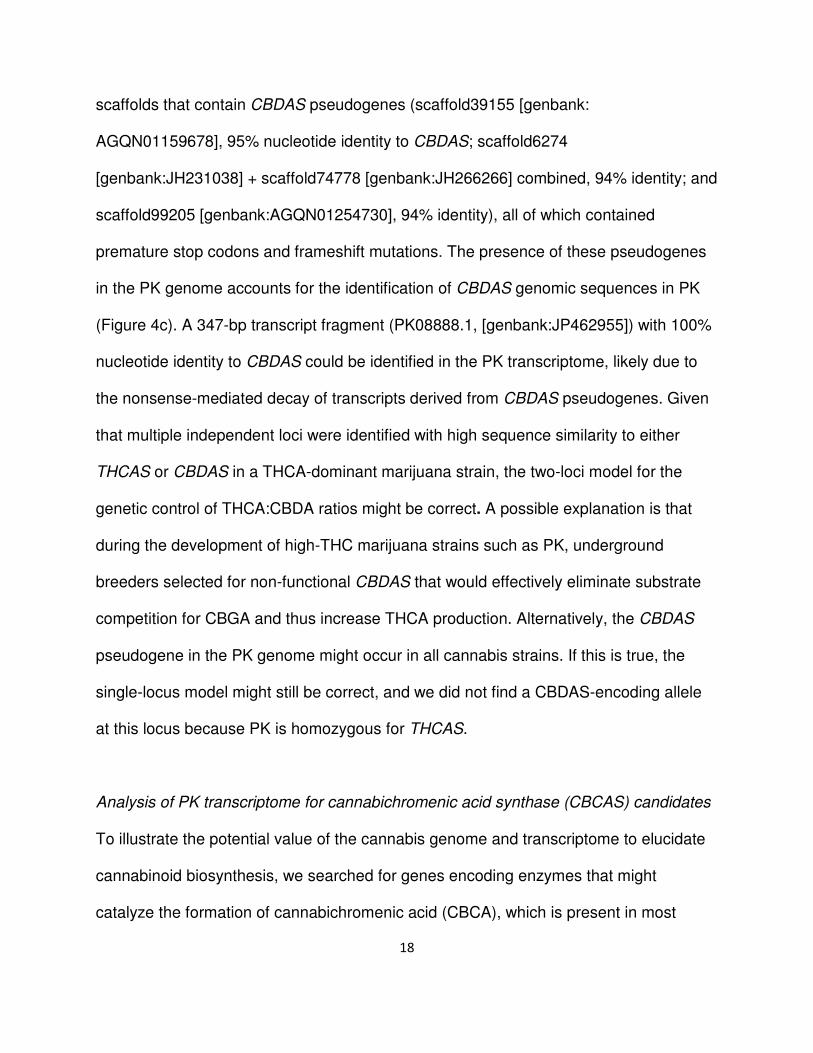
scaffolds that contain CBDAS pseudogenes (scaffold39155 [genbank:
AGQN01159678], 95% nucleotide identity to CBDAS; scaffold6274
[genbank:JH231038] + scaffold74778 [genbank:JH266266] combined, 94% identity; and
scaffold99205 [genbank:AGQN01254730], 94% identity), all of which contained
premature stop codons and frameshift mutations. The presence of these pseudogenes
in the PK genome accounts for the identification of CBDAS genomic sequences in PK
(Figure 4c). A 347-bp transcript fragment (PK08888.1, [genbank:JP462955]) with 100%
nucleotide identity to CBDAS could be identified in the PK transcriptome, likely due to
the nonsense-mediated decay of transcripts derived from CBDAS pseudogenes. Given
that multiple independent loci were identified with high sequence similarity to either
THCAS or CBDAS in a THCA-dominant marijuana strain, the two-loci model for the
genetic control of THCA:CBDA ratios might be correct. A possible explanation is that
during the development of high-THC marijuana strains such as PK, underground
breeders selected for non-functional CBDAS that would effectively eliminate substrate
competition for CBGA and thus increase THCA production. Alternatively, the CBDAS
pseudogene in the PK genome might occur in all cannabis strains. If this is true, the
single-locus model might still be correct, and we did not find a CBDAS-encoding allele
at this locus because PK is homozygous for THCAS.
Analysis of PK transcriptome for cannabichromenic acid synthase (CBCAS) candidates
To illustrate the potential value of the cannabis genome and transcriptome to elucidate
cannabinoid biosynthesis, we searched for genes encoding enzymes that might
catalyze the formation of cannabichromenic acid (CBCA), which is present in most

19
cannabis plants as a minor constituent and in certain strains as the dominant
cannabinoid [44]. Although a protein that synthesizes CBCA has been purified from
cannabis, the gene that encodes the CBCA synthase (CBCAS) has not been identified
[45]. We hypothesized that CBCAS is an oxidocyclase enzyme related to THCAS and
CBDAS, therefore, we queried the PK transcriptome using THCAS and CBDAS
sequences. In total, 23 candidates were identified that had greater than 65% nucleotide
identity with these sequences. These include four genes that we designated THCAS-
like1 to THCAS-like4, which encode proteins that are 89%, 64%, 68%, and 59%
identical to THCAS at the amino acid level, respectively. We also identified transcripts
corresponding to CBDAS2 and CBDAS3, which are closely related to CBDAS but do
not encode enzymes with CBDAS activity [17]. The remaining 18 transcripts encode
proteins that are similar to reticuline oxidase, an oxidoreductase that functions in
alkaloid biosynthesis [46]. Biochemical analysis of CBCAS candidates is currently
underway.
Discussion
We anticipate that the cannabis genome and transcriptome sequences will be
invaluable for understanding the unique biological properties and considerable
phenotypic variation in the genus Cannabis. These genomic resources are applicable to
the molecular analysis of both marijuana and hemp, as we sequenced a marijuana
strain (PK) and two hemp cultivars (‘Finola’ and ‘USO-31’) grown in Canada and
elsewhere. The high repeat content of plant genomes, coupled with the relatively high
level of sequence variation in cannabis [47-49], complicates the assembly of the full
20
genome into the anticipated nine autosomes and two sex chromosomes. We will
continue to explore approaches that might facilitate assembly of the full genome
sequence, including anchoring the genome using molecular markers or FISH
(fluorescence in situ hybridization) [50]. A more complete assembly might provide the
sequences of the X and Y chromosomes and help shed light on the mechanism of sex
determination in cannabis. Nonetheless, our current assembly appears to encompass
the vast majority of the non-repetitive genome and the individual genes.
Mechoulam [13] characterized the plant-derived cannabinoids as a ‘neglected
pharmacological treasure trove’ and others have noted the potentially useful biologically
activities yet to be identified for this group of plant natural products [15]. Medical
marijuana strains reportedly have different therapeutic effects based on levels of THC,
THC:CBD ratios, the presence of minor cannabinoids and the contribution of other
metabolites such as terpenoids [51]. The sequences of the cannabis genome and
transcriptome will provide opportunities for identifying the pathways and remaining
enzymes leading to the major and minor cannabinoids. Such knowledge will facilitate
breeding of cannabis for medical and pharmaceutical applications. For example,
analysis of the PK transcriptome has enabled us to identify several candidate genes
that might encode CBCAS, which forms a cannabinoid with interesting biological
activities [14,52,53]. Despite the low levels of THC in modern hemp strains, the
cannabinoid content of hemp remains a significant impediment to wider cultivation
because of regulations that require germplasm to be carefully controlled and for crops to
be tested to ensure they contain less than 0.3% THC. The genome sequence will aid
21
the development of hemp cultivars that are devoid of cannabinoids through marker-
assisted selection and other breeding techniques.
The differences in the expression of cannabinoid pathway enzymes in PK and ‘Finola’
are also of interest, and could be due to either cis- or trans-regulatory alterations. The
up-regulation of the cannabinoid pathway in PK appears to be a consequence of the
longstanding breeding effort to create marijuana strains with enhanced psychoactivity
through increased THC levels. Plant domestication is often accompanied by a reduction
of secondary metabolic pathways, many of which produce toxic or unpalatable
compounds that have defensive functions [54,55]. The opposite appears to be the case
in marijuana strains of cannabis, where there has been positive selection for THC
production. This is primarily due to two molecular events: the selection for THCAS over
CBDAS and the up-regulation of the cannabinoid pathway and pathways supplying
metabolic precursors. Our analysis indicates that amplification of cannabinoid pathway
genes does not appear to play a causative role in this increased expression. Most of the
key domestication genes in crop plants have been shown to encode transcription
factors [56]. It seems likely that one of the processes causing the emergence of high-
THC marijuana strains is also due to transcriptional alterations in cannabinoid pathway
regulation. Indeed, we find evidence for the increased expression of a multitude of
transcription factors in PK compared with those in ‘Finola’ (Figure 4a).
The underlying mechanisms for this transcriptional control could probably be dissected
using existing techniques, were there not severe legal restrictions in most jurisdictions
22
on growing cannabis, even for research purposes. Although this difficulty is somewhat
unique to cannabis, more generally it is becoming common to obtain genome
sequences and transcriptome data for organisms that are not experimentally tractable.
We propose that in silico analyses, for example, modeling of regulatory networks, can
provide a way to explore the function and evolution of such genomes. On the basis of
close homology to Arabidopsis transcription factors, it is possible to infer the sequence
specificities of many cannabis transcription factors (HvB and M Weirauch, unpublished
results). This modeling of cannabis transcriptional networks is already feasible.
Finally, the genome sequence will enable investigation of the evolutionary history, and
the molecular impact of domestication and breeding on C. sativa. The taxonomic
treatment of the genus Cannabis has been controversial. It might be feasible to use
sequence-based genotyping to trace the relationships in cannabis taxa, including wild
germplasm, landraces, cultivars and strains, as has recently been demonstrated in
grape [57,58]. Our SNV analysis has already allowed for the separation of two hemp
cultivars from two marijuana strains, suggesting additional analysis of diverse cannabis
germplasm is warranted. Outstanding areas that might be addressed by further genomic
investigation include whether the genus is composed of one or several species, the
existence of ‘sativa’ and ‘indica’ gene pools, the relative contributions that wild
ancestors have made to modern hemp and marijuana germplasm, and the process by
which cannabis was first domesticated by humans.
Conclusions

23
C. sativa has been cultivated throughout human history as a source of fibre, oil, food,
drugs and medicine. Here, we have presented a draft genome and transcriptome of C.
sativa, and compared the genomes and flower transcriptomes of high- and low-THCA
producing strains (PK (high), ‘Finola’ (low) and ‘USO-31’ (low to absent)). THCAS, the
gene encoding the oxidocyclase enzyme that forms the THC precursor THCA, is found
in the genome and transcriptome of PK, whereas CBDAS dominates in the ‘Finola’
hemp cultivar. Moreover, we find that most of the cannabinoid biosynthetic pathway
enzymes are highly expressed in flower tissues containing glandular trichomes, and that
the expression of the cannabinoid biosynthetic enzymes is elevated in the high-THCA
PK strain, even relative to other genes expressed specifically in glandular
trichomes. Although some of the genes encoding pathway enzymes are present in
multiple copies, amplifications do not appear to account for the increased expression.
The C. sativa genome sequence will greatly facilitate exploration of the molecular
biology and evolutionary history of this culturally significant and exceptionally useful
plant.

24
Materials and methods
Plant material
Frozen samples of C. sativa PK from clonally propagated female plants were obtained
from an authorized medical marijuana grower in Vancouver, BC, Canada. Plants of the
hemp cultivars C. sativa ‘Finola’ (originally called ‘FIN-314’) and C. sativa ‘USO-31’
were grown from seed in controlled environment chambers at the NRC Plant
Biotechnology Institute, Saskatoon, SK, Canada.
Nucleic acid isolation
Genomic DNA was extracted from nuclei isolated from approximately 30 g of young
leaves from PK using the method described in [59] with modifications from [60]. DNA
was isolated from a single ‘Finola’ plant and a single ‘USO-31’ plant using the same
method. For RNA-Seq analysis, total RNA was isolated from PK roots, stems, shoots
(shoot tips with young leaves and apical meristems), pre-flowers (shoot tips with flower
primordia but no visible stigmas), and early-stage flowers (flowers with visible stigmas)
and mid-stage flowers (flowers with visible, non-withered stigmas and conspicuous
trichomes). A CTAB-based method [61] followed by clean-up with an RNeasy Plant Mini
Kit (Qiagen, Venlo, Netherlands) was used. Genomic DNA was removed by on-column
digest with DNase I (Qiagen). Total RNA was isolated from ‘Finola’ mid-stage female
flowers using the same method.
Illumina paired-end library construction and sequencing

25
Paired-end genomic DNA libraries were constructed using reagents from the NEBNext
DNA Sample Prep Reagent Set 1 (New England Biolabs, Ipswich, MA, USA) or the
Paired-End DNA Sample Prep Kit (Illumina, San Diego, CA, USA). Genomic DNA (5-10
µg) was sheared using the Bioruptor Standard sonication device (Diagenode, Liège -
Belgium) for 20 min on low power using 30 s ‘ON’ and ‘OFF’ cycles. Fragmented DNA
was purified using a PCR purification kit (Qiagen), and was subjected to an end-repair
reaction for 30 minutes at 20°C containing 1× end-repair buffer, 0.4 mM dNTPs, 5 µl T4
DNA Polymerase, 1 µl Klenow Large Fragment, and 5 µl T4 PNK in a final reaction
volume of 100 µl. The reaction was then purified using the Qiagen PCR purification kit
and the 3’-ends of the DNA were adenylated for 30 min at 37°C in a reaction containing
1× Klenow buffer, 0.2 mM dATP, and 3 µl Klenow (Exo-) in a final volume of 50 µl.
Adenylated DNA was again purified using the Qiagen MinElute PCR purification kit.
Adapters were ligated to the purified DNA for 30 min at 20°C in a reaction containing 1×
T4 DNA ligase buffer with ATP, 0.3 µM Adapter Oligo Mix, and 5 µl T4 DNA Ligase in a
final volume of 50 µl. Ligation reactions were immediately analyzed on a 1% agarose
gel and bands of the desired size were excised and purified using the QIAQuick Gel
Extraction Kit (Qiagen). 1-2 µl of the purified DNA was used in a PCR reaction
containing 1× Phusion buffer, 0.2 mM dNTPs, 0.5 µM each of PCR primers PE 1.0 and
2.0 and 2 U Phusion DNA Polymerase in a final reaction of 50 µl. Thermal cycler
conditions were as follows: 98°C for 30 s, 10 cycles of 98°C for 15 s, 65°C for 30 s, and
72°C for 30 s, followed by 72°C for 5 min. PCR reactions were run on a 1% agarose gel
and fragments of the desired size were excised and purified using the QIAQuick Gel
26
Extraction Kit. Products were quantified using the Bioanalyzer 2100 (Agilent, Santa
Clara, CA, USA) and the KAPA Library Quantification Kit for Illumina (KAPA
Biosystems, Woburn, MA, USA), and sequenced as 2 × 100 nt paired-end reads on the
Genome Analyzer IIx or Hi-Seq instruments (Illumina).
Illumina mate-pair library construction and sequencing
The 2-kb and 5-kb mate pair libraries were prepared using the Mate Pair Library
Preparation Kit v2 (Illumina). 10 µg genomic DNA was fragmented using the S2
Adaptive Acoustic Device (Covaris, Woboum, MA, USA) following the manufacturer’s
recommendations. The fragmented DNA was subjected to an end-repair reaction for 30
min at 20°C containing 1× end-repair buffer, 1.5 µl mM dNTPs, 2.5 µl biotinylated
dNTPs, 5 µl T4 DNA Polymerase, 1 µl Klenow Large Fragment, and 5 µl T4 PNK in a
final reaction volume of 100 µl. The DNA was then run on a 0.8% agarose gel and
bands of the desired size were excised and purified using the QIAQuick Gel Extraction
Kit (Qiagen). 600 ng of purified DNA was circularized overnight at 30°C in a reaction
containing 1× Circularization Buffer and 13.4 µl Circularization Ligase in a total volume
of 300 µl. The next day, 3 µl DNA exonuclease was added to the reaction and incubated
for 20 min at 37°C. The circularized DNA was fragmented using the Bioruptor sonication
device as described above. The fragmented DNA was then applied to DynaI magnetic
M-280 beads (Invitrogen, Carlsbad, CA, USA) and washed as recommended by the
manufacturer to enrich for biotinylated DNA fragments. The fraction of DNA bound to
the beads was subjected to end-repair, adenylation, and adapter ligation as described
above, except that each step was followed by a bead wash instead of column
27
purification. The beads were resuspended in 50 µl PCR mix (1× Phusion buffer, 0.2 mM
dNTPs, 0.5 µM each of PCR primers PE 1.0 and 2.0 and 2 U Phusion DNA
Polymerase). Thermal cycler conditions were as described above, except that 18 cycles
were used. Size selection, gel purification, and quantification of libraries were as
described above. Mated libraries were sequenced as 2× 42 nt reads on an Illumina
HiSeq instrument.
cDNA library construction and sequencing
Normalized, full length-enriched cDNA was generated from total RNA pooled from PK
tissues by Bio S&T (Montreal, QC, Canada) and the resulting double-stranded cDNA
was fragmented. Libraries were generated as described for the paired-end genomic
DNA libraries. mRNA-Seq libraries from individual plant tissues were prepared by the
Virginia Bioinformatics Institute (Blacksburg, VA, USA). All cDNA libraries were
sequenced as single-end 100 nt reads (individual tissues) or paired-end 100 nt reads
(normalized sample) on Genome Analyzer IIx or Hi-Seq instruments (Illumina).
454 library construction and sequencing
To construct the paired-end libraries for 454 sequencing, we followed the method
described in the GS FLX Titanium 20 kb and 8 kb Span Paired End Library Preparation
Method Manual from Roche (April 2009 version; Roche, Basel, Switzerland) with the
following modifications. In Manual section 3.1, high-quality genomic DNA (45 µg) was
fragmented using a Hydroshear (Digilab, Holliston, MA, USA) with the large assembly
and set to speed code 18 for 20 cycles. In section 3.3, the fragmented DNA was
28
separated on a single lane of a 0.5% agarose gel (Megabase, from Bio-Rad, Hercules,
California, USA) in 1× TAE for 16 h at 14°C using a FIGE Mapper Electrophoresis
System (Bio-Rad). The switch time ramp was set at 0.1-0.8 s with a linear shape and
forward and reverse voltages were 180 V and 120 V, respectively. In section 3.4, four
slices were cut from the one lane (13 kb, 20 kb, 30 kb and 40 kb). Libraries were
multiplied at the DNA circularization (section 3.6) and library amplification (section 3.10)
steps. For circularization of the 40 kb libraries, 600 ng were used instead of 300 ng
(section 3.6.2). During the circularization incubation program (section 3.6.5), the 40-kb
libraries were held at 37°C for 60 min instead of 45 min. To make the DNA beads, we
followed the method described in the emPCR Method Manual – Lib-L LV GS FLX
Titanium Series (Roche, October 2009 (Rev. Jan 2010)). For emPCR of paired-end
libraries, the Live Amplification Mix (section 3.1.4) was modified with addition of smaller
volume of amplification primer and the heat denaturation (section 3.2.6) was omitted. To
sequence, we followed the method described in the Sequencing Method Manual GS
FLX Titanium Series (Roche, October 2009 (Rev. Jan 2010)) with software v2.5.3.
De novo genome assembly
All Illumina reads were filtered on quality; allowing for no more than 10 bp with a Phred
quality score below 30; discarding the rest of the sequence and keeping only pairs
where both reads were larger than 55 bp. Next we used cutadapt [62] to remove any
reads that were contaminated with an Illumina adapter. Bacterial reads were removed
by aligning each Illumina library to all sequenced bacterial genomes using Bowtie
v0.12.7 [63]. For the Illumina mate pair data, we estimated the proportion of unmated
29
reads to range from 4.6 to 7.8%, based on a comparison of the number of reads that
mapped to contigs >10 kb in a reverse-forward orientation (mated) to the number of
reads mapping in a forward-reverse orientation (unmated). To remove unmated reads,
we used Bowtie to map the mate pair libraries to the Illumina paired-end reads with
inserts ranging between 200 and 660 bp, and discarded those that were fully contained
within a single short-insert read pair. This procedure reduced the proportion of unmated
reads to <0.2%. Finally we discarded duplicated mate pairs with identical sequence in
the first 30 bp of both reads, which accounted for <3% of the data. For 454 data, we
used the CABOG [64] tool sffToFrg to identify mated reads and remove duplicate mate
pairs. The proportion of duplicates in the 454 libraries ranged from 3.1% to 12.2%. The
remaining read sequence data were converted to fastq format, trimmed to a length of 65
bases and used in combination with the Illumina reads in the assembly.
The genome was assembled with SOAPdenovo v1.0.5 using a kmer parameter of 39,
which was selected after testing a range of kmers settings between 31 and 41, and a
merge level of two. The mate pair libraries were only incorporated during the scaffolding
phase, using a cut-off of three or four mapped pairs to identify reliable links between
contigs for the 454 and Illumina mate libraries, respectively. The SOAPdenovo
‘GapCloser’ tool was used with default settings after scaffolding, closing 166 Mb of
gaps. Following assembly, we identified near-identical scaffolds that shared ≥ 98%
identity across ≥ 95% of the length of the smallest scaffold. We assessed that these
occurrences represented instances where heterozygosity resulted in distinct assemblies
of each strand and therefore selected the largest scaffold as the representative genome
30
sequence. Finally, we removed potential bacterial contigs by aligning the draft assembly
to all available fully sequenced microbial genomes obtained from NCBI in April 2011,
and removing scaffolds with significant blat or blastx hits (score >150) and a median
read coverage more than 2 SDs outside the range observed for validated Cannabis
sativa scaffolds with high sequence similarity to other plant genomes.
De novo transcriptome assembly
Each tissue and normalized RNA-Seq library, as well as a combination of all libraries,
was assembled with ABySS v1.2.6 and/or Inchworm v03132011. For ABySS we used
the following parameters: k – 49, e – 5, n – 5. For Inchworm we set the k-mer size to 31.
These parameters were optimized for scaffold N50 and total base coverage, after
running each assembler across a range of parameters.
Following assembly, we used three different approaches to QC and identify the coding
strand of each transcript. First, each transcript was compared with the predicted ORF
translations for three fully sequenced plant genomes (Arabidopsis release TAIR10,
Maize release ZmB73_5b, and Rice release 6.1) using blastx [65]. We selected for PK
transcripts matching at least one ORF translation with an e-value below 10-6 and used
the alignment strand information to orient the transcript. In case multiple blastx hits were
found on conflicting strands, the transcript was dropped from the assembly. Second, we
identified transcripts that had an open reading frame ≥ 240 nt spanning ≥ 70% of the
length of the transcript on one strand, with the additional requirement that there was a ≥
two-fold difference in size compared with any ORF found on the opposite strand.
31
Transcripts meeting these criteria were oriented according to the strand containing the
largest ORF. Third, we used blat [66] to align the transcriptome assemblies to the
genome assembly to identify spliced transcripts. We selected alignments where a
transcript matched a genomic contig in consecutive blocks with ≥ 95% overall sequence
identity and a minimum block (i.e. exon) size of 30 nt. The boundaries of aligned blocks
were considered candidate splice sites and further examined for the presence of the
canonical splice junction donor/acceptor sequences (GT/AG for the coding strand and
CT/AC for the template strand, respectively) in the genomic scaffolds sequence directly
adjacent to the aligned blocks. We selected transcripts with at least one candidate
splice site matching the canonical junction sequences, while discarding those that had
an equal or greater number of candidate splice sites that did not match the canonical
sequences. The resulting set of transcripts was then oriented according to the
directionality of the splice junction sequences.
The transcripts that met the criteria for at least one of the three methods outlined above,
and that had no conflicting orientation information between these methods, were
selected for each assembly (see Table 2 for a summary of each assembly at this stage).
Overall, 64% of all transcripts had their orientations derived from two or more methods.
We then combined the filtered and oriented transcripts from each assembly together
and used cd-hit-est [67] to merge transcripts between assemblies when they shared ≥
97% identity across ≥ 95% of the length of the smallest transcript, keeping the largest
transcript in each cluster. Given that we frequently observed chimeric transcripts in the
Inchworm assembly, we only included Inchworm transcripts that were covered for more
32
than 70% of their length by a single blast hit during the merging stage. Finally, we used
blat to identify blunt overlaps of at least 50 nt between transcript fragments and used
cap3 [68] to join these fragments together. From this assembly we selected an
additional set of representative transcripts by first clustering overlapping isoforms when
they shared ≥ 95% similarity across ≥ 100 nucleotides, and then choosing the transcript
with the largest ORF (Table 2). Finally, remaining traces of vector or adapter
contamination were removed by screening against the UniVec database.
Variant analysis
A subset of the QC filtered Illumina genomic DNA libraries was selected to obtain an
estimated 30× coverage of sequence data for PK, Chemdawg and ‘Finola’, as well as
16× coverage of ‘USO-31’. Each dataset was aligned to the PK genome assembly using
Bowtie v0.12.7 [63] and variants were called across the four sets using the multi-sample
mpileup option in SAMtools (v0.1.17) [69]. We selected for SNVs with a quality score ≥
30, corresponding to a ≤10-3 likelihood of an incorrect call. In addition, we restricted our
analysis to regions uniquely covered by at least five reads in each cultivar and no more
than 150 reads across all samples combined (a total of 159 Mb of the PK reference
genome), to restrict our analysis to regions where we had data for all cultivars, and to
limit spurious calls in repetitive regions of the genome.
Accession numbers
The PK Whole Genome Shotgun project has been deposited at DDBJ/EMBL/GenBank
under the accession [genbank:AGQN00000000]. The version described in this paper
33
is the first version, [genbank:AGQN01000000], and corresponds to the canSat3
assembly in the Cannabis Genome Browser. Assembled transcripts ≥200nt have been
deposited in the NCBI Transcriptome Shotgun Assembly (TSA) sequence database with
accession numbers between [genbank:JP449145] – [genbank:JP482359]. Raw
sequence read data have been deposited in the NCBI Sequence Read Archive with the
following study identifiers: PK genomic DNA – [SRA:SRP008673]; PK RNA-Seq –
[SRA:SRP008726]; 'Finola' genomic DNA – [SRA:SRP008728]; 'Finola' RNA-Seq –
[SRA:SRP008729]; 'USO-31' genomic DNA – [SRA:SRP008730].
Abbreviations
AAE, acyl-activating enzyme; bp, base pair; BP, before present; CBC,
cannabichromene; CBCA, cannabichromenic acid; CBCAS, cannabichromenic acid
synthase; CBD, cannabidiol; CBDA, cannabidiolic acid; CBDAS, cannabidiolic acid
synthase; CBGA, cannabigerolic acid; CMK, 4-diphosphocytidyl-2-C-methyl-D-erythritol
kinase; CTAB, cetyl trimethylammonium bromide; DXR, 1-deoxy-D-xylulose 5-
phosphate reductoisomerase; DXS, 1-deoxyxylulose-5-phosphate synthase; EST,
expressed sequence tag; FIGE, Field inversion gel electrophoresis; FISH, fluorescence
in situ hybridization; Gb, giga base pair; GPP, geranyl diphosphate; GPP synthase lsu,
GPP synthase large subunit; GPP synthase ssu, GPP synthase small subunit; HDR, 4-
hydroxy-3-methylbut-2-enyl diphosphate reductase; HDS, 4-hydroxy-3-methylbut-2-en-
1-yl diphosphate synthase; HPL, hydroperoxide lyase; kb, kilo base pair; LOX,
lipoxygenase; Mb, mega base pair; MCT, 4-diphosphocytidyl-methylerythritol 2-
phosphate synthase; MDS, 2-C-methyl-D-erythritol 2,4-cyclodiphosphate synthase;

34
MEP, 2-C-methyl-D-erythritol 4-phosphate; ORF, open reading frame; OLS, olivetol
synthase; PK, Purple Kush; PT, prenyltransferase; QC, quality control; RPKM, reads
per kb per million reads; SNV, single nucleotide variants; THC, ∆9-tetrahydrocannabinol;
THCA, ∆9-tetrahydrocannabinolic acid; THCAS, ∆9-tetrahydrocannabinolic acid
synthase; THCV, ∆9-tetrahydrocannabivarin.
Competing interests
The authors declare they have no competing interests.
Authors’ contributions
TRH and JEP conceived of the project. HvB performed the genome and transcriptome
assembly and generated the figures. JMS and JEP extracted the nucleic acids. AGC
prepared the Illumina sequencing libraries. CMT prepared and sequenced the 454
libraries under the direction of AGS. TRH, JEP, HvB and JMS wrote the manuscript. All
authors have read and approved the manuscript for publication.
Acknowledgements
JEP thanks the Natural Sciences and Engineering Research Council of Canada for
funding. We are grateful to R. Steen, O. Down and a Canadian patient authorized to
possess marihuana for medical purposes for donating PK samples. J. Slaski kindly
provided hemp seeds. We thank C. Koh, M. Links, J. Dursi, P. Kim and Q. Morris for
their advice and assistance on plant genome assembly; S. Polvi for growing hemp
plants; C. Nislow and T. Durbic for assistance with sequencing; D. Pinto for advice on
35
the SNV analysis; and M. Weirauch for analysis of transcription factors. A portion of the
computations was performed on the GPC supercomputer [70] at the SciNet HPC
Consortium. SciNet is funded by: the Canada Foundation for Innovation under the
auspices of Compute Canada; the Government of Ontario; Ontario Research Fund -
Research Excellence; and the University of Toronto.
36
References
1. Schultes RE, Klein WM, Plowman T, Lockwood TE: Cannabis: an example of
taxonomic neglect. Bot Mus Leafl Harvard Univ 1974, 23:337-367.
2. Li HL: An archaeological and historical account of cannabis in China. Econ Bot
1973, 28:437-444.
3. Russo EB, Jiang H-E, Li X, Sutton A, Carboni A, Bianco F del, Mandolino G, Potter
DJ, Zhao Y-X, Bera S, Zhang Y-B, Lü E-G, Ferguson DK, Hueber F, Zhao L-C, Liu C-J,
Wang Y-F, Li C-S: Phytochemical and genetic analyses of ancient cannabis from
Central Asia. J Exp Bot 2008, 59:4171-4182.
4. Zias J, Stark H, Sellgman J, Levy R, Werker E, Breuer A, Mechoulam R: Early
medical use of cannabis. Nature 1993, 363:215.
5. UNODC: World Drug Report 2011. (United Nations Publication, Sales No.
E.11.XI.10).
6. Ware MA, Wang T, Shapiro S, Robinson A, Ducruet T, Huynh T, Gamsa A, Bennett
GJ, Collet J-P: Smoked cannabis for chronic neuropathic pain: a randomized
controlled trial. CMAJ 2010, 182:E694-701.
7. Lakhan SE, Rowland M: Whole plant cannabis extracts in the treatment of
spasticity in multiple sclerosis: a systematic review. BMC Neurol 2009, 9:59.
8. Hillig K: Genetic evidence for speciation in Cannabis (Cannabaceae). Genet
Resourc Crop Evol 2005, 52: 161-180.

37
9. Elsohly MA, Slade D: Chemical constituents of marijuana: The complex mixture
of natural cannabinoids. Life Sci 2005, 78:539-548.
10. Mehmedic Z, Chandra S, Slade D, Denham H, Foster S, Patel AS, Ross SA, Khan
IA, ElSohly MA: Potency trends of ∆9-THC and other cannabinoids in confiscated
cannabis preparations from 1993 to 2008. J Forensic Sci 2010, 55:1209-1710.
11. Gaoni Y, Mechoulam R: Isolation, structure, and partial synthesis of an active
constituent of hashish. J Am Chem Soc 1964, 86:1646-1647.
12. Joy JE, Watson SJ, Benson JA (eds.): Marijuana and Medicine: Assessing the
Science Base. National Academies Press; 1999.
13. Mechoulam R: Plant cannabinoids: a neglected pharmacological treasure
trove. Br J Pharmacol 2005, 146:913-915.
14. DeLong GT, Wolf CE, Poklis A, Lichtman AH: Pharmacological evaluation of the
natural constituent of Cannabis sativa, cannabichromene and its modulation by
∆9-tetrahydrocannabinol. Drug Alcohol Depend 2010, 112:126-133.
15. Izzo AA, Borrelli F, Capasso R, Marzo V Di, Mechoulam R: Non-psychotropic
plant cannabinoids: new therapeutic opportunities from an ancient herb. Trends
Pharmacol Sci 2009, 30:515-527.
16. Sirikantaramas S, Morimoto S, Shoyama Y, Ishikawa Y, Wada Y, Shoyama Y,
Taura F: The gene controlling marijuana psychoactivity: molecular cloning and
heterologous expression of ∆1-tetrahydrocannabinolic acid synthase from
Cannabis sativa L. J Biol Chem 2004, 279:39767-39774.
38
17. Taura F, Sirikantaramas S, Shoyama Y, Yoshikai K, Shoyama Y, Morimoto S:
Cannabidiolic-acid synthase, the chemotype-determining enzyme in the fiber-type
Cannabis sativa. FEBS Lett 2007, 581:2929-2934.
18. Taura F, Tanaka S, Taguchi C, Fukamizu T, Tanaka H, Shoyama Y, Morimoto S:
Characterization of olivetol synthase, a polyketide synthase putatively involved in
cannabinoid biosynthetic pathway. FEBS Lett 2009, 583:2061-2066.
19. Potter D, Clark P, Brown M: Potency of ∆9-THC and other cannabinoids in
cannabis in England in 2005: Implications for psychoactivity and pharmacology. J
Forensic Sci 2008, 53:90-94.
20. Ming R, Bendahmane A, Renner SS: Sex chromosomes in land plants. Ann Rev
Plant Biol 2011, 62:485-514.
21. Sakamoto K, Akiyama Y, Fukui K, Kamada H, Satoh S: Characterization; genome
sizes and morphology of sex chromosomes in hemp (Cannabis sativa L.).
Cytologia 1998, 63:459-464.
22. NCBI database search October 12, 2011
23. Marks MD, Tian L, Wenger JP, Omburo SN, Soto-Fuentes W, He J, Gang DR,
Weiblen GD, Dixon RA: Identification of candidate genes affecting ∆9-
tetrahydrocannabinol biosynthesis in Cannabis sativa. J Exp Bot 2009, 60:3715-
2610.
24. Rosenthal E: The Big Book of Buds, Volume 3: More Marijuana Varieties from the
World’s Great Seed Breeders. 2007.
39
25. Li R, Zhu H, Ruan J, Qian W, Fang X, Shi Z, Li Y, Li S, Shan G, Kristiansen K, Li S,
Yang H, Wang J, Wang J: De novo assembly of human genomes with massively
parallel short read sequencing. Genome Research 2010, 20:265-272.
26. Simpson JT, Wong K, Jackman SD, Schein JE, Jones SJM, Birol I: ABySS: a
parallel assembler for short read sequence data. Genome Research 2009, 19:1117-
1123.
27. Grabherr MG, Haas BJ, Yassour M, Levin JZ, Thompson DA, Amit I, Adiconis X,
Fan L, Raychowdhury R, Zeng Q, Chen Z, Mauceli E, Hacohen N, Gnirke A, Rhind N,
Palma F di, Birren BW, Nusbaum C, Lindblad-Toh K, Friedman N, Regev A: Full-length
transcriptome assembly from RNA-Seq data without a reference genome. Nature
Biotech 2011, 29:644-652.
28. Mi H, Lazareva-Ulitsky B, Loo R, Kejariwal A, Vandergriff J, Rabkin S, Guo N,
Muruganujan A, Doremieux O, Campbell MJ, Kitano H, Thomas PD: The PANTHER
database of protein families, subfamilies, functions and pathways. Nucleic Acids
Res 2005, 33:D284-288.
29. TAIR10 Genome Release [http://www.arabidopsis.org/]
30. The Cannabis Genome Browser [http://genome.ccbr.utoronto.ca/]
31. Su AI, Cooke MP, Ching KA, Hakak Y, Walker JR, Wiltshire T, Orth AP, Vega RG,
Sapinoso LM, Moqrich A, Patapoutian A, Hampton GM, Schultz PG, Hogenesch JB:
Large-scale analysis of the human and mouse transcriptomes. Proc Nat Acad Sci
USA 2002, 99:4465-4470.
40
32. Galbraith DW, Birnbaum K: Global studies of cell type-specific gene expression
in plants. Ann Rev Plant Biol 2006, 57:451-475.
33. Page JE, Nagel J: Biosynthesis of terpenophenolics in hop and cannabis. In
Recent Advances in Phytochemistry Volume 40: Integrative Plant Biochemistry. Edited
by Romeo JT. Oxford: Elsevier; 2006:179-210.
34. Phillips MA, León P, Boronat A, Rodríguez-Concepción M: The plastidial MEP
pathway: unified nomenclature and resources. Trends Plant Sci 2008, 13:619-623.
35. Fellermeier M, Eisenreich W, Bacher A, Zenk MH: Biosynthesis of cannabinoids.
Incorporation experiments with 13C-labeled glucoses. Eur J Biochem 2001,
268:1596-1604.
36. Page JE, Boubakir Z: Aromatic prenyltransferase from cannabis. 2011. PCT
patent application WO/2011/017798.
37. Turner JC, Hemphill JK, Mahlberg PG: Quantitative determination of
cannabinoids in individual glandular trichomes of Cannabis sativa L.
(Cannabaceae). Am J Bot 1978, 65:1103-1106.
38. Callaway JC, Laakkonen TT: Cultivation of Cannabis oil seed varieties in
Finland. J Int Hemp Assoc 1996, 3:32-34.
39. Pollack JR, Perou CM, Alizadeh AA, Eisen MB, Pergamenschikov A, Williams CF,
Jeffrey SS, Botstein D, Brown PO: Genome-wide analysis of DNA copy-number
changes using cDNA microarrays. Nat Genet 1999, 23:41-46.
41
40. Schneider K, Kienow L, Schmelzer E, Colby T, Bartsch M, Miersch O, Wasternack
C, Kombrink E, Stuible H-P: A new type of peroxisomal acyl-coenzyme A
synthetase from Arabidopsis thaliana has the catalytic capacity to activate
biosynthetic precursors of jasmonic acid. J Biol Chem. 2005, 280:13962-13972.
41. Medicinal Genomics, LLC [http://www.medicinalgenomics.com/]
42. Virovets VG: Selection for non-psychoactive hemp varieties (Cannabis sativa
L.) in the CIS (former USSR). J Int Hemp Assoc 1996, 3:13-15.
43. Meijer EPM de, Bagatta M, Carboni A, Crucitti P, Moliterni VMC, Ranalli P,
Mandolino G: The inheritance of chemical phenotype in Cannabis sativa L.
Genetics 2003, 163:335-346.
44. Meijer EPM de, Hammond K, Micheler M: The inheritance of chemical phenotype
in Cannabis sativa L.(III): variation in cannabichromene proportion. Euphytica
2009, 165:293-311.
45. Morimoto S, Komatsu K, Taura F, Shoyama Y: Purification and characterization
of cannabichromenic acid synthase from Cannabis sativa. Phytochemistry 1998,
49:1525-1529.
46. Dittrich H, Kutchan TM: Molecular cloning, expression, and induction of
berberine bridge enzyme, an enzyme essential to the formation of
benzophenanthridine alkaloids in the response of plants to pathogenic attack.
Proc Nat Acad Sci USA 1991, 88:9969-9973.
42
47. Datwyler SL, Weiblen GD: Genetic variation in hemp and marijuana (Cannabis
sativa L.) according to amplified fragment length polymorphisms. J Forensic Sci
2006, 51:371-351.
48. Faeti V, Mandolino G, Ranalli P: Genetic diversity of Cannabis sativa germplasm
based on RAPD markers. Plant Breeding 1996, 115:367-370.
49. Ouyang S, Buell CR: The TIGR Plant Repeat Databases: a collective resource
for the identification of repetitive sequences in plants. Nucleic Acids Res 2004,
32:D360-363.
50. Stack SM, Royer SM, Shearer LA, Chang SB, Giovannoni JJ, Westfall DH, White
RA, Anderson LK: Role of fluorescence in situ hybridization in sequencing the
tomato genome. Cytogenet Genome Res 2009, 124:339-350.
51. Russo EB: Taming THC: potential cannabis synergy and phytocannabinoid-
terpenoid entourage effects. British J Pharmacol 2011, 163:1344-1364.
52. Maione S, Piscitelli F, Gatta L, Vita D, Petrocellis L De, Palazzo E, Novellis V de,
Marzo V Di: Non-psychoactive cannabinoids modulate the descending pathway of
antinociception in anaesthetized rats through several mechanisms of action.
British J Pharmacol 2011, 162:584-596.
53. Appendino G, Gibbons S, Giana A, Pagani A, Grassi G, Stavri M, Smith E, Rahman
MM: Antibacterial cannabinoids from Cannabis sativa: a structure-activity study. J
Nat Prod 2008, 71:1427-1430.

43
54. Wink M: Plant breeding: importance of plant secondary metabolites for
protection against pathogens and herbivores. Theor Appl Genet 1988, 75:225-233.
55. Kliebenstein DJ: Use of secondary metabolite variation in crop improvement. In
Plant-Derived Natural Products: Synthesis, Function, and Application. Edited by
Osbourn A.E., Lanzotti V. Springer; 2009:83-95.
56. Doebley JF, Gaut BS, Smith BD: The molecular genetics of crop domestication.
Cell 2006, 127:1309-1321.
57. Myles S, Chia J-M, Hurwitz B, Simon C, Zhong GY, Buckler E, Ware D: Rapid
genomic characterization of the genus Vitis. PloS One 2010, 5:e8219.
58. Myles S, Boyko AR, Owens CL, Brown PJ, Grassi F, Aradhya MK, Prins B,
Reynolds A, Chia J-M, Ware D, Bustamante CD, Buckler ES: Genetic structure and
domestication history of the grape. Proc Nat Acad of Sci USA 2011, 108:3530-3535.
59. Landry BS, Hubert N, Etoh T, Harada JJ, Lincoln SE: A genetic map for Brassica
napus based on restriction fragment length polymorphisms detected with
expressed DNA sequences. Genome 1991, 34:543-552.
60. Cheung W, Champagne G, Hubert N, Landry B: Comparison of the genetic maps
of Brassica napus and Brassica oleracea. Theor Appl Genet 1997, 94:569-582.
61. Meisel L, Fonseca B, Gonzaelz S, Baeza-Yates R, Cambiazo V, Campos R,
Gonzalez M, Orellana A, Retamales J, Silva H: A rapid and efficient method for
purifying high quality total RNA from peaches (Prunus persica) for functional
genomics analyses. Biol Res 2005, 38:83-88.
44
62. Martin M: Cutadapt removes adapter sequences from high-throughput
sequencing reads. EMBnet J 2011, 17:10-12.
63. Langmead B, Trapnell C, Pop M, Salzberg SL: Ultrafast and memory-efficient
alignment of short DNA sequences to the human genome. Genome Biol 2009,
10:R25.
64. Miller JR, Delcher AL, Koren S, Venter E, Walenz BP, Brownley A, Johnson J, Li K,
Mobarry C, Sutton G: Aggressive assembly of pyrosequencing reads with mates.
Bioinformatics 2008, 24:2818-2410.
65. Gish W, States DJ: Identification of protein coding regions by database
similarity search. Nat Genet 1993, 3:266-272.
66. Kent WJ: BLAT-the BLAST-like alignment tool. Genome Res 2002, 12:656-664.
67. Li W, Godzik A: Cd-hit: a fast program for clustering and comparing large sets
of protein or nucleotide sequences. Bioinformatics 2006, 22:1658-1659.
68. Huang X, Madan A: CAP3: A DNA sequence assembly program. Genome Res
1999, 9:868-877.
69. Li H, Handsaker B, Wysoker A, Fennell T, Ruan J, Homer N, Marth G, Abecasis G,
Durbin R: The Sequence Alignment/Map format and SAMtools. Bioinformatics 2009,
25:2078-2079.
70. Loken C, Gruner D, Groer L, Peltier R, Bunn N, Craig M, Henriques T, Dempsey J,
Yu C, Chen J, Dursi JL, Chong J, Northrup S, Pinto J, Knecht N and Van Zon R:
45
SciNet: Lessons Learned from Building a Power-efficient Top-20 System and Data
Centre. J Phys: Conf Ser 2010, 256:012026
71. Tamura K, Peterson D, Peterson N, Stecher G, Nei M, Kumar S: MEGA5:
Molecular evolutionary genetics analysis using maximum likelihood, evolutionary
distance, and maximum parsimony methods. Mol Biology Evol 2011, 28:2731-2739.

46
Table 1. Purple Kush sequencing library statistics
Library Insert size (bp)
Raw No. Raw nt (Gb) Filtered No. Filtered nt (Gb)
% in a)
assembly
Genomic DNA, Illumina 2×100 bp paired-end reads
CS-PK_SIL-1a 181 143,951,601 28.0 124,499,863 23.8 82.2
CS-PK_SIL-1b 195 111,106,936 22.2 98,124,711 19.0 82.4 CS-PK_SIL-2a 313 93,774,355 18.8 81,421,333 15.3 84.7 CS-PK_SIL-3b 362 66,932,319 13.4 60,519,955 11.6 82.8 CS-PK_SIL-B 664 95,648,778 19.1 49,550,098 9.2 85.1 CS-PK_SIL-C 580 101,329,142 20.3 72,977,620 13.6 87.1 Genomic DNA, Illumina 2×44 bp mate pair reads CS-PK_2kb-1a 1,926 36,057,086 3.2 24,688,690 2.2 75.0 CS-PK_2kb-1b 1,846 32,385,628 2.8 24,405,458 2.1 76.8 CS-PK_2kb-2a 1,850 37,761,064 3.3 29,927,921 2.6 75.5 CS-PK_2kb-2b 1,787 37,111,622 3.3 28,744,604 2.5 77.1 CS-PK_5kb-1 4,721 36,182,230 3.2 27,377,398 2.4 77.5 CS-PK_5kb-2 4,585 64,613,144 5.7 50,712,974 4.4 79.9 Genomic DNA, 454 mate pairs CS-PK_8kb-1 8,000 557,443 0.20 192,483 0.069 77.0 CS-PK_8kb-2 8,000 484,033 0.17 176,405 0.063 74.5 CS-PK_8kb-3 8,000 603,780 0.21 221,616 0.079 78.6 CS-PK_13kb-1 13,000 430,642 0.11 96,503 0.030 75.1 CS-PK_20kb-1 20,000 611,986 0.19 216,379 0.070 77.0 CS-PK_20kb-2 20,000 575,618 0.21 228,811 0.081 77.0 CS-PK_30kb-1 30,000 644,026 0.22 239,625 0.082 72.8 CS-PK_30kb-2 30,000 536,273 0.15 150,510 0.048 73.4 CS-PK_40kb-1 40,000 213,928 0.06 64,325 0.019 74.9 CS-PK_40kb-2 40,000 627,945 0.21 241,189 0.079 76.8 CS-PK_40kb-3 40,000 573,313 0.19 224,264 0.073 74.5 RNA, Illumina 1×100 bp single-end reads PK-Mid-flower - 37,835,287 3.8 25,687,331 2.3 - PK-Early-flower - 37,472,665 3.7 25,434,724 2.3 - PK-Pre-flower - 54,026,640 5.4 35,522,980 3.2 - PK-Shoot - 55,653,984 5.6 36,204,828 3.3 - PK-Stem - 60,353,149 6.0 39,274,463 3.5 - PK-Root - 37,374,640 3.7 24,904,927 2.2 - RNA, Illumina 2×100 bp paired-end reads PK-subtracted1 180 110,483,894 22.1 64,525,082 11.6 - PK-subtracted2 180 82,190,044 16.4 46,291,148 8.3 - PK-subtracted3 180 105,737,119 21.1 61,974,962 11.2 - PK-subtracted4 180 48,599,953 9.7 26,505,457 4.8 -
a) Percentage of genomic DNA reads that could be mapped back to the canSat3 genome assembly
47
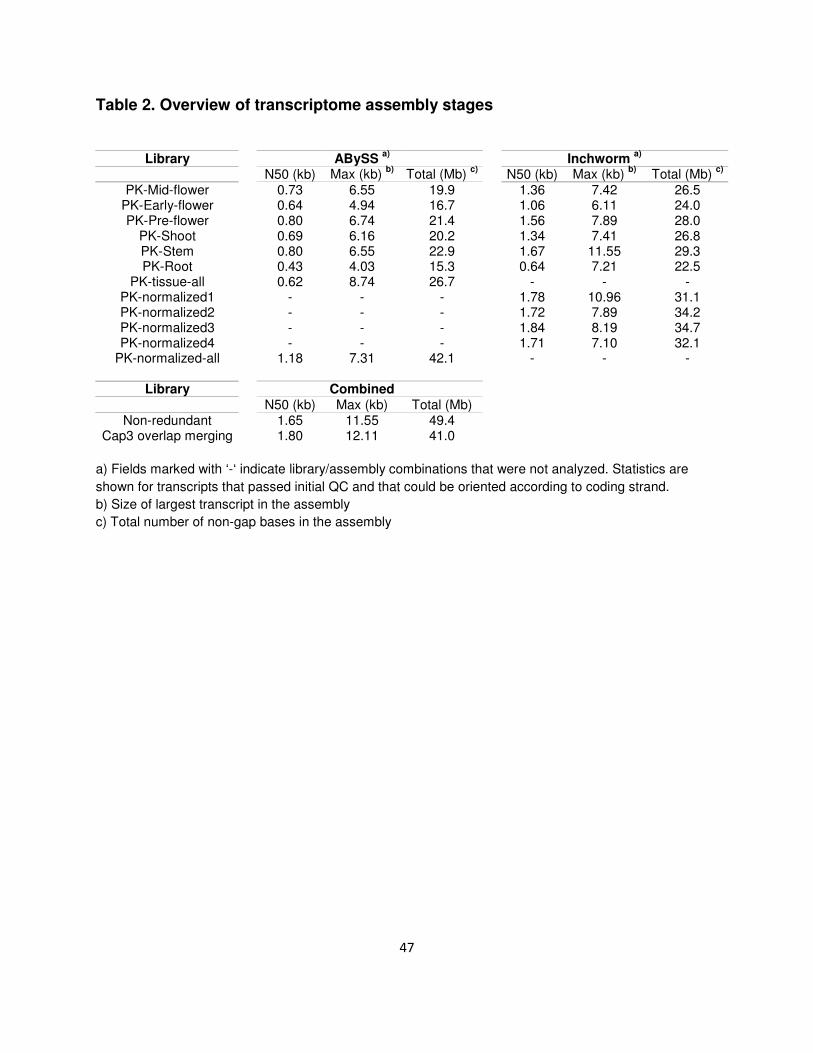
Table 2. Overview of transcriptome assembly stages
Library ABySS
a) Inchworm
a)
N50 (kb) Max (kb) b)
Total (Mb) c)
N50 (kb) Max (kb) b)
Total (Mb) c)
PK-Mid-flower 0.73 6.55 19.9 1.36 7.42 26.5
PK-Early-flower 0.64 4.94 16.7 1.06 6.11 24.0 PK-Pre-flower 0.80 6.74 21.4 1.56 7.89 28.0
PK-Shoot 0.69 6.16 20.2 1.34 7.41 26.8 PK-Stem 0.80 6.55 22.9 1.67 11.55 29.3 PK-Root 0.43 4.03 15.3 0.64 7.21 22.5
PK-tissue-all 0.62 8.74 26.7 - - - PK-normalized1 - - - 1.78 10.96 31.1 PK-normalized2 - - - 1.72 7.89 34.2 PK-normalized3 - - - 1.84 8.19 34.7 PK-normalized4 - - - 1.71 7.10 32.1
PK-normalized-all 1.18 7.31 42.1 - - -
Library Combined N50 (kb) Max (kb) Total (Mb)
Non-redundant 1.65 11.55 49.4 Cap3 overlap merging 1.80 12.11 41.0
a) Fields marked with ‘-‘ indicate library/assembly combinations that were not analyzed. Statistics are
shown for transcripts that passed initial QC and that could be oriented according to coding strand.
b) Size of largest transcript in the assembly
c) Total number of non-gap bases in the assembly
48
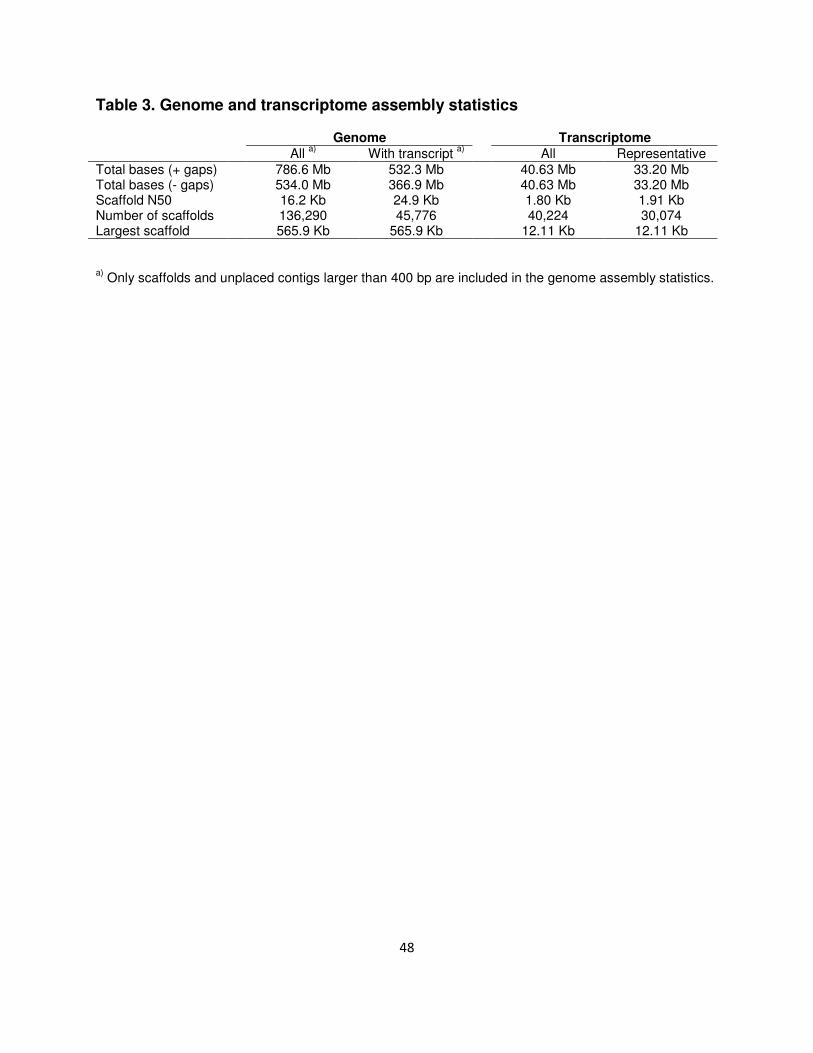
Table 3. Genome and transcriptome assembly statistics
Genome Transcriptome
All a)
With transcript a)
All Representative
Total bases (+ gaps) 786.6 Mb 532.3 Mb 40.63 Mb 33.20 Mb Total bases (- gaps) 534.0 Mb 366.9 Mb 40.63 Mb 33.20 Mb Scaffold N50 16.2 Kb 24.9 Kb 1.80 Kb 1.91 Kb Number of scaffolds 136,290 45,776 40,224 30,074 Largest scaffold 565.9 Kb 565.9 Kb 12.11 Kb 12.11 Kb
a) Only scaffolds and unplaced contigs larger than 400 bp are included in the genome assembly statistics.
49
Figure legends
Figure 1. Transcript classes in Cannabis sativa and Arabidopsis thaliana. Panther
[28] was used to determine the distribution of transcripts in (a) C. sativa (PK) (30,074
representative transcripts) and (b) A. thaliana (31,684 transcripts). The high degree of
similarity between both species indicates that all major functional classes are
proportionally represented in the PK transcriptome assembly.
Figure 2. Proportion of transcriptome mapping to genome assembly
(a) A histogram showing the number of bases in the transcript assembly that could be
mapped to the genome at 98% sequence identity, as a function of transcript length in
300 nt bins. (b) The proportion of transcriptome bases that could be mapped to the
genome for the same bins as in (a). The black dashed line indicates the proportion of
the transcriptome that is accounted for in the genome assembly.
Figure 3. Analysis of gene expression in PK tissues. (a) RNA-Seq read counts for
30,074 representative transcripts (rows), expressed as log2 RPKM, were subjected to
hierarchical agglomerative clustering based on their expression pattern across tissues
(columns). (b) Schematic illustration of THCA and CBDA cannabinoid biosynthesis,
including the production of fatty acid and isoprenoid precursors via the hexanoate, MEP
and GPP pathways. Hexanoate could arise through fatty acid degradation, involving
desaturase, lipoxygenase (LOX) and hydroperoxide lyase (HPL) steps. Activation of
hexanoate by an acyl-activating enzyme (AAE) yields hexanoyl-CoA, which is the

50
substrate for the polyketide synthase enzyme (OLS) that forms olivetolic acid. The
prenyl side-chain originates in the MEP pathway, which provides substrates for GPP
synthesis, and is added by an aromatic prenyltransferase (PT) [36]. The final steps are
catalyzed by the oxidocyclases THCAS and CBDAS. Pathway enzymes and metabolic
intermediates are indicated in black and blue, respectively.. (c) Same data as (a),
showing the expression levels for genes in the cannabinoid pathway and precursor
pathways (rows) across the six assayed tissues (columns). The majority of the genes
encoding cannabinoid and precursor pathway enzymes are most highly expressed in
the flowering stages. Gene and pathway names correspond to those used in panel B.
Figure 4. Comparison of gene expression in female cannabis flowers, and gene
copy number, between marijuana (PK) and hemp (‘Finola’). (a) A scatter plot of
RNA-Seq read counts for all representative transcripts in marijuana and hemp,
expressed as log2 RPKM. Specific subsets of transcripts are shown in color, as
indicated in the key. The dashed line represents the relative enrichment of trichomes in
the marijuana strain, inferred from the ratio in expression of trichome-specific genes, as
defined in the text. Gene symbols/abbreviations: CAN – known and putative
cannabinoid pathway genes; HEX – putative hexanoate pathway genes; GPP - GPP
pathway genes; MEP - MEP pathway genes; TF - putative transcription factors
according to PFAM, with at least a 4-fold change in expression in PK relative to ‘Finola’;
MYB - Myb-domain transcription factors previously suggested as trichome regulators.
(b) A scatter plot of the log2 median read depth (MRD) of genomic DNA-Seq reads that
aligned uniquely to the PK transcriptome. Genomic reads were trimmed to a length of
51
32 bases prior to alignment with Bowtie, to allow for mapping close to exon junctions.
The lack of outliers in the scatter plot indicates that there have been relatively few
changes in gene copy number between marijuana and hemp. (c) The relative RNA-Seq
expression of individual genes in the cannabinoid pathway and precursor pathways (is
shown on the left), adjusted for enrichment of trichome-specific genes (i.e. relative to
the dashed line in panel a).The median genomic DNA read depth for the same genes is
shown on the right. The box plots reflect the variation in the depth of coverage of
uniquely aligned genomic DNA reads across each transcript, with the median coverage
distribution across all transcripts shown as reference (All). Reads that are likely derived
from pseudogenes are marked by the symbol [P]. While there is increased expression
of most cannabinoid genes in the HEX and CAN pathways (left) in PK, this does not
appear to be due to an increased representation of these genes in the PK genome
relative to the ‘Finola’ genome (right).
Figure 5. Neighbour-joining tree for two hemp cultivars and two marijuana
strains. The tree was plotted in MEGA5 [71] using the maximum composite likelihood
of SNV nucleotide substitution rates, calculated based on the concatenated SNV
sequences in each variety, as a distance metric. The topology of the tree reveals a
distinct separation between the hemp and marijuana strains.

Cannabis sativa Arabidopsis thaliana
Calcium-binding protein
Cell adhesion molecule
Cell junction protein
Chaperone
Cytoskeletal protein
Defense/immunity protein
Enzyme modulator
Oxidoreductase
Phosphatase
Protease
Receptor
Signaling molecule
Storage protein
Structural protein
Extracellular matrix protein
Hydrolase
Isomerase
Ligase
Lyase
Membrane traffic protein
Nucleic acid binding
Surfactant
Transcription factor
Transfer/carrier protein
Transferase
Transmembrane protein
Transporter
Viral protein
(a) (b)
Figure 1
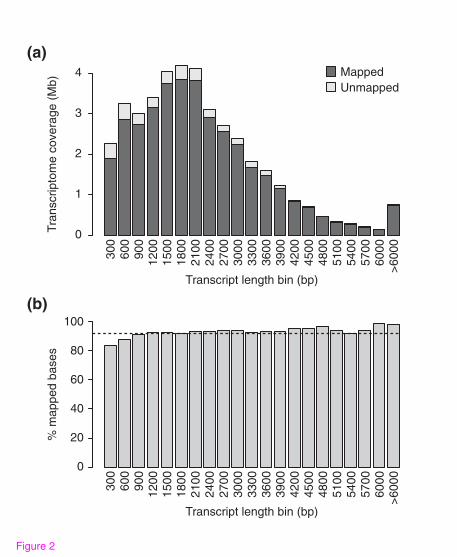
300
600
900
1200
1500
1800
2100
2400
2700
3000
3300
3600
3900
4200
4500
4800
5100
5400
5700
6000
>6000
Tra
nscripto
me c
overa
ge (
Mb)
% m
apped b
ases
0
0
20
40
60
80
100
Transcript length bin (bp)
300
600
900
1200
1500
1800
2100
2400
2700
3000
3300
3600
3900
4200
4500
4800
5100
5400
5700
6000
>6
000
Transcript length bin (bp)
1
2
Mapped
Unmapped
3
4
(a)
(b)
Figure 2

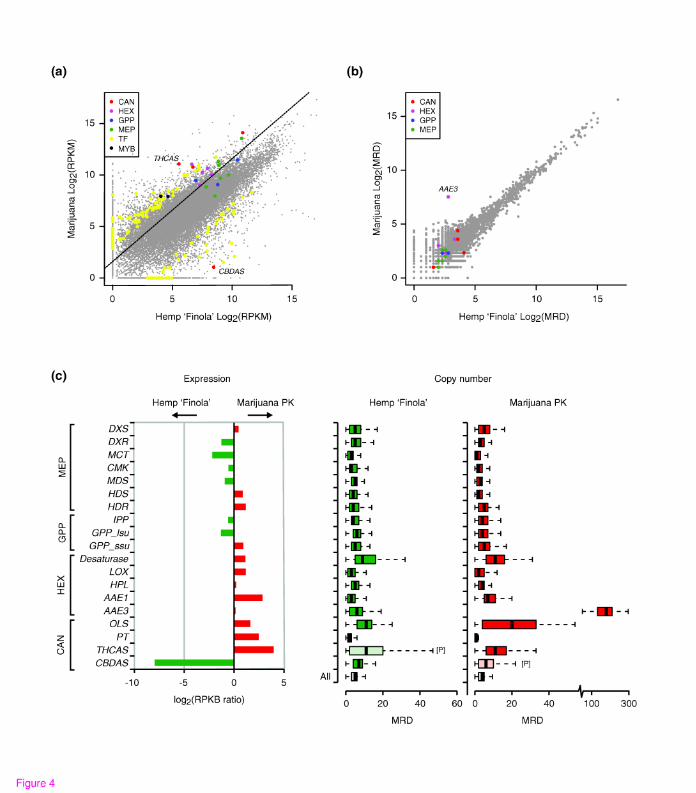

Purple Kush
Chemdawg
‘Finola’
‘USO-31’
0.2
Figure 5