genome-wide analysis of - concordia university · complies with the regulations of the university...
TRANSCRIPT

Genome-wide analysis of
trimethylated lysine 4 of histone H3 (H3K4me3)
in Aspergillus niger
Christina Sawchyn
A Thesis
in
The Department
of
Biology
Presented in Partial Fulfillment of the Requirements
for the Degree of Master of Science (Biology) at
Concordia University
Montreal, Quebec, Canada
April 2014
© Christina Sawchyn, 2014

CONCORDIA UNIVERSITY
School of Graduate Studies
This is to certify that the thesis prepared
By: Christina Sawchyn
Entitled: Genome-wide analysis of trimethylated lysine 4 of histone H3 (H3K4me3)
in Aspergillus niger
and submitted in partial fulfillment of the requirements for the degree of
Master of Science (Biology)
complies with the regulations of the University and meets the accepted standards
with respect to originality and quality.
Signed by the final Examining Committee:
______________________________________ Chair
Dr Malcolm Whiteway
______________________________________ External Examiner
Dr Reginald Storms
______________________________________ Examiner
Dr Alisa Piekny
______________________________________ Examiner
Dr Justin Powlowski
______________________________________ Supervisor
Dr Adrian Tsang
Approved by __________________________________________________
Dr Selvadurai Dayanandan, Graduate Program Director
May 29, 2014 __________________________________________________
Joanne Locke, Interim Dean of Faculty

iii
Abstract
Aspergillus niger is a commercially important producer of enzymes and organic acids. In
this study, I have examined the distribution of trimethylated lysine 4 of histone H3 (H3K4me3)
in the A. niger genome. I performed chromatin immunoprecipitation followed by sequencing
(ChIP-seq) to determine the genomic regions enriched for nucleosomes with this histone
modification. I have conducted an analysis of the resulting peaksets to determine the optimal
peak finding parameters for use in the detection of H3K4me3 ChIP-enriched regions in A. niger.
As H3K4me3 was previously widely reported to mark actively transcribed genes, genome-wide
ChIP-seq maps for maltose and xylose growth were compared with transcriptome data generated
under the same growth conditions. Almost all genes that contained H3K4me3 are actively
transcribed. However, nearly a third of all actively transcribed genes are not associated with
H3K4me3. In addition, H3K4me3 is not associated with the majority of genes differentially
expressed on maltose or xylose growth. Chromosomal maps revealed that this histone
modification is non-randomly distributed in the genome. In particular, H3K4me3 is enriched at
pericentromeric regions, but absent at the centromere and at regions proximal to the telomeres.
Finally, H3K4me3 occasionally localized to actively transcribed regions not predicted to contain
a gene model. The results of this study suggest that H3K4me3 is positively correlated with
transcriptional activity, but is not a definitive marker of active gene expression. Furthermore, this
modification is highly locally organized along A. niger chromosomes. Epigenetic phenomena in
A. niger warrant further study to determine their significance in genome regulation.

iv
Acknowledgements
Firstly and most importantly, I thank my supervisor, Dr Adrian Tsang. I am grateful for the
opportunity to pursue graduate studies under his supervision and in a state-of-the-art laboratory
environment: I benefited greatly from the outstanding facilities at the Centre for Structural and Functional
Genomics (CSFG). I would also like to thank Dr Tsang for the opportunity to perform a ChIP-seq
experiment for the first time in Aspergillus niger. This is a fascinating area of research at the frontier of
molecular biology and I am privileged to have been part of this project. In particular, I am indebted to Dr
Tsang for his instruction in experimental design and execution for generating high-quality results. As
well, in the preparation of this Thesis, Dr Tsang provided me with a great deal of feedback, which has
greatly impacted my writing skills in scientific communication. Finally, Dr Tsang has supported me in
presenting my research at several conferences, experiences for which I am extremely grateful.
It has been a pleasure working with my committee members. I thank Dr Justin Powlowski for
attending lab meetings where I presented results. Dr Alisa Piekny was instrumental in providing direction
to the project, most importantly in suggesting the use of an antibody against a histone modification.
I had the opportunity to collaborate with many outstanding individuals at the CSFG. I thank Dr
Marcos Di Falco for his assistance with the mass spectrometry analysis as well as his support and
encouragement. Dr Ian Reid performed sequence mapping and Dr Emmet O’Brien assisted with aspects
of the bioinformatics analysis. Dr Marie-Jean Meurs was extremely helpful with R Bioconductor and
statistical testing. Truly, all members of the staff at the CSFG have been kind and always ready to lend a
hand. I am fortunate to have worked with each and every one of them.
Without the immeasurable contribution of Vincent Lau, the data analysis portion of this work
would not have been possible. Vincent was always brilliant, patient, enthusiastic and ready to assist.
I would like to acknowledge and thank Vanessa Blandford, not only for providing RNA-seq data
integral to this project, but also for her companionship as a fellow graduate student and friend.
I am especially thankful for support and mentorship from Miriam Posner. Miriam has encouraged
and supported me for many years and I owe her my deepest gratitude.
Last but not least, I would like to offer my special thanks to all of my family and friends for
supporting me through thick and thin. I thank Danny Baum for his friendship, support and love,
particularly in the final stages of this process. Most significantly, thanks to my parents, who have
supported me materially and spiritually in all of my endeavours.

v
Table of Contents
List of Figures ........................................................................................................................................ vii List of Tables ........................................................................................................................................ viii
List of Abbreviations ............................................................................................................................ viii
Section 1: Introduction ................................................................................................................. 1
1.1 The epigenetic regulation of genomes ................................................................................................ 1
1.2 Organization of chromatin .................................................................................................................. 2
1.3 Epigenetic modifications of histones .................................................................................................. 2
1.4 Epigenetic regulation of gene expression ........................................................................................... 4
1.5 Histone methylations as epigenetic markers ....................................................................................... 6
1.6 Trimethylation of lysine 4 on histone H3 (H3K4me3) ....................................................................... 9
1.7 Chromatin immunoprecipitation followed by sequencing: ChIP-seq ............................................... 11
1.8 ChIP-seq data analysis to determine significantly enriched regions ................................................ 14
1.9 Aspergillus niger, a cell factory ........................................................................................................ 15
1.10 Rationale for studying comparative ChIP-seq of A. niger H3K4me3 in growth on maltose and
xylose ...................................................................................................................................................... 16
Section 2: Methods ...................................................................................................................... 19
2.1 Aspergillus niger strains, media and growth conditions ................................................................... 19
2.2 Formaldehyde crosslinking of A. niger mycelia ............................................................................... 19
2.3 Cell lysis and crude separation of cytosolic and nuclear fractions ................................................... 20
2.4 Determination of DNA in pellet and supernatant fractions .............................................................. 21
2.5 Assessment of formaldehyde crosslinking ....................................................................................... 21
2.6 Protein digestion ............................................................................................................................... 22
2.7 LC-MS/MS analysis ......................................................................................................................... 22
2.8 Mass spectrometry bioinformatics data processing .......................................................................... 23
2.9 Lysis of crude nuclei enriched pellet and determination of sonication conditions ........................... 23
2.10 Chromatin immunoprecipitation (ChIP) ......................................................................................... 24
2.11 Immunoblotting to determine the reactivity of the anti-H3K4me3 antibody and sequencing of
immunoprecipitated chromatin ............................................................................................................... 25

vi
2.13 Identification of H3K4me3 peaks ................................................................................................... 26
2.14 Peakset and differential binding analysis with the DiffBind package for R Bioconductor ............ 27
2.17 File conversions, ChIP peak intersections, annotation and analysis of peaksets ............................ 27
2.19 Statistical testing of differences between distributions of FPKM values ....................................... 27
2.20 Data visualization ........................................................................................................................... 27
Section 3: Results ........................................................................................................................ 28
3.1 Protocol development for ChIP-seq in Aspergillus niger ................................................................. 28
3.1.1 Enrichment of nuclear fraction for ChIP-seq analysis .............................................................. 28
3.1.2 Demonstration of suitable crosslinking conditions ................................................................... 31
3.1.4 H3K4me3 chromatin immunoprecipitation followed by sequencing (ChIP-seq) ..................... 33
3.2 H3K4me3 ChIP-seq data processing ................................................................................................ 36
3.2.1 H3K4me3 peak finding ............................................................................................................. 36
3.2.2 Analysis of SICER peakset correlation between replicates ...................................................... 38
3.2.3 SICER peakset analysis ............................................................................................................. 38
3.3 H3K4me3 patterns and distribution in the Aspergillus niger genome .............................................. 47
3.3.1 A majority of actively transcribed genes contain H3K4me3 .................................................... 47
3.3.2 Differential H3K4me3 binding analysis .................................................................................... 53
3.3.3 Comparison of differential H3K4me3 binding and levels of transcript accumulation .............. 55
3.3.4 Genes with and without H3K4me3 are not randomly distributed along the chromosome ........ 61
3.3.5 H3K4me3 is associated with potential non-coding RNA .......................................................... 66
Section 4: Discussion ................................................................................................................... 70
4.1 Development of a method for enrichment of nuclei in Aspergillus niger ........................................ 70
4.2 Technical considerations for A. niger ChIP-sequencing and data analysis ...................................... 70
4.3 H3K4me3 is not a definitive marker of active gene transcription in A. niger .................................. 72
4.4 Non-random distribution of H3K4me3 in the chromosome ............................................................. 75
4.5 H3K4me3 supports the annotation of genomic features ................................................................... 76
Section 5: Conclusion .................................................................................................................. 77
Section 6: References .................................................................................................................. 78

vii
List of Figures
Figure 1. Post-translational modifications on histones ...................................................................3
Figure 2. Suggested modes of genome regulation by histone modifications ..................................5
Figure 3. Summary of a ChIP-seq experiment...............................................................................12
Figure 4. Representation of xylose and maltose metabolic pathways in Aspergillus niger ..........17
Figure 5. DNA content of nuclear and cytosolic fractions ............................................................29
Figure 6. Distribution of marker proteins in pelleted and supernatant fractions ...........................30
Figure 7. Chromatin crosslinking and de-crosslinking .................................................................32
Figure 8. Determination of sonication conditions..........................................................................34
Figure 9. H3K4me3 antibody specificity .......................................................................................35
Figure 10. Control sonicated DNA as a control for H3K4me3 ChIP-seq .....................................37
Figure 11. Correlation heatmap of peaksets ..................................................................................39
Figure 12. Peak finding parameters and the number of H3K4me3 modified genes detected .......43
Figure 13. The effect of smaller window and gap sizes on peak detection ...................................44
Figure 14. Effects of gap size on fragmented peak regions ...........................................................46
Figure 15. Comparing gene expression of A. niger and presence of H3K4me3 for growth on
maltose and xylose .........................................................................................................................48
Figure 16. Comparing expression and presence of H3K4me3 across functional categories .........49
Figure 17. Presence of H3K4me3 in constitutively transcribed genes ..........................................54
Figure 18. Visual representation of significantly differentially bound sites ..................................56
Figure 19. Maltose growth and xylose growth peak occupancy analysis .....................................58
Figure 20. Comparison of differentially expressed genes and H3K4me3 modification................59
Figure 21. Chromosomal distribution of H3K4me3 ......................................................................62
Figure 22. Genes with and without H3K4me3 in regions surrounding the centromeres and
telomeres ........................................................................................................................................64
Figure 23. H3K4me3 marks regions of non-coding transcripts ....................................................67

viii
List of Tables
Table 1. Proposed regulatory functions of histone methylations ....................................................7
Table 2. Published histone modification ChIP-seq studies in fungi ..............................................13
Table 3. Pearson correlation values of SICER peaksets from sample replicates ...........................40
Table 4. Genes marked or unmarked by H3K4me3 categorized by protein function ...................52
Table 5. Differentially bound sites identified in DiffBind .............................................................57
Table 6. Differentially transcribed genes with differential H3K4me3 ..........................................60
Table 7. H3K4me3 distribution at regions proximal to the centromeres and telomeres ...............65
Table 8. Genome coordinates for ChIP-enriched regions not intersecting with a known gene
model..............................................................................................................................................68
List of Abbreviations
ACN acetonitrile
bp base pair
CCAT Control based ChIP-seq Analysis Tool
ChIP chromatin immunoprecipitation
ChIP-seq chromatin immunoprecipitation-sequencing
chr chromosome
CID collision-induced disassociation
DTT dithiothreitol
ECL enhanced chemiluminescence
EDTA ethylenediaminetetraacetic acid
FA formic acid
FDR false discovery rate
FPKM fragments per kilobase of exon per million fragments mapped
G gap size
GC guanine-cytosine
GH glycosyl hydrolase
H1 histone H1
H2A histone H2A
H2B histone H2B
H3 histone H3
H3K4me3 tri-methylated Lysine 4 on histone H3
H4 histone H4
H5 histone H5

ix
HPLC high performance liquid chromatography
IgG immunoglobulin G
K lysine
kb kilobase
kbp kilobase pair
kDa kilodalton
kV kilovolt
LC liquid chromatography
LiCl lithium chloride
MA M (log ratios) and A (mean average)
Me methyl group
MgOAc magnesium acetate
MM minimal media
MS mass spectrometry
NaCl sodium chloride
NADP nicotinamide adenine dinucleotide phosphate
NaHCO3 sodium bicarbonate
NP-40 Nonidet P-40
PAGE polyacrylamide gel electrophoresis
PBS phosphate-buffered saline
PCI phenol/chloroform/isoamyl alcohol
PCR polymerase chain reaction
PHD plant homeodomain
PMSF phenylmethanesulfonyl fluoride
R arginine
RCDC reducing agent and detergent compatible
RNA ribonucleic acid
RNAP RNA polymerase
RNase A ribonuclease A
rRNA ribosomal RNA
SD standard deviation
SDS sodium dodecyl sulfate
SICER spatial clustering approach for identification of ChIP-enriched regions
TAF3 TATA-box binding protein associated factor 3
TE Tris-EDTA
TFIID transcription factor II D
Tris-HCl Tris hydrochloride
tRNA transfer RNA
Ub ubiquitin
W window size

1
Section 1: Introduction
1.1 The epigenetic regulation of genomes
Despite the availability of a wide variety of whole genome sequences, biologists are still
unable to resolve differences in biological characteristics of different cell types, individuals or
species based solely on heritability of gene sequence or DNA mutations. It has become clear that
certain phenomena are governed by other determinants not contained within the DNA sequence.
The term “epigenetics” (derived from the Greek “epi”, meaning “above” or “on top”),
coined by the British biologist Conrad Waddington (Waddington, 1942), is the study of clonally
heritable alterations that direct expression in genomes, unrelated to primary DNA sequence.
These differences include, among others, DNA methylation, paramutation, DNA damage, and
histone modifications.
The biological consequences of epigenetic phenomena, seen in all eukaryotes, are varied.
In mammals, totipotent cells are guided to a differentiated state via epigenetic changes (Boyer et
al. 2006). Once a cell is fully differentiated into a specific cell type, the genome needs to be
stabilized to realize long-term stable gene expression patterns, achieved here again by imparting
epigenetic changes (Ng and Gurdon, 2008). Changes in the epigenome are linked to various
types of cancer and have led to targets for therapeutics (Højfeldt et al. 2013). Epigenetic
modifications have also been implicated in the mediation of DNA repair mechanisms (Li et al.
2013; Tang et al. 2013). In the plant genome, epigenetic mechanisms are involved in
developmental processes, stress-responses and phytohormone signaling (Chen and Zhou, 2013).
In filamentous fungi, the epigenome has become important in the study of secondary metabolite
synthesis (Gacek and Strauss, 2012). For example, the sterigmatocystin gene cluster in
Aspergillus nidulans is regulated by competition between an activating epigenetic modification
that promotes gene expression and a repressing epigenetic marker that mediates genome
silencing (Reyes-Dominguez et al. 2010).
The study of epigenetics has moved to the forefront of molecular biology and has been a
dynamic and productive area of research in the last decade. Advances in epigenetics hold
multiple implications for understanding previously inexplicable changes in eukaryotic gene
expression and chromosome structure.

2
1.2 Organization of chromatin
The basic packaging unit of DNA in nuclear chromatin is the nucleosome. Crystal
structure analysis has revealed that the nucleosome is formed by a core particle consisting of 146
base pairs of DNA superhelix wrapped around the histone octamer, which is made up of two
H2A/H2B heterodimers and two H3 and H4 dimers (Luger et al. 1997). These are immediately
followed by short stretches of linker DNA, which complex with H1 and H5 linker histones. The
nucleosome particles wrapped in DNA form 10 nm linear “beads-on-a-string” structures, known
as chromatin “fibers”. Linear chromatin can assemble into larger 30 nm fibers and even higher
order structures, a phenomenon termed “chromatin compaction”. The properties and fundamental
structure of these arrangements is still controversial (Grigoryev and Woodcock, 2012). Although
many aspects of chromatin biology remain ambiguous, there is clear evidence that the chromatin
fiber is a dynamic and flexible structure that moves inside living cells (Lanctot et al. 2007).
Furthermore, some chromatin loci are more mobile than others and this can depend on their
location within the nucleus.
1.3 Epigenetic modifications of histones
The histones that assemble into nucleosomes and chromatin fibers are subject to a
number of modifications and mediate the epigenetic process. Most histone modifications occur
in the first 25 N-terminal amino acids protruding from the nucleosome core. Several types of
histone modifications have been identified, including phosphorylation of serine, threonine and
tyrosine residues; lysine acetylation, ubiquitylation and sumoylation; and lysine and arginine
methylation (Bannister and Kouzarides, 2011).

3
Figure 1. Post-translational modifications on histones
A depiction of the histone “code”, made up of DNA methylations and other post-translational
histone modifications, read by chromatin binding proteins. (Image source: Scharf and Imhof,
2011)

4
The “histone code” theory proposes that combinations of post-translational covalent
modifications on nucleosomal histones distributed along chromatin (Figure 1) confer a particular
regulatory state or functional properties for that region (Strahl and Allis, 2000; Gardner et al.
2011). Chromatin-binding molecules can recognize this histone “barcode” and facilitate the
recruitment of other factors to alter the chromatin structure (Taverna et al. 2007).
However, due to the lack of experimental support, the “histone code” theory has been
questioned (Henikoff and Shilatifard, 2011). The central question is whether histone
modifications cause a biological response or occur as a result of dynamic cellular processes. In
other words, it has not yet been shown whether histone modifications dictate chromatin changes
that result in a defined output, such as transcriptional activation or repression.
1.4 Epigenetic regulation of gene expression
Two general concepts of possible signaling by histone modifications and their effect on
chromatin structure and transcriptional control have been proposed: direct (or cis) and indirect
(or trans). An overview of these mechanisms is shown in Figure 2 (review of Greer and Shi,
2012).
In cis regulation, histone modifications influence higher order structures of chromatin,
which impact nucleosome positioning, stability and assembly. One theory suggests the
occurrence of chromosomal “looping” by interacting histone modifications (Figure 2, Panel a),
physically bringing together separate, non-adjacent compartments of chromatin (Dekker et al.
2002), which could include gene activating enhancer elements or repressing insular regions
(Deng and Blobel, 2010). The phenomenon known as “gene kissing”, in which distant regulatory
elements and target genes co-localize (occasionally between different chromosomes) has been
demonstrated in Drosophila, mouse and human cells (Lanctot et al. 2007). Precisely how histone
methylations mediate this process remains thus far untested (Allis and Muir, 2011).
In trans regulation, histone modifications facilitate the recruitment or release of specific
binding proteins, such as chromatin remodeling complexes, which mediate their function. One
proposed mechanism suggests that inaccessible chromatin domains can be “opened” by DNA
sequence-specific “pioneering” transcription factors (Cirillo et al. 2002) such as forkhead box
proteins (Figure 2, Panel b). After this binding event, DNA methylation and other histone

5
Figure 2. Suggested modes of genome regulation by histone modifications.
A representation of proposed mechanisms for transcriptional regulation by histone methylations.
Panel a) depicts a cis model and various proposed trans models are shown in Panels b)-d).
(Image source: Greer and Shi, 2012)

6
modifications participate in making the chromatin more accessible to other transcription factors,
the pre-initiation complex and RNA polymerase II (Serandour et al. 2011). Stretches of certain
histone methylation patterns may be a requirement for the binding of transcription factors
(Figure 2, Panel c), as has been demonstrated for the human Myc transcription factor binding to
promoter regions (Guccione et al. 2006), although the mechanism for this is unclear. Finally,
histone modifications can facilitate recruitment of chromatin remodeling complexes (Fuda et al.
2009) to potentially regulate transcriptional efficiency and/or elongation (Figure 2, Panel d).
Despite recent advances made in understanding indirect regulation by histone modifications,
much remains to be understood about the precise functions and order of events that link them to
transcription control (Greer and Shi, 2012).
1.5 Histone methylations as epigenetic markers
Post-translational modifications on histones H1, H2A, H2B, H3 and H4 have been
experimentally correlated with diverse biological functions and processes, including
development and differentiation, cell-cycle regulation, DNA repair, RNA splicing and
transcriptional processes (Kouzarides, 2007; Pederesen and Helin, 2010; Greenberg, 2011;
Eissenberg and Shilatifard, 2010).
As reviewed by Fischle (2013), the most complex epigenetic modification is histone
methylation. Histones are mainly methylated on their arginines and lysines, and rare methylation
of histidines has been described (Gershey et al. 1969, Borun et al. 1972). All methylations of
lysines occur on the ε-amine group, which can be mono- (me), di- (me2) or tri-methylated (me3).
Peptidylarginine methyltransferases methylate arginines once or twice, the latter either
asymmetrically (both methyl groups on one terminal nitrogen) or symmetrically (one methyl
group on each terminal nitrogen). Table 1 summarizes the epigenetic effects of histone
methylations that have been experimentally characterized to date. Methylations of histones have
been implicated in both activation and silencing of global gene expression. The most studied
methylations are those occurring on histones H3 and H4. In general, transcriptional activation is
associated with symmetrical dimethylation of arginine 2 on histone H3 (H3R2me2), H3K4me3,

7
Table 1. Proposed regulatory functions of histone methylations
*'s': symmetrical methylation; 'a': asymmetrical methylation
Histone
and
modified
residue
Methyl
(me)
groups Organism(s) Proposed function(s)
References
(PMID)
H1.4K26 me2 H. sapiens transcriptional silencing 16127177
15099518
H2AR3 me2 H. sapiens regulation of DNA repair response 22761421
H2BK5 me1 H. sapiens transcriptional activation 17512414
H3R2 me2a* H. sapiens, S. cerevisiae transcriptional repression 17898714
17898715
H3R2 me2s*
M. musculus,
D. melanogaster, X. laevis,
S. cerevisiae
transcriptional activation 22720264
H3K4 me1 H. sapiens transcriptional repression;
maintenance of promoter structure 24656132
H3K4 me1 D. melanogaster transcriptional activation 23166019
23560912
H3K4 me1 C. reinhardtii transcriptional repression 16100335
H3K4 me1 S. cerevisiae transcriptional repression 15949446
H3K4 me2 H. sapiens transcriptional activation 17512414
H3K4 me2 S. cerevisiae transcriptional repression 23028359
H3K4 me2 H. sapiens establishment of transcription factor
binding regions 24530516
H3K4 me2 D. melanogaster transcriptional de-repression 15031712
15175259
H3K4 me3 H. sapiens, O. sativa,
S. cerevisiae transcriptional activation
17043231
17512414
20086188
12060701
12353038
14636589
H3K4 me3 D. melanogaster transcriptional de-repression 15031712
15175259
H3K4 me3 S. cerevisiae establishment of repressive chromatin
structure 23028359
H3K4 me3 A. thaliana transcriptional elongation 23284292
H3R8 me2 H. sapiens transcriptional repression
15485929
17043109
17627275
18694959
21447565
H3K9 me1 H. sapiens transcriptional activation 17512414

8
Histone
and
modified
residue
Methyl
groups Organism(s) Proposed function(s)
References
(PMID)
H3K9 me3 M. musculus,
H. sapiens
propagation of heterochromatin;
transcriptional silencing
11242053
17512414
H3K9 me3 H. sapiens transcriptional repression 11959841
H3K9 me3 N. crassa, A. thaliana DNA methylation 11713521
12194816
H3K9 me3 N. crassa normal distribution of centromeric histone
variant 21505064
H3K9 me3 D. melanogaster transcriptional activation 12397363
H3R17 me1 H. sapiens transcriptional activation
11747826
11751582
12498683
H3R17 me2a* H. sapiens transcriptional de-repression 22723830
H3R17 me2a* H. sapiens transcriptional activation 22451921
H3R26 me2a* H. sapiens transcriptional de-repression 22723830
H3K27 me1 H. sapiens transcriptional activation 17512414
H3K27 me3 H. sapiens transcriptional repression 17512414
H3K36 me2 S. cerevisiae, S. pombe,
D. melanogaster
transcriptional elongation;
chromatin deacetylation
15798214
16087749
18007591
24004944
H3K36 me3 D. melanogaster transcriptional elongation;
chromatin deacetylation 18007591
H3K36 me3 H. sapiens regulation of DNA repair response 23622243
H3K79 me2 S. cerevisiae inhibition of heterochromatin propagation 15920479
12574507
H3K79 me2 D. melanogaster,
M. musculus transcriptional activation
15175259
18285465
H3K79 me2 H. sapiens transcriptional elongation 17135274
17855633
H3K79 me3 D. melanogaster transcriptional activation 20203130
H4R3 me2s* H. sapiens regulation of DNA repair response 22761421
H4R3 me2s* H. sapiens DNA methylation; transcriptional silencing 19234465
H4K16 me1 H. sapiens unknown 21925322
H4K20 me1 D. melanogaster transcriptional silencing 12086618
H4K20 me1 H. sapiens DNA replication 20953199
H4K20 me2 S. pombe, H. sapiens,
M. musculus regulation of DNA repair response
15550243
23377543
H4K20 me3 M. musculus transcriptional silencing 15145825
*'s': symmetrical methylation; 'a': asymmetrical methylation

9
H3K9me1 and H3K79me3. Transcriptional repression is correlated with H3K9me3 and
H3K27me3. H3K9me3 is also involved in genome silencing by heterochromatin formation and
H3K79me2 inhibits heterochromatin formation. H3K36me2/3 and H3K79me2 function in
transcriptional elongation. Other proposed functions of histone methylations include DNA repair
(H2AR3me2, H3K36me3 and H4K20me2), DNA methylation (H3K9me3 and H4R3me2s) and
DNA replication (H4K20me1). Some histone methylations were shown to behave differently
between species or to have dual roles. For example, H3K4me1 is an activating marker in fruit
fly, but is correlated with transcriptional repression in yeast and human. The best-studied
chromatin modification, tri-methylation of lysine 4 of histone 3 (H3K4me3), is in yeast
associated with active transcription, but has also been implicated in transcriptional repression.
1.6 Trimethylation of lysine 4 on histone H3 (H3K4me3)
H3K4me3 is a well-conserved modified histone found universally in eukaryotes (Strahl et
al. 1999; Fuchs et al. 2006). In yeast, the Set1/COMPASS complex is responsible for catalyzing
methylations on H3 and was the first histone methylase to be identified (Miller et al. 2001).
These modifications were first thought to be irreversible, due to the thermodynamic stability of
the N-CH3 bond. The discovery of H3K4 demethylases (Shi et al. 2004, Trewick et al. 2005,
Christensen et al. 2007) changed this perception. It has since been demonstrated that histone
methylation, including trimethylation of H3K4me3 (Maltby et al. 2012), is a biochemically
dynamic modification.

10
Several different proteins with a variety of biological functions can bind H3K4me3.
These include transcriptional activators, chromatin remodeling factors, histone acetylation
proteins, chromatin silencing factors, and proteins involved in splicing efficiency (reviewed by
Vermeulen and Timmers, 2010). An important question is how specific recruitment of these
factors is achieved, given their functional diversity and sometimes opposing effects. Currently, it
is thought that this can be achieved by the interaction of H3K4me3 with specific transcription
factors to recruit the appropriate binding molecule (Vermeulen et al. 2007). Another model
suggests that H3K4me3 stabilizes the interaction between transcription factors and other proteins
or facilitates the interaction of the H3K4me3 binding complexes with the DNA sequence (Tu et
al. 2008). Finally, the proteins that can bind H3K4me3 have varying levels of affinity for this
histone modification, which may also play a role in recruitment specificity (Sims and Reinberg,
2006; Huang et al. 2006; Vermeulen et al. 2007).
In general, H3K4me3 is localized to promoter regions or 5’ regions of genes and binding
sites decrease in number over the next few kilobases (Schneider et al. 2004; Bernstein et al.
2005; Barski et al. 2007). This pattern is specific to trimethylation of lysine 4, as di- and
monomethyl K4 modifications show distinct distributions. In yeast, H3K4me2 marks were
shown to localize to the middle of gene coding regions and H3K4me1 is found at the end of
genes (Pokholok et al. 2005).
Over the past decade, a number of studies investigating a role for H3K4 methylation in
gene expression have been published for a wide range of eukaryotic species (Table 1). The first
studies to describe a role for H3K4me3 reported that this histone modification was characteristic
of genes undergoing transcriptional activation in yeast (Bernstein et al. 2002; Santos-Rosa et al.
2002). This finding was subsequently echoed for many other species in (reviewed by Sims et al.
2003). In metazoans, H3K4me3 was proposed to play a role in active gene transcription by
serving as a high affinity binding platform for the general transcription initiation factor TFIID,
which is shown to interact directly with the TAF3 subunit (Vermeulen et al. 2007, Lauberth et al.
2013). As a result, it has been suggested that H3K4me3 stabilizes the pre-initiation complex at
the promoter and increases the probability of transcription initiation.
H3K4me3 is thought to function differently in yeast, as its TAF3 subunit lacks the PHD
finger domain (Gangloff et al. 2001). There is emerging evidence supporting alternative

11
explanations for the relationship between H3K4me3 and gene expression in yeast. For instance,
the yeast Set1p methyltransferase, responsible for the methylation of histone H3, was shown to
bind to the initiating form of RNA polymerase II, suggesting that H3K4me3 could occur as a
consequence rather than a cause of transcription (Ng et al. 2003). In addition, more recent studies
exploring the role of H3K4me3 in yeast transcription have described a role for H3K4me3 in both
active and repressed subsets of genes, suggesting that the role of histone modifications in gene
expression may be context-dependent (Guillemette et al. 2011; Margaritis et al. 2012).
In filamentous fungi, studies describing the role and patterns of H3K4me3 are limited. To
date, there have been two reports: in Neurospora crassa (Smith et al. 2011) and Trichoderma
reesei (Seiboth et al. 2012). Each of these studies performed chromatin immunoprecipitation
followed by sequencing (ChIP-seq) to describe the DNA binding sites of H3K4me3.
Descriptions for the role of H3K4me3 in these studies are brief and the authors did not explore
the link between this histone modification and gene expression. A list of all ChIP-seq
publications describing genome-wide patterns of histone modifications in fungi is shown in
Table 2.
1.7 Chromatin immunoprecipitation followed by sequencing: ChIP-seq
Chromatin immunoprecipitation (ChIP) followed by sequencing, known as ChIP-seq,
generates a genome-wide binding map of a given transcription factor, modified histone or DNA
binding protein. This method employs the pull-down of a target protein using an antibody
specific for a DNA binding protein, followed by massively parallel sequencing of the DNA
fragments bound to the protein of interest (originally described by Barski et al. 2007, Johnson et
al. 2007 and Roberston et al. 2007.) A summary of the steps of a ChIP-seq experiment is
illustrated in Figure 3.
ChIP-seq experimental design requires some key considerations. Most importantly,
specificity and sensitivity of antibodies, including commercially available ChIP-grade antibodies
are required to be validated. According to the ENCODE and modENCODE consortia, which

12
Figure 3. Summary of a ChIP-seq experiment
Crosslink chromatin with formaldehyde to fix proteins bound to DNA
Transcriptional activator Nucleosome Histone
modification
Transcriptional repressor
Antibody
Fragment chromatin; immunoprecipitate DNA bound to target protein
Reverse protein-DNA crosslinks; purify and sequence immunoprecipitated DNA
Map sequenced reads to genome; determine enriched regions

13
Table 2. Published histone modification ChIP-seq studies in fungi
A list of publications (derived from PubMed), which have reported histone modification data
from a ChIP-sequencing (ChIP-seq) experiment. This list includes all published ChIP-seq studies
to-date from yeast (Saccharomyces cerevisiae) and filamentous fungi.
Species Histone
modification Year Authors Major findings
S. cerevisiae
H3K36me2
H3K36me3
H2BK123Ub
2011 Batta et al.
H3K36me2 is more frequent in the genome
than H3K36me3; H3K36 methylation is not
linked to transcription frequency; H3K36
methylation contributes indirectly to
nucleosome stability in transcribed regions
S. cerevisiae H3K4me3 2012 Maltby et al.
H3K4me3 is dependent on histone H3
acetylation; H3K4 demethylation is
negatively regulated by histone H3
acetylation
S. cerevisiae H3K4me3 2014 Thornton et al.
H2B ubiquitylation protein complexes play
a context-dependent role in the deposition
of H3K4me3
S. cerevisiae H4K16Ac 2014 Thurtle and
Rine
Telomeres contain a continuous domain of
hypoacetylated H4K16; H4K16 is
uniformly hypoacetylated at the mating-
type loci
Neurospora
crassa
H3K9me3
H3K4me3
H3K4me2
2011 Smith et al.
H3K9me3 co-localizes with centromeric
histone variants; H3K4me3 and H3K4me2
are not enriched at centromeric DNA
Cryptococcus
neoformans H3K9Ac 2011 Haynes et al.
Ada2 acetylates K9 on H3; H3K9Ac is
proximal to transcription start sites
Trichoderma
reesei
H3K9me3
H3K4me3
H3K4me2
2012 Seiboth et al.
The heterochromatin methyltransferase
LaeA is not involved in the methylation of
H3K4 or H3K9
Fusarium
fujikuroi
H3K4me2
H3K9me3
H3K9Ac
2013 Wiemann et al.
Presence of H3K4me2 and H3K9Ac is
correlated with gene expression in
secondary metabolism gene clusters;
presence of H3K4me2 and H3K9Ac
correlates poorly with gene expression
overall

14
have independently performed over 140 experiments in more than 100 cell types in four different
organisms (ENCODE Project Consortium, 2004, 2011; Celniker et al. 2009, Landt et al. 2012),
antibodies against histone modifications are required to pass two separate tests in order to be
considered appropriate for use in ChIP: validation on immunoblot and another secondary test,
such as a peptide-binding assay. Background controls for ChIP-seq are critical. A mock
immunoprecipitation using non-specific immunoglobulin could be performed; but as suggested
Kidder et al. (2011), sonicated genomic DNA from the same experimental source is preferred as
this control provides a more appropriate background for subtraction of biased chromatin regions
that are preferentially sheared during the sonication process and consequently overrepresented in
the genome. Other technical considerations are sufficient sequencing depth of
immunoprecipitated DNA, and the use of a minimum of two biological replicates.
1.8 ChIP-seq data analysis to determine significantly enriched regions
Following the ChIP-sequencing procedure, the resulting mapped reads can then be
viewed in a genome browser, which provides a first impression of enriched regions in the
genome. This is an important step in the process and it provides the end-user with a preliminary
idea of the quality of the experiment and of the tag distribution in relation to genomic features
(Kidder et al. 2011). An analysis is then performed to identify the presence of significant
“peaks”. As programs may differ in how they detect peaks, it is important to choose a ChIP-seq
“peak-calling” algorithm appropriate for the type of DNA binding protein being studied (broad
regions typically associated with histone modifications and sharp regions with transcription
factors). In general, all software for peak finding include the following components: 1) defining a
signal profile along the genome, 2) determining or modeling the background signal, 3)
establishing peak calling criteria, 4) filtering of artifacts and 5) significance ranking or scoring of
individual peaks (Pepke et al. 2009). Although new programs for peak finding in ChIP-seq
experiments are being developed at a very rapid rate, only a few have been demonstrated for
their effectiveness in histone modification data. Peak callers were initially largely developed for
use in detection of peaks at transcription factor binding sites, which are short (<50bp) and sharp
in appearance and sparsely located throughout the genome (Chen et al. 2008; Valouev et al.
2008; Jothi et al. 2008; Kharchenko et al. 2008; Zhang et al. 2008; Rozowsky et al. 2009).

15
Furthermore, different peak callers have, in various benchmarking studies, shown unequal
performances on different data sets (Laajala et al. 2009; Wilbanks and Facciotti, 2010; Micsinai
et al. 2012), emphasizing the importance of testing different peak callers and comparing the
results.
1.9 Aspergillus niger, a cell factory
Aspergillus niger is a black spored, mitosporic filamentous fungal organism known for its
efficient production of citric acid and other primary metabolites. It is sometimes referred to as a
microbial cell factory for production of gluconic and citric acid (Rujiter et al. 2002), the latter
considered to be one of the most efficient and highest yield industrial bioprocesses (Baker,
2006). Aspergillus niger is also known for producing high quantities of commercially important
proteins, due to its inherent high enzyme secretion capacity. In addition, A. niger is a host for
production of a number of heterologous proteins (Punt et al. 2002; Archer and Turner, 2006).
Other important enzymes secreted by A. niger include cellulases, hemicellulases, pectinases and
proteases, which are involved in plant cell wall and complex biomass decomposition. Some of
these enzymes are of interest for their applications in use for degrading non-edible plant matter
in the emerging market of second-generation biofuels research (Galbe and Zacchi, 2007).
Today, commercial enzyme production is a multi-billion industry (Novozymes, 2008) and
applications include the production of high fructose corn syrup and clarification of cider, wine,
and juice.
Owing to its role in industry as a highly efficient protein and metabolite producer and the
availability of its sequenced genome, A. niger has become an important model organism for the
study of expression systems and industrial protein production (Baker, 2006). However, precisely
how A. niger is able to produce protein at a high and efficient rate is unclear. Upon genomic
comparison of the elements of the secretory pathway between A. niger and Saccharomyces
cerevisiae, no significant differences could be found to explain how A. niger is a better secretor
of extracellular proteins than S. cerevisiae (Pel et al. 2007).
Experimental omics research, in combination with the availability of sequenced genomes,
has resulted in fostering A. niger strain and process improvements. For example, Jacobs et al.

16
(2008) integrated proteomics and transcriptomics data to select protein targets for modulation,
which resulted in increased production of the model β-glucuronidase gene. Together with the
availability of other fully-sequenced genomes and data published from a variety of ‘omics
studies, the research community is provided with a basis for comparing the evolution of cellular
processes in the filamentous fungi, including their versatile primary carbon metabolic systems
(Flipphi et al. 2008).
Recently, Tsang et al. have generated a new assembly for the A. niger NRRL3 (N400)
strain (unpublished data). The assembled eight telomere-to-telomere chromosomes have seven
gaps corresponding to seven of the eight centromeres. The NRRL3 genome contains 34.5 Mbp
and a thorough manual curation has defined 11,846 protein-coding genes.
1.10 Rationale for studying comparative ChIP-seq of A. niger H3K4me3 in growth on
maltose and xylose
In the catabolism of biomass, filamentous fungi liberate monomeric sugars, which are
efficiently metabolized by cells. The Aspergilli have become the most widely studied group of
filamentous fungi for their potential in degrading complex plant polysaccharides from biomass
(Culleton et al. 2013). Thus, primary carbon metabolism in Aspergillus niger and other
filamentous fungi has been the subject of a number of investigations. The monosaccharide xylose
is a product of degradation of xylan, the most abundant hemicellulose structure in the cellulosic
microfibril of plant cell walls (Ebringerova and Heinze, 2000). Starch, one of the most common
plant polysaccharides, is cleaved by amylases into maltose, a disaccharide. Both xylose and
maltose can be used by A. niger as sole carbon substrates, but each of these sugars are
catabolized by different metabolic routes (Figure 4). Unmodified xylose is taken up by the cell
and subsequently reduced to xylitol by xylose reductase (Hondmann and Visser, 1994). Xylitol is
converted to L-xylulose, which is subsequently phosphorylated and degraded in the pentose
phosphate pathway. During growth on maltose, the glucoamylase gene is strongly induced and
secreted for cleavage of maltose to glucose (Yuan et al. 2008; Vongsangnak et al. 2009). Glucose
is then taken up by subsequent catabolic degradation by glycolysis or via the pentose phosphate
pathway (Hondmann and Visser, 1994). Alternatively, glucose can be extracellularly

17
Figure 4. Representation of xylose and maltose metabolic pathways in Aspergillus niger.
(Image source: Lu et al. 2010)

18
oxidized to gluconic acid by glucose oxidase, and further metabolized in the pentose phosphate
pathway.
There are notable differences in gene expression for metabolism of maltose and xylose,
as determined by analyses of the transcriptome (Yuan et al. 2008; Jorgensen et al. 2009) and
proteome (Lu et al. 2010; Ferreira de Oliveira, 2011). At the transcriptional level, metabolism of
different carbon sources is regulated by a variety of transcriptional activators and repressors.
Growth on maltose induces the expression of glucoamylase (transcriptionally repressed during
growth on xylose) by the transcription factor AmyR (Petersen et al. 1999). The transcription
factor XlnR has been shown to regulate nearly all genes involved in the xylan and cellulose
degradation pathway (de Vries and Visser, 2001). The carbon catabolite repressor CreA,
represses genes involved catabolism of other carbon sources in the presence of its preferred
source, glucose.
As described above, H3K4me3 has been implicated in changes in global gene expression.
The genome of A. niger NRRL3 is the first filamentous fungal genome with a fully, manually
curated set of genes. This genome resource, combined with the well-characterized metabolism of
xylose and maltose, provides an excellent system to investigate the role of H3K4me3
modification in gene activity. In the present study, the genome-wide status of H3K4me3
modification was investigated in A. niger. First, I optimized a procedure to efficiently obtain a
nuclear-enriched fraction from A. niger for use in the chromatin immunoprecipitation step. I
performed chromatin immunoprecipitation followed by sequencing (ChIP-seq) of A. niger shake
flask cultures grown on maltose or xylose for two hours. Immunoprecipitated DNA bound to the
H3K4me3 chromatin modification was mapped to the NRRL3 A. niger genome. I performed a
peak finding analysis to determine significantly H3K4me3-enriched sites. I obtained
transcriptome data for A. niger growth on maltose and growth on xylose to investigate the
relationship between active gene transcription and the presence of H3K4me3. Finally, I
examined the distribution of H3K4me3 in the chromosomes to determine patterns of localization
of this modified histone in the A. niger genome.

19
Section 2: Methods
2.1 Aspergillus niger strains, media and growth conditions
Aspergillus niger strain N402 (FGSC A733) was obtained from the Fungal Genetics
Stock Center (Kansas City, Missouri, USA). The A. niger strain N402 (cspA1) is a
morphological mutant with short conidiophores derived from the wild-type N400 (NRRL3, CBS
120.49). Conidia for this experiment were generated by plating on potato dextrose agar and
harvesting after 5 days of incubation at 30°C. Conidia were collected in a saline/Tween solution,
counted using a hemacytometer and stored at 4°C.
All media were based on the Aspergillus minimal media (MM) of Pontecorvo et al.
(1953), with differing carbon sources. Primary cultures were grown on 250 mL MM containing
2% (w/v) fructose as a carbon source at 2 x 10⁶ spores/mL. All cultures were incubated at 30°C
in a rotary shaker at 250 rpm. Mycelia were collected by filtration under suction on Miracloth
(EMD Millipore) and briefly washed with sterile water. Aliquots of 2 g of mycelia were
transferred to each secondary culture flask containing 60 mL of MM with 25 mM xylose or 25
mM maltose as carbon sources. Cultures were further incubated for two hours at 250 rpm and
30°C, then collected by filtration, flash frozen in liquid nitrogen and stored at -80°C until further
processing.
2.2 Formaldehyde crosslinking of A. niger mycelia
For mycelia used in the chromatin immunoprecipitation experiments, cultures were
crosslinked as follows: after the two hour secondary culture incubation on either xylose or
maltose, formaldehyde (Molecular Biology Grade, Fisher) was added directly to the culture flask
to a final concentration of 0.75%. Cultures were incubated at room temperature for 8 minutes
with occasional mixing. The crosslinking reaction was quenched with 1M glycine added directly
to the culture to a final concentration of 0.125M. The cross-linked mycelia were harvested and
kept frozen as described in Section 2.1.

20
2.3 Cell lysis and crude separation of cytosolic and nuclear fractions
To isolate a fraction enriched for nuclei to use in chromatin immunopreciptation from the
A. niger cross-linked and frozen mycelia, a protocol modified from those previously described
for use in the filamentous fungus Neurospora crassa (Loros and Dunlap 1991; Luo et al. 1998;
Hong et al. 2008) was employed. First, frozen 1.5 g of mycelia were ground in liquid nitrogen to
a fine powder using a mortar and pestle . Ground mycelia was transferred to a 7-mL beadbeating
tube (Biospec Bioproducts) with 2.5 mL acid-washed 0.5 mm glass beads (Sigma) and 5 mL of
Buffer A (1 M sorbitol, 7% Ficoll, 20% glycerol, 5 mM MgOAc, 3 mM calcium chloride, 3 mM
DTT, 50 mM Tris-HCl pH 7.5) containing freshly added protease inhibitors (Complete Protease
Inhibitor Tablet, EDTA-free, Roche) and 1mM PMSF. Beadbeating was performed using the
Mini-Beadbeater 8 (Biospec Bioproducts) at 3200 rpm for 16 x 30s cycles. Samples were kept
cool by placing on ice every 60s. After beadbeating, samples were transferred to 50-mL tubes
and 10 mL of Buffer B (10% glycerol, 5 mM MgOAc, 25 mM Tris-HCl) containing protease
inhibitors, taking care to rinse the beadbeating tubes with Buffer B to maximize sample recovery.
Samples were gently mixed by inverting and centrifuged at 3000xg for 7 minutes in a swinging
bucket rotor at 4°C to pellet mycelial debris, glass beads and unbroken mycelia. The resulting
crude whole cell extract was carefully transferred to a clean, clear 30-mL ultra-centrifuge tube,
taking care not to disturb the pelleted material, and centrifuged at 9400xg for 15 minutes at 4°C.
Fractions of the resulting supernatant (crude cytosolic proteins) were retained for SDS-PAGE
and determination of protein concentration. The resulting pelleted material (crude nuclear
extract) was washed three times by carefully resuspending in 1 mL of wash buffer (5 mM
MgOAc, 25 mM Tris-HCl), transferring to a 2-mL microfuge tube, centrifuging at 16000xg for 5
minutes and discarding the supernatant.

21
2.4 Determination of DNA in pellet and supernatant fractions
Phenol/chloroform/isoamyl alcohol (PCI, 25:24:1) DNA extractions were performed for
the resulting cytosolic and pelleted material to determine DNA content. Pellet fractions were
resuspended in lysis buffer and were twice purified with PCI and nucleic acid was precipitated
using ethanol. Precipitated DNA pellets were resuspended in TE buffer (1mM EDTA, 10 mM
Tris-HCl, pH8.0) and treated with RNase A at 30°C for 30 min. Samples were purified once
more with PCI, ethanol precipitated and resuspended in TE buffer.
To determine whether any significant amount of DNA and nuclei were being lost to the
supernatant fraction during the beadbeating step, samples of supernatant were subjected to
phenol/chloroform/isoamyl alcohol DNA purification. In total, 6 x 500 μL fractions (3 mL total,
or 20% of the whole supernatant fraction) were combined in order to concentrate them.
Four microlitres from each sample from the pellet and supernatant fractions were loaded
in each lane of a 2% agarose gel for electrophoresis, followed by staining with ethidium
bromide. For nuclei enriched fractions, DNA concentration was also evaluated using the
PicoGreen assay (Invitrogen) following the manufacturer’s instructions.
2.5 Assessment of formaldehyde crosslinking
To determine the appropriate formaldehyde concentration for chromatin crosslinking,
cultures were treated as described previously (Section 2.2) with increasing final concentrations
of formaldeyde (0%, 0.5%, 0.75%, 1%). To determine whether formaldehyde crosslinking of
chromain was sufficient, or if material was over-crosslinked, purified DNA from crosslinked and
reverse crosslinked samples were visualized on a 2% agarose gel with ethidium bromide staining
(see Section 2.4 for DNA purification procedures).

22
2.6 Protein digestion
Following the pelleting and wash steps, the composition of the resulting supernatant
liquid collected after the beadbeating step and washed pellet fraction were prepared for analysis
by mass spectrometry.
Protein sample determination was carried out with the RCDC kit assay (BioRad,
Mississauga, Ont). For in-gel digestions, samples containing 75 of μg of protein were loaded
onto a 4-12% SDS-PAGE gradient gel and stained with Coomassie Blue. Whole lanes were
evenly cut into 15 bands, subsequently destained, reduced, cysteine-alkylated, and in-gel
digested with sequencing grade modified trypsin (Promega, Madison, WI) as previously
described (Wasiak et al. 2002). Peptides were extracted from the gel pieces through multiple
incubations in solutions of 1% formic acid (FA) and increasing concentration of acetonitrile
(ACN). The extracts were dried in a speedvac and resuspended in 60 μl 5% ACN:0.1% FA.
2.7 LC-MS/MS analysis
Peptide digest (5 μL) was loaded onto a 15 cm x 75 mm i.d PicoFrit column (New
Objective, Woburn, MA) packed with Jupiter 5 mm, 300 Å, C18 resin (Phenomemex, Torrance,
CA) connected in-line with a Velos LTQ-Orbitrap mass spectrometer (Thermo-Fisher, San Jose,
CA). Peptide separation was done using a linear gradient generated by an Easy-LC II Nano-
HPLC system (Thermo Fisher) using a mixture of solvent A (3% ACN:0.1% FA) and solvent B
(99.9% ACN:0.1%FA). The gradient started at 1% B, was set to reach 27% B in 21 min, ramped
to 52 % B in 7 min and 90% B in 2 min, then held at 90% for 5 min.
The capillary voltage on the nanospray source was adjusted to get the best spraying
plume at 10% B and typically ranged from 1.9 to 2.1 kV. MS survey scan spanning the 350 to
2000 m/z range was done at 60000 resolution. The top 10 doubly, triply or quadruply charged
ions with intensity higher that 5000 counts were considered candidates to undergo CID MS/MS
fragmentation in the LTQ-Velos ion trap. Optimal accumulation times were set automatically
using adaptive Automatic Gain Control with a maximum accumulation time of 150 msec.
Selected ions were put in a dynamic exclusion list for 15 sec and reacquired again if still detected
within a 30 sec window. MS/MS scan range was automatically adjusted based on precursor m/z

23
and charge state. Selected ions were fragmented using a normalized collision energy set at 35%
and an isolation window of 2 m/z.
2.8 Mass spectrometry bioinformatics data processing
Raw mass spectrometric data were processed for generation of peaklists using Mascot
Distiller version 2.3.2.0. The peaklist data was searched against the A. niger protein sequence
database using Mascot version 2.3.01 followed by X!Tandem version 2007.01.01.1 on the subset
of identified proteins. Mascot and X!Tandem searches were done using a fragment ion mass
tolerance of 0.80 Da and a parent ion tolerance of 10.0 ppm. Iodoacetamide derivative of
cysteine was specified in Mascot and X!Tandem as a fixed modification. Dehydration of the N-
terminus, loss of ammonia of the N-terminus, deamidation of asparagine and glutamine,
methylation of aspartic acid, glutamic acid and the C-terminus, oxidation of methionine and
acrylamide adduct of cysteine were specified in X!Tandem as variable modifications. Oxidation
of methionine was specified in Mascot as a variable modification. Scaffold (version
Scaffold_4.1.1, Proteome Software Inc.) was used to validate MS/MS based peptide and protein
identifications. In order to ensure a false discovery rate of less than 1% at the peptide level,
peptide identifications were accepted if they could be established at greater than 90.0%
probability as specified by the Peptide Prophet algorithm (Keller et al. 2002). Protein
identifications were accepted if they could be established at greater than 95.0% probability and
contained at least 2 identified peptides. Protein probabilities were assigned by the Protein
Prophet algorithm (Nesvizhskii, 2003). Proteins that contained similar peptides and could not be
differentiated based on MS/MS analysis alone were grouped to satisfy the principles of
parsimony.
2.9 Lysis of crude nuclei enriched pellet and determination of sonication conditions
After the final wash step of the crude nuclear preparation procedure, the pellet was
resuspended in 600μL Buffer C (50mM HEPES-KOH pH7.5, 140mM NaCl, 1mM EDTA
pH8.0, 1% Triton X-100, 0.1% sodium deoxycholate, 0.1% SDS, 1mM PMSF and protease
inhibitor cocktail).

24
To determine optimal nuclei fraction sonication conditions for use in ChIP-seq,
formaldehyde-crosslinked crude nuclear extracts were prepared as described above (Section 2.3).
The lysed nuclear extracts were pooled and subjected to sonication trials on an ultrasonic
homogenizer fitted with a microtip (Biologics, Inc.) performed with increasing numbers of 10-
second cycles (3x10s, 4x10s, 5x10s, 6x10s). All sonications were performed at 20% output and
tubes were incubated on ice throughout the sonication procedure with 15s breaks between each
cycle. Following sonication, samples were reverse-crosslinked overnight by incubating in lysis
buffer (Buffer C) at 65°C and purified using the phenol/chloroform method. For average size
estimation, purified DNA was visualized by electrophoresis on a 2% agarose gel with ethidium
bromide staining.
2.10 Chromatin immunoprecipitation (ChIP)
Aliquots of 150 μL of enriched nuclei, formaldehyde crosslinked and sonicated lysate
were transferred to tubes for either DNA purification as control DNA, chromatin
immunoprecipitation with 4 μg anti-H3K4me3 antibody (Ab 8580, Abcam) or incubation with
beads only (no-antibody control). For ChIP, lysates were incubated with the antibody for 1.5 hrs
with rotation at 4°C before the addition of 30 μL of PureProteome Protein A magnetic beads
(Millipore). All samples were further incubated overnight with gentle rotation on a tube rotator at
4°C. Immunoprecipitates were washed once by addition of 1 mL Buffer C, twice using 1 mL
LiCl wash buffer (0.25M LiCl, 0.5% NP-40, 0.5% sodium deoxycholate, 1 mM EDTA, 10 mM
Tris-HCl pH 8.0) and once with 1 mL TE buffer, each performed for 5 minutes with rotation at
4°C. Immunoprecipitated DNA was eluted by adding 120 μL 1% SDS, 0.1M NaHCO3 and
incubating for 1 hour at 65°C, mixing gently every 15 minutes. The eluate was transferred to a
fresh tube and further incubated with at 65°C overnight to reverse DNA crosslinks and with 2 μL
0.5 mg/mL RNase A. Immunoprecipitates were subsequently purified using a QIAquick PCR
Purification Kit (Qiagen) according to the manufacturer’s specifications. DNA concentration was
determined for all purified samples using the PicoGreen method (Invitrogen).

25
One microgram RNase A (Invitrogen) was added to control DNA aliquots and incubated
overnight at 65°C to reverse DNA crosslinks. Control DNA was purified twice using one
volume phenol/chloroform/isoamyl alcohol, precipitated using two volumes 99% ethanol, and
resuspended in 10mM Tris buffer, pH 8.5. Input DNA was visualized with ethidium bromide
staining for average size estimation by electrophoresis on a 2% agarose gel.
2.11 Immunoblotting to determine the reactivity of the anti-H3K4me3 antibody and
sequencing of immunoprecipitated chromatin
To determine the reactivity and specificity of the commercial H3K4me3 antibody,
immunoblotting was performed on the immunoprecipitated chromatin. As negative control,
crosslinked, total sonicated chromatin not subjected to immunoprecipitation was also examined.
Briefly, proteins were separated on a 12% SDS-PAGE gel wet-transferred to a nitrocellulose
membrane, then incubated with a 5% non-fat milk PBS solution containing 0.1% Tween-20 at
room temperature with agitation for 1 hour. Anti-H3K4me3 antibody (Abcam, Ab8580) diluted
1:2000 was added to the milk solution and incubated overnight at 4°C with agitation. The
membrane was then washed 3 times for 5 minutes using the milk solution. Secondary antibody
incubation was performed for 1 hour at room temperature with horseradish-peroxidase
conjugated mouse anti-rabbit light chain specific monoclonal IgG (Jackson ImmunoResearch
Laboratories, Inc. 211-052-171). Blots were developed using the ECL Plus kit (GE Healthcare)
and imaged on a Typhoon Trio Scanner (GE Healthcare).
The libraries were prepared and sequenced at the Innovation Centre at McGill University
(Montreal, QC, Canada) according to the High Sample (HS) protocol (Illumina, Inc.) and with
the following modifications: the fragmentation step was omitted and the preparation began
instead at the end repair step of the workflow; gel purification was performed on library
molecules in the range of 250-400 bp using the Sage PippinPrep system with at 1.5% gel
cassette, and the enrichement PCR step consisted of 17 cycles rather than 10. Sequenced read
data from ChIP and control libraries were were mapped to the NRRL3 A. niger genome using the
Genomic Short-read Nucleotide Alignment Program (Wu and Nacu, 2010).

26
2.13 Identification of H3K4me3 peaks
Significant histone modification peak detection was performed using SICER (Zang et al.
2009). SICER software was downloaded from http://home.gwu.edu/~wpeng/Software.htm and
the Python compilers Numpy and Scipy were obtained for running the package. Gaps are used to
allow for read-count fluctuations, repetitive regions and unmodified nucleosomes. Gap size can
be adjusted to the nature of the chromatin modification and the length of the gap is a bp-multiple
of the window size. The following parameters were chosen to perform peak finding with SICER:
1) Window size 200 bp, gap size 200 bp (W200-G200), 2) W100-G100, 3) W40-G40, 4) W20-
G20, 5) W20-G40, 6) W20-G60, 7) W20-G80
For all trials, read redundancy threshold was set to include all reads, effective genome size was
set to 1, and FDR was set to 0.05.
Peak splitting with the peaksets generated with SICER was performed using the
PeakSplitter utility from the PeakAnalyzer program (Salmon-Divon et al. 2010; available at
http://www.ebi.ac.uk/research/bertone/software). Parameters for the peak splitting operation
were set to separation float= 0.6 and minimum height = 5.
Identification of significant peaks from sequenced and mapped ChIP-seq reads was
performed using the Control-based ChIP-seq Analysis Tool (or CCAT, Xu et al. 2010; available
at http://cmb.gis.a-star.edu.sg/ChIPSeq/paperCCAT.htm) peak finding method and three trials
were performed with the following sliding window sizes:
1) 1000 bp (as suggested by the package manual and default parameter for histone
modifications), 2) 500 bp, 3) 100bp
Peak finding with Qeseq (Micsinai et al. 2012; available at
http://sourceforge.net/projects/klugerlab/files/qeseq/) with the algorithm default parameters and a
cutoff of 0.05.

27
2.14 Peakset and differential binding analysis with the DiffBind package for R
Bioconductor
Differential H3K4me3 sites were identified using the DiffBind package for R
Bioconductor (Stark and Brown, 2011) available at
http://bioconductor.org/packages/2.13/bioc/html/DiffBind.html
Pearson correlations of peaksets were calculated and consensus binding sites for maltose
or xylose replicates were determined using the overlap function in DiffBind. Reads were counted
in the genomic intervals from consensus peaksets. Identification of differentially bound sites was
performed using the EdgeR method (Robinson et al. 2010). DiffBind plot functions were used to
draw correlation heatmaps, Venn diagrams, and MA plots.
2.17 File conversions, ChIP peak intersections, annotation and analysis of peaksets
File type conversions, gene model annotation of the resulting peaksets and in-depth
analysis for counting intersecting features for peaksets was performed using the BEDTools Suite
package (Quinlan and Hall, 2010, available at http://code.google.com/p/bedtools/). A minimum
overlap fraction of 15% of the gene model feature was imposed for performing annotation of
ChIP peaksets.
2.19 Statistical testing of differences between distributions of FPKM values
Mann-Whitney tests (Bauer, 1972; Hollander and Wolfe, 1973, 1999) were performed in
R Bioconductor using the two-sample Wilcox.test{stats} function.
2.20 Data visualization
Peaksets and raw reads were visualized in the IGV Genome Browser, downloaded from
the Broad Institute (available at http://www.broadinstitute.org/igv/).

28
Section 3: Results
3.1 Protocol development for ChIP-seq in Aspergillus niger
Methods for ChIP-seq have not been described for Aspergillus. Based on ChIP-seq
protocols established for other organisms, I have established the experimental parameters for
isolation, crosslinking, sonication, immunoprecipitation and de-crosslinking of chromatin for
ChIP-seq for A. niger as described below.
3.1.1 Enrichment of nuclear fraction for ChIP-seq analysis
I developed and validated a quick method for obtaining an enriched nuclear fraction from
A. niger mycelia for use in ChIP-seq. The protocol was adapted from that of Loros and Dunlap
(1991) for isolation of nuclei in Neurospora crassa. Briefly, 2 g of mycelial mats recovered from
A. niger cultures were subjected to repeated, short cycles of beadbeating with glass beads in a
viscous Ficoll buffer, followed by dilution in aqueous buffer and centrifugal removal of
unbroken mycelia, glass beads and debris, as described in the Methods. The resulting supernatant
containing the whole cell extract was then centrifuged at high speed to pellet nuclei.
To determine potential loss of nuclei and DNA to the cytosolic fraction prior to pelleting,
six fractions of 500 μL from the supernatant fraction were combined and DNA was extracted
using phenol/chloroform extraction and ethanol precipitation. The precipitates were pooled and
DNA was visualized on an ethidium bromide stained agarose gel. No visible band was detected
in the supernatant, and strongly stained bands were seen in undiluted, 1:10 and 1:20 diluted
fractions from the pellet (Figure 5). This suggested that DNA was enriched in the pelleted
fractions.

29
Supernatant fractions
1 2 3
Figure 5. DNA content of nuclear and cytosolic fractions. Following centrifugation of the
disrupted mycelia, the pellet and supernatant fractions were resolved on 2% agarose gel and
stained with ethidium bromide. Lanes for the pelleted fractions show the undiluted extract, 1:10
and 1:20 dilutions (right to left for three biological replicates). Lanes for the supernatant
fractions represent undiluted samples of three biological replicates.
Figure 6. Distribution of marker proteins in pelleted and supernatant fractions. Supernatant
and pelleted fractions were characterized by mass spectrometry to identify proteins and their
Pelleted fractions
1 2 3

30
relative abundance. Spectral counts for the pelleted fraction (red bars) and for the supernatant
fraction (blue bars) are shown for five protein markers specific for subcellular locations.
To further evaluate the enrichment, proteins from the supernatant and pellet fractions
were analyzed by mass spectrometry. Experimentally determined, subcellular protein markers
Total spectrum count

31
(Andreyev et al. 2010) were used for comparing LC-MS/MS spectra matched to the protein
sequences of A. niger. Figure 6 shows the relative abundance in the nuclear and supernatant
fractions of five marker proteins specific for the nucleus, plasma membrane, cytoplasm,
endoplasmic reticulum and mitochondrion. The results from mass spectrometric analysis suggest
that although some proteins from other subcellular compartments were found in the pellet, this
fraction contained a relatively high proportion of nuclear proteins. These data provide additional
evidence that the pelleting procedure was successful in enriching nuclear materials.
3.1.2 Demonstration of suitable crosslinking conditions
Optimal chromatin crosslinking needs to be determined since insufficient crosslinking
may result in loss of protein-DNA complexes and over-crosslinking will render the chromatin
insoluble, unavailable for antibody capture and /or irreversible (Das et al. 2004; Haring et al.
2007). I generated chromatin samples crosslinked for a fixed time and with increasing
formaldehyde concentrations. The samples were de-crosslinked (incubated overnight at 65°C in
elution buffer) and resolved on an agarose gel for visualization of the DNA fragments. The
starting material is over-crosslinked and irreversible if it is not recovered with the de-
crosslinking step. Similarly, chromatin is under-crosslinked if recovered without de-crosslinking.
Panel A of Figure 7 shows that at 1.0% formaldehyde, the crosslinking is irreversible and 0.75%
formaldehyde is the highest concentration where crosslinked chromatin can be reversed. Panel B
of Figure 7 shows that 0.75% formaldehyde is sufficient for crosslinking because at this
concentration, DNA can only be recovered following de-crosslinking. Therefore, crosslinking
with 0.75% formaldehyde was used for subsequent experiments.
Figure 7. Chromatin crosslinking and de-crosslinking

32
Panel A) Chromatin was crosslinked for a fixed time (8 minutes) with increasing formaldehyde
concentrations (at 0%, 0.5%, 0.75% and 1% final concentration), subjected to a de-crosslinking
step, then resolved on a 2% agarose gel stained with ethidium bromide. Panel B) Recovery of
crosslinked and de-crosslinked chromatin. Lane 1, chromatin crosslinked at 0.75%
formaldehyde; Lane 2, de-crosslinked chromatin following crosslinking at 0.75% formaldehyde;
and Lane 3, chromatin that had not been subjected to crosslinking.
3.1.3 Determination of sonication conditions for crosslinked chromatin
1 2 3
100bp
500bp
A) B)

33
To perform chromatin immunoprecipitation, it is necessary to obtain fragments of an
appropriate size for downstream library size selection and sequencing. Resulting fragments from
sonication should fall within the 200 – 600 bp range (Park, 2009). Using a microtip sonicator, I
performed a sonication trial with increasing numbers of 10-second cycles. The sonicated DNA
was resolved on an agarose gel and stained with ethidium bromide. Panel A of Figure 8 shows
that sonication at 20% power output yielded fragments in the desired size range. Although the
overall sizes of the fragments did not change significantly compared to those observed with
fewer sonication cycles, the presence of the high molecular genomic DNA band was
significantly reduced with more cycles. As a result, I selected six cycles of 10s for chromatin
fragmentation by sonication for downstream sequence library preparation (Figure 8, Panel B).
3.1.4 H3K4me3 chromatin immunoprecipitation followed by sequencing (ChIP-seq)
A chromatin immunoprecipitation protocol was adapted from those of Johnson et al.
(2007; updated protocol available at http://www.hudsonalpha.org/myers-lab/protocols/) and
Saleh et al. (2008). Reactivity and specificity of anti-H3K4me3 antibody was determined by
Western blot (Figure 9). With the crude nuclear extract, the Western blot showed a band at about
17 kDa, the expected molecular weight of the histone H3 protein and the signal increases with
increasing amount of nuclear extract loaded. These results suggest that the anti-H3K4me3
antibody reacts specifically with A. niger histone H3. I then used the antibody to react with
crosslinked chromatin. Following immunoprecipitation, the chromatin was subjected to Western
blot analysis. The results suggested that the anti-H3K4me3 antibody binds specifically when
incubated with crosslinked chromatin.
To identify H3K4me3-marked chromatin, A. niger mycelia were cultured independently
with maltose or xylose as carbon sources. Two biological replicates were performed. The
crosslinked chromatin from each of the four samples was immunoprecipitated with anti-
H3K4me3 antibody and sequenced. Control DNA not subjected to immunoprecipitation from
each of the four samples was sonicated to 200-600 bp and sequenced. Sequencing was performed
at the Innovation Centre at McGill University (Montreal, QC, Canada) on an Illumina Hi-Seq

34
Figure 8. Determination of sonication conditions. Chromatin fragmentation size was
determined by performing a series of sonication trials with increasing number of 10s cycles at
20% power output and visualizing the resulting DNA on an ethidium bromide stained agarose
gel (Panel A). Sonicated chromatin from maltose and xylose growth replicates used for ChIP-seq
in the current experiment is shown in Panel B.
Maltose
1 2
Xylose
1 2 DNA ladder
100bp
500bp
B)
100bp
500bp
A)

35
Figure 9. H3K4me3 antibody specificity. An immunoblot was performed using increasing
amounts of crude nuclear lysate (starting material) and proteins eluted from chromatin
immunoprecipitation using the antibody against H3K4me3 (Abcam, Ab8580). The dark band is
observed at 17 kDa, the expected molecular weight for H3K4me3.

36
Sequencing System. Sequenced reads were then aligned to the genome using the Genomic Short-
read Nucleotide Alignment Program (Wu and Nacu, 2010).
3.2 H3K4me3 ChIP-seq data processing
3.2.1 H3K4me3 peak finding
To locate regions showing significant H3K4me3 enrichment (or “peaks”), I tested a
number of peak finding algorithms. Peak finding was first attempted using the CCAT algorithm
(Control based ChIP-seq Analysis Tool, Xu et al. 2010; available at http://cmb.gis.a-
star.edu.sg/ChIPSeq/paperCCAT.htm), reported as a reliable tool for identification of broad
histone modification peaks (Kidder et al. 2011). I also used the Qeseq algorithm (Asp et al. 2011;
available at http://sourceforge.net/projects/klugerlab/files/qeseq/). I examined results from
CCAT and Qeseq by visualizing the peaks in the genome browser. Both CCAT and Qeseq failed
to reliably identify peak regions that visually corresponded with the raw reads and instead
identified intervals that bore no resemblance to the enriched mapped read regions (data not
shown).
Peak finding was then attempted using the SICER (spatial clustering approach for
identification of ChIP-enriched regions) peak finding algorithm (Zang et al. 2009; available at
http://home.gwu.edu/~wpeng/Software.htm). Visual examination in the genome browser
confirmed that SICER reliably identified peaks in locations enriched for H3K4me3 seen in the
raw read mapping to the genome. The SICER method takes into account the tendency of histone
modification ChIP-seq peaks to form “clusters”. First, the genome is partitioned into windows of
read counts and identifies peaks as clusters of windows that are unlikely to appear by chance.
Once candidate regions have been identified, SICER uses a control DNA library (generated from
total sonicated chromatin not subjected to immunoprecipitation) to determine the significance of
enrichment on each candidate. SICER scales control read count to account for size differences in
the control and ChIP libraries. Visualization of the mapped reads in the genome browser
revealed that some regions mapped to the genome from control DNA also formed peaks. These
overrepresented regions were eliminated from the final peaksets after performing SICER
analysis (Figure 10).

37
Figure 10. Control sonicated DNA as a control for H3K4me3 ChIP-seq.
The effect of normalization of H3K4me3 ChIP-seq reads with control ‘input’ DNA (total
sonicated chromatin not subjected to immunopreciptation) on the final peakset as determined by
SICER (SICER peaks) on the final peakset as determined by using window size = 20bp and gap
size = 60bp. Panels A) and B) are examples representing two different regions of the genome.
Predicted gene models are displayed in the lower track.
SICER
peaks
H3K4me3
ChIP
reads
Control
‘input’
reads
Gene models
SICER
peaks
H3K4me3
ChIP
reads
Control
‘input’
reads
Gene models NRRL3_00041 NRRL3_00042
SICER
peaks
H3K4me3
ChIP
reads
Control
‘input’
reads
Gene models
B)
NRRL3_08401
A)

38
A key feature of SICER is the adjustable window and gap feature to account for read
count fluctuations within an island and reliably separate distinct peaks. As the estimated size of a
single nucleosome and its linker region is ~200bp, the authors recommended using a window
size and gap size = 200 bp (W200-G200) for histone modification peak detection. As such, the
first SICER peak finding trial was performed using these parameters. Visual examination in the
genome browser for the W200-G200 data set in the genome browser revealed that some
H3K4me3-enriched regions were missing in the final peakset. To determine whether this was
occurring as a result of the choice in peak finding parameters, I attempted to use progressively
smaller window and gap size (W100-G100, W40-40, W20-G20) and observed an increase in the
numbers of peaks. I generated additional peaksets using the 20 bp windows with increasing gap
sizes (W20-G40, W20-G60, W20-G80).
3.2.2 Analysis of SICER peakset correlation between replicates
To determine the consistency in peak finding between biological replicates for the
various SICER peaksets, Pearson correlation scores based on peak occupancy were calculated
using the DiffBind package for R Bioconductor (Stark and Brown, 2011). As shown in the
heatmap in Figure 11, peaksets for the biological replicates form a cluster by growth condition.
Clustering by growth condition was also seen for all other peaksets using the increasing window
and gap sizes (Table 3). Although correlation values were similar for all SICER trials with
increasing window and gap sizes, the W20-G60 and W20-G80 peaksets yielded the highest
correlation between the biological replicates cultured on maltose or xylose.
3.2.3 SICER peakset analysis
When surveying each of the peaksets in the genome browser, I observed a number of
issues, which could potentially affect the quality of the peaksets in downstream analyses. To
address these issues, I further analyzed the peaksets to determine the following: 1) number of

39
Figure 11. Correlation heatmap of peaksets. Clustering of peaksets derived from biological
replicates cultured on maltose (samples 1 and 2) and cultured on xylose (samples 3 and 4) as
determined by Pearson correlation. Shown here is the result for the W20-G60 peak finding trial.

40
Table 3. Pearson correlation values of SICER peaksets from sample replicates. Window size
(in base pairs) is denoted by ‘W’ and gap size by ‘G’. Each table shows the correlation values
between biological replicates (denoted by ‘1’ or ‘2’) from the various SICER peak finding trials.
W20-G20
xylose 1 xylose 2 maltose 1 maltose 2
xylose 1 1.00 0.82 0.66 0.69
xylose 2 0.82 1.00 0.70 0.67
maltose 1 0.667 0.70 1.00 0.83
maltose 2 0.69 0.67 0.83 1.00
W20-G40
xylose 1 xylose 2 maltose 1 maltose 2
xylose 1 1.00 0.84 0.67 0.70
xylose 2 0.84 1.00 0.71 0.69
maltose 1 0.70 0.71 1.00 0.85
maltose 2 0.70 0.69 0.85 1.00
W20-G60
xylose 1 xylose 2 maltose 1 maltose 2
xylose 1 1.00 0.86 0.70 0.66
xylose 2 0.86 1.00 0.68 0.73
maltose 1 0.70 0.68 1.00 0.86
maltose 2 0.66 0.73 0.86 1.00

41
W20-G80
xylose 1 xylose 2 maltose 1 maltose 2
xylose 1 1 0.86 0.68 0.72
xylose 2 0.86 1 0.74 0.71
maltose 1 0.68 0.74 1 0.86
maltose 2 0.72 0.71 0.86 1
W40-G40
xylose 1 xylose 2 maltose 1 maltose 2
xylose 1 1 0.84 0.67 0.71
xylose 2 0.84 1 0.72 0.70
maltose 1 0.67 0.72 1 0.83
maltose 2 0.71 0.70 0.83 1
W100-G100
xylose 1 xylose 2 maltose 1 maltose 2
xylose 1 1 0.85 0.67 0.71
xylose 2 0.85 1 0.75 0.70
maltose 1 0.67 0.75 1 0.84
maltose 2 0.71 0.70 0.84 1
W200-G200
xylose 1 xylose 2 maltose 1 maltose 2
xylose 1 1 0.86 0.68 0.73
xylose 2 0.86 1 0.75 0.71
maltose 1 0.68 0.75 1 0.84
maltose 2 0.73 0.71 0.84 1

42
genes intersecting peaks; 2) number of individual peaks overlapping more than one gene and
3) number of genes associated with more than one peak. Since decreasing the window and gap
size increased the overall number of peaks, it was important to determine whether more peaks
also corresponded to more genes containing H3K4me3. When using smaller window and gap
sizes, the overall number of H3K4me3 modified genes increased (Figure 12, Panel A). Among
peaksets generated with 20 bp windows and increasing gap sizes, the number of peaks
intersecting with gene models was similar, although a notable drop was seen when gap size was
80 bp (Figure 12, Panel B). Regions that were omitted with larger window sizes were usually
minor peaks and/or located next to another major peak (Figure 13).
I also evaluated the peaksets to determine the number of peaks that overlapped multiple
gene models. Visual assessment of the peaks in the genome browser revealed that some peaks
were not appropriately split between distinct gene models. I used the “count” feature from the
BEDTools Suite Package (Quinlan and Hall, 2010, available at
http://code.google.com/p/bedtools/) to determine the number of gene models overlapping single
peak regions. The number of peaks that overlapped more than one gene model was significantly
higher when window and gap sizes were larger (data not shown). However, even the smallest
window and gap size peak finding parameters (W20-G20) were not able to perfectly split all
ChIP enriched regions so that single peaks were coupled to single gene models. To resolve this
issue, I employed PeakSplitter (Salmon-Divon et al. 2010;
http://www.ebi.ac.uk/research/bertone/software), a utility of the PeakAnalyzer program. This
tool performs a subdivision of aggregate peak regions (areas containing more than one peak
“summit”) into discrete subpeaks. The splitting operation is performed using a user-defined
parameter, which can be adjusted for sequencing read depth. I examined the results from the
application of PeakSplitter in the genome browser. I observed that PeakSplitter introduced a
20bp gap in regions where read depth decreased between gene models but were not split by the
initial SICER peak finding. Finally, I re-evaluated the number of peaks overlapping more than
one gene following the peak splitting operation. From this analysis, I determined that by using
the PeakSplitter tool, I was able to reduce the number of ChIP regions overlapping more than
one gene model from 673 regions to 57.

43
Figure 12. Peak finding parameters and the number of H3K4me3 modified genes detected.
The number of peaks with intersecting gene models identified for maltose (red) and xylose (blue)
peaksets as a function of window size (Panel A) and gap size (Panel B).
Figure 12. The effect of
A)
B)

44
Figure 13. The effect of smaller window and gap sizes on peak detection. Panels A and B
show two regions of the genome. Numbers 1 and 2 represent results from two biological samples
cultured on xylose. The top two tracks show the mapping of raw reads; the third and fourth
tracks, SICER peaks called with window size of 20 bp and gap size of 60 bp (W20-G60-1 and -
2); the fifth and sixth tracks, SICER peaks called with window size and gap size of 200 bp
(W200-G200-1 and -2); and the bottom track shows the positions of the gene models in the two
regions.
Raw reads 1
Raw reads 2
W20-G60-1
W20-G60-2
W200-G200-1
W200-G200-2
Gene models
A) B)

45
Finally, for the peaksets generated with 20 bp windows, I determined the number of
fragmented or “split” peaks, where more than one peak was reported for a single gene model.
These regions occasionally arose as a result of read fluctuations within a single peak. The
number of split peaks was determined by counting the number of peak features overlapping each
predicted gene model (here again with the BEDTools Suite package). The results from this
analysis showed that the number of split peaks was largest when gap size was 20 bp, and the
fewest were seen when gap size was 60 bp and 80 bp (Figure 14).
The results from the various analyses showed that, among the various peak finding trials,
W20-G60 was the best performer. These parameters yielded a resulting peakset with few peaks
overlapping multiple gene models, a minimal number of split peak regions, while maintaining
maximum sensitivity in detecting H3K4me3 modified genes. As a result, the data set containing
enriched intervals determined using W20-G60 was used for further analysis.

46
Figure 14. Effects of gap size on fragmented peak regions. The number of split or fragmented
peak regions as a function of gap size.

47
3.3 H3K4me3 patterns and distribution in the Aspergillus niger genome
3.3.1 A majority of actively transcribed genes contain H3K4me3
To examine the relationship between gene expression and presence of H3K4me3, I
obtained RNA-seq data generated using the same growth conditions as the ChIP-seq experiment
(data provided by Vanessa Blandford, unpublished). I plotted the log2 FPKM (fragments per
kilobase of exon per million reads mapped) values from maltose growth against the log2 FPKM
values of xylose growth and highlighted gene models containing an H3K4me3 peak (Figure 15,
Panels A, B, C). As shown in the scatter plots, the presence of H3K4me3 correlates positively
with active gene expression. Nearly all genes that have H3K4me3 peaks have FPKM values > 4
(Figure 15, Panel C). However, 1971 genes with FPKM > 4 were not marked with an H3K4me3
peak (Figure 15, Panel B), which suggests that the H3K4me3 chromatin modification is not
necessarily required for gene expression.
While there is a strong trend for highly expressed genes to be epigenetically marked by
H3K4me3 (median FPKM values for genes containing H3K4me3 are 40.8 and 41.4 for growth
on xylose and maltose, respectively, compared with 1.1 and 1.3 for genes without H3K4me3),
the correlation is not perfect. I therefore examined whether there is a correlation between gene
function and H3K4me3 markers. Functional annotation of the predicted genes was described by
Pel et al. (Pel et al. 2007). I compared genes with and without H3K4me3 in the following
functional classes: genes encoding glycosyl hydrolases, components of the secretory pathway,
enzymes of the central metabolism, fungal transcription factors and secondary metabolite genes.
The genes from these functional classes are highlighted in the gene expression scatter plots in
panels A-J of Figure 16. Median FPKM, mean FPKM, standard deviation, maximum and
minimum FPKM values for these gene classes are listed in Table 4. In all cases, the correlation
between gene activity and presence of the H3K4me3 modification is similar to that of the entire
gene set. Due to the high variance seen in each of the functional classes, a Mann-Whitney rank
sum test (suitable for non-normal distributions: Bauer, 1972; Hollander and Wolfe, 1973, 1999)
was performed to determine the significance of differences between the FPKM distributions. For
all protein function categtories, p values were <.0001, which indicates that the difference in
distributions of the FPKM values between genes with and without H3K4me3 are significant.
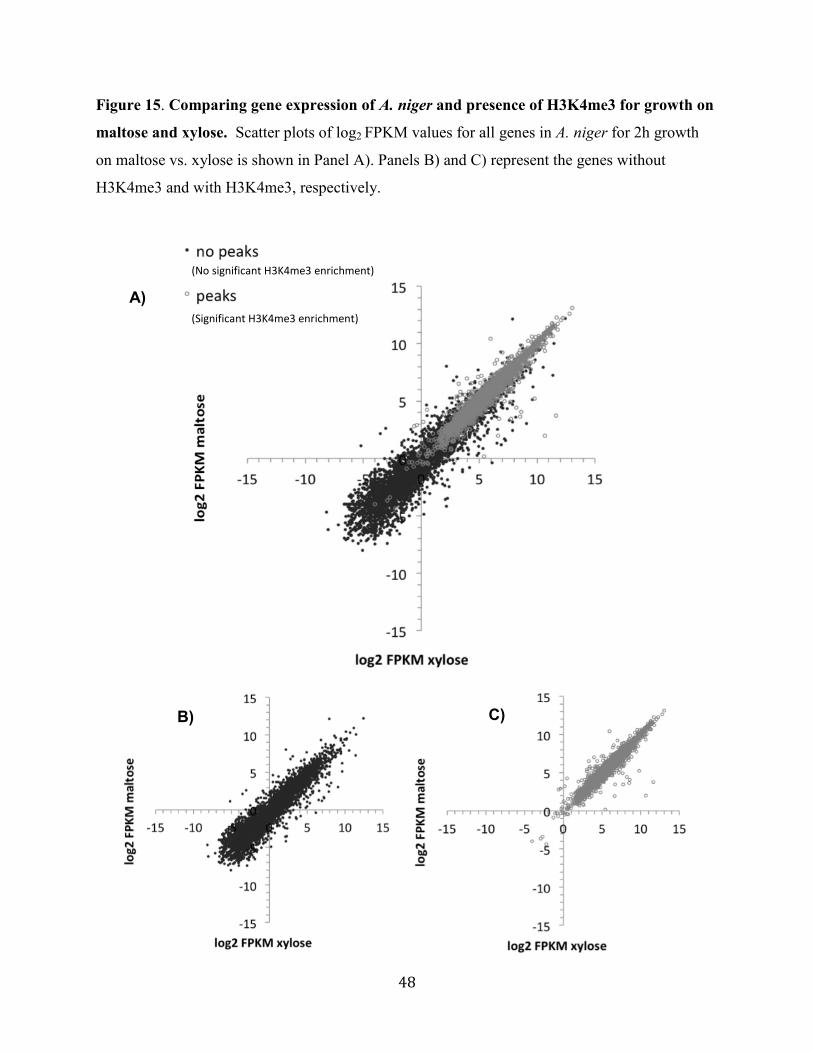
48
Figure 15. Comparing gene expression of A. niger and presence of H3K4me3 for growth on
maltose and xylose. Scatter plots of log2 FPKM values for all genes in A. niger for 2h growth
on maltose vs. xylose is shown in Panel A). Panels B) and C) represent the genes without
H3K4me3 and with H3K4me3, respectively.
A)
B) C)
(No significant H3K4me3 enrichment)
(Significant H3K4me3 enrichment)

49
Figure 16. Comparing expression and presence of H3K4me3 across functional categories.
Genes derived from various functional gene subsets without H3K4me3 are highlighted in orange.
The panels on the left show genes without H3K4me3 (A,C,E,G,I) and those on the right show the
genes with H3K4me3 (B,D,F,H,J).
Glycosyl hydrolase (GH) genes
Genes without H3K4me3 Genes with H3K4me3
A) B)

50
Secretory pathway genes
Genes without H3K4me3 Genes with H3K4me3
Central metabolism genes
Genes without H3K4me3 Genes with H3K4me3
C) D)
E)
F)

51
Fungal transcription factors
Genes without H3K4me3 Genes with H3K4me3
Secondary metabolism genes
Genes without H3K4me3 Genes with H3K4me3
G) H)
J) I)

52
Table 4. Genes marked or unmarked by H3K4me3 as categorized by protein function.
For each protein function category (glycosyl hydrolases, central metabolism, secretory pathway,
secondary metabolism, fungal transcription factors) the following are reported: median FPKM,
mean FPKM, standard deviation (SD), minimum FPKM and maximum FPKM. The results from
a Mann-Whitney U test (to determine whether the distributions of FPKM values differed
between genes with H3K4me3 and genes without H3K4me3) are also reported. U value: product
of the sample sizes for the two samples; p value: the probability that the distributions between
the two groups, genes with H3K4me3 and genes without H3K4me3, are similar.
Genes with H3K4me3 Genes without H3K4me3
Protein
Function
No.
genes
Median
FPKM
Mean
FPKM SD
Min.
FPKM
Max.
FPKM
No.
genes
Median
FPKM
Mean
FPKM SD
Min.
FPKM
Max.
FPKM
Glycosyl
hydrolases 38 62.7 258 409 4.00 1620 207 1.38 21.3 222 0 4470
Central
metabolism 37 131 202 217 6.92 1019 33 4.63 46.5 138 0 917
Secretory
pathway 272 56.7 97.2 134 5.37 1435 44 3.93 19.4 54.3 0 397
Secondary
metabolism 19 48.6 101 131 1.04 616 87 0.32 8.38 43.9 0 800
Fungal TF 20 17.7 29.2 34.5 2.32 188 309 3.87 5.71 5.22 0.05 23.3
All genes 5058 41.1 109 314 0 8847 6788 1.21 12.8 98.4 0 5475
Mann-Whitney U two sample rank-sum test outcomes
Glycosyl hydrolases U = 23454; p <.0001 (one-tailed), p <.0001 (two-tailed)
Central metabolism U = 454; p <.0001 (one-tailed), p <.0001 (two-tailed)
Secretory pathway U = 4105; p <.0001 (one-tailed), p <.0001 (two-tailed)
Secondary metabolism U = 22058; p <.0001 (one-tailed), p <.0001 (two-tailed)
Fungal transcription factors U = 5540; p <.0001 (one-tailed), p <.0001 (two-tailed)
All genes U = 127335486; p <.0001 (one-tailed), p <.0001 (two-tailed)

53
I also examined the distribution of H3K4me3 in genes expected to be constitutively
expressed. With one exception, all aminoacyl tRNA synthetase genes contained H3K4me3
peaks (Figure 17, Panel A). Similarly, all but one of the ribosomal protein genes were marked
with H3K4me3 (Figure 17, Panel B). The mitochondrial ribosomal protein genes, transcribed at
considerably lower levels than their cytoplasmic counterparts, are all marked by H3K4me3
(Figure 17, Panel C).
The integrated transcriptome and ChIP-seq data presented here demonstrate that although
the majority of actively transcribed genes contained H3K4me3, the presence of this histone
modification is not required for transcription of all A. niger genes.
3.3.2 Differential H3K4me3 binding analysis
To identify sites with significantly different levels of H3K4me3 binding, I performed
an analysis using the DiffBind package for R Bioconductor (Stark and Brown, 2011). The
package determines differential read counts in bound genomic intervals using a statistical model
and builds on R graphics routines to generate plots and diagrams to support the binding analysis.
DiffBind works with previously defined peaksets and then calculates a binding matrix based on
scores generated by counting reads within the peaksets. Differentially bound sites are identified
by counting the reads in overlapping intervals for each unique sample group to generate a
normalized read count for each site, then re-clusters the samples using affinity rather than
occupancy data. Using the SICER peaksets from the four samples (two from xylose growth and
two from maltose growth) as an input, DiffBind identified 34 sites (0.7% of the total number of
ChIP enriched sites) as differentially bound by H3K4me3 when comparing growth on maltose or
xylose. The MA plot in Figure 18 (a representation of differences in log H3K4me3 read counts
on maltose and xylose growth as a function of average log read concentration) shows sites with
differential H3K4me3 binding and highlights those that also have a false discovery rate of <0.05.
A list of these sites with their respective fold differences and associated gene models are listed in
Table 5. Five of the sites identified as differentially bound did not intersect with a gene model.
The sites were classified into categories based on the type of differential binding exhibited:
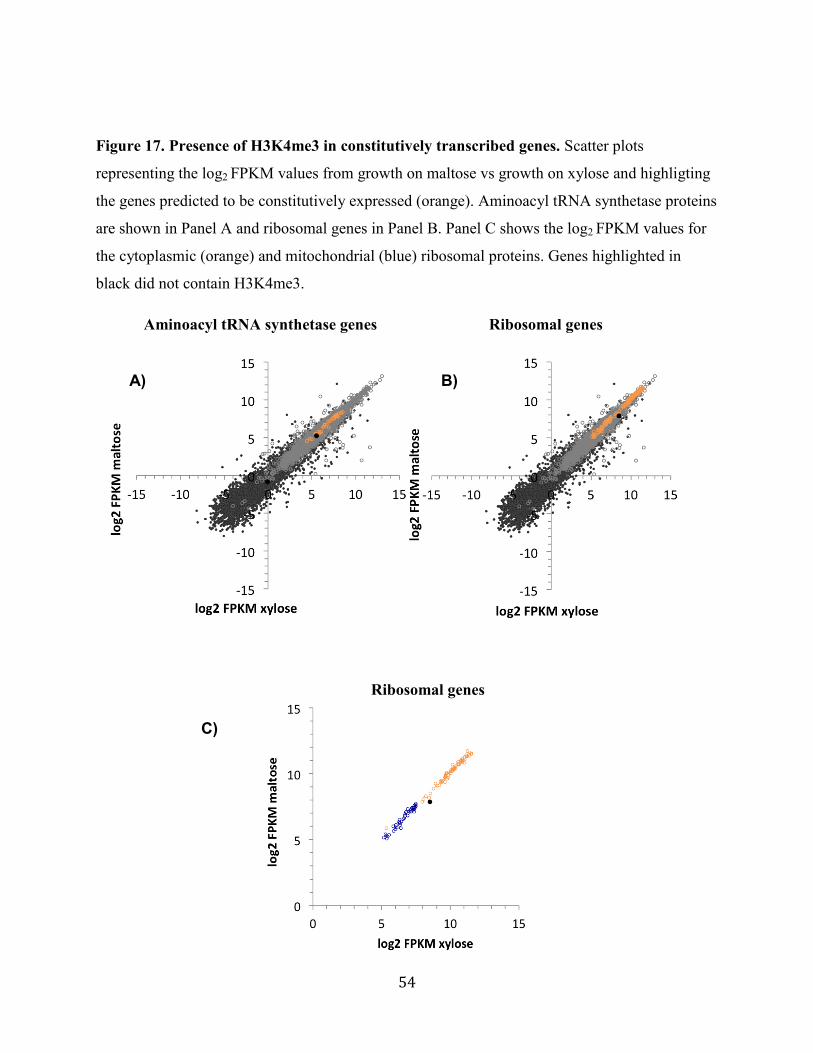
54
Figure 17. Presence of H3K4me3 in constitutively transcribed genes. Scatter plots
representing the log2 FPKM values from growth on maltose vs growth on xylose and highligting
the genes predicted to be constitutively expressed (orange). Aminoacyl tRNA synthetase proteins
are shown in Panel A and ribosomal genes in Panel B. Panel C shows the log2 FPKM values for
the cytoplasmic (orange) and mitochondrial (blue) ribosomal proteins. Genes highlighted in
black did not contain H3K4me3.
Aminoacyl tRNA synthetase genes Ribosomal genes
Ribosomal genes
A) B)
C)

55
H3K4me3 enrichment occurring uniquely during growth on one of the carbon sources (“peaks
exclusively detected in growth on xylose”, “peaks exclusively in growth on maltose”) or
significantly higher H3K4me3 binding (read counts) during growth on one of the carbon sources
(“higher counts in growth on maltose”, “higher counts in growth on xylose”).
I then compared the results from the differential binding analysis with a peak
occupancy analysis. The Venn diagram in Figure 19 shows the number of sites that were
uniquely occupied (as determined by the peak caller) by H3K4me3 for growth on maltose and
growth on xylose. In total, 36 sites uniquely occupied sites on maltose growth and 124 sites on
xylose growth. By using the DiffBind affinity analysis, associated with significance statistics,
only 5 sites were determined as unique to maltose growth and 12 sites to xylose growth. Finally,
the DiffBind analysis returned 17 sites that display significantly different binding affinities
(Table 5). These results indicated that the binding affinity analysis is indispensable for the
identification significantly differentially bound sites.
3.3.3 Comparison of differential H3K4me3 binding and levels of transcript accumulation
The next logical analysis is to compare the differential H3K4me3 binding results with the
differentially expressed genes from the maltose and xylose growth. The differential gene
expression analysis was provided by Vanessa Blandford (data unpublished) and was generated
using the DESeq algorithm (Anders and Huber, 2010). The comparison of the two data sets
revealed that the majority of genes determined as differentially expressed (188/233) do not
contain an H3K4me3 peak, highlighted in the scatter plot shown in Panel A of Figure 20. Of the
45 genes that contain a ChIP peak (Figure 20, Panel B), only 11 genes (listed in Table 6) have
significantly differential levels of H3K4me3. For these 11 genes, higher levels of transcription
are associated with increased H3K4me3. Similarly, genes that have lower expression levels also
have lower levels of H3K4me3. The GH31 alpha-glucosidase gene (NRRL3_07700) was the
single exception to this trend: a lower transcript level is accompanied by an increase in
H3K4me3 at this gene locus. These results demonstrated that genes differentially transcribed on
maltose and xylose growth correlate weakly with the presence of H3K4me3 or with respective
increases and decreases in H3K4me3 modification.

56
Figure 18. Visual representation of significantly differentially bound sites.
An MA plot was generated using the DiffBind package. The points on the plot represent
individual sites that exhibited fold changes in H3K4me3 ChIP-seq read counts between maltose
and xylose growth conditions. Sites determined as significantly differentially bound by
H3K4me3 (highlighted in red) are those that have a log fold change of at least 2 and an FDR rate
of <0.05
.

57
Table 5. Differentially bound sites identified in DiffBind. Significantly differential H3K4me3
ChIP regions and associated gene models, as determined by the DiffBind analysis. Genome
coordinates are provided for regions where no gene model is predicted.
Gene model Mean log2 read depth - maltose
Mean log2 read depth - xylose
Predicted protein
Peaks exclusively detected in growth on xylose
NRRL3_07563 -0.086 14.536 unknown
NRRL3_09251 -0.086 13.718 Bifunctional protein gal10
NRRL3_04471 -0.086 13.133 D-xylulose kinase A
NRRL3_01952 -0.086 12.673 NAD(P)H-dependent D-xylose reductase xyl1
NRRL3_02450 -0.086 12.009 Uncharacterized protein YxeQ
NRRL3_07698 -0.086 11.773 Transcriptional activator of proteases prtT
NRRL3_05970 -0.086 11.470 Galactose-1-phosphate uridylyltransferase
NRRL3_02451 -0.086 11.166 beta-xylosidase GH3
NRRL3_04473 -0.086 11.085 Transaldolase
NRRL3_02937 -0.086 10.328 unknown
NRRL3_07700 -0.086 10.285 alpha-glucosidase GH31
NRRL3_09050 -0.086 8.594 Lactose regulatory protein LAC9
Peaks exclusively detected in growth on maltose
NRRL3_01770 10.653 0.087 unknown
NRRL3_09399 10.285 0.087 Vacuolar calcium ion transporter
NRRL3_05625 9.722 0.087 Linoleate 10R-lipoxygenase
NO MODEL 7.267 0.087 chr_5_2:182420-182559
NO MODEL 6.157 0.087 chr_7_2:237680-237759
Higher counts in growth on xylose
NRRL3_09204 13.479 15.233 D-xylulose reductase A
NRRL3_10884 10.754 13.281 Uncharacterized oxidoreductase
MexAM1_META1p0182 NRRL3_02934 11.292 12.860 unknown
NRRL3_01478 9.739 12.014 Putative NADP-dependent oxidoreductase YfmJ
NRRL3_03187 6.831 11.468 Initiation-specific alpha-1,6-mannosyltransferase
NRRL3_06477 5.227 8.349 UPF0187 protein sll1024
Higher counts in growth on maltose
NRRL3_07785 11.413 9.121 unknown
NRRL3_04106 10.952 7.265 unknown
NO MODEL 10.759 8.753 chr_3_2:368420-368939
NRRL3_02744 10.371 7.725 unknown
NO MODEL 10.109 7.580 chr_2_2:1645480-1646119
NRRL3_01410 10.083 2.526 Putative succinate-semialdehyde dehydrogenase C
[NADP(+)] NRRL3_00397 9.668 6.553 60 kDa lysophospholipase
NRRL3_03297 9.535 5.804 Siderophore iron transporter mirB
NRRL3_04956 9.500 6.295 Maleylacetate reductase
NRRL3_02279 9.280 6.729 unknown
NO MODEL 7.953 4.799 chr_4_1:1132420-1132519

58
Figure 19. Maltose growth and xylose growth peak occupancy analysis
The number of H3K4me3-bound sites exclusive to maltose and xylose, based on peak occupancy
data as determined by SICER peak calling.

59
Figure 20. Comparison of differentially expressed genes and H3K4me3 modification. A
scatter plot of log2 FPKM values for all genes in A. niger for growth on maltose vs. xylose. The
genes determined to be differentially expressed by the DESeq method are highlighted in orange.
Genes without H3K4me3 Genes with H3K4me3
A) B)

60
Table 6. Differentially transcribed genes with differential H3K4me3. Genes that display
positive correlation in the differential RNA-seq and ChIP-seq analyses for growth on maltose
and growth on xylose.
Gene model Xylose FPKM
Maltose FPKM
Xylose log2 H3K4me3 mapped ChIP reads
Maltose log2 H3K4me3 mapped ChIP reads Predicted protein
Peaks exclusively detected in growth on xylose
NRRL3_09251 373.00 12.64 13.72 -0.086 Bifunctional protein gal10
NRRL3_04471 386.73 16.66 13.13 -0.086 D-xylulose kinase A
NRRL3_01952 3153.43 13.39 12.67 -0.086 NAD(P)H-dependent D-xylose reductase xyl1
NRRL3_02450 99.45 3.89 12.01 -0.086 Uncharacterized protein YxeQ
NRRL3_05970 221.65 56.86 11.47 -0.086 Galactose-1-phosphate uridylyltransferase
NRRL3_02451 1620.04 4.00 11.17 -0.086 beta-xylosidase GH3
NRRL3_04473 42.40 1.13 11.09 -0.086 Transaldolase
NRRL3_07700 62.65 1408.08 10.29 -0.086 alpha-glucosidase GH31
Peaks exclusively detected in growth on maltose
NRRL3_05625 30.49 139.67 0.087 9.722 Linoleate 10R-lipoxygenase
Higher counts in growth on xylose
NRRL3_09204 880.46 37.54 15.23 13.479 D-xylulose reductase A
NRRL3_10884 105.16 10.98 13.28 10.754 Uncharacterized oxidoreductase MexAM1

61
3.3.4 Genes with and without H3K4me3 are not randomly distributed along the
chromosome
The eight A. niger chromosomes and the distribution of gene models with and without
H3K4me3 along their lengths are plotted in Figure 21. In general, H3K4me3 distribution is not
even throughout the length of the chromosome. At the centromere regions, H3K4me3 peaks
were completely missing. H3K4me3 distribution abruptly ends on either side of this region,
which also coincides with the last coding gene model predicted. In addition, H3K4me3 is not
evenly distributed along the chromosome arms. This is particularly noticeable at the gene-coding
regions near the centromeres and telomeres. A magnified view of the centromeric and telomeric
regions of chromosomes 4 and 6 is shown in Figure 22 to illustrate the non-random distribution
of H3K4me3 peaks. Table 7 summarizes the number of gene models in the 100-kb regions
adjacent to the telomeres and centromeres associated with H3K4me3 peaks. At the regions near
the telomeres, H3K4me3 is almost completely absent. The opposite is seen at the
pericentromeric regions, where peaks appear at nearly every gene model. These observations
suggest a preferential localization of H3K4me3 along the chromosome length.

62
Figure 21. Chromosomal distribution of H3K4me3.
Genes with H3K4me3 peaks (red) and without H3K4me3 (blue) were mapped to the eight A.
niger chromosomes. The figure also shows a map of genes that are differentially expressed on
maltose growth and xylose growth: black triangles represent the genes that were marked by
H3K4me3 peaks and black circles represent the genes that did not contain H3K4me3.

63
chr1 chr2 chr3 chr4 chr5 chr6 chr7 chr8 Length
(Mb)

64
Figure 22. Genes with and without H3K4me3 in regions near the centromeres and
telomeres. Gene models with H3K4me3 (red) and without H3K4me3 (blue) are represented in
the boxed regions displaying the 100 kb closest to the centromeres and telomeres.
Chromosome 4
Centromeres:
Telomeres:
Chromosome 6
Centromeres:
Telomeres:

65
Table 7. H3K4me3 distribution at regions proximal to the centromeres and telomeres.
Summarized here is the number of genes with H3K4me3 peaks in the 100 kb intervals closest to
centromere and telomere regions of each of the eight A. niger chromosomes.
Genes with
H3K4me3 at
centromeres
% of genes
with
H3K4me3
peaks
Genes with
H3K4me3 at
telomeres
% of genes
with
H3K4me3
peaks
chromosome 1 59/71 83.1 10/74 13.5
chromosome 2 44/58 75.9 1/77 1.30
chromosome 3 58/72 80.6 5/71 7.04
chromosome 4 66/77 85.7 1/73 1.37
chromosome 5 55/71 77.5 5/81 6.17
chromosome 6 54/72 75.0 2/70 2.86
chromosome 7 55/64 85.9 3/74 4.05
chromosome 8 57/81 70.4 1/72 1.39

66
3.3.5 H3K4me3 is associated with potential non-coding RNA
The peak finding analysis returned 60 H3K4me3-enriched ChIP sites that did not
associate with a predicted gene model. I investigated the possible significance of these H3K4me3
peaks. In particular, I examined whether transcription may be occurring at these regions in the
genome, a phenomenon that has been reported in yeast (van Dijk et al. 2011). I observed most of
the ChIP peaks not associated with gene models are present at regions where there is transcript
coverage, an example of which is shown in Figure 23. Five of these ChIP peaks were determined
as differentially bound by H3K4me3 on maltose and xylose (shown in Table 5). A protein-
coding gene model could not be predicted in the genomic sequence of any of these regions.
Therefore, the transcription seen in these regions may be generating non-coding RNA species
and their genomic loci contain the H3K4me3 chromatin modification.

67
Figure 23. H3K4me3 marks regions of non-coding transcripts
The H3K4me3 peak shown in the upper track (in green) was mapped to a genomic interval from
chromosome 7 not predicted to contain a protein- or rRNA-coding gene. The lower track shows
mapped RNA reads (red), generated by RNA-sequencing.
H3K4me3 ChIP
Mapped RNA-seq reads

68
Table 8. Genome coordinates for ChIP-enriched regions not intersecting with a known
gene model.
Start End
chr_1_1 926740 926919
chr_1_1 1223000 1224279
chr_1_1 1388040 1388279
chr_1_1 1596500 1597179
chr_1_2 1333260 1333419
chr_1_2 1339860 1340819
chr_2_1 263280 263759
chr_2_2 344720 345739
chr_2_2 1068560 1069259
chr_2_2 1361280 1362759
chr_2_2 1362960 1363079
chr_2_2 1401440 1401579
chr_2_2 1445640 1446159
chr_2_2 1645480 1646119
chr_2_2 2027360 2027759
chr_2_2 2941980 2942899
chr_2_2 3073640 3073999
chr_2_2 3266360 3266539
chr_3_1 230940 231699
chr_3_1 595900 597059
chr_3_1 1323700 1324459
chr_3_1 1324680 1325039
chr_3_1 1921080 1921799
chr_3_2 348360 349239
chr_3_2 368420 368939
chr_3_2 1689820 1691079
chr_3_2 1875560 1877419
chr_4_1 1132420 1132519
chr_4_1 1520140 1520319
chr_4_1 2282620 2282939
chr_4_2 239480 240799
chr_4_2 318480 319159
chr_4_2 1561780 1562019
chr_4_2 2550260 2551219
chr_4_2 3649080 3649279
chr_5_1 815380 815659
chr_5_1 925180 925719
chr_5_2 41020 41639
chr_5_2 182420 182559

69
chr_5_2 1044200 1044479
chr_5_2 1083100 1083519
chr_5_2 1404020 1404279
chr_5_2 1750740 1752279
chr_5_2 1885480 1886859
chr_5_2 2382060 2382899
chr_6_1 6560 6739
chr_6_1 1031260 1031879
chr_6_1 2433540 2433859
chr_7_1 745140 745799
chr_7_1 879400 880099
chr_7_2 237680 237759
chr_7_2 1501500 1501919
chr_7_2 1824800 1825119
chr_7_2 2404700 2405499
chr_8_1 423600 423959
chr_8_1 996880 997779
chr_8_2 419460 420599
chr_8_2 718020 718199
chr_8_2 1099480 1100379
chr_8_2 1584960 1586359

70
Section 4: Discussion
4.1 Development of a method for enrichment of nuclei in Aspergillus niger
I developed a method to obtain a nuclei-enriched cellular extract of A. niger for use in
downstream chromatin immunoprecipitation experiments. The method was adapted from others
previously described for use in Neurospora crassa with two modifications: 1) volumes in the
protocol were scaled down for use with the smaller 2 g mycelial mats (the N. crassa protocol was
for use with 7g of mycelia) and 2) centrifugation with the sucrose gradients was omitted to
decrease the number of steps required to minimize loss. I validated the nuclei enrichment by
determining the DNA content of the fractions generated and by mass spectrometry to detect
marker proteins of various cellular compartments. The cellular fractionation procedure described
here yields a pellet containing a high concentration of DNA. In addition, mass spectrometric
analysis revealed a relatively high level of marker proteins specific for the nuclear compartment
in the enriched extract. These included proteins located in the nuclear envelope (nucleoporins),
soluble nuclear proteins (topoisomerases) and chromatin bound proteins (histones), suggesting
that whole, intact nuclei were pelleted. The separation method was crude, as the nuclei-enriched
fraction also contained some proteins from the mitochondrion, endoplasmic reticulum and
cytoplasm. However, other previously described procedures for organelle fractionation, even
those reporting high purity, have shown varying degree of contamination of proteins from other
cellular compartments (Mootha et al. 2003; Taylor et al. 2003; Andreyev et al. 2010). Although
other membrane bound organelles (endoplasmic reticulum, mitochondria) were co-purified along
with the nuclear fraction in the current experiment, their presence did not affect the chromatin
immunoprecipitation: only a single, specific band was detected in the immunoblot performed
with the anti-H3K4me3 antibody. Overall, this protocol is a fast and efficient method for the
isolation of an enriched nuclei fraction from A. niger mycelia for use in chromatin
immunoprecipitation.
4.2 Technical considerations for A. niger ChIP-sequencing and data analysis
The results from the ChIP-seq experiment performed here in A. niger highlight the
importance of technical issues to consider for obtaining high quality data. First, it is important to
select an appropriate control for sequencing normalization. I selected total “input” DNA
(chromatin not subjected to immunoprecipitation) as negative control for ChIP-seq, in favour of
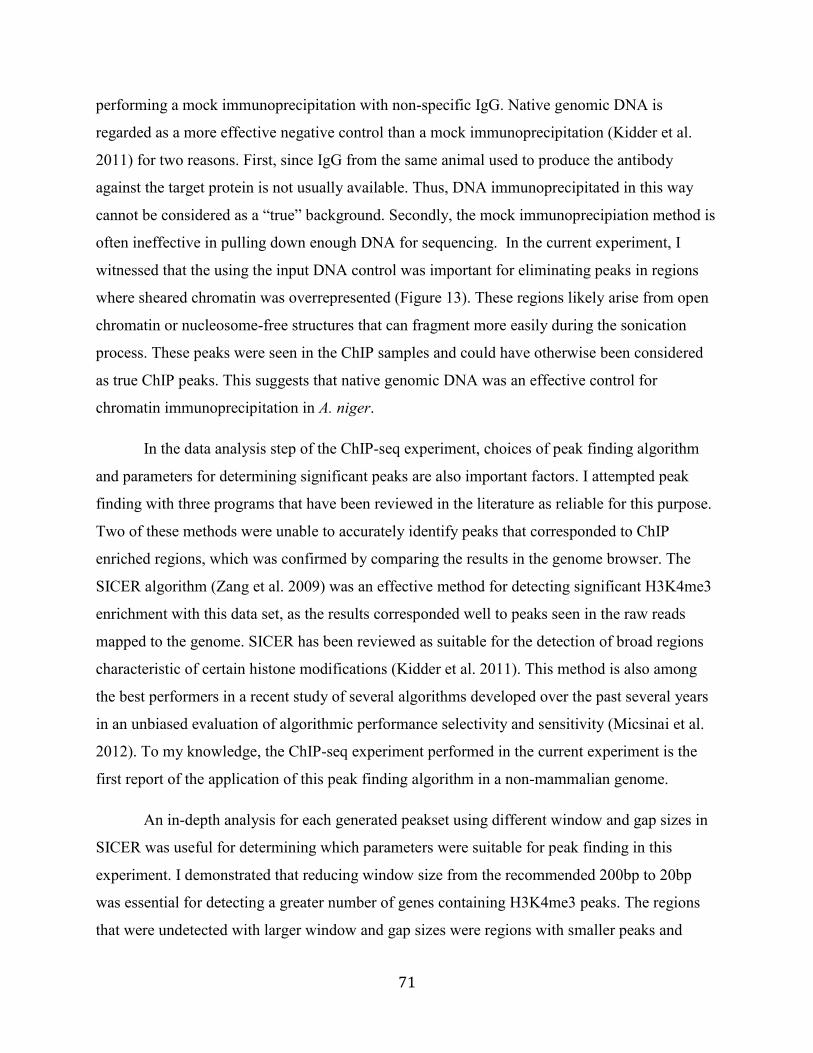
71
performing a mock immunoprecipitation with non-specific IgG. Native genomic DNA is
regarded as a more effective negative control than a mock immunoprecipitation (Kidder et al.
2011) for two reasons. First, since IgG from the same animal used to produce the antibody
against the target protein is not usually available. Thus, DNA immunoprecipitated in this way
cannot be considered as a “true” background. Secondly, the mock immunoprecipiation method is
often ineffective in pulling down enough DNA for sequencing. In the current experiment, I
witnessed that the using the input DNA control was important for eliminating peaks in regions
where sheared chromatin was overrepresented (Figure 13). These regions likely arise from open
chromatin or nucleosome-free structures that can fragment more easily during the sonication
process. These peaks were seen in the ChIP samples and could have otherwise been considered
as true ChIP peaks. This suggests that native genomic DNA was an effective control for
chromatin immunoprecipitation in A. niger.
In the data analysis step of the ChIP-seq experiment, choices of peak finding algorithm
and parameters for determining significant peaks are also important factors. I attempted peak
finding with three programs that have been reviewed in the literature as reliable for this purpose.
Two of these methods were unable to accurately identify peaks that corresponded to ChIP
enriched regions, which was confirmed by comparing the results in the genome browser. The
SICER algorithm (Zang et al. 2009) was an effective method for detecting significant H3K4me3
enrichment with this data set, as the results corresponded well to peaks seen in the raw reads
mapped to the genome. SICER has been reviewed as suitable for the detection of broad regions
characteristic of certain histone modifications (Kidder et al. 2011). This method is also among
the best performers in a recent study of several algorithms developed over the past several years
in an unbiased evaluation of algorithmic performance selectivity and sensitivity (Micsinai et al.
2012). To my knowledge, the ChIP-seq experiment performed in the current experiment is the
first report of the application of this peak finding algorithm in a non-mammalian genome.
An in-depth analysis for each generated peakset using different window and gap sizes in
SICER was useful for determining which parameters were suitable for peak finding in this
experiment. I demonstrated that reducing window size from the recommended 200bp to 20bp
was essential for detecting a greater number of genes containing H3K4me3 peaks. The regions
that were undetected with larger window and gap sizes were regions with smaller peaks and

72
lower levels of mapped ChIP reads. By performing peak finding with smaller windows, these
less prominent peak regions could be detected as significant by the algorithm. Along with the use
of smaller windows, I determined the effects of modifying gap size in SICER peak finding. As
expected, a smaller gap size increased the sensitivity to fluctuations in read density. Peaksets
generated using small gap sizes had the highest number of fragmented peaks associated with a
single gene model. When window size was 20bp and gap size was 60bp, peaksets between
biological replicates showed the highest levels of correlation, a maximum number of ChIP
enriched genes was detected, and fragmented peak regions were kept to a minimum. However,
there were still a number of regions in this peakset that overlapped more than one gene. This was
a potential concern, since some smaller, less highly enriched regions could be obscured as a
result of being merged with another broader or taller peak. The issue was resolved by using a
peak splitting program, which effectively detected the vast majority of significant read
fluctuations that occurred between gene models that were not detected as gaps in the original
peak finding with SICER. The peak splitting method introduced a gap in these regions and the
resulting peakset contained distinct peaks for individual gene models. Taken together, the
analysis demonstrated that the choice of methods for data analysis is important to consider in
ChIP-seq analysis. The genome of A. niger is densely packed, with a mean spacing of ~1 gene
per 3 kbp (close together when compared with that of higher eukaryotes like human and mouse,
which have an average spacing of 1 gene per ~ 144 kbp and ~130 kbp, respectively; Ensembl
Genome Reference Consortium, 2013). This provides a rationale for determining optimal peak
finding parameters that may differ from those recommended by the authors of a peak finding
algorithm. Moreover, the application of another data analysis tool (for example, an application
for peak splitting) was useful in further improving the resulting peakset. This suggests that
integration of multiple methods for generating peaksets from ChIP-seq data could be a useful
approach for obtaining optimal results.
4.3 H3K4me3 is not a definitive marker of active gene transcription in A. niger
H3K4me3 has been reported to correlate positively with actively transcribed genes. To
examine the relationship between gene expression and presence of H3K4me3 in A. niger, I
integrated the results from the ChIP-seq experiment with RNA-seq data generated using the

73
same growth conditions. The results obtained in the current study are only somewhat similar to
reports of patterns and distribution of H3K4me3 for other species. One study in rice (Oryza
sativa) reported that H3K4me3 modified 61.4% of all non-transposable element genes and
82.6% of all transcribed genes (He et al. 2010). In mouse, H3K4me3 mapped to 68% and 74% of
genes in cerebrum and testis tissues, respectively, and 15% of actively transcribed genes lacked
H3K4me3 (Cui et al. 2012). A recent report of H3K4me3 in CD4+ regulatory T cells reported
the presence of this histone modification in 76% of all genes (He et al. 2014). In yeast the
presence of H3K4me3 is associated with as many as 87% of all genes (Guillemette et al. 2011)
and at most +1 nucleosome sites (occuring at gene transcription start sites in the yeast genome;
Weiner et al. 2012). Notably, there is mounting evidence that H3K4me3 is also associated with
transcriptional repression by promoting antisense transcription (van Dijk et al. 2011; Weiner et
al. 2012; Margaritis et al. 2013). The complex picture of H3K4me3 in the yeast genome is an
active area of ongoing investigation
Other studies have integrated genome-wide expression data and shown a positive
correlation of H3K4me3 with increase in gene activity in response to changes in experimental
treatments. In rice, in response to dehydration stress 89.3% of genes that are up-regulated also
have increased levels of H3K4me3 and 90.6% of the down-regulated genes have lower levels of
H3K4me3 (Zong et al. 2013). These results were similar to those from a dehydration stress
experiment performed in Arabidopsis thaliana (van Dijk et al. 2010). In human mammary cells
undergoing epithelial-mesenchymal transition, a gain of H3K4me3 is associated with increased
mRNA accumulation (Malouf et al. 2013).
I show in the present study that in A. niger H3K4me3 is not associated with all active
gene loci. Though the majority of actively transcribed regions (5058 genes) were associated with
H3K4me3, 1971 genes that are actively transcribed (28% of all actively transcribed genes) from
the maltose and xylose growth RNA-seq data sets do not contain an H3K4me3 peak. In total,
H3K4me3 modified regions are mapped to 42.7% of all known coding regions in the A. niger
genome. When compared with the reports in other species, H3K4me3 appears less frequently in
the genome of A. niger. In addition, the analysis from the current experiment shows that only 10
out of 255 genes with increased expression on either growth condition is accompanied by an
increase in H3K4me3. In fact, the majority of genes differentially transcribed between growth on

74
maltose and growth on xylose do not contain H3K4me3 on either carbon source, as this modified
histone marks only 45 of the 233 differentially regulated genes. Amongst the differentially
regulated genes not marked by H3K4me3 during growth on maltose or xylose, there were some
highly expressed genes. These included the glucoamylase gene, known to be strongly repressed
during growth on xylose and strongly induced during growth on maltose (Barton et al. 1972).
The analysis of transcription on maltose or xylose growth in relation to H3K4me3
resulted in other notable observations. Though nearly a third of all actively transcribed genes do
not contain H3K4me3, there is nonetheless an apparent relationship between the presence of the
H3K4me3 modification and genes with higher levels of transcription in A. niger. Although the
threshold values differ, this pattern is conserved in classes of genes with different functional
properties. For example, mean transcript levels for the central metabolic genes containing
H3K4me3 (202±217) are much higher than for fungal transcription factors containing H3K4me3
(29.2±34.5). I examined the presence of H3K4me3 at ribosomal genes and aminoacyl tRNA
synthetases, classes of genes that are predicted to be highly and constitutively expressed. Nearly
all of these loci contained the H3K4me3 modification. These results indicate that although
H3K4me3 does not appear to be required for transcription of nearly a third of the genome, there
may be a role for H3K4me3 for highly expressed genes, including constitutively transcribed
genes.
Interestingly, there are some regions (23 in total) that exhibit differential levels of
H3K4me3 between maltose and xylose growth, but are not differentially transcribed. The reason
for these differential levels of H3K4me3, or the possible significance of the proteins coded at
these loci, is not clear. Another exception is the presence of H3K4me3 at 57 gene loci that are
not actively transcribed on either growth condition. There are reports of similar occurrences in
the literature from other species. One explanation is the suggestion that H3K4me3 can mark
genes “poised” for transcription (Black et al. 2012). Another reason could be that H3K4me3 is
acting in combination with other epigenetic modifications: studies in pluripotent cells have
reported that activating marks can occur alongside a repressive mark, such as H3K27me3, in
what are termed “bivalent promoters” (Bernstein et al. 2006; Azuara et al. 2006). Expression of
genes with bivalent promoters can be repressed despite the presence of the activating H3K4me3
mark. Yet another possibility is that gene expression is silenced by way of H3K4me3 promotion

75
of anti-sense transcription, a phenomenon that has been observed in yeast (Margaritis et al.
2012). H3K4me3 has also been shown to be involved in a type of epigenetic “memory” of recent
transcriptional activity, transmittable through generations in yeast from mother to daughter cells
(Ng et al. 2003; Muramoto et al. 2010) and could explain the presence of this histone
modification at silent genes. Given that a significant number of genes undergoing active
expression do not contain any H3K4me3, these scenarios are difficult to predict. The results I
obtained in this study suggest that the epigenome of A. niger requires further exploration to
better understand the role of H3K4me3 in A. niger gene expression.
Taken together, the comparisons made with reports from other species suggest that there
are differences in the function and distribution of H3K4me3 in the A. niger genome. In
particular, the data suggest that H3K4me3 does not function as a characteristic transcription
activating marker, as demonstrated in other species. To further examine a possible cause for
these differences, I mined the A. niger genome for proteins that make up this protein complex
responsible for tri-methylation of lysine 4 on histone H3 (Set1/COMPASS). The sequences used
for comparison were obtained from well-characterized genes that make up this complex in the
yeast S. cerevisiae. The A. niger genome contains proteins with sequence similarity to six of the
seven Set1/COMPASS complex subunits, but I was not able to locate an ortholog for the Shg1
gene. Although this subunit is not apparently essential for H3K4me3 deposition, Shg1 may
influence efficiency or accuracy of K4 trimethylation (Krogan et al. 2002; Nagy et al. 2002;
Mersman et al. 2012). The possible effects of the lack of a Shg1 ortholog in A. niger should be
further examined.
4.4 Non-random distribution of H3K4me3 in the chromosome
H3K4me3 density increases at the pericentromeric region, where nearly every gene
model contains an H3K4me3 peak. The opposite is seen in the regions preceding the telomeres,
and this occurs independently of gene density or GC content. As well, H3K4me3 is not evenly
distributed over the lengths of the chromosome arms. An interesting observation that requires
further investigation is the appearance of many differentially expressed genes in intervals where
H3K4me3 is largely depleted both on maltose and xylose. Patterns in chromosomal distribution
are not yet well understood, although some models have been hypothesized. For example, the
“genome compartmentalization” theory (Naumova and Dekker, 2010) proposes that the local

76
state of chromatin, including patterns of histone modifications along the chromosome, can be
integrated with three-dimensional chromatin folding and spatial co-localization of other factors
to gain a full understanding of genome regulation. The uneven distribution of H3K4me3 in A.
niger chromosomes, sometimes over long intervals of the genome in gene-dense regions and in
regions proximal to the telomeres and centormeres, raises the possibility that regions in
chromosomes in A. niger are compartmentalized. This result could provide an interesting avenue
for investigating the role of higher order chromatin structures in A. niger gene expression.
4.5 H3K4me3 supports the annotation of genomic features
The H3K4me3 map of A. niger chromosomes also reveals that this histone modification
is completely absent in the centromere region. The lack of H3K4me3 peaks observed in
centromeric regions, typically associated with heterochromatin, is consistent with findings by
Smith et al. (2011), which demonstrated a lack of H3K4 di- and tri-methylation in centromere
regions of the filamentous fungus N. crassa. In N. crassa, canonical H3 is replaced by a
centromere-specific histone variant, CenH3. Although centromeric regions are typically
associated with heterochromatin, other euchromatic markers generally associated with
transcriptionally active genes have been found in human centromeres (Lam et al. 2006; Sullivan
et al. 2004). Euchromatic modifications, including H3K4me3, are not seen in the N. crassa
centromeres. This raises the possibility that similar to N. crassa, the A. niger centromere
boundaries occur where an abrupt discontinuation of H3K4me3 peaks is observed, and thereby
marking the precise location of the A. niger centromeres.
A number of H3K4me3 peaks do not intersect with a predicted gene model, but may
mark a previously unrecognized coding region or other genomic features. Indeed, during a recent
manual curation of the newly assembled NRRL3 A. niger genome, the H3K4me3 ChIP-seq data
is useful in supporting the presence of gene models (data unpublished). A similar approach was
recently used in improving the rice genome (Du et al. 2013). As shown in the current
experiment, in rare instances H3K4me3 marks regions where coding gene models cannot be
predicted but where there is transcript coverage. This observation suggests that H3K4me3 could
be a marker for regions of non-coding RNA. Several studies have demonstrated the co-
localization of histone modifications, including H3K4me3, with non-coding RNA. These
observations, combined with the availability of RNA sequencing data, have facilitated the

77
annotation of non-coding RNA species in the genome (Marchese and Huarte, 2013). An analysis
of the location of peak summits of H3K4me3 regions have been useful in annotating
transcription start sites in a number of organisms, including mouse (Mikkelsen et al. 2007),
Arabidopsis (van Dijk et al. 2010), and Rhesus macaque (Liu et al. 2011). Precise locations of
transcription start sites in A. niger have not been widely identified in the genome, although a
number of highly transcribed and well-assembled full-length transcripts are available from
several expression data sets. This relationship is currently being investigated.
Section 5: Conclusion
In the present study, I have generated a map of H3K4me3 distribution in a high-quality
assembly of the Aspergillus niger genome. H3K4me3 marks genes undergoing active
transcription, but a significant number of expressed genes do not contain H3K4me3. These
include the majority of genes that are differentially expressed between growth on maltose and
xylose. Overall, distribution of H3K4me3 is non-random along the length of the chromosome,
with high levels at pericentromeric regions and low levels near the telomeres. The results
presented here also highlight the considerations involved in ChIP-seq data analysis and the
importance of relating epigenetic information with gene expression data. The integration of
transcriptome and epigenome data can reveal novel trends and targets for further investigation.

78
References
Allis, C. D., & Muir, T. W. (2011). Spreading chromatin into chemical biology. Chembiochem : A European
Journal of Chemical Biology, 12, 264–279. doi:10.1002/cbic.201000761
Alon, U. (2009). How To Choose a Good Scientific Problem. Molecular Cell, 35(6), 726–728.
Ameyar-Zazoua, M., Rachez, C., Souidi, M., Robin, P., Fritsch, L., Young, R., … Harel-Bellan, A. (2012).
Argonaute proteins couple chromatin silencing to alternative splicing. Nature Structural & Molecular Biology.
doi:10.1038/nsmb.2373
Anders, S., & Huber, W. (2010). Differential expression analysis for sequence count data. Genome Biology, 11,
R106. doi:10.1186/gb-2010-11-10-r106
Andreyev, A. Y., Shen, Z., Guan, Z., Ryan, A., Fahy, E., Subramaniam, S., … Dennis, E. A. (2010). Application of
proteomic marker ensembles to subcellular organelle identification. Molecular & Cellular Proteomics : MCP,
9, 388–402. doi:10.1074/mcp.M900432-MCP200
Archer, D., & Turner, G. (2006). Genomics of protein secretion and hyphal growth in Aspergillus. In A. J. P. Brown
(Ed.), The Mycota XIII (pp. 75–96). Springer, Berlin Heidelberg.
Azuara, V., Perry, P., Sauer, S., Spivakov, M., Jørgensen, H. F., John, R. M., … Fisher, A. G. (2006). Chromatin
signatures of pluripotent cell lines. Nature Cell Biology, 8, 532–538. doi:10.1038/ncb1403
Baker, S. E. (2006). Aspergillus niger genomics: past, present and into the future. Medical Mycology, 44, S17–21.
doi:10.1080/13693780600921037
Bannister, A. J., & Kouzarides, T. (2011). Regulation of chromatin by histone modifications. Cell Research, 21,
381–395. doi:10.1038/cr.2011.22
Barski, A., Cuddapah, S., Cui, K., Roh, T. Y., Schones, D. E., Wang, Z., … Zhao, K. (2007). High-Resolution
Profiling of Histone Methylations in the Human Genome. Cell, 129, 823–837. doi:10.1016/j.cell.2007.05.009
Barton, L. L., Georgi, C. E., & Lineback, D. R. (1972). Effect of maltose on glucoamylase formation by Aspergillus
niger. Journal of Bacteriology, 111, 771–777.
Batta, K., Zhang, Z., Yen, K., Goffman, D. B., & Pugh, B. F. (2011). Genome-wide function of H2B ubiquitylation
in promoter and genic regions. Genes & Development. doi:10.1101/gad.177238.111
Bauer, D. F. (1972). Constructing Confidence Sets Using Rank Statistics. Journal of the American Statistical
Association, 67, 687–690. doi:10.2307/2284469
Bernstein, B. E., Humphrey, E. L., Erlich, R. L., Schneider, R., Bouman, P., Liu, J. S., … Schreiber, S. L. (2002).
Methylation of histone H3 Lys 4 in coding regions of active genes. Proceedings of the National Academy of
Sciences of the United States of America, 99, 8695–8700. doi:10.1073/pnas.082249499
Bernstein, B. E., Kamal, M., Lindblad-Toh, K., Bekiranov, S., Bailey, D. K., Huebert, D. J., … Lander, E. S. (2005).
Genomic maps and comparative analysis of histone modifications in human and mouse. Cell, 120, 169–181.
doi:10.1016/j.cell.2005.01.001
Bernstein, B. E., Mikkelsen, T. S., Xie, X., Kamal, M., Huebert, D. J., Cuff, J., … Lander, E. S. (2006). A Bivalent
Chromatin Structure Marks Key Developmental Genes in Embryonic Stem Cells. Cell, 125, 315–326.
doi:10.1016/j.cell.2006.02.041
Biology, S. (1978). Progress in Molecular and Subcellular Biology. (F. E. Hahn, H. Kersten, W. Kersten, & W.
Szybalski, Eds.) (Vol. 6). Berlin, Heidelberg: Springer Berlin Heidelberg. doi:10.1007/978-3-642-66856-2
Black, J. C., Van Rechem, C., & Whetstine, J. R. (2012). Histone Lysine Methylation Dynamics: Establishment,
Regulation, and Biological Impact. Molecular Cell. doi:10.1016/j.molcel.2012.11.006
Boa, S., Coert, C., & Patterton, H.-G. (2003). Saccharomyces cerevisiae Set1p is a methyltransferase specific for
lysine 4 of histone H3 and is required for efficient gene expression. Yeast (Chichester, England), 20(9), 827–
35. doi:10.1002/yea.995
Bohle, K., Jungebloud, a, Göcke, Y., Dalpiaz, a, Cordes, C., Horn, H., & Hempel, D. C. (2007). Selection of
reference genes for normalisation of specific gene quantification data of Aspergillus niger. Journal of
Biotechnology, 132(4), 353–8. doi:10.1016/j.jbiotec.2007.08.005
Bonnet-Garnier, A., Feuerstein, P., Chebrout, M., Fleurot, R., Jan, H.-U., Debey, P., & Beaujean, N. (2012).
Genome organization and epigenetic marks in mouse germinal vesicle oocytes. The International Journal of
Developmental Biology, 56(10-12), 877–87. doi:10.1387/ijdb.120149ab
Borun, T. W., Pearson, D., & Paik, W. K. (1972). Studies of histone methylation during the HeLa S-3 cell cycle. The
Journal of Biological Chemistry, 247(13), 4288–98. Retrieved from
http://www.ncbi.nlm.nih.gov/pubmed/5035694

79
Boyer, L. A., Mathur, D., & Jaenisch, R. (2006). Molecular control of pluripotency. Current Opinion in Genetics
and Development. doi:10.1016/j.gde.2006.08.009
Celniker, S. E., Dillon, L. A. L., Gerstein, M. B., Gunsalus, K. C., Henikoff, S., Karpen, G. H., … Waterston, R. H.
(2009). Unlocking the secrets of the genome. Nature, 459, 927–930. doi:10.1038/459927a
Chen, X., Xu, H., Yuan, P., Fang, F., Huss, M., Vega, V. B., … Ng, H. H. (2008). Integration of External Signaling
Pathways with the Core Transcriptional Network in Embryonic Stem Cells. Cell, 133, 1106–1117.
doi:10.1016/j.cell.2008.04.043
Chen, X., & Zhou, D. X. (2013). Rice epigenomics and epigenetics: Challenges and opportunities. Current Opinion
in Plant Biology. doi:10.1016/j.pbi.2013.03.004
Christensen, J., Agger, K., Cloos, P. A. C., Pasini, D., Rose, S., Sennels, L., … Helin, K. (2007). RBP2 Belongs to a
Family of Demethylases, Specific for Tri-and Dimethylated Lysine 4 on Histone 3. Cell, 128, 1063–1076.
doi:10.1016/j.cell.2007.02.003
Cirillo, L. A., Lin, F. R., Cuesta, I., Friedman, D., Jarnik, M., & Zaret, K. S. (2002). Opening of compacted
chromatin by early developmental transcription factors HNF3 (FoxA) and GATA-4. Molecular Cell, 9, 279–
289. doi:10.1016/S1097-2765(02)00459-8
Cui, P., Liu, W., Zhao, Y., Lin, Q., Ding, F., Xin, C., … Yu, J. (2012). The association between H3K4me3 and
antisense transcription. Genomics, Proteomics & Bioinformatics, 10(2), 74–81. doi:10.1016/j.gpb.2012.05.001
Cui, P., Liu, W., Zhao, Y., Lin, Q., Zhang, D., Ding, F., … Hu, S. (2012). Comparative Analyses of H3K4 and
H3K27 Trimethylations Between the Mouse Cerebrum and Testis. Genomics, Proteomics and Bioinformatics,
10, 82–93. doi:10.1016/j.gpb.2012.05.007
Culleton, H., McKie, V., & de Vries, R. P. (2013). Physiological and molecular aspects of degradation of plant
polysaccharides by fungi: What have we learned from Aspergillus? Biotechnology Journal, 8, 884–94.
doi:10.1002/biot.201200382
Cumming, G., Fidler, F., & Vaux, D. L. (2007). Error bars in experimental biology. The Journal of Cell Biology,
177(1), 7–11.
Das, P. M., Ramachandran, K., vanWert, J., & Singal, R. (2004). Chromatin immunoprecipitation assay.
BioTechniques, 37, 961–969.
De Oliveira, J. M. P. F., van Passel, M. W. J., Schaap, P. J., & de Graaff, L. H. (2011). Proteomic analysis of the
secretory response of Aspergillus niger to D-maltose and D-xylose. PloS One, 6, e20865.
doi:10.1371/journal.pone.0020865
De Vries, R. P., & Visser, J. (2001). Aspergillus Enzymes Involved in Degradation of Plant Cell Wall
Polysaccharides. Microbiology and Molecular Biology Reviews, 65, 497–522. doi:10.1128/MMBR.65.4.497-
522.2001
Dehé, P.-M., Dichtl, B., Schaft, D., Roguev, A., Pamblanco, M., Lebrun, R., … Géli, V. (2006). Protein interactions
within the Set1 complex and their roles in the regulation of histone 3 lysine 4 methylation. The Journal of
Biological Chemistry, 281(46), 35404–12. doi:10.1074/jbc.M603099200
Dekker, J., Rippe, K., Dekker, M., & Kleckner, N. (2002). Capturing chromosome conformation. Science (New
York, N.Y.), 295, 1306–1311. doi:10.1126/science.1067799
Deng, W., & Blobel, G. A. (2010). Do chromatin loops provide epigenetic gene expression states? Current Opinion
in Genetics and Development. doi:10.1016/j.gde.2010.06.007
Du, Z., Li, H., Wei, Q., Zhao, X., Wang, C., Zhu, Q., … Su, Z. (2013). Genome-wide analysis of histone
modifications: H3K4me2, H3K4me3, H3K9ac, and H3K27ac in Oryza sativa L. Japonica. Molecular Plant, 6,
1463–72. doi:10.1093/mp/sst018
Ebringerova, A., & Heinze, T. (2000). Xylan and xylan derivatives - biopolymers with valuable properties, 1 -
Naturally occurring xylans structures, procedures and properties. Macromolecular Rapid Communications, 21,
542–556. doi:10.1002/1521-3927(20000601)21:9<542::aid-marc542>3.3.co;2-z
Eissenberg, J. C., & Shilatifard, A. (2010). Histone H3 lysine 4 (H3K4) methylation in development and
differentiation. Developmental Biology. doi:10.1016/j.ydbio.2009.08.017
Fischle, W. (2012). One, two, three: how histone methylation is read. Epigenomics, 4, 641–653.
doi:10.2217/epi.12.56
Flipphi, M., Sun, J., Robellet, X., Karaffa, L., Fekete, E., Zeng, A. P., & Kubiecek, C. P. (2009). Biodiversity and
evolution of primary carbon metabolism in Aspergillus nidulans and other Aspergillus spp. Fungal Genetics
and Biology : FG & B, 46 Suppl 1. doi:10.1016/j.fgb.2008.07.018
Fuchs, J., Demidov, D., Houben, A., & Schubert, I. (2006). Chromosomal histone modification patterns--from
conservation to diversity. Trends in Plant Science, 11, 199–208. doi:10.1016/j.tplants.2006.02.008

80
Fuda, N. J., Ardehali, M. B., & Lis, J. T. (2009). Defining mechanisms that regulate RNA polymerase II
transcription in vivo. Nature, 461, 186–192. doi:10.1038/nature08449
Gacek, A., & Strauss, J. (2012). The chromatin code of fungal secondary metabolite gene clusters. Applied
Microbiology and Biotechnology. doi:10.1007/s00253-012-4208-8
Galbe, M., & Zacchi, G. (2007). Pretreatment of lignocellulosic materials for efficient bioethanol production.
Advances in Biochemical Engineering/biotechnology, 108, 41–65. doi:10.1007/10
Gangloff, Y. G., Pointud, J. C., Thuault, S., Carré, L., Romier, C., Muratoglu, S., … Davidson, I. (2001). The TFIID
components human TAF(II)140 and Drosophila BIP2 (TAF(II)155) are novel metazoan homologues of yeast
TAF(II)47 containing a histone fold and a PHD finger. Molecular and Cellular Biology, 21, 5109–5121.
doi:10.1128/MCB.21.15.5109-5121.2001
Gardner, K. E., Allis, C. D., & Strahl, B. D. (2011). Operating on chromatin, a colorful language where context
matters. Journal of Molecular Biology. doi:10.1016/j.jmb.2011.01.040
Gershey, E. L., Haslett, G. W., Vidali, G., & Allfrey, G. (1969). MACROMOLECULES : Chemical Studies of
Histone Methylation : EVIDENCE FOR THE OCCURRENCE OF 3-METHYLHISTIDINE IN AVIAN
ERYTHROCYTE HISTONE of Histone Methylation.
Greenberg, R. A. (2011). Histone tails: Directing the chromatin response to DNA damage. FEBS Letters.
doi:10.1016/j.febslet.2011.05.037
Greer, E. L., & Shi, Y. (2012). Histone methylation: a dynamic mark in health, disease and inheritance. Nature
Reviews Genetics, 13(5), 343–357. doi:10.1038/nrg3173
Grigoryev, S. a, & Woodcock, C. L. (2012). Chromatin organization - the 30 nm fiber. Experimental Cell Research,
318(12), 1448–55. doi:10.1016/j.yexcr.2012.02.014
Guccione, E., Martinato, F., Finocchiaro, G., Luzi, L., Tizzoni, L., Dall’ Olio, V., … Amati, B. (2006). Myc-
binding-site recognition in the human genome is determined by chromatin context. Nature Cell Biology, 8,
764–770. doi:10.1038/ncb1434
Guillemette, B., Drogaris, P., Lin, H.-H. S., Armstrong, H., Hiragami-Hamada, K., Imhof, A., … Festenstein, R. J.
(2011). H3 lysine 4 is acetylated at active gene promoters and is regulated by H3 lysine 4 methylation. PLoS
Genetics, 7(3), e1001354. doi:10.1371/journal.pgen.1001354
Ha, M. (2013). Understanding the chromatin remodeling code. Plant Science : An International Journal of
Experimental Plant Biology, 211, 137–45. doi:10.1016/j.plantsci.2013.07.006
Haring, M., Offermann, S., Danker, T., Horst, I., Peterhansel, C., & Stam, M. (2007). Chromatin
immunoprecipitation: optimization, quantitative analysis and data normalization. Plant Methods, 3, 11.
doi:10.1186/1746-4811-3-11
Haynes, B. C., Skowyra, M. L., Spencer, S. J., Gish, S. R., Williams, M., Held, E. P., … Doering, T. L. (2011).
Toward an integrated model of capsule regulation in Cryptococcus neoformans. PLoS Pathogens, 7.
doi:10.1371/journal.ppat.1002411
He, G., Zhu, X., Elling, A. A., Chen, L., Wang, X., Guo, L., … Deng, X.-W. (2010). Global epigenetic and
transcriptional trends among two rice subspecies and their reciprocal hybrids. The Plant Cell, 22, 17–33.
doi:10.1105/tpc.109.072041
He, H., Ni, B., Tian, Y., Tian, Z., Chen, Y., Liu, Z., … Zhang, Y. (2014). Histone methylation mediates plasticity of
human FOXP3(+) regulatory T cells by modulating signature gene expressions. Immunology, 141(3), 362–76.
doi:10.1111/imm.12198
Henikoff, S., & Shilatifard, A. (2011). Histone modification: cause or cog? Trends in Genetics : TIG, 27(10), 389–
96. doi:10.1016/j.tig.2011.06.006
Højfeldt, J. W., Agger, K., & Helin, K. (2013). Histone lysine demethylases as targets for anticancer therapy. Nature
Reviews. Drug Discovery, 12, 917–30. doi:10.1038/nrd4154
Hollander, M., & Wolfe, D. A. (n.d.). Nonparametric Statistical Methods (pp. 27–33; 68–75). New York: John
Wiley & Sons.
Hondmann, D., & Visser, J. (1994). Carbon metabolism. Prog Ind Microbiol, 29, 61–139.
Hong, C. I., Jolma, I. W., Loros, J. J., Dunlap, J. C., & Ruoff, P. (2008). Simulating dark expressions and
interactions of frq and wc-1 in the Neurospora circadian clock. Biophysical Journal, 94, 1221–1232.
doi:10.1529/biophysj.107.115154
Huang, Y., Fang, J., Bedford, M. T., Zhang, Y., & Xu, R.-M. (2006). Recognition of histone H3 lysine-4
methylation by the double tudor domain of JMJD2A. Science (New York, N.Y.), 312, 748–751.
doi:10.1126/science.1125162

81
Jacobs, D. I., Olsthoorn, M. M. A., Maillet, I., Akeroyd, M., Breestraat, S., Donkers, S., … Sagt, C. M. J. (2009).
Effective lead selection for improved protein production in Aspergillus niger based on integrated genomics.
Fungal Genetics and Biology : FG & B, 46 Suppl 1. doi:10.1016/j.fgb.2008.08.012
Johnson, D. S., Mortazavi, A., Myers, R. M., & Wold, B. (2007). Genome-wide mapping of in vivo protein-DNA
interactions. Science (New York, N.Y.), 316, 1497–1502. doi:10.1126/science.1141319
Johnson, L. M., Cao, X., & Jacobsen, S. E. (2002). Interplay between two epigenetic marks: DNA methylation and
histone H3 lysine 9 methylation. Current Biology, 12, 1360–1367. doi:10.1016/S0960-9822(02)00976-4
Jørgensen, T. R., Goosen, T., Hondel, C. a M. J. J. Van Den, Ram, A. F. J., & Iversen, J. J. L. (2009).
Transcriptomic comparison of Aspergillus niger growing on two different sugars reveals coordinated
regulation of the secretory pathway. BMC Genomics, 10, 44. doi:10.1186/1471-2164-10-44
Jothi, R., Cuddapah, S., Barski, A., Cui, K., & Zhao, K. (2008). Genome-wide identification of in vivo protein-DNA
binding sites from ChIP-Seq data. Nucleic Acids Research, 36, 5221–5231. doi:10.1093/nar/gkn488
Karimi-Aghcheh, R., Bok, J. W., Phatale, P. a, Smith, K. M., Baker, S. E., Lichius, A., … Kubicek, C. P. (2013).
Functional analyses of Trichoderma reesei LAE1 reveal conserved and contrasting roles of this regulator. G3
(Bethesda, Md.), 3(2), 369–78. doi:10.1534/g3.112.005140
Keller, A., Nesvizhskii, A. I., Kolker, E., & Aebersold, R. (2002). Empirical statistical model to estimate the
accuracy of peptide identifications made by MS/MS and database search. Analytical Chemistry, 74, 5383–
5392. doi:10.1021/ac025747h
Kharchenko, P. V, Tolstorukov, M. Y., & Park, P. J. (2008). Design and analysis of ChIP-seq experiments for DNA-
binding proteins. Nature Biotechnology, 26, 1351–1359. doi:10.1038/nbt.1508
Kidder, B. L., Hu, G., & Zhao, K. (2011). ChIP-Seq: technical considerations for obtaining high-quality data. Nature
Immunology. doi:10.1038/ni.2117
Kirmizis, A., Santos-Rosa, H., Penkett, C. J., Singer, M. A., Vermeulen, M., Mann, M., … Kouzarides, T. (2007).
Arginine methylation at histone H3R2 controls deposition of H3K4 trimethylation. Nature, 449(7164), 928–
32. doi:10.1038/nature06160
Kouzarides, T. (2007). Chromatin Modifications and Their Function. Cell. doi:10.1016/j.cell.2007.02.005
Krogan, N. J., Dover, J., Khorrami, S., Greenblatt, J. F., Schneider, J., Johnston, M., & Shilatifard, A. (2002).
COMPASS, a histone H3 (Lysine 4) methyltransferase required for telomeric silencing of gene expression.
The Journal of Biological Chemistry, 277, 10753–10755. doi:10.1074/jbc.C200023200
Laajala, T. D., Raghav, S., Tuomela, S., Lahesmaa, R., Aittokallio, T., & Elo, L. L. (2009). A practical comparison
of methods for detecting transcription factor binding sites in ChIP-seq experiments. BMC Genomics, 10, 618.
doi:10.1186/1471-2164-10-618
Lam, A. L., Boivin, C. D., Bonney, C. F., Rudd, M. K., & Sullivan, B. A. (2006). Human centromeric chromatin is a
dynamic chromosomal domain that can spread over noncentromeric DNA. Proceedings of the National
Academy of Sciences of the United States of America, 103, 4186–4191. doi:10.1073/pnas.0507947103
Lanctôt, C., Cheutin, T., Cremer, M., Cavalli, G., & Cremer, T. (2007). Dynamic genome architecture in the nuclear
space: regulation of gene expression in three dimensions. Nature Reviews. Genetics, 8, 104–115.
doi:10.1038/nrg2041
Landt, S. G., Marinov, G. K., Kundaje, A., Kheradpour, P., Pauli, F., Batzoglou, S., … Snyder, M. (2012). ChIP-seq
guidelines and practices of the ENCODE and modENCODE consortia. Genome Research.
doi:10.1101/gr.136184.111
Lauberth, S. M., Nakayama, T., Wu, X., Ferris, A. L., Tang, Z., Hughes, S. H., & Roeder, R. G. (2013). H3K4me3
interactions with TAF3 regulate preinitiation complex assembly and selective gene activation. Cell, 152(5),
1021–36. doi:10.1016/j.cell.2013.01.052
Li, F., Mao, G., Tong, D., Huang, J., Gu, L., Yang, W., & Li, G. M. (2013). The histone mark H3K36me3 regulates
human DNA mismatch repair through its interaction with MutSα. Cell, 153, 590–600.
doi:10.1016/j.cell.2013.03.025
Liu, Y., Han, D., Han, Y., Yan, Z., Xie, B., Li, J., … Han, J.-D. J. (2011). Ab initio identification of transcription
start sites in the Rhesus macaque genome by histone modification and RNA-Seq. Nucleic Acids Research, 39,
1408–1418. doi:10.1093/nar/gkq956
Loros, J. J., & Dunlap, J. C. (1991). Neurospora crassa clock-controlled genes are regulated at the level of
transcription. Molecular and Cellular Biology, 11, 558–563. doi:10.1128/MCB.11.1.558.Updated
Lu, X., Sun, J., Nimtz, M., Wissing, J., Zeng, A.-P., & Rinas, U. (2010). The intra- and extracellular proteome of
Aspergillus niger growing on defined medium with xylose or maltose as carbon substrate. Microbial Cell
Factories, 9, 23. doi:10.1186/1475-2859-9-23

82
Luger, K., Mäder, A. W., Richmond, R. K., Sargent, D. F., & Richmond, T. J. (1997). Crystal structure of the
nucleosome core particle at 2.8 A resolution. Nature, 389, 251–260. doi:10.1038/38444
Luo, C., Loros, J. J., & Dunlap, J. C. (1998). Nuclear localization is required for function of the essential clock
protein FRQ. The EMBO Journal, 17, 1228–1235. doi:10.1093/emboj/17.5.1228
Malouf, G. G., Taube, J. H., Lu, Y., Roysarkar, T., Panjarian, S., Estecio, M. R., … Issa, J.-P. J. (2013). Architecture
of epigenetic reprogramming following Twist1-mediated epithelial-mesenchymal transition. Genome Biology,
14(12), R144. doi:10.1186/gb-2013-14-12-r144
Maltby, V. E., Martin, B. J. E., Brind’Amour, J., Chruscicki, A. T., McBurney, K. L., Schulze, J. M., … Howe, L. J.
(2012). Histone H3K4 demethylation is negatively regulated by histone H3 acetylation in Saccharomyces
cerevisiae. Proceedings of the National Academy of Sciences. doi:10.1073/pnas.1202070109
Marchese, F. P., & Huarte, M. (2013). Long non-coding RNAs and chromatin modifiers: Their place in the
epigenetic code. Epigenetics : Official Journal of the DNA Methylation Society, 9, 21–26.
doi:10.4161/epi.27472
Margaritis, T., Oreal, V., Brabers, N., Maestroni, L., Vitaliano-Prunier, A., Benschop, J. J., … Holstege, F. C. P.
(2012). Two distinct repressive mechanisms for histone 3 lysine 4 methylation through promoting 3’-end
antisense transcription. PLoS Genetics, 8(9), e1002952. doi:10.1371/journal.pgen.1002952
Mersman, D. P., Du, H.-N., Fingerman, I. M., South, P. F., & Briggs, S. D. (2012). Charge-based Interaction
Conserved within Histone H3 Lysine 4 (H3K4) Methyltransferase Complexes Is Needed for Protein Stability,
Histone Methylation, and Gene Expression. Journal of Biological Chemistry. doi:10.1074/jbc.M111.280867
Metzker, M. L. (2010). Sequencing technologies - the next generation. Nature Reviews. Genetics, 11(1), 31–46.
Micsinai, M., Parisi, F., Strino, F., Asp, P., Dynlacht, B. D., & Kluger, Y. (2012). Picking ChIP-seq peak detectors
for analyzing chromatin modification experiments. Nucleic Acids Research, 40, e70. doi:10.1093/nar/gks048
Mikkelsen, T. S., Ku, M., Jaffe, D. B., Issac, B., Lieberman, E., Giannoukos, G., … Bernstein, B. E. (2007).
Genome-wide maps of chromatin state in pluripotent and lineage-committed cells. Nature, 448, 553–560.
doi:10.1038/nature06008
Miller, T., Krogan, N. J., Dover, J., Erdjument-Bromage, H., Tempst, P., Johnston, M., … Shilatifard, A. (2001).
COMPASS: a complex of proteins associated with a trithorax-related SET domain protein. Proceedings of the
National Academy of Sciences of the United States of America, 98, 12902–12907.
doi:10.1073/pnas.231473398
Mootha, V. K., Bunkenborg, J., Olsen, J. V., Hjerrild, M., Wisniewski, J. R., Stahl, E., … Mann, M. (2003).
Integrated Analysis of Protein Composition, Tissue Diversity, and Gene Regulation in Mouse Mitochondria.
Cell, 115, 629–640. doi:10.1016/S0092-8674(03)00926-7
Morillon, A., Karabetsou, N., Nair, A., & Mellor, J. (2005). Dynamic lysine methylation on histone H3 defines the
regulatory phase of gene transcription. Molecular Cell, 18(6), 723–34. doi:10.1016/j.molcel.2005.05.009
Muramoto, T., Müller, I., Thomas, G., Melvin, A., & Chubb, J. R. (2010). Methylation of H3K4 Is Required for
Inheritance of Active Transcriptional States. Current Biology, 20, 397–406. doi:10.1016/j.cub.2010.01.017
Nagy, P. L., Griesenbeck, J., Kornberg, R. D., & Cleary, M. L. (2002). A trithorax-group complex purified from
Saccharomyces cerevisiae is required for methylation of histone H3. Proceedings of the National Academy of
Sciences of the United States of America, 99, 90–94. doi:10.1073/pnas.221596698
Naumova, N., & Dekker, J. (2010). Integrating one-dimensional and three-dimensional maps of genomes. Journal of
Cell Science, 123, 1979–1988. doi:10.1242/jcs.051631
Nesvizhskii, A. I., Keller, A., Kolker, E., & Aebersold, R. (2003). A statistical model for identifying proteins by
tandem mass spectrometry. Analytical Chemistry, 75, 4646–4658. doi:10.1021/ac0341261
Ng, H. H., Robert, F., Young, R. a, & Struhl, K. (2003). Targeted recruitment of Set1 histone methylase by
elongating Pol II provides a localized mark and memory of recent transcriptional activity. Molecular Cell,
11(3), 709–19. Retrieved from http://www.ncbi.nlm.nih.gov/pubmed/12667453
Ng, R. K., & Gurdon, J. B. (2008). Epigenetic inheritance of cell differentiation status. Cell Cycle (Georgetown,
Tex.), 7, 1173–1177. doi:10.4161/cc.7.9.5791
Novozymes. (2008). The Novozymes Report 2007.
Park, P. J. (2009). ChIP-seq: advantages and challenges of a maturing technology. Nature Reviews. Genetics, 10,
669–680. doi:10.1038/nrg2641
Pedersen, M. T., & Helin, K. (2010). Histone demethylases in development and disease. Trends in Cell Biology.
doi:10.1016/j.tcb.2010.08.011
Pel, H. J., de Winde, J. H., Archer, D. B., Dyer, P. S., Hofmann, G., Schaap, P. J., … Stam, H. (2007). Genome
sequencing and analysis of the versatile cell factory Aspergillus niger CBS 513.88. Nature Biotechnology, 25,
221–231. doi:10.1038/nbt1282

83
Pepke, S., Wold, B., & Mortazavi, A. (2009). Computation for ChIP-seq and RNA-seq studies. Nature Methods, 6,
S22–S32. doi:10.1038/nmeth.1371
Petersen, K. L., Lehmbeck, J., & Christensen, T. (1999). A new transcriptional activator for amylase genes in
Aspergillus. Molecular & General Genetics : MGG, 262, 668–676.
Pokholok, D. K., Harbison, C. T., Levine, S., Cole, M., Hannett, N. M., Tong, I. L., … Young, R. A. (2005).
Genome-wide map of nucleosome acetylation and methylation in yeast. Cell, 122, 517–527.
doi:10.1016/j.cell.2005.06.026
Pradeepa, M. M., Sutherland, H. G., Ule, J., Grimes, G. R., & Bickmore, W. a. (2012). Psip1/Ledgf p52 binds
methylated histone H3K36 and splicing factors and contributes to the regulation of alternative splicing. PLoS
Genetics, 8(5), e1002717. doi:10.1371/journal.pgen.1002717
Punt, P. J., Van Biezen, N., Conesa, A., Albers, A., Mangnus, J., & Van Den Hondel, C. (2002). Filamentous fungi
as cell factories for heterologous protein production. Trends in Biotechnology. doi:10.1016/S0167-
7799(02)01933-9
Quinlan, A. R., & Hall, I. M. (2010). BEDTools: a flexible suite of utilities for comparing genomic features.
Bioinformatics (Oxford, England), 26, 841–842. doi:10.1093/bioinformatics/btq033
R Development Core Team, R. (2011). R: A Language and Environment for Statistical Computing. (R. D. C. Team,
Ed.)R Foundation for Statistical Computing. R Foundation for Statistical Computing. doi:10.1007/978-3-540-
74686-7
Reyes-Dominguez, Y., Bok, J. W., Berger, H., Shwab, E. K., Basheer, A., Gallmetzer, A., … Strauss, J. (2010).
Heterochromatic marks are associated with the repression of secondary metabolism clusters in Aspergillus
nidulans. Molecular Microbiology, 76, 1376–1386. doi:10.1111/j.1365-2958.2010.07051.x
Richmond, R. K., Sargent, D. F., Richmond, T. J., Luger, K., & Ma, A. W. (1997). Crystal structure of the
nucleosome ˚ resolution core particle at 2 . 8 A, 7, 251–260.
Robertson, G., Hirst, M., Bainbridge, M., Bilenky, M., Zhao, Y., Zeng, T., … Jones, S. (2007). Genome-wide
profiles of STAT1 DNA association using chromatin immunoprecipitation and massively parallel sequencing.
Nature Methods, 4, 651–657. doi:10.1038/nmeth1068
Robinson, M. D., McCarthy, D. J., & Smyth, G. K. (2010). edgeR: a Bioconductor package for differential
expression analysis of digital gene expression data. Bioinformatics (Oxford, England), 26, 139–140.
doi:10.1093/bioinformatics/btp616
Rozowsky, J., Euskirchen, G., Auerbach, R. K., Zhang, Z. D., Gibson, T., Bjornson, R., … Gerstein, M. B. (2009).
PeakSeq enables systematic scoring of ChIP-seq experiments relative to controls. Nature Biotechnology, 27,
66–75. doi:10.1038/nbt.1518
Ruijter, G. J. ., Kubicek, C. P., & Visser, J. (2002). Production of organic acids by fungi. in The Mycota X Industrial
Applications (ed. Osiewacz, H.D.) (pp. 213–230). Springer Berlin Heidelberg.
Saleh, A., Alvarez-Venegas, R., & Avramova, Z. (2008). An efficient chromatin immunoprecipitation (ChIP)
protocol for studying histone modifications in Arabidopsis plants. Nature Protocols, 3, 1018–1025.
doi:10.1038/nprot.2008.66
Salmon-Divon, M., Dvinge, H., Tammoja, K., & Bertone, P. (2010). PeakAnalyzer: genome-wide annotation of
chromatin binding and modification loci. BMC Bioinformatics, 11, 415. doi:10.1186/1471-2105-11-415
Santos-Rosa, H., Schneider, R., Bannister, A. J., Sherriff, J., Bernstein, B. E., Emre, N. C. T., … Kouzarides, T.
(2002). Active genes are tri-methylated at K4 of histone H3. Nature, 419, 407–411. doi:10.1038/nature01080
Scharf, A. N. D., & Imhof, A. (2011). Every methyl counts--epigenetic calculus. FEBS Letters, 585, 2001–2007.
doi:10.1016/j.febslet.2010.11.029
Schneider, R., Bannister, A. J., Myers, F. A., Thorne, A. W., Crane-Robinson, C., & Kouzarides, T. (2004). Histone
H3 lysine 4 methylation patterns in higher eukaryotic genes. Nature Cell Biology, 6, 73–77.
doi:10.1038/ncb1076
Seiboth, B., Karimi, R. A., Phatale, P. a, Linke, R., Hartl, L., Sauer, D. G., … Kubicek, C. P. (2012). The putative
protein methyltransferase LAE1 controls cellulase gene expression in Trichoderma reesei. Molecular
Microbiology, 84, 1150–64. doi:10.1111/j.1365-2958.2012.08083.x
Sérandour, A. A., Avner, S., Percevault, F., Demay, F., Bizot, M., Lucchetti-Miganeh, C., … Eeckhoute, J. (2011).
Epigenetic switch involved in activation of pioneer factor FOXA1-dependent enhancers. Genome Research,
21, 555–565. doi:10.1101/gr.111534.110
Shi, Y., Lan, F., Matson, C., Mulligan, P., Whetstine, J. R., Cole, P. A., … Shi, Y. (2004). Histone demethylation
mediated by the nuclear amine oxidase homolog LSD1. Cell, 119, 941–953. doi:10.1016/j.cell.2004.12.012
Sims, R. J., Nishioka, K., & Reinberg, D. (2003). Histone lysine methylation: A signature for chromatin function.
Trends in Genetics, 19, 629–639. doi:10.1016/j.tig.2003.09.007

84
Sims, R. J., & Reinberg, D. (2006). Histone H3 Lys 4 methylation: caught in a bind? Genes & Development, 20,
2779–2786. doi:10.1101/gad.1468206
Smith, E., & Shilatifard, A. (2010). The Chromatin Signaling Pathway: Diverse Mechanisms of Recruitment of
Histone-Modifying Enzymes and Varied Biological Outcomes. Molecular Cell.
doi:10.1016/j.molcel.2010.11.031
Smith, K. M., Phatale, P. A., Sullivan, C. M., Pomraning, K. R., & Freitag, M. (2011). Heterochromatin is required
for normal distribution of Neurospora crassa CenH3. Molecular and Cellular Biology, 31, 2528–2542.
doi:10.1128/MCB.01285-10
Stark, R., & Brown, G. (2011). DiffBind: differential binding analysis of ChIP-Seq peak data. R Foundation for
Statistical Computing. Retrieved from
http://bioconductor.org/packages/release/bioc/vignettes/DiffBind/inst/doc/DiffBind.pdf
Strahl, B. D., & Allis, C. D. (2000). The language of covalent histone modifications. Nature, 403, 41–45.
doi:10.1038/47412
Strahl, B. D., Ohba, R., Cook, R. G., & Allis, C. D. (1999). Methylation of histone H3 at lysine 4 is highly
conserved and correlates with transcriptionally active nuclei in Tetrahymena. Proceedings of the National
Academy of Sciences of the United States of America, 96, 14967–14972. doi:10.1073/pnas.96.26.14967
Sullivan, B. A., & Karpen, G. H. (2004). Centromeric chromatin exhibits a histone modification pattern that is
distinct from both euchromatin and heterochromatin. Nature Structural & Molecular Biology, 11, 1076–1083.
doi:10.1038/nsmb845
Tamaru, H., & Selker, E. U. (2001). A histone H3 methyltransferase controls DNA methylation in Neurospora
crassa. Nature, 414, 277–283. doi:10.1038/35104508
Tang, J., Cho, N. W., Cui, G., Manion, E. M., Shanbhag, N. M., Botuyan, M. V., … Greenberg, R. a. (2013).
Acetylation limits 53BP1 association with damaged chromatin to promote homologous recombination. Nature
Structural & Molecular Biology, 20, 317–25. doi:10.1038/nsmb.2499
Taverna, S. D., Li, H., Ruthenburg, A. J., Allis, C. D., & Patel, D. J. (2007). How chromatin-binding modules
interpret histone modifications: lessons from professional pocket pickers. Nature Structural & Molecular
Biology, 14, 1025–1040. doi:10.1038/nsmb1338
Taylor, S. W., Fahy, E., Zhang, B., Glenn, G. M., Warnock, D. E., Wiley, S., … Ghosh, S. S. (2003).
Characterization of the human heart mitochondrial proteome. Nature Biotechnology, 21, 281–286.
doi:10.1038/nbt793
The ENCODE Project Consortium 2004. (ENCyclopedia Of DNA Elements). (2004). Science (New York, N.Y.),
306, 636–640.
The ENCODE Project Consortium 2011. A user’s guide to the encyclopedia of DNA elements (ENCODE). (n.d.).
PLoS Biology, 9(e1001046).
Thornton, J. L., Westfield, G. H., Takahashi, Y.-H., Cook, M., Gao, X., Woodfin, A. R., … Shilatifard, A. (2014).
Context dependency of Set1/COMPASS-mediated histone H3 Lys4 trimethylation. Genes & Development,
28(2), 115–20. doi:10.1101/gad.232215.113
Thurtle, D. M., & Rine, J. (2014). The molecular topography of silenced chromatin in Saccharomyces cerevisiae.
Genes & Development, 28, 245–258. doi:10.1101/gad.230532.113
Trewick, S. C., McLaughlin, P. J., & Allshire, R. C. (2005). Methylation: lost in hydroxylation? EMBO Reports, 6,
315–320. doi:10.1038/sj.embor.7400379
Tu, S., Teng, Y.-C., Yuan, C., Wu, Y.-T., Chan, M.-Y., Cheng, A.-N., … Tsai, M.-D. (2008). The ARID domain of
the H3K4 demethylase RBP2 binds to a DNA CCGCCC motif. Nature Structural & Molecular Biology, 15,
419–421. doi:10.1038/nsmb.1400
Valouev, A., Johnson, D. S., Sundquist, A., Medina, C., Anton, E., Batzoglou, S., … Sidow, A. (2008). Genome-
wide analysis of transcription factor binding sites based on ChIP-Seq data. Nature Methods, 5, 829–834.
doi:10.1038/nmeth.1246
Van Dijk, E. L., Chen, C. L., d’Aubenton-Carafa, Y., Gourvennec, S., Kwapisz, M., Roche, V., … Morillon, A.
(2011). XUTs are a class of Xrn1-sensitive antisense regulatory non-coding RNA in yeast. Nature, 475, 114–
117. doi:10.1038/nature10118
Van Dijk, K., Ding, Y., Malkaram, S., Riethoven, J.-J. M., Liu, R., Yang, J., … Fromm, M. (2010). Dynamic
changes in genome-wide histone H3 lysine 4 methylation patterns in response to dehydration stress in
Arabidopsis thaliana. BMC Plant Biology, 10, 238. doi:10.1186/1471-2229-10-238
Vermeulen, M., Mulder, K. W., Denissov, S., Pijnappel, W. W. M. P., van Schaik, F. M. A., Varier, R. A., …
Timmers, H. T. M. (2007). Selective Anchoring of TFIID to Nucleosomes by Trimethylation of Histone H3
Lysine 4. Cell, 131, 58–69. doi:10.1016/j.cell.2007.08.016

85
Vermeulen, M., & Timmers, H. M. (2010). Grasping trimethylation of histone H3 at lysine 4. Epigenomics.
doi:10.2217/epi.10.11
Vongsangnak, W., Salazar, M., Hansen, K., & Nielsen, J. (2009). Genome-wide analysis of maltose utilization and
regulation in aspergilli. Microbiology, 155, 3893–3902. doi:10.1099/mic.0.031104-0
Waddington, C. H. (1942). The epigenotype. Endeavour, 18–20. doi:10.1093/ije/dyr184
Wasiak, S., Legendre-Guillemin, V., Puertollano, R., Blondeau, F., Girard, M., de Heuvel, E., … McPherson, P. S.
(2002). Enthoprotin: a novel clathrin-associated protein identified through subcellular proteomics. The Journal
of Cell Biology, 158, 855–862. doi:10.1083/jcb.200205078
Weiner, A., Chen, H. V., Liu, C. L., Rahat, A., Klien, A., Soares, L., … Rando, O. J. (2012). Systematic dissection
of roles for chromatin regulators in a yeast stress response. PLoS Biology, 10, 17.
doi:10.1371/journal.pbio.1001369
Wiemann, P., Sieber, C. M. K., von Bargen, K. W., Studt, L., Niehaus, E. M., Espino, J. J., … Tudzynski, B. (2013).
Deciphering the Cryptic Genome: Genome-wide Analyses of the Rice Pathogen Fusarium fujikuroi Reveal
Complex Regulation of Secondary Metabolism and Novel Metabolites. PLoS Pathogens, 9.
doi:10.1371/journal.ppat.1003475
Wilbanks, E. G., & Facciotti, M. T. (2010). Evaluation of algorithm performance in ChIP-seq peak detection. PLoS
ONE, 5. doi:10.1371/journal.pone.0011471
Wu, T. D., & Nacu, S. (2010). Fast and SNP-tolerant detection of complex variants and splicing in short reads.
Bioinformatics (Oxford, England), 26, 873–881. doi:10.1093/bioinformatics/btq057
Xu, H., Handoko, L., Wei, X., Ye, C., Sheng, J., Wei, C.-L., … Sung, W.-K. (2010). A signal-noise model for
significance analysis of ChIP-seq with negative control. Bioinformatics (Oxford, England), 26, 1199–1204.
doi:10.1093/bioinformatics/btq128
Yuan, C., Matthews, A. G. W., Jin, Y., Chen, C. F., Brad, A., Ohsumi, T. K., … Oettinger, M. A. (2012). NIH
Public Access, 1(2), 83–90. doi:10.1016/j.celrep.2011.12.008.Histone
Yuan, X.-L., van der Kaaij, R. M., van den Hondel, C. A. M. J. J., Punt, P. J., van der Maarel, M. J. E. C.,
Dijkhuizen, L., & Ram, A. F. J. (2008). Aspergillus niger genome-wide analysis reveals a large number of
novel alpha-glucan acting enzymes with unexpected expression profiles. Molecular Genetics and Genomics : MGG, 279, 545–561. doi:10.1007/s00438-008-0332-7
Zang, C., Schones, D. E., Zeng, C., Cui, K., Zhao, K., & Peng, W. (2009). A clustering approach for identification
of enriched domains from histone modification ChIP-Seq data. Bioinformatics (Oxford, England), 25(15),
1952–8. doi:10.1093/bioinformatics/btp340
Zhang, Y., Liu, T., Meyer, C. A., Eeckhoute, J., Johnson, D. S., Bernstein, B. E., … Liu, X. S. (2008). Model-based
analysis of ChIP-Seq (MACS). Genome Biology, 9, R137. doi:10.1186/gb-2008-9-9-r137
Zong, W., Zhong, X., You, J., & Xiong, L. (2013). Genome-wide profiling of histone H3K4-tri-methylation and
gene expression in rice under drought stress. Plant Molecular Biology, 81(1-2), 175–88. doi:10.1007/s11103-
012-9990-2