genome-wide analysis of tandem repeats in plants and green
TRANSCRIPT
INVESTIGATION
Genome-Wide Analysis of Tandem Repeats in Plantsand Green AlgaeZhixin Zhao,* Cheng Guo,* Sreeskandarajan Sutharzan,* Pei Li,*,† Craig S. Echt,‡ Jie Zhang,§
and Chun Liang*,1
*Department of Botany, Miami University, Oxford, Ohio 45056, †Department of Automation, Xiamen University, Xiamen,361005, China, ‡Southern Research Station, USDA Forest Service, Saucier, Mississippi 39574, and §State Key Laboratoryfor Biology of Plant Diseases and Insect Pests, Institute of Plant Protection, Chinese Academy of Agricultural Science,Beijing 100193, China
ABSTRACT Tandem repeats (TRs) extensively exist in the genomes of prokaryotes and eukaryotes. Basedon the sequenced genomes and gene annotations of 31 plant and algal species in Phytozome version 8.0(http://www.phytozome.net/), we examined TRs in a genome-wide scale, characterized their distributionsand motif features, and explored their putative biological functions. Among the 31 species, no significantcorrelation was detected between the TR density and genome size. Interestingly, green alga Chlamydo-monas reinhardtii (42,059 bp/Mbp) and castor bean Ricinus communis (55,454 bp/Mbp) showed muchhigher TR densities than all other species (13,209 bp/Mbp on average). In the 29 land plants, including22 dicots, 5 monocots, and 2 bryophytes, 59-UTR and upstream intergenic 200-nt (UI200) regions had thefirst and second highest TR densities, whereas in the two green algae (C. reinhardtii and Volvox carteri) thefirst and second highest densities were found in intron and coding sequence (CDS) regions, respectively. InCDS regions, trinucleotide and hexanucleotide motifs were those most frequently represented in all spe-cies. In intron regions, especially in the two green algae, significantly more TRs were detected near theintron–exon junctions. Within intergenic regions in dicots and monocots, more TRs were found near boththe 59 and 39 ends of genes. GO annotation in two green algae revealed that the genes with TRs in intronsare significantly involved in transcriptional and translational processing. As the first systematic examinationof TRs in plant and green algal genomes, our study showed that TRs displayed nonrandom distribution forboth intragenic and intergenic regions, suggesting that they have potential roles in transcriptional or trans-lational regulation in plants and green algae.
KEYWORDS
tandem repeatsSSRgenomesplantsgreen algae
Tandem repeats (TRs) are DNA sequence motifs that contain at leasttwo adjacent repeating units. They extensively exist in prokaryotes andeukaryotes (Tautz and Renz 1984; Tóth et al. 2000; Sharma et al.2007; Sureshkumar et al. 2009; Christians and Watt 2009; Orsi et al.2010; Roorkiwal and Sharma 2011). Generally, two categories aregiven to distinguish TRs based on different repeat unit size: micro-
satellites [unit size: 1–6 or 1–10 bp; also known as simple sequencerepeats (SSR)] and minisatellites (unit size: 10–60 or 10–100 bp)(Mayer et al. 2010; Gemayel et al. 2012). In plants and animals,SSRs are widely detected in both mRNAs (cDNA/ESTs) and ge-nomes (Tautz and Renz 1984; Jurka and Pethiyagoda 1995; Tóthet al. 2000; Subramanian et al. 2003; Fujimori et al. 2003; Sharmaet al. 2007; Gemayel et al. 2010). For example, through investigatingSSRs (repeat unit size: 1–6 bp) using EST databases in 11 plant andgreen algal species, Victoria et al. (2011) found that dimer motifshave higher frequencies in green algae, bryophytes, and ferns,whereas trimer motifs are more frequent in flowering plants. Differ-ent from nuclear genomes, mitochondrial genomes appear to prefermononucleotide repeats (A/T) first and dinucleotide repeats (AT)next in 16 investigated plant species (Kuntal and Sharma 2011).Although most research articles focus on SSRs, Mayer et al. (2010)found that in coding regions densities of longer TRs (unit size: 7–50bp) in arthropoda Daphnia pulex are much higher than shorter TRs
Copyright © 2014 Zhao et al.doi: 10.1534/g3.113.008524Manuscript received September 13, 2013; accepted for publication October 26,2013; published Early Online November 5, 2013.This is an open-access article distributed under the terms of the CreativeCommons Attribution Unported License (http://creativecommons.org/licenses/by/3.0/), which permits unrestricted use, distribution, and reproduction in anymedium, provided the original work is properly cited.Supporting information is available online at http://www.g3journal.org/lookup/suppl/doi:10.1534/g3.113.008524/-/DC11Corresponding author: Department of Botany, Miami University, Oxford, OH45056. E-mail: [email protected]
Volume 4 | January 2014 | 67

(unit size: 1–6 bp) and suggest the importance of including longerTRs in comparative analyses.
TRs are extremely mutable, with mutation rates that are muchhigher than other parts of the genome (Gemayel et al. 2010). Mostmutations in TRs are caused by the changes in the number of therepeating units, not by point mutations (Verstrepen et al. 2005;Gemayel et al. 2010, 2012). In humans, such repeat number variantsare related to some serious diseases or defects, such as fragile X syn-drome (Verkerk et al. 1991), spinobulbar muscular atrophy (La Spadaet al. 1991), and Huntington disease (Walker 2007). In plants, thewell-known Bur-0 IIL1 defect in Arabidopsis thaliana that generatesa detrimental phenotype is caused by the expansion of triplet TTC/GAA in the intron of IIL1 gene (Sureshkumar et al. 2009).
Through investigating TR density variation in a few plant andanimal species, it has been concluded that there is no significantrelationship between genome size and TR density in plants andanimals (da Maia et al. 2009; Mayer et al. 2010). Based on EST datafrom two green algae, two mosses, a fern, a fern palm, the ginkgo tree,two conifers, 10 dicots, and five monocots, SSRs are found to havehighly variable abundance among different species (von Stackelberget al. 2006). Recently, a comparative analysis for 282 species includingplants and animals shows no sequence conservation in centromereTRs (Melters et al. 2013). Moreover, TRs show a nonrandom distri-bution in many genomes and are often located within genes andregulatory regions (Streelman and Kocher 2002; Rockman and Wray2002; Li et al. 2002; Martin et al. 2005; Legendre et al. 2007; Vinceset al. 2009). Variable TRs are abundant in genes that are involved intranscriptional regulation and morphogenesis in humans (Legendreet al. 2007). The 59-UTRs have higher TR density among differentgenic regions in plants (Morgante et al. 2002; Fujimori et al. 2003;Zhang et al. 2006). In A. thaliana, for example, 59-UTRs have thehighest TR density and the abundant motifs are dinucleotide CT/GAand trinucleotide CTT/GAA (Zhang et al. 2006). In the yeast Saccha-romyces cerevisiae, �25% genes possess TRs in their promoters, andthe variations of repeat unit number can cause changes in gene ex-pression and local nucleosome positioning (Vinces et al. 2009).Among coding sequences (CDS), the dominant repeat unit sizes arethree-fold nucleotides (e.g., trinucleotides and hexanucleotides) be-cause it is assumed that such motifs are selected to avoid frame shiftmutations that would affect translation (Legendre et al. 2007; Metzgaret al. 2002). In 42 fully sequenced prokaryotic genomes, the TR dis-tributions in CDS are biased toward CDS termini, yielding U-shapeTR density curves across the span of the CDS (Lin and Kussell 2011).
So far, no systematic research regarding TR variation andcharacterization has been conducted on a genome-wide scale inplants. The rapid advance of sequencing technologies has madea number of plant and algal genomes available to investigate thecharacteristics and distributions of TRs in both intragenic (i.e., 59-UTR, CDS, intron, and 39-UTR) and intergenic regions. Using ge-nome sequence data from 31 species (i.e., 29 land plants and 2 greenalgae) released in Phytozome version 8.0 (http://www.phytozome.net/),we detected and characterized TRs and examined their distributionsand variations in intragenic and intergenic regions. This research willfacilitate our understanding of TRs and their potential biological func-tions in transcription or translation in land plants and green algae.
MATERIALS AND METHODS
Collecting genomes and annotation dataThe assembled genome sequences (including chromosomes, mito-chondria, and chloroplasts) and gene annotations of the 31 species
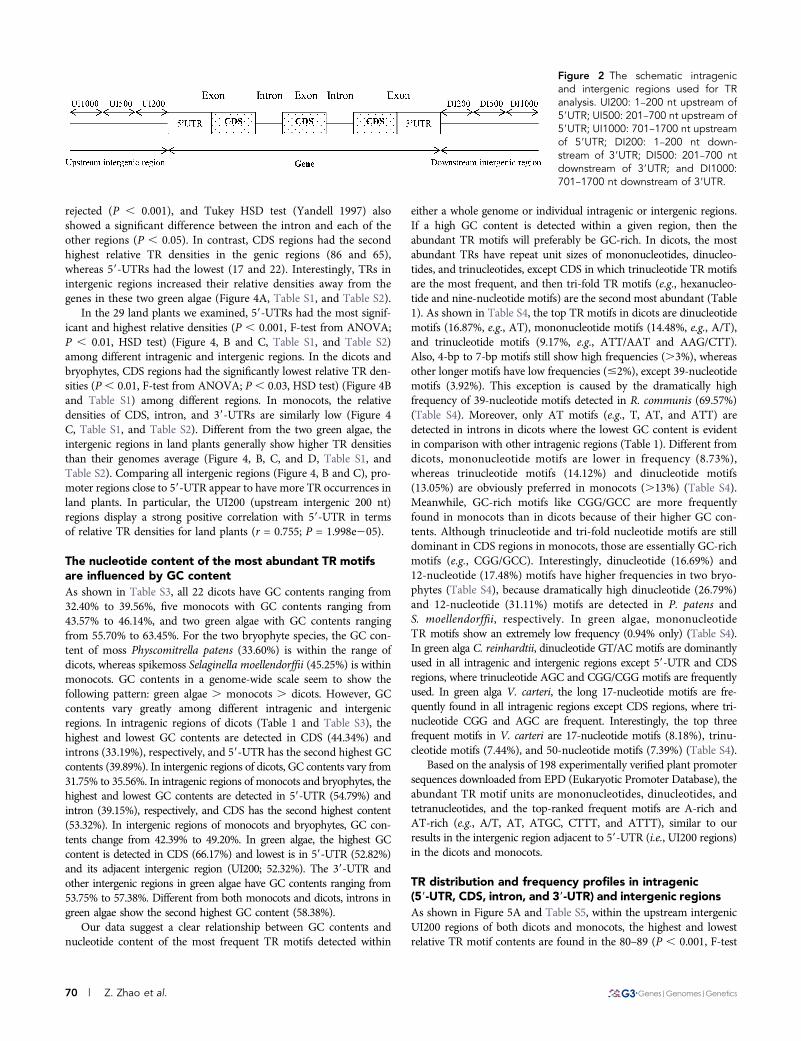
were downloaded from Phytozome version 8.0 (http://www.phytozome.net) (Figure 1 for the species list). Only valid nucleotides (A, T, G, andC) were counted when analyzing the sequences. For each species, thenucleotide sequences from whole genome were used for genome-wideTR detection and density calculation. According to the data extractionschema shown in Figure 2, individual intergenic and intragenic regionswere also extracted and used for TR analysis. In Phytozome version 8.0,UTR annotations, including 59-UTRs and 39-UTRs, were not availablefor Carica papaya, Brassica rapa, Linum usitatissimum, and Malusdomestica. Therefore, the UTR regions were not examined individuallyfor these four species. However, the upstream and downstream inter-genic regions (e.g., UI1000, DI1000) were still examined based on therelevant gene start and end positions annotated for these four species(Figure 2). Perl (Practical Extraction and Report Language) was used towrite codes to extract sequences, initiate TR detection, and parse resultsfor downstream data analysis.
TR detection and analysisFor both perfect and imperfect TR detection, we utilized a tandemrepeat search tool for complete genomes (Phobos version 3.3.12)(Mayer et al. 2010). Considering the computational resource andexecution time required for processing all 31 genomes, we adopted1–50 bp as the repeat unit size, similar to what has been utilizedpreviously by Mayer et al. (2010). The minimum length of thedetected repeats needed to be at least 12 nt, and the minimum repeatalignment score for imperfect repeats was set as 12. As for the re-cursive TRs, only one motif was selected based on alphabetical order-ing to be representative (Jurka and Pethiyagoda 1995). For example,AAG, AGA, and GAA were the repeat units of (AAG)n, but onlyAAG was selected to represent the repeat motif. Moreover, the TRmotifs and their corresponding reverse complement motifs (e.g., AAGand CTT motifs) were investigated separately. This was because genesare annotated in different strands (i.e., + vs. 2), there are plenty ofsense and anti-sense transcripts reported recently for many genes (Guet al. 2009; Kerin et al. 2012), emphasizing the importance of geneorientation in genome annotations, and a similar strategy had beenadopted by others (Zhang et al. 2006; Kuntal and Sharma 2011).
TR density was defined by base pairs per megabase pairs (bp/Mbp), namely the length of detected TRs out of the total length of thesequences for detection. To enable comparison among differentspecies or different regions (e.g., intragenic vs. intergenic regions)within the same species, we normalized the TR densities and com-puted the relative density: for each species, the whole genome den-sity was defined as 100, and then the relative density for a specificregion was computed by the following: (TR density for a given re-gion)/(the whole genome density). To investigate the TR distributionprofiles within a given region, the sequence length of a specific re-gion was first normalized to a 0–99 scale that contained 10 intervalsof the same size (e.g., 0–9, 10–19, . . ., 90–99). The motif percentageswere then calculated for the 10 intervals based on their occurrences.In this way, the same intergenic or intragenic regions with differentsequence lengths can be compared.
The 198 experimentally verified plant promoter sequences, whichwere extracted from2499 to 100 around the transcription start site (0position in the coordinate), were downloaded from EPD (EukaryoticPromoter Database; http://epd.vital-it.ch/seq_download.php#) (Périeret al. 2000). These promoter sequences were also scanned for perfectand imperfect TRs.
Based on Chlamydomonas reinhardtii GO annotation (version 4.0)from JGI (http://genome.jgi-psf.org/Chlre4/Chlre4.download.ftp.html),GOEAST (Gene Ontology Enrichment Analysis Software Toolkit)
68 | Z. Zhao et al.

(Zheng and Wang 2008) was used to detect the significance of GOterms for the genes with TRs in introns. GO annotations in Volvoxcarteri were analyzed by annot8r (Schmid and Blaxter 2008) andranked based on E-value. Pearson correlation (r) test statistics wereconducted using Minitab 16 (www.minitab.com). The figures in thebox plot were drawn using R (http://www.r-project.org/). Alsothrough R, both ANOVA F-test and Tukey honestly significantdifference (HSD) test (Yandell 1997) were performed for signifi-cance tests.
RESULTS
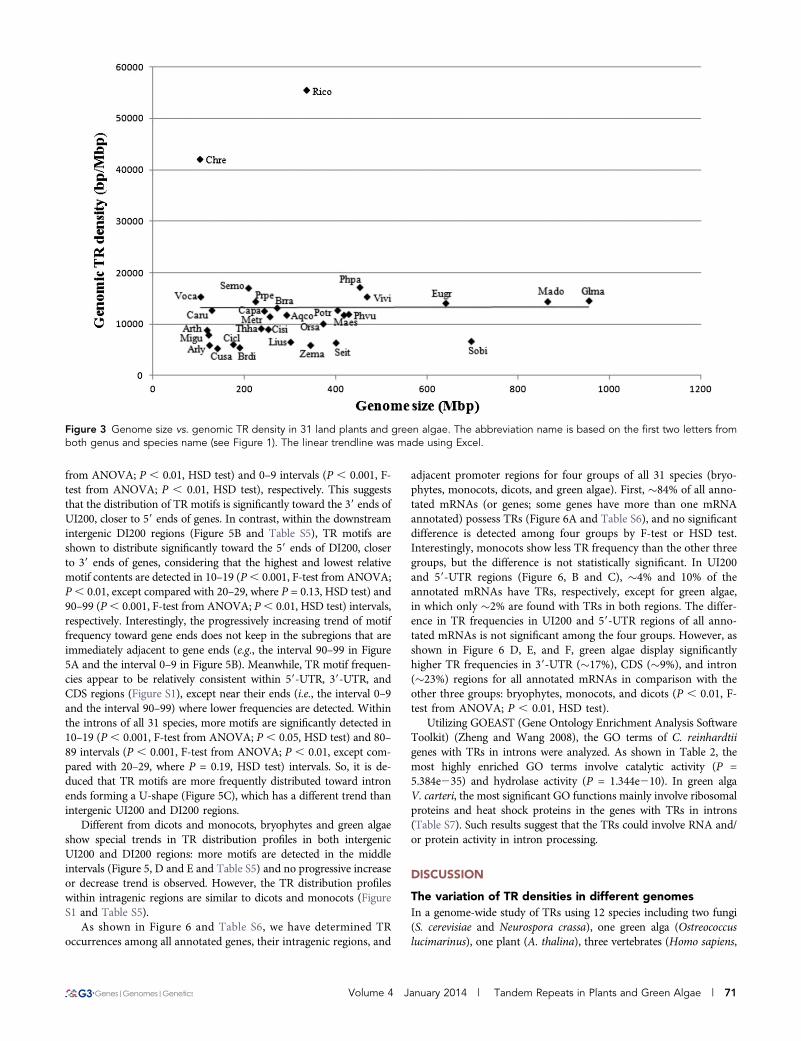
The TR density variation among different genome sizesThe species that we examined span a large evolutionary distance,including two green algae, two mosses, five monocots, and 22 dicots(Figure 1). As shown in Figure 3, there was no correlation betweengenome sizes and TR densities (r = 0.010; P = 0.957). The mean TRdensity at the whole-genome level was 13,209 bp/Mbp (SD = 10,309)among all tested species, except in C. reinhardtii (42,059 bp/Mbp) andRicinus communis (55,454 bp/Mbp), which showed dramaticallyhigher TR densities than the other species. Excluding these two out-liers (C. reinhardtii and R. communis), we still cannot find a significant
correlation between genome sizes and TR densities among theremaining species (r = 0.311; P = 0.101) (Figure 3).
The TR density variation in intragenic andintergenic regionsSequences from functionally different intragenic regions (i.e., 59-UTR,CDS, intron and 39-UTR) and progressively flanking upstream (i.e.,UI200, UI500, UI1000) and downstream (i.e., DI200, DI500, andDI1000) intergenic regions were analyzed for TRs (Figure 2). UTRannotations were not available from Phytozome version 8.0 for fourspecies (C. papaya, B. rapa, L. usitatissimum, and M. domestica);therefore, 59-UTR and 39-UTR were analyzed only for the remaining27 species.
We found that TRs showed clearly localization preferences amongdifferent intragenic and intergenic regions. In the two green algae, C.reinhardtii and V. carteri (Figure 4A and Supporting Information,Table S1, and Table S2), intron regions have the highest relative TRdensities of 162 and 120, respectively, which are 1.62-times and 1.20-times of the relevant whole-genome TR densities (the whole-genomerelative TR density is defined as 100 for each species). Based on F-testfrom ANOVA, the null hypothesis that all tested intergenic and in-tragenic regions have the equal mean relative TR densities can be
Figure 1 The phylogenic tree of 31species showed in Phytozome version8.0 (http://www.phytozome.net). Theabbreviated names (the first two lettersfrom both genus and species name arecombined) and common names arelisted in parentheses.
Volume 4 January 2014 | Tandem Repeats in Plants and Green Algae | 69
rejected (P , 0.001), and Tukey HSD test (Yandell 1997) alsoshowed a significant difference between the intron and each of theother regions (P , 0.05). In contrast, CDS regions had the secondhighest relative TR densities in the genic regions (86 and 65),whereas 59-UTRs had the lowest (17 and 22). Interestingly, TRs inintergenic regions increased their relative densities away from thegenes in these two green algae (Figure 4A, Table S1, and Table S2).
In the 29 land plants we examined, 59-UTRs had the most signif-icant and highest relative densities (P , 0.001, F-test from ANOVA;P , 0.01, HSD test) (Figure 4, B and C, Table S1, and Table S2)among different intragenic and intergenic regions. In the dicots andbryophytes, CDS regions had the significantly lowest relative TR den-sities (P , 0.01, F-test from ANOVA; P , 0.03, HSD test) (Figure 4Band Table S1) among different regions. In monocots, the relativedensities of CDS, intron, and 39-UTRs are similarly low (Figure 4C, Table S1, and Table S2). Different from the two green algae, theintergenic regions in land plants generally show higher TR densitiesthan their genomes average (Figure 4, B, C, and D, Table S1, andTable S2). Comparing all intergenic regions (Figure 4, B and C), pro-moter regions close to 59-UTR appear to have more TR occurrences inland plants. In particular, the UI200 (upstream intergenic 200 nt)regions display a strong positive correlation with 59-UTR in termsof relative TR densities for land plants (r = 0.755; P = 1.998e205).
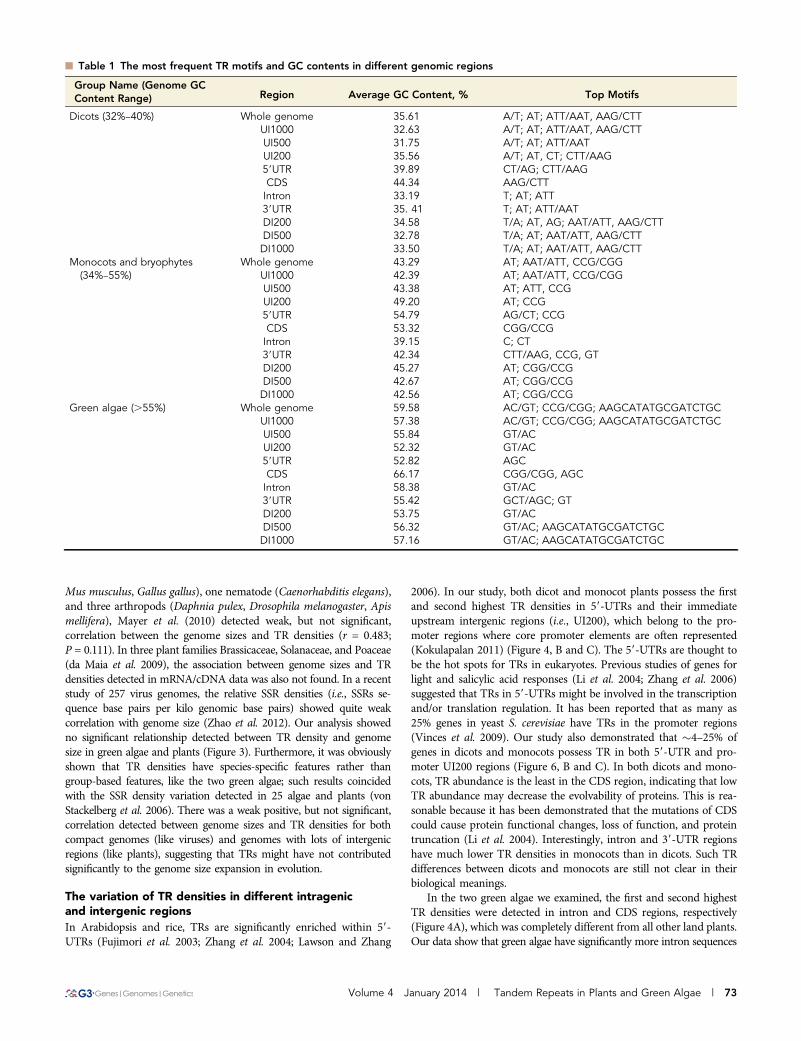
The nucleotide content of the most abundant TR motifsare influenced by GC contentAs shown in Table S3, all 22 dicots have GC contents ranging from32.40% to 39.56%, five monocots with GC contents ranging from43.57% to 46.14%, and two green algae with GC contents rangingfrom 55.70% to 63.45%. For the two bryophyte species, the GC con-tent of moss Physcomitrella patens (33.60%) is within the range ofdicots, whereas spikemoss Selaginella moellendorffii (45.25%) is withinmonocots. GC contents in a genome-wide scale seem to show thefollowing pattern: green algae . monocots . dicots. However, GCcontents vary greatly among different intragenic and intergenicregions. In intragenic regions of dicots (Table 1 and Table S3), thehighest and lowest GC contents are detected in CDS (44.34%) andintrons (33.19%), respectively, and 59-UTR has the second highest GCcontents (39.89%). In intergenic regions of dicots, GC contents vary from31.75% to 35.56%. In intragenic regions of monocots and bryophytes, thehighest and lowest GC contents are detected in 59-UTR (54.79%) andintron (39.15%), respectively, and CDS has the second highest content(53.32%). In intergenic regions of monocots and bryophytes, GC con-tents change from 42.39% to 49.20%. In green algae, the highest GCcontent is detected in CDS (66.17%) and lowest is in 59-UTR (52.82%)and its adjacent intergenic region (UI200; 52.32%). The 39-UTR andother intergenic regions in green algae have GC contents ranging from53.75% to 57.38%. Different from both monocots and dicots, introns ingreen algae show the second highest GC content (58.38%).
Our data suggest a clear relationship between GC contents andnucleotide content of the most frequent TR motifs detected within
either a whole genome or individual intragenic or intergenic regions.If a high GC content is detected within a given region, then theabundant TR motifs will preferably be GC-rich. In dicots, the mostabundant TRs have repeat unit sizes of mononucleotides, dinucleo-tides, and trinucleotides, except CDS in which trinucleotide TR motifsare the most frequent, and then tri-fold TR motifs (e.g., hexanucleo-tide and nine-nucleotide motifs) are the second most abundant (Table1). As shown in Table S4, the top TR motifs in dicots are dinucleotidemotifs (16.87%, e.g., AT), mononucleotide motifs (14.48%, e.g., A/T),and trinucleotide motifs (9.17%, e.g., ATT/AAT and AAG/CTT).Also, 4-bp to 7-bp motifs still show high frequencies (.3%), whereasother longer motifs have low frequencies (#2%), except 39-nucleotidemotifs (3.92%). This exception is caused by the dramatically highfrequency of 39-nucleotide motifs detected in R. communis (69.57%)(Table S4). Moreover, only AT motifs (e.g., T, AT, and ATT) aredetected in introns in dicots where the lowest GC content is evidentin comparison with other intragenic regions (Table 1). Different fromdicots, mononucleotide motifs are lower in frequency (8.73%),whereas trinucleotide motifs (14.12%) and dinucleotide motifs(13.05%) are obviously preferred in monocots (.13%) (Table S4).Meanwhile, GC-rich motifs like CGG/GCC are more frequentlyfound in monocots than in dicots because of their higher GC con-tents. Although trinucleotide and tri-fold nucleotide motifs are stilldominant in CDS regions in monocots, those are essentially GC-richmotifs (e.g., CGG/GCC). Interestingly, dinucleotide (16.69%) and12-nucleotide (17.48%) motifs have higher frequencies in two bryo-phytes (Table S4), because dramatically high dinucleotide (26.79%)and 12-nucleotide (31.11%) motifs are detected in P. patens andS. moellendorffii, respectively. In green algae, mononucleotideTR motifs show an extremely low frequency (0.94% only) (Table S4).In green alga C. reinhardtii, dinucleotide GT/AC motifs are dominantlyused in all intragenic and intergenic regions except 59-UTR and CDSregions, where trinucleotide AGC and CGG/CGG motifs are frequentlyused. In green alga V. carteri, the long 17-nucleotide motifs are fre-quently found in all intragenic regions except CDS regions, where tri-nucleotide CGG and AGC are frequent. Interestingly, the top threefrequent motifs in V. carteri are 17-nucleotide motifs (8.18%), trinu-cleotide motifs (7.44%), and 50-nucleotide motifs (7.39%) (Table S4).
Based on the analysis of 198 experimentally verified plant promotersequences downloaded from EPD (Eukaryotic Promoter Database), theabundant TR motif units are mononucleotides, dinucleotides, andtetranucleotides, and the top-ranked frequent motifs are A-rich andAT-rich (e.g., A/T, AT, ATGC, CTTT, and ATTT), similar to ourresults in the intergenic region adjacent to 59-UTR (i.e., UI200 regions)in the dicots and monocots.
TR distribution and frequency profiles in intragenic(59-UTR, CDS, intron, and 39-UTR) and intergenic regionsAs shown in Figure 5A and Table S5, within the upstream intergenicUI200 regions of both dicots and monocots, the highest and lowestrelative TR motif contents are found in the 80–89 (P , 0.001, F-test
Figure 2 The schematic intragenicand intergenic regions used for TRanalysis. UI200: 1–200 nt upstream of59UTR; UI500: 201–700 nt upstream of59UTR; UI1000: 701–1700 nt upstreamof 59UTR; DI200: 1–200 nt down-stream of 39UTR; DI500: 201–700 ntdownstream of 39UTR; and DI1000:701–1700 nt downstream of 39UTR.
70 | Z. Zhao et al.
from ANOVA; P , 0.01, HSD test) and 0–9 intervals (P , 0.001, F-test from ANOVA; P , 0.01, HSD test), respectively. This suggeststhat the distribution of TR motifs is significantly toward the 39 ends ofUI200, closer to 59 ends of genes. In contrast, within the downstreamintergenic DI200 regions (Figure 5B and Table S5), TR motifs areshown to distribute significantly toward the 59 ends of DI200, closerto 39 ends of genes, considering that the highest and lowest relativemotif contents are detected in 10–19 (P, 0.001, F-test from ANOVA;P, 0.01, except compared with 20–29, where P = 0.13, HSD test) and90–99 (P, 0.001, F-test from ANOVA; P, 0.01, HSD test) intervals,respectively. Interestingly, the progressively increasing trend of motiffrequency toward gene ends does not keep in the subregions that areimmediately adjacent to gene ends (e.g., the interval 90–99 in Figure5A and the interval 0–9 in Figure 5B). Meanwhile, TR motif frequen-cies appear to be relatively consistent within 59-UTR, 39-UTR, andCDS regions (Figure S1), except near their ends (i.e., the interval 0–9and the interval 90–99) where lower frequencies are detected. Withinthe introns of all 31 species, more motifs are significantly detected in10–19 (P , 0.001, F-test from ANOVA; P , 0.05, HSD test) and 80–89 intervals (P , 0.001, F-test from ANOVA; P , 0.01, except com-pared with 20–29, where P = 0.19, HSD test) intervals. So, it is de-duced that TR motifs are more frequently distributed toward intronends forming a U-shape (Figure 5C), which has a different trend thanintergenic UI200 and DI200 regions.
Different from dicots and monocots, bryophytes and green algaeshow special trends in TR distribution profiles in both intergenicUI200 and DI200 regions: more motifs are detected in the middleintervals (Figure 5, D and E and Table S5) and no progressive increaseor decrease trend is observed. However, the TR distribution profileswithin intragenic regions are similar to dicots and monocots (FigureS1 and Table S5).
As shown in Figure 6 and Table S6, we have determined TRoccurrences among all annotated genes, their intragenic regions, and
adjacent promoter regions for four groups of all 31 species (bryo-phytes, monocots, dicots, and green algae). First, �84% of all anno-tated mRNAs (or genes; some genes have more than one mRNAannotated) possess TRs (Figure 6A and Table S6), and no significantdifference is detected among four groups by F-test or HSD test.Interestingly, monocots show less TR frequency than the other threegroups, but the difference is not statistically significant. In UI200and 59-UTR regions (Figure 6, B and C), �4% and 10% of theannotated mRNAs have TRs, respectively, except for green algae,in which only �2% are found with TRs in both regions. The differ-ence in TR frequencies in UI200 and 59-UTR regions of all anno-tated mRNAs is not significant among the four groups. However, asshown in Figure 6 D, E, and F, green algae display significantlyhigher TR frequencies in 39-UTR (�17%), CDS (�9%), and intron(�23%) regions for all annotated mRNAs in comparison with theother three groups: bryophytes, monocots, and dicots (P , 0.01, F-test from ANOVA; P , 0.01, HSD test).
Utilizing GOEAST (Gene Ontology Enrichment Analysis SoftwareToolkit) (Zheng and Wang 2008), the GO terms of C. reinhardtiigenes with TRs in introns were analyzed. As shown in Table 2, themost highly enriched GO terms involve catalytic activity (P =5.384e235) and hydrolase activity (P = 1.344e210). In green algaV. carteri, the most significant GO functions mainly involve ribosomalproteins and heat shock proteins in the genes with TRs in introns(Table S7). Such results suggest that the TRs could involve RNA and/or protein activity in intron processing.
DISCUSSION
The variation of TR densities in different genomesIn a genome-wide study of TRs using 12 species including two fungi(S. cerevisiae and Neurospora crassa), one green alga (Ostreococcuslucimarinus), one plant (A. thalina), three vertebrates (Homo sapiens,
Figure 3 Genome size vs. genomic TR density in 31 land plants and green algae. The abbreviation name is based on the first two letters fromboth genus and species name (see Figure 1). The linear trendline was made using Excel.
Volume 4 January 2014 | Tandem Repeats in Plants and Green Algae | 71

Figure 4 The relative TR densities in different intragenic and intergenic regions. (A) Two green algae. (B) Twenty species including dicots andbryophytes. (C) Five monocot land plants. (D) Four land plant species without UTR annotations.
72 | Z. Zhao et al.
Mus musculus, Gallus gallus), one nematode (Caenorhabditis elegans),and three arthropods (Daphnia pulex, Drosophila melanogaster, Apismellifera), Mayer et al. (2010) detected weak, but not significant,correlation between the genome sizes and TR densities (r = 0.483;P = 0.111). In three plant families Brassicaceae, Solanaceae, and Poaceae(da Maia et al. 2009), the association between genome sizes and TRdensities detected in mRNA/cDNA data was also not found. In a recentstudy of 257 virus genomes, the relative SSR densities (i.e., SSRs se-quence base pairs per kilo genomic base pairs) showed quite weakcorrelation with genome size (Zhao et al. 2012). Our analysis showedno significant relationship detected between TR density and genomesize in green algae and plants (Figure 3). Furthermore, it was obviouslyshown that TR densities have species-specific features rather thangroup-based features, like the two green algae; such results coincidedwith the SSR density variation detected in 25 algae and plants (vonStackelberg et al. 2006). There was a weak positive, but not significant,correlation detected between genome sizes and TR densities for bothcompact genomes (like viruses) and genomes with lots of intergenicregions (like plants), suggesting that TRs might have not contributedsignificantly to the genome size expansion in evolution.
The variation of TR densities in different intragenicand intergenic regionsIn Arabidopsis and rice, TRs are significantly enriched within 59-UTRs (Fujimori et al. 2003; Zhang et al. 2004; Lawson and Zhang
2006). In our study, both dicot and monocot plants possess the firstand second highest TR densities in 59-UTRs and their immediateupstream intergenic regions (i.e., UI200), which belong to the pro-moter regions where core promoter elements are often represented(Kokulapalan 2011) (Figure 4, B and C). The 59-UTRs are thought tobe the hot spots for TRs in eukaryotes. Previous studies of genes forlight and salicylic acid responses (Li et al. 2004; Zhang et al. 2006)suggested that TRs in 59-UTRs might be involved in the transcriptionand/or translation regulation. It has been reported that as many as25% genes in yeast S. cerevisiae have TRs in the promoter regions(Vinces et al. 2009). Our study also demonstrated that �4–25% ofgenes in dicots and monocots possess TR in both 59-UTR and pro-moter UI200 regions (Figure 6, B and C). In both dicots and mono-cots, TR abundance is the least in the CDS region, indicating that lowTR abundance may decrease the evolvability of proteins. This is rea-sonable because it has been demonstrated that the mutations of CDScould cause protein functional changes, loss of function, and proteintruncation (Li et al. 2004). Interestingly, intron and 39-UTR regionshave much lower TR densities in monocots than in dicots. Such TRdifferences between dicots and monocots are still not clear in theirbiological meanings.
In the two green algae we examined, the first and second highestTR densities were detected in intron and CDS regions, respectively(Figure 4A), which was completely different from all other land plants.Our data show that green algae have significantly more intron sequences
n Table 1 The most frequent TR motifs and GC contents in different genomic regions
Group Name (Genome GCContent Range) Region Average GC Content, % Top Motifs
Dicots (32%–40%) Whole genome 35.61 A/T; AT; ATT/AAT, AAG/CTTUI1000 32.63 A/T; AT; ATT/AAT, AAG/CTTUI500 31.75 A/T; AT; ATT/AATUI200 35.56 A/T; AT, CT; CTT/AAG59UTR 39.89 CT/AG; CTT/AAGCDS 44.34 AAG/CTTIntron 33.19 T; AT; ATT39UTR 35. 41 T; AT; ATT/AATDI200 34.58 T/A; AT, AG; AAT/ATT, AAG/CTTDI500 32.78 T/A; AT; AAT/ATT, AAG/CTTDI1000 33.50 T/A; AT; AAT/ATT, AAG/CTT
Monocots and bryophytes(34%–55%)
Whole genome 43.29 AT; AAT/ATT, CCG/CGGUI1000 42.39 AT; AAT/ATT, CCG/CGGUI500 43.38 AT; ATT, CCGUI200 49.20 AT; CCG59UTR 54.79 AG/CT; CCGCDS 53.32 CGG/CCGIntron 39.15 C; CT39UTR 42.34 CTT/AAG, CCG, GTDI200 45.27 AT; CGG/CCGDI500 42.67 AT; CGG/CCGDI1000 42.56 AT; CGG/CCG
Green algae (.55%) Whole genome 59.58 AC/GT; CCG/CGG; AAGCATATGCGATCTGCUI1000 57.38 AC/GT; CCG/CGG; AAGCATATGCGATCTGCUI500 55.84 GT/ACUI200 52.32 GT/AC59UTR 52.82 AGCCDS 66.17 CGG/CGG, AGCIntron 58.38 GT/AC39UTR 55.42 GCT/AGC; GTDI200 53.75 GT/ACDI500 56.32 GT/AC; AAGCATATGCGATCTGCDI1000 57.16 GT/AC; AAGCATATGCGATCTGC
Volume 4 January 2014 | Tandem Repeats in Plants and Green Algae | 73

Figure 5 The relative distribution position of TRs in the intron and intergenic regions. (A) UI200 region in dicots and monocots. (B) DI200 region indicots and monocots. (C) Intron region in the 31 investigated species. (D) UI200 region in bryophytes and green algae. (E) DI200 region inbryophytes and green algae.
74 | Z. Zhao et al.

Figure 6 The percentage of TRs in different intragenic and intergenic regions. (A) mRNAs. (B) UI200 region. (C) 59-UTR region. (D) 39-UTR region.(E) CDS region. (F) Intron region.
Volume 4 January 2014 | Tandem Repeats in Plants and Green Algae | 75

(32.85% and 37.03% in the whole genome in C. reinhardtii and V.carteri) compared with land plants (average, 15.73% ). This mayimply that in green algae the TRs in the intron and CDS regionsare not randomly expanded and could be involved in intron-relatedor CDS-related activities and in RNA processing (e.g., exon splicing).In fact, our GO analysis for C. reinhardtii genes with TRs in intonsshowed that the most significant GO functions were catalytic activityand hydrolase activity (Table 2). Those functions indicate that thegenes with rich TR motifs in their introns could be involved inprotein synthesis and degradation.
The top TR motifs are influenced by GC contentIn our study, the top-ranked TR motifs are CT/AG and CTT/AAG in59-UTR in dicots. This is consistent with the results of Zhang et al.(2006) in which the motifs (CT/AG and CTT/AAG) were preferred in59-UTR in Arabidopsis and acted as regulatory elements for genesinvolved in light and salicylic acid responses (Zhang et al. 2006).Our results also showed that CDS regions are preferentially associatedwith trinucleotides and hexanucleotides motifs, which has beenreported previously by other researchers (Subramanian et al. 2003;Fujimori et al. 2003; Li et al. 2004; Zhang et al. 2006; Mayer et al.2010). It is suggested that there is strong evolutionary pressure againstTR expansion in CDS than in introns to keep stable protein products(Dokholyan et al. 2000). Such a feature can help explain why tri-foldnucleotide motifs (e.g., trinucleotide and hexanucleotide motifs) aremore frequent than others to reduce potential translational frameshifting. Two green algae have the highest TR densities in intronsand the relevant abundant motifs are dinucleotide GT/AC in ourstudy. Canonical splicing signals GT and AG are located at the 59and 39 ends of the intron, respectively. The abundant GT/AC dinu-cleotide TRs in introns might suggest that such repeats may be in-volved in exon splicing or alternative splicing in green algae (Gemayelet al. 2012).
In dicots, most TR motifs contain A and/or T nucleotide(s),whereas both A/T-rich motifs and CCG/CGG motifs are often used inmonocots. However, A/T-rich motifs are rarely detected in the twogreen algae. Therefore, it is clear that the top TR motifs have a strongrelationship with the GC content (Table 1). If there is high GC con-tent, then the most frequent TR motifs prefer to be GC-rich instead ofAT-rich. A similar relationship also has been demonstrated in 11species (including green algae, bryophytes, ferns, gymnosperms, andangiosperms) (Victoria et al. 2011) and amino acid repeats in 10angiosperms (Zhou et al. 2011).
In terms of repeat unit size length distribution (Table S4), mono-nucleotide motifs are not the most frequent TR motifs in all 31 in-vestigated species. It is known that longer repeats (.6 bp) have highdensities in D. pulex (Mayer et al. 2010). In our study, some longerrepeats also show higher frequencies than many short TRs: 39-nucle-otide motifs in dicot R. communis, 17-nucleotide and 50-nucleotide
motifs in green alga V. carteri, and 12-nucleotide motifs in bryophyteS. moellendorffii. Therefore, this suggests that TRs are not generatedrandomly in genomes and longer TRs may play some roles in geneexpression and regulation.
The distribution and frequency of TRs in intragenicand intergenic regionsIt is clear that the distribution of TR motifs in intergenic regions issignificantly biased toward both the 59 and 39 ends of genes in dicotsand monocots (Figure 5, A and B). TRs have been shown to locatewithin genes and regulatory regions and participate in transcriptionaland translational regulation (Streelman and Kocher 2002; Rockmanand Wray 2002; Li et al. 2002; Martin et al. 2005; Legendre et al. 2007;Vinces et al. 2009). In our study, the biased TR motif distribution inintergenic regions further supports this notion.
In introns of all 31 species, especially in the two green algae, moreabundant TR motifs are significantly detected toward the ends ofintrons. Interestingly, SSR densities in CDS regions of 42 prokayrotegenomes also show a similar U-shape profile (Lin and Kussell 2011).Because introns contain important regulatory motifs for many biolog-ical processes, including splicing (Matlin et al. 2005; Barbazuk et al.2008), our results suggest that the TRs in introns might have locali-zation preference in their regulatory roles. Considering exon splicingthat utilizes the canonical splicing signals (GT and AG) at the 59 and39 end of introns and the GO functions of genes with TRs in introns(Table 2), we believe that the highly abundant TRs in introns, espe-cially in the two green algae, may involve with both constitutive andalternative splicing activities.
The frequencies of TRs are consistent with the TR densityvariations in the four different groups. It has been shown that 59-UTR and UI200 have much higher TR densities in dicots, monocots,and bryophytes, whereas higher TR densities are found in intron andCDS regions in green algae (Figure 4 and Figure 6). Comparativelyspeaking, there are more TRs (densities and frequencies) in 59-UTRand promoter (UI200) regions in land plants (dicots, monocots, andbryophytes), whereas green algae have more TRs in intron and CDSregions.
In this study, the genome assemblies and gene annotations wereobtained from Phytozome version 8.0. Within this release, somespecies (e.g., Arabidopsis and rice) apparently have better, high-qualitygene annotations than other species (e.g., papaya and apple withoutUTR annotation). We also noticed that many genome assemblies haveunfinished gaps (e.g., ...NNN...). Perhaps this is attributable to thehighly repetitive nature of the sequences and the limitation of currentsequencing technologies. On other hand, our data analysis is obviouslybiased toward dicot plants because the species number available inPhytozome version 8.0 is not balanced for all four groups: two speciesin green algae, two in bryophytes, five in monocots, and 22 in dicots.Another limitation in our data analysis is the repeat unit size selection.Ideally, we should have examined all TRs with the repeat unit size of1–100 (i.e., covering all microsatellites and minisatellites) or evenlonger. Unfortunately, we decided to examine the TR motifs of1–50 bp because of the constraints in both current bioinformaticstools and the demanding computational resources required for pro-cessing all 31 genomes (i.e., CPU, memory, and execution periods).Clearly, these limitations will affect the quality of our data analysisresults presented in this article to some extent. With the rapidadvances in sequencing and computational technologies and withthe rapid increase of transcriptomics data, we can expect more high-quality, accurate genome assemblies and gene annotations availablefor in-depth TR analyses involving more plant and green algal
n Table 2 The most significant GO functions of genes with TRs inintrons in C. reinhardtii
Term P
Catalytic activity 5.384e235Hydrolase activity 1.344e210Oxidoreductase activity 7.792e26Peptidase activity 1.109e24Peptidase activity acting on
L-amino acid peptides1.766e24
Endopeptidase activity 5.793e24
76 | Z. Zhao et al.

species. This will definitely help us improve our understanding ofthe evolution of TRs and their roles in gene expression regulation.
CONCLUSIONSIt is known that TRs involve plenty of roles in gene expression andgenome evolution. In this study, as the first systematic examination ofTRs in plant and green alga genomes, we found that TR density hasno significantly discernible relationship with genome size, and TRsdisplay nonrandom distribution within both intragenic and intergenicregions, suggesting that they might have been involved in transcrip-tional or translational regulation in plants and green algae. Obviously,more research work is needed to facilitate our understanding of TRs interms of their motif features and potential biological functions, as wellas their evolutionary trends in land plants and green algae.
ACKNOWLEDGMENTSWe thank Qingshun Quinn Li and two anonymous reviewers for theirconstructive comments to improve the manuscript. C.L. managed andcoordinated the project. Z.Z. performed data collection and dataanalysis. C.G. and S.S. helped with statistical analyses. P.L. imple-mented GO analysis in V. carteri. All authors participated in manu-script writing and editing. This project was funded partially by theNIH-AREA (1R15GM94732-1 A1 to C.L.) and the Botany Depart-ment and Office for the Advancement of Research and Scholarship(OARS) of Miami University in Ohio.
LITERATURE CITEDBarbazuk, W. B., Y. Fu, and K. M. McGinnis, 2008 Genome-wide anal-
yses of alternative splicing in plants: opportunities and challenges.Genome Res. 18: 1381–1392.
Christians, J. K., and C. A. Watt, 2009 Mononucleotide repeats represent animportant source of polymorphic microsatellite markers in Aspergillusnidulans. Molecular Ecology Resources 9: 572–578.
da Maia, L. C., V. Q. de Souza, M. M. Kopp, F. I. F. de Carvalho, and A. C. deOliveira, 2009 Tandem repeat distribution of gene transcripts in threeplant families. Genet. Mol. Biol. 32: 822–833.
Dokholyan, N. V., S. V. Buldyrev, S. Havlin, and H. E. Stanley,2000 Distributions of dimeric tandem repeats in non-coding and cod-ing DNA sequences. J. Theor. Biol. 202: 273–282.
Fujimori, S., T. Washio, K. Higo, Y. Ohtomo, K. Murakami et al., 2003 Anovel feature of microsatellites in plants: a distribution gradient along thedirection of transcription. FEBS Lett. 554: 17–22.
Gemayel, R., J. Cho, S. Boeynaems, and K. J. Verstrepen, 2012 Beyondjunk-variable tandem repeats as facilitators of rapid evolution of regula-tory and coding sequences. Genes 3: 461–480.
Gemayel, R., M. D. Vinces, M. Legendre, and K. J. Verstrepen,2010 Variable tandem repeats accelerate evolution of coding and reg-ulatory sequences. Annu. Rev. Genet. 44: 445–477.
Gu, R., Z. Zhang, J. N. DeCerbo, and G. G. Carmichael, 2009 Gene regulationby sense-antisense overlap of polyadenylation signals. RNA 15: 1154–1163.
Jurka, J., and C. Pethiyagoda, 1995 Simple repetitive DNA sequences fromprimates: compilation and analysis. J. Mol. Evol. 40: 120–126.
Kerin, T., A. Ramanathan, K. Rivas, N. Grepo, G. A. Coetzee et al.,2012 A noncoding RNA antisense to Moesin at 5p14.1 in autism. Sci.Transl. Med. 4: 128ra40–128ra40.
Kokulapalan, W., 2011 Genome-wide computational analysis of Chlamy-domonas reinhardtii promoters. OhioLINK ETD Center. Available at:https://etd.ohiolink.edu/ap:10:0::NO:10:P10_ETD_SUBID:57668.
Kuntal, H., and V. Sharma, 2011 In silico analysis of SSRs in mitochondrialgenomes of plants. OMICS 15: 783–789.
Lawson, M. J., and L. Zhang, 2006 Distinct patterns of SSR distribution inthe Arabidopsis thaliana and rice genomes. Genome Biol. 7: R14.
Legendre, M., N. Pochet, T. Pak, and K. J. Verstrepen, 2007 Sequence-basedestimation of minisatellite and microsatellite repeat variability. GenomeRes. 17: 1787–1796.
Li, B., Q. Xia, C. Lu, Z. Zhou, and Z. Xiang, 2004 Analysis on frequency anddensity of microsatellites in coding sequences of several eukaryotic ge-nomes. Genomics Proteomics Bioinformatics 2: 24–31.
Li, Y.-C., A. B. Korol, T. Fahima, A. Beiles, and E. Nevo,2002 Microsatellites: genomic distribution, putative functions and mu-tational mechanisms: a review. Mol. Ecol. 11: 2453–2465.
Lin, W.-H., and E. Kussell, 2011 Evolutionary pressures on simple sequencerepeats in prokaryotic coding regions. Nucleic Acids Res. 40: 2399–2413.
Martin, P., K. Makepeace, S. A. Hill, D. W. Hood, and E. R. Moxon,2005 Microsatellite instability regulates transcription factor binding andgene expression. Proc. Natl. Acad. Sci. USA 102: 3800–3804.
Matlin, A. J., F. Clark, and C. W. J. Smith, 2005 Understanding alternativesplicing: towards a cellular code. Nat. Rev. Mol. Cell Biol. 6: 386–398.
Mayer, C., F. Leese, and R. Tollrian, 2010 Genome-wide analysis of tandemrepeats in Daphnia pulex–a comparative approach. BMC Genomics 11: 277.
Melters, D. P., K. R. Bradnam, H. A. Young, N. Telis, M. R. May et al.,2013 Comparative analysis of tandem repeats from hundreds of speciesreveals unique insights into centromere evolution. Genome Biol. 14: R10.
Metzgar, D., L. Liu, C. Hansen, K. Dybvig, and C. Wills, 2002 Domain-leveldifferences in microsatellite distribution and content result from differentrelative rates of insertion and deletion mutations. Genome Res. 12: 408–413.
Morgante, M., M. Hanafey, and W. Powell, 2002 Microsatellites are pref-erentially associated with nonrepetitive DNA in plant genomes. Nat.Genet. 30: 194–200.
Orsi, R. H., B. M. Bowen, and M. Wiedmann, 2010 Homopolymeric tracts rep-resent a general regulatory mechanism in prokaryotes. BMC Genomics 11: 102.
Périer, R. C., V. Praz, T. Junier, C. Bonnard, and P. Bucher, 2000 Theeukaryotic promoter database (EPD). Nucleic Acids Res. 28: 302–303.
Rockman, M. V., and G. A. Wray, 2002 Abundant raw material for cis-regulatory evolution in humans. Mol. Biol. Evol. 19: 1991–2004.
Roorkiwal, M., and P. C. Sharma, 2011 Mining functional microsatellites inlegume unigenes. Bioinformation 7: 264–270.
Schmid, R., and M. L. Blaxter, 2008 annot8r: GO, EC and KEGG annota-tion of EST datasets. BMC Bioinformatics 9: 180.
Sharma, P. C., A. Grover, and G. Kahl, 2007 Mining microsatellites ineukaryotic genomes. Trends Biotechnol. 25: 490–498.
La Spada, A. R., E. M. Wilson, D. B. Lubahn, A. E. Harding, and K. H.Fischbeck, 1991 Androgen receptor gene mutations in X-linked spinaland bulbar muscular atrophy. Nature 352: 77–79.
Streelman, J. T., and T. D. Kocher, 2002 Microsatellite variation associatedwith prolactin expression and growth of salt-challenged tilapia. Physiol.Genomics 9: 1–4.
Subramanian, S., R. K. Mishra, and L. Singh, 2003 Genome-wide analysis ofmicrosatellite repeats in humans: their abundance and density in specificgenomic regions. Genome Biol. 4: R13.
Sureshkumar, S., M. Todesco, K. Schneeberger, R. Harilal, S. Balasubrama-nian et al., 2009 A genetic defect caused by a triplet repeat expansion inArabidopsis thaliana. Science 323: 1060–1063.
Tautz, D., and M. Renz, 1984 Simple sequences are ubiquitous repetitivecomponents of eukaryotic genomes. Nucleic Acids Res. 12: 4127–4138.
Tóth, G., Z. Gáspári, and J. Jurka, 2000 Microsatellites in different eu-karyotic genomes: survey and analysis. Genome Res. 10: 967–981.
Verkerk, A. J., M. Pieretti, J. S. Sutcliffe, Y. H. Fu, D. P. Kuhl et al.,1991 Identification of a gene (FMR-1) containing a CGG repeat co-incident with a breakpoint cluster region exhibiting length variation infragile X syndrome. Cell 65: 905–914.
Verstrepen, K. J., A. Jansen, F. Lewitter, and G. R. Fink, 2005 Intragenictandem repeats generate functional variability. Nat. Genet. 37: 986–990.
Victoria, F. C., L. C. da Maia, and A. de Oliveira, 2011 In silico comparativeanalysis of SSR markers in plants. BMC Plant Biol. 11: 15.
Vinces, M. D., M. Legendre, M. Caldara, M. Hagihara, and K. J. Verstrepen,2009 Unstable tandem repeats in promoters confer transcriptionalevolvability. Science 324: 1213–1216.
von Stackelberg, M., S. A. Rensing, and R. Reski, 2006 Identification ofgenic moss SSR markers and a comparative analysis of twenty-four algaland plant gene indices reveal species-specific rather than group-specificcharacteristics of microsatellites. BMC Plant Biol. 6: 9.
Volume 4 January 2014 | Tandem Repeats in Plants and Green Algae | 77

Walker, F. O., 2007 Huntington’s disease. Lancet 369: 218–228.Yandell, B. S., 1997 Practical data analysis for designed experiments,
Chapman & Hall, London, New York.Zhang, L., D. Yuan, S. Yu, Z. Li, Y. Cao et al., 2004 Preference of simple
sequence repeats in coding and non-coding regions of Arabidopsisthaliana. Bioinformatics 20: 1081–1086.
Zhang, L., K. Zuo, F. Zhang, Y. Cao, J. Wang et al., 2006 Conservation ofnoncoding microsatellites in plants: implication for gene regulation. BMCGenomics 7: 323.
Zhao, X., Y. Tian, R. Yang, H. Feng, Q. Ouyang et al., 2012 Coevolutionbetween simple sequence repeats (SSRs) and virus genome size. BMCGenomics 13: 435.
Zheng, Q., and X.-J. Wang, 2008 GOEAST: a web-based software toolkit forGene Ontology enrichment analysis. Nucleic Acids Res. 36: W358–W363.
Zhou, Y., J. Liu, L. Han, Z.-G. Li, and Z. Zhang, 2011 Comprehensiveanalysis of tandem amino acid repeats from ten angiosperm genomes.BMC Genomics 12: 632.
Communicating editor: A. H. Paterson
78 | Z. Zhao et al.