genome-wide association study for the relationship …
TRANSCRIPT

University of Nebraska - LincolnDigitalCommons@University of Nebraska - Lincoln
Theses and Dissertations in Animal Science Animal Science Department
Spring 1-19-2018
GENOME-WIDE ASSOCIATION STUDYFOR THE RELATIONSHIP BETWEENTEMPERATURE AND FEED INTAKE IN BEEFCATTLERobel GhebrewoldUniversity of Nebraska - Lincoln, [email protected]
Follow this and additional works at: https://digitalcommons.unl.edu/animalscidiss
Part of the Animal Sciences Commons, and the Genetics and Genomics Commons
This Article is brought to you for free and open access by the Animal Science Department at DigitalCommons@University of Nebraska - Lincoln. It hasbeen accepted for inclusion in Theses and Dissertations in Animal Science by an authorized administrator of DigitalCommons@University of Nebraska- Lincoln.
Ghebrewold, Robel, "GENOME-WIDE ASSOCIATION STUDY FOR THE RELATIONSHIP BETWEEN TEMPERATURE ANDFEED INTAKE IN BEEF CATTLE" (2018). Theses and Dissertations in Animal Science. 157.https://digitalcommons.unl.edu/animalscidiss/157

GENOME-WIDE ASSOCIATION STUDY FOR THE RELATIONSHIP BETWEEN
TEMPERATURE AND FEED INTAKE IN BEEF CATTLE
By
Robel Araya Ghebrewold
A THESIS
Presented to the Faculty of
The Graduate College of the University of Nebraska
In Partial Fulfillment of Requirements
For the Degree of Master of Science
Major: Animal Science
Under the Supervision of Professor Matthew L. Spangler
Lincoln, Nebraska
January, 2018

GENOME-WIDE ASSOCIATION STUDY FOR THE RELATIONSHIP BETWEEN
TEMPERATURE AND FEED INTAKE IN BEEF CATTLE
Robel Araya Ghebrewold, M.S.
University of Nebraska, 2018
Advisor: Matthew L. Spangler
Environmental conditions, such as changes in ambient temperature, can cause changes in
animal behavior and performance. In general, it is believed that as ambient temperature increases,
dry matter intake (DMI) of beef cattle decreases. However, our hypothesis was that the degree to
which animals adjust their daily DMI due to changes in ambient temperature is partially controlled
by genetic effects. Consequently, the objective of this study was to estimate the genetic component
of the regression of DMI on ambient temperature using an admixed beef cattle population
consisting of various crosses of Angus, Simmental, and Piedmontese (n = 239). Ambient
temperatures were received from a local weather station and DMI was collected via Calen gates.
The feeding period averaged 155 d with a range of 114 d to 189 d depending on the management
group. Individual animal regressions of DMI on average daily ambient temperature were
performed using either daily high or low temperatures over the entirety of the feeding period. Daily
high temperatures (°C) averaged 15.07 with a range of -17.21 to 38.25. Daily low temperatures
(°C) averaged 2.37 with a range of -28.33 to 15.26. The corresponding intercept and regression
coefficient for each animal were used as phenotypes for a genome-wide association study
(GWAS). Animals were genotyped with the BovineSNP50 Beadchip. Data were analyzed using a
BayesC model with the GenSel software fitting contemporary group (n = 4) and initial body weight
(IBW) as fixed effects. A MCMC chain of 100,000 iterations were used with the first

40,000 samples discarded as burn-in. The proportion of SNPs having null effect (𝜋) was set to
0.995. Posterior mean heritability estimates (PSD) for the analysis when daily high temperature
was considered in the regression were 0.68 (0.06) and 0.45 (0.08) for the intercept and slope,
respectively. Similarly, posterior mean heritability estimates (PSD) for the intercept and slope
when the daily low temperature was considered in the regression were 0.76 (0.05) and 0.48 (0.08),
respectively. These results suggest that changes in DMI due to changes in ambient temperature are
under genetic control. Admittedly the population under study is small and admixed, suggesting
that the genomic heritability estimates contained herein are potentially biased upward. However,
the concept of applying this same procedure in larger populations warrants further investigation as
a means of identifying animals that are less sensitive to environmental extremes.

Acknowledgements
I would like to thank my advisor Dr. Spangler for his guidance, advice, patience and
discussions during my academic program at UNL. Indeed, it was an honor and a privilege for me
to have the opportunity to study under his direction within the Animal Breeding and Genetics
group at the University of Nebraska-Lincoln. The various discussions I have with Dr. Spangler
during my academic program have helped me to strengthen and develop my professional skill, as
well as gave me new perspective and knowledge in beef genetics.
I am also very grateful to all my graduate committee members, Dr. Lewis, Dr. Kachman
and Dr. Fernando. Dr. Lewis, I`m very thankful for the fruitful discussions we had and for the
knowledge and experience I gained from attending your classes and seminars as well. I have
always enjoyed your guidance and discussions. Moreover, I will always remember my first
meeting with you back in Ås, Norway. I`m also very thankful to Sherri Pitchie`s help and
support in relation to the department work and travel arrangements. I`m also very thankful for all
students of ABG group for their love and accompany. Napo Vargas, thank you for the good time
we shared and great discussions we had.
A special thanks to my beloved family for their patience, support and encouragement, I
really appreciate for their trust and love they have for me.
My deepest thanks goes to God, for HIS unconditional love and mercy up on me.

Table of Contents
Introduction……………………………………………………………………………………… ..1
Literature Review.............................................................................................................................3
Animals Response to Heat Stress .................................................................................................4
Measuring Heat stress.…………..……….……………………………………………...………7
Economic Impact of Heat Stress……………………………………….………………………..8
Mitigation Strategies of Heat stress…………………………………….…………….………..10
Environmental Modification………………………………………………………………..10
Nutritional Modification……………………...…………………………………………….11
Developing Genetically Improved Breeds…………………………………………....…….12
Crossbreeding.............................................................................................................…...14
Selection……..………………………………….……………………………………….15
Genomic Selection……………………………………….………………...……………18
Genome-wide association study (GWAS)...........................................................................…...22
Genes involved in heat/cold stress response….…………....…………………………………..23
Summary…………………………………………………………..……………………………..26
References………………………………………………………………………….………….…27
GWAS for the relationship between temperature and feed intake in beef cattle..………………40
Abstract…………………………………………………………………………………………..40

Introduction…………………………………………………………………...………………….42
Materials and Methods…..………………………………...……………………..………………44
Gene Ontology………………………………………………………………….………….….....47
Results and Discussion..........................................................................................................…....47
Genetic parameters……………………………………………………………………………….47
Candidate Genes…………………………………………………………………………..…......50
Implications............................................................................................................................…...52
Tables.....................................................................................................................................…...53
Figures……………………………………………………………………………………………84
References......................................................................................................................................92


1
Introduction
The environment in which farm animals are kept plays a significant role in their
production performance. With the exception of some intensive production systems, beef
production in the U.S. is often in extensive production systems whereby beef cattle are reared in
complex environments in which they continuously face short and long term environmental
change. As a result, beef cattle are susceptible to different environmental conditions and can
experience both heat and cold stress. Environmental factors contributing to heat stress are daily
high ambient temperature, high relative humidity, low air movement, solar radiation and heat
wave. Moreover, due to their poor sweating mechanism, beef cattle also acquire heat through the
process of fermentation during digestion. Even though animals are forced to adapt to certain
environmental changes, these changes can be very detrimental to their performance and
production ability. Reduction of feed intake and growth are among the common signs of beef
cattle under heat stress. However, in extreme cases heat stress can also cause death contributing
to a significant revenue loss to producers as well as animal welfare concerns.
Heat stress can be defined as the disturbance of a body system from its resting state due
to the high level of an external force. Cattle maintain normal body temperature through
balancing heat gain and loss, a process known as thermoregulation. Heat stress is a situation that
occurs when animals are unable to dissipate their heat load efficiently. Based on the duration and
severity of the stress, it can be described as acute or chronic. Acute heat stress is characterized by
short and sudden periods of extremely high temperature; on the other hand, chronic heat stress is
a condition when there is are long periods of elevated temperature. Beef cattle experience heat
stress when an imbalance between the internal heat production and their ability to dissipate it
efficiently exist. Decreased dry matter intake, reduced metabolic rate, increased respiratory rates

2
and sweating are some of the physiological signs that contribute negatively to the production
ability of the animals. Generally, as the ambient temperature increases animals eat less, which
negatively impacts the usage of energy for production. This negative correlation between dry
matter intake and high ambient temperature is well-documented. However, differences in an
animal’s physiological response and production performance under extreme heat/cold stress is
also partially controlled by their genetic makeup. Therefore, our hypothesis was that the degree
to which animals adjust their daily DMI due to changes in ambient temperature is partially
controlled by their genetic effects. Consequently, the objective of this study was to estimate the
genetic component of the regression of DMI on ambient temperature via a genome-wide
association study using an admixed beef cattle population consisting of various crosses of Angus,
Simmental, and Piedmontese (n = 239).

3
Literature Review
Global projections of climate change have been one of the most critical issues facing the
agricultural sector worldwide. Research studies show that there will still be an increase in
temperature, precipitation and concentration of carbon dioxide globally (Hatfield et al., 2008,
2011). Similar projections for the United States over the next 30 years support this evidence that
there will most likely be an increase of temperature of 1.5-2 ℃ (Tebaldi et al., 2006; Karl et al.,
2009). This puts climate change as one of the top issues that challenges and threatens the future
well-being of humans and animals. The forecast of climate change prompts us to consider the
inevitable consequences of the climate change on agricultural production in particular.
Demographic changes of the world population is another serious challenge facing the
agricultural sector. According to the United Nations Department of Economic and Social Affairs
(UN DESA) 2015 report, the world population is expected to reach 8.5 billion by 2030, 9.7
billion by 2050 and 11.2 billion by 2100. Moreover, projection of demand for animal-source
food as a result of diet change such as meat and milk are expected to grow by 73 and 58 %,
respectively, by 2050. Both climate change and population growth combine to pose an
unprecedented challenge that cannot be overlooked. Therefore, in order to feed more people by
2050, the scientific community must find a way to increase the level of current agricultural
production given projected climate change.
Livestock production has been recognized as one of the main components of the
agricultural sector given its key role in food security by providing protein. Protein is one of the
three important nutrient requirements of humans. Despite its role in food security, livestock
production is expected to change given the current forecast of climate change (Hatfield et al.,
2008). Key et al. (2014) showed that the impact of environmental temperature on livestock is one

4
of the four major ways that livestock production could be impacted due to climate change by
affecting animal health, reproduction and animal products (meat and milk). Furthermore,
livestock production could be altered from an increase production costs and productivity losses
incurred by climate change. For example, climate change further increase costs and availability
of feed crops. In addition, pasture, rangeland places and yield could also be affected by climate
change which in turn influences livestock production costs and profits. Climate change could
also increase production costs incurred from the distribution of parasites and pathogens as a
result of extreme temperature. The before mentioned examples are part of the consequences of
climate change that could significantly affect livestock production. Climate change could
contribute to increases in daily high ambient temperature and humidity, which together could
result in heat stress for livestock. The stressor factors such as heat, gaseous contaminants, dust,
mud, and/or crowding play an influential role on animals’ performance whether in beef or milk
production. Freeman (1987) pointed out that heat stress is one of the most critical stress factors,
which most likely reduces the welfare and performance of animals particularly in the hot regions
of the world. In light of such climate changes, animals’ meat and milk production are
deteriorating on a daily basis (Key et al., 2014).
Animals Response to Heat Stress
According to Yousef (1985), heat stress is defined as the disturbance of a body system
from its resting state due to the high level of an external force. Therefore, heat stress is a
situation that occurs when animals are unable to dissipate their heat load efficiently. Based on the
duration and severity of the stress, it can be described as acute or chronic. Acute heat stress is
characterized by short and sudden periods of extremely high temperature; on the other hand,

5
chronic heat stress is a condition when there are long periods of elevated temperature (Emery,
2004).
Environmental conditions where animals are producing at optimal level are known as the
comfort or thermoneutral zone. The thermoneutral zone is a range of temperature where animals
maintain their normal body temperature and are able to perform and produce without a need for a
behavioral or physiological adjustment. This means that it is a range of temperature within which
animal’s production is optimum with minimum cost (Du Prezz et al., 1990). Depending on the
species and breed, animal comfort zone varies. For example, cattle in general have a zone of
comfort that ranges between 5℃ – 20℃, calves between 10℃ – 20℃, sheep between 21℃ –
31℃, goats 10℃ – 20℃, respectively (Kerr, 2015). However, environmental conditions that
exceed either the upper or lower bound of the thermoneutral zone of an animal will induce stress
which in turn alters the physiological and behavioral system of the animal. As mentioned above,
heat stress is one of the main sources of stress caused by climatic conditions that has a direct
physical impact on the performance of the animal. However, an animal can also experience stress
in their life time due to other sources as well, such as infection, nutritional deficiency and
metabolic disease. Depending on the genetic background of the animal and the environmental
factors, the strength and duration of animal’s response to stress varies (Freeman, 1987). Animals
under heat stress exhibit various physiological and behavioral responses that include reduction in
urinary water losses, reduction in feed intake and production, increased sweating, increased
respiration, increased rectal temperature and heart rates. Animals exhibit these physiological and
behavioral responses in order to maintain thermal equilibrium. Animals maintain their internal
body temperature in a state of equilibrium by physical, physiological and biochemical responses
a process called thermoregulation (Aggarwal and Upadhayay, 2012). Animals under heat stress

6
are unable to maintain a normal thermoregulation process. During such abnormal
thermoregulatory process, animals cannot avoid heat from their body effectively. They will also
experience poor sweating mechanisms. Often beef cattle are exposed to climatic conditions that
occur naturally due to the extensive production system. Beef cattle that experience heat stress
can be identified by using typical non-observable and observable signs. Some of the visible signs
are listed as slobbering, panting, open mouth breathing, decreased activity, refusal to lie down,
agitation and restlessness. On the other hand, lowered conception rate, appearance of stress
hormones in the blood, lower fertility in bulls, increased peripheral blood flow, and a lowered
ruminal pH value are typical invisible signs to recognize beef cattle that are suffering from heat
stress.
Cattle can experience heat stress differently because of various contributing factors such
as animals’ characteristics and/or genetic factors. Bos indicus cattle are well known for their
genetic adaptation to heat stress as compared to Bos taurus breeds. Moreover, cattle within the
same breed can also experience higher heat stress if they absorb and produce more heat from the
environment but dissipate less of their body heat. Animals with higher levels of performance can
also experience more heat stress than animals with lower production performance. Because of
their inherent higher level of productivity, such animals are able to produce more heat than those
with lower productivity (Blackshaw and Blackshaw, 1994; West, 1994).
Similarly, there are well identified animal characteristics that impact animals experience
with higher levels of heat stress. For example, a hide color is one of the significant characteristics
that differentiate animals’ ability to cope with heat stress. Animals with dark hair have lower
reflectance ability and also absorb greater solar radiation than animals with white hair and as a
result dark hair animals experience higher heat stress than others (Da Silva et al., 2003).

7
According to Brown-Brandle et al. (2006), the animals’ level of fatness, history of respiratory
pneumonia, and temperament are also other factors that distinguish animals in experiencing
different levels of heat stress; for example, calm animals experience less heat stress than
excitable animals. Feedlot cattle that are treated for pneumonia have better respiratory rate under
heat stress than untreated animals. The age of animals also impacts their ability to cope with heat
stress; very young and very old animals are more vulnerable to heat stress than others. Moreover,
how cattle are kept in a feedlot and what they eat determines animals’ ability to tolerate heat
stress. Heavy feedlot cattle are at risk to experience heat stress. Similarly, animals that are being
fed excessive protein levels are prone to experience heat stress, particularly in pastures and
feedlots. The kind and quality of feed also creates differences among animals to experience heat
stress. For example, feeds such as hay contribute to the occurrence of heat stress more than corn-
based feeds. This is because corn-based feeds are known for their low heat production during
fermentation or digestion. Generally, animals’ responses to heat stress vary based on four
important factors: differences in genetics, health, production status, and previous exposure to
heat. The response of cattle to heat/wave and hot/dry conditions is a twofold process. The first
process is directed towards the reduction of metabolic heat; whereas, the second process is
directed towards the utilization of all mechanism to enhance the loss of heat from their body.
During such conditions, animals do have lowered appetite and increased water consumption.
Measuring Heat Stress
Ambient temperature is not the only environmental factor that has an impact on the
development of heat stress in cattle. Humidity and air movement also have a large impact on the
occurrence of heat stress (Armstrong, 1994). For example, high humidity negatively influences
the ability of animals to cool their body and in turn contributes to the occurrence of heat stress.

8
Under lower humidity conditions, animals can experience less heat stress; however, the risk for
heat stress rises when the humidity increases, even though at lower ambient temperature.
Animals will experience the most sever heat stress when both the ambient temperature and
relative humidity are high. In addition to those day time conditions, night time conditions such as
minimum wind speed, minimum solar radiation, and minimum Temperature Humidity Index
(THI) also impact heat stress in cattle (Mader et al., 2006). The THI is an index that collectively
measures ambient temperature, relative humidity, and evaporation rate (Dikmen and Hansen,
2009). “THI is an index for assessment of the potential of an environment to induce heat stress in
humans and farm animals” (Aggarwal and Upadhayay, 2012). Dikmen and Hansen (2009)
asserted that THI is a reliable indicator of heat stress in cattle. However, THI has some
drawbacks; the ability of THI in predicting heat stress in extensive grazing systems may not be
accurate, since THI does not account for accumulated heat load. The THI also cannot account for
solar radiation and wind speed (Gaughan et al., 2008).
Economic Impact of Heat Stress
There is substantial evidence that shows significant economic losses incurred due to heat
stress in livestock production. In general, economic damage of livestock production as a result of
heat stress come from different sources of the production system such as reduction of feed intake
and growth, decreased milk, meat and egg production, decreased fertility or reproduction
efficiency, reduction in immunity and ultimately during an extreme stress event from mortality
of the animal. Moreover, an additional source of economic loss can also come from an
investment made to mitigate heat stress. Estimates of economic losses imposed by heat stress
vary depending on several other factors such as type of production systems and its environmental
location, tolerance and response of species and breeds to heat stress. Even though it is difficult to
9
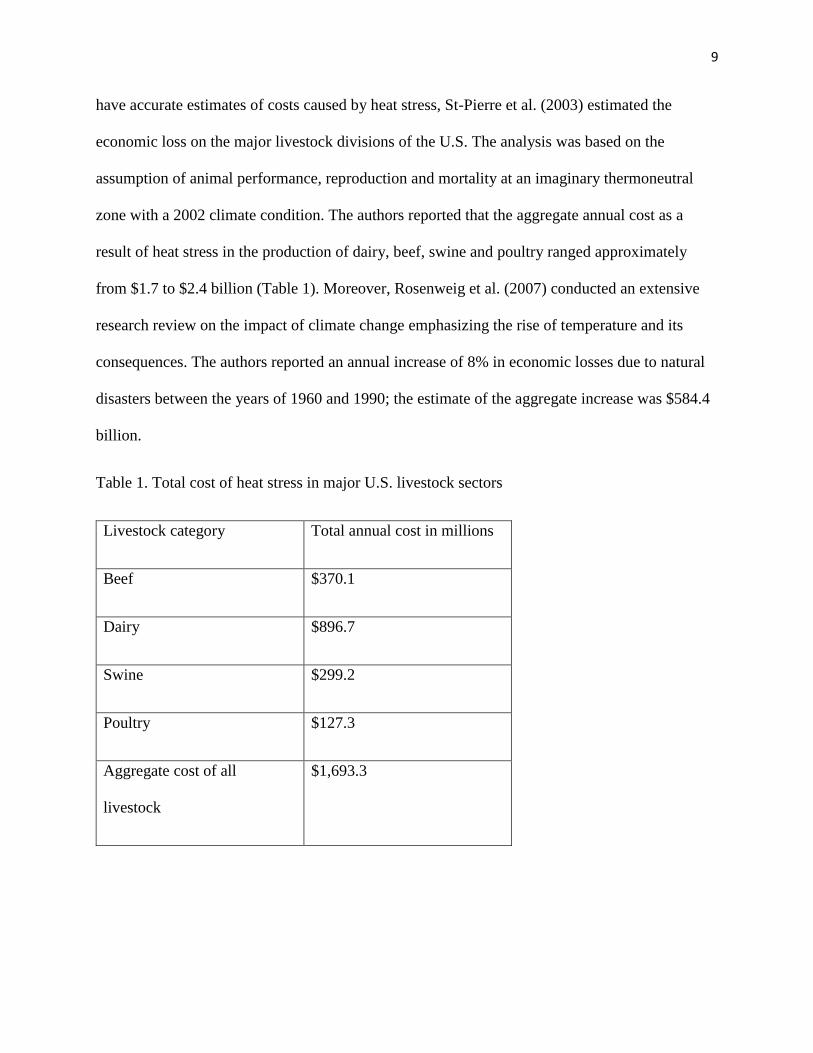
have accurate estimates of costs caused by heat stress, St-Pierre et al. (2003) estimated the
economic loss on the major livestock divisions of the U.S. The analysis was based on the
assumption of animal performance, reproduction and mortality at an imaginary thermoneutral
zone with a 2002 climate condition. The authors reported that the aggregate annual cost as a
result of heat stress in the production of dairy, beef, swine and poultry ranged approximately
from $1.7 to $2.4 billion (Table 1). Moreover, Rosenweig et al. (2007) conducted an extensive
research review on the impact of climate change emphasizing the rise of temperature and its
consequences. The authors reported an annual increase of 8% in economic losses due to natural
disasters between the years of 1960 and 1990; the estimate of the aggregate increase was $584.4
billion.
Table 1. Total cost of heat stress in major U.S. livestock sectors
Livestock category Total annual cost in millions
Beef $370.1
Dairy $896.7
Swine $299.2
Poultry $127.3
Aggregate cost of all
livestock
$1,693.3

10
Mitigation Strategies of Heat Stress
Environmental Modification
Livestock producers and scientists use multidisciplinary management approaches to
lessen the economic loss induced by heat stress (Collier et al., 2003). Environmental
modification is the first and most common strategy implemented by livestock producers to help
animals cope with heat stress. Hahn (1981) pointed out that the different alternative
environmental modifications available for livestock producers to choose from are based on either
shielding the animals from the variables contributing to heat stress or increasing the animal’s
ability of evaporative heat loss.
Often, farmers provide shade through buildings, trees and housing thereby protecting
animals from the exposure of direct solar radiation (Blackshaw and Blackshaw, 1994; Buffington
et al., 1983). Buffington et al. (1983) reported that tree shades are very effective in comforting
animals that are reared outside. Insuring that there is enough shade available is also important as
cattle tend to look for a cooler place during high temperatures and gather themselves to use shade
provided by other animals. However, in some instances natural shades provided by trees may not
be enough or appropriate. Therefore, livestock producers may use artificial shelters. In such
cases, it is important to take into consideration not only the design but also the materials used, as
both play a significant role in minimizing heat stress (Armstrong, 1994; Smith et al., 2002).
Usage of cooling equipment is another key method of environmental management
intervention strategy to mitigate heat stress and help animals maintain their performance.
Cooling devices such as sprinklers, ventilators or water nozzles are used separately or in
combination during extreme high temperatures to cool down animals directly and/or the

11
environment. Applying sprinklers can help to reduce ground temperatures and raise evaporative
cooling (Gaughan et al., 2008; Means et al., 1992; Morrison et al., 1973). Moreover, utilization
of ventilators or fans can also help to increase the movement of air especially for cattle that are
kept inside barns or pens. Opening of windows and sides of the barn are another option that can
improve sufficient air movement through natural ventilation (Bryant et al., 2007).
Nutritional Modification
Combating heat stress through improved nutrition is another important mitigation
strategy. During high temperatures livestock lose water through respiration and sweating and as a
result consumption of water increases. Therefore, animals’ access to adequate, available, cool
and clean water is very critical. Increasing the number of water troughs and rate of refill during
heat stress can keep cattle with sufficient quantities of water and help to avoid competition for
access and crowding. Cattle drink more water during heat stress to regulate and maintain their
body temperature. However, an increase in water consumption will also enhance urine
production which results in the loss of minerals such as sodium, potassium and magnesium. As a
result, additional supply of minerals during heat stress is necessary.
Understanding of nutrient requirements and timing of feeding can also be as critical as
providing water in helping cattle cope with heat stress. In general, cattle react with lower dry
matter intake during heat stress subsequently affecting animals’ performance and productivity.
Often, it is not advisable to make a sudden ration change during heat stress, but providing
improved forage quality and palatable feeds can reduce the impact of heat stress (Beede and
Shearer, 1996). It has been reported that cattle accumulate heat load from consuming diets that
have high energy content or from feeds that contribute to the production of heat during
fermentation. Feeds such as hay or straw are known for their low energy content but contribute

12
significantly to the production of heat during fermentation. Moreover, feeds such as corn and
other concentrates are known for their higher energy content but with less heat production during
digestion. However, feeding cattle with more concentrates can also lead to acidosis problems.
Carstens et al. (1989) suggested that controlling high energy feeds can help lower metabolic heat
production thereby reducing heat load that can be acquired by cattle. Therefore, it is very
important to act with caution while adjusting feed rations during hot weather (NRC 2001). In
addition, feeding patterns also contribute in determining whether cattle acquire high heat load or
not during the day. Brosh et al. (1998) reported that feeding animals during the morning will lead
to the peak of heat production from feed during which the environmental temperature is also
high. The authors reported that in general heat production from feed intake reaches its peak after
4 to 6 hours of feeding. Therefore, it has been suggested that feeding cattle during the evening or
night may reduce acquiring of heat load from metabolic heat (Reinhardt and Brandt 1994; Brosh
et al., 1998).
Developing Genetically Improved Breeds
Heat stress mitigation strategies mentioned above often require financial investments.
Moreover, it may exacerbate the situation sometimes if it has not been done properly instead of
helping animals to cope with environmental stress. As a result, mitigation strategies may not
provide a sustainable solution by themselves in the long run relative to the current projection of
climate change and global warming. Therefore, utilizing genetic diversity to develop breeds that
are genetically adaptive to harsh environments or improve current breeds should be an emphasis
in order to address the situation in a sustainable manner.
It is a well-documented fact that certain breeds are better suited and perform better than
others in a specific environment. Breeds can survive, be productive, and reproduce in a particular

13
environment because they have developed adaptation mechanisms pertinent to the environment
that they live in that enables the population to continue for generations to come (Barker, 2009).
For example, Bos indicus are a prominent sub-species of cattle in some regions of the world with
the ability to perform as well as reproduce in tropical and arid areas. Moreover, they are also
known for being a multipurpose breed; often farmers use them for ploughing and transportation.
Body conformation, coat color, better sweating mechanism and sebaceous glands are some of the
factors that contributed to Bos indicus heat tolerance capacity. More importantly it is believed
that Bos indicus adaptability to heat stress and harsh environments is the result of their
thermotolerant genes acquired from their exposure and interaction of the environment from
where they descended (Bonsman, 1973; Hansen, 2004; Turner, 1980). In contrast to Bos indicus
cattle, Bos taurus breeds are regarded as breeds of temperate environments because of their
adaptability to cold environments. Bos taurus cattle are known for their high milk and meat
production ability and are generally less tolerant to heat stress as well as harsh environments.
However, there is still variation within Bos taurus cattle in response to heat stress. For example
Jersey cattle have been identified as more heat tolerant than Holstein (Da Silva, 2006).
The existence of genetic variation for heat tolerance between and within breeds can give
breeders the option to make genetic improvement of cattle thereby bringing a sustainable and
long-lasting solution to ever evolving climate change. Crossbreeding and selection have been the
two important breeding strategies that have been practiced by animal and plant breeders for
decades to exploit genetic variation between and within breeds, respectively. Evolution has
played a major role in distinguishing certain species and subspecies to be adapted to specific
environments. As a result they have developed genes that help them thrive through harsh
environments. Therefore, breeding tools can be used to make genetic improvement of cattle by

14
selecting animals within adapted breeds to improve economically important traits (i.e., growth
and carcass merit, milk yield) or select within more productive breeds to make them more
adapted. In addition, it is important to exploit the benefit from implementing crossbreeding by
introgressing adapted genes from local breeds while avoiding the undesirable ones.
Crossbreeding
Crossbreeding is a breeding strategy used to exploit genetic variation that exists between
breeds or lines. The two main advantages of crossbreeding are breed complementarity and
heterosis (hybrid vigour). Often crossbred animals have improved performance as compared to
the average performance of their parents as a result of heterosis. Because heritability estimates of
adaptive traits such as heat/cold tolerance are often characterized as low to moderate,
crossbreeding can be utilized for an improvement of such traits to attain and benefit from
heterosis. As part of using a structured crossbreeding system to improve adaptation and
capitalize on breed complementarity, improvement of other lowly heritable and economically
important traits such as fertility (Stonaker, 1973; Venter et al., 1986) would be expected.
The Brahman breed was developed in the southern part of the U.S. from numerous
humped cattle of Bos indicus origin from India (Philips, 1963; Yturria, 1973). The Brahman
breed was developed due to the fact that the European breeds were not adaptive to the
environment and production with the indigenous cattle was low. Koger (1963) and Randel
(2005) have pointed out that Brahman animals have been used for crossbreeding in the beef
industry for their adaptive traits. Turner (1980) also summarized that zebu cattle have been
beneficial in the beef industry for their large heterosis effects when crossed with Bos taurus
cattle for growth, adaptive traits, maternal effects and reproductive traits. Moreover, in a review
paper, Turner (1980) presented different research studies performed on the contribution of zebu

15
cattle in the beef production system. For example, both Howes (1963) and Evans (1963)
concluded that Brahman cattle have better adaptation to heat stress than Hereford due to their
ability of maintaining lower respiration rates. However, Howes (1963) reported that Brahman
cattle have lower ovulation rates than Hereford, which the author cited as part of the reason for
better heat tolerance but lower reproductive efficiency than Hereford. Heat tolerance comparison
between Brahman, Brahman x Hereford and Hereford by Cartwright (1955) identified the
superiority of the former two over Hereford cattle. Research studies for tick resistance shows that
crossbred of Bos indicus x Bos taurus are more resistant than Bos taurus cattle (Rick 1962;
Strother et al., 1974). A study of energy comparison by Lofgreen et al. (1975) reported that
Brahman x British crossbred steers utilized energy more efficiently than British steers. Brahman
cattle was also found to be more energy efficient than Hereford cattle on low energy diets such
as high roughage (Bonsma 1973; Moore et al., 1975). Crossbred cattle of British x Brahman
were found to have increased carcass weight compared to straightbred Brahman cattle (Carpenter
1973).
Selection
In order to select animals to be parents of the next generation, one needs to estimate the
breeding value of an animal for the desired economically important traits of interest, in this case
heat tolerance (Dekkers, 2012). The breeding value of an animal can be defined as the sum of the
average effect of all alleles (quantitative trait loci) that control the desired trait of interest
(Falconer and Mackay, 1996). Unfortunately, most of quantitative trait loci that affect a trait of
interest are unknown, and thus selection based on Estimated Breeding Values (EBV) using
animal kinship and performance data is necessary. For traits that may be expressed late in life or

16
that are difficult or expensive to measure, using traditional pedigree-based EBV may result in
slow rates of annual genetic gain.
However, with the current development of new technologies in molecular biology for the
past couple of decades, the animal breeding and genetics industry has been revolutionized,
subsequently increasing the need for incorporating molecular information into existing genetic
selection tools. The advent of new technologies in the industry has opened the opportunity for
new traits that have been once considered as difficult and complex to be incorporated into
breeding goals. However, the challenge to identify mutations that are truly associated with heat
stress and integrating it into breeding goals still remains.
It is a well-known fact that conventional selection tools (pedigree-based EBV) are
effective at generating genetic change. Often, economically important traits are quantitative and
breeding objectives are dictated by market needs (Hetzel et al., 1986). A breeding objective
specifies the desired traits of interest to be improved in the population and shows the direction
for genetic change (Kinghorn et al., 2015). However, conventional selection programs have been
focused more on production traits, such as milk, meat and egg production. In addition, improving
livestock production through environmental intervention was once seen as the simple way of
countering the problem. As a result, adaptation traits have been ignored and their fundamental
genetic mechanisms remain unclear. Several reasons could be available for why adaptation traits
have received less attention, but foremost is a general lack of a clear phenotype that can be easily
recorded. Therefore, integrating adaptation traits (i.e., heat/cold tolerance) into breeding
objectives to select animals to be parents of the next generation will be necessary. To do so will
require identifying a phenotype that can be relatively easily measured and quantifying the degree
to which this phenotype is under genetic control.

17
Genetic parameter estimates of heat tolerance for beef cattle were published by Da Silva
(1973), three decades after Rhoad (1940) first suggested selecting cattle for adaptation traits,
especially for heat resistance. Da Silva (1973) reported heritability estimates of heat tolerance
related traits in 192 Brazilian composite cattle from what is known as the Canchin breed. The
author reported heritability estimates for initial rectal temperature and respiratory rate of 0.11
and 0.59, respectively. However, exposing them to direct sun light during the hottest time of the
day, Da Silva (1973) reported a moderate heritability estimate (0.44) for rectal temperature and a
very high negative genetic correlation (-0.895) with average daily gain. Based on these findings
the author suggested that it should be possible for breeders to select cattle for heat tolerance and
average daily gain simultaneously. The findings of Da Silva (1973) confirmed similar previous
studies in dairy cows. Seath (1947) studied heat tolerance in 52 Jersey and 68 Holstein cows and
reported heritability estimates of 0.15 to 0.31 and 0.77 to 0.84 for rectal temperature and
respiratory rate, respectively. Legates (1953) also reported heritability estimates of 0.22 to 0.30
and 0.34 to 0.54 for rectal temperature and respiratory rate, respectively. Turner (1982) studied
rectal temperature in relation to fertility in cows and reported a heritability estimate of rectal
temperature of 0.25. Mackinnon et al. (1991) reported a similar heritability estimate of 0.19 for
rectal temperature from a study of adaptation traits and growth in tropical cattle. Burrow (2001)
performed a study between production, adaptation and temperament traits of tropical beef cattle
and reported a low heritability estimate of 0.18 for repeated rectal temperature. Ravagnolo and
Misztal (2000) reported a heritability estimate of 0.17 for heat tolerance using more than 15,000
Holsteins. Dikmen et al. (2012) also reported heritability estimate of rectal temperature of 0.17 in
dairy cows which falls into the range of that reported by Seath (1947). Nguyen et al. (2016)
performed a study of heat tolerance to phenotypic variation for milk, fat and protein yields on

18
366, 835 Holstein and 76, 852 Jersey cows in Australia. The authors defined heat tolerance as the
rate of reduction of production during heat stress and reported a heritability estimate for heat
tolerance of 0.19, 0.17, 0.17 for Holsteins and 0.24, 0.18 and 0.18 for Jerseys, respectively.
Howard et al. (2014) reported a posterior heritability estimate of 0.68 and 0.21 for summer and
winter measurements of hourly tympanic and vaginal body temperature of 239 crossbred beef
cattle. All the aforementioned studies have confirmed the existence of genetic variation for
adaptation traits, especially for heat tolerance. Variation exists both within and between breeds,
which ultimately shows that there is a room for genetic improvement of livestock for adaptation
using either structured crossbreeding or within-breed selection.
Genomic Selection
Quantitative genetics is known as the study of complex traits based on an infinitesimal
model, which states that a trait is controlled by many genes with each one contributing a small
amount, but also recognizing that environmental factors play a role (Bulmer, 1980; Dekkers et
al., 2002). For more than four decades, domestic animals of agricultural importance have been
artificially selected to be parents of the next generation based on their phenotype record and
pedigree for the traits of economically important (Dekkers, 2012). Statistical methods of best
linear unbiased prediction (BLUP) are used to estimate the breeding value of animals. Animals
are ranked and selected according to their EBV (Dekkers, 2012; Dekkers et al., 2002). Enormous
genetic improvement of livestock through conventional breeding schemes has been possible due
to these methods, but genetic gain can be slow and time consuming. Moreover, conventional
breeding schemes present limitations relative to desired economic traits that are
difficult/expensive to measure, traits with low heritability and those that take a longer period of
time to measure (Dekkers, 2012). However, with the recent advancement of molecular high-

19
throughput technology and low cost of genotyping, genomic selection came to play a significant
role in overcoming the shortcomings of conventional breeding schemes.
Selecting animals based on their estimated genomic breeding values (GBV) is known as
genomic selection. The name genomic selection was first presented by Haley and Visscher in
1998 (Meuwissen, 2007), but Meuwissen et al. (2001) introduced and showed the methodologies
first. It is a form of marker-assisted selection, where breeding schemes are designed to develop
prediction equations using phenotype and genotype information from a reference population
which ultimately will be used to estimate genomic breeding values of livestock with limited
phenotype and genotype records (Pryce and Daetwyler, 2012). The fundamental concept of
genomic selection is based on selecting animals/plants using dense markers of single nucleotide
polymorphisms (SNPs) that cover the whole genome and at least some of them are assumed to be
in linkage disequilibrium (LD) with the quantitative trait locus (QTL). The main advantage of
genomic selection over conventional selection is the ability to increase the accuracy of
identifying genetically superior animals’ earlier in life (Berry, 2014). The three major factors that
determine the accuracy of the prediction of true genetic value of an animal/plant through
genomic selection are the heritability of the trait, the number of animals in the reference
population as well as the extent of linkage disequilibrium (LD) between markers and quantitative
trait loci (QTL) (Daetwyler et al., 2008; Goddard, 2009; Meuwissen, 2009).
Since Meuwissen et al. (2001) demonstrated how to estimate the genetic value of an
animal from genetic markers across the whole genome using simulation, genomic selection has
become pervasive across many livestock and plant industries. Implementation of genomic
selection required the redesign of existing breeding programs. The effect of genomic selection
has varied across all major livestock sectors, but the dairy industry was the first livestock

20
industry to implement genomic selection on a wide-scale and is the most recognized for the
progress made by incorporating genomic information in breeding value estimation. Being able
to select animals at an early stage of life thereby shortening the generation interval is one of the
benefits of genomic selection over conventional breeding strategies. Schaeffer (2006) reported
based on a cost-benefit analysis that replacing traditional EBV-based selection by genomic
selection in the dairy industry could result in a reduction of costs by 92% while attaining double
the genetic improvement compared to selecting animals using progeny-testing methods. De Roos
et al. (2011) studied the rate of genetic gain due to selecting animals earlier in life using genomic
selection in comparison with selection of proven bulls in dairy cows and showed that rate of
genetic gain could be doubled through implementation of the former method. Similar research
was also performed by König et al. (2009). The authors compared progeny testing dairy breeding
scheme with genomic selection breeding scheme approach and suggested that the ultimate
economic benefit of dairy industry from implementing genomic breeding scheme came from the
reduction of generation interval and costs associated with it. It is a well-known fact that dairy
industry adopted genomic selection ahead of most of the other livestock sectors mainly due to its
massive and well organized phenotypic and pedigree database as well as breeding structure,
which subsequently led into a successful implementation and integration of national genetic
evaluations of various countries since 2009 (Berry et al., 2016; Spelman et al., 2013).
Often, selection of animals in beef cattle breeding is performed based on market specific
demand (Jonas and Koning, 2015). As a result, selection in beef cattle has led to increased rib
eye area, marbling scores as well early growth (Garrick, 2011). However, for a trait complex that
is much more difficult to measure and is lower in heritability, such as reproduction, there was no
evidence to support any genetic change (Garrick, 2011). However, adoption and implementation

21
of genomic selection in the U.S. beef industry is not as broadly implemented as in dairy cattle
breeding (Meuwissen et al., 2016), perhaps because of its unique breeding structure. It is
common knowledge that selection candidates in beef cattle breeding have some of their
individual phenotypes recorded before selection decisions are made (Boerner et al., 2014;
Johnston et al., 2012). Moreover, beef cattle breeding often uses natural service bulls which in
turn has restricted the impact of genomic selection in contrast to the dairy breeding structure, in
which usage of artificial insemination is very common (Todd et al., 2011). Schaeffer (2006) and
König et al. (2009) have shown that most of the economic benefit of genomic selection came
from increasing the accuracy of selection thereby shortening the generation interval and costs
associated with it, which is one of the main driving forces of genomic selection success along
with other factors in dairy cattle breeding. Therefore, the beef cattle industry will likely benefit
to a lesser extent as compared to dairy cattle breeding from the implementation of genomic
selection relative to reducing the generation interval. However, beef cattle breeding will
definitely benefit from other advantages that genomic selection has to offer. For example, it can
benefit from incorporating genomic information into breeding goals thereby increasing selection
accuracy for traits that are difficult/expensive to measure and/or require slaughtering the animal
or for traits measured late in life and those that are lowly heritable. Traits such as feed efficiency,
carcass quality and reproduction are some of the desired economic traits that beef cattle breeding
can benefit from the implementation of genomic selection (Swan et al., 2012). One of the
challenges of beef cattle breeding is that breeding values are still less accurate than dairy cattle
(Johnston et al., 2012). Moreover, genetic markers in beef used to improve desired economic
traits fail to show reliable result across populations (Allan and Smith, 2008). In addition, limited
number of training populations and effective population size are part of the reasons for lagging

22
behind the implementation of genomic selection in beef cattle breeding (Johnston et al., 2012).
Attaining higher prediction accuracy requires measurement of novel phenotypes from large
populations (Pollak et al., 2012), otherwise significant SNP identified could be spurious. De
Roos et al. (2009) pointed out that in order to increase the prediction accuracy, merging genomic
data of different countries as well as breeds is necessary. Moreover, Pollak et al. (2012) also
suggested that usage of high density markers could improve accuracy of prediction in
populations that are distantly related. Therefore, beef cattle breeding perhaps can take the
advantage of increasing the accuracy of estimated breeding values through genomic predictions
of desired economic traits that are already in continuous genetic evaluations as well as traits that
are expensive/difficult to measure, sex-limited and those measured late in life, or require the
death of the animal (MacNeil, 2016).
Genome-wide association study (GWAS)
With the development of new technologies in molecular genetics as well as affordable
genotyping costs associated with it, GWAS have been made feasible by the identification of
thousands of SNPs across the whole genome of humans, livestock and plants species.
Implementation of GWAS requires analyzing DNA sequence variants (mainly SNPs) across
whole-genome of an organism along with its phenotype in order to identify genomic regions that
are truly associated with the desired trait of interest. The fundamental concept of GWAS
implementation is based on the assumption that a significant association can be detected between
the genetic variants and the economic trait of interest because the SNPs are in LD with the QTL.
GWAS is a relatively new technique in agricultural livestock compared with other
mapping techniques that have been used before. Linkage analysis and candidate gene techniques
were used to decipher genes that affect complex economic traits of interest in domestic animals

23
before GWAS projects first started in humans. However, the availability and discovery of large
numbers of genetic variants in different livestock species helped enormously the implementation
of GWAS in the animal breeding and genetics field.
Genes involved in heat/cold stress response
As many other desired economic traits, heat tolerance seems to fall into category of
complex traits which are influenced by many genes across the whole genome. Several research
studies showed that response to environmental stress (heat/cold) are controlled by many genes in
livestock species as well as humans (Dikmen et al., 2012, 2013; Hayes et al., 2009). Page et al.
(2006) performed a genome-wide analysis in humans and found that heat shock factors (HSFs)
have been involved as significant first responders to a rise in cell temperature and they are also
associated to cellular adaptation and survival. The HSFs are transcription factors that control heat
shock proteins (HSPs) expression through interaction with a specific DNA sequence in the
promotor, which are known as heat shock element (HSE) (Akerfelt et al., 2010; Anckar and
Sistonen, 2011; Morimoto, 1998). Heat shock proteins (HSPs) are recognized as proteins
expressed during a significant heat shock (Lindquist 1986). Families of heat shock proteins that
are associated to thermal regulation are HSP40, HSP60, HSP70 and HSP90. Moreover, HSPs
found to be the main proteins synthesized by cells during both extreme temperature elevation and
shortly after (Lindquist, 1986). Hansen (1999, 2015) described that the molecular basis of
thermotolerance is not yet well-known, but there are suggestions for heat shock proteins
involvement during heat stress which directly affects the function of the oocyte and embryo.
Olson et al. (2003) also discovered that a slick hair gene plays a role in producing short
sleek hair coat in cattle. The slick hair gene is the only gene identified at the SLICK locus in
Senepol and Criollo breeds and is inherited as a single dominant gene. Mariasegaram et al.

24
(2007) and Flori et al. (2012) were able to map the SLICK gene to bovine chromosome 20.
Cattle with slick gene are recognized as thermotolerant. The following table adopted from the
literature review by Rolf (2015), describes the different pathways and/or genes identified in
genome-wide association studies.

25
Table 2. List of pathways and/or genes that have been identified in genomic studies as potential
candidate genes for body temperature regulation, (Adapted from Rolf, 2015).
Pathway/Function Gene (s) Publication
Cellular response to stress STAC, WRNIP1, MLH1,
RIPK1, SMC6, GEM1
Howard et al., 2014
Response to heat STAC Howard et al., 2014
Gap junction TUBB2A, TUBB2B Howard et al., 2014
Cellular response to stress CCNG, TNRC6A Howard et al., 2014
Apoptosis FGD3, G2E3, RASA1, CSTB,
DAPK1, MLH1, RIPK1,
SERPINB9, HMGB1
Howard et al., 2014
Ion transport CACNG3, CLCN4, PRKCB,
TRPC5, KCNS3, SLC22A23,
TRPC4
Howard et al., 2014
Thyroid hormone regulation DIO2 Howard et al., 2014
Body weight and feed intake NBEA Howard et al., 2014
Heat shock protein response HSPH1, TRAP1 Howard et al., 2014
Respiration ITGA9 Howard et al., 2014
Calcium ion and protein
binding
NCAD Dikmen et al., 2012
Protein ubiquitination RFWD12, KBTBD2, CEP170,
PLD5
Dikmen et al., 2012

26
Thyroid hormone regulation SLCO1C1 Dikmen et al., 2012
Insulin signaling PDE3A Dikmen et al., 2012
RNA metabolism LSM5, SNORD14, SNORA19,
U1, SCARNA3
Dikmen et al., 2012
Transaminase activity GOT1 Dikmen et al., 2012
Apoptosis, cell signaling FGF4 Hayes et al., 2009
XM_865508 (G3PD-like) Hayes et al., 2009
Summary
Research evidence shows that heat/cold stress is becoming one of the main limitations on
animal productivity, as well as a major contributor of production costs associated with it. As a
result, it has drawn the attention of the scientific community to look for different ways of
minimizing or if possible, avoiding the negative consequences of it through the implementation
of different mitigation strategies as well as through the development of selection tools.
Exploiting the current development of technology in molecular biology and incorporating
genomic information into conventional breeding programs for the purpose of selecting parents of
the next generation could possibly increase the accuracy of selection for novel traits such as
tolerance to extreme climates. Several studies showed that the ability of animals to withstand
heat/cold stress is low to moderately heritable which suggests that reconsideration of current
breeding goals is necessary in order to incorporate this important trait complex. Without
selection tools for adaptation, the genetic diversity of economically important agricultural
species in the future may be restricted to those that are regionally adapted via natural selection
and thus production potential could be limited.

27
References
Aggarwal, A., & Upadhyay, R. (2012). Heat stress and animal productivity. Springer Science &
Business Media.
Åkerfelt, M., Morimoto, R. I., & Sistonen, L. (2010). Heat shock factors: integrators of cell
stress, development and lifespan. Nature reviews Molecular cell biology, 11(8), 545-555.
Allan, M. F., & Smith, T. P. L. (2008). Present and future applications of DNA technologies to
improve beef production. Meat Science, 80(1), 79-85.
Anckar, J., & Sistonen, L. (2011). Regulation of HSF1 function in the heat stress response:
implications in aging and disease. Annual review of biochemistry, 80, 1089-1115.
Armstrong, D. (1994). Heat stress interaction with shade and cooling. Journal of dairy science,
77(7), 2044-2050.
Barker, J. S. S. (2009). Defining fitness in natural and domesticated populations. In Adaptation
and fitness in animal populations (pp. 3-14). Springer Netherlands.
Berry, D. P. PROCEEDINGS GENERAL SESSION 2: FOCUS ON THE FEEDLOT. Friday,
June 20, 2014.
Berry, D. P., Garcia, J. F., & Garrick, D. J. (2016, January). Development and implementation of
genomic predictions in beef cattle. American Society of Animal Science.
Blackshaw, J. K., & Blackshaw, A. W. (1994). Heat stress in cattle and the effect of shade on
production and behaviour: a review. Australian Journal of Experimental Agriculture, 34(2), 285-
295.
28
Boerner, V., Johnston, D. J., & Tier, B. (2014). Accuracies of genomically estimated breeding
values from pure-breed and across-breed predictions in Australian beef cattle. Genetics Selection
Evolution, 46(1), 61.
Bonsma, J. C. 1973. Crossbreeding for adaptability. In M. Koger, T. J. Cunha and A. C. Warnick
(Ed.) Crossbreeding Beef Cattle. Series 2. University of Florida Press, Gainesville.
Bonsma, JC 1973. Crossbreeding for adaptability.
Brosh, A., Aharoni, Y., Degen, A. A., Wright, D., & Young, B. A. (1998). Effects of solar
radiation, dietary energy, and time of feeding on thermoregulatory responses and energy balance
in cattle in a hot environment. Journal of Animal Science, 76(10), 2671-2677.
Brown-Brandl, T. M., Eigenberg, R. A., & Nienaber, J. A. (2006). Heat stress risk factors of
feedlot heifers. Livestock Science, 105(1), 57-68.
Bryant, J. R., Lopez-Villalobos, N., Pryce, J. E., Holmes, C. W., Johnson, D. L., & Garrick, D. J.
(2007). Environmental sensitivity in New Zealand dairy cattle. Journal of Dairy Science, 90(3),
1538-1547.
Buffington, D. E., Collier, R. J., & Canton, G. H. (1983). Shade management systems to reduce
heat stress for dairy cows in hot, humid climates. Transactions of the ASAE, 26(6), 1798-1802.
Bulmer, M. G. (1980). The mathematical theory of quantitative genetics. Clarendon Press., 1980.
Burrow, H. M. (2001). Variances and covariances between productive and adaptive traits and
temperament in a composite breed of tropical beef cattle. Livestock Production Science, 70(3),
213-233.

29
Carpenter, Z. L. (1973). Effects of crossbreeding on carcass characteristics. Crossbreed Beef
Cattle Ser Univ Fla.
Carstens, G. E., Johnson, D. E., & Ellenberger, M. A. (1989). Energy metabolism and
composition of gain in beef steers exhibiting normal and compensatory growth. In 11.
Symposium on Energy Metabolism of Farm Animals. Lunteren (Netherlands).
Cartwright, T. C. (1955). Responses of beef cattle to high ambient temperatures. Journal of
Animal Science, 14(2), 350-362.
Charoensook, R., Gatphayak, K., Sharifi, A. R., Chaisongkram, C., Brenig, B., & Knorr, C.
(2012). Polymorphisms in the bovine HSP90AB1 gene are associated with heat tolerance in Thai
indigenous cattle. Tropical animal health and production, 44(4), 921-928.
CM Dekkers, J. (2012). Application of genomics tools to animal breeding. Current genomics,
13(3), 207-212.
Collier, R. J., Coppola, C., & Wolfgram, A. (2003). Novel approaches for the alleviation of
climatic stress in farm animals. Interactions between climate and animal production. EAAP
Technical Series, (7), 61-71.
Da Silva, R. G. (2006). Weather and climate and animal production. Update of the guide to
agricultural meteorological practices, 563-567.
Da Silva, R. G., La Scala Jr, N., & Tonhati, H. (2003). Radiative properties of the skin and
haircoat of cattle and other animals. Transactions of the ASAE, 46(3), 913.
Daetwyler, H. D., Villanueva, B., & Woolliams, J. A. (2008). Accuracy of predicting the genetic
risk of disease using a genome-wide approach. PloS one, 3(10), e3395.

30
De Roos, A. P. W., Hayes, B. J., & Goddard, M. E. (2009). Reliability of genomic predictions
across multiple populations. Genetics, 183(4), 1545-1553.
De Roos, A. P. W., Schrooten, C., Veerkamp, R. F., & Van Arendonk, J. A. M. (2011). Effects
of genomic selection on genetic improvement, inbreeding, and merit of young versus proven
bulls. Journal of Dairy Science, 94(3), 1559-1567.
Dekkers, J. C. (2002). The use of molecular genetics in the improvement of agricultural
populations. Nature Reviews Genetics, 3(1), 22-33.
Dikmen, S., & Hansen, P. J. (2009). Is the temperature-humidity index the best indicator of heat
stress in lactating dairy cows in a subtropical environment?. Journal of dairy science, 92(1), 109-
116.
Dikmen, S., Cole, J. B., Null, D. J., & Hansen, P. J. (2012). Heritability of rectal temperature and
genetic correlations with production and reproduction traits in dairy cattle. Journal of dairy
science, 95(6), 3401-3405.
Dikmen, S., Cole, J. B., Null, D. J., & Hansen, P. J. (2013). Genome-wide association mapping
for identification of quantitative trait loci for rectal temperature during heat stress in Holstein
cattle. PLoS One, 8(7), e69202.
Du Preez, J. H., Giesecke, W. H., & Hattingh, P. J. (1990). Heat stress in dairy cattle and other
livestock under southern African conditions. I. Temperature-humidity index mean values during
the four main seasons.
Edriss, V., Guldbrandtsen, B., Lund, M. S., & Su, G. (2013). Effect of marker‐data editing on the
accuracy of genomic prediction. Journal of Animal Breeding and Genetics, 130(2), 128-135

31
Emery, J. (2004). Heat stress in poultry-Solving the problem.
Evans, J. V. (1963). Adaptation to subtropical environments by Zebu and British breeds of cattle
in relation to erythrocyte characters. Australian Journal of Agricultural Research, 14(4), 559-571.
Falconer, D. S., Mackay, T. F., & Frankham, R. (1996). Introduction to quantitative genetics (4th
edn). Trends in Genetics, 12(7), 280.
Flori, L., Gonzatti, M. I., Thevenon, S., Chantal, I., Pinto, J., Berthier, D., ... & Gautier, M.
(2012). A quasi-exclusive European ancestry in the Senepol tropical cattle breed highlights the
importance of the slick locus in tropical adaptation. PloS one, 7(5), e36133.
Freeman BM (1987) The stress syndrome. World’s Poult Sci J 43:15–19
Garrick, D. J. (2011). The nature, scope and impact of genomic prediction in beef cattle in the
United States. Genetics Selection Evolution, 43(1), 17.
Gaughan, J. B., Mader, T. L., Holt, S. M., & Lisle, A. (2008). A new heat load index for feedlot
cattle. Faculty Papers and Publications in Animal Science, 613.
Gaughan, J. B., Mader, T. L., Holt, S. M., & Lisle, A. (2008). A new heat load index for feedlot
cattle. Faculty Papers and Publications in Animal Science, 613.
Goddard, M. (2009). Genomic selection: prediction of accuracy and maximisation of long term
response. Genetica, 136(2), 245-257.
Habier, D., Fernando, R. L., Kizilkaya, K., & Garrick, D. J. (2011). Extension of the Bayesian
alphabet for genomic selection. BMC bioinformatics, 12(1), 186.
Hahn, G. L. (1981). Housing and management to reduce climatic impacts on livestock. Journal
of Animal Science, 52(1), 175-186.

32
Hansen, P. J. (1999). Possible roles for heat shock protein 70 and glutathione in protection of the
mammalian preimplantation embryo from heat shock. Ann. Rev. Biomed. Sci, 1, 5-29.
Hansen, P. J. (2004). Physiological and cellular adaptations of zebu cattle to thermal stress.
Animal reproduction science, 82, 349-360.
Hansen, P. J. (2015). Genetic variation in resistance of the preimplantation bovine embryo to
heat shock. Reproduction, Fertility and Development, 27(1), 22-30.
Hatfield, J. L., Boote, K. J., Kimball, B. A., Ziska, L. H., Izaurralde, R. C., Ort, D., ... & Wolfe,
D. (2011). Climate impacts on agriculture: implications for crop production. Agronomy journal,
103(2), 351-370.
Hatfield, J. L., Gitelson, A. A., Schepers, J. S., & Walthall, C. L. (2008). Application of spectral
remote sensing for agronomic decisions. Agronomy Journal, 100(Supplement_3), S-117.
Hayes, B. J., Bowman, P. J., Chamberlain, A. J., & Goddard, M. E. (2009). Invited review:
Genomic selection in dairy cattle: Progress and challenges. Journal of dairy science, 92(2), 433-
443.
Hetzel, D. J. S., & Seifert, G. W. (1986). Breeding objectives and selection traits for extensive
beef cattle production in the tropics.
Howard, J. T., Kachman, S. D., Snelling, W. M., Pollak, E. J., Ciobanu, D. C., Kuehn, L. A., &
Spangler, M. L. (2014). Beef cattle body temperature during climatic stress: a genome-wide
association study. International journal of biometeorology, 58(7), 1665-1672.
Howes, J. R. (1963). Blood composition and physiology of Brahman and Herefords.
Crossbreeding Beef Cattle. University of Florida Press, Gainesville.

33
Illumina, Inc. (2010) Technical note: DNA analysis, Infinium® genotyping data analysis. San
Diego (CA). Illumina, Inc. 9 p. pub. no. 9702007-005.
Johnston, D. J., Tier, B., & Graser, H. U. (2012). Beef cattle breeding in Australia with
genomics: opportunities and needs. Animal Production Science, 52(3), 100-106.
Jonas, E., & de Koning, D. J. (2015). Genomic selection needs to be carefully assessed to meet
specific requirements in livestock breeding programs. Frontiers in genetics, 6.
Kerr, S. R. (2015). Livestock heat stress: recognition, response, and prevention.
Key, N., Sneeringer, S., & Marquardt, D. (2014). Climate change, heat stress, and US dairy
production.
Khazzaka, A., Figwer, P., Poirel, M. T., Serrar, M., & Franck, M. (2006). Hsp70 response in pigs
is affected by their Halothane genotypes after heat stress. Journal of Thermal Biology, 31(8),
605-610.
Kinghorn, B. P., Van Eenennaam, A. L., & MacNeil, M. D. Targeting multiple end-uses in beef
cattle breeding programs. Proceedings, Applied Reproductive Strategies in Beef Cattle • August
17 &18, 2015 • Davis, CA.
Klungland, H., & Våge, D. I. (2003). Pigmentary switches in domestic animal species. Annals of
the New York Academy of Sciences, 994(1), 331-338.
Koger, M., & Wamkk, A. C. (1963). Crossbreeding beef cattle. Crossbreeding beef cattle.
König, S., Simianer, H., & Willam, A. (2009). Economic evaluation of genomic breeding
programs. Journal of Dairy Science, 92(1), 382-391.

34
Legates, J. E. 1953. Studies on heat tolerance. Re-port of North Carolina Project to Regional
Techn. Committee Conf., Tifton, Ga., April 20-21 (mimeo.).
Lindquist, S. (1986). The heat-shock response. Annual review of biochemistry, 55(1), 1151-
1191.
Liu, Y. X., Zhou, X., Li, D. Q., Cui, Q. W., & Wang, G. L. (2010). Association of ATP 1 A 1
gene polymorphism with heat tolerance traits in dairy cattle. Genetics and Molecular Research,
9(2), 891-896.
Liu, Y., Li, D., Li, H., Zhou, X., & Wang, G. (2011). A novel SNP of the ATP1A1 gene is
associated with heat tolerance traits in dairy cows. Molecular biology reports, 38(1), 83-88.
Lofgreen, G. P., Givens, R. L., Morrison, S. R., & Bond, T. E. (1975). Effect of drinking water
temperature on beef cattle performance. Journal of Animal Science, 40(2), 223-229.
Mackinnon, M. J., Meyer, K., & Hetzel, D. J. S. (1991). Genetic variation and covariation for
growth, parasite resistance and heat tolerance in tropical cattle. Livestock Production Science,
27(2-3), 105-122.
MacNeil, M. D. (2016). Value of genomics in breeding objectives for beef cattle. Revista
Brasileira de Zootecnia, 45(12), 794-801.
Mader, T. L., Johnson, L. J., & Gaughan, J. B. (2010). A comprehensive index for assessing
environmental stress in animals. Journal of Animal Science, 88(6), 2153-2165.
Mariasegaram, M., Chase, C. C., Chaparro, J. X., Olson, T. A., Brenneman, R. A., & Niedz, R.
P. (2007). The slick hair coat locus maps to chromosome 20 in Senepol‐derived cattle. Animal
genetics, 38(1), 54-59.

35
Means, S. L., Bucklin, R. A., Nordstedt, R. A., Beede, D. K., Bray, D. R., Wilcox, C. J., &
Sanchez, W. K. (1992). Water application rates for a sprinkler and fan dairy cooling system in
hot, humid climates. Applied Engineering in Agriculture, 8(3), 375-379.
Meehl, G. A., Tebaldi, C., Walton, G., Easterling, D., & McDaniel, L. (2009). Relative increase
of record high maximum temperatures compared to record low minimum temperatures in the US.
Geophysical Research Letters, 36(23).
Meuwissen T.H.E., Hayes B.J., Goddard M.E. (2001) Prediction of total genetic value using
genome-wide dense marker maps. Genetics, 157, 1819–1829.
Meuwissen, T. (2007). Genomic selection: marker assisted selection on a genome wide scale.
Journal of animal Breeding and genetics, 124(6), 321-322.
Meuwissen, T. H. (2009). Accuracy of breeding values of' unrelated individuals predicted by
dense SNP genotyping. Genetics Selection Evolution, 41(1), 35.
Meuwissen, T., Hayes, B., & Goddard, M. (2016). Genomic selection: A paradigm shift in
animal breeding. Animal frontiers, 6(1), 6-14.
Moore, R. L., Essig, H. W., & Smithson, L. J. (1975). Influence of breeds of beef cattle on ration
utilization. Journal of Animal Science, 41(1), 203-207.
Morimoto, R. I. (1998). Regulation of the heat shock transcriptional response: cross talk between
a family of heat shock factors, molecular chaperones, and negative regulators. Genes &
development, 12(24), 3788-3796.
Morrison, S. R., Givens, R. L., & Lofgreen, G. P. (1973). Sprinkling cattle for relief from heat
stress. Journal of Animal Science, 36(3), 428-431.

36
Nguyen, T. T., Bowman, P. J., Haile-Mariam, M., Pryce, J. E., & Hayes, B. J. (2016). Genomic
selection for tolerance to heat stress in Australian dairy cattle. Journal of dairy science, 99(4),
2849-2862.
NRC (2001) in Nutrient Requirements of Dairy Cattle, 7th edn National Acad Sci DC,
Olson, T. A., Lucena, C., Chase, C. C., & Hammond, A. C. (2003). Evidence of a major gene
influencing hair length and heat tolerance in cattle. Journal of Animal Science, 81(1), 80-90.
Page, T. J., Sikder, D., Yang, L., Pluta, L., Wolfinger, R. D., Kodadek, T., & Thomas, R. S.
(2006). Genome-wide analysis of human HSF1 signaling reveals a transcriptional program
linked to cellular adaptation and survival. Molecular bioSystems, 2(12), 627-639.
Phillips, R. W. (1963). Beef cattle in various areas of the world. Crossbreeding Beef Cattle.
Series I, 3.
Pollak, E. J., Bennett, G. L., Snelling, W. M., Thallman, R. M., & Kuehn, L. A. (2012).
Genomics and the global beef cattle industry1. Animal Production Science, 52(3), 92-99.
Pryce, J. E., & Daetwyler, H. D. (2012). Designing dairy cattle breeding schemes under genomic
selection: a review of international research. Animal Production Science, 52(3), 107-114.
Randel, R. D. (2005). Reproduction of Bos indicus breeds and crosses. A compilation of research
results involving tropically adapted beef cattle breeds.
Ravagnolo, O., & Misztal, I. (2000). Genetic component of heat stress in dairy cattle, parameter
estimation. Journal of Dairy Science, 83(9), 2126-2130.

37
Reinhardt, C. D., & Brandt, R. T. (1994). Effect of morning vs evening feeding of limited-fed
Holsteins during summer months. Kansas State University Cattleman’s Day Report, Manhattan,
KS.
Rhoad, A. O. (1940). A Method of Assaying Genetic Differences in the Adaptability of Cattle to
Tropical and Subtropical Climates. Empire Journal of Experimental Agriculture, 8, 190-198.
Rick, R. F. (1962). Studies on the reactions of animals to infestation with ticks. VI. Resistance of
cattle to infestation with the tick Boophilus microplus. Aust. J. Agric. Res, 13, 532-550.
Rosenzweig, C., Casassa, G., Karoly, D. J., Imeson, A., Liu, C., Menzel, A., ... & Hanson, C. E.
(2007). Assessment of observed changes and responses in natural and managed systems. Climate
change, 2007, 79.
Schaeffer, L. R. (2006). Strategy for applying genome‐wide selection in dairy cattle. Journal of
animal Breeding and genetics, 123(4), 218-223.
Seath, D. M. (1947). Heritability of heat tolerance in dairy cattle. Journal of Dairy Science,
30(3), 137-144.
Shearer, J. K., Bray, D. R., Beede, D. K., & Bucklin, R. A. (1996). Utilizing shade and cooling to
reduce heat stress. In Professional Dairy Management Seminar. Dubuque, IA (p. 1).
Smith, J. F., Brouk, M. J., & Harner III, J. P. (2002, September). Managing heat stress in dairy
facilities. In the AABP proceedings (Vol. 35, pp. 71-76).
Sonna, L. A., Fujita, J., Gaffin, S. L., & Lilly, C. M. (2002). Invited review: effects of heat and
cold stress on mammalian gene expression. Journal of Applied Physiology, 92(4), 1725-1742.

38
Spelman, R. J., Hayes, B. J., & Berry, D. P. (2013). Use of molecular technologies for the
advancement of animal breeding: genomic selection in dairy cattle populations in Australia,
Ireland and New Zealand. Animal Production Science, 53(9), 869-875.
Stonaker, H. H. (1973). Genetic principles in improving beef cattle breeds in crossbreeding.
Crossbreed Beef Cattle Ser Univ Fla.
St-Pierre, N. R., Cobanov, B., & Schnitkey, G. (2003). Economic losses from heat stress by US
livestock industries. Journal of dairy science, 86, E52-E77.
Strother, G. R., Burns, E. C., & Smart, L. I. (1974). Resistance of purebred Brahman, Hereford,
and Brahman times Hereford crossbred cattle to the lone star tick, Amblyomma americanum
(Acarina: Ixodidae). Journal of medical entomology, 11(5), 559-563.
Swan, A. A., Johnston, D. J., Brown, D. J., Tier, B., & Graser, H. U. (2012). Integration of
genomic information into beef cattle and sheep genetic evaluations in Australia. Animal
Production Science, 52(3), 126-132.
Tebaldi, C., Hayhoe, K., Arblaster, J. M., & Meehl, G. A. (2006). Going to the extremes.
Climatic change, 79(3), 185-211.
Todd, D. L., Woolliams, J. A., & Roughsedge, T. (2011). Gene flow in a national cross-breeding
beef population. animal, 5(12), 1874-1886.
Turner, H. G. (1982). Genetic variation of rectal temperature in cows and its relationship to
fertility. Animal Science, 35(3), 401-412.
Turner, J. W. (1980). Genetic and biological aspects of Zebu adaptability. Journal of Animal
Science, 50(6), 1201-1205.

39
UNFPA, U., & UN-HABITAT, I. O. M. (2013). Population dynamics in the post-2015
development agenda: Report of the global thematic consultation on population dynamics. United
Nations. URL http://www. worldwewant2015. org/file/313464/download/340868.
Van Eenennaam, A. L., Van Der Werf, J. H. J., & Goddard, M. E. (2011). The value of using
DNA markers for beef bull selection in the seedstock sector. Journal of Animal Science, 89(2),
307-320. Washington, pp 318–319.
West, J. W. (1994). Interactions of energy and bovine somatotropin with heat stress. Journal of
Dairy Science, 77(7), 2091-2102.
West, J. W. (2003). Effects of heat-stress on production in dairy cattle. Journal of dairy science,
86(6), 2131-2144.
Yousef, M. K. (1985). Stress physiology in livestock. Volume I. Basic principles. CRC press.
Yturria, F. D. (1973). Bos indicus. A brief history and description of some of the different
breeds. Pan American Zebu Assoc. Bull.
Zimin, A. V., Delcher, A. L., Florea, L., Kelley, D. R., Schatz, M. C., Puiu, D., ... & Marçais, G.
(2009). A whole-genome assembly of the domestic cow, Bos taurus. Genome biology, 10(4),
R42.

40
GENOME-WIDE ASSOCIATION STUDY FOR THE RELATIONSHIP BETWEEN
TEMPERATURE AND FEED INTAKE IN BEEF CATTLE
Abstract
The interaction of livestock with the environment they live in is complex and plays a
significant role in their production performance, which also depends on location and
management practices. Climate change is projected to increase temperature globally. As a result,
climate change will most likely aggravate the pressure from different sources of stressors on the
current agricultural production system in general and in livestock specifically. Environmental
conditions, such as changes in ambient temperature, can cause changes in animal behavior and
performance. In general, it is believed that as ambient temperature increases, dry matter intake
(DMI) of beef cattle decreases. However, our hypothesis was that the degree to which animals
adjust their daily DMI due to changes in ambient temperature is partially controlled by genetic
effects. Consequently, the objective of this study was to estimate the genetic component of the
regression of DMI on ambient temperature using an admixed beef cattle population consisting of
various crosses of Angus, Simmental, and Piedmontese (n = 239). Ambient temperatures were
received from a local weather station and DMI was collected via Calen gates. The feeding period
averaged 155 d with a range of 114 d to 189 d depending on the management group. Individual
animal regressions of DMI on average daily ambient temperature were performed using either
daily high or low temperatures over the entirety of the feeding period. Daily high temperatures
(°C) averaged 15.07 with a range of -17.21 to 38.25. Daily low temperatures (°C) averaged 2.37
with a range of -28.33 to 15.26. The corresponding intercept and regression coefficient for each
animal were used as phenotypes for a genome-wide association study (GWAS). Animals were
genotyped with the BovineSNP50 Beadchip. Data were analyzed using GenSel software and a

41
BayesC model fitting contemporary group (n = 4) and initial body weight (IBW) as fixed effects.
A MCMC chain of 100,000 iterations were used with the first 40,000 samples discarded as burn-
in. The proportion of SNPs having null effect (𝜋) was set to 0.995. Posterior mean heritability
estimates (PSD) for the analysis when daily high temperature was considered in the regression
and myostatin genotype (MG) was included as fixed effect in the model (model-1) were 0.27
(0.07) and 0.25 (0.08) for the intercept and slope, respectively Posterior mean heritability
estimates (PSD) for the analysis when daily high temperature was considered in the regression
and MG was not included as fixed effect in the model (model-2) were 0.68 (0.06) and 0.45 (0.08)
for the intercept and slope, respectively. Similarly, posterior mean heritability estimates (PSD)
for the analysis when daily low temperature was considered in the regression for model-1 were
0.29 (0.09) and 0.27 (0.08) for the intercept and slope, respectively. Posterior mean heritability
estimates (PSD) for the intercept and slope when the daily low temperature was considered in the
regression were 0.76 (0.05) and 0.48 (0.08), respectively. These results suggest that changes in
DMI due to changes in ambient temperature are under genetic control. Admittedly the population
under study is small and admixed, suggesting that the genomic heritability estimates contained
herein are potentially biased upward. However, the concept of applying this same procedure in
larger populations warrants further investigation as a means of identifying animals that are less
sensitive to environmental extremes.
Key Words: beef cattle, dry matter intake, environmental stress, genome-wide association study

42
Introduction
The interaction of livestock with the environment they live in is complex and plays a
significant role in their production performance, which also depends on location and
management practices. Climate change is projected to increase temperature globally (Tebaldi et
al., 2006; Walthall et al., 2013). As a result, climate change will most likely aggravate the
pressure from different sources of stressors on the current agricultural production system in
general (Hatfield et al., 2008, 2011). With the exception of some intensive production systems,
beef production in the U.S. is often in extensive production systems whereby beef cattle are
reared in complex environments in which they continuously face short and long term
environmental changes such as ambient temperature. As a result, beef cattle are vulnerable to
different environmental conditions and can experience both heat and cold stress.
Environmental factors contributing to heat stress are daily high ambient temperature, high
relative humidity, low air movement, solar radiation and heat wave. Moreover, due to their poor
sweating mechanism, beef cattle also acquire heat through the process of fermentation during
digestion. Even though animals are forced to adapt to certain environmental changes, these
changes can be very detrimental to their performance and production ability. Reduction of feed
intake and growth are among the common signs of beef cattle under heat stress. However, in
extreme cases, heat stress can also cause death contributing to a significant revenue loss to
producers.
Cattle maintain normal body temperature through balancing heat gain and loss, a process
known as thermoregulation. However, it is also a well-known fact that animals’ capacity to

43
acclimatize its metabolic rate to cope with temperature extremes can cause not only production
loss but also animal death (Walthall et al., 2013). Heat stress is a situation that occurs when
animals are unable to dissipate their heat load efficiently. Based on the duration and severity of
the stress, it can be described as acute or chronic. Beef cattle experience heat stress when an
imbalance between the internal heat production and their ability to dissipate it efficiently exist.
Decreased dry matter intake, reduced metabolic rate, increased respiratory rates and sweating are
some of the physiological signs that contribute negatively to the production ability of the
animals. Generally, as the ambient temperature increases animals eat less, which negatively
impacts the usage of energy for production. This negative correlation between dry matter intake
and high ambient temperature is well-documented. However, differences in an animal’s
physiological response and production performance under extreme heat stress is also partially
controlled by their underlying genetic makeup. Therefore, our hypothesis was that the degree to
which animals adjust their daily DMI due to changes in ambient temperature is partially
controlled by underlying genetic effects. Consequently, the objective of this study was to
estimate the genetic component of the regression of DMI on ambient temperature via a genome-
wide association study using an admixed beef cattle population consisting of various crosses of
Angus, Simmental, and Piedmontese.

44
Materials and Methods
Data
An admixed beef cattle population of steers and heifers (n = 239) of unknown pedigree
consisting of various percentages of Angus, Simmental and Piedmontese with serial body
weights and dry matter intake records were used in this study. The project was approved by the
University of Nebraska-Lincoln Institutional Animal Care and Use Committee.
As described by Howard et al. (2013), animals were genotyped before arrival to confirm
presence of the Piedmontese-derived myostatin mutation (C313Y). Animals with 0-copy (n= 84),
1-copy (n=96) and 2-copy (n=59) of the C313Y genotype (MG) were labelled as homozygous
normal, heterozygous and homozygous for inactive MG, respectively. All animals were
genotyped with the Illumina BovineSNP50 panel that included over 50,000 single nucleotide
polymorphisms (SNP). Cattle were fed in four groups over a 2-year period and dry matter intake
(DMI) were recorded via Calen a gate facility at the University of Nebraska Agricultural
Research and Development Center (ARDC). Individual feed bunks were filled each day and
refusals were calculated on average every 6 days with a range of 1 to 9 days. The time between 2
successive feed refusal collections were defined as a feeding period. Groups 1 (S1) and 2 (S2)
contained calf-fed steers and S1 were on feed from December 16, 2009 to June 24, 2010 and S2
were on feed from December 23, 2010 to August 12, 2011. Groups 3 (H2) and 4 (H1) contained
yearling heifers. H1 heifer group were on feed from July 28, 2010 to November 19, 2010 and H2
were on feed from July 20, 2011 to January 27, 2012. Each group was randomly assigned into 2
pens with approximately 30 cattle per pen. Cattle had access to water and were fed a diet that

45
satisfied NRC requirements. The finishing ration for group H1 and S1 contained wet distillers’
grain and soluble, a 1:1 blend of high moisture and dry rolled corn, grass hay and supplement at
35, 52, 8 and 5 percent of the diet.
The finishing ration for H2 and S2 contained modified distillers grain with soluble sweet bran, a
1:1 blend of high moisture and dry rolled corn, grass hay and supplement at 20, 20, 48, 8, and 4
percent of the diet. Over the 2-year feeding period cattle were neither implanted with nor fed
growth-promoting additives. The feeding period for groups S1 and S2 averaged 185.5 days (d)
with a range of 182 to 189 d and for groups H1 and H2 averaged 124.5 d with a range of 114 to
135 d. Average body weight and visually appraised external fat were used to determine when
groups of cattle were ready for harvest. Individual animal DMI was recorded periodically
ranging between 3 to 9 d for steers and between 2 to 10 d for heifers.
Statistical Analysis
Daily high (DH) and low (DL) ambient temperatures were received from a local public
weather station for the feeding periods of each group. Average daily high and low ambient
temperatures were centered to improve the biological interpretability of regression coefficients
(Schielzeth, 2010). Individual animal DMI were summed across four consecutive measurement
events and this sum was considered as a DMI phenotype for an individual. Individual animal
regressions of DMI on centered ambient temperature (either DH or DL) corresponding to the
feed intake period for each DMI phenotype were fitted using DMI phenotypes as described
above. These regressions were performed over the entirety of the feeding period. Model fit
summaries by group can be found in tables 1-8. Three animals (two steers and one heifer) were
removed from the analysis due to missing initial body weight (IBW) observation. Therefore, a

46
total number of 236 animals were used for the GWAS analysis. A summary of the phenotypes
and ambient temperatures used for the analysis are reported in tables 9 - 14.
Genome-wide association studies to estimate the proportion of phenotypic variation due
to additive genetic variation using a total of four traits were conducted: DH intercept and slope,
and DL intercept and slope. Illumina data analysis software was used to assign quality scores
(GenCall) for each genotype. If genotypes were missing or a GenCall score was below 0.20, they
were replaced with the mean allele frequency across all animals (Illumina, Inc 2010; Edriss et al.
2012). Exclusion of markers based on minor allelic frequency and deviations from Hardy–
Weinberg proportions were shown to have little impact on genetic prediction (Edriss et al.,
2012). As a result, all single nucleotide polymorphisms (SNP) were utilized for analysis in this
study and none were culled based on MAF. Data were analyzed and estimates of marker effects
and variances were attained by fitting all markers simultaneously and contemporary group (n =
4) and initial body weight (IBW) as fixed effects using a BayesC model (Habier et al., 2011) via
GenSel software (Version 0.9.2.045; Fernando and Garrick, 2008). Each trait was analyzed with
(Model-1) and without (Model-2) MG in the GWAS model as a fixed effect. The proportion of
SNP having null effect (π) was set to 0.995. A chain length of 100,000 iterations were run with
the first 40,000 discarded as burn-in. The results reported herein are the averages of 60,000
samples from a Markov Chain Monte Carlo chain.
Convergence of each analysis was met by starting with high and low a priori heritability
estimates until the posterior heritability estimates were trending down and up, respectively, and
an average value between them was taken as the a priori heritability for the final analysis. SNPs
were blocked into 1-Megabase (1-Mb) non-overlapping windows and the marker specific

47
posterior variance across SNP within a window was summed to give an estimate of the total
genetic variance for each window (n = 2,681).
Gene Ontology
The top 0.5% of 1-Mb windows (n ~ 13) that accounted for the largest proportion of the
additive genetic variance were extended by 0.5-Mb in both directions and a positional candidate
gene approach was conducted using cow genes build UMD_3.1 assembly (Zimin et al., 2009).
Human orthologues of beef cattle positional candidate genes were obtained using Ensembl Genes
90 database and the BioMart data mining tool
(https://www.ensembl.org/biomart/martview/e5a2abeadd0cfb919f0e1f493f388748).
Furthermore, functional annotation of human orthologues, identification of overrepresented gene
ontology terms, and pathway analysis was performed using bioinformatics tool of the database
for annotation, visualization and integrated discovery (DAVID v6.8) (https://david.ncifcrf.gov/).
Results and Discussion
Genetic Parameters
Mean posterior heritability estimates are presented in table 15. When MG was not fitted
in the model, the posterior mean heritability (PSD) estimates for the intercept and slope when the
daily high temperature was considered in the regression were 0.68 (0.06) and 0.45 (0.08),
respectively. Similarly, posterior mean heritability (PSD) estimates for the intercept and slope
when the daily low temperature was considered in the regression were 0.76 (0.05) and 0.48
(0.08), respectively. The mean posterior heritability estimates (PSD) when MG was fitted as a
fixed effect for DH were 0.27 (0.07) and 0.25 (0.08) for the intercept and slope, respectively.

48
Likewise, the mean posterior heritability estimates (PSD) for DL when MG was fitted in the
model were 0.29 (0.09) and 0.27 (0.08) for the intercept and slope, respectively. When MG was
fitted in the model the posterior heritability estimates decreased substantially. This was not
unexpected given previous studies using this population illustrated the impact of MG on
individual animal body temperature regulation (Howard et al., 2013). The sizable reduction in
the genomic heritability estimates are likely reflective of not only the impact of MG on this trait
complex, but also potentially due to having corrected for Piedmontese background more
generally when fitting MG as a fixed effect.
In general, the posterior mean heritability estimates of this study were within the range of
heritability estimates of body temperature regulation and respiration rate reported from previous
similar studies which ranged from 0.11 to 0.68 (Burrow, 2001; Da Silva, 1973; Dikmen et al.,
2012; Howard et al., 2014; Mackinnon et al., 1991; Seath and Miller, 1947; Turner, 1984).
Burrow (2001) used rectal temperatures as a measure of heat resistance in addition to other
phenotype measures used to estimate variances and co-variances between productive and
adaptive traits as well as temperament in a composite breed of tropical beef cattle. Burrow
(2001) showed a low heritability estimate of rectal temperature 0.18. Da Silva (1973) used both
respiration rate and rectal temperature record to estimate heritabilities and correlations of weight
and heat tolerance traits for a group of 192 bullocks and heifers of tropical beef cattle. Da Silva
(1973) found a heritability estimate for respiratory rate ranged from 0.44 to 0.59. Likewise, Da
Silva (1973) showed estimates of heritability of rectal temperature ranging from 0.11 to 0.44.
Dikmen et al. (2012) used a total of 1,695 Holstein cows record and estimated a moderate
heritability of rectal temperature of 0.17. Mackinnon et al. (1991) also estimated the heritability
of rectal temperature in zebu cross cattle to be moderate (0.19). Seath and Miller (1947) used

49
both body temperature and respiration rates as a measure of heat tolerance for Jersey and
Holstein cows of data collected on the years of 1944 and 1945 and found a heritability estimate
of body temperature of 0.15 and 0.31 for data collected in 1944 and 1945, respectively.
Similarly, the authors found 0.76 and 0.84 heritability estimates of respiration rates for the years
of 1944 and 1945, respectively. Turner (1984) used 200 heifers of Bos indicus, Bos taurus and
crossbred lines to estimate a moderate heritability estimate of rectal temperature 0.33.
Phenotypes of respiration rate and body temperature regulation are the two most common
phenotypes used as an indicator of heat/cold stress (Rolf, 2015). However, decrease in
production has also used as an alternative phenotype measurement for heat stress (Nguyen et al.,
2016). As mentioned above, previous studies utilized respiration rate measured as breaths per
minute (Da Silva, 1973; Seath and Miller, 1947) as well as one-time measurements of rectal
temperature as phenotypes of heat stress or both (Da Silva, 1973; Seath and Miller, 1947). One
of the reasons for the variation of the heritability estimates among different studies could be the
choice of the phenotype for heat stress. Developing a standard phenotype measurement of heat
stress is one of the challenges of the scientific community, previous studies have used body
temperatures measured from either tympanic (in the ear), rectal or intravaginal and showed
heritability estimates of their result. However, in this study we have developed and used
regression coefficients of averaged daily ambient temperature on total DMI for the entire feeding
period of each group. The other reason that could contribute to the different heritability estimates
of different studies is that the use of different breeds reared in very different environments.
Results of posterior heritability estimates presented by Howard et al. (2014) are the
closest to the current study, though the authors developed and used a different phenotype
measurement for heat stress. Howard et al. (2014) found a posterior mean heritability estimate of

50
0.68 and 0.21 for summer and winter phenotypes developed using area under the curve of body
temperature measured from tympanic and intravaginal tissue measurements. Admittedly, the
population under the current study is relatively small and admixed, suggesting that the genomic
heritability estimates contained herein could be potentially biased upward. However, the
heritability estimates of this study indicate that feed intake changes in response to temperature
related stress is partly controlled by the underlying genetic makeup of the animal.
Candidate genes
Genomic regions/gene names and function are detailed in tables 16 to 23. Functional
annotation, enrichment and pathway analysis of the extended top 0.5% 1-Mb windows resulted
in significant enrichments for multiple biological processes and pathways for both models and
traits (DH and DL intercept and slope phenotypes) and unveiled genomic regions/genes with
functions of heat shock protein binding (GBP1, LMAN2, DNAJC2, DNAJC9, HSPB1,
DNAJB12, UNC45B, BAG6, STUB1, TELO2, STIP1), response to cold/heat and external
temperature stimulus (VGF, CCL2, P2RX3, AMICA, MICB, HSPA1A, HSPA1B, PRKAA1,
MLST8, HSPA1L, HSPB1, MROH2B, POLR2D, MSTN, ADORA1,PLAC8, REN, TRPM8,
CPB2, PIRT), regulation of response to appetite (BBS4), response to feeding and eating
behaviors (NAPEPLD, NPW, REN, DACH1), and temperature homeostasis (EDNRB, TNF).
Expression of heat shock proteins (HSPs) is regulated by heat shock factors (HSF) known as a
transcription factor family (Page et al., 2006). As described by Page et al. (2006) and Morimoto
(1998) HSF regulate the expression of HSPs through the interaction with heat shock element
(HSE). The HSE are a specific DNA sequence found in the promotor. Akerfelt et al. (2007) also
illustrated that HSF organize the cellular response to heat/cold stress and control HSPs. Winter et
al. (2004) mapped HSF1 to chromosome 14 in cattle and are known to take part in the acute

51
response to heat shock. Khazzaka et al. (2006) showed the relationship between HSP70 and
Halothane genotypes response to heat stress in pigs. Sonna et al. (2002) have also identified
approximately 50 genes that have not been previously considered as heat shock proteins that
plays a role during response to heat stress. Charoensook et al. (2012) also identified
polymorphism in the bovine HSP90AB1 gene that are associated with heat stress in an
indigenous Thai cattle. The authors used respiration rate, rectal temperature, pack cell volume as
well as individual heat tolerance coefficient as heat stress indicators (phenotypes). Liu et al.
(2010, 2011) also identified a significant association between a polymorphism in the ATP1A1
gene and heat tolerance in 160 Chinese Holstein.
The largest effect 1-Mb chromosomal windows for model-1 (with MG fitted) were on
chromosome 3 at 49-Mb for DH intercept and on chromosome 25 at 41-Mb for DL intercept and
chromosome 25 at 1-Mb for both the DH and DL slope. The largest effect 1-Mb chromosomal
windows for model-2 (without MG fitted) were on chromosome 2 at 8-Mb for DH and DL
intercept and chromosome 25 at 1-Mb for DH and DL slope, respectively. The SNP name and
location that explained the highest proportion of additive genetic variance within each of the top
0.5% 1-Mb windows for model-1 and model-2 of each DH and DL intercept and slope can be
found in tables 24 and 25.

52
Implications
Application of regression coefficients of DMI on ambient temperature as phenotype for
genome-wide association studies (GWAS) in the current study unveiled possible genomic
regions and candidate genes that may have a significant association with both heat and cold
stress. Furthermore, extending the genomic regions for functional annotation, enrichment and
pathway analysis of the top 0.5% 1-Mb windows revealed significant enrichments for multiple
biological processes and pathways that could potentially contribute to heat/cold tolerance. In
addition, the genomic heritability estimates suggest that genomic information were able to
explain a moderate to large proportion of the phenotypic variation for DH and DL intercept and
slope. Moreover, estimates of posterior genomic heritability suggested that information of
heat/cold stress tolerance of animals could be incorporated into breeding objectives to help
selection decisions of current animals to be parents of the next generations. However, the current
study also reveals that there is a need for additional investigations to develop a better and
standardized measurement of heat/cold stress. Given the moderate to high heritability estimates
reported herein and previous studies, this trait complex would respond favorably to selection and
breeders could select for more robust individuals. However, the concept of applying this same
procedure in larger populations warrants further investigation as a means of identifying animals
that are less sensitive to environmental extremes.

53
Table 1. Descriptive statistics of coefficient of determination and akaike information
criterion (AIC) for steer1 (S1) group of daily high ambient temperatures (DH) averaged over 4-
week period on dry matter intake
Descriptive
statistics
Coefficient of
determination
AIC-First Order AIC-Second Order AIC-Third Order
Mean 0.245333
81.50909
78.09695
78.96899
Minimum 0.000124
69.50591
68.46136
63.31235
Maximum 0.837864
92.11029
86.40022
88.37352
SD 0.198399
4.700271
3.888438
4.362816
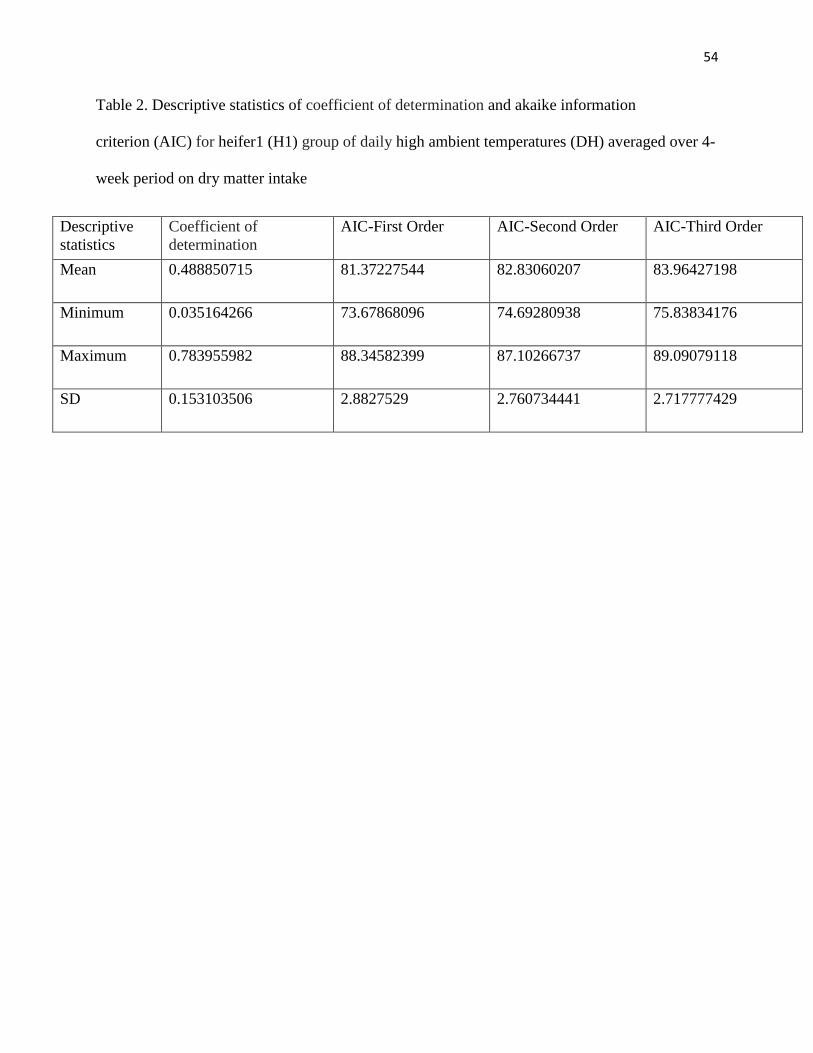
54
Table 2. Descriptive statistics of coefficient of determination and akaike information
criterion (AIC) for heifer1 (H1) group of daily high ambient temperatures (DH) averaged over 4-
week period on dry matter intake
Descriptive
statistics
Coefficient of
determination
AIC-First Order AIC-Second Order AIC-Third Order
Mean 0.488850715 81.37227544 82.83060207 83.96427198
Minimum 0.035164266 73.67868096 74.69280938 75.83834176
Maximum 0.783955982 88.34582399 87.10266737 89.09079118
SD 0.153103506 2.8827529 2.760734441 2.717777429

55
Table 3. Descriptive statistics of coefficient of determination and akaike information
criterion (AIC) for group steer2 (S2) of daily high ambient temperatures (DH) averaged over 4-
week period on dry matter intake
Descriptive
statistics
Coefficient of
determination
AIC-First Order AIC-Second Order AIC-Third Order
Mean 0.066086882 89.94814687 89.51098667 90.89819458
Minimum 0.00023907 78.7056886 79.69970268 78.06969669
Maximum 0.573615215 97.87825874 95.58704785 97.39146665
SD 0.121504175 3.713548607 3.131123685 3.491915785

56
Table 4. Descriptive statistics of coefficient of determination and akaike information
criterion (AIC) for group heifer2 (H2) of daily high ambient temperatures (DH) averaged over 4-
week period on dry matter intake
Descriptive
statistics
Coefficient of
determination
AIC-First-Order AIC-Second AIC-Third
Mean 0.533528415 59.861189 59.92463929 58.42559182
Minimum 0.059060676 51.37569144 48.08685882 32.48168491
Maximum 0.968539097 66.50988197 64.44284548 65.0249957
SD 0.23476167 2.936444244 2.93417505 5.745442924

57
Table 5. Descriptive statistics of coefficient of determination and akaike information
criterion (AIC) for steer1 (S1) group of daily low ambient temperatures (DL) averaged over 4-
week period on dry matter intake
Descriptive
statistics
Coefficient of
determination
AIC-First AIC-Second AIC-Third
Mean 0.221021526 81.78796238 77.25949103 77.90253294
Minimum 0.00013846 69.30531355 65.06357193 59.48729772
Maximum 0.763770168 92.4659131 85.94649748 87.50673534
SD 0.191188526 4.760319143 4.378242282 4.88303427

58
Table 6. Descriptive statistics of coefficient of determination and akaike information
criterion (AIC) for heifer1 (H1) group of daily high ambient temperatures (DH) averaged over 4-
week period on dry matter intake
Descriptive
statistics
Coefficient of
determination
AIC-First Order AIC-Second
Order
AIC-Third Order
Mean 0.518404803 80.93599917 82.50314079 83.67697333
Minimum 0.115883505 73.59341246 75.5453475 72.01297335
Maximum 0.810246854 85.96597672 86.95687809 88.75044468
SD 0.14666218 2.601986493 2.590254682 3.317428264
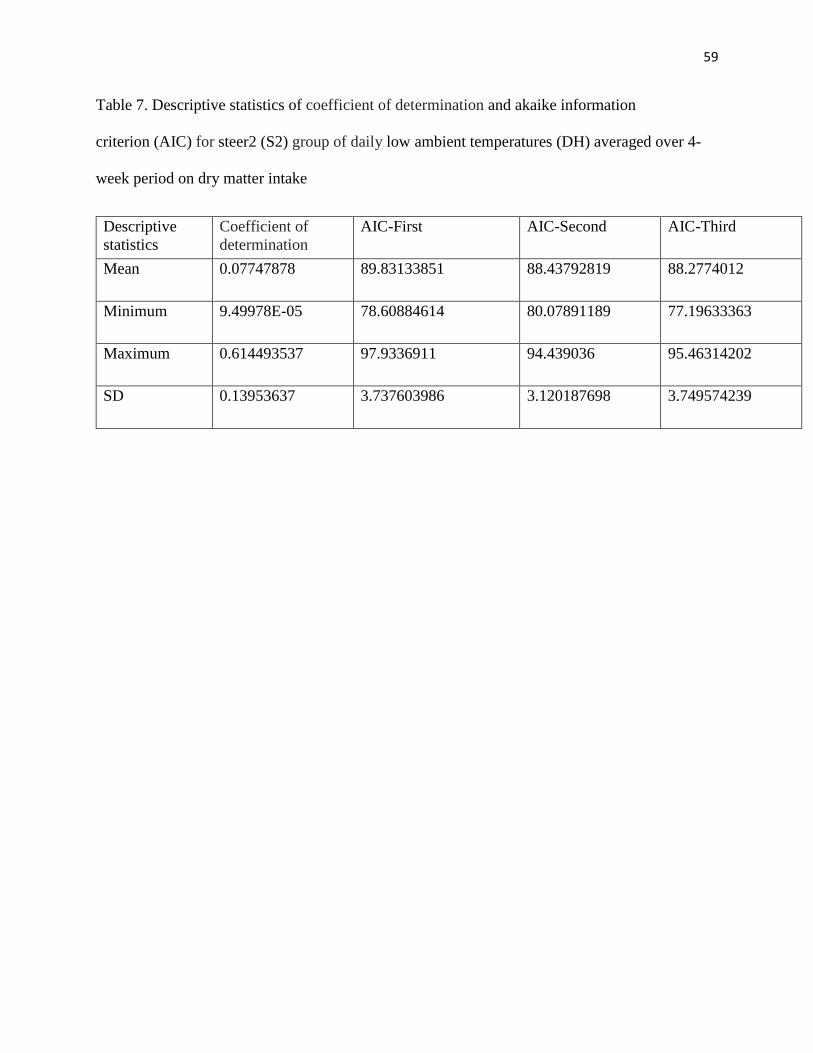
59
Table 7. Descriptive statistics of coefficient of determination and akaike information
criterion (AIC) for steer2 (S2) group of daily low ambient temperatures (DH) averaged over 4-
week period on dry matter intake
Descriptive
statistics
Coefficient of
determination
AIC-First AIC-Second AIC-Third
Mean 0.07747878 89.83133851 88.43792819 88.2774012
Minimum 9.49978E-05 78.60884614 80.07891189 77.19633363
Maximum 0.614493537 97.9336911 94.439036 95.46314202
SD 0.13953637 3.737603986 3.120187698 3.749574239

60
Table 8. Descriptive statistics of coefficient of determination and akaike information
criterion (AIC) for heifer2 (H2) group of daily low ambient temperatures (DH) averaged over 4-
week period on dry matter intake
Descriptive
statistics
Coefficient of
determination
AIC-First AIC-Second AIC-Third
Mean 0.689347307 56.9935386 54.84458836 54.8579066
Minimum 0.101614618 44.3710793 33.57139902 27.77909677
Maximum 0.99224899 64.9067043 63.31530074 64.22373171
SD 0.223698692 3.63072618 5.454864188 6.86851409
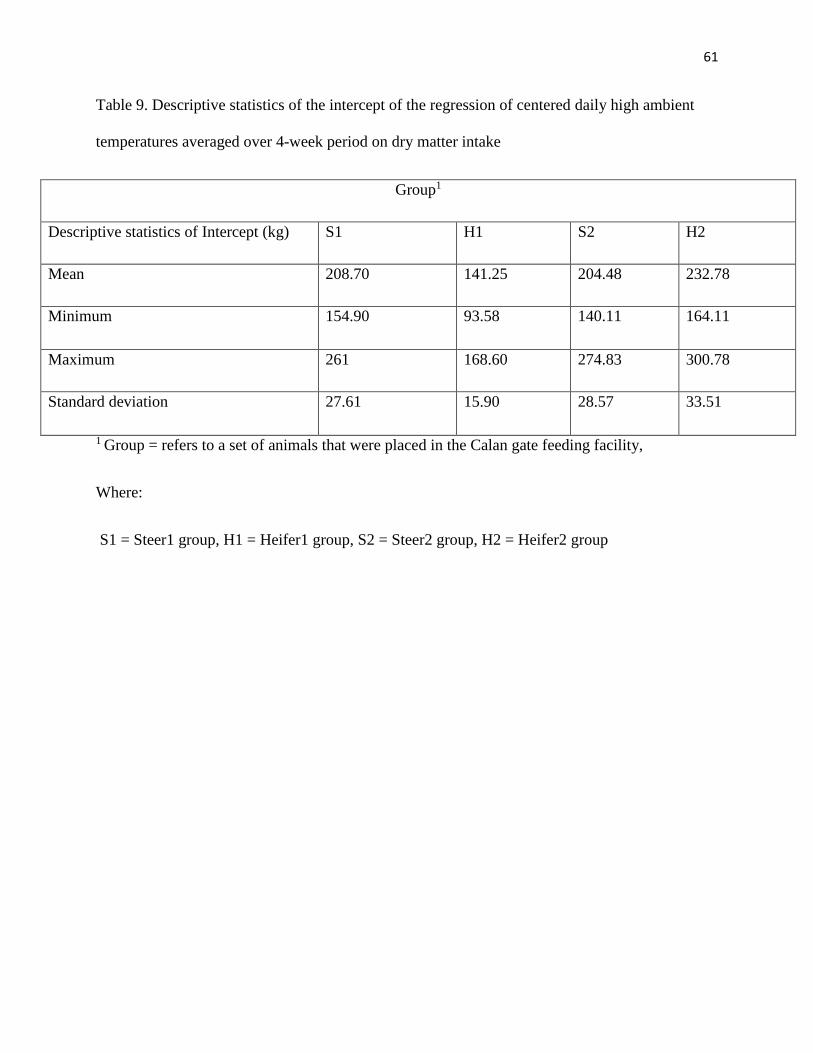
61
Table 9. Descriptive statistics of the intercept of the regression of centered daily high ambient
temperatures averaged over 4-week period on dry matter intake
Group1
Descriptive statistics of Intercept (kg) S1 H1 S2 H2
Mean 208.70 141.25 204.48 232.78
Minimum 154.90 93.58 140.11 164.11
Maximum 261 168.60 274.83 300.78
Standard deviation 27.61 15.90 28.57 33.51
1 Group = refers to a set of animals that were placed in the Calan gate feeding facility,
Where:
S1 = Steer1 group, H1 = Heifer1 group, S2 = Steer2 group, H2 = Heifer2 group

62
Table 10. Descriptive statistics of the slope of the regression of centered daily high ambient
temperatures averaged over 4-week period on dry matter intake
Group1
Descriptive statistics of slope (kg/℃) S1 H1 S2 H2
Mean 1.07 -4.56 -0.26 -4.49
Minimum -0.605 -7.72 -5.27 -10.44
Maximum 4.03 -1.18 1.60 -0.87
Standard deviation 0.81 1.48 1.25 2.39
1 Group = refers to a set of animals that were placed in the Calan gate feeding facility,
Where:
S1 = Steer1 group, H1 = Heifer1 group, S2 = Steer2 group, H2 = Heifer2 group

63
Table 11. Descriptive statistics of the intercept of the regression of centered daily low ambient
temperatures averaged over 4-week period on dry matter intake
Group1
Descriptive statistics of intercept (kg) S1 H1 S2 H2
Mean 208.70 177.67 204.48 232.78
Minimum 154.90 102.87 140.11 164.11
Maximum 261 232.42 274.83 300.78
Standard deviation 27.61 25.02 28.57 33.51
1 Group = refers to a set of animals that were placed in the Calan gate feeding facility,
Where:
S1 = Steer1 group, H1 = Heifer1 group, S2 = Steer2 group, H2 = Heifer2 group

64
Table 12. Descriptive statistics of the slope of the regression of centered daily low ambient
temperatures averaged over 4-week period on dry matter intake
Group1
Descriptive statistics of slope (kg/℃) S1 H1 S2 H2
Mean 1.09 -3.76 -0.65 -4.64
Minimum -0.52 -6.89 -5.63 -9.36
Maximum 4.22 -0.96 1.09 -1.19
Standard deviation 0.87 1.19 1.21 2.19
1 Group = refers to a set of animals that were placed in the Calan gate feeding facility,
Where:
S1 = Steer1 group, H1 = Heifer1 group, S2 = Steer2 group, H2 = Heifer2 group

65
Table 13. Descriptive statistics of initial body weight
Group1
Descriptive statistics S1 H1 S2 H2
Mean 276.15 kg 394.31 kg 259.14 kg 309.17 kg
Minimum 225.57 kg 342.60 kg 157.26 kg 254.01 kg
Maximum 319.33 kg 454.64 kg 339.60 kg 403.11 kg
Standard deviation 27.44 kg 27.20 kg 30.20 kg 37.79 kg
1 Group = refers to a set of animals that were placed in the Calan gate feeding facility,
Where:
S1 = Steer1 group, H1 = Heifer1 group, S2 = Steer2 group, H2 = Heifer2 group

66
Table 14. Descriptive statistics of dry matter intake over the entirety of the feeding period
Group1
Descriptive statistics S1 H1 S2 H2
Mean 1460.93 kg 988.67 kg 1413.27 kg 1163.93 kg
Minimum 1084.35 kg 655.16 kg 980.71 kg 820.55 kg
Maximum 1826.83 kg 1180.20 kg 1923.95 kg 1503.98 kg
Standard deviation 193.24 kg 111.31 kg 200 kg 167.55 kg
Number of animals
per group
59 60 58 59
Feeding period December 16, 2009
– June 24, 2010
July 28, 2010-
November19, 2010
December 23, 2010
– August 12, 2011
July 20, 2011 –
January 27, 2012
Total number of
days
189 114 182 135
1 Group = refers to a set of animals that were placed in the Calan gate feeding facility,
Where:
S1 = Steer1 group, H1 = Heifer1 group, S2 = Steer2 group, H2 = Heifer2 group

67
Table 15. Posterior heritability (Posterior Standard Deviation) estimates of average daily high
and low regression coefficients
Trait Heritability Estimates
High Temperature Low Temperature
1Model-2 (Intercept) 0.68 (0.06) 0.76 (0.05)
2Model-1 (Intercept) 0.27 (0.07) 0.29 (0.09)
1Model-2 (Slope) 0.45 (0.08) 0.48 (0.08)
2Model-1 (Slope) 0.25 (0.08) 0.27 (0.08)
1Model-1 = refers to the exclusion of MG as fixed effect in the genome-wide association model
2Model-1 = refers to the inclusion of MG as a fixed effect in the genome-wide association model

68
Table 16. Functional annotation, enrichment and pathway analysis
Gene Name Gene function and analysis type1
Model- 12 (Intercept with MG included in the analysis)
guanylate binding protein 1(GBP1) Heat shock protein binding, Hsp90 protein binding
lectin, mannose binding 2(LMAN2) Heat shock protein binding, protein binding
VGF nerve growth factor
inducible(VGF)
Response to cold, external stimulus, stress, temperature stimulus
C-C motif chemokine ligand 2(CCL2) Response to temperature, heat, external stimulus, radiation.
DnaJ heat shock protein family
(Hsp40) member C2(DNAJC2)
Response to stress, regulation of cellular response to heat, regulation of
cellular response to stress, heat shock protein binding, Hsp70 protein binding.
DnaJ heat shock protein family
(Hsp40) member C9(DNAJC9)
Positive regulation of ATPase activity, social behavior, positive regulation of
catalytic activity, regulation of ATPase activity, positive regulation of
molecular function, regulation of catalytic activity, regulation of hydrolase
activity, positive regulation of hydrolase activity, intraspecies interaction
between organisms, heat shock protein binding.
HEAT repeat containing 9(HEATR9) hematopoietic progenitor cell differentiation, immune system process, immune
system development, multicellular organism development, cellular
process, hemopoiesis, cell differentiation, multicellular organismal
process, developmental process, single-organism process, single-multicellular
organism process, single-organism cellular process, single-organism
developmental process, animal organ development, hematopoietic or lymphoid

69
organ development, system development, anatomical structure
development, cellular developmental process.
Heat shock protein family B (small)
member 1(HSPB1)
Response to oxidative stress, regulation of cellular response to stress,
regulation of primary metabolic process of response to stress, regulation of
response to stress, protein binding.
Bardet-Biedl syndrome 4(BBS4) Response to stimulus, regulation of response to food, negative regulation of
response to food, regulation of appetite, regulation of response to external
stimulus, negative regulation of response to external stimulus, negative
regulation of appetite by leptin-mediated signaling pathway.
N-acyl phosphatidylethanolamine
phospholipase D(NAPEPLD)
Response to stress, aging, behavior, feeding behavior, metabolic
process, catabolic process, phospholipid catabolic process, developmental
process, response to isolation stress, eating behavior, cellular metabolic
process, primary metabolic process, negative regulation of biological
process, negative regulation of behavior, regulation of biological
process, regulation of behavior, response to stimulus, regulation of feeding
behavior, biological regulation, organic substance metabolic process, organic
substance catabolic process, regulation of eating behavior, negative regulation
of eating behavior, negative regulation of feeding behavior.
DnaJ heat shock protein family
(Hsp40) member B12(DNAJB12)
Membrane, integral component of membrane, intrinsic component of
membrane, membrane part.
Unc-45 myosin chaperone B(UNC45B) Binding, protein binding, heat shock protein binding, Hsp90 protein binding
1Analysis type = refers to the model used during the GWAS analysis.
2Model-1 = refers to the inclusion of myostatin genotype (MG) as a fixed effect during GWAS

70
Table 17. Functional annotation, enrichment and pathway analysis for model-1 analysis of DH
slope
Gene Name Gene function and analysis type1
Model- 12 (DH slope phenotype with MG included in the analysis)
Neuropeptide W(NPW) Feeding behavior, regulation of biological process, response to stimulus,
cellular response to stimulus.
Endothelin receptor type B(EDNRB) Temperature homeostasis.
Purinergic receptor P2X 3(P2RX3) Response to stress, response to heat, temperature stimulus, cold, abiotic
stimulus, external stimulus, and endogenous stimulus.
MHC class I polypeptide-related
sequence A(MICA)
Response to stress, response to temperature stimulus, response to heat,
external stimulus.
MHC class I polypeptide-related
sequence B(MICB)
Response to temperature stimulus, external stimulus, heat, regulation of
response to external stimulus.
VGF nerve growth factor
inducible(VGF)
Response to temperature stimulus, cold, external stimulus, abiotic stimulus,
endogenous stimulus.
Heat shock protein family A (Hsp70)
member 1A(HSPA1A)
Response to temperature stimulus, heat, abiotic stimulus, endogenous
stimulus, heat acclimation, cellular response to heat, stress.
Heat shock protein family A (Hsp70)
member 1B(HSPA1B)
Response to heat, temperature stimulus, abiotic stimulus, heat acclimation, and
regulation of cellular response to heat, heat shock protein binding.

71
Protein kinase AMP-activated catalytic
subunit alpha 1(PRKAA1)
Response to stress, temperature stimulus, cellular response to starvation,
endogenous stimulus, cold acclimation, response to radiation, response to cold,
UV, light stimulus.
Tumor necrosis factor(TNF) Temperature homeostasis, fever generation morphogenesis of a branching
structure, regulation of response to external stimulus, regulation of fever
generation, regulation of heat generation, positive regulation to external
stimulus, positive regulation of heat generation.
MTOR associated protein, LST8
homolog(MLST8)
Cellular response to stress, response to stimulus, regulation of cellular
response to heat, heat generation, regulation of heat generation, regulation of
response to external stimulus.
Heat shock protein family A (Hsp70)
member 1 like(HSPA1L)
Response to stress, regulation of response to stress, regulation of cellular
response to stress, regulation of cellular response to heat.
Heat shock protein family B (small)
member 1(HSPB1)
Regulation of response to external stimulus, cellular response to stress.
Maestro heat like repeat family
member 2B(MROH2B)
Cellular response to stimulus, response to stimulus, biological regulation,
regulation of biological process.
BCL2 associated athanogene 6(BAG6) Binding, protein binding, Hsp70 protein binding, heat shock protein binding,
protein complex binding.
STIP1 homology and U-box containing
protein 1(STUB1)
Receptor binding, binding, protein binding, Hsp70 protein binding, Hsp90
protein binding.
Telomere maintenance 2(TELO2) Protein binding, heat shock protein binding, protein complex binding, Hsp90
protein binding.
1Analysis type = refers to the model used during the GWAS analysis.

72
2Model-1 = refers to the inclusion of MG as a fixed effect during GWAS
Table 18. Functional annotation, enrichment and pathway analysis for model-2 analysis of DH
intercept
Gene Name Gene function and analysis type1
Model- 22 (Intercept with-out MG in the analysis)
RNA polymerase II subunit
D(POLR2D)
Response to temperature stimulus, response to heat.
Myostatin (MSTN) Response to temperature stimulus, response to heat.
Guanylate binding protein 1(GBP1) Heat shock protein binding, Hsp90 protein binding.
Lectin, mannose binding 2(LMAN2) Heat shock protein binding.
1Analysis type = refers to the model used during the GWAS analysis.
2Model-2 = refers to the exclusion of MG as a fixed effect during GWAS

73
Table 19. Functional annotation, enrichment and pathway analysis for model-2 analysis of DH
slope
Gene Name Gene function and analysis type1
Model- 22 (Slope with-out MG in the analysis)
Neuropeptide W(NPW) Feeding behavior, regulation of biological process, response to stimulus,
cellular response to stimulus.
Endothelin receptor type B(EDNRB) Temperature homeostasis, heat generation, regulation of heat generation,
regulation of response to external stimulus, regulation of fever generation.
Purinergic receptor P2X 3(P2RX3) Response to stress, response to heat, temperature stimulus, cold, abiotic
stimulus, external stimulus, and endogenous stimulus.
MTOR associated protein, LST8
homolog(MLST8)
Regulation of cellular response to heat, stress.
STIP1 homology and U-box containing
protein 1(STUB1).
Heat shocking protein binding, Hsp70 protein binding, Hsp90 protein binding.
Telomere maintenance 2(TELO2) Heat shock protein binding, protein complex binding, and Hsp90 protein
binding.
1Analysis type = refers to the model used during the GWAS analysis.
2Model-2 = refers to the exclusion of MG as a fixed effect during GWAS

74
Table 20. Functional annotation, enrichment and pathway analysis for model-1 analysis of DL
intercept
Gene Name Gene function and analysis type1
Model- 12 (Intercept with MG included in the analysis)
Guanylate binding protein 1(GBP1) Protein binding, Hsp90 protein binding, and heat shock protein binding.
Adenosine A1 receptor (ADORA1) Response to temperature stimulus, detection of external stimulus, detection of
abiotic stimulus, response to external stimulus, response to abiotic stimulus,
negative regulation of metabolic process, positive regulation of metabolic
process, detection of temperature stimulus involved in sensory perception of
pain.
Placenta specific 8(PLAC8) Response to stress, defense response, metabolic process, response to
temperature stimulus, response to cold, external stimulus, abiotic stimulus,
positive regulation of metabolic process.
Renin(REN) Response to external stimulus, response to stress, feeding behavior.
Lectin, mannose binding 2(LMAN2) Heat shock protein binding.
1Analysis type = refers to the model used during the GWAS analysis.
2Model-1 = refers to the inclusion of MG as a fixed effect during GWAS

75
Table 21. Functional annotation, enrichment and pathway analysis for model-1 analysis of DL
slope
Gene Name Gene function and analysis type1
Model- 12 (Slope with MG included in the analysis)
Endothelin receptor type B(EDNRB) Temperature homeostasis, regulation of fever generation, heat generation,
regulation of heat generation, regulation of response to external stimulus.
Purinergic receptor P2X 3(P2RX3) Response to stress, temperature stimulus, heat, cold, external stimulus,
endogenous stimulus.
Neuropeptide W(NPW) Behavior, Feeding behavior, cellular process, regulation of cellular process,
response to stimulus, cellular response to stimulus, biological regulation.
MTOR associated protein, LST8
homolog (MLST8).
Regulation of response to stress, regulation of cellular response to stress, cell-
cell adhesion regulation of cellular response to heat, response to cold,
detection of external stimulus, response to external stimulus, response to
temperature stimulus, detection of temperature stimulus, sensory perception of
temperature stimulus.
STIP1 homology and U-box
containing protein 1(STUB1).
Protein binding, Hsp70 protein binding, heat shock protein binding, Hsp90
protein binding.
Telomere maintenance 2(TELO2) Protein binding, heat shock protein binding, protein complex binding, Hsp90
protein binding.
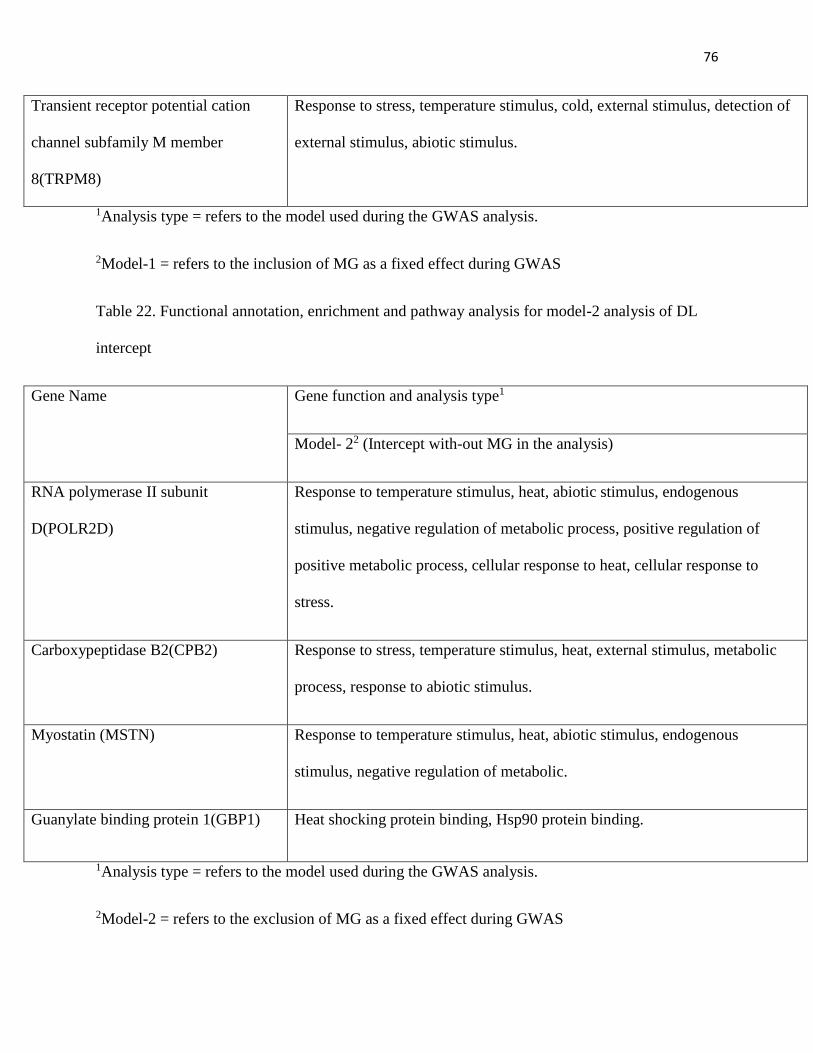
76
Transient receptor potential cation
channel subfamily M member
8(TRPM8)
Response to stress, temperature stimulus, cold, external stimulus, detection of
external stimulus, abiotic stimulus.
1Analysis type = refers to the model used during the GWAS analysis.
2Model-1 = refers to the inclusion of MG as a fixed effect during GWAS
Table 22. Functional annotation, enrichment and pathway analysis for model-2 analysis of DL
intercept
Gene Name Gene function and analysis type1
Model- 22 (Intercept with-out MG in the analysis)
RNA polymerase II subunit
D(POLR2D)
Response to temperature stimulus, heat, abiotic stimulus, endogenous
stimulus, negative regulation of metabolic process, positive regulation of
positive metabolic process, cellular response to heat, cellular response to
stress.
Carboxypeptidase B2(CPB2) Response to stress, temperature stimulus, heat, external stimulus, metabolic
process, response to abiotic stimulus.
Myostatin (MSTN) Response to temperature stimulus, heat, abiotic stimulus, endogenous
stimulus, negative regulation of metabolic.
Guanylate binding protein 1(GBP1) Heat shocking protein binding, Hsp90 protein binding.
1Analysis type = refers to the model used during the GWAS analysis.
2Model-2 = refers to the exclusion of MG as a fixed effect during GWAS

77
Table 23. Functional annotation, enrichment and pathway analysis for model-2 analysis of DL
slope
Gene Name Gene function and analysis type1
Model- 22 (Slope with-out MG in the analysis)
Endothelin receptor type B(EDNRB) Temperature homeostasis, regulation of fever generation, heat generation,
regulation of heat generation, regulation of response to external stimulus.
Phosphoinositide interacting regulator
of transient receptor potential
channels(PIRT)
Response to stress, behavior, response to temperature stimulus, heat, cellular
process, abiotic stimulus.
Purinergic receptor P2X 3(P2RX3) Response to stress, response to temperature stimulus, behavior, response to
heat and cold, external stimulus, endogenous stimulus.
Dachshund family transcription factor
1(DACH1)
Behavior, feeding behavior, metabolic process, cellular aromatic compound
metabolic process.
Neuropeptide W(NPW) Behavior, feeding behavior, cellular process, regulation of biological process,
regulation of cellular process, response to stimulus, cellular response to
stimulus, biological regulation.
MTOR associated protein, LST8
homolog(MLST8)
Regulation of response to stress, regulation of cellular response to stress, cell-
cell adhesion regulation of cellular response to heat.
STIP1 homology and U-box
containing protein 1(STUB1)
Protein binding, Hsp70 protein binding, heat shock protein binding, Hsp90
protein binding.
Telomere maintenance 2(TELO2) Protein binding, heat shock protein binding, protein complex binding, Hsp90
protein binding.

78
1Analysis type = refers to the model used during the GWAS analysis.
2Model-2 = refers to the exclusion of MG as a fixed effect during GWAS

79
Table 24. Largest SNP effect of daily high average temperature
Ilumina BovineSNP50 SNP ID Trait Analysis Model Chr_Mb
ARS-BFGL-NGS-42373 DH Intercept Model-1 3_49
Hapmap49413-BTA-102772 DH Intercept Model-1 3_49
Hapmap48045-BTA-67779 DH Intercept Model-1 3_48
Hapmap48939-BTA-90484 DH Intercept Model-1 3_48
INRA-510 DH Intercept Model-1 3_53
ARS-BFGL-NGS-112952 DH Intercept Model-1 3_53
ARS-BFGL-NGS-18669 DH Intercept Model-1 7_39
ARS-BFGL-NGS-116385 DH Intercept Model-1 7_39
Hapmap53960-rs29016796 DH Intercept Model-1 1_93
Hapmap42952-BTA-48143 DH Intercept Model-1 1_93
ARS-BFGL-NGS-54279 DH Intercept Model-1 25_35
ARS-BFGL-NGS-79606 DH Intercept Model-1 25_35
ARS-BFGL-NGS-32007 DH Intercept Model-1 13_34
ARS-BFGL-NGS-1661 DH Intercept Model-2 2_8
BTB-00079285 DH Intercept Model-2 2_8
ARS-BFGL-BAC-36882 DH Intercept Model-2 1_94
BTB-01086791 DH Intercept Model-2 1_94
BTA-97386-no-rs DH Intercept Model-2 2_5
BTA-47839-no-rs DH Intercept Model-2 2_5
Hapmap43083-BTA-86781 DH Intercept Model-2 2_4

80
ARS-BFGL-NGS-6152 DH Intercept Model-2 2_4
ARS-BFGL-NGS-100268 DH Intercept Model-2 16_79
Hapmap25860-BTA-150580 DH Intercept Model-2 16_79
ARS-BFGL-NGS-42373 DH Intercept Model-2 3_49
Hapmap49413-BTA-102772 DH Intercept Model-2 3_49
ARS-BFGL-NGS-81865 DH Intercept Model-2 2_7
ARS-BFGL-NGS-110520 DH Slope Model-1 25_1
Hapmap23849-BTC-016077 DH Slope Model-1 25_1
ARS-BFGL-NGS-36563 DH Slope Model-1 12_52
Hapmap30611-BTA-24813 DH Slope Model-1 12_52
BTB-01885735 DH Slope Model-1 10_44
Hapmap9514-BTA-67200 DH Slope Model-1 10_44
ARS-BFGL-NGS-15341 DH Slope Model-1 3_87
ARS-BFGL-NGS-40956 DH Slope Model-1 3_87
ARS-BFGL-NGS-16109 DH Slope Model-1 14_8
ARS-BFGL-NGS-84397 DH Slope Model-1 14_8
BTA-122625-no-rs DH Slope Model-1 12_58
BTB-00266340 DH Slope Model-1 12_58
ARS-BFGL-NGS-24349 DH Slope Model-1 23_27
ARS-BFGL-NGS-110520 DH Slope Model-2 25_1
Hapmap23849-BTC-016077 DH Slope Model-2 25_1
ARS-BFGL-NGS-102158 DH Slope Model-2 2_0
Hapmap55208-ss46526613 DH Slope Model-2 2_0
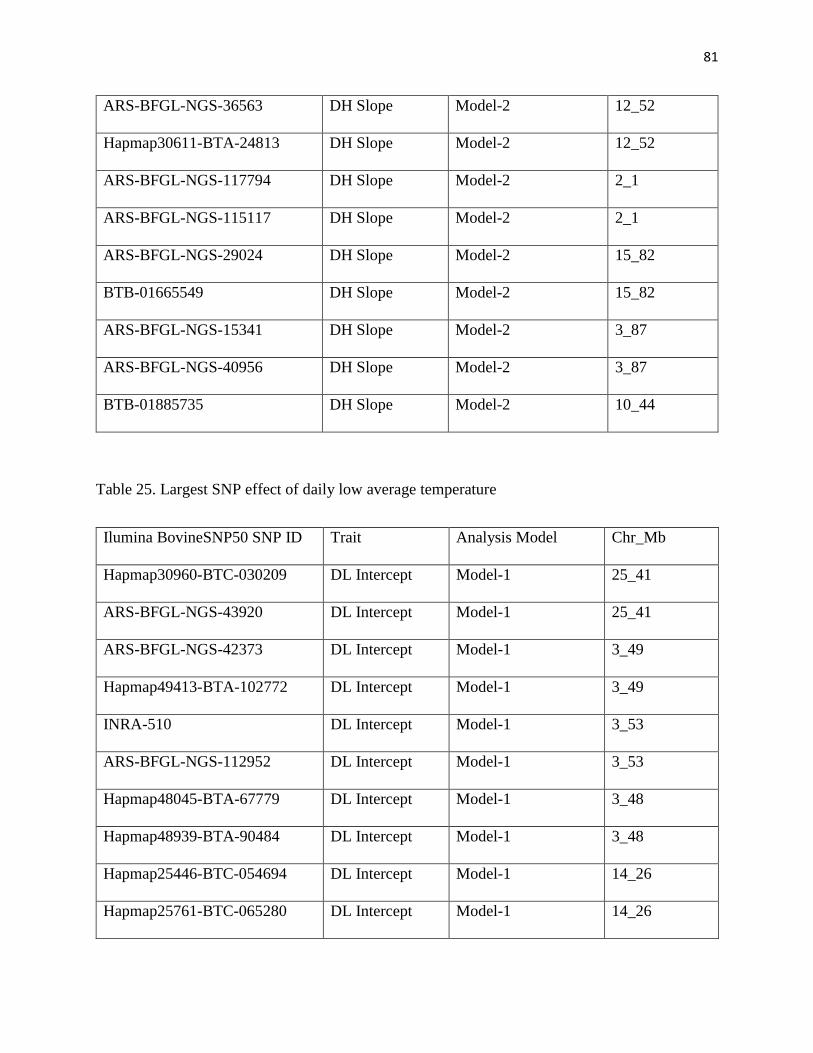
81
ARS-BFGL-NGS-36563 DH Slope Model-2 12_52
Hapmap30611-BTA-24813 DH Slope Model-2 12_52
ARS-BFGL-NGS-117794 DH Slope Model-2 2_1
ARS-BFGL-NGS-115117 DH Slope Model-2 2_1
ARS-BFGL-NGS-29024 DH Slope Model-2 15_82
BTB-01665549 DH Slope Model-2 15_82
ARS-BFGL-NGS-15341 DH Slope Model-2 3_87
ARS-BFGL-NGS-40956 DH Slope Model-2 3_87
BTB-01885735 DH Slope Model-2 10_44
Table 25. Largest SNP effect of daily low average temperature
Ilumina BovineSNP50 SNP ID Trait Analysis Model Chr_Mb
Hapmap30960-BTC-030209 DL Intercept Model-1 25_41
ARS-BFGL-NGS-43920 DL Intercept Model-1 25_41
ARS-BFGL-NGS-42373 DL Intercept Model-1 3_49
Hapmap49413-BTA-102772 DL Intercept Model-1 3_49
INRA-510 DL Intercept Model-1 3_53
ARS-BFGL-NGS-112952 DL Intercept Model-1 3_53
Hapmap48045-BTA-67779 DL Intercept Model-1 3_48
Hapmap48939-BTA-90484 DL Intercept Model-1 3_48
Hapmap25446-BTC-054694 DL Intercept Model-1 14_26
Hapmap25761-BTC-065280 DL Intercept Model-1 14_26

82
Hapmap41308-BTA-60333 DL Intercept Model-1 10_21
ARS-BFGL-NGS-64602 DL Intercept Model-1 10_21
ARS-BFGL-NGS-110120 DL Intercept Model-1 6_101
ARS-BFGL-NGS-1661 DL Intercept Model-2 2_8
BTB-00079285 DL Intercept Model-2 2_8
ARS-BFGL-BAC-36882 DL Intercept Model-2 1_94
BTB-01086791 DL Intercept Model-2 1_94
BTA-97386-no-rs DL Intercept Model-2 2_5
BTA-47839-no-rs DL Intercept Model-2 2_5
ARS-BFGL-NGS-100268 DL Intercept Model-2 16_79
Hapmap25860-BTA-150580 DL Intercept Model-2 16_79
Hapmap43083-BTA-86781 DL Intercept Model-2 2_4
ARS-BFGL-NGS-6152 DL Intercept Model-2 2_4
ARS-BFGL-NGS-42373 DL Intercept Model-2 3_49
Hapmap49413-BTA-102772 DL Intercept Model-2 3_49
BTB-00455305 DL Intercept Model-2 11_8
ARS-BFGL-NGS-110520 DL Slope Model-1 25_1
Hapmap23849-BTC-016077 DL Slope Model-1 25_1
ARS-BFGL-NGS-29024 DL Slope Model-1 15_82
BTB-01665549 DL Slope Model-1 15_82
ARS-BFGL-NGS-36563 DL Slope Model-1 12_52
Hapmap30611-BTA-24813 DL Slope Model-1 12_52
ARS-BFGL-NGS-16109 DL Slope Model-1 14_8

83
ARS-BFGL-NGS-84397 DL Slope Model-1 14_8
BTA-56736-no-rs DL Slope Model-1 23_45
BTB-00867539 DL Slope Model-1 23_45
ARS-BFGL-NGS-98604 DL Slope Model-1 17_33
BTB-01786459 DL Slope Model-1 17_33
ARS-BFGL-NGS-107859 DL Slope Model-1 8_63
ARS-BFGL-NGS-110520 DL Slope Model-2 25_1
Hapmap23849-BTC-016077 DL Slope Model-2 25_1
ARS-BFGL-NGS-102158 DL Slope Model-2 2_0
Hapmap55208-ss46526613 DL Slope Model-2 2_0
ARS-BFGL-NGS-36563 DL Slope Model-2 12_52
Hapmap30611-BTA-24813 DL Slope Model-2 12_52
ARS-BFGL-NGS-102370 DL Slope Model-2 28_27
ARS-BFGL-NGS-30132 DL Slope Model-2 28_27
ARS-BFGL-NGS-117794 DL Slope Model-2 2_1
ARS-BFGL-NGS-115117 DL Slope Model-2 2_1
ARS-BFGL-NGS-29024 DL Slope Model-2 15_82
BTB-01665549 DL Slope Model-2 15_82
BTA-122625-no-rs DL Slope Model-2 12_58

84
1 2 3 4 5 6 7 8 9 10 11 12 14 16 18 20 22 24 26
Figure 1. Genome-wide association analysis between SNP genotypes and daily high (DH)
temperature intercept from model-1 analysis, when myostatin genotype (MG) was included as a
fixed effect in the model. The Y-axis represents the model frequency of each marker. The X-axis
represents number of chromosomes and each dot colors represent SNPs.
Model
Fre
qu
ency

85
1 2 3 4 5 6 7 8 9 10 11 12 14 16 18 20 22 24 26
Chromosome
Figure 2. Genome-wide association analysis between SNP genotypes and daily high (DH)
temperature intercept from model-2 analysis, when myostatin genotype (MG) was not included
as a fixed effect in the model. The Y-axis represents the model frequency of each marker. The X-
axis represents number of chromosomes and each dot colors represent SNPs.
Model
Fre
qu
ency
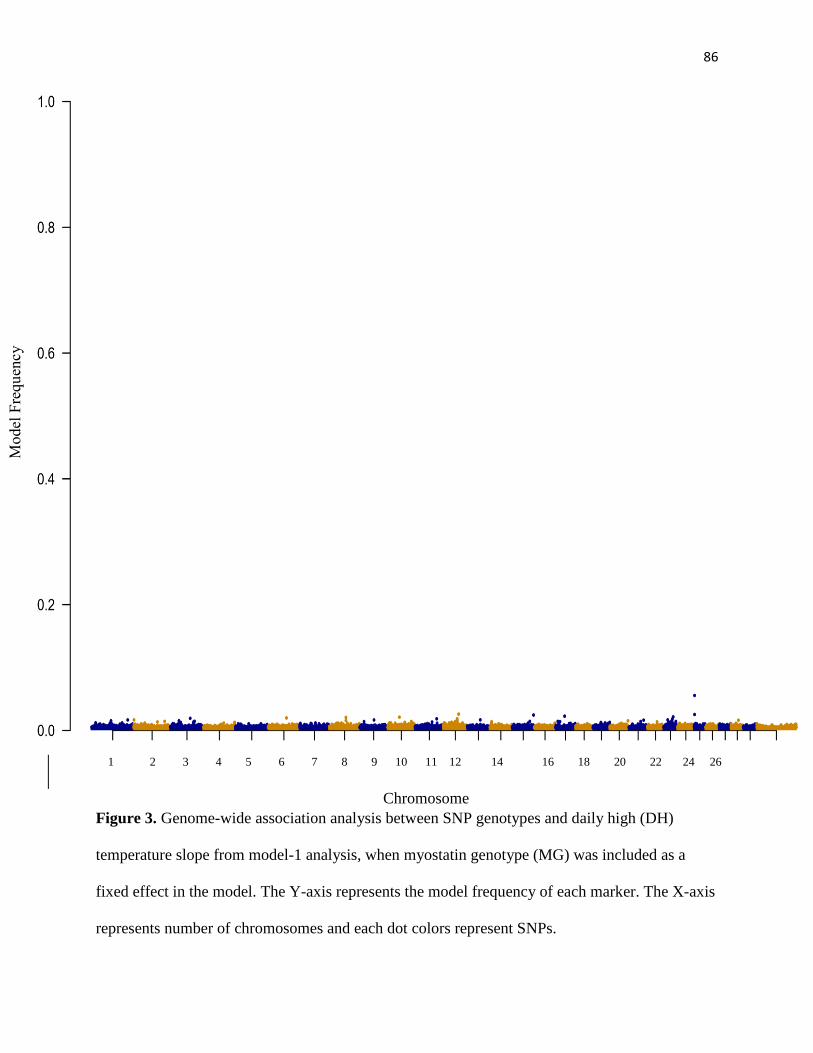
86
1 2 3 4 5 6 7 8 9 10 11 12 14 16 18 20 22 24 26
Chromosome
Figure 3. Genome-wide association analysis between SNP genotypes and daily high (DH)
temperature slope from model-1 analysis, when myostatin genotype (MG) was included as a
fixed effect in the model. The Y-axis represents the model frequency of each marker. The X-axis
represents number of chromosomes and each dot colors represent SNPs.

87
1 2 3 4 5 6 7 8 9 10 11 12 14 16 18 20 22 24 26
Chromosome
Figure 4. Genome-wide association analysis between SNP genotypes and daily high (DH)
temperature slope from model-2 analysis, when myostatin genotype (MG) was not included as a
fixed effect in the model. The Y-axis represents the model frequency of each marker. The X-axis
represents number of chromosomes and each dot colors represent SNPs.
Model
Fre
qu
ency

88
1 2 3 4 5 6 7 8 9 10 11 12 14 16 18 20 22 24 26
Chromosome
Figure 5. Genome-wide association analysis between SNP genotypes and daily low (DL)
temperature intercept from model-1 analysis, when myostatin genotype (MG) was included as a
fixed effect in the model. The Y-axis represents the model frequency of each marker. The X-axis
represents number of chromosomes and each dot colors represent SNPs.

89
1 2 3 4 5 6 7 8 9 10 11 12 14 16 18 20 22 24 26
Chromosome
Figure 6. Genome-wide association analysis between SNP genotypes and daily low (DL)
temperature intercept from model-2 analysis, when myostatin genotype (MG) was not included
as a fixed effect in the model. The Y-axis represents the model frequency of each marker. The X-
axis represents number of chromosomes and each dot colors represent SNPs.

90
1 2 3 4 5 6 7 8 9 10 11 12 14 16 18 20 22 24 26
Chromosome
Figure 7. Genome-wide association analysis between SNP genotypes and daily low (DL)
temperature slope from model-1 analysis, when myostatin genotype (MG) was included as a
fixed effect in the model. The Y-axis represents the model frequency of each marker. The X-axis
represents number of chromosomes and each dot colors represent SNPs.

91
1 2 3 4 5 6 7 8 9 10 11 12 14 16 18 20 22 24 26
Chromosome
Figure 8. Genome-wide association analysis between SNP genotypes and daily low (DL)
temperature slope from model-2 analysis, when myostatin genotype (MG) was not included as a
fixed effect in the model. The Y-axis represents the model frequency of each marker. The X-axis
represents number of chromosomes and each dot colors represent SNPs.

92
References
Åkerfelt, M., Trouillet, D., Mezger, V., & Sistonen, L. E. A. (2007). Heat shock factors at a
crossroad between stress and development. Annals of the New York Academy of
Sciences, 1113(1), 15-27.
Anckar, J., & Sistonen, L. (2011). Regulation of HSF1 function in the heat stress response:
implications in aging and disease. Annual Review of Biochemistry, 80, 1089-1115.
Burrow, H. M. (2001). Variances and covariances between productive and adaptive traits and
temperament in a composite breed of tropical beef cattle. Livestock Production Science, 70(3),
213-233.
Charoensook, R., Gatphayak, K., Sharifi, A. R., Chaisongkram, C., Brenig, B., & Knorr, C.
(2012). Polymorphisms in the bovine HSP90AB1 gene are associated with heat tolerance in Thai
indigenous cattle. Tropical Animal Health and Production, 44(4), 921-928.
Da Silva, R. G. (1973). Improving tropical beef cattle by simultaneous selection for weight and
heat tolerance. Heritabilities and correlations of the traits. Journal of Animal Science, 37(3), 637-
642.
Dikmen, S., Cole, J. B., Null, D. J., & Hansen, P. J. (2012). Heritability of rectal temperature and
genetic correlations with production and reproduction traits in dairy cattle. Journal of Dairy
Science, 95(6), 3401-3405.
Edriss, V., Guldbrandtsen, B., Lund, M. S., & Su, G. (2013). Effect of marker‐data editing on the
accuracy of genomic prediction. Journal of Animal Breeding and Genetics, 130(2), 128-135.

93
Fernando, R. L., & Garrick, D. J. (2008). GenSel-User manual for a portfolio of genomic
selection related analyses.
Habier, D., Fernando, R. L., Kizilkaya, K., & Garrick, D. J. (2011). Extension of the Bayesian
alphabet for genomic selection. BMC Bioinformatics, 12(1), 186.
Hatfield, J. L., Boote, K. J., Kimball, B. A., Ziska, L. H., Izaurralde, R. C., Ort, D., ... & Wolfe,
D. (2011). Climate impacts on agriculture: implications for crop production. Agronomy Journal,
103(2), 351-370.
Hatfield, J. L., Gitelson, A. A., Schepers, J. S., & Walthall, C. L. (2008). Application of spectral
remote sensing for agronomic decisions. Agronomy Journal, 100(Supplement_3), S-117.
Howard, J. T., Kachman, S. D., Nielsen, M. K., Mader, T. L., & Spangler, M. L. (2013). The
effect of myostatin genotype on body temperature during extreme temperature events. Journal of
Animal Science, 91(7), 3051-3058.
Howard, J. T., Kachman, S. D., Snelling, W. M., Pollak, E. J., Ciobanu, D. C., Kuehn, L. A., &
Spangler, M. L. (2014). Beef cattle body temperature during climatic stress: a genome-wide
association study. International Journal of Biometeorology, 58(7), 1665-1672.
Illumina, Inc. (2010) Technical note: DNA analysis, Infinium® genotyping data analysis. San
Diego (CA). Illumina, Inc. 9 p. pub. no. 9702007-005.
Khazzaka, A., Figwer, P., Poirel, M. T., Serrar, M., & Franck, M. (2006). Hsp70 response in pigs
is affected by their Halothane genotypes after heat stress. Journal of Thermal Biology, 31(8),
605-610.

94
Liu, Y. X., Zhou, X., Li, D. Q., Cui, Q. W., & Wang, G. L. (2010). Association of ATP 1 A 1
gene polymorphism with heat tolerance traits in dairy cattle. Genetics and Molecular Research,
9(2), 891-896.
Liu, Y., Li, D., Li, H., Zhou, X., & Wang, G. (2011). A novel SNP of the ATP1A1 gene is
associated with heat tolerance traits in dairy cows. Molecular Biology Reports, 38(1), 83-88.
Mackinnon, M. J., Meyer, K., & Hetzel, D. J. S. (1991). Genetic variation and covariation for
growth, parasite resistance and heat tolerance in tropical cattle. Livestock Production
Science, 27(2-3), 105-122.
Morimoto, R. I. (1998). Regulation of the heat shock transcriptional response: cross talk between
a family of heat shock factors, molecular chaperones, and negative regulators. Genes &
Development, 12(24), 3788-3796.
Nguyen, T. T., Bowman, P. J., Haile-Mariam, M., Pryce, J. E., & Hayes, B. J. (2016). Genomic
selection for tolerance to heat stress in Australian dairy cattle. Journal of Dairy Science, 99(4),
2849-2862.
Page, T. J., Sikder, D., Yang, L., Pluta, L., Wolfinger, R. D., Kodadek, T., & Thomas, R. S.
(2006). Genome-wide analysis of human HSF1 signaling reveals a transcriptional program
linked to cellular adaptation and survival. Molecular BioSystems, 2(12), 627-639.
Seath, D. M. (1947). Heritability of heat tolerance in dairy cattle. Journal of Dairy
Science, 30(3), 137-144.
Seath, D. M., & Miller, G. D. (1947). Heat tolerance comparisons between Jersey and Holstein
cows. Journal of Animal Science, 6(1), 24-34.

95
Sonna, L. A., Fujita, J., Gaffin, S. L., & Lilly, C. M. (2002). Invited review: effects of heat and
cold stress on mammalian gene expression. Journal of Applied Physiology, 92(4), 1725-1742.
Tebaldi, C., Hayhoe, K., Arblaster, J. M., & Meehl, G. A. (2006). Going to the Extremes.
Climatic Change, 79(3), 185-211.
Turner, H. (1984). Variation in rectal temperature of cattle in a tropical environment and its
relation to growth rate. Animal Science, 38(3), 417-427.
Walthall, C. L., Anderson, C. J., Baumgard, L. H., Takle, E., & Wright-Morton, L. (2013).
Climate change and agriculture in the United States: Effects and adaptation.
Winter, A., Alzinger, A., & Fries, R. (2004). Assessment of the gene content of the chromosomal
regions flanking bovine DGAT1. Genomics, 83(1), 172-180.
Zimin, A. V., Delcher, A. L., Florea, L., Kelley, D. R., Schatz, M. C., Puiu, D., ... & Marçais, G.
(2009). A whole-genome assembly of the domestic cow, Bos taurus. Genome Biology, 10(4),
R42.

96