genome-wide association study results for educational ... · h. e 1,4 & p. d. k 5,6,7 h...
TRANSCRIPT
ARTICLE
Genome-wide association study results foreducational attainment aid in identifying geneticheterogeneity of schizophreniaV. Bansal 1,2,3, M. Mitjans1,4, C. A. P. Burik5,6,7, R.K. Linnér 5,6,7, A. Okbay 5,7, C.A. Rietveld6,8,
M. Begemann1,9, S. Bonn 2,3, S. Ripke10,11,12, R. de Vlaming 5,7, M. G. Nivard 13,
H. Ehrenreich1,4 & P. D. Koellinger5,6,7
Higher educational attainment (EA) is negatively associated with schizophrenia (SZ). How-
ever, recent studies found a positive genetic correlation between EA and SZ. We investigate
possible causes of this counterintuitive finding using genome-wide association study results
for EA and SZ (N= 443,581) and a replication cohort (1169 controls; 1067 cases) with deeply
phenotyped SZ patients. We find strong genetic dependence between EA and SZ that cannot
be explained by chance, linkage disequilibrium, or assortative mating. Instead, several genes
seem to have pleiotropic effects on EA and SZ, but without a clear pattern of sign con-
cordance. Using EA as a proxy phenotype, we isolate FOXO6 and SLITRK1 as novel candidate
genes for SZ. Our results reveal that current SZ diagnoses aggregate over at least two disease
subtypes: one part resembles high intelligence and bipolar disorder (BIP), while the other part
is a cognitive disorder that is independent of BIP.
DOI: 10.1038/s41467-018-05510-z OPEN
1 Clinical Neuroscience, Max Planck Institute of Experimental Medicine, Hermann-Rein-Straße 3, 37075 Göttingen, Germany. 2 Research Group forComputational Systems Biology, German Center for Neurodegenerative Diseases (DZNE), Von-Siebold-Straße 3A, 37075 Göttingen, Germany. 3 Institute ofMedical Systems Biology, Center for Molecular Neurobiology, University Clinic Hamburg-Eppendorf, Falkenried 94, 20251 Hamburg, Germany. 4DFGResearch Center for Nanoscale Microscopy and Molecular Physiology of the Brain (CNMPB), Humboldtallee 23, 30703 Göttingen, Germany. 5 Complex TraitGenetics, Vrije Universiteit Amsterdam, De Boelelaan 1085 B-631, 1081 HV Amsterdam, Netherlands. 6 Institute for Behavior and Biology, Erasmus UniversityRotterdam, P.O. Box 1738, 3000 DR Rotterdam, Netherlands. 7 School of Business and Economics, Department of Economics, De Boelelaan 1105, 1081 HVAmsterdam, Netherlands. 8 Erasmus School of Economics, Erasmus University Rotterdam, P.O. Box 1738, 3000 DR Rotterdam, Netherlands. 9 Department ofPsychiatry & Psychotherapy, University of Göttingen, Von-Siebold-Straße 5, 37075 Göttingen, Germany. 10 Analytic and Translational Genetics Unit,Massachusetts General Hospital, 02114 MA Boston, USA. 11 Stanley Center for Psychiatric Research, Broad Institute of MIT and Harvard, 02142 MACambridge, USA. 12 Department of Psychiatry and Psychotherapy, Charité-Universitätsmedizin Berlin, Campus Mitte, Berlin 10117, Germany. 13 Department ofBiological Psychology, Vrije Universiteit Amsterdam, van der Boechorststraat 1, 1081 BT Amsterdam, Netherlands. These authors contributed equally: V.Bansal, M. Mitjans. These authors jointly supervised this work: M.G. Nivard, H. Ehrenreich, P.D. Koellinger. Correspondence and requests for materials shouldbe addressed to P.D.K. (email: [email protected])
NATURE COMMUNICATIONS | (2018) 9:3078 | DOI: 10.1038/s41467-018-05510-z | www.nature.com/naturecommunications 1
1234
5678
90():,;

Schizophrenia (SZ) is the collective term used for a severe,highly heterogeneous and costly psychiatric disorder that iscaused by environmental and genetic factors1–4. A genome-
wide association study (GWAS) by the Psychiatric GenomicsConsortium (PGC) identified 108 genomic loci that are associatedwith SZ5. These 108 loci jointly account for ≈3.4% of the variationon the liability scale for SZ5, while all single-nucleotide poly-morphisms (SNPs) that are currently measured by SNP arrayscapture ≈64% (s.e.= 8%) of the variation in liability for the dis-ease6. This implies that many genetic variants with small effectsizes contribute to the heritability of SZ, but most of them areunidentified as of yet. A polygenic score (PGS) based on all SNPscurrently accounts for 4–15% of the variation on the liability scalefor SZ5.
Yet, this PGS does not predict any differences in symptoms orseverity of the disease among SZ patients4. Partly, this could bebecause the clinical disease classification of SZ spans severaldifferent behavioural and cognitive traits that may not haveidentical genetic architectures. Therefore, identifying additionalgenetic variants and understanding through which pathways theyare linked with the clinical diagnosis of SZ is an important step inunderstanding the aetiologies of the ‘schizophrenias’7. However,GWAS analyses of specific SZ symptoms would require very largesample sizes to be statistically well-powered, and the currentlyavailable data sets on deeply phenotyped SZ patients are not yetlarge enough for this purpose.
Here, we use an alternative approach to make progress withdata that is readily available—by combining GWAS for SZ andeducational attainment (EA). Previous studies suggest a complexrelationship between EA and SZ8 that may be used to gainadditional insights into the genetic architecture of SZ and itssymptoms. In particular, phenotypic data seem to suggest anegative correlation between EA and SZ9. For example, SZpatients with lower EA typically show an earlier age of diseaseonset, higher levels of psychotic symptomatology and worsenedglobal cognitive function9. In fact, EA has been suggested to be ameasure of premorbid function and a predictor of outcomes inSZ. Moreover, it has been forcefully argued that retarded intel-lectual development, global cognitive impairment during child-hood and bad school performance should be seen as core featuresof SZ that precede the development of psychotic symptoms anddifferentiate SZ from bipolar disorder (BIP)10–14. Furthermore,credible genetic links between SZ and impaired cognitive per-formance have been found15.
In contrast to these findings, recent studies using large-scaleGWAS results identified a small, but positive genetic correlationbetween EA and SZ (ρEA,SZ= 0.08)8, and higher PGS values forSZ have been reported to be associated with creativity andgreater EA16. Other statistically well-powered studies foundthat a high intelligence quotient (IQ) has protective effectsagainst SZ17 and reported a negative genetic correlationbetween IQ and SZ (ρIQ,SZ= –0.2)18, suggesting the possibilitythat genetic effects that contribute to EA but not via IQare responsible for the observed positive genetic correlationbetween SZ and EA.
Indeed, previous research by the Social Science Genetic Asso-ciation Consortium (SSGAC)8 already demonstrated that theeffect of the EA-PGS on years of schooling is mediated by severalindividual characteristics that have imperfect or no genetic cor-relation with each other, including higher IQ, higher opennessand higher conscientiousness. These different factors that con-tribute to EA seem to be related to SZ and its symptoms incomplex ways19–21. For example, differences in openness havebeen reported to differentiate between patients diagnosed with SZspectrum personality disorders (higher openness) from patientsdiagnosed with SZ (lower openness), while conscientiousness
tends to be reduced among patients of both disorders comparedto healthy controls19.
The contributing factors to EA that have previously been iden-tified by the SSGAC (i.e. IQ, openness and conscientiousness)8 arephenotypically and genetically related, but by no meansidentical22,23. Specifically, the Cognitive Genomics Consortium(COGENT) reported a moderate genetic correlation between IQand openness (rg= 0.48, P= 3.25 × 10⁻⁴), but only a small geneticcorrelation of IQ and conscientiousness of 0.10 that was indis-tinguishable from zero (rg= 0.10, P= 0.46)24. Therefore, it isappropriate to think of EA as a genetically heterogeneous traitthat can be decomposed into subphenotypes that have imperfectgenetic correlations with each other. If the various symptoms ofSZ also have non-identical genetic architectures, this could resultin a pattern where both EA and SZ share many genetic loci, butwithout a clear pattern of sign concordance and with seeminglycontradictory phenotypic and genetic correlation results.
To explore this hypothesis and to discern it from alternativeexplanations, we perform a series of statistical genetic analysesusing large-scale GWAS results for SZ and EA from non-overlapping samples. We start by characterizing the geneticrelationship between both traits by using EA as a ‘proxy pheno-type’25 for SZ. We annotate possible biological pathways, tissuesand cell types implied by genetic variants that are associated withboth traits and explore to what extent these variants are alsoenriched for association with other traits. We test if the geneticrelationship between EA and SZ can be explained by chance,linkage disequilibrium (LD) or assortative mating. Furthermore,we investigate the hypothesis that the part of SZ that is differentfrom BIP is a neurodevelopmental disorder, whereas the part ofSZ that overlaps with BIP is not. Finally, we develop a formalstatistical test for genetic heterogeneity of SZ using a polygenicprediction framework that leverages both the SZ and the EAGWAS results. Together, our analysis suggest that current SZdiagnoses aggregate over at least two disease subtypes: one partresembles BIP and high IQ, while the other part is a cognitivedisorder that is independent of BIP.
ResultsGenetic dependence and genetic correlation. As a formal pre-lude to our study, it is conceptually important to differentiatebetween genetic dependence and genetic correlation. In ouranalyses, genetic dependence means that the genetic variantsassociated with EA are more likely to also be associated with SZthan expected by chance. In contrast, genetic correlation isdefined by the correlation of the (true) effect sizes of geneticvariants on the two traits. Thus, genetic correlation implies alinear genetic relationship between two traits whereas geneticdependence does not. Thus, two traits can be genetically depen-dent even if they are not genetically correlated and vice versa. Onepossible cause of a non-linear genetic dependence is that at leastone of the traits is genetically heterogeneous in the sense that itaggregates across subphenotypes (or symptoms) with non-identical genetic architectures. Supplementary Note 1 presents aformal discussion and simulations that illustrate the data patternsthat can emerge.
Proxy-phenotype analyses. We used the proxy-phenotypemethod (PPM)25 to illustrate the genetic dependence betweenEA and SZ. PPM is a two-stage approach. In the first stage, aGWAS on the proxy-phenotype (EA) is conducted. The moststrongly associated loci are then advanced to the second stage,which tests the association of these loci with the phenotype ofinterest (SZ) in an independent sample. If the two traits aregenetically dependent, this two-stage approach can increase the
ARTICLE NATURE COMMUNICATIONS | DOI: 10.1038/s41467-018-05510-z
2 NATURE COMMUNICATIONS | (2018) 9:3078 | DOI: 10.1038/s41467-018-05510-z | www.nature.com/naturecommunications

statistical power for detecting associations for the target traitbecause it limits the multiple testing burden for the phenotype ofinterest compared to a GWAS8,25,26.
Our PPM analyses followed a preregistered analysis plan(https://osf.io/dnhfk/) using GWAS results on EA (n= 363,502)8
and SZ (34,409 cases and 45,670 controls)5 that were obtainedfrom non-overlapping samples of Europeans. For replication andfollow-up analyses, we used the Göttingen Research Associationfor Schizophrenia (GRAS) data collection27, which has a uniquelyrich and accurate set of SZ measures. The GRAS sample was notpart of either GWAS.
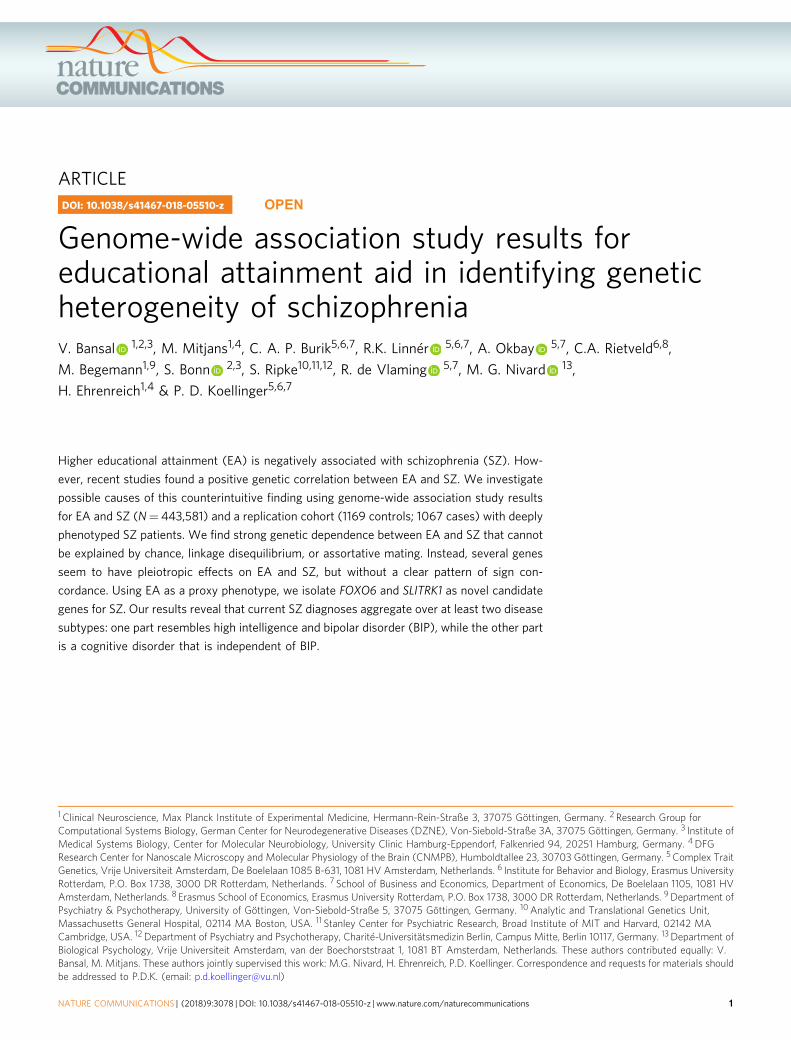
Analyses were performed using 8,240,280 autosomal SNPs thatpassed quality controls in both GWAS and additional filters. Weselected approximately independent lead SNPs from the EAGWAS that passed the predefined significance threshold of PEA <10–5 and looked up their SZ results. To test if EA-associated SNPsare more strongly associated with SZ than expected by chance(referred to as ‘raw enrichment’ below), we conducted aMann–Whitney test that compares the PSZ values of the EA-associated lead SNPs with the PSZ values of a set of randomlydrawn, approximately LD-independent SNPs with similar minorallele frequencies (MAFs). Fig. 1 presents an overview of theproxy-phenotype analyses.
The first-stage GWAS on EA identified 506 loci that passed ourpredefined threshold of PEA < 10–5 (Supplementary Note 2); 108of them were significant at the genome-wide level (PEA < 5 × 10⁻⁸,see Supplementary Data 2). Of the 506 EA lead-SNPs, 132 areassociated with SZ at nominal significance (PSZ < 0.05), and 21 ofthese survive Bonferroni correction (PSZ < 0:05
506 = 9.88 × 10⁻⁵)(Table 1). LD score regression results suggest that the vastmajority of the association signal in both the EA8 and the SZ5
GWAS are truly genetic signals, rather than spurious signalsoriginating from uncontrolled population stratification. Fig. 2ashows a Manhattan plot for the GWAS on EA highlighting SNPsthat were also significantly associated with SZ (black crosses forPSZ < 0.05, magenta crosses for PSZ= 9.88 × 10⁻⁵).
A Q–Q plot of the 506 EA lead SNPs for SZ is shown in Fig. 2b.Although the observed sign concordance of 52% is notsignificantly different from a random pattern (P= 0.40), we find3.23 times more SNPs in this set of 506 SNPs that are nominallysignificant for SZ than expected given the distribution of theP values in the SZ GWAS results (raw enrichment P= 6.87 ×10⁻¹⁰). The observed enrichment of the 21 EA lead SNPs thatpass Bonferroni correction for SZ (PSZ < 0:05
506 = 9.88 × 10⁻⁵) iseven more pronounced (27 times stronger, P= 5.44 × 10⁻¹⁴).
The effect sizes of these 21 SNPs on SZ are small, ranging fromodds ratio (OR)= 1.02 (rs4500960) to OR= 1.11 (rs4378243)after correction for the statistical winner’s curse25 (Table 1). Wecalculated the probability that these 21 SNPs are truly associatedwith SZ using a heuristic Bayesian method that takes the winner’scurse corrected effect sizes, statistical power and prior beliefs intoaccount25. Applying a reasonable prior belief of 5%, we find thatall 21 SNPs are likely or almost certain to be true positives.
Novel SZ loci. Of the 21 variants we identified, 12 are in LD withloci previously reported by the PGC5 and two are in the majorhistocompatibility complex region on chromosome (chr) 6 andwere therefore not separately reported in that study. Three of thevariants we isolated (rs7610856, rs143283559 and rs28360516)were independently found in a meta-analysis of the PGC results5
with another large-scale sample which identified 50 novel SZSNPs28. Two of the 21 variants (rs756912, rs7593947) are in LDwith loci recently reported in a study that also compared GWASfindings from EA and SZ using smaller samples and a less con-servative statistical approach29. The remaining two SNPs we
identified here (rs7336518 on chr13 and rs7522116 on chr1) addto the list of empirically plausible candidate loci for SZ.
Using a proportions test, we compared the ratio of novel SNPsfrom ref.28 included in our list of 132 loci that are jointlyassociated with EA and SZ (PEA < 10−5 and PSZ < 0.05, yielding 6loci) with the ratio observed in all remaining approximatelyindependent loci with PSZ < 0.05 in our SZ GWAS results. Wefound that the proportion of novel SZ SNPs is higher among the132 loci that are informed by the EA GWAS results (Fisher’sexact test P= 2.4 × 10⁻⁹, two-sided). Thus, using EA as a proxy-phenotype for SZ helped to predict the novel genome-widesignificant findings reported in ref.28, illustrating the power of theproxy-phenotype approach.
Detection of shared causal loci. The next step in our study was aseries of analyses that aimed to identify reasons for the observedgenetic dependence between EA and SZ and to put the findings ofthe PPM analysis into context. First, we probed if there is evi-dence that the loci identified by the PPM may tag shared causalloci for both EA and SZ (i.e. pleiotropy), rather than being in LDwith different causal loci for both traits.
For each of the 21 SNPs isolated by our PPM analysis, welooked at their neighbouring SNPs within a ±500 kb window andestimated their posterior probability of being causal for EA or SZusing PAINTOR30. We then selected two sets of SNPs, each ofwhich contains the smallest number of SNPs that yields acumulative posterior probability of 90% or 50% of containingthe causal locus for EA and SZ. We refer to these as broad sets(90%) and narrow sets (50%), respectively. SupplementaryNote 3 and Supplementary Data 4 also contain results for the80 and 65% credibility sets. For each of these sets, we calculatedthe posterior probability that it contains the causal locus for theother trait.
For the broad credibility set analyses (90%), we found 11 lociwith a medium or high credibility to have direct causal effects onboth EA and SZ (including one of the novel SNPs, rs7336518). Sixof these loci have concordant effects on the two traits (i.e. ++ or−−) while five have discordant effects (i.e. +− or −+, Table 1).The analyses of the 50% credible sets are based on a smaller numberof SNPs. This also results in lower probabilities that the SZ setcontains the causal SNP for EA and vice versa. Nevertheless, ouranalysis with 50% credible sets show that four specific loci(rs7610856, rs320700, rs79210963 and rs7336518) had credibilityof more than 15% for the other trait, providing support for the high(rs320700 and rs79210963) and medium (rs7610856 andrs7336518) credibility judgments based on the 90% sets. One ofthese has a discordant effect (rs7610856) while the others have aconcordant effect on SZ and EA.
Overall, our analyses suggest that some of the 21 SNPs that weidentified by using EA as a proxy-phenotype for SZ are likely tohave direct pleiotropic effects on both traits. Of the most likelycandidates for direct pleiotropic effects, three SNPs haveconcordant signs (rs79210963, rs7336518 and rs320700) andone has discordant signs (rs7610856).
Biological annotations. Biological annotation of the 132 SNPsthat are jointly associated with EA (PEA < 10−5) and SZ (PSZ <0.05) using DEPICT (Supplementary Note 4 and SupplementaryData 5–7) points to genes that are known to be involved inneurogenesis and synapse formation (Supplementary Data 8).Some of the indicated genes, including SEMA6D and CSPG5,have been suggested to play a potential role in SZ31,32.
For the two novel candidate SNPs reported in this study(rs7522116 and rs7336518), DEPICT points to the FOXO6(Forkhead Box O6) and the SLITRK1 (SLIT and NTRK Like
NATURE COMMUNICATIONS | DOI: 10.1038/s41467-018-05510-z ARTICLE
NATURE COMMUNICATIONS | (2018) 9:3078 | DOI: 10.1038/s41467-018-05510-z | www.nature.com/naturecommunications 3

Family Member 1) genes, respectively. FOXO6 is predominantlyexpressed in the hippocampus and has been suggested to beinvolved in memory consolidation, emotion and synapticfunction33,34. Similarly, SLITRK1 is also highly expressed in thebrain35, is particularly localized to excitatory synapses andpromotes their development36, and it has previously beensuggested to be a candidate gene for neuropsychiatric disorders37.
LD-aware enrichment across different traits. The raw enrich-ment P value reported in Fig. 2b could in principle be due to theLD structure of the EA lead SNPs that we tested. Specifically, ifthese EA lead SNPs have stronger LD with other SNPs in thehuman genome than expected by chance, this could cause theobserved enrichment of this set of SNPs on SZ and other traitsbecause higher LD increases the chance these SNPs would ‘tag’causal SNPs that they are correlated with38,39.
To assess the null hypothesis that the observed geneticdependence between EA and SZ can be entirely explained byLD patterns in the human genome, we developed an associationenrichment test that corrects for the LD score of each SNP. Weapplied this test to the 132 SNPs that are jointly associated withEA (PEA < 10−5) and SZ (PSZ < 0.05), i.e. the loci that wereidentified by using EA as a proxy-phenotype for SZ. LD scoreswere obtained from the HapMap 3 European reference panel40
(Supplementary Data 9). We found significant joint LD-awareenrichment for SZ (P= 9.57 × 10−66), demonstrating that thegenetic dependence between EA and SZ cannot be entirelyexplained by LD.
Furthermore, we used this test to explore if these SNPs aregenerally enriched for association with all (brain-related) pheno-types, or whether they exhibit some degree of outcome specificity.For this purpose, we extended the LD-aware enrichment test to21 additional traits for which GWAS results were available in the
1) EA GWAS (Okbay et al. 2016)
N = 363,502 individuals
12,299,530 SNPs
2) SZ GWAS (Ripke et al. 2014)
(PGC - GRAS excluded)
N = 34,409 cases
N = 45,670 controls
17,221,718 SNPs
8,240,280 SNPs
Overlap
EA_all
EA_all
pEA < 10–5
506 SNPs
132 SNPs
21 SNPs
BonferronipSZ = 0.05/506
2 SNPsnovel for SZ
SZ_all
EA_132 SZ_132
8,240,280 SNPs
3) Proxy-phenotype
4) Schizophrenia diagnosis prediction in the GRAS sampleN = 1054 cases/N = 1169 controls
5) Schizophrenia symptom prediction in the GRAS sampleN = 1054 cases
Pol
ygen
ic r
isk
scor
esP
olygenic risk scoresP
olyg
enic
ris
k sc
ore
Polygenic risk scores
pSZ < 0.05
Concordant
SNP effectEA SZ
8,240,280 SNPs
Discordant
+
+
–
–
+–
+–
a
b
c
Fig. 1 Workflow of the proxy-phenotype analyses. Notes: Educational attainment (EA) and schizophrenia (SZ) GWAS results are based on the analysesreported in refs.5, 8. All cohorts that were part of the SZ GWAS were excluded from the meta-analysis on EA. The GRAS data collection was not included ineither the SZ or the EA meta-analysis. Proxy-phenotype analyses were conducted using 8,240,280 autosomal SNPs that passed quality control. Geneticoutliers of non-European descent (N= 13 cases) were excluded from the analysis in the GRAS data collection
ARTICLE NATURE COMMUNICATIONS | DOI: 10.1038/s41467-018-05510-z
4 NATURE COMMUNICATIONS | (2018) 9:3078 | DOI: 10.1038/s41467-018-05510-z | www.nature.com/naturecommunications

public domain (Supplementary Fig. 5 and SupplementaryData 10). Some of the traits were chosen because they arephenotypically related to SZ (e.g. neuroticism, depressivesymptoms, major depressive disorder, autism and childhoodIQ), while others were less obviously related to SZ (e.g. age atmenarche, intracranial volume and cigarettes per day) or servedas negative controls (height, birth weight, birth length and fasting(pro)insulin). The power of the LD-aware enrichment testprimarily depends on the GWAS sample size of the target traitand results of our test would be expected to change as GWASsample sizes keep growing. We found LD-aware enrichment ofthese SNPs for BIP, neuroticism, childhood IQ and age atmenarche. However, we found no LD-aware enrichment for otherbrain-traits that are phenotypically related to SZ, such asdepressive symptoms, subjective well-being, autism and attentiondeficit hyperactivity disorder. We also did not find LD-awareenrichment for most traits that are less obviously related to thebrain and our negative controls. Furthermore, one of the novelSNPs we isolated shows significant LD-aware enrichment bothfor SZ and for BIP (rs7522116). The results suggest that the lociidentified by the PPM are not simply related to all (brain) traits.Instead, they show some degree of phenotype specificity.
Replication in the GRAS sample. Following our preregisteredanalysis plan (https://osf.io/dnhfk/), we replicated the PPM ana-lysis results in the GRAS sample (Supplementary Note 5 andSupplementary Data 11) using polygenic prediction (Supple-mentary Note 6, Supplementary Data 12 and SupplementaryFig. 6). The PGS (SZ_132) that is based on the 132 independentEA lead SNPs that are also nominally associated with SZ (PEA <10−5 and PSZ < 0.05) adds ΔR2= 7.54− 7.01%= 0.53%
predictive accuracy for SZ case–control status to a PGS (SZ_all)derived from the GWAS on SZ alone (P= 1.7 × 10⁻⁴, Supple-mentary Data 13, Model 3).
Prediction of SZ measures among patients. To explore thegenetic architecture of specific SZ measures, we again used ourreplication sample (GRAS), which contains exceptionally detailedmeasures of SZ symptoms, severity and disease history4,7,27. Wefocused on years of education, age at prodrome, age at diseaseonset, premorbid IQ (approximated by a multiple-choice voca-bulary test), global assessment of functioning (GAF), the clinicalglobal impression of severity (CGI-S) as well as positive andnegative symptoms (PANSS positive and negative, respectively)among SZ patients (N ranges from 903 to 1039, see Supple-mentary Note 5). Consistent with the idea that EA is a predictorof SZ measures, our phenotypic correlations show that highereducation is associated with later age at prodrome, later onset ofdisease and less severe disease symptoms among SZ patients(Supplementary Note 7, Supplementary Data 15 and Supple-mentary Fig. 7).
Our most direct test for genetic heterogeneity of SZ is based onPGS analyses that we performed using the detailed SZ measuresamong GRAS patients. If SZ is genetically heterogeneous, there ispotentially relevant information in the sign concordance ofindividual SNPs with EA traits that may improve the predictionof symptoms (Supplementary Note 1). We use a simple methodto do this here: first, we construct a PGS for SZ that contains oneSNP per LD-block that is most strongly associated with SZ.Overall, this score (SZ_all) contains 349,357 approximately LD-independent SNPs. Next, we split SZ_all into two scores, based onsign-concordance of the SNPs with SZ and EA. More specifically,
Table 1 SNPs significantly associated with schizophrenia after Bonferroni correction
SNP-ID EA beta Signsconcordant
SZ adj. R2
(%)SZ OR(Adj.)
EAF Power α=0.05/506 (%)
Chance of directpleiotropic effecton EA and SZ
Posterior probability of trueassociation with SZ priorbelief (π) (%)
90%sets
50%sets
0.1% 1.0% 5.0% 10.0%
rs79210963 −0.016 Yes 0.021 0.931 0.89 22.9 H M 75.0 96.8 99.3 99.7rs7610856 0.013 No 0.022 0.955 0.41 22.8 M M 74.9 96.8 99.3 99.7rs10896636 0.012 No 0.020 0.956 0.67 17.8 H L 68.7 95.6 99.1 99.5rs756912 −0.015 Yes 0.022 0.956 0.51 22.7 L L 74.8 96.7 99.3 99.7rs6449503 0.018 No 0.020 0.961 0.51 12.9 L L 60.0 93.7 98.7 99.3rs7336518 −0.016 Yes 0.014 0.964 0.13 1.5 M M 13.4 60.6 88.5 93.9rs143283559 0.014 No 0.017 0.965 0.72 4.6 M L 32.8 83.0 96.1 98.0rs11210935 0.015 No 0.014 0.973 0.77 1.2 L L 10.9 55.1 86.0 92.5rs77000541 −0.014 Yes 0.018 0.974 0.33 1.6 L L 14.1 62.2 89.2 94.3rs2819344 0.014 No 0.017 0.983 0.62 0.3 H L 3.0 23.3 60.4 75.3rs4500960 −0.013 No 0.017 1.017 0.47 0.3 L L 3.0 23.3 60.4 75.3rs28360516 −0.012 No 0.013 1.027 0.70 1.4 M L 12.6 59.0 87.8 93.5rs7522116 0.011 Yes 0.015 1.029 0.56 3.0 M L 23.8 75.8 94.0 96.9rs7593947 0.014 Yes 0.018 1.040 0.51 12.5 M L 59.1 93.5 98.6 99.3rs11694989 0.011 Yes 0.021 1.044 0.43 17.9 L L 68.8 95.7 99.1 99.5rs320700 0.013 Yes 0.024 1.054 0.65 36.4 H M 85.3 98.3 99.7 99.8rs3957165 0.015 Yes 0.020 1.056 0.83 14.7 L L 63.6 94.6 98.9 99.4rs10791106 0.011 Yes 0.026 1.056 0.54 46.9 L L 89.9 98.9 99.8 99.9rs2992632 0.016 Yes 0.025 1.060 0.74 36.8 M L 85.5 98.3 99.7 99.8rs10773002 0.022 Yes 0.043 1.087 0.28 91.0 L L 99.0 99.9 100.0 100.0rs4378243 0.019 Yes 0.044 1.112 0.85 91.5 L L 99.1 99.9 100.0 100.0
Notes: The SNPs in the table are ordered by their odds ratio (OR) on schizophrenia (SZ). Effect sizes for SZ (in R2 and OR) are downward adjusted for the winner’s curse25. EA (beta) is the standardizedbeta of a SNP for educational attainment (EA) GWAS. R2 was approximated from the winner’s curse adjusted OR ratios, using the formulas described in Methods section. The winner’s curse adjustmenttook into account that only SNPs with P= 0.05/506 were selected. SNPs with concordant effects on both SZ and EA are marked as ‘yes’ in the sign concordance column. EAF is the effect allele frequencyin the SZ GWAS data. Power calculations assumed that the available GWAS sample size for SZ for each SNP consisted of 34,409 cases and 45,670 controls. The chance that a SNP has direct pleiotropiceffects on EA and SZ has been evaluated with PAINTOR using sets of SNPs that have a cumulative probability of 90% or 50% to include the causal variant (see Methods and Supplementary Note 3). Theposterior probability that these SNPs are truly associated with SZ was calculated using the Bayesian procedure developed by Rietveld et al.25. SNPs highlighted in bold are associations for SZ that havenot been emphasized in the previous literature. H high, M medium, L low.
NATURE COMMUNICATIONS | DOI: 10.1038/s41467-018-05510-z ARTICLE
NATURE COMMUNICATIONS | (2018) 9:3078 | DOI: 10.1038/s41467-018-05510-z | www.nature.com/naturecommunications 5

one score contains all estimated SZ effects of SNPs that haveconcordant signs for both traits (174,734 SNPs with ++ or −−on both traits, Concordant) while the other contains the estimatedSZ effects of the remaining SNPs with discordant effects (174,623SNPs with +− or −+, Discordant). Note that splitting the SZ_allscore this way is not expected to improve the prediction ofsymptoms if they share the same genetic architecture (i.e. if SZwas a genetically homogenous trait). We test this null hypothesiswith an F test that compares the predictive performance ofmodels that include (i) the SZ_all and the EA score (EA_all) and(ii) the Concordant, Discordant, and EA_all scores (Supplemen-tary Note 1). We also compare the performance of both of thesemodels to a baseline that only includes the SZ_all score as arelevant predictor.
We found that the EA_all PGS is associated with years ofeducation (P= 1.0 × 10⁻⁶) and premorbid IQ (P= 2.7 × 10⁻⁴)among SZ patients (Table 2). Consistent with earlier results4, wealso found that none of the SZ measures can be predicted by the
PGS for SZ (SZ_all, Table 2). However, splitting the PGS for SZbased on the sign-concordance of SNPs with EA (Concordant andDiscordant) increased predictive accuracy significantly forseverity of disease (GAF (pF= 0.023)) and symptoms (PANSSnegative (pF= 0.007)) (Table 2). This increase in predictiveaccuracy is evidence for genetic heterogeneity of SZ (Supplemen-tary Note 1). Specifically, our results indicate that SZ patients witha high genetic propensity for EA have better GAFs and less severenegative symptoms (PANSS negative). However, if the highgenetic predisposition for EA is primarily due to loci that alsoincrease the risk for SZ (i.e. high values on the Concordant score),this protective effect is attenuated. We repeated these analysesexcluding patients who were diagnosed with schizoaffectivedisorder (SD, N= 198) and found similar results, implying thatour findings are not only due to the presence of patients with SD(Supplementary Note 8, Supplementary Data 18).
We note that this implementation of our test for heterogeneityof SZ (Supplementary Note 1) is based on a conservative pruning
Sig
nific
ance
of a
ssoc
iatio
n (–
log 1
0 (P
val
ue)) 40
30
20
10
01 2 3 4 5 6 7 8
Chromosome
Schizophrenia
Obs
erve
d –l
og10
(P
val
ue)
9 10 11 12 13 14 15 17 19 2122201816
Lead SNPs (PSZ < 0.05)EA
Lead SNPs (PSZ < 9.85×10⁻⁵)
P value = 1×10⁻⁵
8
6
4
2
Enrichment P value: 6.87×10⁻¹⁰
Sign concordance: 52%
Expected –log10 (P value)
20 4 6 8
0
rs4378243 (–log10 (P value) = 12.3)
rs10773002 (–log10
(P value) = 11.5)
rs10791106
rs2992632
rs756912
rs3957165rs10896636
rs6449503
rs4500960
rs143283559rs7522116rs11210935rs28360516rs77000541
rs2819344rs7336518
rs7593947
rs11694989rs79210963
rs7610856
rs320700
a
b
Fig. 2 Results of the proxy-phenotype analyses. Notes: a Manhattan plot for educational attainment (EA) associations (n= 363,502). The x axis is thechromosomal position, and the y axis is the significance on a −log10 scale (two-sided). The black dashed line shows the suggestive significance level of10−5 that we specified in our preregistered analysis plan. Black and magenta crosses identify EA-associated lead-SNPs that are also associated with SZ atnominal or Bonferroni-adjusted significance levels, respectively. b Q–Q plot of the 506 EA-associated SNPs for schizophrenia (SZ) (n= 34,409 cases andn= 45,670 controls). SNPs with concordant effects on both phenotypes are pink, and SNPs with discordant effects are blue. SNPs outside the grey area (21SNPs) pass the Bonferroni-corrected significance threshold that corrects for the total number of SNPs we tested (P < 0.05/506= 9.88 × 10⁻⁵) and arelabelled with their rs numbers. Observed and expected P values are on a −log10 scale. For the sign concordance test: P= 0.40, two-sided
ARTICLE NATURE COMMUNICATIONS | DOI: 10.1038/s41467-018-05510-z
6 NATURE COMMUNICATIONS | (2018) 9:3078 | DOI: 10.1038/s41467-018-05510-z | www.nature.com/naturecommunications

algorithm that controls for LD both within and across theConcordant and Discordant scores. This limits the number ofgenetic markers in both of these scores, their expected predictiveaccuracy and the power of the test. As an alternative, we also useda less conservative approach that only prunes for LD withinscores, yielding 260,441 concordant and 261,062 discordantSNPs. Split scores based on this extended set of SNPs have higherpredictive accuracy for all the SZ measures that we analysed(Supplementary Data 22), reaching ΔR2= 1.12% (pF= 0.0004)for PANSS negative.
Finally, we show that randomly splitting the SZ_all score doesnot yield any gains in predictive accuracy (SupplementaryData 19).
Genetic differences between SZ and bipolar. The ongoingdebate about what constitutes the difference between SZ andBIP10–14 suggests an additional possibility to test for geneticheterogeneity among SZ cases. While SZ and BIP share psycho-tic symptoms such as hallucinations and delusions, scholars haveargued that SZ should be perceived as a neurodevelopmentaldisorder in which cognitive deficits precede the development ofpsychotic symptoms, while this is not the case for BIP10–14.However, cognitive deficits during adolescence are currently not adiagnostic criterion that formally differentiates SZ from BIP. As aresult, many patients who are formally diagnosed with SZ did notsuffer from cognitive impairments in their adolescent years, buttheir disease aetiology may be different from those who do. Thesedifferences in disease aetiology may be visible in how the non-shared part of the genetic architecture of SZ and BIP is related tomeasures of cognition, such as EA and childhood IQ.
We tested this by using genome-wide inferred statistics(GWIS)41 to obtain GWAS regression coefficients and standarderrors for SZ that are ‘purged’ of their genetic correlation withBIP and vice versa (yielding ‘unique’ SZ(min BIP) and ‘unique’BIP(min SZ) results, respectively). We repeated the look-up of theEA-associated lead SNPs in those summary statistics and find thatthe enrichment is weaker than in the SZ GWAS results that did
not control for genetic overlap between SZ and BP (Supplemen-tary Note 9).
We then computed genetic correlations of these GWIS resultswith EA, childhood IQ and (as a non-cognitive control trait)neuroticism using bivariate LD score regression42, and comparedthe results to those obtained using ordinary SZ and BIP GWASresults (Supplementary Note 10).
In line with earlier findings8,42, we see a positive geneticcorrelation of ordinary SZ and BIP with EA. However, the geneticcorrelations between ‘unique’ SZ(min BIP) with EA and childhoodIQ are negative and significant (rg=−0.16, P= 3.88 × 10⁻⁴ andrg=−0.31, P= 6.00 × 10⁻³, respectively), while the geneticcorrelations of ‘unique’ BIP(min SZ) with EA and IQ remainpositive (rg ≈ 0.3) (Fig. 3, Supplementary Data 24). Thus, theslightly positive genetic correlation between SZ and EA8,42 can beentirely attributed to the genetic overlap between SZ and BIP41, aresult recently replicated using genomic structural equationmodelling43. Overall, these results add to the impression thatcurrent clinical diagnoses of SZ aggregate over various non-identical disease aetiologies.
Simulating assortative mating. Finally, simulations show thatassortative mating is unlikely to be a major cause of the observedlevel of genetic dependence between EA and SZ (SupplementaryNote 11, Supplementary Fig. 9).
DiscussionWe explored the genetic relationship between EA and SZ usinglarge, non-overlapping GWAS samples. Our results show thatEA-associated SNPs are much more likely to be associated withSZ than expected by chance, i.e. both traits are geneticallydependent. Overall, we isolated 21 genetic loci that are crediblyassociated with SZ by using EA as a proxy-phenotype, includingtwo novel candidate genes, FOXO6 and SLITRK1. Furthermore,we showed that EA GWAS results help to predict future GWASfindings for SZ in even larger samples.
Table 2 Polygenic prediction of schizophrenia measures in the GRAS patient sample
Years ofeducationa
Age atprodrome
Age atdisease onset
PremorbidIQa
GAFb CGI-Sb PANSSpositiveb
PANSSnegativeb
Baseline model
SZ_all Stand.beta
0.001 −0.041 −0.056 −0.063 −0.024 0.041 0.033 0.043
P value 0.976 0.297 0.129 0.090 0.510 0.249 0.364 0.253EA_all Stand.
beta0.182** 0.005 −0.002 0.149** 0.068* −0.057 0.001 −0.051
P value 4.4 × 10−09 0.884 0.961 7.2 × 10⁻⁶ 0.029 0.065 0.981 0.107Adj. R² 0.0612 0.0023 0.0047 0.0417 0.0655 0.0816 0.0711 0.0243ΔAdj. R²c 0.0312 −0.0010 −0.0009 0.0209 0.0035 0.0023 −0.0010 0.0015
Split model
Concordant Stand.beta
−0.013 −0.019 −0.031 −0.043 −0.096* 0.050 0.079 0.125**
P value 0.751 0.665 0.456 0.326 0.022 0.232 0.059 0.0036Discordant Stand.
beta0.014 −0.030 −0.035 −0.034 0.066 <0.001 −0.039 −0.072
P value 0.730 0.515 0.409 0.437 0.112 0.996 0.351 0.090EA_all Stand.
beta0.191** 0.002 −0.002 0.153** 0.122** −0.074 −0.039 −0.118**
P value 1.0 × 10−06 0.965 0.953 2.7×10⁻⁴ 0.002 0.058 0.319 0.003Adj. R² 0.0604 0.0012 0.0037 0.0406 0.0694 0.0811 0.0728 0.0306ΔAdj. R²c 0.0304 −0.0021 −0.0019 0.0198 0.0074 0.0018 0.0007 0.0078
n 1039 915 1043 903 1010 1014 1009 1002ΔR² (Split−baselinemodel)
−0.0008 −0.0011 −0.0010 −0.0011 0.0039 −0.0005 0.0017 0.0063
P value from F testd 0.698 0.907 0.968 0.891 0.023* 0.479 0.098 0.007**
Notes: Linear regression using the first ten genetic principal components as control variables aAge of onset was included as covariate bMedication was included as covariate cChange in Adj. R2 of themodels compared to a model that only contains the SZ_all score and the control variables dP value from F test refers to improvement in split model compared to baseline model *Significance at P o 0.05**Significance at P o 0.01 Stand standardized.
NATURE COMMUNICATIONS | DOI: 10.1038/s41467-018-05510-z ARTICLE
NATURE COMMUNICATIONS | (2018) 9:3078 | DOI: 10.1038/s41467-018-05510-z | www.nature.com/naturecommunications 7

Biological annotation of a broader set of SNPs that are jointlyassociated with EA (PEA < 10−5) and SZ (PSZ < 0.05) points toneurogenesis and synapse formation as potentially importantpathways that may influence both traits.
However, the genetic loci that are associated with both traits donot follow a systematic sign pattern that would correspond to astrong positive or negative genetic correlation. Our follow-upanalyses demonstrated that this pattern of strong geneticdependence but weak genetic correlation between EA and SZcannot be fully explained by LD or assortative mating.
Instead, our results are most consistent with the idea that EAand SZ are both genetically heterogeneous traits that aggregateover various subphenotypes or symptoms with non-identicalgenetic architectures. Specifically, our results suggest that currentSZ diagnoses aggregate over at least two disease subtypes: onepart resembles BIP and high IQ (possibly associated with Con-cordant SNPs), where better cognition may also be geneticallylinked to other BIP features such as higher energy and drive,while the other part is a cognitive disorder that is independent ofBIP (possibly influenced by Discordant SNPs). This latter subtypebears similarity with Kraepelin’s description of dementia prae-cox11. Overall, our pattern of results resonates with the idea thatcognitive deficits in early life may be an important differentiatingfactor between patients with BIP versus SZ psychosis.
Moreover, splitting the PGS for SZ into two scores based on thesign concordance of SNPs with EA enables the prediction ofdisease symptoms and severity from genetic data for the first timeto some extent. We showed that this result is not driven bypatients with SD and it cannot be repeated by randomly splittingthe SZ score. Obviously, further replication of our results in othersamples with high-quality SZ measures would be highly desirable.
The many sign-concordant loci that increase the risk for SZ butalso improve the chance for higher education point to possibleside-effects of pharmacological interventions that may aim totarget biological pathways that are implicated by pleiotropic loci.Indeed, exploring pleiotropic patterns of disease-associated genesacross a broad range of phenotypes (including social-scientificones such as EA or subjective well-being26) may be a viable
strategy to identify possible side-effects of new pharmacologicalproducts at early stages of drug development in the future.
Although the complexity of SZ remains astonishing, our studycontributes to unravelling this complexity by starting at a geneticlevel of analysis using well-powered GWAS results. Our resultsprovide some hope that a psychiatric nosology that is based onbiological causes rather than pure phenotypical classificationsmay be feasible in the future. Studies that combine well-poweredGWASs of several diseases and from phenotypes that representvariation in the normal range such as EA are likely to play animportant part in this development. However, deep phenotypingof large patient samples will be necessary to link GWAS resultsfrom complex outcomes such as EA and SZ to specific biologicaldisease subgroups.
MethodsGWAS. The principal investigators of all cohorts obtained informed consent fromall study participants and approval from Institutional Review Boards (IRB) at theirrespective institution. We obtained GWAS summary statistics on EA from theSSGAC. The results are based on Okbay et al.8, including the UK Biobank. ThePGC shared GWAS summary statistics on SZ with us that were reported in Ripkeet al.5, but excluded data from our replication sample (GRAS), yielding a totalsample size of n= 34,409 cases and n= 45,670 controls.
All cohorts that were part of both studies5,8 were excluded from the meta-analysis on EA, yielding non-overlapping GWAS samples and nEA= 363,502. Theoriginal EA results file contained 12,299,530 genetic markers, compared to17,221,718 in the SZ results file.
We applied the following additional quality control steps:
1. To maximize statistical power, we excluded SNPs that were missing in largeparts of the two samples. Specifically, we continued with SNPs that wereavailable in at least 19 out of 50 cohorts in the SZ results5 (the actual N perSNP was not provided in the SZ GWAS summary statistics) and in N >200,000 in the EA meta-analysis8. This step excluded 3,778,914 and 6,369,138genetic markers for EA and SZ, respectively.
2. We dropped SNPs that were not available in both GWAS results files. Thisstep restricted our analyses to the set of available genetic markers that passedthe quality-control filters in both the EA and the SZ GWAS results, leaving uswith 8,403,560 autosomal SNPs.
3. We dropped six SNPs with non-standard alleles (i.e. not A, C, T or G) andtwo SNPs with mismatched effective alleles. Furthermore, we dropped 163,272SNPs in the first and the 99th percentile of the distribution of differences inMAF in the two results files. This final step eliminated SNPs that were likely tobe affected by coding errors, strand flips or substantial differences in MAF inthe EA and SZ samples.
The remaining 8,240,280 autosomal SNPs were used in the proxy-phenotypeand prediction analyses.
Proxy-phenotype method. Look-up: We conducted our proxy-phenotype analysesfollowing a pre-registered analysis plan (https://osf.io/dnhfk/), using the 8,240,280autosomal SNPs that passed quality control. We selected 10−5 as the default Pvalue threshold to identify EA-associated SNPs prior to carrying out the proxy-phenotype analyses (Supplementary Note 2).
To select approximately independent SNPs from the EA GWAS results, weapplied the clumping procedure in PLINK version 1.944,45 using r2 > 0.1 and1,000,000 kb as the clumping parameters and the 1000 Genomes phase 1 version 3European reference panel46 to estimate LD among SNPs. This algorithm assignsthe SNP with the smallest P value as the lead SNP in its ‘clump’. All SNPs in thevicinity of 1,000,000 kb around the lead SNP that are correlated with it at r2 > 0.1are assigned to this clump. The next clump is formed around the SNP with the nextsmallest P value, consisting of SNPs that have not been already assigned to the firstclump. This process is iterated until no SNPs remain with P < 10−5, leading to 506approximately independent EA-associated lead SNPs. 108 of the 506 EA-associatedlead SNPs are genome-wide significant (P < 5 × 10⁻⁸).
We looked up the SZ GWAS results for these 506 EA-associated lead SNPs.Results for all 506 SNPs are reported in Supplementary Data 2 and Fig. 2.
In order to investigate the novelty of the findings, we extracted all the SNPs inLD with these 21 SNPs at r2 ≥ 0.1 with a maximum distance of 1000 kb using the1000 Genomes phase 1 European reference panel.
Bayesian credibility of results: We probed the credibility of our proxy-phenotype association results using a heuristic Bayesian calculation followingRietveld et al. (Supplementary Information pp. 13–15)25. We focus on the 21 EA-associated lead SNPs that are also associated with SZ after Bonferroni correction.
Educational attainment
Schizophrenia (SZ)
1.0***
**
*
**
***
*rg
0.8
0.6
0.4
0.2
0.0
–0.2
–0.4
–0.6
–0.8
–1.0
GWIS schizophrenia(min BIP)
Bipolar disorder (BIP)
GWIS bipolar disorder(min SZ)
Childhood IQ
Neuroticism
Educa
tiona
l atta
inmen
t
Schizo
phre
nia (S
Z)
GWIS
schiz
ophr
enia (m
in BIP
)
Bipolar
diso
rder
(BIP
)
GWIS
bipo
lar d
isord
er (min
SZ)
Childh
ood
IQ
Neuro
ticism
Fig. 3 Genetic correlations of GWAS and GWIS results. Notes: Theheatmap displays the genetic correlations across seven sets of GWAS orGWIS summary statistics. Genetic correlations were estimated with LDscore regression 42. The colour scale represents the genetic correlationsranging from –1 (red) to 1 (blue). Asterisks denote significant geneticcorrelations at P value < 0.01
ARTICLE NATURE COMMUNICATIONS | DOI: 10.1038/s41467-018-05510-z
8 NATURE COMMUNICATIONS | (2018) 9:3078 | DOI: 10.1038/s41467-018-05510-z | www.nature.com/naturecommunications

Bayes’ rule implies that the probability that an association is true given that weobserve significance is given by
P H1jt>tα=2� �
¼ P t>tα=2 jH1ð ÞP H1ð ÞP t>tα=2 jH1ð ÞP H1ð ÞþP t>tα=2 jH0ð ÞP H0ð Þ
¼ ðpowerÞðπÞpowerð Þ πð ÞþðαÞð1�πÞ
‘Power’, as well as the significance test, are two-sided, π is the prior belief thatthe SNP is truly associated and α is the significance threshold used for testing (inour case, α= 0:05
506 = 9.88 × 10⁻⁵).To calculate power for each SNP, we computed the winner’s curse corrected OR
using the procedure described in Rietveld et al. (Supplementary Information pp. 7–13)47 for the α threshold of 9.88 × 10⁻⁵. Because the actual sample size per SNP isnot reported in the SZ GWAS summary statistics, we furthermore assumed thateach SNP was available in the entire sample of 34,409 cases and 45,670 controls (i.e.the PGC results from Ripke et al.5 excluding the GRAS data collection).
An important question is which prior beliefs are reasonable starting points forthese Bayesian calculations. For an arbitrarily chosen SNP, the most conservativereasonable prior would assume that each truly associated SNP has the same effectsize as the strongest effect size that was actually observed in the data. If one dividesthe SNP-based heritability of the trait by that effect size in R2 units, one obtains alower bound for the number of SNPs that can be assumed to be truly associated. Toaid this line of thinking, we converted the winner’s curse corrected OR of our 21SNPs into R2 using
R2 ¼ dffiffiffiffiffiffiffiffiffiffiffiffiffid2 þ a
p� �2
where d is Cohen’s d, which is calculated as
d ¼ lnðOddsÞffiffiffi3
p
π
and a is a correction factor that adjusts for the MAF of the SNP. This correctionfactor is calculated as
a ¼ n1 þ n2ð Þ2n1n2
where n1=N ×MAF and n2=N × (1−MAF)48.The largest effect size in R2 that we observe in our results is rs4378243 with
0.044%. The SNP-based heritability of SZ is ≈21%49. Thus, if all causal SZ SNPswould have an effect of R2= 0.044%, we would expect that ≈500 truly causal lociexist. The chance of finding any one of them by chance from a set of ≈500,000independent loci in the human genome is ≈0.1%. (Our pruning algorithm of SNPsthat passed QC leads to only 223,065 independent loci. Thus, assuming 500,000independent loci in these calculations is conservative.) However, in reality mosttruly associated loci for SZ will surely have smaller effects than that. Thus, a priorbelief of ≈0.1% is certainly too conservative.
Furthermore, the SNPs we investigate are not arbitrary but selected based ontheir association with another, genetically related cognitive trait (EA) in a verylarge, independent sample. Thus, a prior belief of 1 or 5% that these SNPs are alsoassociated with SZ is probably more reasonable. As an upper bound, we assumethat 10% of all loci are causal. Thus, the chance to pick any one of them by chancewould be 10%.
Table 1 displays the winner’s curse corrected effect size of the 21 EA-associatedlead SNPs that are also associated with SZ after Bonferroni correction. It also showsthe posterior probability that these SNPs are truly associated with SZ given ourresults for prior beliefs ranging from 0.1, 1, 5 to 10%. Thirteen of these SNPs haveposterior probabilities of being true positives of >50% for even the mostconservative prior. For a more realistic prior belief of 5%, all 21 SNPs are likely oralmost certain to be true positives.
Sign concordance: We compared the signs of the beta coefficients of the 506 EAlead SNPs (PEA < 10−5) with the beta coefficients for SZ. If the signs were aligned,we assigned a ‘1’ to the SNP and ‘0’ otherwise. By chance, sign concordance isexpected to be 50%. We tested if the observed sign concordance is different from50% using the binomial probability test50. 263 of the 506 SNPs have the same sign(52%, P= 0.40, two-sided).
Sign concordance is 58% (P= 0.10, two-sided) in the set of 132 EA lead SNPsthat are also nominally significant for SZ (PEA < 1 × 10⁻⁵ and PSZ < 0.05).
Finally, for the 21 SNPs that passed Bonferroni correction for SZ (PEA < 1 ×10⁻⁵ and PSZ < 9.88 × 10⁻⁵), sign concordance is 62% (P= 0.38, twosided).
Raw enrichment factor (not corrected for LD score of SNPs): Because EA andSZ are highly polygenic, we tested for enrichment by taking the actual distributionof P values in the GWAS result files into account.
Due to the polygenic architecture of both traits, it is expected to find some EA-associated SNPs that are also associated with SZ just by chance even if both traitsare genetically independent. Under this null hypothesis, the expected number of
EA-associated lead SNPs that are also significantly associated with SZ is
EH0NS;EA!SZ
h i¼ NT;EA ´ τPEA ´ τPSZ
where NT,EA is the total number of independent lead SNPs in the EA GWASresults, and τPEA and τPSZ are the shares of SNPs in NT,EA that have P values for EAand SZ below a certain threshold, respectively.
We define the raw enrichment factor as
NS;EA!SZ=E NS;EA!SZ
h i
where NS,EA→SZ is the observed independent number of SNPs that pass both the Pvalue thresholds PEA and PSZ.
We obtained NT,EA by applying the clumping procedure described above (PPM)without a P value threshold for EA, leading to 222,289 independent EA lead SNPsin our merged GWAS results file. For PEA < 10−5, we found 506 SNP (τPEA =
506222;289
= 0.2276%).The Bonferroni threshold for testing 506 independent hypothesis is PSZ < 0:05
506 =9.88 × 10⁻⁵. There are 341 independent SNPs in the SZ results that pass thisthreshold, thus τPSZ =
341222;289= 0.1534%. Therefore, we expect [NS,EA→SZ]=
222,289 × 0.2276% × 0.1534%= 0.776 (i.e. less than one) SNP to be jointlyassociated with both traits under the hull hypothesis of no genetic overlap. At theseP value thresholds, we actually observe NS,EA→SZ= 21 SNPs, implying a rawenrichment factor of 21
0:776= 27.For PSZ < 0.05, we found 17,935 SNP (τPSZ =
17;935222;289= 8.068%). Thus, [NS,EA→SZ]
= 222,289 × 0.2276% × 8.068%= 41. At this more liberal P value threshold, weactually observe NS,EA→SZ= 132 SNPs, implying a raw enrichment factor of 132
41 =3.23.
Raw enrichment P value (not corrected for LD score of SNPs): Following Okbayet al.26, we performed a non-parametric test of joint enrichment that probeswhether the EA lead SNPs are more strongly associated with SZ than randomlychosen sets of SNPs with MAF within one percentage point of the lead SNP. Toperform our test, we randomly drew ten matched SNPs for each of the 506 EA leadSNPs with PEA < 10−5.
We then ranked the 506 × 10 randomly matched SNPs and the original 506 leadEA SNPs by P value and conducted a Mann–Whitney test51 of the null hypothesisthat the P value distribution of the 506 EA lead SNPs are drawn from the samedistribution as the 506 × 10 randomly matched SNPs. We reject the null hypothesiswith P= 6.872 × 10⁻¹⁰ (Z= 6.169, two-sided). As a negative control test, we alsocalculated the raw enrichment P value of the first randomly drawn, MAF-matchedset of SNPs against the remaining nine sets, yielding P = 0.17.
Repeating this raw enrichment test for the subset of 21 EA-associated SNPs thatremained significantly associated with SZ after Bonferroni correction (thresholdPSZ < 0:05
506 = 9.88 × 10⁻⁵) yields P= 5.44 × 10⁻¹⁴ (Z= 7.521, two-sided). Thenegative control test based on the raw enrichment P value of the first randomlydrawn, MAF-matched set of SNPs against the remaining nine sets yields P= 0.34.
GWAS catalogue look-up. In order to investigate the novelty of the 21 SNPassociations that were found significant for SZ after Bonferroni correction, reportedin Table 1, we performed a look-up in the GWAS catalogue52 (revision 2016-08-25,downloaded on 2016-08-29, https://www.ebi.ac.uk/gwas/api/search/downloads/full) with the SNPs and all their ‘LD partners’ (i.e. all SNPs with an r2 > 0.5 within a250 kb window). The LD partners were extracted with PLINK44 using a version ofthe 1000G reference panel specifically harmonized to combine 1000G phase 1 andphase 3 imputed data53, and the reference panel has been described previously26.The result of the GWAS catalogue look-up is reported in Supplementary Data 3.
Prediction of future GWAS loci for SZ. To identify LD partners and to clump ourGWAS results, we used a threshold of r2 > 0.1 and a 1,000,000 kb window in the1000 Genomes phase 1 version 3 European reference panel. Our SZ summarystatistics contained 51,721 approximately independent SNPs with PSZ < 0.05. Weidentified 21,430 SNPs in LD with the 50 novel SNPs reported in ref.28 and 54,425SNPs in LD with the 128 genome-wide significant loci that were previouslyreported5. We removed SNPs in LD with the previously GWAS hits from ouranalyses because those SNPs could (by definition) not be identified as novel. Theremaining set of 51,528 approximately independent SNPs with PSZ < 0.05 in our SZGWAS results contained one proxy for each of the 50 novel SNPs in ref.28. Afterremoving SNPs in LD with previous GWAS hits, 110 SNPs with PSZ < 0.05 alsoexhibited PEA < 10−5 in the independent EA GWAS sample. Of those 110 SNPs, sixwere identified as novel SZ loci in the most recent GWAS dataset expansion28.Using Fisher’s exact test, we rejected the null hypothesis that the proportion ofnovel SNPs (6/110 vs 50/51528) is equal in the two sets (P= 2.4 × 10⁻⁹, two-sided).Furthermore, as a robustness check, we performed the analysis again by excludingthe SNPs with MAF ≤ 0.1 and found similar results (P= 1.2 × 10⁻⁶). Thus, weconclude that conditioning GWAS results on SZ with independent GWAS evidenceon EA significantly outperforms pure chance in predicting GWAS results on SZfrom even larger samples.
NATURE COMMUNICATIONS | DOI: 10.1038/s41467-018-05510-z ARTICLE
NATURE COMMUNICATIONS | (2018) 9:3078 | DOI: 10.1038/s41467-018-05510-z | www.nature.com/naturecommunications 9

Pleiotropy between EA and SZ. To explore if the loci identified by our PPM mayhave direct pleiotropic effects on EA and SZ, we applied genetic fine mapping usingfull GWAS results for both traits. Our procedure was as follows:
First, the SZ and EA GWAS results were merged into a single file and alignedsuch that the reference allele is identical. Ambiguous SNPs or SNPs which may besubject to strands flips were removed. Second, all SNPs within 500 kb upstream anddownstream of the 21 significant lead SNPs from the PPM analyses were extracted.The pairwise LD between all SNPs in each window was computed. We then ranPAINTOR 3.030 which estimates the posterior probability of any SNP within alocus to be causal. We applied this procedure for EA and SZ. We then selected a90% credibility set for EA and SZ, which reflects the broadest possible set of SNPswhose posterior probability covers 90% of the total posterior probability at thatlocus. We predetermined the maximum number of true causal loci to be 2. For theEA 90% credibility set, we then determined the posterior probability that this setcontains the causal locus for SZ and vice versa. As the size of this set fluctuatesbetween <1% of the locus size to ~30% of the total locus size (i.e. a more narrow setcan be identified for some loci compared to others), we also computed 80, 65 and50% credibility sets for EA and SZ (Supplementary Note 3 and SupplementaryData 4), which all have increasingly narrower sets of SNPs (the 50% credibility setis the narrowest set we investigated). Finally, we compute the ratio of the cross traitcredibility for the 90% sets and the proportion of SNPs in the locus, which reflectsthe enrichment of signal over the baseline where each SNP is equally credible. Weclassify the probability of a locus being pleiotropic as low, medium, or high if theposterior probability of both the EA set on SZ and the SZ set on EA are <15, 15–45or >45% respectively.
Biological annotations. To gain insights into possible biological pathways that areindicated by the PPM results, we applied DEPICT8,54 using a false discovery ratethreshold of ≤0.05. DEPICT is a data-driven integrative method that uses recon-stituted gene sets based on massive numbers of experiments measuring geneexpression to (1) prioritize genes and gene sets and (2) identify tissues and celltypes wereprioritised genes are highly expressed. The input for our analyses(DEPICT version 1 release 194) were the 132 EA lead SNPs that are also nominallyassociated with SZ.
For these 132 EA lead SNPs, we also used DEPICT to determine the enrichmentof expression in particular tissues and cell types by testing whether the genesoverlapping the GWAS loci are highly expressed in any of 209 Medical SubjectHeading (MeSH) annotations.
To identify independent biological groupings, we computed the pairwisePearson correlations of all significant gene sets using the ‘network_plot.py’ scriptprovided with DEPICT. Next, we used the Affinity Propagation method on thePearson distance matrix for clustering55. The Affinity Propagation methodautomatically chooses an exemplar for each cluster.
Furthermore, we prioritize genes using DEPICT. Any particular locus centredon a SNP may contain multiple genes. One straightforward approach is tonominate a gene that is closest to the SNP. But this approach does not consider ifthe expression of the gene is likely to be altered or regulated by the causal site in thelocus. Therefore, we used DEPICT to map genes to associated loci, which prioritizeimportant genes that share similar annotations in bioinformatic databases.
Significant reconstituted gene sets, tissues, cell types and prioritized genesidentified by DEPICT are described in Supplementary Note 4.
LD-aware enrichment of PPM results across different traits. For SNP i in traitj, the expected χ2 statistic can be calculated as
E Z2ij
h i¼ Nj ´ h
2j ´ LDscorei=M
� �þ ð1þ NaÞj
where N is the sample size of the target trait j, h2 is the heritability of trait j,LDscorei=
PMk¼1
r2ik for SNP i is calculated using HapMap3 SNPs from European-ancestry,M is the number of SNPs included in the calculation of the LD score (n=1,173,569 SNPs), r2jk is the squared correlation between SNPs j and k in theHapMap3 reference panel and 1+Na is the LD score regression intercept for traitj.
To determine whether a particular realization is significantly larger thanexpected (and thus the ratio χ2observed/χ2expected is significantly greater than one), wetest each particular observed Z statistic (the square root of the χ2) for SNP j againsta normal distribution with variance: (Nj × h2j × LDscorei/M)+ (1+Na)j.
We used precomputed LD scores available from the LDSC software38. Asrecommended by Bulik-Sullivan et al.38, we restricted our analysis to HapMap3SNPs (using the merge-alleles flag) because these seem to be well-imputed in moststudies. Out of 132 SNPs with PEA < 1 × 10⁻⁵and PSZ < 0.05, only 30 SNPs aredirectly present in HapMap3 SNP list (Supplementary Data 9). Therefore, weextracted proxy SNPs with r2 > 0.8 and a maximum distance of 500 kb to ourmissing EA lead SNPs and chose the one with the highest r2 as a proxy. After thisstep, we could include 105 (out of 132) SNPs in our analyses. For each of these 105SNPs, we observed the Z-statistics in the publicly available GWAS results of thetraits. Z-statistics were converted into χ2 statistics by squaring them. The LD scorecorrected enrichment per SNP for each trait is the ratio of the observed to theexpected χ2.
Furthermore, since the SNPs considered for enrichment are independent, wecan use Fisher’s method to combine the enrichment P values per SNP into a singleP value per trait. The latter P value reflects excess enrichment for the set of SNPsbeyond what is expected if these SNPs are part of the infinitesimal geneticcontribution to the trait in question.
The results are shown in Supplementary Fig. 5 (and in Supplementary Data 10).Our LD-aware enrichment test has two limitations. First, LD score regression
assumes that allele frequency (AF) does not correlate with effect size, anassumption which has been empirically shown to be violated for low-frequencyalleles56. Second, our test assumes the absence of selection on the trait. Variation inAF and the degree of negative selection could explain excess signal in low LDSNPs57. However, our raw enrichment P value is robust to this because it takes theAF of the candidate SNPs explicitly into account.
Replication of PPM results in the GRAS data collection. The GRAS data col-lection complies with the Helsinki Declaration and were approved by the EthicsCommittees of the Universities of Göttingen and Greifswald, Germany or of col-laborating centres. All subjects and/or their authorized legal representatives gavewritten informed consent.
We showed in our pre-registered analysis plan that our replication sample(GRAS) is not large enough to replicate individual SNPs (https://osf.io/dnhfk/).Instead, we decided at the outset to attempt replication of the proxy-phenotypeanalysis results using a PGS that consists of the >80 most strongly associated,independent SNPs. The set that best meets this criterion are the 132 independentEA lead SNPs that are also nominally associated with SZ (PSZ < 0.05). PGS for thisset of 132 candidate SNPs were constructed using either the β coefficient estimatesof the EA or the SZ GWAS meta-analysis, resulting in two different scores (namedEA_132 and SZ_132).
In addition, we also constructed PGS for EA, SZ, BIP and neuroticism in theGRAS data collection using all available SNPs as control variables for multivariateprediction analyses (named EA_all, SZ_all, BIP_all and Neuro_all). Technicaldetails are described below.
Polygenic score calculations in the GRAS data collection. PGS were calculatedusing PLINK version 1.944,45. We calculated eight different scores, which aredescribed below. Supplementary Fig. 6 shows the distribution of the MAFs of allSNPs that were included in these PGS.
SZ scores: We received the GWAS summary statistics for SZ from the PGCexcluding the data from our replication sample (GRAS). We constructed a PGSusing the 132 EA lead SNPs (PEA < 10−5) that are also nominally associated withSZ (PSZ < 0.05). This score (SZ_132) is used for replication of the proxy-phenotypeanalyses.
Furthermore, we constructed a PGS using all 8,240,280 SNPs that survivedquality control (SZ_all). Next, we applied the clumping procedure using r² > 0.1and 1000 kb as the clumping parameters and the 1000 Genomes phase 1 version 3European reference panel to estimate LD among SNPs, eventually leaving a set of349,357 SNPs ready for profile scoring. The vast majority of the SNPs we includedin the SZ PGS (79%) have MAF > 1% and MAF < 99% (Supplementary Fig. 6).
For secondary analyses on the prediction of SZ symptoms, we constructed twoPGS using the 349,357 SNPs that have concordant (+ and +; or – and –) ordiscordant signs (+ and –; or – and +) for EA and SZ, respectively. This resulted in174,734 and 174,623 independent SNPs with concordant or discordant,respectively. We used these approximately independent SNPs for profile scoringand call the resulting PGS Concordant and Discordant. We note that this approachof constructing the Concordant and Discordant scores is based on a veryconservative LD-pruning algorithm because we first LD-pruned all SNPs thatsurvived quality control for both phenotypes and then sort them based on signconcordance. Thus, this approach prunes for LD both within and across theConcordant and Discordant scores.
As an alternative, we also used a less conservative approach that only prunes forLD within scores. Specifically, this alternative approach first sorts all SNPs that passquality control for both phenotypes (8,240,280 SNPs) based on sign concordance(4,147,926 SNPs with concordant and 4,092,354 SNPs with discordant signs) andthen LD-prunes the resulting set, yielding 260,441 and 261,062 independent SNPswith concordant or discordant, respectively. We call the PGS resulting from thisapproach Concordant_more_SNPs and Discordant_more_SNPs.
To enable tests for the sensitivity of our results to the MAF distribution of SNPsincluded in our scores, we also constructed PGS using SNPs with MAF > 1% (i.e.dropping SNPs with allele frequency ≤0.01 or ≥0.99) and with MAF > 10% (i.e.dropping SNPs with allele frequency ≤0.10 or ≥0.90), respectively, from the8,240,280 SNPs that survived quality control. Next, we used r2 > 0.1 and 1000 kb asthe clumping parameters and the 1000 Genomes phase 1 version 3 Europeanreference panel to estimate LD among SNPs, eventually leaving a set of 302,150approximately independent lead-SNPs with MAF > 1% and 108,075 SNPs withMAF > 10% ready for profile scoring. The resulting scores are called SZ_all_1% andSZ_all_10%, respectively. We also constructed PGS from this set of SNPs that tookthe sign concordance between EA and SZ into account and call these PGSConcordant_1% (151,265 SNPs), Discordant_1% (150,885 SNPs) andConcordant_10% (54,287 SNPs), Discordant_10% (53,788 SNPs), respectively.
ARTICLE NATURE COMMUNICATIONS | DOI: 10.1038/s41467-018-05510-z
10 NATURE COMMUNICATIONS | (2018) 9:3078 | DOI: 10.1038/s41467-018-05510-z | www.nature.com/naturecommunications

All scores were calculated using the –score function in PLINK using the naturallog of the OR of the SNPs for SZ as effect sizes.
Educational attainment scores: Beta coefficients for the EA GWAS were
approximated using bβj = zjffiffiffiffiffiffiffiffiffiffiffiffiffiffiffiffiffiffiffiffiffiffiffiffiffiffiffiffiffiffiffiffiffiNj�2�MAFj�ð1�MAFjÞ
p , see Rietveld et al.47 for the derivation.
Using these betas, we constructed a PGS using the 132 EA lead SNPs (PEA < 1 × 10⁻⁵) that are also nominally associated with SZ (PSZ < 0.05). The resulting score iscalled EA_132.
Furthermore, we constructed a PGS using all 8,240,280 SNPs that survivedquality control. Next, we applied the clumping procedure using r2 > 0.1 and 1000kb as the clumping parameters and the 1000 Genomes phase 1 version 3 Europeanreference panel to estimate LD among SNPs, eventually leaving a set of 348,429SNPs ready for profile scoring (Supplementary Fig. 6). The resulting score is calledEA_all. Eighty percent of the SNPs we included in the EA PGS have MAF > 1% &MAF < 99% (Supplementary Fig. 6).
We also constructed PGS using SNPs with MAF > 1% i.e. dropping SNPs withallele frequency ≤0.01 or ≥0.99) and with MAF > 10% (i.e. dropping SNPs withallele frequency ≤0.10 or ≥0.90), respectively, from the 8,240,280 SNPs that survivedquality control. Next, we used r2 > 0.1 and 1000 kb as the clumping parameters andthe 1000 Genomes phase 1 version 3 European reference panel to estimate LDamong SNPs, eventually leaving a set of 306,977 approximately independent lead-SNPs with MAF > 1% and 106,607 SNPs with MAF > 10% ready for profile scoring.The resulting scores are called EA_all_1% and EA_all_10%, respectively.
BIP score: We obtained GWAS summary statistics on BIP from the PGC58. Weused the LD-pruned GWAS summary from PGC (‘pgc.bip.clump.2012–04.txt’)with a set of 108,834 LD-pruned SNPs ready for profile scoring. PGS for the GRASdata collection were calculated by the application of the –score function in PLINKusing the natural log of the OR. The resulting score is called BIP_all.
Neuroticism score: We obtained GWAS summary statistics on Neuroticismfrom the SSGAC. The results are based on the analyses reported in Okbay et al.26
containing 6,524,432 variants. We applied the clumping procedure using r2 > 0.1and 1000 kb as the clumping parameters and the 1000 Genomes phase 1 version 3European reference panel to estimate LD among SNPs, eventually leaving a set of232,483 SNPs ready for profile scoring (Supplementary Fig. 6). PGS for the GRASdata collection were calculated by the application of –score function in PLINK usingthe Neuroticism beta values. The resulting score is called Neuro_all.
Note that our replication sample (GRAS) was not included in the GWASsummary statistics of any of these traits.
Polygenic score correlations: We calculated Pearson correlations between allPGS that we constructed in the GRAS data collection (SZ_all, SZ_132, EA_all,EA_132, Concordant, Discordant, BIP_all and Neuro_all). Results for SZ patientsand healthy controls together are reported in Supplementary Data 12a. We foundvery similar results among the SZ cases (Supplementary Data 12b) and healthycontrols when we analysed them separately from each other (SupplementaryData 12c). These results were used to inform the correct multiple regression modelspecification for the polygenic prediction analyses (Supplementary Note 6 and 8).
GWIS. A GWIS infers genome-wide summary statistics for a (non-linear) functionof phenotypes for which GWAS summary statistics are available41. Here, in par-ticular, we wish to infer for each SNP the effect on SZ, conditioned upon its effecton BIP. One possible approximation involves a GWIS of the following linearregression function:
SZ ¼ β � BIPþ e
where the parameter β is estimated from the genetic covariance between SZ and
BIP and the genetic variance in BIP as β=covg SZ;BIPð Þvarg ðBIPÞ . The residual (e) is actually
our trait of intrest, for which we use the term SZ(min BIP). Using GWIS we infer thegenome-wide summary statistics for SZ(min BIP) given the most recent PGC GWASresults for SZ (omitting the GRAS data collection)5 and BIP59. The effect size withrespect to SZ(min BIP) for a single SNP is computed as:
eff sz � β � effBIP ¼ eff e
The standard error for each SNP effect is approximated using the delta methodand accounts for the possible effect of sample overlap between the SZ and BIPGWAS.
As data input, we used the GWAS results on SZ (excluding the GRAS datacollection). GWAS results for BIP59 (6990 cases; 4820 controls) were obtained fromthe website of the PGC (https://www.med.unc.edu/pgc/files/resultfiles/pgc.cross.bip.zip).
Using the same method and data, we also ‘purged’ the genetic associationresults for BIP of their overlap with SZ, obtaining ‘unique’ BIP(min SZ) results.
Code availability. Source code for GWIS and LD-aware enrichment analyses areavailable at https://github.com/MichelNivard/EA_SZ.
Data availability. The GWAS summary statistics that support the findings of thisstudy are available on the website of the SSGAC: http://www.thessgac.org/#!data/
kuzq8. The GRAS data collection is not publicly available due to data protectionlaws in Germany that strictly safeguard the privacy ofstudy participants. To requestaccess, contact the study’s principal investigator Prof. Dr. Hannelore Ehrenreich([email protected])
Received: 7 August 2017 Accepted: 9 July 2018
References1. Knapp, M., Mangalore, R. & Simon, J. The global costs of schizophrenia.
Schizophr. Bull. 30, 279–293 (2004).2. Sullivan, P. F., Kendler, K. S. & Neale, M. C. Schizophrenia as a complex trait.
Arch. Gen. Psychiatry 60, 1187 (2003).3. Polderman, T. J. C. et al. Meta-analysis of the heritability of human
traits based on fifty years of twin studies. Nat. Genet. 47, 702–709 (2015).4. Stepniak, B. et al. Accumulated environmental risk determining age at
schizophrenia onset: a deep phenotyping-based study. Lancet Psychiatry 1,444–453 (2014).
5. Ripke, S. et al. Biological insights from 108 schizophrenia-associated geneticloci. Nature 511, 421–427 (2014).
6. Bhatia, G. et al. Haplotypes of common SNPs can explain missing heritabilityof complex disease. https://doi.org/10.1101/022418 (2015).
7. Ehrenreich, H. et al. OTTO: a new strategy to extract mental disease-relevantcombinations of GWAS hits from individuals. Mol. Psychiatry 23, 476–486(2018).
8. Okbay, A. et al. Genome-wide association study identifies 74 loci associatedwith educational attainment. Nature 533, 539–542 (2016).
9. Swanson, C. L., Gur, R. C., Bilker, W., Petty, R. G. & Gur, R. E. Premorbideducational attainment in schizophrenia: association with symptoms, functioning,and neurobehavioral measures. Biol. Psychiatry 44, 739–747 (1998).
10. Kahn, R. S. & Keefe, R. S. E. Schizophrenia is a cognitive illness. JAMAPsychiatry 70, 1107 (2013).
11. Kraepelin, E. Clinical Psychiatry: A Text-Book for Students and Physician, 6thedition, translated and edited by A. R. Diefendorf (Macmillian, New York andLondon, 1902).
12. Trotta, A., Murray, R. & MacCabe, J. Do premorbid and post-onset cognitivefunctioning differ between schizophrenia and bipolar disorder? A systematicreview and meta-analysis. Psychol. Med. 45, 381–394 (2015).
13. Murray, R. M. et al. A developmental model for similarities and dissi milaritiesbetween schizophrenia and bipolar disorder. Schizophr. Res. 71, 405–416 (2004).
14. Murray, R. M., O’Callaghan, E., Castle, D. J. & Lewis, S. W. Aneurodevelopmental approach to the classification of schizophrenia.Schizophr. Bull. 18, 319–332 (1992).
15. Stefansson, H. et al. CNVs conferring risk of autism or schizophrenia affectcognition in controls. Nature 505, 361–366 (2013).
16. Power, R. A. et al. Polygenic risk scores for schizophrenia and bipolar disorderpredict creativity. Nat. Neurosci. 18, 953–955 (2015).
17. Kendler, K. S., Ohlsson, H., Sundquist, J. & Sundquist, K. IQ andschizophrenia in a Swedish National Sample: their causal relationshipand the interaction of IQ with genetic risk. Am. J. Psychiatry 172, 259–265(2015).
18. Sniekers, S. et al. Genome-wide association meta-analysis of 78,308 individualsidentifies new loci and genes influencing human intelligence. Nat. Genet. 49,1107–1112 (2017).
19. Camisa, K. M. et al. Personality traits in schizophrenia and related personalitydisorders. Psychiatry Res. 133, 23–33 (2005).
20. Beauchamp, M.-C., Lecomte, T., Lecomte, C., Leclerc, C. & Corbière, M. Dopeople with a first episode of psychosis differ in personality profiles?Schizophr. Res. 85, 162–167 (2006).
21. Bagby, R. M. et al. Bipolar disorder, unipolar depression and the five-factormodel of personality. J. Affect. Disord. 41, 25–32 (1996).
22. Ackerman, P. L. & Heggestad, E. D. Intelligence, personality, and interests:evidence for overlapping traits. Psychol. Bull. 121, 219–245 (1997).
23. Bartels, M. et al. The five factor model of personality and intelligence: a twinstudy on the relationship between the two constructs. Pers. Individ. Differ. 53,368–373 (2012).
24. Trampush, J. W. et al. GWAS meta-analysis reveals novel loci and geneticcorrelates for general cognitive function: a report from the COGENTconsortium. Mol. Psychiatry 22, 336–345 (2017).
25. Rietveld, C. A. et al. Common genetic variants associated with cognitiveperformance identified using the proxy-phenotype method. Proc. Natl Acad.Sci. USA 111, 13790–13794 (2014).
26. Okbay, A. et al. Genetic variants associated with subjective well-being,depressive symptoms, and neuroticism identified through genome-wideanalyses. Nat. Genet. 48, 624–633 (2016).
NATURE COMMUNICATIONS | DOI: 10.1038/s41467-018-05510-z ARTICLE
NATURE COMMUNICATIONS | (2018) 9:3078 | DOI: 10.1038/s41467-018-05510-z | www.nature.com/naturecommunications 11

27. Ribbe, K. et al. The cross-sectional GRAS sample: a comprehensivephenotypical data collection of schizophrenic patients. BMC Psychiatry 10, 91(2010).
28. Pardiñas, A. F. et al. Common schizophrenia alleles are enriched in mutation-intolerant genes and in regions under strong background selection. Nat.Genet. 50, 381–389 (2018).
29. Le Hellard, S. et al. Identification of gene loci that overlap between schizophreniaand educational attainment. Schizophr. Bull. 43, 654–664 (2017).
30. Kichaev, G. et al. Improved methods for multi-trait fine mapping ofpleiotropic risk loci. Bioinformatics 33, 248–255 (2017).
31. So, H.-C. et al. Identification of neuroglycan C and interacting partners aspotential susceptibility genes for schizophrenia in a Southern Chinesepopulation. Am. J. Med. Genet. Part B Neuropsychiatr. Genet. 153B, 103–113(2010).
32. Arion, D., Horváth, S., Lewis, D. A. & Mirnics, K. Infragranular geneexpression disturbances in the prefrontal cortex in schizophrenia: signature ofaltered neural development? Neurobiol. Dis. 37, 738–746 (2010).
33. Salih, D. A. M. et al. FoxO6 regulates memory consolidation and synapticfunction. Genes Dev. 26, 2780–2801 (2012).
34. Maiese, K. FoxO proteins in the nervous system. Anal. Cell Pathol. 2015, 1–15(2015).
35. Aruga, J., Yokota, N. & Mikoshiba, K. Human SLITRK family genes: genomicorganization and expression profiling in normal brain and brain tumor tissue.Gene 315, 87–94 (2003).
36. Beaubien, F. et al. Slitrk1 is localized to excitatory synapses and promotes theirdevelopment. Sci. Rep. 6, 27343 (2016).
37. Proenca, C. C. et al. Slitrks as emerging candidate genes involved inneuropsychiatric disorders. Trends Neurosci. 34, 143–153 (2011).
38. Bulik-Sullivan, B. K. et al. LD Score regression distinguishes confoundingfrom polygenicity in genome-wide association studies. Nat. Genet. 47,291–295 (2015).
39. Finucane, H. K. et al. Partitioning heritability by functional category usingGWAS summary statistics. Nat. Genet. 47, 1228–1235 (2015).
40. Browning, B. L. & Browning, S. R. A unified approach to genotype imputationand haplotype-phase inference for large data sets of trios and unrelatedindividuals. Am. J. Hum. Genet. 84, 210–223 (2008).
41. Nieuwboer, H. A., Pool, R., Dolan, C. V., Boomsma, D. I. & Nivard, M. G.GWIS: genome-wide inferred statistics for functions of multiple phenotypes.Am. J. Hum. Genet. 99, 917–927 (2016).
42. Bulik-Sullivan, B. K. et al. An atlas of genetic correlations across humandiseases and traits. Nat. Genet. 47, 1236–1241 (2015).
43. Grotzinger, A. D. et al. Genomic SEM provides insights into the multivariategenetic architecture of complex traits. bioRxiv, https://doi.org/10.1101/305029.
44. Purcell, S. et al. PLINK: a tool set for whole-genome association andpopulation-based linkage analyses. Am. J. Hum. Genet. 81, 559–575 (2007).
45. Chang, C. C. et al. Second-generation PLINK: rising to the challenge of largerand richer datasets. Gigascience 4, 7 (2015).
46. The 1000 Genomes Project Consortium. et al. An integrated map of geneticvariation from 1092 human genomes. Nature 491, 56–65 (2012).
47. Rietveld, C. A. et al. GWAS of 126,559 individuals identifies genetic variantsassociated with educational attainment. Science 340, 1467–1471 (2013).
48. Borenstein, M., Hedges, L. V., Higgins, J. P. T. & Rothstein, H. R. Introductionto Meta-Analysis 45–51 (John Wiley & Sons, Ltd., Chichester, 2009).
49. Lee, S. H. et al. Estimating the proportion of variation in susceptibility toschizophrenia captured by common SNPs. Nat. Genet. 44, 247–250 (2012).
50. Sheskin, D. Handbook of Parametric and Nonparametric Statistical Procedures289–311 (Taylor & Francis Group, New York et al., 2007).
51. Nachar, N. The Mann-Whitney U: a test for assessing whether twoindependent samples come from the same distribution. Quant. MethodsPsychol. 4, 13–20 (2008).
52. Welter, D. et al. The NHGRI GWAS catalog, a curated resource of SNP-traitassociations. Nucleic Acids Res. 42, D1001–D1006 (2014).
53. Auton, A. et al. A global reference for human genetic variation. Nature 526,68–74 (2015).
54. Pers, T. H. et al. Biological interpretation of genome-wide association studiesusing predicted gene functions. Nat. Commun. 6, 5890 (2015).
55. Frey, B. J. & Dueck, D. Clustering by passing messages between data points.Science 315, 972-976 (2007).
56. Yang, J. et al. Genetic variance estimation with imputed variants findsnegligible missing heritability for human height and body mass index. Nat.Genet. 47, 1114–1120 (2015).
57. Gazal, S. et al. Linkage disequilibrium dependent architecture of humancomplex traits reveals action of negative selection. Nat. Genet. 49, 1421–1427(2017).
58. Sklar, P. et al. Large-scale genome-wide association analysis of bipolardisorder identifies a new susceptibility locus near ODZ4. Nat. Genet. 43,977–983 (2011).
59. Cross-Disorder Group of the Psychiatric Genomics Consortium.Identification of risk loci with shared effects on five major psychiatricdisorders: a genome-wide analysis. Lancet 381, 1371–1379 (2013).
AcknowledgementsThis research was carried out under the auspices of the Social Science Genetic Asso-ciation Consortium (SSGAC), including use of the UK Biobank Resource (applicationreference number 11425). We thank all research consortia that provide access to GWASsummary statistics in the public domain. Specifically, we acknowledge data access fromthe Psychiatric Genomics Consortium (PGC), the Genetic Investigation of ANthropo-metric Traits Consortium (GIANT), the International Inflammatory Bowel DiseaseGenetics Consortium (IIBDGC), the International Genomics of Alzheimer’s Project(IGAP), the CARDIoGRAMplusC4D Consortium, the Reproductive Genetics Con-sortium (ReproGen), the Tobacco and Genetics Consortium (TAG), the Meta-Analysesof Glucose and Insulin-related traits Consortium (MAGIC), the ENIGMA Consortiumand the Childhood Intelligence Consortium (CHIC). We would like to thank the researchparticipants and employees of 23andMe for making this work possible as well as Joyce Y.Tung, Nicholas A. Furlotte and David A. Hinds from the 23andMe research team. Thisstudy was supported by funding from an ERC Consolidator Grant (647648 EdGe, PhilippD. Koellinger), the Max Planck Society, the Max Planck Förderstiftung, the DFG(CNMPB), EXTRABRAIN EU-FP7, the Niedersachsen-Research Network on Neu-roinfectiology (N-RENNT) and EU-AIMS. Michel G. Nivard was supported by a RoyalNetherlands Academy of Science Professor Award to Dorret I. Boomsma (PAH/6635).Additional acknowledgements are provided in the Supplementary Note 12.
Author contributionsP.D.K. designed and oversaw the study and conducted proxy-phenotype analyses. V.B.and M.M. carried out analyses in the GRAS sample. R.d.V., C.A.P.B., M.G.N. and P.D.K.developed statistical methods. V.B. conducted bioinformatics and computed the LD-aware enrichment tests. C.A.P.B. and R.d.V. conducted simulation analyses. M.G.N.computed GWIS results, genetic correlations and carried out pleiotropy analyses. R.K.L.assisted with biological annotation and visualization of results. P.D.K., V.B., M.M. and H.E. made especially major contributions to writing and editing. All authors contributed toand critically reviewed the manuscript.
Additional informationSupplementary Information accompanies this paper at https://doi.org/10.1038/s41467-018-05510-z.
Competing interests: The authors declare no competing interests.
Reprints and permission information is available online at http://npg.nature.com/reprintsandpermissions/
Publisher's note: Springer Nature remains neutral with regard to jurisdictional claims inpublished maps and institutional affiliations.
Open Access This article is licensed under a Creative CommonsAttribution 4.0 International License, which permits use, sharing,
adaptation, distribution and reproduction in any medium or format, as long as you giveappropriate credit to the original author(s) and the source, provide a link to the CreativeCommons license, and indicate if changes were made. The images or other third partymaterial in this article are included in the article’s Creative Commons license, unlessindicated otherwise in a credit line to the material. If material is not included in thearticle’s Creative Commons license and your intended use is not permitted by statutoryregulation or exceeds the permitted use, you will need to obtain permission directly fromthe copyright holder. To view a copy of this license, visit http://creativecommons.org/licenses/by/4.0/.
© The Author(s) 2018
ARTICLE NATURE COMMUNICATIONS | DOI: 10.1038/s41467-018-05510-z
12 NATURE COMMUNICATIONS | (2018) 9:3078 | DOI: 10.1038/s41467-018-05510-z | www.nature.com/naturecommunications