genome-wide epigenetic and proteomic analysis reveals ... wide epigenetic and... · genome-wide...
TRANSCRIPT
ORIGINAL RESEARCH
Genome-wide epigenetic and proteomic analysis revealsaltered Notch signaling in EPC dysfunctionJamie R. Karcher1,2, Brian R. Hoffmann1,2, Pengyuan Liu2,3, Yong Liu2, Mingyu Liang2 &Andrew S. Greene1,2
1 Biotechnology and Bioengineering Center, Medical College of Wisconsin, Milwaukee, Wisconsin
2 Department of Physiology, Medical College of Wisconsin, Milwaukee, Wisconsin
3 Cancer Center, Medical College of Wisconsin, Milwaukee, Wisconsin
Keywords
Angiogenesis, endothelial progenitor cells,
epigenetics, high-salt diet, Notch4.
Correspondence
Andrew S. Greene, Biotechnology and
Bioengineering Center, Medical College of
Wisconsin, 8701 Watertown Plank Road,
Milwaukee, WI 53226.
Tel: 414-955-8671
Fax: 414-955-6568
E-mail: [email protected]
Funding Information
This study was funded by National Institutes
of Health grant HL082798 which was
awarded to A.S. Greene, PhD and also
funded through a training grant: T32
HL007852 (PI: H.V. Forster) awarded to the
Department of Physiology at the Medical
College of Wisconsin.
Received: 18 December 2014; Revised: 27
February 2015; Accepted: 7 March 2015
doi: 10.14814/phy2.12358
Physiol Rep, 3 (4), 2015, e12358,
doi: 10.14814/phy2.12358
Abstract
Endothelial progenitor cells (EPCs) are bone-marrow-derived mononuclear
cells that participate in tube formation in vitro and vessel formation in vivo.
EPC transplantation, as a therapeutic approach in cardiovascular diseases, has
produced mixed results likely due to underlying disease states and environ-
mental factors affecting EPC function. In this study, we investigated the mech-
anisms by which a high-salt diet impairs EPC function. The number of
endothelial progenitor cells (CD34+, VEGFR2+, CD133+, and c-Kit+) was
decreased in the bone marrow of Sprague–Dawley (SD) rats fed a high-salt
diet (HSD; 4% NaCl) as compared to SD rats on a normal-salt diet (NSD;
0.4% NaCl). NSD EPCs augmented endothelial cell tube formation in vitro,
whereas HSD EPCs did not. NSD EPCs were a potent therapeutic restoring
electrical stimulation-induced angiogenesis in vivo. HSD EPCs were not able
to restore angiogenesis in vivo. EPC DNA methylation was analyzed by
reduced representative bisulfite sequencing and membrane proteins were ana-
lyzed using high accuracy liquid chromatography mass spectrometry. Differen-
tially methylated genes and differentially abundant membrane proteins
measured between the NSD and HSD EPCs, revealed a total of 886 gene-pro-
tein sets where reciprocal methylation and expression occurred. Based on
stringent criteria, Notch4 was found to be hypermethylated in HSD EPCs and
had corresponding decrease in protein expression. Suppression of Notch4 pro-
tein expression in EPCs using siRNA confirmed a role for Notch4 in EPC-
mediated angiogenesis, suggesting Notch4 suppression as a mechanism by
which high-salt diet inhibits EPC-mediated angiogenesis.
Introduction
Endothelial progenitor cells (EPCs) are bone-marrow-
derived cells that exhibit endothelial cell properties in vitro
and promote angiogenesis in vivo (Asahara et al. 1997).
EPCs make up approximately 1% of the total bone mar-
row mononuclear cell population (Asahara et al. 1997). A
wide variety of cellular markers and growth conditions
have been used to define the EPC population. In this
study, EPCs were defined as the population of cells that
adhere to fibronectin-coated plates and are positive for
CD34, VEGF receptor 2 (VEGFR2), c-Kit, and CD133
after 14 days in culture in EPC-specific media.
Experimental studies and some preclinical trials have
shown that autologous injection of EPCs during ischemic
tissue conditions can increase capillary density (Orlic
et al. 2001; Murphy et al. 2007). EPC treatment may
improve cardiac function in myocardial infarction models
ª 2015 The Authors. Physiological Reports published by Wiley Periodicals, Inc. on behalf of
the American Physiological Society and The Physiological Society.
This is an open access article under the terms of the Creative Commons Attribution License,
which permits use, distribution and reproduction in any medium, provided the original work is properly cited.
2015 | Vol. 3 | Iss. 4 | e12358Page 1
Physiological Reports ISSN 2051-817X
(Kawamoto et al. 2001), as well as in a model of hyper-
tensive heart failure (Parker and Greene 2011). EPC
transplantation also increased microvessel density and
decreased fibrosis in cardiac tissue in a salt-sensitive
hypertensive rat model, by increasing blood flow and an
improving diastolic function (Parker et al. 2012). Under
some experimental conditions EPCs can incorporate into
blood vessels (Yeh et al. 2003; Ziegelhoeffer et al. 2004;
O’Neill et al. 2005; Peters et al. 2005), however, it appears
that the rate of vascular incorporation is generally very
low.
Many of the benefits found with the EPC therapy in
experimental animals have not been replicated in human
clinical trials (Kuethe et al. 2004; Lunde et al. 2005). A
number of explanations for the varying results found in
human EPC trials have been offered, however, the most
likely explanation is that the source of EPCs in animal
studies were from healthy animals with experimentally
induced cardiovascular injury or disease, whereas in
human trials EPC transplants were autologous and poten-
tially dysfunctional.
Dysfunction of EPCs has now been demonstrated in
diseases including diabetes, atherosclerosis, stroke, and
hypertension (Vasa et al. 2001; Tepper et al. 2002; Loo-
mans et al. 2004a; Pistrosch et al. 2005). When isolated
from the blood of patients with congestive heart failure,
EPCs show impaired migration and neovascularization
capacity (Walter et al. 2005; Geft et al. 2008). Hyperten-
sion has also been correlated with decreased circulating
numbers of EPCs (Fadini et al. 2006; Pirro et al. 2007),
decreased migration of EPCs (Vasa et al. 2001; Imanishi
et al. 2005), and decreased survival of EPCs in the blood
(Imanishi et al. 2005). EPCs from hypertensive patients
also display increased senescence (Yao et al. 2008; Zhou
et al. 2008). The mechanisms underlying the EPC dys-
function are not clear. However, the impairment in EPC
proliferation, adhesion, and angiogenic properties may
underlie the failure of EPC transplants and understanding
the mechanisms involved in EPC dysfunction may
improve our understanding in cardiovascular disease
pathogenesis and vascular complications. Development of
new strategies to restore EPC function and consequently
increase EPC engraftment and/or mobilization may con-
siderably impact angiogenic stem cell-based therapy.
In this study, high-salt diet was tested as a model of
EPC dysfunction. We found that a high-salt diet (4%
NaCl, HSD) caused a decrease in the relative number of
EPCs in the bone marrow mononuclear cell (BM-MNC)
fraction but it did not alter cellular marker expression of
isolated and cultured EPCs. Unlike normal-salt diet (0.4%
NaCl, NSD) treated rats, HSD EPCs could not augment
in vitro tube formation when cocultured with endothelial
cells. In vivo transplantation of NSD EPCs caused a
robust therapeutic restoration of stimulated angiogenesis,
however, HSD EPCs did not. DNA methylation and pro-
teomic analysis of NSD and HSD EPCs showed numerous
gene-protein sets with altered methylation or expression.
Bioinformatic analysis revealed Notch4 as a lead candi-
date in EPC dysfunction that was confirmed by experi-
mental knockdown.
Methods and Materials
Animal care
Male Sprague–Dawley rats were purchased from Harlan
Laboratories (Indianapolis, IN) and were 7–9 weeks old
at the time of this study. The Medical College of Wiscon-
sin (MCW) Institutional Animal Care and Use Commit-
tee approved all animal protocols. Animals were housed
and cared for in the MCW Animal Resource Center and
were given food and water ad libitum.
Endothelial progenitor cell isolation fromthe bone marrow
Sprague–Dawley rats were placed on a normal-salt diet
(NSD, 0.4% NaCl Dyets) or a high-salt diet (HSD, 4%
NaCl Dyets) for 7 days. Following 7 days on either diet,
the rats were killed with Beuthanasia-D Special (Merck)
and both femurs and tibias were surgically dissected. The
bone marrow mononuclear cell population was isolated
as previously described (Kaczorowski et al. 2013; Karcher
and Greene 2014). The bone marrow mononuclear cells
were resuspended in endothelial cell basal medium-2
[EGM-2 (Lonza); MCDB131 media containing 10% heat-
inactivated FBS, vascular endothelial growth factor
(VEGF), human fibroblast growth factor-2, human epi-
dermal growth factor, insulin-like growth factor-1, ascor-
bic acid, gentamicin, and amphotericin-B]. To isolate
EPCs the bone marrow mononuclear cells were plated on
bovine fibronectin (Sigma, St. Louis, MO, F1141) coated
100 mm tissue culture dishes at a concentration of
1 9 107 cells/plate. The plates were incubated in 21% O2
and 5% CO2 at 37°C until the cells were approximately
70% confluent (14 days).
Immunocytochemistry and flow cytometry
Bone marrow mononuclear cells (BM-MNCs) or endothe-
lial progenitor cells were isolated and characterized using
fluorescently labeled antibodies. The number of CD34+/
VEGFR2+ cells were quantified in bone marrow mononu-
clear cells as previously described (Parker et al. 2012).
EPCs were labeled with CD34, c-Kit, CD133, and VEGR2
to validate known cellular makers. Briefly BM-MNCs or
2015 | Vol. 3 | Iss. 4 | e12358Page 2
ª 2015 The Authors. Physiological Reports published by Wiley Periodicals, Inc. on behalf of
the American Physiological Society and The Physiological Society.
Altered Notch Signaling in EPCs J. R. Karcher et al.
EPCs were fixed in 2% paraformaldehyde solution in
Dulbecco’s Phosphate-Buffered Saline (DPBS). The cells
were incubated in 90% methanol solution for 30 min and
blocked in 3% goat serum. The bone marrow mononu-
clear cells were incubated with monoclonal antibodies
against CD34 (Courtesy of Jan E. Schnitzer (Testa et al.
2009), Prism, San Diego, CA) followed by Alexa Fluor
633-conjugated secondary antibody (goat anti-mouse,
Invitrogen, Carlsbad, CA) and with a monoclonal antibody
against FLK-1 (Santa Cruz Biotechnology, Dallas, TX,
sc-315, VEGFR2) followed by Alexa Fluor 488-conjugated
secondary antibody (goat anti-rabbit, Invitrogen). EPCs
were incubated with monoclonal antibodies against CD34
(Courtesy of Jan E. Schnitzer (Testa et al. 2009), Prism,
San Diego, CA), monoclonal antibody against FLK-1
(Santa Cruz Biotechnology, sc-315, VEGFR2), polyclonal
antibody against CD133 (Abcam, Cambridge, UK,
ab19898) or the polyclonal antibody against c-kit (Santa
Cruz Biotechnology, sc-168) followed by Alexa488-
conjugated secondary antibody (goat anti-rabbit or goat
anti-mouse, Invitrogen). Cells exposed only to the second-
ary antibody served as controls. Each analysis included
10–50,000 events and was run on the LSRII Flow Cyto-
meter (Becton Dickinson, Franklin Lakes, NJ). Data were
analyzed using FlowJo software (TreeStar Inc. Ashland,
OR).
Matrigel tube formation assay
Four-well chamber slides were coated with 300 lL of
growth factor reduced Matrigel (BD Biosciences, San
Diego, CA) for 60 min at room temperature. Cultured
neonatal rat cardiac microvascular endothelial cells
(RMVEC, Cell Biologics) were rinsed with DPBS and lifted
with trypsin. Twenty thousand RMVECs were plated on
Matrigel-coated wells. EPCs from HSD or NSD donor SD
rats were rinsed five times with DPBS and lifted with tryp-
sin. Twenty thousand EPCs from each donor type were
added to wells with RMVECs and total volume was
brought to 1.0 mL. Cells were incubated together and two
409 magnification images of tube formation were
acquired and quantified following 24 h in culture. Pipeline
software (Prisco et al. 2014) was used to quantify the total
length of tubes and number of segments formed.
A second set of tube formation assays were performed
with EPC secretome, which is the conditioned media
removed from endothelial progenitor cells in culture.
After 14 days in culture EPCs were switched into fresh
MCDB131 with EGM-2 supplements and 10% FBS and
incubated at 37°C at either at normoxia (21% O2 and 5%
CO2) or hypoxia (2% O2 and 5% CO2). EPC secretome
was collected for 24 h and added to 20,000 RMVECs pla-
ted on Matrigel-coated slides. RMVECs exposed only to
fresh media (no secreted proteins) served as a control.
Following 24 h incubation, two 409 magnification images
were acquired and quantified with Pipeline software
(Prisco et al. 2014).
Electrical stimulator surgery and EPCtransplantation
Sprague–Dawley rats (7–9 weeks old) were placed on
high-salt diet (4% NaCl, Dyets) 1 week before the surgery
and the diet was continued for the duration of the proto-
col. The rats were divided into two groups: (1) received
endothelial progenitor cells from Sprague–Dawley rats on
a normal-salt diet, (2) received endothelial progenitor
cells from Sprague–Dawley rats on a high-salt diet. Two
days prior to cell injections, a battery-powered stimulator
was implanted, as described previously (Linderman et al.
2000). Briefly under aseptic conditions, a subcutaneous
incision was made over the thoracolumbar region and a
miniature battery-powered stimulator (Linderman et al.
2000) was implanted to stimulate the hind limb muscula-
ture and secured in place. Two days after the electrical
stimulator was implanted 6000 EPCs were injected intra-
venously into the tail vein, whereas the rats were under
isoflorane anesthesia. After a total of 7 days of stimula-
tion the rats were killed and the tibialis anterior muscle
was collected for analysis.
Analysis of vessel density
The vessel density of the harvested tibialis anterior (TA)
muscle from both hind limbs of electrically stimulated rats
was analyzed as previously described (Rieder et al. 1995;
Kaczorowski et al. 2013; Karcher and Greene 2014; Prisco
et al. 2014). Vessel density was expressed as the mean
number of vessel-grid intersections per microscope field.
RRBS library preparation and sequencing
Genomic DNA was isolated from EPCs derived from
NSD and HSD fed rats with PureLinkTM Genomic DNA
Mini Kit (Invitrogen), following the manufacturer’s rec-
ommendations. The genomic DNA was eluted in DNA
elution buffer (10 mmol/L Tris-HCl (pH 9.0), 0.1 mmol/
L EDTA) and the concentration was determined with a
Qubit fluorometer and dsDNA BR Assay Kit per the
manufacturer’s instructions. The RRBS library was com-
pleted using approximately 200 ng of DNA as previously
described (Gu et al. 2011; Boyle et al. 2012; Smallwood
and Kelsey 2012; Liu et al. 2014). Briefly, the DNA was
digested with MspI overnight at 37°C. End-repairing and
A-tailing of the MspI-digested DNA fragments was
prepared using polymerase-chain reaction (PCR). The end-
ª 2015 The Authors. Physiological Reports published by Wiley Periodicals, Inc. on behalf ofthe American Physiological Society and The Physiological Society.
2015 | Vol. 3 | Iss. 4 | e12358Page 3
J. R. Karcher et al. Altered Notch Signaling in EPCs
repaired and A-tailed DNA fragments were ethanol precipi-
tated for purification and were ligated to custom-designed
adapters by PCR (Liu et al. 2014). Bisulfite conversion of
size-selected DNA was performed using the QIAGEN Epi-
Tect kit follow the manufacturer’s protocol. The samples
were amplified by PCR to prepare for sequencing. An Ag-
ilent Bioanalyzer DNA 1000 chip was used to validate
and quantify the library. Samples were multiplexed six
per lane on a 300 Gb flowcell and paired-end sequenced
with an Illumina HiSeq 2000.
Sequence alignment and analysis
Sequence reads obtained from Illumina HiSeq 2000 were
analyzed by MethylCoder (Pedersen et al. 2011) using the
genomic short-read-nucleotide alignment program
(GSNAP) (Langmead et al. 2009; Wu and Nacu 2010).
Bisulfite conversion rates were estimated from the num-
ber of unconverted cytosines at Klenow filled 3’ MspI
sites of sequencing reads. The numbers of converted and
unconverted cytosines across the genome were extracted
from each RRBS library. For each region of DNA where a
cytosine occurred next to a guanine (CpG), the amount
of methylation on the 5’ position of the cytosine (5mC)
was taken as the percentage of unconverted cytosines. The
boundaries of CpG islands (CGIs) were downloaded from
the UCSC genome annotation database. An overall value
of 5mC per CGI was calculated by pooling data from all
the CpGs covered within each CGI. CpGs with fewer than
20 reads were excluded, and only CGIs with five represen-
tative CpGs or more were analyzed. To test for CGIs that
contained 5mC levels significantly above the bisulfite con-
version error in each RRBS library, a binomial test was
applied using a Benjamini–Hochberg corrected P-value
cutoff of 0.05. Fisher’s test was used to evaluate differ-
ences between groups.
Preparation of samples for massspectrometry
EPCs were collected from NSD and HSD fed rats. EPCs
derived from each rat were rinsed twice and scraped in
DPBS, pooled and pelleted at 3009g for 5 min at 4°C. Cellswere lysed mechanically twice in 4 mL of hypotonic lysis
buffer (1 mol/L Tris (pH 7.5) and 100 mmol/L MgCl2) by
30 passages with a cooled glass dounce. Lysate was centri-
fuged at 800 9g for 10 min at 4°C to pellet nuclei and large
organelles. The supernatant was transferred to a clean tube
and the pellet was rinsed with a membrane preparation buf-
fer (280 mmol/L sucrose, 50 mmol/L MES pH 6.5,
450 mmol/L NaCl, and 10 mmol/L MgCl2) for 10 min on
ice. Supernatants were centrifuged at 75,0009g at 4°C over-
night to pellet membranes. The pelleted membranes were
washed with 200 lL of fresh membrane wash buffer
(25 mmol/L NaCO3) and set in thermomixer at 4°C for
30 min. Membranes were spun in the ultracentrifuge at
75,000 9g at 4°C for 30 min. Samples were reduced in
100 mmol/L Ammonium bicarbonate and RapiGest
(Waters) for 20 min. Fresh 100 mmol/L Iodoacetamide was
added to cause alkylation for 20 min on a thermomixer at
55 9g for 20 min. Trypsin (one vial of Promega Sequence-
grade-modified trypsin reconstituted (a total of 20 lg addedto sample)) was added to the samples to digest overnight at
37°C.The samples were spun at 14,000 9g for 10 min to
remove any undigested debris. The peptide solutions were
dried in a speed vacuum and subsequently resuspended
in 0.1% TFA for desalting on Varian Omix C18 desalting
tips (Agilent Technologies, Santa Clara, CA). Tryptic pep-
tide samples were resuspended in buffer A (98% HPLC
H2O, 1.9% CAN (acetonitrile), 0.1% formic acid). Protein
concentrations were measured after cell lysis and diluted
appropriately to normalize protein loading. Tryptic pep-
tide samples (1.9 lL/run) were passed over an in-house
C18 resin (particle size 5 lm; Phenomenex, Torrance,
CA) packed 15 cm column (inner diameter of 50 lmol/
L) coupled to a NanoAccuity UPLC system (Waters, Mil-
ford, MA). A 240-min gradient from buffer A to buffer B
(98% ACN, 1.9% HPLC H2O, and 0.1% FA) was applied
to the peptide-bound C18 column. Eluted peptides
underwent electrospray ionization followed by data acqui-
sition using an LTQ-Orbitrap Velos Mass Spectrometer
(Thermo Scientific, Waltham, MA). Each group (NSD
and HSD EPCs) had data acquired for three biological
replicates. Each biological replicate included two technical
replicates for a total of 12 runs MS runs.
Proteomic data analysis
Mass Spectrometric RAW data files were uploaded into
the Medical College of Wisconsin Biotechnology and Bio-
engineering Center Workflow and extracted using Extract-
MSn 5.0, followed by Sequest and Mascot database search.
Searches were performed against the UnitProtKB rodent
database. Using Visualize Software (Halligan and Greene
2011), Sequest and Mascot searches for each individual
run were combined via the search combiner matching
each spectra to the best match from either search algo-
rithm to avoid redundancy. Each biological replicate then
had all Sequest/Mascot combined files for each technical
replicate compiled, followed by compilation of all EPC
replicates. A relative quantitation comparison of the total
values for NSD versus HSD EPCs through spectral count-
ing was performed and normalized for overall scan count
(Halligan and Greene 2011; Parker and Greene 2011; Ka-
czorowski et al. 2013). Filters included removal of redun-
2015 | Vol. 3 | Iss. 4 | e12358Page 4
ª 2015 The Authors. Physiological Reports published by Wiley Periodicals, Inc. on behalf of
the American Physiological Society and The Physiological Society.
Altered Notch Signaling in EPCs J. R. Karcher et al.
dant proteins, presence in two of three biological repli-
cates, scan count ≥ 25 for either condition, protein proba-
bility >0.85, at least two peptides identified, and at least a
twofold change in protein expression.
Immunoblot to determine Notch4 proteinexpression
EPCs from Sprague–Dawley rats on NSD or HSD were
harvested as described above. Cells were placed in norm-
oxic (21% O2, 5% CO2) or hypoxic conditions (2% O2,
5% CO2) at 37°C for 6 h and were flash frozen in mam-
malian protein extraction reagent (MPER, Thermo Fisher
Scientific) containing protease inhibitors (Roche). Immu-
noblots were performed as previously described (Karcher
and Greene 2014) using a rabbit polyclonal antibody for
Notch4 [Anti-Notch4 (c-3), sc-377399, dilution 1:500].
Membranes were stained with Ponceau S (Sigma) to con-
firm equal protein loading. Whole kidney lysate was used
as positive control.
Quantitative PCR to detect Notch4
EPCs were harvested as described above. Cells were incu-
bated for 6 h at normoxic (21% O2, 5% CO2) or hypoxic
conditions (2% O2, 5% CO2) at 37°C and total RNA was
purified using Qiagen’s RNeasy Mini Kit per manufac-
turer’s instructions. Real-time PCR analysis was performed
as described by Knoll et al. (2005) with a Notch4 primer
set (Rn01525734_g1, Thermo Scientific). Notch4 mRNA
expression was normalized to endogenous 18S rRNA.
siRNA-mediated Notch4 knockdownexperiments
After 13 days of expansion, EPCs cells were transfected
using DharmaFECT3 transfection reagent (T-2003-03;
Thermo Scientific) with ON-TARGETplus Notch4 siRNA
(J-103283-05-0005, Thermo Scientific) or the scrambled
control (D-001810-02-05, Thermo Scientific) according to
the manufacturer’s instructions. The transfection mixture
and siRNA was added to MCDB131+ EGM-2 (without
antibiotics) media yielding a siRNA final concentration of
25 nmol/L. After 24 h of transfection, the media on the
transfecting EPCs was changed to MCDB131+ EGM-2
(with antibiotics). After 24 h, the cells were used in the
tube formation assay. RNA was isolated from an aliquot
of cells was used to assess knockdown efficiency.
Statistics
Significance was determined by one-way or repeated mea-
sures ANOVA (Sigma Plot, SPSS Inc., Chicago, IL) with
post hoc Fisher’s least significant difference where appro-
priate. All results are reported as mean � standard error
(SE). Computation of statistical significances of observed
ms/ms spectra in HSD compared to NSD EPC samples
were appropriately adjusted for multiple comparisons
(Halligan and Greene 2011). Statistical comparisons of
tube formation and cell surface marker expression were
performed with t-tests. One-way analysis of variance was
used to compare differences between group for histologi-
cal and functional measurements from the in vivo experi-
ments. Student Neuman–Keuls post hoc testing was
performed when significant group differences were indi-
cated. Significance was set at P < 0.05.
Results
Quantification of endothelial progenitorcells
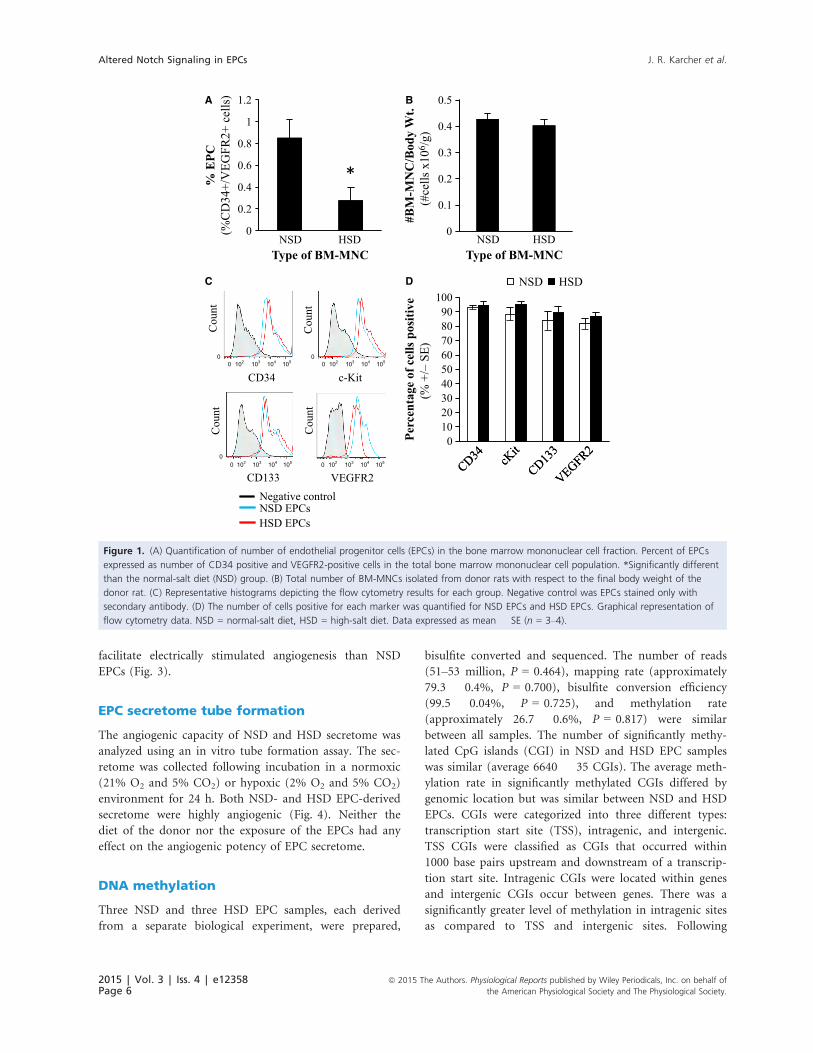
HSD led to a significant decrease in the number of
CD34+/VEGFR2+ cells relative to normal-salt fed rats
(P = 0.029), suggesting that HSD significantly decreased
the number of EPCs in bone marrow available for self-
repair (Fig. 1A). The total number of mononuclear cells
isolated from the bone marrow between the normal-salt
and high-salt donors did not differ (Fig. 1B).
Cell surface marker expression of enrichedEPCs
Expression of the phenotype markers VEGFR2, c-Kit,
CD133, and CD34 on cultured EPCs derived from high-
salt and normal-salt fed donor rats is shown in Fig. 1C
and D. Cell marker composition of EPCs isolated from
high-salt donors did not differ from EPCs isolated from
normal-salt diet fed Sprague–Dawley donor rats.
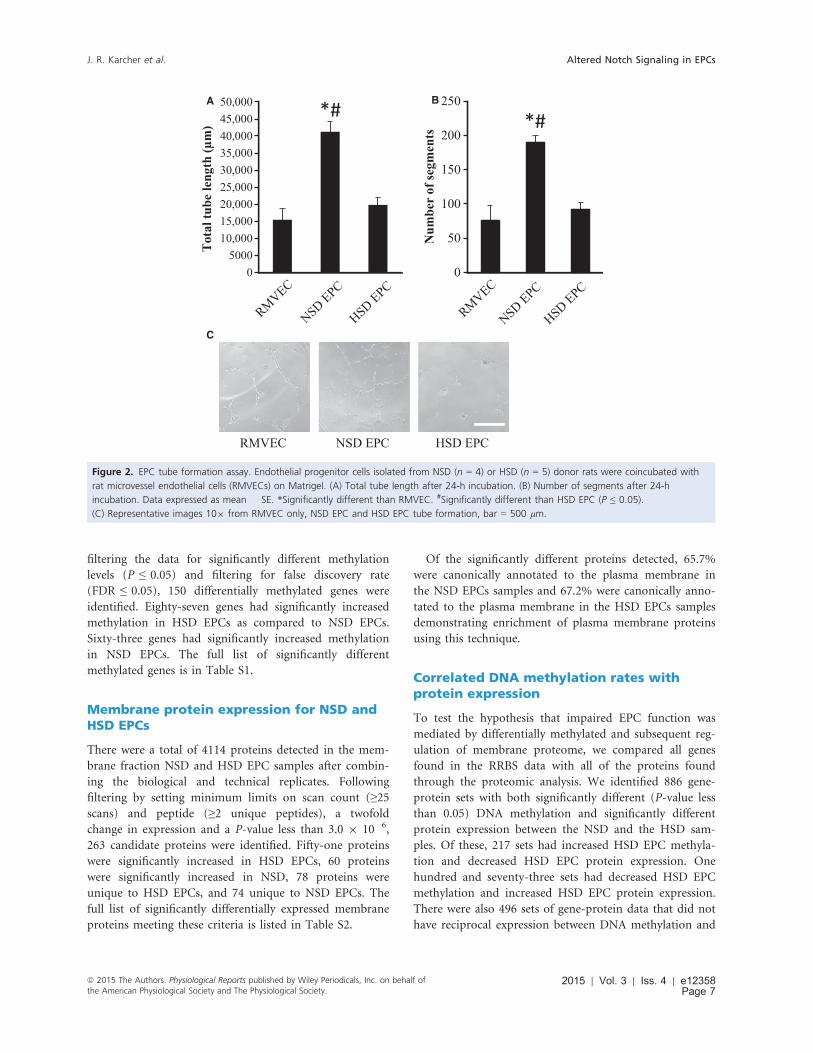
EPC tube formation
The angiogenic capacity of NSD and HSD endothelial
progenitor cells was analyzed using an in vitro tube for-
mation assay. HSD EPCs cocultured with rat heart micro-
vessel endothelial cells (RMVECs) formed fewer tubes
than NSD EPCs cocultured with RMVECs as quantified
by total tube length and number of segments. (Fig. 2).
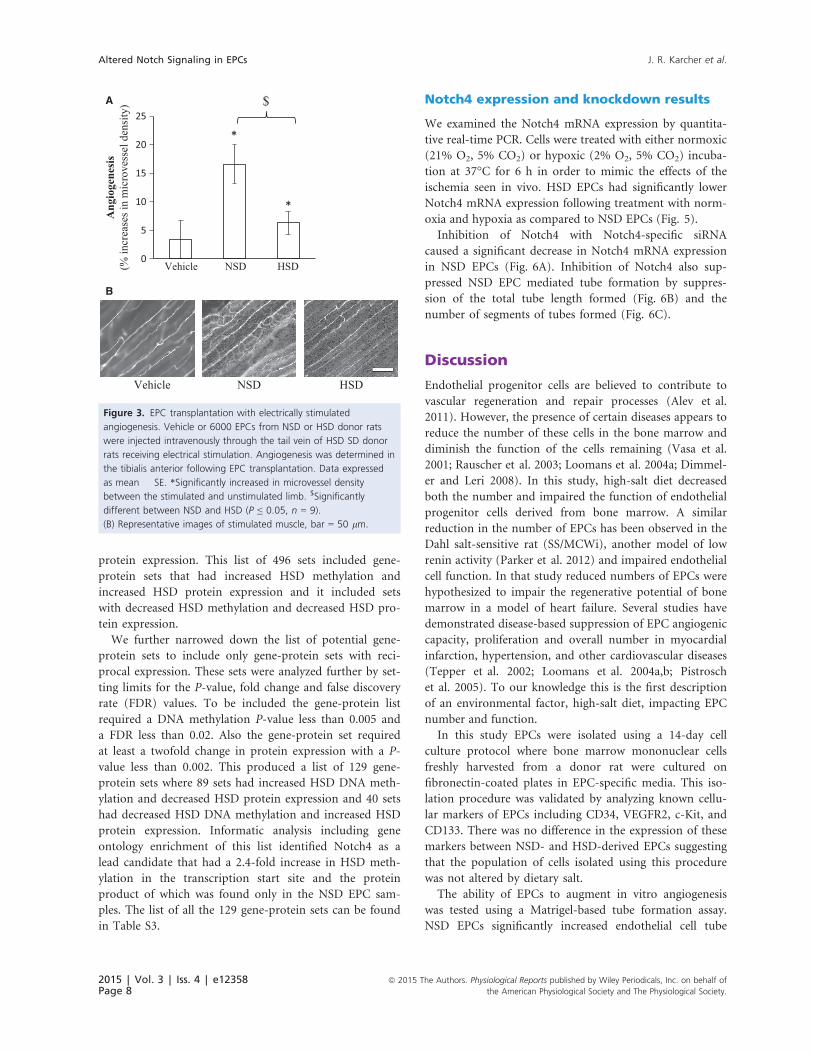
Effect of exogenous EPC delivery onmicrovessel density in nonhypertensive SDrecipients on a high-salt diet
Following intravenous injection of 6000 EPCs, there was a
significant difference between NSD and HSD EPC trans-
plantation where HSD EPCs were significantly less able to
ª 2015 The Authors. Physiological Reports published by Wiley Periodicals, Inc. on behalf ofthe American Physiological Society and The Physiological Society.
2015 | Vol. 3 | Iss. 4 | e12358Page 5
J. R. Karcher et al. Altered Notch Signaling in EPCs
facilitate electrically stimulated angiogenesis than NSD
EPCs (Fig. 3).
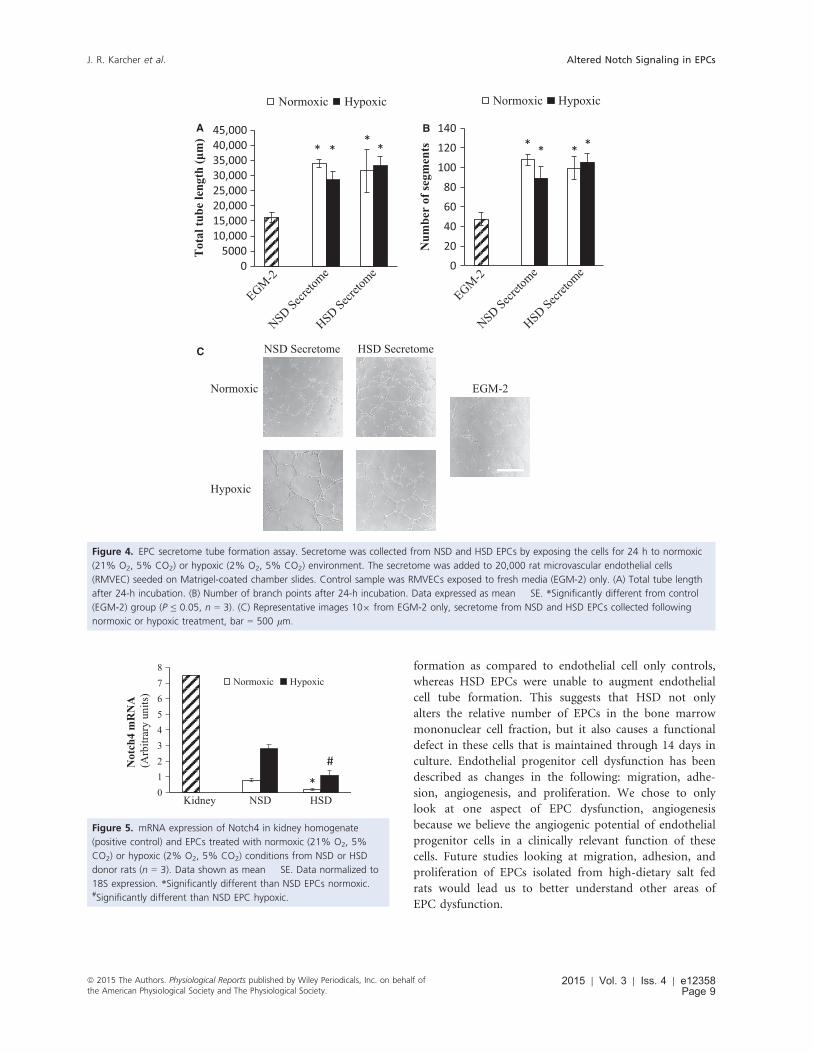
EPC secretome tube formation
The angiogenic capacity of NSD and HSD secretome was
analyzed using an in vitro tube formation assay. The sec-
retome was collected following incubation in a normoxic
(21% O2 and 5% CO2) or hypoxic (2% O2 and 5% CO2)
environment for 24 h. Both NSD- and HSD EPC-derived
secretome were highly angiogenic (Fig. 4). Neither the
diet of the donor nor the exposure of the EPCs had any
effect on the angiogenic potency of EPC secretome.
DNA methylation
Three NSD and three HSD EPC samples, each derived
from a separate biological experiment, were prepared,
bisulfite converted and sequenced. The number of reads
(51–53 million, P = 0.464), mapping rate (approximately
79.3 � 0.4%, P = 0.700), bisulfite conversion efficiency
(99.5 � 0.04%, P = 0.725), and methylation rate
(approximately 26.7 � 0.6%, P = 0.817) were similar
between all samples. The number of significantly methy-
lated CpG islands (CGI) in NSD and HSD EPC samples
was similar (average 6640 � 35 CGIs). The average meth-
ylation rate in significantly methylated CGIs differed by
genomic location but was similar between NSD and HSD
EPCs. CGIs were categorized into three different types:
transcription start site (TSS), intragenic, and intergenic.
TSS CGIs were classified as CGIs that occurred within
1000 base pairs upstream and downstream of a transcrip-
tion start site. Intragenic CGIs were located within genes
and intergenic CGIs occur between genes. There was a
significantly greater level of methylation in intragenic sites
as compared to TSS and intergenic sites. Following
0
0.2
0.4
0.6
0.8
1
1.2 A B
C D
% E
PC(%
CD
34+/
VEG
FR2+
cel
ls)
0
0.1
0.2
0.3
0.4
0.5
NSD HSD
#BM
-MN
C/B
ody
Wt.
(#ce
lls x
106 /
g)
Type of BM-MNC NSD
Type of BM-MNC
*
CD34
Cou
nt
Negative control NSD EPCsHSD EPCs
c-Kit
Cou
nt
CD133
Cou
nt
VEGFR2
Cou
nt
0 10 20 30 40 50 60 70 80 90
100
Perc
enta
ge o
f cel
ls p
ositi
ve(%
+/–
SE)
NSD HSD
HSD
10200
103 104 10510200
103 104 105
1020 103 104 10510200
103 104 105
Figure 1. (A) Quantification of number of endothelial progenitor cells (EPCs) in the bone marrow mononuclear cell fraction. Percent of EPCs
expressed as number of CD34 positive and VEGFR2-positive cells in the total bone marrow mononuclear cell population. *Significantly different
than the normal-salt diet (NSD) group. (B) Total number of BM-MNCs isolated from donor rats with respect to the final body weight of the
donor rat. (C) Representative histograms depicting the flow cytometry results for each group. Negative control was EPCs stained only with
secondary antibody. (D) The number of cells positive for each marker was quantified for NSD EPCs and HSD EPCs. Graphical representation of
flow cytometry data. NSD = normal-salt diet, HSD = high-salt diet. Data expressed as mean � SE (n = 3–4).
2015 | Vol. 3 | Iss. 4 | e12358Page 6
ª 2015 The Authors. Physiological Reports published by Wiley Periodicals, Inc. on behalf of
the American Physiological Society and The Physiological Society.
Altered Notch Signaling in EPCs J. R. Karcher et al.
filtering the data for significantly different methylation
levels (P ≤ 0.05) and filtering for false discovery rate
(FDR ≤ 0.05), 150 differentially methylated genes were
identified. Eighty-seven genes had significantly increased
methylation in HSD EPCs as compared to NSD EPCs.
Sixty-three genes had significantly increased methylation
in NSD EPCs. The full list of significantly different
methylated genes is in Table S1.
Membrane protein expression for NSD andHSD EPCs
There were a total of 4114 proteins detected in the mem-
brane fraction NSD and HSD EPC samples after combin-
ing the biological and technical replicates. Following
filtering by setting minimum limits on scan count (≥25scans) and peptide (≥2 unique peptides), a twofold
change in expression and a P-value less than 3.0 9 10�6,
263 candidate proteins were identified. Fifty-one proteins
were significantly increased in HSD EPCs, 60 proteins
were significantly increased in NSD, 78 proteins were
unique to HSD EPCs, and 74 unique to NSD EPCs. The
full list of significantly differentially expressed membrane
proteins meeting these criteria is listed in Table S2.
Of the significantly different proteins detected, 65.7%
were canonically annotated to the plasma membrane in
the NSD EPCs samples and 67.2% were canonically anno-
tated to the plasma membrane in the HSD EPCs samples
demonstrating enrichment of plasma membrane proteins
using this technique.
Correlated DNA methylation rates withprotein expression
To test the hypothesis that impaired EPC function was
mediated by differentially methylated and subsequent reg-
ulation of membrane proteome, we compared all genes
found in the RRBS data with all of the proteins found
through the proteomic analysis. We identified 886 gene-
protein sets with both significantly different (P-value less
than 0.05) DNA methylation and significantly different
protein expression between the NSD and the HSD sam-
ples. Of these, 217 sets had increased HSD EPC methyla-
tion and decreased HSD EPC protein expression. One
hundred and seventy-three sets had decreased HSD EPC
methylation and increased HSD EPC protein expression.
There were also 496 sets of gene-protein data that did not
have reciprocal expression between DNA methylation and
05000
10,00015,00020,00025,00030,00035,00040,00045,00050,000
Tot
al tu
be le
ngth
(μm
)
*#
0
50
100
150
200
250
Num
ber
of se
gmen
ts
*#
RMVEC NSD EPC HSD EPC
A B
C
Figure 2. EPC tube formation assay. Endothelial progenitor cells isolated from NSD (n = 4) or HSD (n = 5) donor rats were coincubated with
rat microvessel endothelial cells (RMVECs) on Matrigel. (A) Total tube length after 24-h incubation. (B) Number of segments after 24-h
incubation. Data expressed as mean � SE. *Significantly different than RMVEC. #Significantly different than HSD EPC (P ≤ 0.05).
(C) Representative images 109 from RMVEC only, NSD EPC and HSD EPC tube formation, bar = 500 lm.
ª 2015 The Authors. Physiological Reports published by Wiley Periodicals, Inc. on behalf ofthe American Physiological Society and The Physiological Society.
2015 | Vol. 3 | Iss. 4 | e12358Page 7
J. R. Karcher et al. Altered Notch Signaling in EPCs
protein expression. This list of 496 sets included gene-
protein sets that had increased HSD methylation and
increased HSD protein expression and it included sets
with decreased HSD methylation and decreased HSD pro-
tein expression.
We further narrowed down the list of potential gene-
protein sets to include only gene-protein sets with reci-
procal expression. These sets were analyzed further by set-
ting limits for the P-value, fold change and false discovery
rate (FDR) values. To be included the gene-protein list
required a DNA methylation P-value less than 0.005 and
a FDR less than 0.02. Also the gene-protein set required
at least a twofold change in protein expression with a P-
value less than 0.002. This produced a list of 129 gene-
protein sets where 89 sets had increased HSD DNA meth-
ylation and decreased HSD protein expression and 40 sets
had decreased HSD DNA methylation and increased HSD
protein expression. Informatic analysis including gene
ontology enrichment of this list identified Notch4 as a
lead candidate that had a 2.4-fold increase in HSD meth-
ylation in the transcription start site and the protein
product of which was found only in the NSD EPC sam-
ples. The list of all the 129 gene-protein sets can be found
in Table S3.
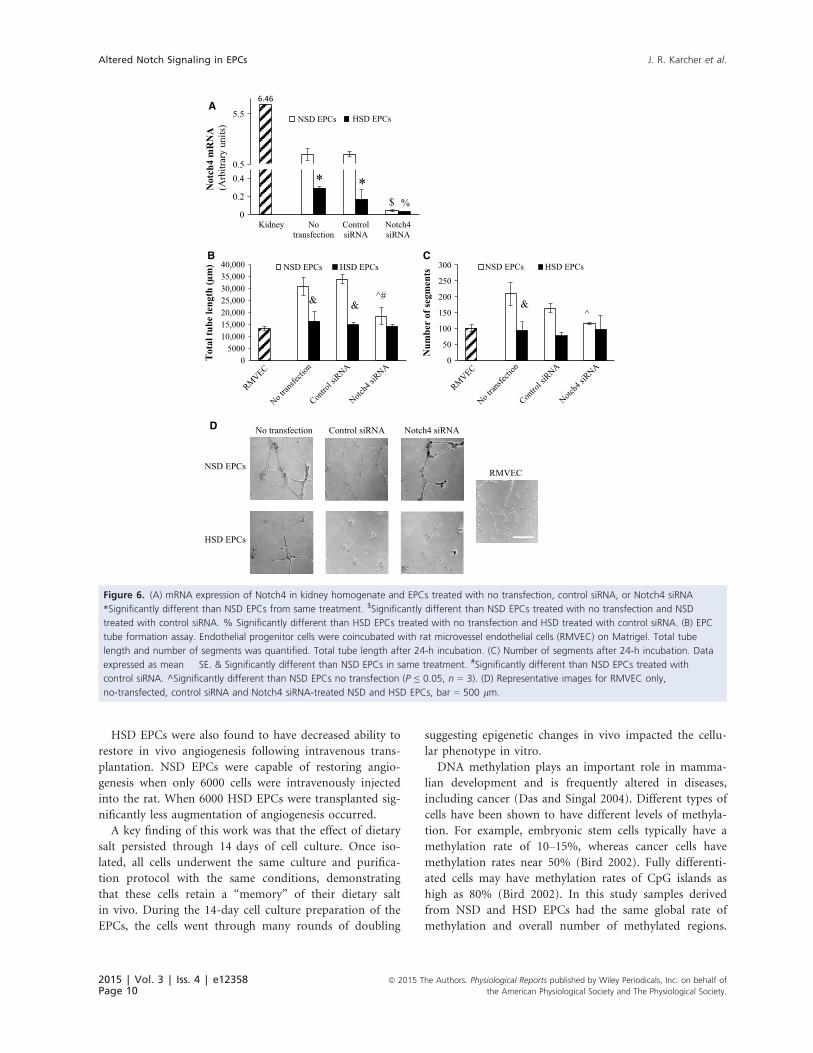
Notch4 expression and knockdown results
We examined the Notch4 mRNA expression by quantita-
tive real-time PCR. Cells were treated with either normoxic
(21% O2, 5% CO2) or hypoxic (2% O2, 5% CO2) incuba-
tion at 37°C for 6 h in order to mimic the effects of the
ischemia seen in vivo. HSD EPCs had significantly lower
Notch4 mRNA expression following treatment with norm-
oxia and hypoxia as compared to NSD EPCs (Fig. 5).
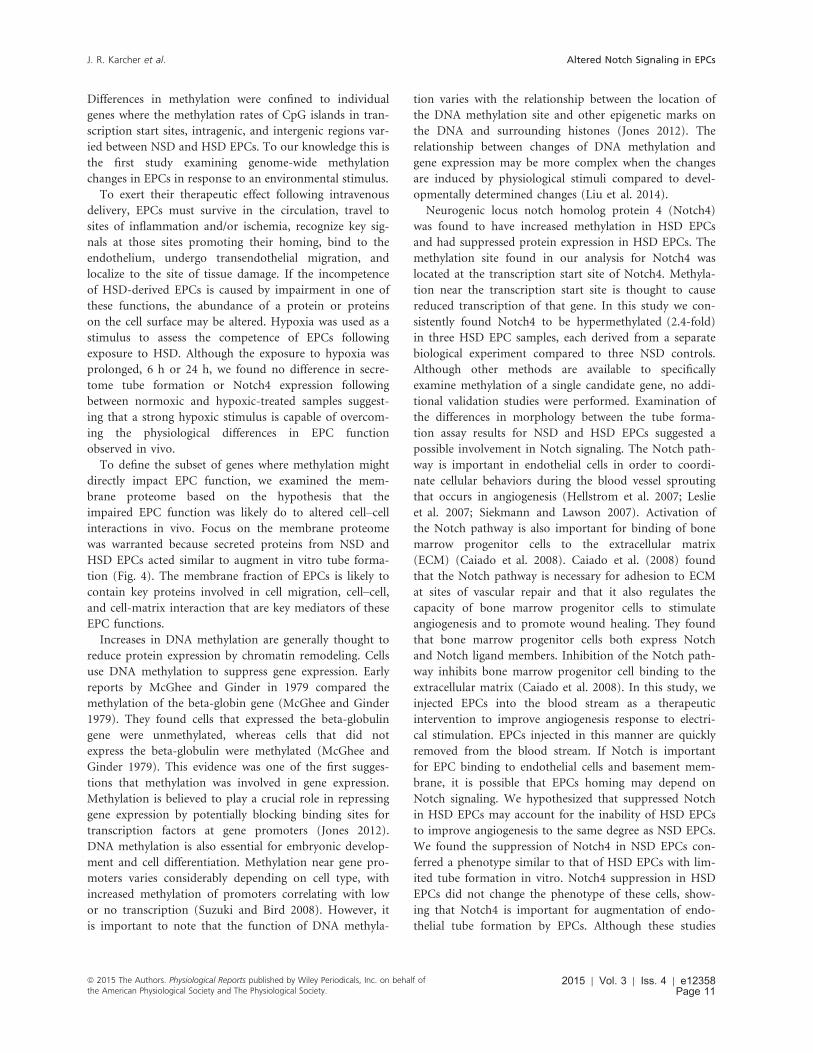
Inhibition of Notch4 with Notch4-specific siRNA
caused a significant decrease in Notch4 mRNA expression
in NSD EPCs (Fig. 6A). Inhibition of Notch4 also sup-
pressed NSD EPC mediated tube formation by suppres-
sion of the total tube length formed (Fig. 6B) and the
number of segments of tubes formed (Fig. 6C).
Discussion
Endothelial progenitor cells are believed to contribute to
vascular regeneration and repair processes (Alev et al.
2011). However, the presence of certain diseases appears to
reduce the number of these cells in the bone marrow and
diminish the function of the cells remaining (Vasa et al.
2001; Rauscher et al. 2003; Loomans et al. 2004a; Dimmel-
er and Leri 2008). In this study, high-salt diet decreased
both the number and impaired the function of endothelial
progenitor cells derived from bone marrow. A similar
reduction in the number of EPCs has been observed in the
Dahl salt-sensitive rat (SS/MCWi), another model of low
renin activity (Parker et al. 2012) and impaired endothelial
cell function. In that study reduced numbers of EPCs were
hypothesized to impair the regenerative potential of bone
marrow in a model of heart failure. Several studies have
demonstrated disease-based suppression of EPC angiogenic
capacity, proliferation and overall number in myocardial
infarction, hypertension, and other cardiovascular diseases
(Tepper et al. 2002; Loomans et al. 2004a,b; Pistrosch
et al. 2005). To our knowledge this is the first description
of an environmental factor, high-salt diet, impacting EPC
number and function.
In this study EPCs were isolated using a 14-day cell
culture protocol where bone marrow mononuclear cells
freshly harvested from a donor rat were cultured on
fibronectin-coated plates in EPC-specific media. This iso-
lation procedure was validated by analyzing known cellu-
lar markers of EPCs including CD34, VEGFR2, c-Kit, and
CD133. There was no difference in the expression of these
markers between NSD- and HSD-derived EPCs suggesting
that the population of cells isolated using this procedure
was not altered by dietary salt.
The ability of EPCs to augment in vitro angiogenesis
was tested using a Matrigel-based tube formation assay.
NSD EPCs significantly increased endothelial cell tube
$
0
5
10
15
20
25
Vehicle NSD HSD
Ang
ioge
nesi
s(%
incr
ease
s in
mic
rove
ssel
den
sity
)*
*
A
B
Vehicle NSD HSD
Figure 3. EPC transplantation with electrically stimulated
angiogenesis. Vehicle or 6000 EPCs from NSD or HSD donor rats
were injected intravenously through the tail vein of HSD SD donor
rats receiving electrical stimulation. Angiogenesis was determined in
the tibialis anterior following EPC transplantation. Data expressed
as mean � SE. *Significantly increased in microvessel density
between the stimulated and unstimulated limb. $Significantly
different between NSD and HSD (P ≤ 0.05, n = 9).
(B) Representative images of stimulated muscle, bar = 50 lm.
2015 | Vol. 3 | Iss. 4 | e12358Page 8
ª 2015 The Authors. Physiological Reports published by Wiley Periodicals, Inc. on behalf of
the American Physiological Society and The Physiological Society.
Altered Notch Signaling in EPCs J. R. Karcher et al.
formation as compared to endothelial cell only controls,
whereas HSD EPCs were unable to augment endothelial
cell tube formation. This suggests that HSD not only
alters the relative number of EPCs in the bone marrow
mononuclear cell fraction, but it also causes a functional
defect in these cells that is maintained through 14 days in
culture. Endothelial progenitor cell dysfunction has been
described as changes in the following: migration, adhe-
sion, angiogenesis, and proliferation. We chose to only
look at one aspect of EPC dysfunction, angiogenesis
because we believe the angiogenic potential of endothelial
progenitor cells in a clinically relevant function of these
cells. Future studies looking at migration, adhesion, and
proliferation of EPCs isolated from high-dietary salt fed
rats would lead us to better understand other areas of
EPC dysfunction.
A B
EGM-2
NSD Secretome HSD Secretome
Normoxic
Hypoxic
C
05000
10,00015,00020,00025,00030,00035,00040,00045,000
Tot
al tu
be le
ngth
(μm
)
Normoxic Hypoxic
0
20
40
60
80
100
120
140
Num
ber
of se
gmen
ts
Normoxic Hypoxic
**** * ***
Figure 4. EPC secretome tube formation assay. Secretome was collected from NSD and HSD EPCs by exposing the cells for 24 h to normoxic
(21% O2, 5% CO2) or hypoxic (2% O2, 5% CO2) environment. The secretome was added to 20,000 rat microvascular endothelial cells
(RMVEC) seeded on Matrigel-coated chamber slides. Control sample was RMVECs exposed to fresh media (EGM-2) only. (A) Total tube length
after 24-h incubation. (B) Number of branch points after 24-h incubation. Data expressed as mean � SE. *Significantly different from control
(EGM-2) group (P ≤ 0.05, n = 3). (C) Representative images 109 from EGM-2 only, secretome from NSD and HSD EPCs collected following
normoxic or hypoxic treatment, bar = 500 lm.
012345678
Kidney NSD HSD
Not
ch4
mR
NA
(Arb
itrar
y un
its)
Normoxic Hypoxic
*
#
Figure 5. mRNA expression of Notch4 in kidney homogenate
(positive control) and EPCs treated with normoxic (21% O2, 5%
CO2) or hypoxic (2% O2, 5% CO2) conditions from NSD or HSD
donor rats (n = 3). Data shown as mean � SE. Data normalized to
18S expression. *Significantly different than NSD EPCs normoxic.#Significantly different than NSD EPC hypoxic.
ª 2015 The Authors. Physiological Reports published by Wiley Periodicals, Inc. on behalf ofthe American Physiological Society and The Physiological Society.
2015 | Vol. 3 | Iss. 4 | e12358Page 9
J. R. Karcher et al. Altered Notch Signaling in EPCs
HSD EPCs were also found to have decreased ability to
restore in vivo angiogenesis following intravenous trans-
plantation. NSD EPCs were capable of restoring angio-
genesis when only 6000 cells were intravenously injected
into the rat. When 6000 HSD EPCs were transplanted sig-
nificantly less augmentation of angiogenesis occurred.
A key finding of this work was that the effect of dietary
salt persisted through 14 days of cell culture. Once iso-
lated, all cells underwent the same culture and purifica-
tion protocol with the same conditions, demonstrating
that these cells retain a “memory” of their dietary salt
in vivo. During the 14-day cell culture preparation of the
EPCs, the cells went through many rounds of doubling
suggesting epigenetic changes in vivo impacted the cellu-
lar phenotype in vitro.
DNA methylation plays an important role in mamma-
lian development and is frequently altered in diseases,
including cancer (Das and Singal 2004). Different types of
cells have been shown to have different levels of methyla-
tion. For example, embryonic stem cells typically have a
methylation rate of 10–15%, whereas cancer cells have
methylation rates near 50% (Bird 2002). Fully differenti-
ated cells may have methylation rates of CpG islands as
high as 80% (Bird 2002). In this study samples derived
from NSD and HSD EPCs had the same global rate of
methylation and overall number of methylated regions.
A
B C
&
05000
10,00015,00020,00025,00030,00035,00040,000
Tot
al tu
be le
ngth
(μm
) NSD EPCs HSD EPCs
0
50
100
150
200
250
300
Num
ber
of se
gmen
ts NSD EPCs HSD EPCs
^& &
^#
0.5
5.5 NSD EPCs HSD EPCs
0
0.2
0.4
Kidney Notransfection
ControlsiRNA
Notch4siRNA
* *$ %
6.46
RMVEC
D
Not
ch4
mR
NA
(Arb
itrar
y un
its)
No transfection Control siRNA Notch4 siRNA
NSD EPCs
HSD EPCs
Figure 6. (A) mRNA expression of Notch4 in kidney homogenate and EPCs treated with no transfection, control siRNA, or Notch4 siRNA
*Significantly different than NSD EPCs from same treatment. $Significantly different than NSD EPCs treated with no transfection and NSD
treated with control siRNA. % Significantly different than HSD EPCs treated with no transfection and HSD treated with control siRNA. (B) EPC
tube formation assay. Endothelial progenitor cells were coincubated with rat microvessel endothelial cells (RMVEC) on Matrigel. Total tube
length and number of segments was quantified. Total tube length after 24-h incubation. (C) Number of segments after 24-h incubation. Data
expressed as mean � SE. & Significantly different than NSD EPCs in same treatment. #Significantly different than NSD EPCs treated with
control siRNA. ^Significantly different than NSD EPCs no transfection (P ≤ 0.05, n = 3). (D) Representative images for RMVEC only,
no-transfected, control siRNA and Notch4 siRNA-treated NSD and HSD EPCs, bar = 500 lm.
2015 | Vol. 3 | Iss. 4 | e12358Page 10
ª 2015 The Authors. Physiological Reports published by Wiley Periodicals, Inc. on behalf of
the American Physiological Society and The Physiological Society.
Altered Notch Signaling in EPCs J. R. Karcher et al.
Differences in methylation were confined to individual
genes where the methylation rates of CpG islands in tran-
scription start sites, intragenic, and intergenic regions var-
ied between NSD and HSD EPCs. To our knowledge this is
the first study examining genome-wide methylation
changes in EPCs in response to an environmental stimulus.
To exert their therapeutic effect following intravenous
delivery, EPCs must survive in the circulation, travel to
sites of inflammation and/or ischemia, recognize key sig-
nals at those sites promoting their homing, bind to the
endothelium, undergo transendothelial migration, and
localize to the site of tissue damage. If the incompetence
of HSD-derived EPCs is caused by impairment in one of
these functions, the abundance of a protein or proteins
on the cell surface may be altered. Hypoxia was used as a
stimulus to assess the competence of EPCs following
exposure to HSD. Although the exposure to hypoxia was
prolonged, 6 h or 24 h, we found no difference in secre-
tome tube formation or Notch4 expression following
between normoxic and hypoxic-treated samples suggest-
ing that a strong hypoxic stimulus is capable of overcom-
ing the physiological differences in EPC function
observed in vivo.
To define the subset of genes where methylation might
directly impact EPC function, we examined the mem-
brane proteome based on the hypothesis that the
impaired EPC function was likely do to altered cell–cellinteractions in vivo. Focus on the membrane proteome
was warranted because secreted proteins from NSD and
HSD EPCs acted similar to augment in vitro tube forma-
tion (Fig. 4). The membrane fraction of EPCs is likely to
contain key proteins involved in cell migration, cell–cell,and cell-matrix interaction that are key mediators of these
EPC functions.
Increases in DNA methylation are generally thought to
reduce protein expression by chromatin remodeling. Cells
use DNA methylation to suppress gene expression. Early
reports by McGhee and Ginder in 1979 compared the
methylation of the beta-globin gene (McGhee and Ginder
1979). They found cells that expressed the beta-globulin
gene were unmethylated, whereas cells that did not
express the beta-globulin were methylated (McGhee and
Ginder 1979). This evidence was one of the first sugges-
tions that methylation was involved in gene expression.
Methylation is believed to play a crucial role in repressing
gene expression by potentially blocking binding sites for
transcription factors at gene promoters (Jones 2012).
DNA methylation is also essential for embryonic develop-
ment and cell differentiation. Methylation near gene pro-
moters varies considerably depending on cell type, with
increased methylation of promoters correlating with low
or no transcription (Suzuki and Bird 2008). However, it
is important to note that the function of DNA methyla-
tion varies with the relationship between the location of
the DNA methylation site and other epigenetic marks on
the DNA and surrounding histones (Jones 2012). The
relationship between changes of DNA methylation and
gene expression may be more complex when the changes
are induced by physiological stimuli compared to devel-
opmentally determined changes (Liu et al. 2014).
Neurogenic locus notch homolog protein 4 (Notch4)
was found to have increased methylation in HSD EPCs
and had suppressed protein expression in HSD EPCs. The
methylation site found in our analysis for Notch4 was
located at the transcription start site of Notch4. Methyla-
tion near the transcription start site is thought to cause
reduced transcription of that gene. In this study we con-
sistently found Notch4 to be hypermethylated (2.4-fold)
in three HSD EPC samples, each derived from a separate
biological experiment compared to three NSD controls.
Although other methods are available to specifically
examine methylation of a single candidate gene, no addi-
tional validation studies were performed. Examination of
the differences in morphology between the tube forma-
tion assay results for NSD and HSD EPCs suggested a
possible involvement in Notch signaling. The Notch path-
way is important in endothelial cells in order to coordi-
nate cellular behaviors during the blood vessel sprouting
that occurs in angiogenesis (Hellstrom et al. 2007; Leslie
et al. 2007; Siekmann and Lawson 2007). Activation of
the Notch pathway is also important for binding of bone
marrow progenitor cells to the extracellular matrix
(ECM) (Caiado et al. 2008). Caiado et al. (2008) found
that the Notch pathway is necessary for adhesion to ECM
at sites of vascular repair and that it also regulates the
capacity of bone marrow progenitor cells to stimulate
angiogenesis and to promote wound healing. They found
that bone marrow progenitor cells both express Notch
and Notch ligand members. Inhibition of the Notch path-
way inhibits bone marrow progenitor cell binding to the
extracellular matrix (Caiado et al. 2008). In this study, we
injected EPCs into the blood stream as a therapeutic
intervention to improve angiogenesis response to electri-
cal stimulation. EPCs injected in this manner are quickly
removed from the blood stream. If Notch is important
for EPC binding to endothelial cells and basement mem-
brane, it is possible that EPCs homing may depend on
Notch signaling. We hypothesized that suppressed Notch
in HSD EPCs may account for the inability of HSD EPCs
to improve angiogenesis to the same degree as NSD EPCs.
We found the suppression of Notch4 in NSD EPCs con-
ferred a phenotype similar to that of HSD EPCs with lim-
ited tube formation in vitro. Notch4 suppression in HSD
EPCs did not change the phenotype of these cells, show-
ing that Notch4 is important for augmentation of endo-
thelial tube formation by EPCs. Although these studies
ª 2015 The Authors. Physiological Reports published by Wiley Periodicals, Inc. on behalf ofthe American Physiological Society and The Physiological Society.
2015 | Vol. 3 | Iss. 4 | e12358Page 11
J. R. Karcher et al. Altered Notch Signaling in EPCs
clearly implicate Notch4 as a candidate in EPC function
we did not restore Notch4 levels in HSD EPCs and test
the hypothesis that restoration would rescue the angio-
genic phenotype. Such an experiment will be critical in
the future to determine if elevation of Notch4 could be
used in a therapeutic manner.
To the best of our knowledge Notch4 has not been
reported as hypermethylated in conditions such as insulin
resistance or myocardial infarction. It would be very
interesting to determine the methylation status of Notch4
in cardiovascular disease and other common underlying
conditions such as hypertension or obesity. Limited stud-
ies in adults have demonstrated that Notch4 is expressed
in the aorta, endothelial cells of arteries including pulmo-
nary and cardiac vessels and in the endocardium (Iso
et al. 2003). Notch4 has also been shown to be suppressed
in allografted vessels during the development of trans-
plant arteriosclerosis, as Notch4 is necessary for endothe-
lial quiescence, survival, and repair in response to tissue
injury (Quillard et al. 2008). Also Notch4 has been impli-
cated in pregnancy-induced hypertension (Sahin et al.
2011).
Our study also identified other Notch genes including
Notch1, Notch2, and Notch3 in our proteomic and DNA
methylation analysis, however, none of the other family
members met our strict criteria to be a potential candi-
date. Notch1 protein expression was increased in HSD
EPCs than NSD EPCs and had methylated at two distinct
spots one in NSD EPCs and the other in HSD EPCs.
Notch2 protein expression was also increased in HSD
EPCs and had increased methylation in NSD EPCs.
Notch3 was only found in NSD EPC protein samples and
had three found CpG islands with increased methylation
in NSD EPCs. Our proteomics data did not identify
delta-like proteins or jagged. This does not mean that
these proteins are not expressed in endothelial progenitor
cells as they may be at a low expression that was masked
during mass spectroscopy. Delta-like and jagged genes
were also not identified in the DNA methylation analysis.
Further analysis of these genes would be necessary to con-
clude if there are any differences in expression or methyl-
ation between NSD and HSD endothelial progenitor cells.
In summary, high-salt diet altered the DNA methyla-
tion profile of EPCs causing a suppressed angiogenic
competency. We identified numerous genes with differen-
tial methylation and differential protein abundance
between NSD and HSD EPCs. Notch4 that emerged as a
lead functional candidate had increased methylation in
HSD EPCs and suppressed protein expression in HSD
EPCs. Notch4 knockdown confirmed its role as necessary
in NSD EPC tube formation, revealing one potential
mechanism by which high-salt diet suppresses EPC medi-
ated angiogenesis.
Conflict of Interest
None declared.
References
Alev, C., M. Ii, and T. Asahara. 2011. Endothelial progenitor
cells: a novel tool for the therapy of ischemic diseases.
Antioxid. Redox Signal. 15:949–965.Asahara, T., T. Murohara, A. Sullivan, M. Silver, R. van der
Zee, T. Li, et al. 1997. Isolation of putative progenitor
endothelial cells for angiogenesis. Science 275:964–967.
Bird, A. 2002. DNA methylation patterns and epigenetic
memory. Genes Dev. 16:6–21.
Boyle, P., K. Clement, H. Gu, Z. D. Smith, M. Ziller, J. L.
Fostel, et al. 2012. Gel-free multiplexed reduced
representation bisulfite sequencing for large-scale DNA
methylation profiling. Genome Biol. 13:R92.
Caiado, F., C. Real, T. Carvalho, and S. Dias. 2008. Notch
pathway modulation on bone marrow-derived vascular
precursor cells regulates their angiogenic and wound healing
potential. PLoS ONE 3:e3752.
Das, P. M., and R. Singal. 2004. DNA methylation and cancer.
J. Clin. Oncol. 22:4632–4642.Dimmeler, S., and A. Leri. 2008. Aging and disease as modifiers
of efficacy of cell therapy. Circ. Res. 102:1319–1330.Fadini, G. P., S. V. de Kreutzenberg, and A. Coracina. 2006.
Circulating CD341 cells, metabolic syndrome, and
cardiovascular risk. Eur. Heart J. 27:2247e55.
Geft, D., S. Schwartzenberg, O. Rogowsky, A. Finkelstein, J.
Ablin, S. Maysel-Auslender, et al. 2008. Circulating
apoptotic progenitor cells in patients with congestive heart
failure. PLoS ONE 3:e3238.
Gu, H., Z. D. Smith, C. Bock, P. Boyle, A. Gnirke, and A.
Meissner. 2011. Preparation of reduced representation
bisulfite sequencing libraries for genome-scale DNA
methylation profiling. Nat. Protoc. 6:468–481.
Halligan, B. D., and A. S. Greene. 2011. Visualize: a free and
open source multifunction tool for proteomics data analysis.
Proteomics 11:1058–1063.Hellstrom, M., L. K. Phng, J. J. Hofmann, E. Wallgard, L.
Coultas, P. Lindblom, et al. 2007. Dll4 signalling through
Notch1 regulates formation of tip cells during angiogenesis.
Nature 445:776–780.Imanishi, T., C. Moriwaki, and T. Hano. 2005. Endothelial
progenitor cell senescence is accelerated in both
experimental hypertensive rats and patients with essential
hypertension. J. Hypertens. 23:1831–1837.Iso, T., Y. Hamamori, and L. Kedes. 2003. Notch signaling in
vascular development. Arterioscler. Thromb. Vasc. Biol.
23:543–553.
Jones, P. A. 2012. Functions of DNA methylation: islands,
start sites, gene bodies and beyond. Nat. Rev. Genet.
13:484–492.
2015 | Vol. 3 | Iss. 4 | e12358Page 12
ª 2015 The Authors. Physiological Reports published by Wiley Periodicals, Inc. on behalf of
the American Physiological Society and The Physiological Society.
Altered Notch Signaling in EPCs J. R. Karcher et al.
Kaczorowski, C. C., T. J. Stodola, B. R. Hoffmann, A. R.
Prisco, P. Y. Liu, D. N. Didier, et al. 2013. Targeting the
endothelial progenitor cell surface proteome to identify
novel mechanisms that mediate angiogenic efficacy in a
rodent model of vascular disease. Physiol. Genomics 45:999–1011.
Karcher, J. R., and A. S. Greene. 2014. Bone marrow
mononuclear cell angiogenic competency is suppressed by a
high-salt diet. Am. J. Physiol. Cell Physiol. 306:C123–C131.
Kawamoto, A., H. C. Gwon, and H. Iwaguro. 2001.
Therapeutic potential of ex vivo expanded endothelial
progenitor cells for myocardial ischemia. Circulation
103:634–637.
Knoll, K. E., J. L. Pietrusz, and M. Liang. 2005. Tissue-specific
transcriptome responses in rats with early streptozotocin-
induced diabetes. Physiol. Genomics 21:222–229.Kuethe, F., B. M. Richartz, H. G. Sayer, C. Kasper, G. S.
Werner, K. Hoffken, et al. 2004. Lack of regeneration of
myocardium by autologous intracoronary mononuclear
bone marrow cell transplantation in humans with large
anterior myocardial infarctions. Int. J. Cardiol. 97:123–127.
Langmead, B., C. Trapnell, M. Pop, and S. L. Salzberg. 2009.
Ultrafast and memory-efficient alignment of short DNA
sequences to the human genome. Genome Biol. 10:R25.
Leslie, J. D., L. Ariza-McNaughton, A. L. Bermange, R.
McAdow, S. L. Johnson, and J. Lewis. 2007. Endothelial
signalling by the Notch ligand Delta-like 4 restricts
angiogenesis. Development 134:839–844.Linderman, J. R., M. R. Kloehn, and A. S. Greene. 2000.
Development of an implantable muscle stimulator:
measurement of stimulated angiogenesis and poststimulus
vessel regression. Microcirculation 7:119–128.Liu, Y., P. Liu, C. Yang, A. W. Cowley Jr, and M. Liang. 2014.
Base-resolution maps of 5-methylcytosine and 5-
hydroxymethylcytosine in Dahl S rats: effect of salt and
genomic sequence. Hypertension 63:827–838.Loomans, C. J., H. H. Dao, A. J. van Zonneveld, and T. J.
Rabelink. 2004a. Endothelial progenitor cell dysfunction: a
novel concept in the pathogenesis of vascular complications
of type 1 diabetes. Diabetes 53:195–199.
Loomans, C. J., E. J. de Koning, F. J. Staal, M. B. Rookmaaker,
C. Verseyden, H. C. de Boer, et al. 2004b. Is endothelial
progenitor cell dysfunction involved in altered angiogenic
processes in patients with hypertension? Curr. Hypertens.
Rep. 6:51–54.Lunde, K., S. Solheim, S. Aakhus, H. Arnesen, M. Abdelnoor,
and K. Forfang. 2005. Autologous stem cell transplantation
in acute myocardial infarction: the ASTAMI randomized
controlled trial. Intracoronary transplantation of autologous
mononuclear bone marrow cells, study design and safety
aspects. Scand. Cardiovasc. J. 39:150–158.McGhee, J. D., and G. D. Ginder. 1979. Specific DNA
methylation sites in the vicinity of the chicken beta-globin
genes. Nature 280:419–420.
Murphy, N. F., C. O’Loughlin, M. Ledwidge, D. McCaffrey,
and K. I. McDonald. 2007. Improvement but no cure of left
ventricular systolic dysfunction in treated heart failure
patients. Eur. J. Heart Fail. 9:1196–1204.
O’Neill, T. J. T., B. R. Wamhoff, G. K. Owens, and T. C.
Skalak. 2005. Mobilization of bone marrow-derived cells
enhances the angiogenic response to hypoxia without
transdifferentiation into endothelial cells. Circ. Res. 97:1027–1035.
Orlic, D., J. Kajstura, S. Chimenti, I. Jakoniuk, S. M.
Anderson, B. Li, et al. 2001. Bone marrow cells regenerate
infarcted myocardium. Nature 410:701–705.Parker, S. J., and A. S. Greene. 2011. Delivery of endothelial
progenitor cells derived from consomic SS-13BN/mcwi
donor rats reduces diastolic dysfunction in hypertensive SS/
MCWi recipients. FASEB J. 25:661–668.Parker, S. J., D. N. Didier, J. R. Karcher, T. J. Stodola, B.
Endres, and A. S. Greene. 2012. Bone marrow mononuclear
cells induce beneficial remodeling and reduce diastolic
dysfunction in the left ventricle of hypertensive SS/MCWi
rats. Physiol. Genomics 44:925–933.
Pedersen, B., T. F. Hsieh, C. Ibarra, and R. L. Fischer. 2011.
MethylCoder: software pipeline for bisulfite-treated
sequences. Bioinformatics 27:2435–2436.Peters, B. A., L. A. Diaz, K. Polyak, L. Meszler, K. Romans, E.
C. Guinan, et al. 2005. Contribution of bone marrow-
derived endothelial cells to human tumor vasculature. Nat.
Med. 11:261–262.Pirro, M., G. Schillaci, C. Menecali, F. Bagaglia, R.
Paltriccia, G. Vaudo, et al. 2007. Reduced number of
circulating endothelial progenitors and HOXA9 expression
in CD34+ cells of hypertensive patients. J. Hypertens.
25:2093–2099.
Pistrosch, F., K. Herbrig, U. Oelschlaegel, S. Richter, J.
Passauer, S. Fischer, and P. Gross. 2005. PPARgamma-
agonist rosiglitazone increases number and migratory
activity of cultured endothelial progenitor cells.
Atherosclerosis 183:163–167.Prisco, A. R., J. D. Bukowy, B. R. Hoffmann, J. R. Karcher, E.
C. Exner, and A. S. Greene. 2014. Automated quantification
reveals hyperglycemia inhibits endothelial angiogenic
function. PLoS ONE 9:e94599.
Quillard, T., S. Coupel, F. Coulon, J. Fitau, M. Chatelais, M.
C. Cuturi, et al. 2008. Impaired Notch4 activity elicits
endothelial cell activation and apoptosis: implication for
transplant arteriosclerosis. Arterioscler. Thromb. Vasc. Biol.
28:2258–2265.Rauscher, F. M. G.-C., P. J. B. H. Davis, T. Wang, D. Gregg,
P. Ramaswami, A. M. Pippen, C. Dong, D. A. Taylor,
Annex, et al. 2003. Progenitor cell exhaustion, and
atherosclerosis. Circulation 108:457–463.Rieder, M. J., D. M. O’Drobinak, and A. S. Greene. 1995. A
computerized method for determination of microvascular
density. Microvasc. Res. 49:180–189.
ª 2015 The Authors. Physiological Reports published by Wiley Periodicals, Inc. on behalf ofthe American Physiological Society and The Physiological Society.
2015 | Vol. 3 | Iss. 4 | e12358Page 13
J. R. Karcher et al. Altered Notch Signaling in EPCs
Sahin, Z., N. Acar, O. Ozbey, I. Ustunel, and R. Demir. 2011.
Distribution of Notch family proteins in intrauterine growth
restriction and hypertension complicated human term
placentas. Acta Histochem. 113:270–276.
Siekmann, A. F., and N. D. Lawson. 2007. Notch signalling
and the regulation of angiogenesis. Cell Adh. Migr. 1:104–106.
Smallwood, S. A., and G. Kelsey. 2012. Genome-wide analysis
of DNA methylation in low cell numbers by reduced
representation bisulfite sequencing. Methods Mol. Biol.
925:187–197.
Suzuki, M. M., and A. Bird. 2008. DNA methylation
landscapes: provocative insights from epigenomics. Nat. Rev.
Genet. 9:465–476.Tepper, O. M., R. D. Galiano, J. M. Capla, C. Kalka, P. J.
Gagne, G. R. Jacobowitz, et al. 2002. Human endothelial
progenitor cells from type II diabetics exhibit impaired
proliferation, adhesion, and incorporation into vascular
structures. Circulation 106:2781–2786.
Testa, J. E., A. Chrastina, P. Oh, Y. Li, H. Witkiewicz, M.
Czarny, et al. 2009. Immunotargeting and cloning of two
CD34 variants exhibiting restricted expression in adult rat
endothelia in vivo. Am. J. Physiol. Lung Cell. Mol. Physiol.
297:L251–L262.Vasa, M., S. Fichtlscherer, and A. Aicher. 2001. Number and
migratory activity of circulating endothelial progenitor cells
inversely correlate with risk factors for coronary artery
disease. Circ. Res., 89:E1e7.
Walter, D. H. H., J. J. Reinhold, U. Rochwalsky, F. Seeger, J.
Honold, J. Hoffmann, et al. 2005. Impaired CXCR4
signaling contributes to the reduced neovascularization
capacity of endothelial progenitor cells from patients with
coronary artery disease. Circ. Res. 97:1142–1151.
Wu, T. D., and S. Nacu. 2010. Fast and SNP-tolerant detection
of complex variants and splicing in short reads.
Bioinformatics 26:873–881.Yao, E. H., N. Fukuda, T. Matsumoto, M. Katakawa, C.
Yamamoto, Y. Han, et al. 2008. Effects of the antioxidative
[beta]-blocker celiprolol on endothelial progenitor cells
in hypertensive rats. Am. J. Hypertens. 21:
1062–1068.Yeh, E. T., S. Zhang, H. D. Wu, M. Korbling, J. T. Willerson,
and Z. Estrov. 2003. Transdifferentiation of human
peripheral blood CD34+-enriched cell population into
cardiomyocytes, endothelial cells, and smooth muscle cells
in vivo. Circulation 108:2070–2073.
Zhou, Y., et al. 2008. Changes in number and biological
function of endothelial progenitor cells in hypertension
disorder complicating pregnancy. J. Huazhong Univ. Sci.
Technol. Med. Sci. 28:670–673.
Ziegelhoeffer, T., B. Fernandez, S. Kostin, M. Heil, R.
Voswinckel, A. Helisch, and W. Schaper. 2004. Bone
marrow-derived cells do not incorporate into the adult
growing vasculature. Circ. Res. 94:230–238.
Supporting Information
Additional Supporting Information may be found in the
online version of this article:
Table S1. Comparison of DNA methylation between NSD
and HSD EPCs.
Table S2. Comparison of proteins found between NSD
and HSD EPC samples.
Table S3. Comparison of gene-protein sets.
2015 | Vol. 3 | Iss. 4 | e12358Page 14
ª 2015 The Authors. Physiological Reports published by Wiley Periodicals, Inc. on behalf of
the American Physiological Society and The Physiological Society.
Altered Notch Signaling in EPCs J. R. Karcher et al.