genome-wide mapping and analysis of active …zhangweb.cshl.edu/reprints/barrera_gr07.pdfgenome-wide...
TRANSCRIPT
10.1101/gr.6654808Access the most recent version at doi: published online Nov 27, 2007; Genome Res.
Roland D. Green and Bing Ren Leah O. Barrera, Zirong Li, Andrew D. Smith, Karen C. Arden, Webster K. Cavenee, Michael Q. Zhang,
embryonic stem cells and adult organsGenome-wide mapping and analysis of active promoters in mouse
dataSupplementary
http://www.genome.org/cgi/content/full/gr.6654808/DC1 "Supplemental Research Data"
P<P Published online November 27, 2007 in advance of the print journal.
serviceEmail alerting
click heretop right corner of the article or Receive free email alerts when new articles cite this article - sign up in the box at the
Notes
object identifier (DOIs) and date of initial publication. by PubMed from initial publication. Citations to Advance online articles must include the digital publication). Advance online articles are citable and establish publication priority; they are indexedappeared in the paper journal (edited, typeset versions may be posted when available prior to final Advance online articles have been peer reviewed and accepted for publication but have not yet
http://www.genome.org/subscriptions/ go to: Genome ResearchTo subscribe to
© 2007 Cold Spring Harbor Laboratory Press
Cold Spring Harbor Laboratory Press on November 27, 2007 - Published by www.genome.orgDownloaded from
Genome-wide mapping and analysis of activepromoters in mouse embryonic stem cellsand adult organsLeah O. Barrera,1,2,7 Zirong Li,1,7 Andrew D. Smith,3 Karen C. Arden,1,4
Webster K. Cavenee,1,4 Michael Q. Zhang,3 Roland D. Green,5,8 and Bing Ren1,6,8
1Ludwig Institute for Cancer Research, UCSD School of Medicine, La Jolla, California 92093-0653, USA; 2UCSD BioinformaticsGraduate Program, UCSD, La Jolla, California 92093-0653, USA; 3Cold Spring Harbor Laboratory, Cold Spring Harbor,New York 11724; 4Department of Medicine, UCSD School of Medicine, La Jolla, California 92093-0660, USA; 5NimbleGenSystems Inc., Madison, Wisconsin 53711, USA; 6Department of Cellular and Molecular Medicine, UCSD Schoolof Medicine, La Jolla, California 92093-0653, USA
By integrating genome-wide maps of RNA polymerase II (Polr2a) binding with gene expression data and H3ac andH3K4me3 profiles, we characterized promoters with enriched activity in mouse embryonic stem cells (mES) as well asadult brain, heart, kidney, and liver. We identified ∼24,000 promoters across these samples, including 16,976annotated mRNA 5� ends and 5153 additional sites validating cap-analysis of gene expression (CAGE) 5� end data.We showed that promoters with CpG islands are typically non-tissue specific, with the majority associated withPolr2a and the active chromatin modifications in nearly all the tissues examined. By contrast, the promoters withoutCpG islands are generally associated with Polr2a and the active chromatin marks in a tissue-dependent way. Wedefined 4396 tissue-specific promoters by adapting a quantitative index of tissue-specificity based on Polr2aoccupancy. While there is a general correspondence between Polr2a occupancy and active chromatin modificationsat the tissue-specific promoters, a subset of them appear to be persistently marked by active chromatin modificationsin the absence of detectable Polr2a binding, highlighting the complexity of the functional relationship betweenchromatin modification and gene expression. Our results provide a resource for exploring promoter Polr2a bindingand epigenetic states across pluripotent and differentiated cell types in mammals.
[Supplemental material is available online at www.genome.org. The sequence data from this study have beensubmitted to the Gene Expression Omnibus under accession no. GSE7688.]
Over 200 different cell types underscore the functional complex-ity of mammals (Alberts et al. 2002). In turn, the complement ofgenes expressed in each cell type specifies its unique functions(Okazaki et al. 2002; Su et al. 2002, 2004; Sharov et al. 2003;Zhang et al. 2005). Throughout the genome, regulatory se-quences such as promoters, enhancers, and insulators controlgene expression by interacting with specific transcription factors,many of which exert their effect by modulating the local chro-matin modification states (Lee et al. 2004; Guillemette et al.2005; Mito et al. 2005; Pokholok et al. 2005; Raisner et al. 2005;Yuan et al. 2005; Zhang et al. 2005; Heintzman et al. 2007). Thus,unbiased genome-wide profiles of transcription factor bindingand chromatin modifications at these regulatory sequences,across a panel of mammalian cell types, are expected to provideinsights into the regulatory mechanisms of tissue-specific geneexpression (Levine and Tjian 2003).
Previously, large-scale efforts to understand mammalian tis-sue-specific expression have been devoted to the investigation of
transcript expression patterns across cell and tissue types. Micro-array-based technologies and high-throughput sequencingmethods have been used to determine steady-state mRNA levelsof genes in a compendium of cell and tissue types under normalor pathological conditions (Okazaki et al. 2002; Su et al. 2002,2004; Sharov et al. 2003; Zhang et al. 2004). These data sets havebeen valuable for understanding the tissue-specific gene expres-sion programs and provide a rich source of information for de-fining common transcription factor motifs that may underlietissue-specific patterns of expression (Wasserman and Fickett1998; Wasserman et al. 2000; Smith et al. 2005, 2006, 2007; Xieet al. 2005; Xuan et al. 2005). Recently, advances in the sequenc-ing of transcript 5� ends have also expanded the annotation ofmammalian promoters in different mammalian tissues and pro-vided references of potential transcriptional start sites for mostmammalian genes (Carninci et al. 2005, 2006; Kimura et al.2006). These recent studies have revealed a large spectrum oftranscripts for each gene generated by extensive usage of alter-native promoters, alternative splicing, and alternative polyade-nylation sites. The extent of alternative promoter usage and theidentification of transcription factor motifs suggest the key roleof promoters in contributing to the control of gene expressionleading to mammalian cell-type diversity.
While measuring the abundance and defining the 5� ends ofRNA transcripts are crucial for the understanding of mechanisms
7These authors contributed equally to this work.8Corresponding author.E-mail [email protected], [email protected]; fax: (858) 534-7750.Article published online before print. Article and publication date are at http://www.genome.org/cgi/doi/10.1101/gr.6654808.
Letter
18:000–000 ©2008 by Cold Spring Harbor Laboratory Press; ISSN 1088-9051/08; www.genome.org Genome Research 1www.genome.org
Cold Spring Harbor Laboratory Press on November 27, 2007 - Published by www.genome.orgDownloaded from
that drive tissue-specific gene expression programs, such infor-mation is not sufficient to resolve the complex mechanisms ofgene regulation. For example, we and others have recently shownthat a significant number of promoters are in a poised state oftranscription—they are bound by the general transcription ma-chinery but do not have detectable transcription activities insteady-state cells (Kim et al. 2005b; Guenther et al. 2007). To thisend, it is necessary to directly analyze transcription factor load-ing and chromatin structures at promoters. As a first step towardunderstanding the gene regulatory mechanisms in mammaliancells, we now directly identify active promoters by unbiased map-ping of the RNA polymerase II pre-initiation complex (PIC) in themouse genome across a panel of mouse organs—brain, heart,kidney, liver—and mouse embryonic stem cells (hereafter collec-tively referred to as “tissues”). In addition, we profiled two activechromatin modifications (H3ac and H3K4me3) at each identifiedpromoter and tracked the corresponding gene transcript levels.By examining these complementary data sets across the tissuessurveyed, we identified a complex relationship among chroma-tin modifications, Polr2a occupancy, and tissue-specific gene ex-pression. The majority of CpG island containing promoters areassociated with Polr2a and the active chromatin marks, regard-less of tissue type. By contrast, non-CpG island promoters aretypically associated with the active chromatin marks and occu-pied by Polr2a in a tissue-restricted manner. We developed aquantitative measure of promoter tissue-specificity based onPolr2a binding that defined 4296 tissue-specific promoters. De-tailed motif analysis of the tissue-specific promoters and func-tional annotation of corresponding genes showed an enrichmentof known tissue-specific transcription factors and functionalgroups in these tissue-specific promoters. Interestingly, compari-sons of H3K4me3 and H3ac profiles across tissues for these tissue-specific promoters showed unexpected patterns of enrichment ofthese marks in adult tissues for promoters with enriched activityin ES cells. These results suggest the importance of characterizingepigenetic profiles in addition to motif analysis in cataloguingthe regulatory sequences, which contribute to mammalian cell-type diversity.
Results
Genome-wide mapping of PIC-binding sites in mouse mES cellsand adult organs
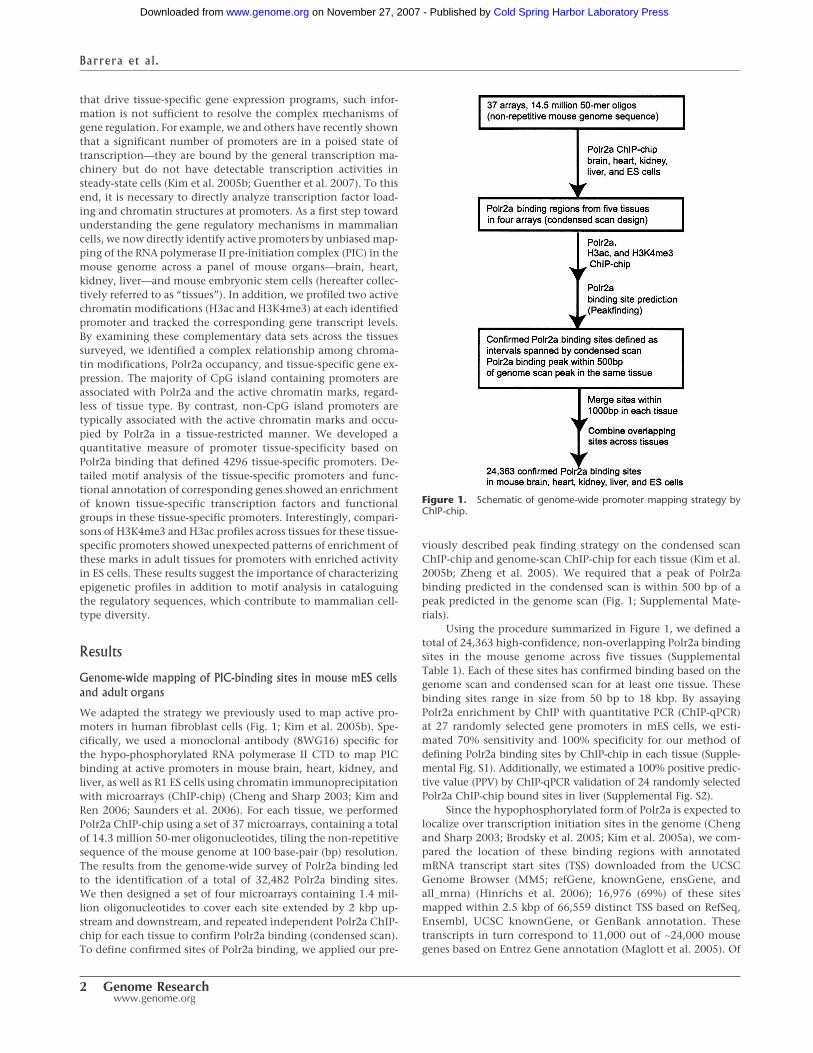
We adapted the strategy we previously used to map active pro-moters in human fibroblast cells (Fig. 1; Kim et al. 2005b). Spe-cifically, we used a monoclonal antibody (8WG16) specific forthe hypo-phosphorylated RNA polymerase II CTD to map PICbinding at active promoters in mouse brain, heart, kidney, andliver, as well as R1 ES cells using chromatin immunoprecipitationwith microarrays (ChIP-chip) (Cheng and Sharp 2003; Kim andRen 2006; Saunders et al. 2006). For each tissue, we performedPolr2a ChIP-chip using a set of 37 microarrays, containing a totalof 14.3 million 50-mer oligonucleotides, tiling the non-repetitivesequence of the mouse genome at 100 base-pair (bp) resolution.The results from the genome-wide survey of Polr2a binding ledto the identification of a total of 32,482 Polr2a binding sites.We then designed a set of four microarrays containing 1.4 mil-lion oligonucleotides to cover each site extended by 2 kbp up-stream and downstream, and repeated independent Polr2a ChIP-chip for each tissue to confirm Polr2a binding (condensed scan).To define confirmed sites of Polr2a binding, we applied our pre-
viously described peak finding strategy on the condensed scanChIP-chip and genome-scan ChIP-chip for each tissue (Kim et al.2005b; Zheng et al. 2005). We required that a peak of Polr2abinding predicted in the condensed scan is within 500 bp of apeak predicted in the genome scan (Fig. 1; Supplemental Mate-rials).
Using the procedure summarized in Figure 1, we defined atotal of 24,363 high-confidence, non-overlapping Polr2a bindingsites in the mouse genome across five tissues (SupplementalTable 1). Each of these sites has confirmed binding based on thegenome scan and condensed scan for at least one tissue. Thesebinding sites range in size from 50 bp to 18 kbp. By assayingPolr2a enrichment by ChIP with quantitative PCR (ChIP-qPCR)at 27 randomly selected gene promoters in mES cells, we esti-mated 70% sensitivity and 100% specificity for our method ofdefining Polr2a binding sites by ChIP-chip in each tissue (Supple-mental Fig. S1). Additionally, we estimated a 100% positive predic-tive value (PPV) by ChIP-qPCR validation of 24 randomly selectedPolr2a ChIP-chip bound sites in liver (Supplemental Fig. S2).
Since the hypophosphorylated form of Polr2a is expected tolocalize over transcription initiation sites in the genome (Chengand Sharp 2003; Brodsky et al. 2005; Kim et al. 2005a), we com-pared the location of these binding regions with annotatedmRNA transcript start sites (TSS) downloaded from the UCSCGenome Browser (MM5; refGene, knownGene, ensGene, andall_mrna) (Hinrichs et al. 2006); 16,976 (69%) of these sitesmapped within 2.5 kbp of 66,559 distinct TSS based on RefSeq,Ensembl, UCSC knownGene, or GenBank annotation. Thesetranscripts in turn correspond to 11,000 out of ∼24,000 mousegenes based on Entrez Gene annotation (Maglott et al. 2005). Of
Figure 1. Schematic of genome-wide promoter mapping strategy byChIP-chip.
Barrera et al.
2 Genome Researchwww.genome.org
Cold Spring Harbor Laboratory Press on November 27, 2007 - Published by www.genome.orgDownloaded from
the remaining unmatched sites within and outside of knowngene loci, 5153 mapped within 2.5 kbp of TSS based on 5� capanalysis of gene-expression (CAGE) sequencing from a panel of145 mouse cDNA libraries (Shiraki et al. 2003; Carninci et al.2005). Taken together, these two lines of evidence provide inde-pendent support that 91% of these Polr2a binding regions cor-respond to known transcription initiation sites (Table 1).
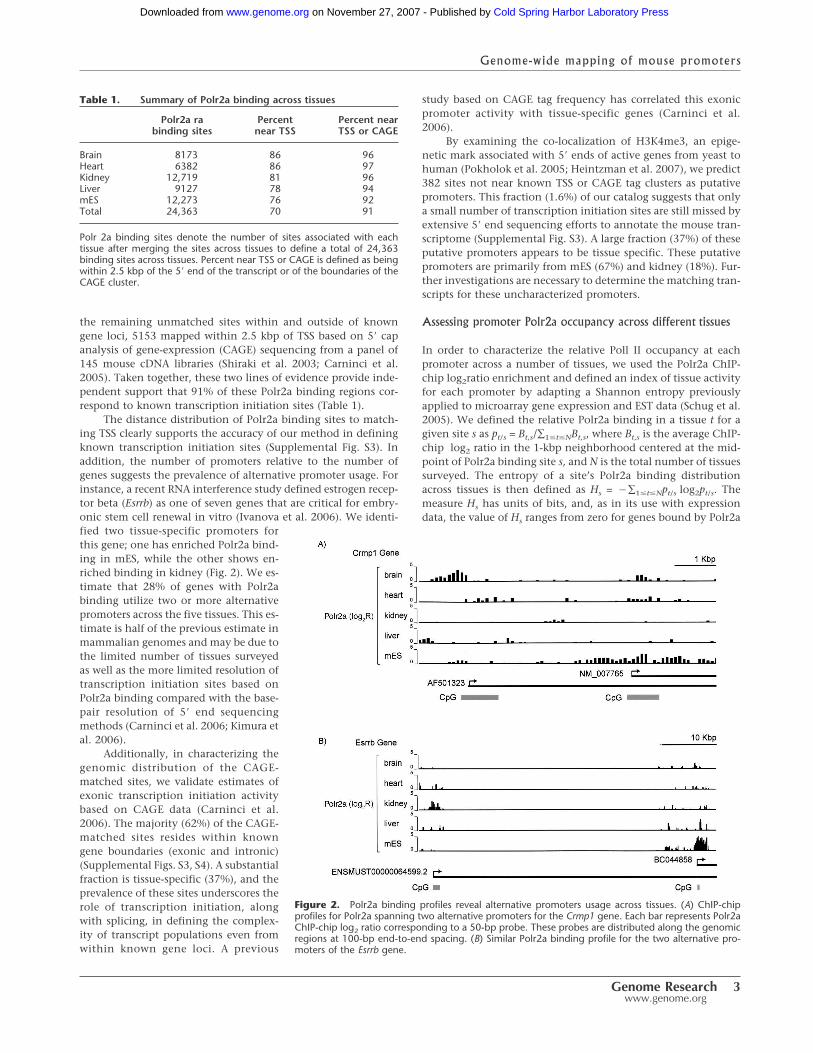
The distance distribution of Polr2a binding sites to match-ing TSS clearly supports the accuracy of our method in definingknown transcription initiation sites (Supplemental Fig. S3). Inaddition, the number of promoters relative to the number ofgenes suggests the prevalence of alternative promoter usage. Forinstance, a recent RNA interference study defined estrogen recep-tor beta (Esrrb) as one of seven genes that are critical for embry-onic stem cell renewal in vitro (Ivanova et al. 2006). We identi-fied two tissue-specific promoters forthis gene; one has enriched Polr2a bind-ing in mES, while the other shows en-riched binding in kidney (Fig. 2). We es-timate that 28% of genes with Polr2abinding utilize two or more alternativepromoters across the five tissues. This es-timate is half of the previous estimate inmammalian genomes and may be due tothe limited number of tissues surveyedas well as the more limited resolution oftranscription initiation sites based onPolr2a binding compared with the base-pair resolution of 5� end sequencingmethods (Carninci et al. 2006; Kimura etal. 2006).
Additionally, in characterizing thegenomic distribution of the CAGE-matched sites, we validate estimates ofexonic transcription initiation activitybased on CAGE data (Carninci et al.2006). The majority (62%) of the CAGE-matched sites resides within knowngene boundaries (exonic and intronic)(Supplemental Figs. S3, S4). A substantialfraction is tissue-specific (37%), and theprevalence of these sites underscores therole of transcription initiation, alongwith splicing, in defining the complex-ity of transcript populations even fromwithin known gene loci. A previous
study based on CAGE tag frequency has correlated this exonicpromoter activity with tissue-specific genes (Carninci et al.2006).
By examining the co-localization of H3K4me3, an epige-netic mark associated with 5� ends of active genes from yeast tohuman (Pokholok et al. 2005; Heintzman et al. 2007), we predict382 sites not near known TSS or CAGE tag clusters as putativepromoters. This fraction (1.6%) of our catalog suggests that onlya small number of transcription initiation sites are still missed byextensive 5� end sequencing efforts to annotate the mouse tran-scriptome (Supplemental Fig. S3). A large fraction (37%) of theseputative promoters appears to be tissue specific. These putativepromoters are primarily from mES (67%) and kidney (18%). Fur-ther investigations are necessary to determine the matching tran-scripts for these uncharacterized promoters.
Assessing promoter Polr2a occupancy across different tissues
In order to characterize the relative Poll II occupancy at eachpromoter across a number of tissues, we used the Polr2a ChIP-chip log2ratio enrichment and defined an index of tissue activityfor each promoter by adapting a Shannon entropy previouslyapplied to microarray gene expression and EST data (Schug et al.2005). We defined the relative Polr2a binding in a tissue t for agiven site s as pt/s = Bt,s/∑1�t�NBt,s, where Bt,s is the average ChIP-chip log2 ratio in the 1-kbp neighborhood centered at the mid-point of Polr2a binding site s, and N is the total number of tissuessurveyed. The entropy of a site’s Polr2a binding distributionacross tissues is then defined as Hs = �∑1�t�Npt/s log2pt/s. Themeasure Hs has units of bits, and, as in its use with expressiondata, the value of Hs ranges from zero for genes bound by Polr2a
Figure 2. Polr2a binding profiles reveal alternative promoters usage across tissues. (A) ChIP-chipprofiles for Polr2a spanning two alternative promoters for the Crmp1 gene. Each bar represents Polr2aChIP-chip log2 ratio corresponding to a 50-bp probe. These probes are distributed along the genomicregions at 100-bp end-to-end spacing. (B) Similar Polr2a binding profile for the two alternative pro-moters of the Esrrb gene.
Table 1. Summary of Polr2a binding across tissues
Polr2a rabinding sites
Percentnear TSS
Percent nearTSS or CAGE
Brain 8173 86 96Heart 6382 86 97Kidney 12,719 81 96Liver 9127 78 94mES 12,273 76 92Total 24,363 70 91
Polr 2a binding sites denote the number of sites associated with eachtissue after merging the sites across tissues to define a total of 24,363binding sites across tissues. Percent near TSS or CAGE is defined as beingwithin 2.5 kbp of the 5� end of the transcript or of the boundaries of theCAGE cluster.
Genome-wide mapping of mouse promoters
Genome Research 3www.genome.org
Cold Spring Harbor Laboratory Press on November 27, 2007 - Published by www.genome.orgDownloaded from
in a single tissue to log2(N) for sites bound uniformly in alltissues surveyed. We also adapted the companion measure of“categorical tissue-specificity” to characterize the bias of a Polr2abinding site for a particular tissue de-fined as Qs/t = Hs � log2(pt/s). This indexalso has units of bits and as before has aminimum of zero when a site is boundby Polr2a predominantly in the tissue andgrows without bound as the relative bind-ing of Polr2a in that tissue goes to zero.
We used these measures of entropyand categorical tissue-specificity to as-sess the usage of all Polr2a binding sitesacross tissues. When applied to sites notmatched to known mRNAs but nearknown microRNAs (miRNAs), 10 of 19matched miRNAs were classified as tis-sue-specific. Recent studies have pro-vided evidence that miRNAs play a piv-otal role in defining tissue- and cell-specific expression patterns (Table 2; Am-bros 2004; Lim et al. 2005). Indeed, sevenof the 10 promoters we defined as tissue-specific for the miRNA were cloned fromthe corresponding tissue source or theclosely related tissue source, in the case ofmES and testis (Griffiths-Jones et al. 2006).Two of these tissue-specific miRNAs havebeen shown to down-regulate a largenumber of mRNAs in human: miR-124transfection in HeLa cells shifted the ex-pression profile toward that of brain,while miR-1 shifted the expression profileof HeLa cells toward heart and skeletalmuscles (Lim et al. 2005).
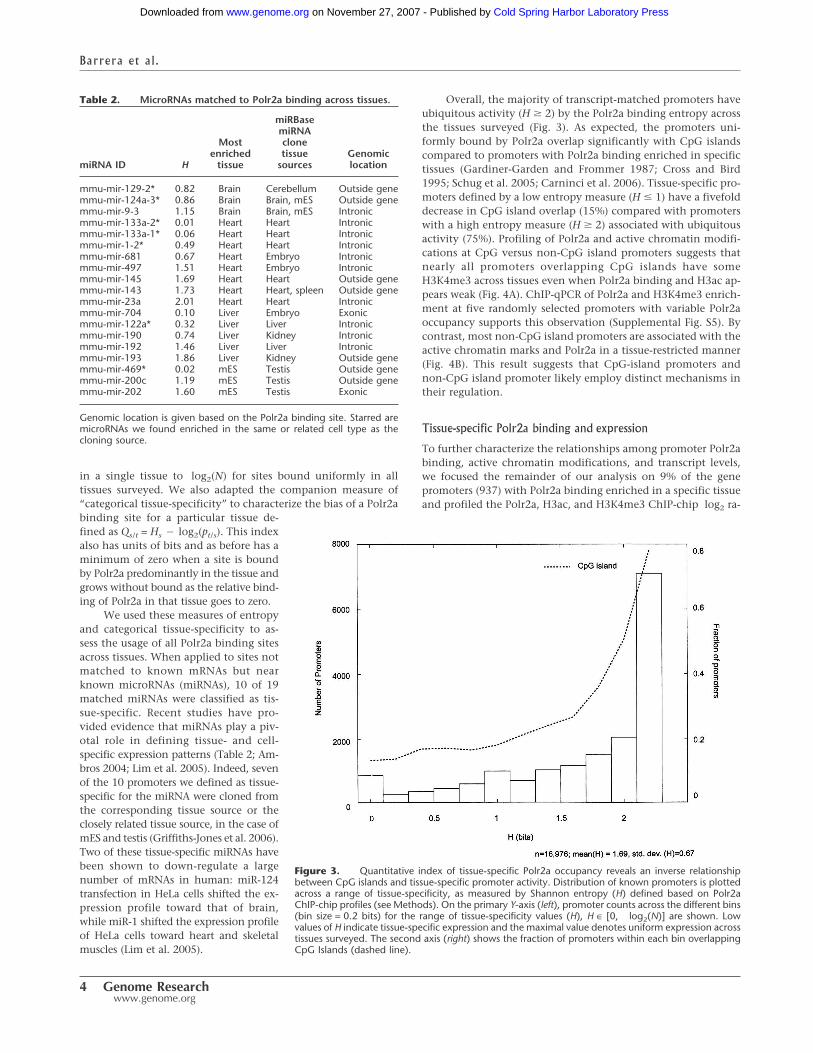
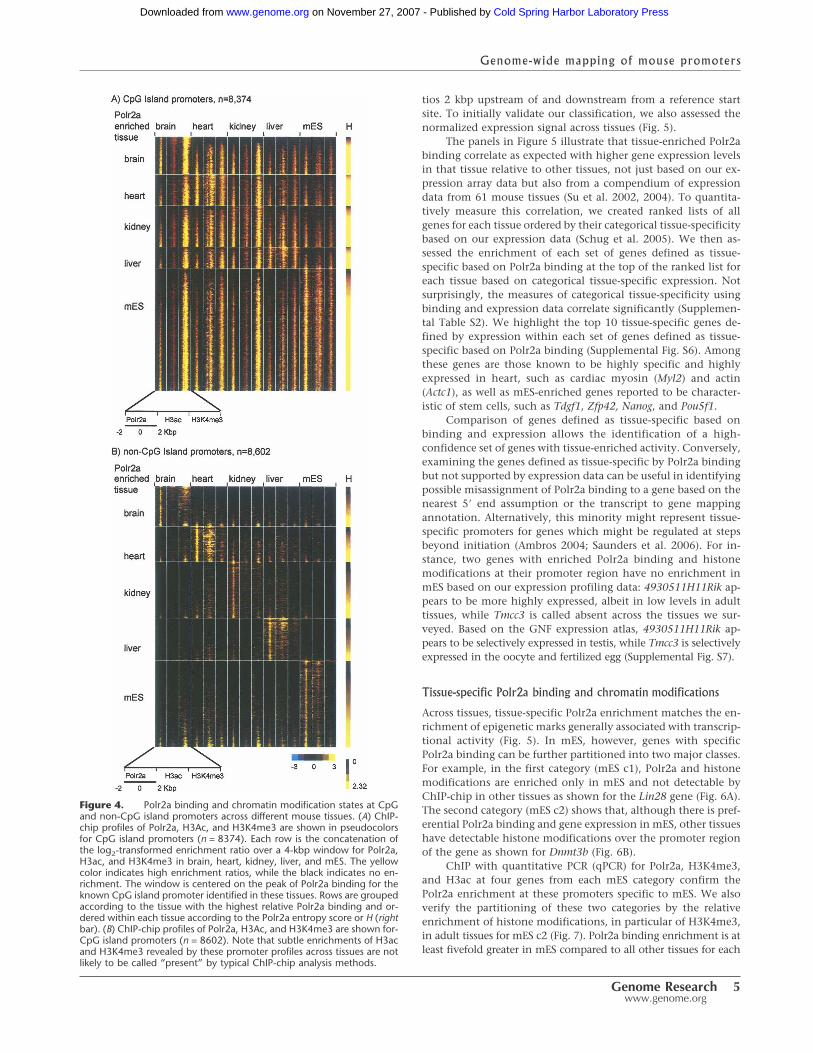
Overall, the majority of transcript-matched promoters haveubiquitous activity (H � 2) by the Polr2a binding entropy acrossthe tissues surveyed (Fig. 3). As expected, the promoters uni-formly bound by Polr2a overlap significantly with CpG islandscompared to promoters with Polr2a binding enriched in specifictissues (Gardiner-Garden and Frommer 1987; Cross and Bird1995; Schug et al. 2005; Carninci et al. 2006). Tissue-specific pro-moters defined by a low entropy measure (H � 1) have a fivefolddecrease in CpG island overlap (15%) compared with promoterswith a high entropy measure (H � 2) associated with ubiquitousactivity (75%). Profiling of Polr2a and active chromatin modifi-cations at CpG versus non-CpG island promoters suggests thatnearly all promoters overlapping CpG islands have someH3K4me3 across tissues even when Polr2a binding and H3ac ap-pears weak (Fig. 4A). ChIP-qPCR of Polr2a and H3K4me3 enrich-ment at five randomly selected promoters with variable Polr2aoccupancy supports this observation (Supplemental Fig. S5). Bycontrast, most non-CpG island promoters are associated with theactive chromatin marks and Polr2a in a tissue-restricted manner(Fig. 4B). This result suggests that CpG-island promoters andnon-CpG island promoter likely employ distinct mechanisms intheir regulation.
Tissue-specific Polr2a binding and expression
To further characterize the relationships among promoter Polr2abinding, active chromatin modifications, and transcript levels,we focused the remainder of our analysis on 9% of the genepromoters (937) with Polr2a binding enriched in a specific tissueand profiled the Polr2a, H3ac, and H3K4me3 ChIP-chip log2 ra-
Figure 3. Quantitative index of tissue-specific Polr2a occupancy reveals an inverse relationshipbetween CpG islands and tissue-specific promoter activity. Distribution of known promoters is plottedacross a range of tissue-specificity, as measured by Shannon entropy (H) defined based on Polr2aChIP-chip profiles (see Methods). On the primary Y-axis (left), promoter counts across the different bins(bin size = 0.2 bits) for the range of tissue-specificity values (H), H ∈ [0, log2(N)] are shown. Lowvalues of H indicate tissue-specific expression and the maximal value denotes uniform expression acrosstissues surveyed. The second axis (right) shows the fraction of promoters within each bin overlappingCpG Islands (dashed line).
Table 2. MicroRNAs matched to Polr2a binding across tissues.
miRNA ID H
Mostenriched
tissue
miRBasemiRNAclonetissue
sourcesGenomiclocation
mmu-mir-129-2* 0.82 Brain Cerebellum Outside genemmu-mir-124a-3* 0.86 Brain Brain, mES Outside genemmu-mir-9-3 1.15 Brain Brain, mES Intronicmmu-mir-133a-2* 0.01 Heart Heart Intronicmmu-mir-133a-1* 0.06 Heart Heart Intronicmmu-mir-1-2* 0.49 Heart Heart Intronicmmu-mir-681 0.67 Heart Embryo Intronicmmu-mir-497 1.51 Heart Embryo Intronicmmu-mir-145 1.69 Heart Heart Outside genemmu-mir-143 1.73 Heart Heart, spleen Outside genemmu-mir-23a 2.01 Heart Heart Intronicmmu-mir-704 0.10 Liver Embryo Exonicmmu-mir-122a* 0.32 Liver Liver Intronicmmu-mir-190 0.74 Liver Kidney Intronicmmu-mir-192 1.46 Liver Liver Intronicmmu-mir-193 1.86 Liver Kidney Outside genemmu-mir-469* 0.02 mES Testis Outside genemmu-mir-200c 1.19 mES Testis Outside genemmu-mir-202 1.60 mES Testis Exonic
Genomic location is given based on the Polr2a binding site. Starred aremicroRNAs we found enriched in the same or related cell type as thecloning source.
Barrera et al.
4 Genome Researchwww.genome.org
Cold Spring Harbor Laboratory Press on November 27, 2007 - Published by www.genome.orgDownloaded from
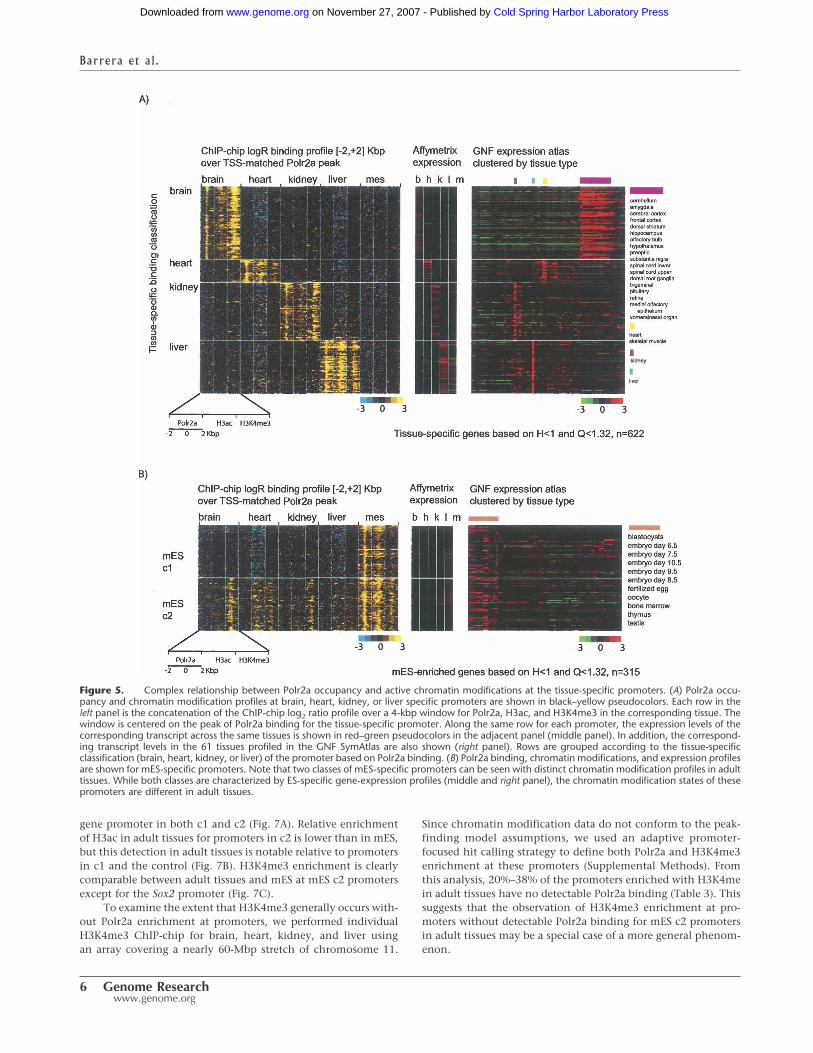
tios 2 kbp upstream of and downstream from a reference startsite. To initially validate our classification, we also assessed thenormalized expression signal across tissues (Fig. 5).
The panels in Figure 5 illustrate that tissue-enriched Polr2abinding correlate as expected with higher gene expression levelsin that tissue relative to other tissues, not just based on our ex-pression array data but also from a compendium of expressiondata from 61 mouse tissues (Su et al. 2002, 2004). To quantita-tively measure this correlation, we created ranked lists of allgenes for each tissue ordered by their categorical tissue-specificitybased on our expression data (Schug et al. 2005). We then as-sessed the enrichment of each set of genes defined as tissue-specific based on Polr2a binding at the top of the ranked list foreach tissue based on categorical tissue-specific expression. Notsurprisingly, the measures of categorical tissue-specificity usingbinding and expression data correlate significantly (Supplemen-tal Table S2). We highlight the top 10 tissue-specific genes de-fined by expression within each set of genes defined as tissue-specific based on Polr2a binding (Supplemental Fig. S6). Amongthese genes are those known to be highly specific and highlyexpressed in heart, such as cardiac myosin (Myl2) and actin(Actc1), as well as mES-enriched genes reported to be character-istic of stem cells, such as Tdgf1, Zfp42, Nanog, and Pou5f1.
Comparison of genes defined as tissue-specific based onbinding and expression allows the identification of a high-confidence set of genes with tissue-enriched activity. Conversely,examining the genes defined as tissue-specific by Polr2a bindingbut not supported by expression data can be useful in identifyingpossible misassignment of Polr2a binding to a gene based on thenearest 5� end assumption or the transcript to gene mappingannotation. Alternatively, this minority might represent tissue-specific promoters for genes which might be regulated at stepsbeyond initiation (Ambros 2004; Saunders et al. 2006). For in-stance, two genes with enriched Polr2a binding and histonemodifications at their promoter region have no enrichment inmES based on our expression profiling data: 4930511H11Rik ap-pears to be more highly expressed, albeit in low levels in adulttissues, while Tmcc3 is called absent across the tissues we sur-veyed. Based on the GNF expression atlas, 4930511H11Rik ap-pears to be selectively expressed in testis, while Tmcc3 is selectivelyexpressed in the oocyte and fertilized egg (Supplemental Fig. S7).
Tissue-specific Polr2a binding and chromatin modifications
Across tissues, tissue-specific Polr2a enrichment matches the en-richment of epigenetic marks generally associated with transcrip-tional activity (Fig. 5). In mES, however, genes with specificPolr2a binding can be further partitioned into two major classes.For example, in the first category (mES c1), Polr2a and histonemodifications are enriched only in mES and not detectable byChIP-chip in other tissues as shown for the Lin28 gene (Fig. 6A).The second category (mES c2) shows that, although there is pref-erential Polr2a binding and gene expression in mES, other tissueshave detectable histone modifications over the promoter regionof the gene as shown for Dnmt3b (Fig. 6B).
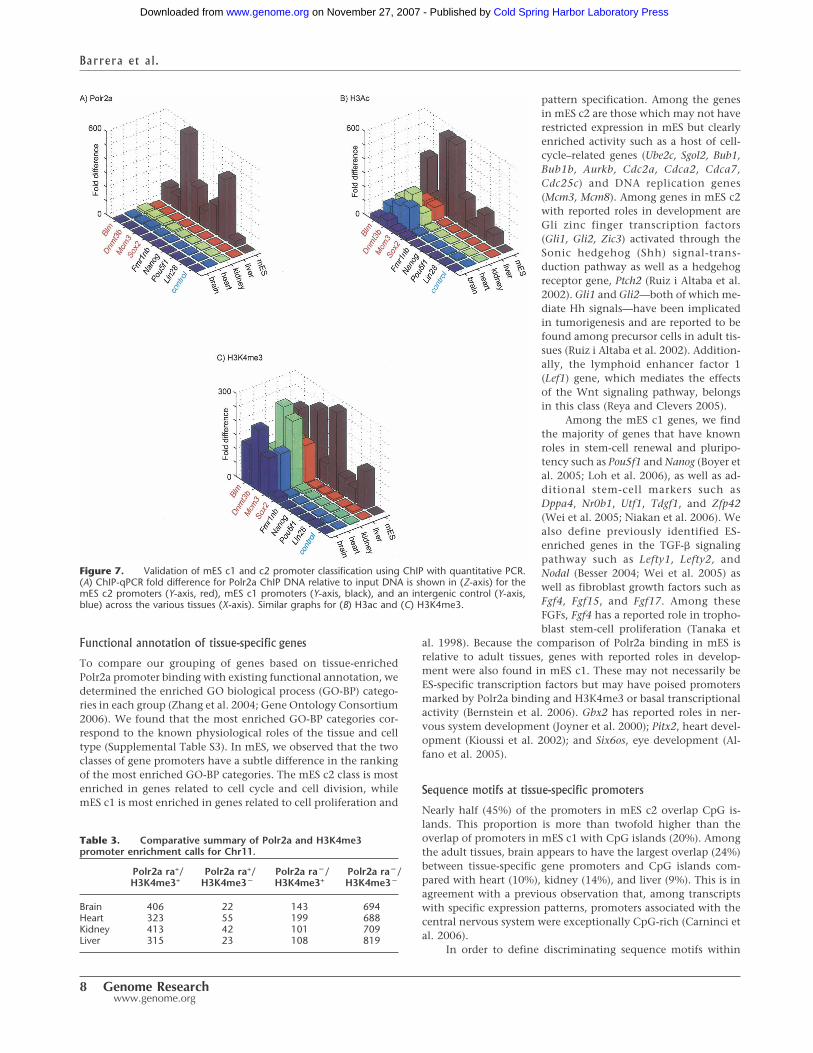
ChIP with quantitative PCR (qPCR) for Polr2a, H3K4me3,and H3ac at four genes from each mES category confirm thePolr2a enrichment at these promoters specific to mES. We alsoverify the partitioning of these two categories by the relativeenrichment of histone modifications, in particular of H3K4me3,in adult tissues for mES c2 (Fig. 7). Polr2a binding enrichment is atleast fivefold greater in mES compared to all other tissues for each
Figure 4. Polr2a binding and chromatin modification states at CpGand non-CpG island promoters across different mouse tissues. (A) ChIP-chip profiles of Polr2a, H3Ac, and H3K4me3 are shown in pseudocolorsfor CpG island promoters (n = 8374). Each row is the concatenation ofthe log2-transformed enrichment ratio over a 4-kbp window for Polr2a,H3ac, and H3K4me3 in brain, heart, kidney, liver, and mES. The yellowcolor indicates high enrichment ratios, while the black indicates no en-richment. The window is centered on the peak of Polr2a binding for theknown CpG island promoter identified in these tissues. Rows are groupedaccording to the tissue with the highest relative Polr2a binding and or-dered within each tissue according to the Polr2a entropy score or H (rightbar). (B) ChIP-chip profiles of Polr2a, H3Ac, and H3K4me3 are shown for-CpG island promoters (n = 8602). Note that subtle enrichments of H3acand H3K4me3 revealed by these promoter profiles across tissues are notlikely to be called “present” by typical ChIP-chip analysis methods.
Genome-wide mapping of mouse promoters
Genome Research 5www.genome.org
Cold Spring Harbor Laboratory Press on November 27, 2007 - Published by www.genome.orgDownloaded from
gene promoter in both c1 and c2 (Fig. 7A). Relative enrichmentof H3ac in adult tissues for promoters in c2 is lower than in mES,but this detection in adult tissues is notable relative to promotersin c1 and the control (Fig. 7B). H3K4me3 enrichment is clearlycomparable between adult tissues and mES at mES c2 promotersexcept for the Sox2 promoter (Fig. 7C).
To examine the extent that H3K4me3 generally occurs with-out Polr2a enrichment at promoters, we performed individualH3K4me3 ChIP-chip for brain, heart, kidney, and liver usingan array covering a nearly 60-Mbp stretch of chromosome 11.
Since chromatin modification data do not conform to the peak-finding model assumptions, we used an adaptive promoter-focused hit calling strategy to define both Polr2a and H3K4me3enrichment at these promoters (Supplemental Methods). Fromthis analysis, 20%–38% of the promoters enriched with H3K4mein adult tissues have no detectable Polr2a binding (Table 3). Thissuggests that the observation of H3K4me3 enrichment at pro-moters without detectable Polr2a binding for mES c2 promotersin adult tissues may be a special case of a more general phenom-enon.
Figure 5. Complex relationship between Polr2a occupancy and active chromatin modifications at the tissue-specific promoters. (A) Polr2a occu-pancy and chromatin modification profiles at brain, heart, kidney, or liver specific promoters are shown in black–yellow pseudocolors. Each row in theleft panel is the concatenation of the ChIP-chip log2 ratio profile over a 4-kbp window for Polr2a, H3ac, and H3K4me3 in the corresponding tissue. Thewindow is centered on the peak of Polr2a binding for the tissue-specific promoter. Along the same row for each promoter, the expression levels of thecorresponding transcript across the same tissues is shown in red–green pseudocolors in the adjacent panel (middle panel). In addition, the correspond-ing transcript levels in the 61 tissues profiled in the GNF SymAtlas are also shown (right panel). Rows are grouped according to the tissue-specificclassification (brain, heart, kidney, or liver) of the promoter based on Polr2a binding. (B) Polr2a binding, chromatin modifications, and expression profilesare shown for mES-specific promoters. Note that two classes of mES-specific promoters can be seen with distinct chromatin modification profiles in adulttissues. While both classes are characterized by ES-specific gene-expression profiles (middle and right panel), the chromatin modification states of thesepromoters are different in adult tissues.
Barrera et al.
6 Genome Researchwww.genome.org
Cold Spring Harbor Laboratory Press on November 27, 2007 - Published by www.genome.orgDownloaded from
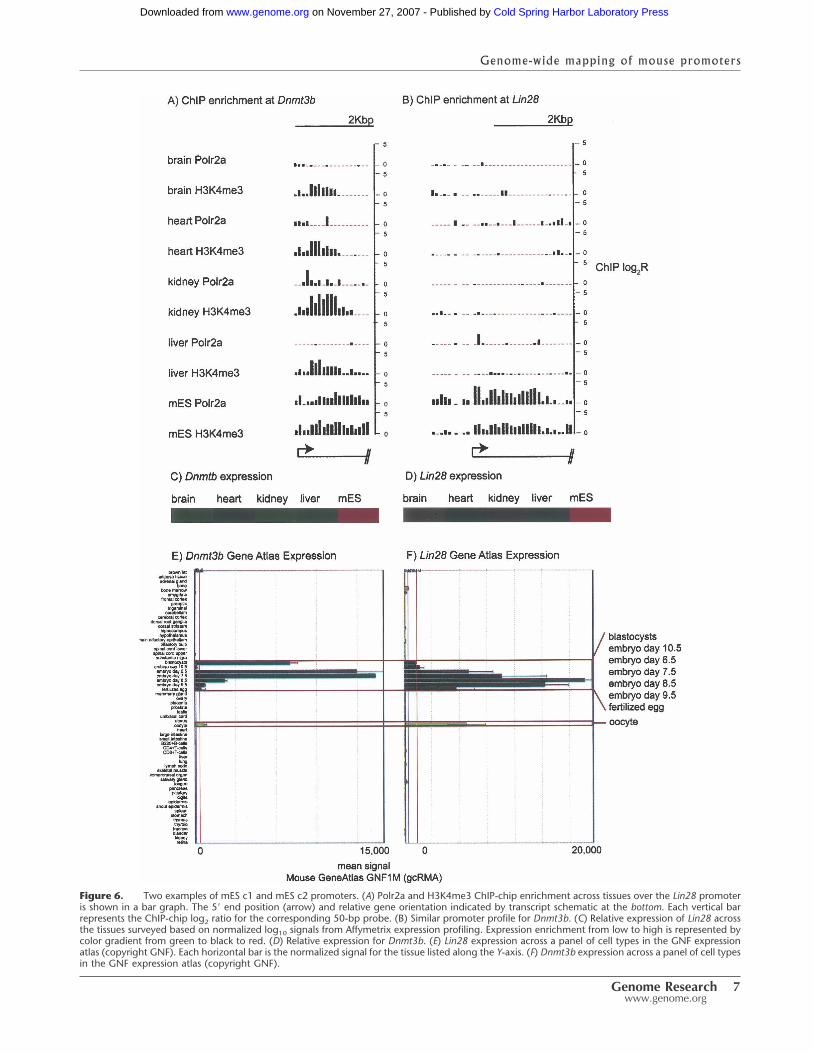
Figure 6. Two examples of mES c1 and mES c2 promoters. (A) Polr2a and H3K4me3 ChIP-chip enrichment across tissues over the Lin28 promoteris shown in a bar graph. The 5� end position (arrow) and relative gene orientation indicated by transcript schematic at the bottom. Each vertical barrepresents the ChIP-chip log2 ratio for the corresponding 50-bp probe. (B) Similar promoter profile for Dnmt3b. (C) Relative expression of Lin28 acrossthe tissues surveyed based on normalized log10 signals from Affymetrix expression profiling. Expression enrichment from low to high is represented bycolor gradient from green to black to red. (D) Relative expression for Dnmt3b. (E) Lin28 expression across a panel of cell types in the GNF expressionatlas (copyright GNF). Each horizontal bar is the normalized signal for the tissue listed along the Y-axis. (F) Dnmt3b expression across a panel of cell typesin the GNF expression atlas (copyright GNF).
Genome-wide mapping of mouse promoters
Genome Research 7www.genome.org
Cold Spring Harbor Laboratory Press on November 27, 2007 - Published by www.genome.orgDownloaded from
Functional annotation of tissue-specific genes
To compare our grouping of genes based on tissue-enrichedPolr2a promoter binding with existing functional annotation, wedetermined the enriched GO biological process (GO-BP) catego-ries in each group (Zhang et al. 2004; Gene Ontology Consortium2006). We found that the most enriched GO-BP categories cor-respond to the known physiological roles of the tissue and celltype (Supplemental Table S3). In mES, we observed that the twoclasses of gene promoters have a subtle difference in the rankingof the most enriched GO-BP categories. The mES c2 class is mostenriched in genes related to cell cycle and cell division, whilemES c1 is most enriched in genes related to cell proliferation and
pattern specification. Among the genesin mES c2 are those which may not haverestricted expression in mES but clearlyenriched activity such as a host of cell-cycle–related genes (Ube2c, Sgol2, Bub1,Bub1b, Aurkb, Cdc2a, Cdca2, Cdca7,Cdc25c) and DNA replication genes(Mcm3, Mcm8). Among genes in mES c2with reported roles in development areGli zinc finger transcription factors(Gli1, Gli2, Zic3) activated through theSonic hedgehog (Shh) signal-trans-duction pathway as well as a hedgehogreceptor gene, Ptch2 (Ruiz i Altaba et al.2002). Gli1 and Gli2—both of which me-diate Hh signals—have been implicatedin tumorigenesis and are reported to befound among precursor cells in adult tis-sues (Ruiz i Altaba et al. 2002). Addition-ally, the lymphoid enhancer factor 1(Lef1) gene, which mediates the effectsof the Wnt signaling pathway, belongsin this class (Reya and Clevers 2005).
Among the mES c1 genes, we findthe majority of genes that have knownroles in stem-cell renewal and pluripo-tency such as Pou5f1 and Nanog (Boyer etal. 2005; Loh et al. 2006), as well as ad-ditional stem-cell markers such asDppa4, Nr0b1, Utf1, Tdgf1, and Zfp42(Wei et al. 2005; Niakan et al. 2006). Wealso define previously identified ES-enriched genes in the TGF-� signalingpathway such as Lefty1, Lefty2, andNodal (Besser 2004; Wei et al. 2005) aswell as fibroblast growth factors such asFgf4, Fgf15, and Fgf17. Among theseFGFs, Fgf4 has a reported role in tropho-blast stem-cell proliferation (Tanaka et
al. 1998). Because the comparison of Polr2a binding in mES isrelative to adult tissues, genes with reported roles in develop-ment were also found in mES c1. These may not necessarily beES-specific transcription factors but may have poised promotersmarked by Polr2a binding and H3K4me3 or basal transcriptionalactivity (Bernstein et al. 2006). Gbx2 has reported roles in ner-vous system development (Joyner et al. 2000); Pitx2, heart devel-opment (Kioussi et al. 2002); and Six6os, eye development (Al-fano et al. 2005).
Sequence motifs at tissue-specific promoters
Nearly half (45%) of the promoters in mES c2 overlap CpG is-lands. This proportion is more than twofold higher than theoverlap of promoters in mES c1 with CpG islands (20%). Amongthe adult tissues, brain appears to have the largest overlap (24%)between tissue-specific gene promoters and CpG islands com-pared with heart (10%), kidney (14%), and liver (9%). This is inagreement with a previous observation that, among transcriptswith specific expression patterns, promoters associated with thecentral nervous system were exceptionally CpG-rich (Carninci etal. 2006).
In order to define discriminating sequence motifs within
Table 3. Comparative summary of Polr2a and H3K4me3promoter enrichment calls for Chr11.
Polr2a ra+/H3K4me3+
Polr2a ra+/H3K4me3�
Polr2a ra�/H3K4me3+
Polr2a ra�/H3K4me3�
Brain 406 22 143 694Heart 323 55 199 688Kidney 413 42 101 709Liver 315 23 108 819
Figure 7. Validation of mES c1 and c2 promoter classification using ChIP with quantitative PCR.(A) ChIP-qPCR fold difference for Polr2a ChIP DNA relative to input DNA is shown in (Z-axis) for themES c2 promoters (Y-axis, red), mES c1 promoters (Y-axis, black), and an intergenic control (Y-axis,blue) across the various tissues (X-axis). Similar graphs for (B) H3ac and (C) H3K4me3.
Barrera et al.
8 Genome Researchwww.genome.org
Cold Spring Harbor Laboratory Press on November 27, 2007 - Published by www.genome.orgDownloaded from

each tissue-specific promoter set, we used two complementarymotif-finding strategies. The first strategy measures motif enrich-ment in each tissue-promoter set relative to a background setbased on a balanced error measure which equally weighs a mo-tif’s ability to identify promoters in the set (sensitivity) and tocorrectly discriminate against promoters not in the set (specific-ity) (Smith et al. 2005, 2006, 2007). Using this strategy, we char-acterized the enrichment of known vertebrate motifs fromTRANSFAC (Matys et al. 2006) and JASPAR (Sandelin et al. 2004)in each tissue-specific promoter set relative to two types of back-ground promoter sets: (1) a random set of mouse promoters fromCSHLMPD (Xuan et al. 2005), and (2) the relative complement ofthe tissue-specific promoter set in the set of all tissue-specificpromoters (Table 4). To identify novel motifs in each tissue-specific promoter set, we used a previously described de novomotif finder, DME (Smith et al. 2005, 2006, 2007). We evaluatedthe significance of these novel motifs using the same misclassi-fication metric and report the novel motifs for each set (Table 4).To complement this strategy, we also used relative overrepresen-tation of conserved occurrences to define characteristic motifs foreach tissue set. By these methods, we identified binding sites fortranscription factors with previously reported roles in the specific
tissue or cell type, as well as others whose roles remain unclear orwhose binding domains appear similar to those of transcriptionfactors with reported roles in that tissue (Table 4).
Discussion
One of the first steps toward a comprehensive understanding ofthe mechanisms of cell diversity is to define and profile the activepromoters in different cell types. Here we describe an integratedapproach for profiling the epigenetic and sequence features ofactive promoters in mouse embryonic stem cells and four adultorgans. We defined 24,363 Pol II binding sites that include16,976 annotated 5� ends of known transcripts and 5153 TSSpreviously supported by CAGE evidence alone. We confirmedwidespread usage of alternative promoters by mammalian genes,and identified over four thousand promoters as tissue-specific.These tissue-specific promoters led to the identification of tran-scription factor motifs for genes with tissue-specific expression.Our results also reveal complex relationships among Polr 2abinding, chromatin modifications, and gene expression in differ-ent tissues. We showed that most CpG island promoters are asso-
Table 4. Summary of known and novel motifs identified in each tissue using a relative conservation metric and a balancedmisclassification metric.
Tissue Factor(s) Motif(s) Selected reference(s)
Brain Amt-Ahr MA0006 Swanson et al. (1995)Aitola and Pelto-Huikko (2003)
ATF M00691|V$ATF1_Q6, M00017|V$ATF_01, M00179|V$CREBP1_Q2 Herdegen and Leah (1998)CREB M00039|V$CREB_01, M00040|V$CREBP1_01, M00041|V$CREBP1CJUN_01,
M00041|V$CREB_02, M00177|V$CREB_Q2, M00178|V$CREB_Q4,M00916|V$CREB_Q2_01, M00917|V$CREB_Q4_01, MA0018
Herdegen and Leah (1998)Walton and Dragunow (2000)
CREB, ATF M00801|V$CREB_Q3, M00981|V$CREBATF_Q6 Walton and Dragunow (2000)E2F M00803|V$E2F_Q2 Dabrowski et al. (2006)Egr2 M00246|V$EGR2_01 O’Donovan et al. (1999)Myb MA0100 Shin et al. (2001)Nfil3 M00045|V$E4BP4_01 Junghans et al. (2004)NRSF M00256|V$NRSF_01 Schoenherr and Anderson (1995)Rfx5 M00626|V$EFC_Q6 Durand et al. (2000)
Blackshear et al. (2003)SMAD M00974|V$SMAD_Q6_01 Nakashima et al. (1999)
Rodriguez et al. (2001)Unknown DME21|DGGVDRGAGSWR
Heart AP4 M00175|V$AP4_Q5 Flink et al. (1992)Smith and Lomax (1993)Apone and Hauschka (1995)
MEF2 M00232|V$MEF2_03 Wasserman and Fickett (1998)Smith et al. (2005, 2007)
Muscle TBP motif M00320|V$MTATA_B Diagana et al. (1997)RORA M00156|V$RORA1_01, MA0071 Megy et al. (2002)Sf1 M00727|V$SF1_Q6SRF M00215|V$SRF_C Wasserman and Fickett (1998)
Smith et al. (2005, 2007)Unknown DME10|SAGRRBAKRGRM, DME8|MVRGGRCAGR
Kidney HNF1 M00132|V$HNF1_01, M00790|V$HNF1_Q6,M01011|V$HNF1_Q6_01, MA0046
Senkel et al. (2005)
Pax2 M00098|V$PAX2_01 Schedl and Hastie (2000)Unknown DME11|SAKSKCTGKS
Liver Cutl1 M00104|V$CDPCR1_01HNF4 MA0114 Smith et al. (2005, 2007)PPAR, HNF4, COUP, RAR M00762|V$DR1_Q3 Smith et al. (2005, 2007)Unknown DME27|WSDGARABSYWG
mES c1 Unknown DME6|WABYCCWGMAmES c2 E2F1 M00940|V$E2F1_Q6_01 Stead et al. (2002)
Myc-Max M00118|V$MYCMAX_01 Takahashi and Yamanaka (2006)
Significant motifs identified using the relative conservation metric are based on a P value threshold which takes into account the number of motifs andtissues tested (P value cutoff < 1/(motifs � tissues)). Error-rate P values do not require multiple testing adjustment and are filtered at P < 0.05.
Genome-wide mapping of mouse promoters
Genome Research 9www.genome.org
Cold Spring Harbor Laboratory Press on November 27, 2007 - Published by www.genome.orgDownloaded from
ciated with Polr2a and active chromatin marks in nearly all thetissues, but non-CpG island promoters are accompanied with theactive chromatin marks and Polr2a in a highly tissue-restrictedmanner. For most tissue-specific promoters, there is a general cor-respondence between Polr2a binding and presence of active chro-matin marks at the promoters. However, a subset of ES cell genepromoters are persistently marked by active chromatin modifica-tions even in the absence of detectable Polr2a binding in adulttissues. Therefore, distinct mechanisms of gene regulation appear tobe involved in CpG and non-CpG promoters and at different classesof tissue specific promoters.
To characterize the tissue-specificity of factor binding byChIP-chip at promoters, we adapted a quantitative index basedon Shannon entropy (Schug et al. 2005). This strategy overcomessome of the limitations associated with ChIP-chip technology.The current emphasis on “bound” versus “unbound” sites inChIP-chip analysis sacrifices sensitivity for specificity in definingsites associated with a particular factor. This naïve binary classi-fication becomes especially problematic, however, when compar-ing factor occupancy at genomic sites across cell types or condi-tions. Further development of quantitative measures of relativeChIP-enrichment for a factor’s genomic localization acrosssamples or conditions will be critical in circumventing these is-sues.
We used two complementary approaches—classificationand conservation—to define the sequence motifs associated withtissue-specific promoters based on our entropy measure. Al-though we identified known motifs previously associated withthese tissue-specific promoters, none of the novel motifs definedbased on classification ability was significantly enriched based onthe strict conservation metric. In particular, conservation did notsupport the novel motif, which was the only motif identified inmES c1. In general, promoters with mES-enriched activity werecharacterized by a dearth of significant motifs, known and novel,relative to adult tissues. Although our limited motif results inmES cells may reflect the bias of existing motif databases and thelimitations of our motif-analyses strategies, we posit that long-range or distal regulatory elements might play a more critical rolein regulating the expression of enriched transcripts in ES cells.
Although in general there are close associations amongPolr2a binding, histone modifications, and transcript levels atmost tissue-specific promoters, we showed H3K4me3 enrich-ment at a substantial fraction of promoters with weak to unde-tectable Polr2a occupancy in adult tissues. This trend is strikingfor roughly half of the promoters defined as mES-specific basedon Polr2a binding and gene expression (mES c2). These promot-ers with enriched activity in mES remain epigenetically markedby H3ac and H3K4me3 in adult tissues even without detectablePolr2a binding. Modifications associated with transcriptional ac-tivity, in particular H3K4me3, have been suggested to play addi-tional roles as markers of recent transcription or poised activa-tion at promoters, directly or indirectly inhibiting other forms ofchromatin-mediated repression (Kouskouti and Talianidis 2005;Bernstein et al. 2006; Roh et al. 2006; Ruthenburg et al. 2007;Weber et al. 2007). Subtle differences in the known function andidentity of genes between the two mES classes reveal moreknown mouse embryonic stem-cell markers within mES c1(Nanog, Pouf51, Dppa4, Nr0b1, Utf1, Tdgf1). Promoters in mES c2might be associated with a unique set of genes, such as the Glizinc finger transcription factors, expressed at low levels, or in asmall subset of cell types, within adult tissues (Ruiz i Altaba et al.2002). The mES c2 category, relative to its complement among
promoters with mES enriched activity, is distinguished by a two-fold higher overlap with CpG islands (45%). This sequence dis-tinction might provide a clue to understanding this class and itsregulation (Roh et al. 2006; Weber et al. 2007). Further work isunderway to more precisely characterize this phenomenon andits extent.
Our approach toward understanding tissue-specific gene ex-pression integrates Polr2a binding, chromatin modifications,and sequence features of promoters with measurements of rela-tive transcript abundance. The genomic maps of Polr 2a bindingand chromatin modifications will be valuable resources thatcomplement profiles of transcript levels and abundance for un-raveling the layers of control governing gene expression patternsacross cell types. Mapping these features at additional cell typesat various developmental stages will likely provide further insightas to how cell-specific programs of expression are specified bysequence and epigenetic features across development.
Methods
Sample preparationR1 ES cells (a gift from Dr. Don Cleveland, Ludwig Institute forCancer Research, San Diego) were maintained on top of feedercells in a cell culture dish with DMEM high-glucose mediumsupplemented with 15% FBS, 0.1 mM nonessential amino acid, 1mM sodium pyruvate, 1 µM �-mercaptoethanol, 2 mM L-glutamine, 50 g/mL pen/strep, and LIF. Cells were passed once on0.1% gelatin without feeder cells before being harvested. Cellswere harvested and cross-linked with 1% formaldehyde for 20min when they reached ∼80% confluence on the plates. Mousetissues were dissected from a female BL6 mouse at 10–12 wk,chopped into small pieces (∼1 mm3) with a razor blade in cold1� PBS, and cross-linked with 1% formaldehyde for 30 min atroom temperature. All samples were then sonicated according topreviously described protocols (Li et al. 2003).
Chromatin immunoprecipitation with microarrays (ChIP-chip)Chromatin immunoprecipitation was performed as previouslydescribed (Li et al. 2003). Briefly, 2 mg of sonicated chromatin(OD260) was incubated with 10 µg of antibody (anti-RNA poly-merase II, MMS-126R, Covance; anti-AcH3, 06-599, Upstate; anti-Me3H3K4, 07-473, Upstate) coupled to the IgG magnetic beads(Dynal Biotech). The magnetic beads were washed eight timeswith RIPA buffer (50 mM HEPES at pH 8.0, 1 mM EDTA, 1%NP-40, 0.7% DOC, and 0.5 M LiCl, supplemented with Completeprotease inhibitors from Roche Applied Science), and washedonce with TE (10 mM Tris at pH 8.0, 1 mM EDTA). After washing,the bound DNA was eluted at 65°C in elution buffer (10 mM Trisat pH 8.0, 1 mM EDTA, and 1% SDS). The eluted DNA was incu-bated at 65°C overnight to reverse the cross-links. Following in-cubation, the immunoprecipitated DNA was treated sequentiallywith Proteinase K and RNase A and was then desalted using theQIAquick PCR purification kit (Qiagen). The purified DNA wasblunt ended using T4 polymerase (New England Biolabs) andligated to the linkers (oJW102, 5�-GCGGTGACCCGGGAGATCTGAATTC-3�, and oJW103, 5�-GAATTCAGATC-3�). The ligatedDNA was subjected to ligation-mediated PCR, labeled with Cy3and Cy5 dCTP using a BioPrime DNA labeling kit (Invitrogen),and hybridized to the mouse genome tiling microarray.
The 37 genome-scan tiling array set containing 14.3 50-meroligonucleotides, positioned at every 100 bp were designed andfabricated using the maskless array synthesis technology (MAS)by NimbleGen Systems. These arrays were designed to contain all
Barrera et al.
10 Genome Researchwww.genome.org
Cold Spring Harbor Laboratory Press on November 27, 2007 - Published by www.genome.orgDownloaded from
the non-repetitive sequences throughout the mouse genome(NCBIv33, mm5).
Initial identification of Polr2a binding sites in five tissuesAfter scanning and image extraction, Cy5 (ChIP DNA) and Cy3(input) signal values for each of the 37 genome tiling arrays werenormalized by intensity-dependent Loess using the R packagelimma (Gentleman et al. 2004; Smyth 2005). Median filtering(window size=3 probes) was used to smooth log2 (Cy5/Cy3) dataacross the tiled regions. For each array, ChIP-enriched probe clus-ters were defined as regions with a minimum of four probes sepa-rated by a maximum of 500 bp with filtered log2R greater than2.5 standard deviations from the mean log ratio, as used in ourprevious study of TAF1 binding in the human genome (Kim et al.2005b).
The application of the analysis above for each genome-scantiling set corresponding to Polr2a ChIP-chip for each tissue re-sulted in five sets (brain, heart, kidney, liver, embryonic stemcells) of putative Polr2a binding regions in the mouse.
Condensed array ChIP-chipWe designed a condensed array by combining the five sets ofputative Polr2a binding regions from the five Polr2a genome-wide scans. Each binding region was extended by 2000 bp up-stream and downstream and overlapping regions from the Polr2aChIP-chip of different tissues were merged to yield a set of 32,482putative Polr2a binding regions for condensed array design.NimbleGen Systems used the same probe designs from the ge-nome-scan tiling set overlapping the 32,482 regions to synthe-size the condensed scan array set containing 1.5 million probesin four arrays.
We performed 15 ChIP-chip experiments over the con-densed array design for three factors (Polr2a, H3ac, H3K4me3)across five mouse tissues. After scanning and image extraction,Cy5 (ChIP DNA) and Cy3 (input) signal values for each of thefour condensed-scan tiling arrays (in each set) were normalizedby applying either intensity-dependent Loess or median-scalingnormalization with the correction based only on the intensitiesof 14,572 control probes (designated RANDOM_GC11_GC34).The R package limma was used to implement the normalization(Gentleman et al. 2004; Smyth 2005).
Final catalog of Polr2a binding sitesTo define a final catalog of Polr2a binding sites we applied animproved version of the peakfinding algorithm which we previ-ously used to define Taf1 binding in human IMR90 cells (Kim etal. 2005b; Zheng et al. 2005). This algorithm predicts a bindingsite for a factor at the probe-level resolution. The P value forsignificant peaks is based on the following test-statistic:
Yn =1
�n �i=1
n
Yi.
Here n is the number of probes in the window forming a trianglecentered at the predicted peak; Yi is the log ratio for probe iwithin the window. The algorithm does not use a prespecifiedwindow size but computes the statistic for all possible windowsof a certain size range containing triangles centered at the pre-dicted peak. We chose a P value cutoff of P < 0.05 to define sig-nificant peaks for Polr2a binding in both the condensed scan andgenome-wide scan for each tissue. We designated a peak inthe condensed scan as confirmed if the peak is predicted within500 bp of the peak identified in the genome-wide scan for each
tissue. We define the coordinates of the confirmed peaks as therange defined by the matching condensed scan peak and genomescan peak.
As a second step in defining a catalog of Polr2a binding sites,we pooled the confirmed peaks in each tissue and merged all thesites that are within 1000 bp of each other. This cutoff was basedon the distribution of nearest-neighbor distances between con-firmed peaks. Sites were then merged across tissues if there wasany base pair overlap. The Polr2a binding site is then defined asthe range of the confirmed peaks merged across tissues.
Expression analysisTo complement the Polr2a mapping strategy, we defined the setof genes with transcripts relatively enriched in each tissue. Weidentified these genes by analyzing the genome-wide expressionprofiles of the each tissue using Affymetrix GeneChip MouseGenome 430 2.0, which represents >39,000 mouse transcripts.Total RNA from each mouse tissue was extracted using Trizolreagent (Invitrogen, Carlsbad, CA) and further purified usingRNeasy Mini Kit (Qiagen, Valencia, CA) according to the manu-facturer’s recommendations. The purified total RNA was submit-ted to UCSD Cancer Center Microarray Resource for GeneChipRNA expression analysis using Mouse Genome 430 2.0 arrays.The resulting hybridization data were analyzed using AffymetrixGeneChip Operating Software (GCOS) v. 2.0 to determine thedetection call as present (P), marginal (M), or absent (A) at sig-nificance level P < 0.05.
We used annotation from the Affymetrix library fileMouse430_2.cdf to match probe sets to corresponding EntrezGene identifiers. Probe sets with identifier extension “x_at” wereremoved from the analysis. A total of 20,827 Entrez genes weremapped to the remaining probe sets. We performed quantile nor-malization on the probe set signals across tissues using the Rpackage, affy (Bolstad et al. 2003; Gentleman et al. 2004). Toassign a signal for a gene in each tissue, we selected the maxi-mum normalized expression signal of all probe sets matched tothe gene if there are multiple probe sets for a gene. Tissue-specificmeasures of entropy and categorical tissue-specificity based onexpression were computed as previously described (Schug et al.2005).
Promoter-focused ChIP-chip hit callingH3K4me3 ChIP-chip for each tissue was performed using thearray covering chr11:36,912,182–99,375,819. To circumvent is-sues in identifying sites of H3K4me3 enrichment, we developeda promoter-focused strategy to answer this question. We took theset of known promoters surveyed (refGene, knownGene, andensGene) and merged them into a non-redundant set of 1265nonoverlapping promoter regions 1 kbp wide [�500,+500] fromthe TSS. This set does not include bidirectional promoters toprevent potential mismatching of H3K4me3 and Polr2a enrich-ment at head-to-head promoters.
Every array for a tissue and marker (H3K4me3, Polr2a) com-bination was normalized using a recently reported sequence/GC-based normalization method, MA2C (Song et al. 2007). We re-analyzed corresponding Polr2a ChIP-chip array data for each tis-sue to make the results directly comparable. For each experiment,the average ChIP-chip log ratio in the 1-kbp window spanned byeach promoter was defined as its ChIP-chip enrichment index.The distributions of the average ChIP-chip log ratios over all thepromoters for all tissues, for both H3K4me3and Polr2a clearlyshow a bimodal distribution (mixture of two Gaussian dis-tributions). We used an expectation-maximization (EM) strategyfor estimating the parameters for a mixture of two Gaussians
Genome-wide mapping of mouse promoters
Genome Research 11www.genome.org
Cold Spring Harbor Laboratory Press on November 27, 2007 - Published by www.genome.orgDownloaded from
(http://www.mathworks.com/matlabcentral/fileexchange/loadFile.do?objectId=8636). A score cutoff for promoter ChIP en-richment is determined for each factor and tissue combinationbased on the estimated parameters of the null distribution cen-tered near 0. This cutoff is defined as two standard deviationsabove the mean.
Motif analysis
ClassificationWe identified motifs for each set of tissue-specific gene promot-ers by examining the relative over-representation of known ver-tebrate transcription factor binding site (TFBS) matrices based onTRANSFAC (Matys et al. 2006) and JASPAR (Sandelin et al. 2004)(673) in each set compared to two types of background sets: (1) arandom set of mammalian promoters or (2) the relative comple-ment of the set in the set of all tissue-specific gene promoters.The mES c2 set was excluded from the relative complement setsof tissue-specific promoters because its pattern of histone modi-fication enrichment was not tissue-specific. A previously de-scribed enumerative strategy, DME, was also used to determinethe highest ranked de novo discriminative motifs of differentwidths (w = 6, 8, 10, 12, 14) in each tissue-specific set comparedto each of the two types of background sets (Smith et al. 2005,2006).
For known and de novo motifs, a motif’s ability to classifythe foreground sequences from background sequences is mea-sured by the balanced misclassification error rate. This error rateis defined as:
Error Rate = 1 − ��Sensitivity + Specificity�
2 �.
Sensitivity is defined as the proportion of promoters in theforeground set containing the motif, and specificity is defined asthe proportion of promoters in the background set without themotif. The threshold for motif matching is optimized for eachmatrix to minimize the error rate.
The significance of the balanced misclassification error ratefor a motif (P value) is determined by estimating the expecteddistribution of the error rates for a given comparison.
ConservationGiven the set of known vertebrate TFBS matrices from TRANSFACand JASPAR (678), the best occurrence of each motif was mappedat every orthologous pair of promoter in mouse and human ineach tissue-specific set using the CREAD (http://rulai.cshl.edu/cread/index.shtml) utility storm. Promoter occurrences for allmotifs were filtered to those scoring above a functional depththreshold of 0.85:
Functional Depth =�Score − Minimum Possible Score�
�Maximum Possible Score − Minimum Possible Score�.
For every motif, we counted the number of promoters in whichthe best occurrence of the motif overlapped in the orthologousmouse and human promoters (aligned). We defined the totalnumber of orthologous promoter pairs as P, the total number oforthologous promoter pairs with conserved occurrences of a mo-tif m as C, the number of orthologous promoter pairs specific tothe tissue as T, and the number of orthologous promoter pairs inT with conserved occurrences of the motif as k. We then scoredthe tissue-enrichment of the conserved occurrences for each mo-tif (m) and for each tissue (t) by using the hypergeometric distri-bution (Tavazoie et al. 1999).
pm,t = 1 − �i=0
k �T
i ��P − T
C − i ��P
C�.
P values obtained from each of the 4038 tests (673 motifs, 6 tissuesets) were classified as significant based on a P value cutoff ofP < 1/4038 to account for multiple testing.
Please see Supplemental Methods for additional methodsand detailed explanations. For software used in expectation-maximization (EM) strategy for estimating parameters for a mix-ture of two Gaussians see http://www.mathworks.com/matlabcentral/fileexchange/loadFile.do?objectId=8636. For theCREAD utility storm, see http://rulai.cshl.edu/cread/index.shtml.
AcknowledgmentsWe thank Dr. Keith Ching for bioinformatics advice and GraceLiu for style suggestions. This research was supported in part bya Ford Foundation Pre-Doctoral Fellowship (L.O.B.); Ludwig In-stitute for Cancer Research (B.R.); R33CA105829 (B.R.),R21CA116365-01 (R.D.G.), and HG001696 (M.Q.Z.) from NIH;and EIA-0324292 (M.Q.Z.) from NSF.
References
Aitola, M.H. and Pelto-Huikko, M.T. 2003. Expression of Arnt and Arnt2mRNA in developing murine tissues. J. Histochem. Cytochem.51: 41–54.
Alberts, B., Johnson, A., Lewis, J., Raff, M., Roberts, K., and Walter, P.2002. Molecular biology of the cell. Garland Publishing, New York.
Alfano, G., Vitiello, C., Caccioppoli, C., Caramico, T., Carola, A., Szego,M.J., McInnes, R.R., Auricchio, A., and Banfi, S. 2005. Naturalantisense transcripts associated with genes involved in eyedevelopment. Hum. Mol. Genet. 14: 913–923.
Ambros, V. 2004. The functions of animal microRNAs. Nature431: 350–355.
Apone, S. and Hauschka, S.D. 1995. Muscle gene E-box controlelements. Evidence for quantitatively different transcriptionalactivities and the binding of distinct regulatory factors. J. Biol. Chem.270: 21420–21427.
Bernstein, B.E., Mikkelsen, T.S., Xie, X., Kamal, M., Huebert, D.J., Cuff,J., Fry, B., Meissner, A., Wernig, M., Plath, K., et al. 2006. A bivalentchromatin structure marks key developmental genes in embryonicstem cells. Cell 125: 315–326.
Besser, D. 2004. Expression of nodal, lefty-a, and lefty-B inundifferentiated human embryonic stem cells requires activation ofSmad2/3. J. Biol. Chem. 279: 45076–45084.
Blackshear, P.J., Graves, J.P., Stumpo, D.J., Cobos, I., Rubenstein, J.L.,and Zeldin, D.C. 2003. Graded phenotypic response to partial andcomplete deficiency of a brain-specific transcript variant of thewinged helix transcription factor RFX4. Development130: 4539–4552.
Bolstad, B.M., Irizarry, R.A., Astrand, M., and Speed, T.P. 2003. Acomparison of normalization methods for high densityoligonucleotide array data based on variance and bias. Bioinformatics19: 185–193.
Boyer, L.A., Lee, T.I., Cole, M.F., Johnstone, S.E., Levine, S.S., Zucker,J.P., Guenther, M.G., Kumar, R.M., Murray, H.L., Jenner, R.G., et al.2005. Core transcriptional regulatory circuitry in human embryonicstem cells. Cell 122: 947–956.
Brodsky, A.S., Meyer, C.A., Swinburne, I.A., Hall, G., Keenan, B.J., Liu,X.S., Fox, E.A., and Silver, P.A. 2005. Genomic mapping of RNApolymerase II reveals sites of co-transcriptional regulation in humancells. Genome Biol. 6: R64.
Carninci, P., Kasukawa, T., Katayama, S., Gough, J., Frith, M.C., Maeda,N., Oyama, R., Ravasi, T., Lenhard, B., Wells, C., et al. 2005. Thetranscriptional landscape of the mammalian genome. Science309: 1559–1563.
Carninci, P., Sandelin, A., Lenhard, B., Katayama, S., Shimokawa, K.,Ponjavic, J., Semple, C.A., Taylor, M.S., Engstrom, P.G., Frith, M.C.,et al. 2006. Genome-wide analysis of mammalian promoterarchitecture and evolution. Nat. Genet. 38: 626–635.
Barrera et al.
12 Genome Researchwww.genome.org
Cold Spring Harbor Laboratory Press on November 27, 2007 - Published by www.genome.orgDownloaded from
Cheng, C. and Sharp, P.A. 2003. RNA polymerase II accumulation in thepromoter-proximal region of the dihydrofolate reductase and �-actingenes. Mol. Cell. Biol. 23: 1961–1967.
Cross, S.H. and Bird, A.P. 1995. CpG islands and genes. Curr. Opin.Genet. Dev. 5: 309–314.
Dabrowski, M., Aerts, S., and Kaminska, B. 2006. Prediction of a key roleof motifs binding E2F and NR2F in down-regulation of numerousgenes during the development of the mouse hippocampus. BMCBioinformatics 7: 367. Doi: 10.1186/1471-2105-7-367.
Diagana, T.T., North, D.L., Jabet, C., Fiszman, M.Y., Takeda, S., andWhalen, R.G. 1997. The transcriptional activity of a muscle-specificpromoter depends critically on the structure of the TATA elementand its binding protein. J. Mol. Biol. 265: 480–493.
Durand, B., Vandaele, C., Spencer, D., Pantalacci, S., and Couble, P.2000. Cloning and characterization of dRFX, the Drosophila memberof the RFX family of transcription factors. Gene. 246: 285–293.
Flink, I.L., Edwards, J.G., Bahl, J.J., Liew, C.C., Sole, M., and Morkin, E.1992. Characterization of a strong positive cis-acting element of thehuman �-myosin heavy chain gene in fetal rat heart cells. J. Biol.Chem. 267: 9917–9924.
Gardiner-Garden, M. and Frommer, M. 1987. CpG islands in vertebrategenomes. J. Mol. Biol. 196: 261–282.
Gene Ontology Consortium. 2006. The Gene Ontology (GO) Project in2006. Nucleic Acids Res. 34: D322–D326. doi: 10.1093/nar/gkj021.
Gentleman, R.C., Carey, V.J., Bates, D.M., Bolstad, B., Dettling, M.,Dudoit, S., Ellis, B., Gautier, L., Ge, Y., Gentry, J., et al. 2004.Bioconductor: Open software development for computationalbiology and bioinformatics. Genome Biol. 5: R80. doi:10.1186/gb-2004-5-10-r80.
Griffiths-Jones, S., Grocock, R.J., van Dongen, S., Bateman, A., andEnright, A.J. 2006. miRBase: MicroRNA sequences, targets and genenomenclature. Nucleic Acids Res. 34: D140–D144. doi:10.1093/nar/gkj112.
Guenther, M.G., Levine, S.S., Boyer, L.A., Jaenisch, R., and Young, R.A.2007. A chromatin landmark and transcription initiation at mostpromoters in human cells. Cell 130: 77–88.
Guillemette, B., Bataille, A.R., Gevry, N., Adam, M., Blanchette, M.,Robert, F., and Gaudreau, L. 2005. Variant histone H2A.Z is globallylocalized to the promoters of inactive yeast genes and regulatesnucleosome positioning. PLoS Biol. 3: e384. doi:10.1371/journal.pbio.0030384.
Heintzman, N.D., Stuart, R.K., Hon, G., Fu, Y., Ching, C.W., Hawkins,R.D., Barrera, L.O., Van Calcar, S., Qu, C., Ching, K.A., et al. 2007.Distinct and predictive chromatin signatures of transcriptionalpromoters and enhancers in the human genome. Nat. Genet.39: 311–318.
Herdegen, T. and Leah, J.D. 1998. Inducible and constitutivetranscription factors in the mammalian nervous system: Control ofgene expression by Jun, Fos and Krox, and CREB/ATF proteins. BrainRes Rev. 28: 370–490.
Hinrichs, A.S., Karolchik, D., Baertsch, R., Barber, G.P., Bejerano, G.,Clawson, H., Diekhans, M., Furey, T.S., Harte, R.A., Hsu, F., et al.2006. The UCSC Genome Browser Database: Update 2006. NucleicAcids Res. 34: D590–D598. doi: 10.1093/nar/gkj144.
Ivanova, N., Dobrin, R., Lu, R., Kotenko, I., Levorse, J., Decoste, C.,Schafer, X., Lun, Y., and Lemischka, I.R. 2006. Dissectingself-renewal in stem cells with RNA interference. Nature442: 533–538.
Joyner, A.L., Liu, A., and Millet, S. 2000. Otx2, Gbx2 and Fgf8 interactto position and maintain a mid-hindbrain organizer. Curr. Opin. CellBiol. 12: 736–741.
Junghans, D., Chauvet, S., Buhler, E., Dudley, K., Sykes, T., andHenderson, C.E. 2004. The CES-2-related transcription factor E4BP4is an intrinsic regulator of motoneuron growth and survival.Development. 131: 4425–4434.
Kim, T.H., Barrera, L.O., Qu, C., Van Calcar, S., Trinklein, N.D., Cooper,S.J., Luna, R.M., Glass, C.K., Rosenfeld, M.G., Myers, R.M., et al.2005a. Direct isolation and identification of promoters in thehuman genome. Genome Res. 15: 830–839.
Kim, T.H., Barrera, L.O., Zheng, M., Qu, C., Singer, M.A., Richmond,T.A., Wu, Y., Green, R.D., and Ren, B. 2005b. A high-resolution mapof active promoters in the human genome. Nature 436: 876–880.
Kim, T.H. and Ren, B. 2006. Genome-wide analysis of protein–DNAinteractions. Annu. Rev. Genomics Hum. Genet. 7: 81–102.
Kimura, K., Wakamatsu, A., Suzuki, Y., Ota, T., Nishikawa, T.,Yamashita, R., Yamamoto, J., Sekine, M., Tsuritani, K., Wakaguri, H.,et al. 2006. Diversification of transcriptional modulation: Large-scaleidentification and characterization of putative alternative promotersof human genes. Genome Res. 16: 55–65.
Kioussi, C., Briata, P., Baek, S.H., Wynshaw-Boris, A., Rose, D.W., andRosenfeld, M.G. 2002. Pitx genes during cardiovascular
development. Cold Spring Harb. Symp. Quant. Biol. 67: 81–87.Kouskouti, A. and Talianidis, I. 2005. Histone modifications defining
active genes persist after transcriptional and mitotic inactivation.EMBO J. 24: 347–357.
Lee, C.K., Shibata, Y., Rao, B., Strahl, B.D., and Lieb, J.D. 2004. Evidencefor nucleosome depletion at active regulatory regions genome wide.Nat. Genet. 36: 900–905.
Levine, M. and Tjian, R. 2003. Transcription regulation and animaldiversity. Nature 424: 147–151.
Li, Z., Van Calcar, S., Qu, C., Cavenee, W.K., Zhang, M.Q., and Ren, B.2003. A global transcriptional regulatory role for c-Myc in Burkitt’slymphoma cells. Proc. Natl. Acad. Sci. 100: 8164–8169.
Lim, L.P., Lau, N.C., Garrett-Engele, P., Grimson, A., Schelter, J.M.,Castle, J., Bartel, D.P., Linsley, P.S., and Johnson, J.M. 2005.Microarray analysis shows that some microRNAs down-regulate largenumbers of target mRNAs. Nature 433: 769–773.
Loh, Y.H., Wu, Q., Chew, J.L., Vega, V.B., Zhang, W., Chen, X.,Bourque, G., George, J., Leong, B., Liu, J., et al. 2006. The Oct4 andNanog transcription network regulates pluripotency in mouseembryonic stem cells. Nat. Genet. 38: 431–440.
Maglott, D., Ostell, J., Pruitt, K.D., and Tatusova, T. 2005. Entrez Gene:Gene-centered information at NCBI. Nucleic Acids Res. 33: D54–D58.doi: 10.1093/nar/gki031.
Matys, V., Kel-Margoulis, O.V., Fricke, E., Liebich, I., Land, S.,Barre-Dirrie, A., Reuter, I., Chekmenev, D., Krull, M., Hornischer, K.,et al. 2006. TRANSFAC and its module TRANSCompel®:Transcriptional gene regulation in eukaryotes. Nucleic Acids Res.34: D108–D110. doi: 10.1093/nar/gkj143.
Megy, K., Audic, S., and Claverie, J.M. 2002. Heart-specific genesrevealed by expressed sequence tag (EST) sampling. Genome Biol. 3:RESEARCH0074. Doi: 10.1186/gb-2002-3-12-research0074.
Mito, Y., Henikoff, J.G., and Henikoff, S. 2005. Genome-scale profilingof histone H3.3 replacement patterns. Nat. Genet. 37: 1090–1097.
Nakashima, K., Yanagisawa, M., Arakawa, H., Kimura, N., Hisatsune, T.,Kawabata, M., Miyazono, K., and Taga, T. 1999. Synergistic signalingin fetal brain by STAT3-Smad1 complex bridged by p300. Science.284: 479–482.
Niakan, K.K., Davis, E.C., Clipsham, R.C., Jiang, M., Dehart, D.B., Sulik,K.K., and McCabe, E.R. 2006. Novel role for the orphan nuclearreceptor Dax1 in embryogenesis, different from steroidogenesis. Mol.Genet. Metab. 88: 261–271.
O’Donovan, K.J., Tourtellotte, W.G., Millbrandt, J., and Baraban, J.M.1999. The EGR family of transcription-regulatory factors: Progress atthe interface of molecular and systems neuroscience. Trends Neurosci.22: 167–173.
Okazaki, Y., Furuno, M., Kasukawa, T., Adachi, J., Bono, H., Kondo, S.,Nikaido, I., Osato, N., Saito, R., Suzuki, H., et al. 2002. Analysis ofthe mouse transcriptome based on functional annotation of 60,770full-length cDNAs. Nature 420: 563–573.
Pokholok, D.K., Harbison, C.T., Levine, S., Cole, M., Hannett, N.M., Lee,T.I., Bell, G.W., Walker, K., Rolfe, P.A., Herbolsheimer, E., et al.2005. Genome-wide map of nucleosome acetylation andmethylation in yeast. Cell 122: 517–527.
Raisner, R.M., Hartley, P.D., Meneghini, M.D., Bao, M.Z., Liu, C.L.,Schreiber, S.L., Rando, O.J., and Madhani, H.D. 2005. Histonevariant H2A.Z marks the 5� ends of both active and inactive genes ineuchromatin. Cell 123: 233–248.
Reya, T. and Clevers, H. 2005. Wnt signaling in stem cells and cancer.Nature 434: 843–850.
Rodriguez, C., Huang, L.J., Son, J.K., McKee, A., Xiao, Z., and Lodish,H.F. 2001. Functional cloning of the proto-oncogene brain factor-1(BF-1) as a Smad-binding antagonist of transforming growth factor-�signaling. J. Biol. Chem. 276: 30224–30230.
Roh, T.Y., Cuddapah, S., Cui, K., and Zhao, K. 2006. The genomiclandscape of histone modifications in human T cells. Proc. Natl.Acad. Sci. 103: 15782–15787.
Ruiz i Altaba, A., Sanchez, P., and Dahmane, N. 2002. Gli and hedgehogin cancer: Tumors, embryos, and stem cells. Nat. Rev. Cancer2: 361–372.
Ruthenburg, A.J., Allis, C.D., and Wysocka, J. 2007. Methylation oflysine 4 on histone H3: Intricacy of writing and reading a singleepigenetic mark. Mol. Cell 25: 15–30.
Sandelin, A., Alkema, W., Engstrom, P., Wasserman, W.W., andLenhard, B. 2004. JASPAR: An open-access database for eukaryotictranscription factor binding profiles. Nucleic Acids Res. 32: D91–D94.doi: 10.1093/nar/gkh012.
Saunders, A., Core, L.J., and Lis, J.T. 2006. Breaking barriers totranscription elongation. Nat. Rev. Mol. Cell Biol. 7: 557–567.
Schedl, A. and Hastie, N.D. 2000. Cross-talk in kidney development.Curr. Opin. Genet. Dev. 10: 543–549.
Schoenherr, C.J. and Anderson, D.J. 1995. The neuron-restrictive
Genome-wide mapping of mouse promoters
Genome Research 13www.genome.org
Cold Spring Harbor Laboratory Press on November 27, 2007 - Published by www.genome.orgDownloaded from
silencer factor (NRSF): A coordinate repressor of multipleneuron-specific genes. Science. 267: 1360–1363.
Schug, J., Schuller, W.P., Kappen, C., Salbaum, J.M., Bucan, M., andStoeckert Jr., C.J. 2005. Promoter features related to tissue specificityas measured by Shannon entropy. Genome Biol. 6: R33. doi:10.1186/gb-2005-6-4-r33.
Senkel, S., Lucas, B., Klein-Hitpass, L., and Ryffel, G.U. 2005.Identification of target genes of the transcription factor HNF1betaand HNF1alpha in a human embryonic kidney cell line. Biochim.Biophys. Acta. 1731: 179–190.
Sharov, A.A., Piao, Y., Matoba, R., Dudekula, D.B., Qian, Y., VanBuren,V., Falco, G., Martin, P.R., Stagg, C.A., Bassey, U.C., et al. 2003.Transcriptome analysis of mouse stem cells and early embryos. PLoSBiol. 1: E74. doi: 10.1371/journal.pbio.0000074.
Shin, D.H., Lee, H.W., Jeon, G.S., Lee, H.Y., Lee, K.H., and Cho, S.S.2001. Constitutive expression of c-myb mRNA in the adult rat brain.Brain Res. 892: 203–207.
Shiraki, T., Kondo, S., Katayama, S., Waki, K., Kasukawa, T., Kawaji, H.,Kodzius, R., Watahiki, A., Nakamura, M., Arakawa, T., et al. 2003.Cap analysis gene expression for high-throughput analysis oftranscriptional starting point and identification of promoter usage.Proc. Natl. Acad. Sci. 100: 15776–15781.
Smith, E.O. and Lomax, M.I. 1993. Structural organization of the bovinegene for the heart/muscle isoform of cytochrome c oxidase subunitVIa. Biochim. Biophys. Acta. 1174: 63–71.
Smith, A.D., Sumazin, P., Xuan, Z., and Zhang, M.Q. 2006. DNA motifsin human and mouse proximal promoters predict tissue-specificexpression. Proc. Natl. Acad. Sci. 103: 6275–6280.
Smith, A.D., Sumazin, P., and Zhang, M.Q. 2005. Identifyingtissue-selective transcription factor binding sites in vertebratepromoters. Proc. Natl. Acad. Sci. 102: 1560–1565.
Smith, A.D., Sumazin, P., and Zhang, M.Q. 2007. Tissue-specificregulatory elements in mammalian promoters. Mol. Syst. Biol. 3: 73.
Smyth, G.K. 2005. Limma: Linear models for microarray data. InBioinformatics and computational biology solutions using R andBioconductor (eds. V.C. R. Gentleman et al.), pp. 397–420. Springer,New York.
Song, J.S., Johnson, W.E., Zhu, X., Zhang, X., Li, W., Manrai, A.K., Liu,J.S., Chen, R., and Liu, X.S. 2007. Model-based analysis of 2-colorarrays (MA2C). Genome Biol. 8: R178. doi: 10.1186/gb-2007-8-8-r178.
Stead, E., White J., Faast, R., Conn, S., Goldstone, S., Rathjen, J.,Dhingra, U., Rathjen, P., Walker, D., and Dalton, S. 2002.Pluripotent cell division cycles are driven by ectopic Cdk2, cyclinA/E and E2F activities. Oncogene. 21: 8320–8333.
Su, A.I., Cooke, M.P., Ching, K.A., Hakak, Y., Walker, J.R., Wiltshire, T.,Orth, A.P., Vega, R.G., Sapinoso, L.M., Moqrich, A., et al. 2002.Large-scale analysis of the human and mouse transcriptomes. Proc.Natl. Acad. Sci. 99: 4465–4470.
Su, A.I., Wiltshire, T., Batalov, S., Lapp, H., Ching, K.A., Block, D.,Zhang, J., Soden, R., Hayakawa, M., Kreiman, G., et al. 2004. A geneatlas of the mouse and human protein-encoding transcriptomes.Proc. Natl. Acad. Sci. 101: 6062–6067.
Swanson, H.I., Chan, W.K., and Bradfield, C.A.. 1995. DNA binding
specificities and pairing rules of the Ah receptor, ARNT, and SIMproteins. J. Biol. Chem. 270: 26292–26302.
Takahashi, K. and Yamanaka, S. 2006. Induction of pluripotent stemcells from mouse embryonic and adult fibroblast cultures by definedfactors. Cell. 126: 663–676.
Tanaka, S., Kunath, T., Hadjantonakis, A.K., Nagy, A., and Rossant, J.1998. Promotion of trophoblast stem cell proliferation by FGF4.Science 282: 2072–2075.
Tavazoie, S., Hughes, J.D., Campbell, M.J., Cho, R.J., and Church, G.M.1999. Systematic determination of genetic network architecture. Nat.Genet. 22: 281–285.
Walton, M.R. and Dragunow, I. 2000. Is CREB a key to neuronalsurvival? Trends Neurosci. 23: 48–53.
Wasserman, W.W. and Fickett, J.W. 1998. Identification of regulatoryregions which confer muscle-specific gene expression. J. Mol. Biol.278: 167–181.
Wasserman, W.W., Palumbo, M., Thompson, W., Fickett, J.W., andLawrence, C.E. 2000. Human-mouse genome comparisons to locateregulatory sites. Nat. Genet. 26: 225–228.
Weber, M., Hellmann, I., Stadler, M.B., Ramos, L., Paabo, S., Rebhan,M., and Schubeler, D. 2007. Distribution, silencing potential, andevolutionary impact of promoter DNA methylation in the humangenome. Nat. Genet. 39: 457–466.
Wei, C.L., Miura, T., Robson, P., Lim, S.K., Xu, X.Q., Lee, M.Y., Gupta,S., Stanton, L., Luo, Y., Schmitt, J., et al. 2005. Transcriptomeprofiling of human and murine ESCs identifies divergent pathsrequired to maintain the stem cell state. Stem Cells 23: 166–185.
Xie, X., Lu, J., Kulbokas, E.J., Golub, T.R., Mootha, V., Lindblad-Toh, K.,Lander, E.S., and Kellis, M. 2005. Systematic discovery of regulatorymotifs in human promoters and 3� UTRs by comparison of severalmammals. Nature 434: 338–345.
Xuan, Z., Zhao, F., Wang, J., Chen, G., and Zhang, M.Q. 2005.Genome-wide promoter extraction and analysis in human, mouse,and rat. Genome Biol. 6: R72. doi: 10.1186/gb-2005-6-8-r72.
Yuan, G.C., Liu, Y.J., Dion, M.F., Slack, M.D., Wu, L.F., Altschuler, S.J.,and Rando, O.J. 2005. Genome-scale identification of nucleosomepositions in S. cerevisiae. Science 309: 626–630.
Zhang, H., Roberts, D.N., and Cairns, B.R. 2005. Genome-wide dynamicsof Htz1, a histone H2A variant that poises repressed/basal promotersfor activation through histone loss. Cell 123: 219–231.
Zhang, W., Morris, Q.D., Chang, R., Shai, O., Bakowski, M.A.,Mitsakakis, N., Mohammad, N., Robinson, M.D., Zirngibl, R.,Somogyi, E., et al. 2004. The functional landscape of mouse geneexpression. J. Biol. 3: 21.
Zheng, M., Barrera, L.O., Ren, B., and Wu, Y. 2005. ChIP-chip: Data,model, and analysis. In Proceedings of the American StatisticalAssociation, Statistical Computing Section. American StatisticalAssociation, Alexandria, VA.
Received May 3, 2007; accepted in revised form October 12, 2007.
Barrera et al.
14 Genome Researchwww.genome.org
Cold Spring Harbor Laboratory Press on November 27, 2007 - Published by www.genome.orgDownloaded from