genomesize - claude bernard university lyon 1pbil.univ-lyon1.fr/members/mbailly/amig/gsize.pdf ·...
TRANSCRIPT

Bacterial genome structures
Genome size
Genome size
1 Introduction
2 Chromosomes Topology & Counts
3 Genome size
4 Replichores and gene orientation
5 Chirochores
6 G+C content
7 Codon usage
40 [email protected] Bacterial genome structures

Bacterial genome structures
Genome size
Units
bp: base pair
Common multiples are:
1 kb = 103 bp
1 Mb = 106 bp
1 Gb = 109 bp
Bacterial genomes are typically expressed in Mb
41 [email protected] Bacterial genome structures

Bacterial genome structures
Genome size
Units
Length conversion
Dickerson et al (1982) Science, 216:475-485.1 bp ≈ 0.33 nm
1 kb ≈ 0.33 µm
1 Mb ≈ 0.33 mm
1 Gb ≈ 0.33 m
Bacterial genomes are typically in the mm range (and therefore1000x bigger than the typical bacterial size).
42 [email protected] Bacterial genome structures
Bacterial genome structures
Genome size
Units
Mass conversion (1 pg = 10−12 g)
Dolezel et al (2003) Cytometry, 51A:127-128.Number of base pairs = mass in pg × 0.978 109
1 kb ≈ 10−6 pg
1 Mb ≈ 10−3 pg
1 Gb ≈ 1 pg
Bacterial genomes are typically in the 10−3 pg range (femtogram).
43 [email protected] Bacterial genome structures

Bacterial genome structures
Genome size
As compared to other
The big picture
Virus, organellesTiny genomes (kb)High gene densityBacteriophages:10-100 genes
”Bacteria”Small genomes (Mb)High gene densityE. coli:∼ 5000 genes
EucaryaLarge genomes (Gb)Low gene densityHomo Sapiens:∼ 25000 genes
44 [email protected] Bacterial genome structures


Bacterial genome structures
Genome size
As compared to other
C value paradox: who has the biggest genome?
amphibiansannelids
arachnidsbirds
chordatescnidaria
crustaceansechinoderms
fishflatworms
insectsmammals
misc−invertsmolluscs
myriapodsnematodes
reptilesrotifers
spongestardigrades
−1.5 −1.0 −0.5 0.0 0.5 1.0 1.5 2.0
Gregory, T.R. (2005) Animal Genome Size Database
Genome size [pg] (log 10 scale)
Hard Quizz : what makes the humans being ”biologically”differentfrom other animals, if not a bigger genome?
46 [email protected] Bacterial genome structures

Bacterial genome structures
Genome size
Exceptions
Giant virus: mimivirus 1.2 Mb
Electronic microscopy of a ”bacteria” on the left (Ureaplasma urealyticum (parvum)) with a genome size of 0.751
Mb and mimivirus on the rigth with a genome size of 1.181 Mb. Credit: the Mimivirus picture gallery from
http://giantvirus.org/. Copyright: Prof. Didier Raoult, Rickettsia Laboratory, La Timone, Marseille, France.
47 [email protected] Bacterial genome structures

Bacterial genome structures
Genome size
Exceptions
Tiny eucaryal genome: Guillardia theta is only 551 kb
termini.
UG.their
genes
non-that
ent
for
iscyano-
thise
Primaryendosymbiosis
Primaryeukaryotic alga
Cyanobacterium
Nucleus(~350 Mb)
Mitochondrion(48 kb)
Starchgrain
Periplastidmembrane
Periplastidspace
Chloroplast(121 kb)
Nucleomorph (551 kb)
RoughER
Cryptomonad cell
Secondary endosymbiosis
Douglas, S. et al (2001) Nature, 410:1091-1096.
48 [email protected] Bacterial genome structures

Bacterial genome structures
Genome size
Exceptions
Tiny eucaryal genome: Encephalitozoon cuniculi is only2.9 Mb
Microsporidia are well-known to infect immunocompromised
patients and are also responsible for clinical syndromes in
immunocompetent individuals. In recent years, evidence has
been obtained in support of a very close relationship between
Microsporidia and Fungi. In some species, the compaction of
the genome and genes is remarkable. Thus, a systematic
sequencing project has been initiated for the 2.9 Mbp genome
of Encephalitozoon cuniculi, which will be useful for future
comparative genomic studies.
Towards the minimal eukaryotic parasitic genome
Christian P Vivarès* and Guy Méténier
Figure 1
XI
Strain Ireference isolate
Strain I Strain I
X
IX
VIII
Katinka, M.D. et al (2001) Nature, 414:450-453.
49 [email protected] Bacterial genome structures

Bacterial genome structures
Genome size
Exceptions
Overlap of free living forms
Eucarya Saccharomyces cerevisiae is 12 Mb
Bacteria Sorangium cellulosum is 13 Mb
50 [email protected] Bacterial genome structures

Bacterial genome structures
Genome size
Molecular evolution
Nothing in Biology Makes Sense Except in the Light ofEvolution (T. Dobzhansky)
Principle
Species evolve through random changes which are submitted tonatural selection
Variability
Natural selection
51 [email protected] Bacterial genome structures

Bacterial genome structures
Genome size
Between species variability
What is the distribution of bacterial genome size. . .
. . . and what do you expect if it is a character under selection? Notunder selection?
Study this yourself:If you do not remember in details what is a mixture of gaussianlaws, read first – and quickly:http://pbil.univ-lyon1.fr/R/fichestd/tdr221.pdf
Then:http://pbil.univ-lyon1.fr/R/fichestd/tdr222.pdf
(use the file goldtable.txt already downladed for the last part)
52 [email protected] Bacterial genome structures

Bacterial genome structures
Genome size
Between species variability
Genome size for 279 bacteria (GOLD 2002)
53 [email protected] Bacterial genome structures

Bacterial genome structures
Genome size
Between species variability
Genome size for 1062 bacteria (GOLD 2007)
54 [email protected] Bacterial genome structures

Bacterial genome structures
Genome size
Between species variability
Genome size summary
55 [email protected] Bacterial genome structures

Bacterial genome structures
Genome size
Between species variability
Generalists versus specialists
Giovannoni, S.J. et al (2005) Science, 309:1242-1245.
56 [email protected] Bacterial genome structures

Bacterial genome structures
Genome size
Between species variability
Genome size & repeat density
Genetica 115: 1–12, 2002.
© 2002 Kluwer Academic Publishers. Printed in the Netherlands.1
Genome deterioration: loss of repeated sequences and accumulation of
junk DNA
A. Carolin Frank, Haleh Amiri & Siv G.E. Andersson∗
Department of Molecular Evolution, University of Uppsala, Uppsala, S-751 36 Sweden; ∗Author for correspon-
dence (Phone: +46-18-4714379; Fax: +46-18-471 64 04; E-mail: [email protected])
57 [email protected] Bacterial genome structures

Bacterial genome structures
Genome size
Between species variability
Genome size & repeat density
58 [email protected] Bacterial genome structures

Bacterial genome structures
Genome size
Between species variability
Genome size & repeat density
8
Figure 3. Schematic illustration of genome size variations as a function of time during transitions to intracellular growth habitats. Filled boxes
represent mobile genetic elements. Genomes of obligate intracellular bacteria are smaller and have a lower content of repeated sequences (//)
and a higher content of pseudogenes (x) than genomes of free-living bacteria and facultative intracellular parasites.
59 [email protected] Bacterial genome structures

Bacterial genome structures
Genome size
Between species variability
Pseudogenes in Rickettsia prowazekii
050,000
100,000
150,000
200,000
250,000
300,000
350,000
400,000
450,000
500,000550,000600,000
650,000
700,000
750,000
800,000
850,000
900,000
950,000
1,000,000
1,050,000
R. prowazekii
1111523 bp
Andersson, S.G. et al (1998) Nature, The genome sequence of Rickettsia prowazekii and the origin of mitochondria
396:133-140.
60 [email protected] Bacterial genome structures

Bacterial genome structures
Genome size
Between species variability
Pseudogenes in Mycobacterium leprae
Massive gene decay in the leprosybacillusS. T. Cole*, K. Eiglmeier*, J. Parkhill², K. D. James², N. R. Thomson², P. R. Wheeler³, N. HonoreÂ*, T. Garnier*, C. Churcher², D. Harris²,K. Mungall², D. Basham², D. Brown², T. Chillingworth², R. Connor², R. M. Davies², K. Devlin², S. Duthoy*, T. Feltwell², A. Fraser²,N. Hamlin², S. Holroyd², T. Hornsby², K. Jagels², C. Lacroix*, J. Maclean², S. Moule², L. Murphy², K. Oliver², M. A. Quail²,M.-A. Rajandream², K. M. Rutherford², S. Rutter², K. Seeger², S. Simon*, M. Simmonds², J. Skelton², R. Squares², S. Squares²,K. Stevens², K. Taylor², S. Whitehead², J. R. Woodward² & B. G. Barrell²
*Unite de GeÂneÂtique MoleÂculaire BacteÂrienne, Institut Pasteur, 28 rue du Docteur Roux, 75724 Paris Cedex 15, France² Sanger Centre, Wellcome Trust Genome Campus, Hinxton, CB10 1SA, UK³Veterinary Laboratories Agency, Weybridge, Woodham Lane, New Haw, Addlestone, Surrey KT15 3NB, UK
............................................................................................................................................................................................................................................................................
Leprosy, a chronic human neurological disease, results from infection with the obligate intracellular pathogen Mycobacteriumleprae, a close relative of the tubercle bacillus.Mycobacterium leprae has the longest doubling time of all known bacteria and hasthwarted every effort at culture in the laboratory. Comparing the 3.27-megabase (Mb) genome sequence of an armadillo-derivedIndian isolate of the leprosy bacillus with that of Mycobacterium tuberculosis (4.41Mb) provides clear explanations for theseproperties and reveals an extreme case of reductive evolution. Less than half of the genome contains functional genes butpseudogenes, with intact counterparts in M. tuberculosis, abound. Genome downsizing and the current mosaic arrangementappear to have resulted from extensive recombination events between dispersed repetitive sequences. Gene deletion and decayhave eliminated many important metabolic activities including siderophore production, part of the oxidative and most of themicroaerophilic and anaerobic respiratory chains, and numerous catabolic systems and their regulatory circuits.
Cole, S.T. et al (1998) Nature, 409:1007-10011.
61 [email protected] Bacterial genome structures
Bacterial genome structures
Genome size
Within species variability
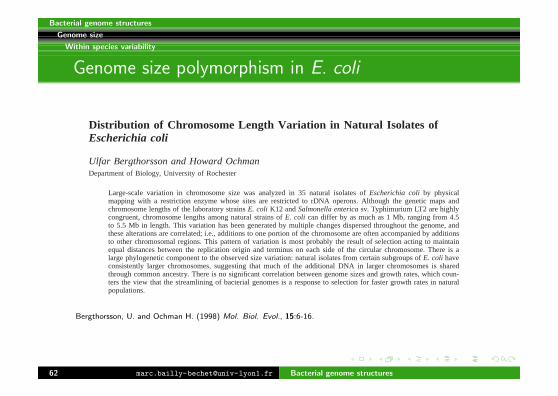
Genome size polymorphism in E. coli
Distribution of Chromosome Length Variation in Natural Isolates ofEscherichia coli
Ulfar Bergthorsson and Howard OchmanDepartment of Biology, University of Rochester
Large-scale variation in chromosome size was analyzed in 35 natural isolates of Escherichia coli by physicalmapping with a restriction enzyme whose sites are restricted to rDNA operons. Although the genetic maps andchromosome lengths of the laboratory strains E. coli K12 and Salmonella enterica sv. Typhimurium LT2 are highlycongruent, chromosome lengths among natural strains of E. coli can differ by as much as 1 Mb, ranging from 4.5to 5.5 Mb in length. This variation has been generated by multiple changes dispersed throughout the genome, andthese alterations are correlated; i.e., additions to one portion of the chromosome are often accompanied by additionsto other chromosomal regions. This pattern of variation is most probably the result of selection acting to maintainequal distances between the replication origin and terminus on each side of the circular chromosome. There is alarge phylogenetic component to the observed size variation: natural isolates from certain subgroups of E. coli haveconsistently larger chromosomes, suggesting that much of the additional DNA in larger chromosomes is sharedthrough common ancestry. There is no significant correlation between genome sizes and growth rates, which coun-ters the view that the streamlining of bacterial genomes is a response to selection for faster growth rates in naturalpopulations.
Bergthorsson, U. and Ochman H. (1998) Mol. Biol. Evol., 15:6-16.
62 [email protected] Bacterial genome structures

Bacterial genome structures
Genome size
Within species variability
The ECOR collection
Ochman, H. and Selander, R.K. (1984) J. Bacteriol., 157:690-693.
63 [email protected] Bacterial genome structures

Bacterial genome structures
Genome size
Within species variability
Digestion of the E. coli chromosome with I-CeuI
FIG. 1.—Locations of I-CeuI recognition sites on the E. coli K12chromosome. I-CeuI cleaves at the seven rrn genes, whose map po-sitions are indicated. The resulting restriction fragments are designatedA through G.
Rohlf
-
Felsen-programs
al.con-
64 [email protected] Bacterial genome structures

Bacterial genome structures
Genome size
Within species variability
Results in kb
group strain Host..sex. Location A B C D E F G1 A ECOR4 Human (F) Iowa 2585 707 527 90 166 38 6082 A ECOR5 Human (F) Iowa 2940 743 515 90 128 38 6993 A ECOR11 Human (F) Sweden 2750 824 556 90 128 38 7354 A ECOR13 Human (F) Sweden 2485 680 515 90 128 38 6395 A ECOR14 Human (F) Sweden 2645 735 608 90 128 38 7076 A ECOR15 Human (F) Sweden 2690 735 575 90 138 38 6397 A ECOR18 Celebese ape Washington 2510 699 515 90 122 38 6088 A ECOR19 Celebese ape Washington 2480 699 527 90 122 38 6399 A ECOR20 Steer Bali 2505 654 480 90 122 38 608
10 A ECOR21 Steer Bali 2505 654 480 90 122 38 60811 A ECOR23 Elephant Washington 2675 807 532 90 138 38 68012 B1 ECOR27 Giraffe Washington 2600 707 515 90 143 38 61613 B1 ECOR28 Human (F) Iowa 2620 743 527 94 128 38 63914 B1 ECOR29 Kangaroo rat Nevada 2610 787 527 94 138 38 63915 B1 ECOR34 Dog Massachusetts 2500 790 515 94 138 38 68016 B1 ECOR58 Lion Washington 2700 743 515 94 136 38 63917 B1 ECOR68 Giraffe Washington 2745 843 532 94 138 38 80718 B1 ECOR71 Human (F) Sweden 2650 771 547 90 138 38 65419 B1 ECOR72 Human (F) Sweden 2635 771 532 94 138 38 68020 B2 ECOR51 Human infant Massachusetts 2750 810 550 112 138 38 810
. . .
31 D ECOR39 Human (F) Sweden 2780 787 581 104 143 38 71332 D ECOR40 Human (F) Sweden 2845 807 616 104 143 43 78733 E ECOR31 Leopard Washington 2775 743 547 94 138 38 73534 E ECOR37 Marmoset Washington 3100 787 581 94 175 38 74335 E ECOR42 Human (M) Massachusetts 2735 743 616 94 143 38 699
65 [email protected] Bacterial genome structures

Bacterial genome structures
Genome size
Within species variability
What is the polymorphism of E. coli genome size?
Study this yourself:
> pgs <- read.table("http://pbil.univ-lyon1.fr/R/donnees/polygensize.txt",+ header = TRUE, sep = "\t")> head(pgs)
subgroup strain Host..sex. Location A B C D E F G1 A ECOR4 Human (F) Iowa 2585 707 527 90 166 38 6082 A ECOR5 Human (F) Iowa 2940 743 515 90 128 38 6993 A ECOR11 Human (F) Sweden 2750 824 556 90 128 38 7354 A ECOR13 Human (F) Sweden 2485 680 515 90 128 38 6395 A ECOR14 Human (F) Sweden 2645 735 608 90 128 38 7076 A ECOR15 Human (F) Sweden 2690 735 575 90 138 38 639
What is the distribution of genome size?
Any relationship with the subgroup?
What is the nice hidden structure in this dataset?
66 [email protected] Bacterial genome structures
Bacterial genome structures
Genome size
Within species variability
Genome size is highly polymorphic in E. coli
67 [email protected] Bacterial genome structures

Bacterial genome structures
Genome size
Within species variability
Genome size phylogenetic inertia
68 [email protected] Bacterial genome structures

Bacterial genome structures
Genome size
Within species variability
Genome size phylogenetic inertia
69 [email protected] Bacterial genome structures

Bacterial genome structures
Genome size
Within species variability
The nice hidden structure
70 [email protected] Bacterial genome structures
Bacterial genome structures
Genome size
Within species variability
The nice hidden structure (II)
71 [email protected] Bacterial genome structures

Bacterial genome structures
Genome size
Within species variability
0157:H7 EDL933 vs MG1655
Red parts on the outer circle represent insertion sequences in thepathogenic bacteria.
72 [email protected] Bacterial genome structures

Bacterial genome structures
Genome size
Within species variability
Insertion Sequences (IS)
One of the main reason of within-species genomepolymorphism
IS are DNA sequences inserted in the genome, present amongcertain individuals in a population
Typically IS can be lysogenic phages or sequences acquired byhorizontal transfer
73 [email protected] Bacterial genome structures

Bacterial genome structures
Genome size
Within species variability
Horizontal transfert
There is 3 main ways of acquiring sequences by horizontal transfertfor bacteria:
Transformation : acquisition of external DNA sequences by”competent”bacteria
Conjugation : exchange of DNA sequences betweenindividuals in a population
Transduction : phage-mediated transfer of DNA
74 [email protected] Bacterial genome structures
Bacterial genome structures
Genome size
Within species variability
Insertion Sequences and pathogenicity
Many bacteria are pathogens because of acquired IS, e.g. fromphages (prophages). Examples:
Y. pestis acquired the toxicity protein from a phage
E. coli O157:H7 is a pathogenic strain of E. coli, only becauseof added IS.
P. aeruginosa PA01 contains inserted sequences ofbacteriocins, designed by phages to kill bacteria
75 [email protected] Bacterial genome structures
Bacterial genome structures
Genome size
Within species variability
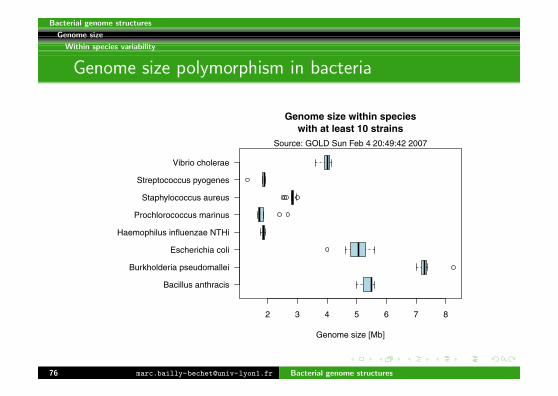
Genome size polymorphism in bacteria
Bacillus anthracis
Burkholderia pseudomallei
Escherichia coli
Haemophilus influenzae NTHi
Prochlorococcus marinus
Staphylococcus aureus
Streptococcus pyogenes
Vibrio cholerae
2 3 4 5 6 7 8
Genome size within species
with at least 10 strains
Genome size [Mb]
Source: GOLD Sun Feb 4 20:49:42 2007
76 [email protected] Bacterial genome structures