genomic analysis of human microrna transcripts
TRANSCRIPT
8/8/2019 Genomic analysis of human microRNA transcripts
http://slidepdf.com/reader/full/genomic-analysis-of-human-microrna-transcripts 1/6
Genomic analysis of human microRNA transcriptsHarpreet Kaur Saini*, Sam Griffiths-Jones†‡, and Anton James Enright*§
*Wellcome Trust Sanger Institute, Wellcome Trust Genome Campus, Hinxton, Cambridge CB10 1SA, United Kingdom; †Faculty of Life Sciences,University of Manchester, Michael Smith Building, Oxford Road, Manchester M13 9PT, United Kingdom
Edited by Michael S. Waterman, University of Southern California, Los Angeles, CA, and approved August 28, 2007 (received for review April 30, 2007)
MicroRNAs (miRNAs) are important genetic regulators of develop-
ment, differentiation, growth, and metabolism. The mammalian ge-nome encodes 500 known miRNA genes. Approximately 50% areexpressed from non-protein-coding transcripts, whereas the restarelocatedmostly in theintrons of coding genes.Intronic miRNAs aregenerally transcribed coincidentally with their host genes. However,the nature of the primary transcript of intergenic miRNAs is largelyunknown. We have performed a large-scale analysis of transcriptionstart sites, polyadenylation signals, CpG islands, EST data, transcrip-tion factor-binding sites, and expression ditag data surrounding
intergenic miRNAs in the human genome to improveour understand-ing of the structure of their primary transcripts. We show that asignificant fraction of primary transcripts of intergenic miRNAs are3–4 kb in length, with clearly defined 5 and 3 boundaries. Weprovide strong evidence for the complete transcript structure of asmall number of human miRNAs.
MicroRNAs (miRNAs) are short (21-to 23-nt) RNAs that bindto the 3 untranslated regions (3 UTRs) of target genes (1,
2). This binding event causes translational repression of the targetgene (3) or stimulates rapid degradation of the target transcript (4).miRNAs control the expression of largenumbers of genes (5, 6) andare involved in crucial biological processes, including development,differentiation, apoptosis, cell proliferation, and disease (7). In-deed, recent studies have implicated miRNAs in numerous humandiseases such as colorectal cancer, chronic lymphocytic leukemia,and Fragile X syndrome (8–12). Expression analyses show thatmiRNAs are highly and differentially expressed, with specificmiRNAs active in specific tissues at specific times (13). In manycancers, miRNA expression is significantly altered, which has been
shown to be a useful diagnostic tool (14). Although our knowledge of miRNA biology has advanced rap-
idly, attention has been focused on processing and targeting. AmiRNA is processed from a longer transcript, referred to as theprimary transcript (pri-miRNA) (1, 15, 16). The pri-miRNA in-cludes a precursor miRNA hairpin (pre-miRNA), or sometimesmore than one cotranscribed pre-miRNA (16–18). The processedpre-miRNA hairpin is exported to the cytoplasm, where the finalmature miRNA is excised (1, 15). Although we know the genomiccoordinates of the mature and precursor sequences on the genome,
we often know very little about the primary transcript. Approxi-mately50% of human miRNAsappear to be expressed from intronsof protein-coding transcripts (19). However, only a handful of intergenic pri-miRNAs have been characterized. These studiesindicate that they can be up to several kilobases long and contain
a 5 7-methylguanosine cap and a 3 polyadenylated [poly(A)] tail(17, 18, 20), implying transcription by RNA polymerase II. Paststudies have also identified canonical TATA box motifs upstreamof miRNA genes (21). In contrast, a recent study provided evidencefor transcription of a few miRNAs by polymerase III, where thesemiRNAs were found to be interspersed by Alu repeats (22). Fullunderstanding of miRNA transcription requires a complete de-scription of the location and extent of pri-miRNAs, includingtranscription start sites, promoters, and transcription factor (TF)-binding sites.
Annotation of the primary transcripts of miRNAs is extremelyimportant to our understanding of the biology of miRNAs andtheir regulatory targets. This information allows (i) the predic-tion of upstream regulatory regions such as TF-binding sites; (ii)
the detection of other sequence and structural motifs around themiRNA that may be recognized by the processing machinery;(iii) the mapping of SNPs and mutations that may be outside themature miRNA but affect its transcription or processing; and it(iv) provides information required to build targeting constructsfor miRNA knockout.
Although previous studies (23, 24) have looked at transcriptionalfeatures associated with miRNAs, they focused on individualfeatures in isolation [expressed sequence tags (ESTs) and TF-binding sites]. In this work, we seek to combine multiple sets of features from large-scale genomic data with experimentally vali-dated miRNA data to predict and describe features of pri-miRNAtranscripts and to delineate their genomic boundaries. Similaranalyses have proved invaluable for coding gene prediction (25).We located intergenic miRNAs on the human genome and mapped
the following features to the surrounding regions: transcription startsite (TSS) predictions, EST matches, CpG island predictions, geneidentification signature–paired-end ditags (GIS-PET) matches, TF-binding site predictions, and poly(A) signal predictions. We foundconsistent 5 and 3 sequence features outside pre-miRNAs thatclearly delineate the boundaries of miRNA transcripts. For manyintergenic miRNAs, we predict the extent of their primary tran-scripts by using these data. Our results indicate that the majority of primary transcripts of intergenic miRNAs are shorter than protein-coding transcripts, with TSSs located within 2,000 bp upstream andpoly(A) signals located within 2,000 bp downstream of the pre-miRNA. Additional features such as ESTs, conserved TF-bindingsites, and expressionditags provide further insightinto the structureof primary transcripts and the transcription of clustered miRNAs aspolycistronic transcripts.
Results and Discussion
We analyzed six sets of data: TSSs, CpG islands, ESTs, TF-bindingsites, expression ditags, and poly(A) signal predictions. Each of these features is discussed in detail below.
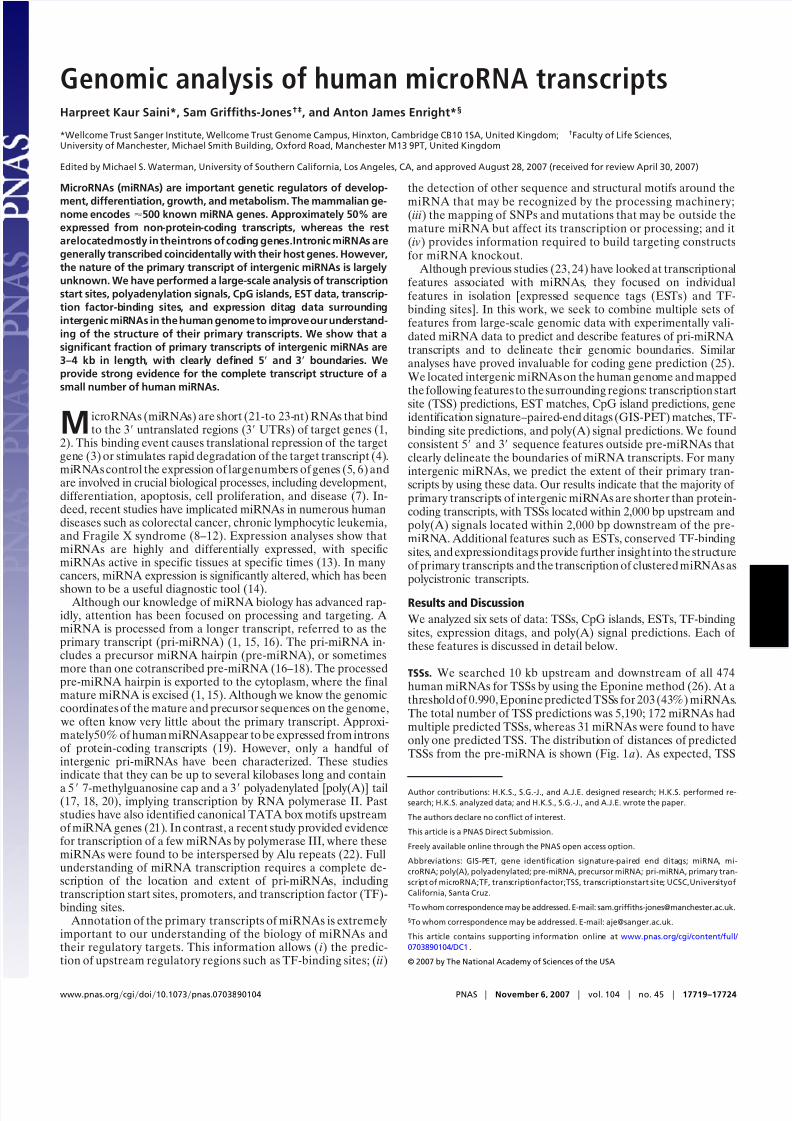
TSSs. We searched 10 kb upstream and downstream of all 474human miRNAs for TSSs by using the Eponine method (26). At athresholdof 0.990, Eponine predicted TSSs for 203 (43%) miRNAs.The total number of TSS predictions was 5,190; 172 miRNAs hadmultiple predicted TSSs, whereas 31 miRNAs were found to haveonly one predicted TSS. The distribution of distances of predictedTSSs from the pre-miRNA is shown (Fig. 1 a). As expected, TSS
Author contributions: H.K.S., S.G.-J., and A.J.E. designed research; H.K.S. performed re-
search; H.K.S. analyzed data; and H.K.S., S.G.-J., and A.J.E. wrote the paper.
The authors declare no conflict of interest.
This article is a PNAS Direct Submission.
Freely available online through the PNAS open access option.
Abbreviations: GIS-PET, gene identification signature-paired end ditags; miRNA, mi-
croRNA; poly(A), polyadenylated; pre-miRNA, precursor miRNA; pri-miRNA, primary tran-
script of microRNA;TF, transcriptionfactor;TSS, transcriptionstart site; UCSC,Universityof
California, Santa Cruz.
‡To whom correspondence may be addressed. E-mail: [email protected].
§To whom correspondence may be addressed. E-mail: [email protected].
This article contains supporting information online at www.pnas.org/cgi/content/full/
0703890104/DC1 .
© 2007 by The National Academy of Sciences of the USA
www.pnas.orgcgidoi10.1073pnas.0703890104 PNAS November 6, 2007 vol. 104 no. 45 17719–17724

8/8/2019 Genomic analysis of human microRNA transcripts
http://slidepdf.com/reader/full/genomic-analysis-of-human-microrna-transcripts 2/6
predictions are located almost exclusively in the upstream region.The majority of TSSs occur within 6 kb upstream of thepre-miRNAstart. Moreover, this distribution can be divided into three distinctregions: thefirst lying close to thepre-miRNA within2 kb upstreamand containing 22% of the total TSS predictions; the second broadregion from2 kb to6 kb, with the highest peak centered on4kbcomprising 39% of TSSs;and thethird region from9kbto10kb, containing 7% of TSSs. We speculate that the three differentregions correspond to different sets of miRNAs. Indeed, intronicand intergenic miRNAs have distinct distributions (Fig. 1 a). There
are 2,875 and 2,315 TSS predictions for 104 intronic and 99intergenic miRNAs, respectively. TSS predictions for intronicmiRNAs lie predominantly in the region from2kbto6 kb (Fig.1 a). The other two regions contain higher peaks for intergenicmiRNAs than the intronic ones. Overall, 36% and 64% of TSSpredictions in these regions belong to intronic and intergenicmiRNAs, respectively.
It is accepted that intronic miRNAs are generally transcribedalong with their hostgenes (19). Eponine predicted TSSsof intronicmiRNAs should therefore correspond with the annotated TSSs of the host transcript. Indeed, we find that the majority of predictionslie within 1 kb of the annotated TSS, and the distribution of distances between predicted and annotated TSSs is peaked0 [seesupporting information (SI) Fig. 3]. The 1-kb variation in position
corresponds well with the published positional accuracy of theEponine method (26).
Intergenic miRNAs are independent transcription units, withtheir own transcriptional regulatory elements. For such miRNAs,there are two separate and prominent peaks containing predictedTSSs (Fig. 1 a). The first lies close to the pre-miRNA (within 2 kb)and contains 31% of the total TSS predictions, whereas the second(approximately 10 kb) lies further from the pre-miRNA andcontains 11% of the TSS predictions. We find 15 miRNAs thatpossess TSSs in the region from9 kb to 10 kb. Interestingly, all
of these miRNAs have more than one predicted TSS, with themajority of predictions lying between 8 kb and 10 kb. No otherannotated transcripts are identified in these regions. We concludethat a minority of intergenic pri-miRNAs are long with TSSscentered on10 kb. As a control, we used Eponine to predict TSSsin randomly selected intergenic sequences of length 20 kb (Fig. 1 a).The distribution of predictions in random intergenic sequencesdiffers greatly from that surrounding miRNAs, indicating that thedistribution of TSSs at 2 kb and 10 kb of intergenic miRNAs ishighly nonrandom.
Many intergenic miRNAs are clustered in the genome, suggest-ing that more than one pre-miRNA may be processed from thesame primary transcript (27). We clustered miRNAs at differentdistance cutoffs (1–10 kb) and tested whether TSS predictions
0
100
200
300
400
500
600
700
800
-100 00 -8 000 - 6000 - 4000 -200 0 0 2000 4000 6000 8000 10000
N u m b e r o f T S S p r e d i c t i o n s
Distance (bp)
all miRNAsIntronic miRNAs
Intergenic miRNAsRandom Sequences
0
100
200
300
400
500
-10000 -8000 -6000 -4000 -2000 0 2000 4000 6000 8000 10000
N u m b e r o f T S S p r e d i c t i o n s
Distance (bp)
1 kb3 kb5 kb7 kb
10 kb
a
0
5
10
15
20
25
30
35
-10000 -8000 -6000 -4000 -2000 0 2000 4000 6000 8000 10000
N u m b e r o f C p G I s
l a n d s
Distance (bp)
Random SequencesIntergenic miRNAs
0
200
400
600
800
1000
1200
1400
1600
-10000 -8000 -6000 -4000 -2000 0 2000 4000 6000 8000 10000
N u m b e r o f m a t c h e d E S T s
Distance (bp)
ESTs matched with either strandESTs matched with same strand as the miRNA
Random Sequences
b
c d
e
BX094730.1
AI695443.1
BM855863.1
AA863395.1
AA863389.1
AI969882.1
BX092498.1
hsa-miR-200c hsa-miR-141ESTs
6943kb 6944kbChromosome 12 (+)
Fig. 1. Distribution of TSS, CpG, and EST distances from the 5
end of the pre-miRNAs (positioned at zero) and in random intergenic sequences. (a
) TSSpredictions.( b) TSS predictions for clusteredintergenic pre-miRNAs. (c) CpGpredictions. (d ) ESTpredictions.( e) The miRNA cluster hsa-mir-200c141 overlapped
by six ESTs aligned completely in the upstream and downstream regions.
17720 www.pnas.orgcgidoi10.1073pnas.0703890104 Saini et al .
8/8/2019 Genomic analysis of human microRNA transcripts
http://slidepdf.com/reader/full/genomic-analysis-of-human-microrna-transcripts 3/6
support their cotranscription. With an inter-miRNA distance of 1kb, there are 38 clusters formed by 97 miRNAs. Of 38 clusters, 17are found to have predicted TSSs within 10 kb upstream. The TSSdistribution remains largely unchanged, even at large clusteringdistances, which suggests that there are very few TSS predictions inthe regions between pre-miRNAs within a single cluster. Forexample, of a total of 17 clusters with predicted TSSs, only 6 clustershave TSS predictions between the clustered miRNAs. We concludethat some miRNAs separated by up to 10 kb are transcribed
together in a single primary transcript.
CpG Islands. CpG islands (28) are useful aids for promoterprediction because they are known to colocalize with TSSs. Welooked for CpG islands within 10 kb upstream and downstreamof intergenic miRNAs. In total, 111 CpG islands were identifiedfor 82 intergenic miRNAs. Twenty-one miRNAs were found topossess more than one predicted CpG island, with most of theseassociated with two CpG islands. One exception to this finding
was hsa-mir-9-3, which had five CpG islands. The mean lengthof predicted CpG islands was 1.4 kb. Furthermore, 25 pre-miRNAs were found to be completely embedded in CpG islands.In a recent study, it was shown that the expression of CpG-embedded miRNAs is regulated by hypo/hypermethylation of their associated CpG islands (29), which can further contribute
to their distinct expression profiles in normal and cancerous cells(29, 30). Although CpG islands are frequently associated withconstitutively expressed housekeeping genes, their role in reg-ulation of expression of miRNAs is still poorly understood.
The distribution of distances of CpG islands from the start of the pre-miRNA and in random intergenic sequences is shown inFig. 1 c. There is a considerable difference in the distributionplots for CpG islands of miRNAs and random intergenic se-quences. CpG islands are identified both upstream and down-stream of miRNA sequences, with a significant proportion(40%) overlapping with predicted TSS sites within 4 kb up-stream. This colocalization provides compelling evidence thatpromoters of intergenic miRNAs are often located within 4 kbupstream of the pre-miRNA. Treating clusters of miRNAs(defined at different inter-miRNA distances) as single units does
not significantly alter the distribution (see SI Fig. 4).
ESTs. We searched for ESTs mapped to within 10 kb of all 249intergenic miRNAs. A total of 222 miRNAs had 7,014 match-ing ESTs. Only 55 pre-miRNA sequences were overlapped by336 ESTs, whereas the remaining 167 had EST matches in theirflanking sequences. More ESTs (5,021) matched downstreamof the pre-miRNA than upstream (1, 657). Among the miR-NAs with matched ESTs, 19 miRNAs had only one EST match,117 had 2–10 matched ESTs, 20 had 11–20 matched ESTs, and66 had 20 EST matches. Furthermore, the multiple ESTsmatching the flanking sequences of a pre-miRNA exhibitedsignificant overlap, providing excellent evidence for theboundaries of the pri-miRNAs.
The distribution of matched ESTs to the flanking sequences of
intergenic miRNAs is shown in Fig. 1 d. Most of the EST matchesare located between 2 kb and 4.5 kb. There are more ESTsmatched in the downstream region, and a small excess match theantisensestrand.We note that thestrand specificity of ESTs is oftenpoorly determined, but the excess of antisense ESTs matchingimmediately downstream of pre-miRNAs warrants further investi-gation. These findings are consistent with a previous study by Gu et al. (23) who also reported that76% of the investigated miRNAshave matched ESTs in their upstream 2.5 kb and downstream 4 kbflanking sequences and cover mostly the downstream region of pre-miRNAs.
We also investigated the distribution of matched 5 and 3 ESTsseparately. We find that: (i) there are more matches to 3 ESTs(40% of matched ESTs are 3, 31% are 5 ESTs, and the rest are
unannotated); (ii) the majority of 3 ESTs matched in the down-stream region, whereas 5 ESTs matched both in the downstreamand upstream regions; and (iii) most of the 5 ESTs are matched tothe same strand as the pre-miRNAs. ESTs contained within 2 kbupstream of pre-miRNA overlap with the distribution of predictedTSSs and CpG islands (Fig. 1 d).
We examined EST support for clusters of miRNAs expressedfrom a single primary transcript. Different clustering distances donot significantly alter the distribution of EST overlap (see SIFig.5),
with matched ESTs spanning from
2 kb to
4.5 kb. At the 10-kbclustering distance, there are 34 clusters, of which 30 have matchedESTs. Only five clusters have ESTs that map across the wholecluster (SI Table 3), providing strong evidence that each cluster istranscribed as a single transcript. For instance, the cluster formedby the miRNAs hsa-mir-374545 on chromosome X is entirelyoverlapped by 6 ESTs, where the majority are 5 ESTs in the sameorientation as the cluster (SI Table 3). Similarly, the cluster onchromosome 12 formed by miRNAs hsa-mir-200c141 is found tobe completely overlapped by 6 ESTs with significant overlap in theupstream and downstream regions (Fig. 1 e).
The remaining 25 clusters are found to have ESTs matched onlyto their flanking sequences or partially overlapping the cluster. Weobserved that in such instances the flanking ESTs are oftenperfectly overlapped with each other, defining either the 5 or 3
end of a cluster. Aligned flanking ESTs are useful in demarcatingthe transcript boundaries and thus estimating the length of thepri-miRNA. For instance, the cluster formed by miRNAs hsa-mir-23a27a24-2 has 10 ESTs in its downstream region with a perfectoverlap at 1,771 bp from the 3 end of hsa-mir-24-2, defining its 3boundary, which is in agreement with reported experimental dataregarding the 3 end structure of hsa-mir-23a27a24-2 (18).
Another cluster formed by miRNAs hsa-mir-29b-2 and hsa-mir-29cis found to be overlapped by 20 ESTs aligned with perfect 3overlap, 333 bp downstream of hsa-mir-29c. Similarly, the clusterformed by hsa-let-7a-17f-17d has perfect overlap of 3 ends of flanking ESTs at 637 bp downstream of hsa-let-7d.
It is also possible to derive hypotheses regarding the expressionprofile of miRNAs based on tissue expression data of mappedESTs. For example, hsa-mir-122a is found to have 26 ESTs match-
ing with its flanking regions, 24 of which are expressed in liver.Previous reports have determined the liver specificity of hsa-mir-122a by detailed and laborious cloning studies (31). Similarly, weare able to derive the tissue expression of skeletal muscle-enrichedmiRNAs (133b, 206, 143) (32) and brain-specific miRNAs (124a-1,124a-2, 124a-3) (32) based solely on the flanking matched ESTs.
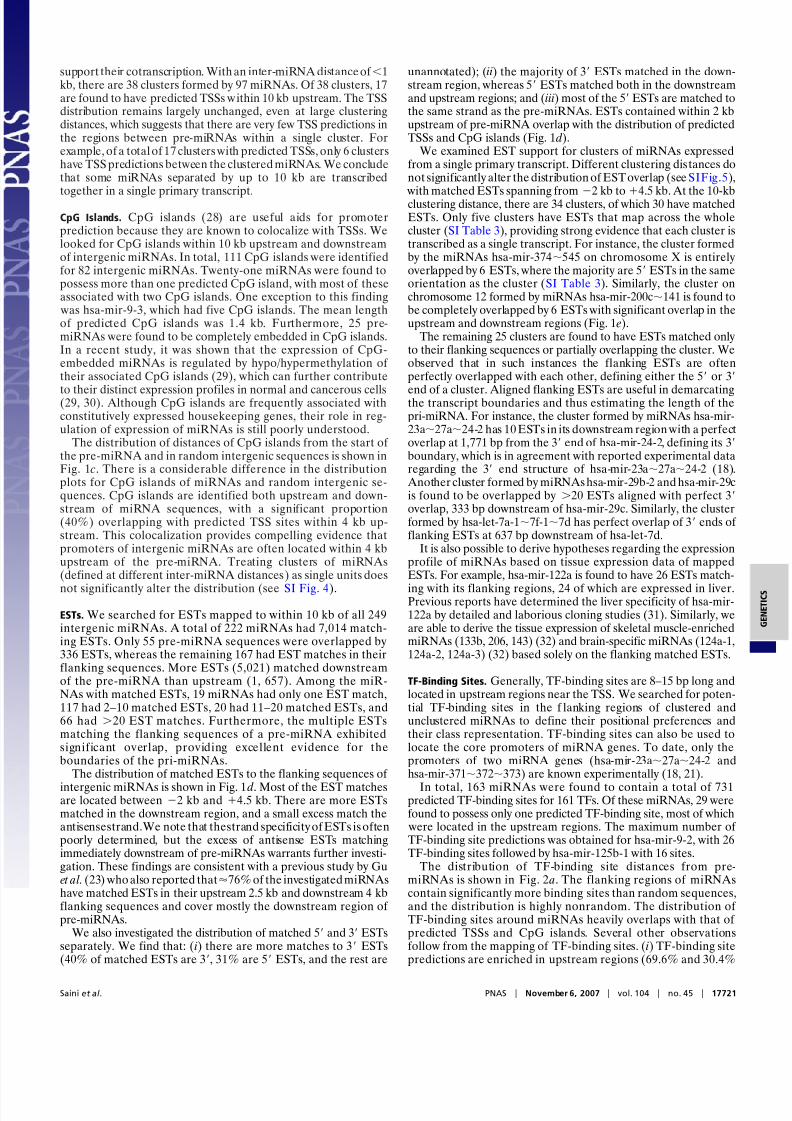
TF-Binding Sites. Generally, TF-binding sites are 8–15 bp long andlocated in upstream regions near the TSS. We searched for poten-tial TF-binding sites in the f lanking regions of clustered andunclustered miRNAs to define their positional preferences andtheir class representation. TF-binding sites can also be used tolocate the core promoters of miRNA genes. To date, only thepromoters of two miRNA genes (hsa-mir-23a27a24-2 andhsa-mir-371372373) are known experimentally (18, 21).
In total, 163 miRNAs were found to contain a total of 731predicted TF-binding sites for 161 TFs. Of these miRNAs, 29 werefound to possess only one predicted TF-binding site, most of which
were located in the upstream regions. The maximum number of TF-binding site predictions was obtained for hsa-mir-9-2, with 26TF-binding sites followed by hsa-mir-125b-1 with 16 sites.
The distribution of TF-binding site distances from pre-miRNAs is shown in Fig. 2 a. The flanking regions of miRNAscontain significantly more binding sites than random sequences,and the distribution is highly nonrandom. The distribution of TF-binding sites around miRNAs heavily overlaps with that of predicted TSSs and CpG islands. Several other observationsfollow from the mapping of TF-binding sites. (i) TF-binding sitepredictions are enriched in upstream regions (69.6% and 30.4%
Saini et al . PNAS November 6, 2007 vol. 104 no. 45 17721

8/8/2019 Genomic analysis of human microRNA transcripts
http://slidepdf.com/reader/full/genomic-analysis-of-human-microrna-transcripts 4/6
of TF-binding sites lie in upstream and downstream regions,respectively). The presence of few downstream binding sites mayrepresent some distal regulatory elements (enhancers or silenc-ers). (ii) A large fraction of TF-binding sites lie close to thepre-miRNA: 37% of the total upstream TF-binding sites lie
within 2 kb upstream. (iii) Thirty-six miRNAs have TF sitesoverlapping with their CpG islands. (iv) Many of the TF sites areclustered and may act cooperatively: 60% of miRNAs have morethan half of their TF sites within 1 kb. Similar distributionprofiles are also obtained after clustering of miRNAs (Fig. 2 a).
Recently, Zhou et al. (24) predicted putative promoter regions of miRNAs and analyzed their positional distributions with respect tothe corresponding miRNA precursors. They reported that 100(93.5%) of the 107 human miRNA genes they analyzed haveputative promoters within 500 bp upstream. Our findings alsosuggest that the TF-binding sites are close to the pre-miRNA. Inaddition, Lee et al. (18) provided the first direct evidence of transcription of hsa-mir-23a27a24-2 and identified the pro-moter region within600 bp upstream of the cluster. Our analysisshows the 400-bp upstream region of cluster hsa-mir-
23a27a24-2 to be highly enriched in TF-binding sites.We further wished to determine whether some of these putative
TFs are more abundant in miRNAs. We searched for those factorsthat are enriched and overrepresented in miRNAs, focusing on TFsfound within 2 kb upstream of a pre-miRNA. Z scores and P values
were then calculated for each of the TFs identified. We comparedthem with a control consisting of 2 kb upstream of the annotatedtranscription start sites of RefSeq genes (33) obtained from theUniversity of California, Santa Cruz (UCSC) Genome Browser(34). The mapping of conserved TF-binding sites and the TFs inRefSeq upstream sequences were obtained from the TF-bindingsite track of UCSC Genome Browser.
We found binding sites for 72 TFs within 2 kb upstream of pre-miRNAs. Among these TFs, the top five statistically significant
ones with P values ( 0.05) are listed in Table 1. For each TF, weshow the TransFac ID, TransFac class, factor name, the associatedGene Ontology function, and the P value. Interestingly, most of these TFs are related to growth and developmental processes. Thetop two TFs, MSX1 01 and NCX 01, are homeobox proteins, whichare known to be involved in developmental and regulatory pro-cesses. These TFs are also predicted as TFs of miRNAs in aprevious study (35). In addition, we also found a correspondencebetween the presence of a particular TF w ith the tissue expressionof miRNAs. The upstream regions of brain-specific miRNAshsa-mir-124a-1, 124a-2, 125b-1, 219-1, and 9-3 contain many bind-ing sites for homeobox TFs. For example, hsa-mir-124a-2 is asso-ciated with sites for TFs MSX, ZIC1, MEIS1BHOXA9 01, andCREB1CJUN 01, which are known to regulate brain and nervousdevelopmental processes. A T cell-specific miRNA, hsa-mir-142,has a binding site for TF SEF1 C, which is known to be importantfor T cell-specific gene expression. Moreover, let-7 family miRNAs,
which are known to be involved in differentiation processes, arefound to be enriched in the TFs CDP, EVI1, and NKX, involved incell growth and development. It is important to note that there may
be a large number of miRNA-specific TF-binding sites that are notannotated in the databases. The data presented here provide aplatform for subsequent detection of novel TF motifs important forregulation of miRNA expression.
In contrast, the five significant motifs in upstream regions of RefSeq genes are NRF2, SREBP1 01, CREBP1CJUN 01, E2F 02,and RFX1 02 (SI Table 4). NRF2 is the mitochondrial respiratorychain regulator and was also detected as one of the strongest motifsby a previous study (36). Overall, 11 TFs are obtained withsignificant P values and among them, 6 are consistent with the TFsidentified by a previous study (36).
Poly(A) Signals. Pri-miRNAs have been shownto be poly(A) (17, 18,20). To obtain an estimate of the 3 boundary of transcripts, we
0
100
200
300
400
500
600
-10000 -8000 -6000 - 4000 -2000 0 2000 4000 6000 8000 10000
N u m b e r o f T F b i n d i n g s i t e s
Distance (bp)
No clustering1 kb3 kb5 kb7 kb
10 kbRandom Sequences
0
20
40
60
80
100
120
-10000 -8000 -6000 -4000 -2000 0 2000 4000 6000 8000 10000
N u m b e r o f p o l y A s i g n a l s
Distance (bp)
No clustering1Kb3Kb5Kb7kb
10KbRandom Sequences
A AA AA AA AA A AA AA AA AA
TSS TATA
PolyA
Site
PolyA
Site
CpG
0 +1 +2 +3 +4 +5-5 -4 -3 -2 -1
5’ 3’ TF Binding Sites
pre-miRNA
(single or clustered)
a b
c d
BX094730.1
AI695443.1
BM855863.1
AA863395.1
AA863389.1
AI969882.1
BX092498.1
h sa -m iR -2 00 c h sa -m iR -1 41ESTs
6943kb 6944kbChromosome 12 (+)
U_59235
U_592351
U_115145
U_1151451
U_240341
U_2403411
U_59235
U_592351
U_115145
U_1151451
U_240341
U_2403411
DITAG
140
Fig. 2. Distribution of TF-binding site distances in intergenic miRNAs and random sequences. (a) TF-binding site predictions. (b) Poly(A) signal predictions. (c)
The miRNA cluster hsa-mir-200c141withsix matched ESTs andthe 5 /3 endssupported by mapped ditags (U 59235 andU 115145).( d ) Structureof a canonical
human intergenic pri-miRNA.
17722 www.pnas.orgcgidoi10.1073pnas.0703890104 Saini et al .

8/8/2019 Genomic analysis of human microRNA transcripts
http://slidepdf.com/reader/full/genomic-analysis-of-human-microrna-transcripts 5/6
searched for four different poly(A) hexamers in the flankingregions of miRNAs by using the dnafsminer tool (37). The distri-bution of poly(A) signals is shown in Fig. 2 b. We identified a totalof 1,560 instances of these poly(A) hexamers in 249 intergenicmiRNAs. A total of 28 miRNAs had one putative poly(A) signal,41 miRNAs had two poly(A)s, 22 miRNAs had three poly(A)s, andthe remainder had more than four signals. The most frequentlyoccurring hexamers were AATAAA and ATTAAA, comprising31.7% and 25.3% of the total poly(A) hexamers identified, respec-tively. Treating clustered miRNAs as single transcriptional unitsresults in a greater proportion of poly(A) predictions falling 1.8kb downstream of the last miRNA. The mean distance of the first
AATAAA was 830 bp from the 3 end of the pre-miRNA. Thedistribution of poly(A) site predictions in randomly chosen inter-genic sequences is also shown (Fig. 2 b). The number of predictionsin random intergenic sequences is higher in regions flankingmiRNAs, demonstrating that the specificity of the prediction isunsurprisingly poor. A poly(A) hexanucleotide signal alone istherefore insufficient evidence for a 3 end. However, the peak of poly(A) predictions between 0 and 2 kb downstream of pre-miRNAs remains clearly above that in surrounding regions.
Very few miRNAs have experimentally verified poly(A) tails.Lee et al. (18) experimentally characterized the presence of apoly(A) tail at 1,752 bp downstream of hsa-mir-24-2. We alsoidentified a putative poly(A) signal AATAAA with a significantdnafsminer score (0.939) at 1,752 bp downstream of the 3 end of hsa-mir-24-2 in a cluster formed by hsa-mir-23a27a24-2. As
discussed above, we also identified
10 ESTs in the downstreamregion of this cluster, perfectly aligned at 1,771 bp from the 3 endof hsa-mir-24-2. However, no single EST covers the entire cluster.In addition, we found other examples of putative poly(A) signalssupported by proximally aligned ESTs. For instance, a cluster
formed by miRNAs hsa-mir-29b-229c possesses a poly(A) signal(dnafsminer score 0.952) at 311 bp downstream of the 3 endof hsa-mir-29c, close to the ESTs aligned at 333 bp.
GIS-PET. GIS analysis covalently links the 5 and 3 signatures of each full-length transcript into a paired-end ditag (PET) (38).Ditags provide unique identifiers for transcript 5 and 3 endsand are useful in defining their boundaries (38, 39). The pre-diction of TSS sites/CpG islands can be supported by mappingthe 5 end of ditags or 5 CAGE tags in the upstream region.Similarly, mapping of the 3 end of ditags can confirm thelocation of poly(A) tails. We identified a few instances wherethe ditag 5 ends are mapped in the upstream region close to thepredicted TSSs or CpG islands (within 100 bp). For example, thecluster of miRNAs hsa-mir-181c181d is found to contain the 5end of ditags U 443297 and U 166195 at 1,607 bp from the 5end of hsa-mir-181c overlapping w ith predicted CpG islands(present at 1,916 bp upstream of hsa-mir-181c). Similarly,many 3 ditags overlap 3 ends of ESTs. For example, the clusterformed by miRNAs, hsa-mir-200c and hsa-mir-141 is found tocontain ditags U 59235 and U 115145 at 473 bp from the 5 endof hsa-mir-200c and their 3 counterparts present at 230 bp fromthe 3 end of hsa-mir-141. The 3 ditags support the putativepoly(A) signal identified at 211 bp and overlapping ESTsending at 250 bp from the 3 end of hsa-mir-141 (Fig. 2 c). Takentogether, these data strongly suggest that the putative 5 and 3boundaries of cluster hsa-mir-200c141 are approximately
400 bp and
250 bp, respectively, with primary transcriptlength of 1,150 bp.
Prediction of Putative Boundaries of Pri-miRNAs. The data presentedin this work provide strong evidence for the length and boundaries
Table 1. Top 5 of 72 TFs identified within 2 kb upstream of human intergenic miRNAs
TransFac ID TransFac class Factor name Gene ontology P value
MSX1 01 Homeobox MSX1, HOX7: Homeobox protein MSX-1 Skeletal development 0.00004
NCX 01 Homeobox TLX2, HOX11L1, NCX: T cell leukemia homeobox protein 2 Development 0.0047
CDC5 01 Tryptophan clusters Cell division control protein 5 Regulation of transcription 0.0047
SRF 01 Mads Serum response factor RNA polymerase II transcription factor activity; signal
transduction
0.0264
RP58 01 Unannotated Zinc finger protein 238 Negative regulation of transcription from RNA
polymerase II
0.0264
Table 2. High-confidence predictions of boundaries and lengths of primary transcripts of 15 intergenic miRNAs
miRNA/cluster
Chromosome
(strand)
Predicted 5 end
of primary
transcript
Predicted 3 end
of primary
transcript
Predicted length
of primary
transcript, bp Supporting evidence
hsa-mir-200c141 12() 6942737 6943865 1,128 TSS, CpG, ESTs, ditags, poly(A)
hsa-mir-497–195 17() 6861211 6863698 2,487 ESTs, 5 CAGE
hsa-mir-34b34c 11() 110888630 110889820 1,190 TSS, CpG, 5 CAGE, ESTs,
poly(A)
hsa-mir-29b-229c 1() 206041489 206046102 4,613 ESTs, 5 CAGE, ditags, poly(A)hsa-mir-572 4() 10979348 10984460 5,112 TSS, CpG, 5 CAGE, ditags,
ESTs, poly(A)
hsa-mir-124a-1 8() 9794986 9800634 5,648 TSS, CpG, 5 CAGE, ESTs,
poly(A)
hsa-mir-99blet-7e125a 19() 56885133 56888521 3,388 TSS, CpG, 5 CAGE, ESTs
hsa-mir-424-503 X() 133508008 133511322 3,314 TSS, CpG, 5 CAGE, ESTs
hsa-mir-200b200a429 1() 1088033 1094500 6,467 TSS, CpG, 5 CAGE, ditags, ESTs
hsa-mir-223 X() 65152025 65156338 4,313 ESTs, 5 CAGE, poly(A)
hsa-mir-23a27a24–2 19() 13804510 13808884 4,374 ESTs, ditags
hsa-mir-219-2 9() 130193109 130195318 2,209 TSS, CpG, 5 CAGE, ditags, ESTs
hsa-mir-210 11() 555660 558587 2,927 TSS, CpG, 5 CAGE, ESTs,
poly(A)
hsa-let-7i 12() 61283559 61284132 573 TSS, CpG, ESTs, ditags, poly(A)
hsa-mir-92b 1() 153431072 153432003 931 TSS, CpG, 5 CAGE, ESTs, ditags
Saini et al . PNAS November 6, 2007 vol. 104 no. 45 17723

8/8/2019 Genomic analysis of human microRNA transcripts
http://slidepdf.com/reader/full/genomic-analysis-of-human-microrna-transcripts 6/6
of pri-miRNAs and the transcription of clustered polycistronicmiRNAs. Although each feature represents only a small piece of evidence for a transcript end, the combined weight of the diversityand number of analyzed features delineates many 5 and 3 bound-aries of pri-miRNAs with high confidence. The 15 best supportedpri-miRNAs [by TSS, CpG, EST, ditag, and poly(A) data] are given(Table 2). Detailed graphical views of these and other examples areprovided in SI Table 5. It is clear that the length of the primarytranscript varies greatly, from 0.5 kb to 7 kb in the 15 examples. In
addition, a small set of pri-miRNAs (hsa-mir-374
545, hsa-mir-9-2,hsa-mir-193b365-1, hsa-mir-181c181d) appear to have length10 kb (see SI Table 6). Furthermore, we are able to predict onlythe 5 or 3 end of the primary transcript of a much larger numberof miRNAs (SI Table 7). Based on these results, we derive acanonical structure of the mammalian miRNA primary transcript(Fig. 2 d) showing the TSS, CpG islands, and overlapping TF sites
within 2 kb upstream and poly(A) signal 2 kb downstream of theprecursor miRNA.
Conclusions
Little is known about the structure of pri-miRNA transcripts.Previous studies have focused on individual features (23, 24).In contrast, we present a survey of multiple genomic featuresof approximately hundreds of annotated miRNAs in the
human genome, the most comprehensive analysis of miRNAtranscriptional features to date. This analysis has allowed usto delineate the boundaries of a significant proportion of intergenic human miRNAs.
Our results demonstrate that transcriptional features in flankingsequences of miRNA precursors provide strong evidence for theboundaries of pri-miRNAs and for the cotranscription of clusteredmiRNAs. TSS and CpG island predictions demarcate the 5 ends of many intergenic miRNA transcripts. The data analyzed indicatethat a significantfraction of human intergenic miRNAs possess TSSsites within 2 kb of the pre-miRNA. Most CpG islands are foundin close proximity to these TSS sites. Poly(A) sites define and
predict 3 boundaries. We show that the distribution of poly(A)signals peaks at 2 kb downstream of the pre-miRNA.
Combining these signal prediction results with EST and expres-sion ditag data provides strong evidence that many human inter-genicmiRNAsare encoded by primary transcripts 3–4 kb long,witha small fraction of longer transcripts up to 6 kb (Fig. 2 d). Previousdetailed experimental studies of small numbers of pri-miRNAshave also shown transcript lengths of 1–4 kb (17, 18, 20).
Obviously, experimental work is required to determine unam-
biguously exact pri-miRNA transcript lengths. In contrast, thecomputational results presented here provide bounds on pri-miRNA transcript lengths, together with a set of high confidence,strongly supported pri-miRNA predictions in an efficient andtimely manner. These predictions provide a large-scale look atfeatures surrounding intergenic miRNAs and as such represent asignificant step in our understanding of their transcription.
Materials and Methods
Obtaining Human Pre-miRNAs. We obtained genomic coordinates of 474 human pre-miRNAs from the miRBase miRNA sequencedatabase (version 9.0) (40). The human genome sequences andannotations were obtained from Ensembl release 42 (WellcomeTrust Sanger Institute, Cambridge, U.K.) (41) and are clusteredaccording to their genomic distance. For full details, see SI Materials
and Methods .
Obtaining Genomic Features. Flanking sequence data, TSSs (SI Fig.5), and GIS-PET data were obtained from Ensemble (41, 42).TF-binding sites were obtained using the UCSC browser (34, 43,44). Poly(A) signals were predicted using the dnafsmimer method.For details, please see SI Materials and Methods.
We thank members of Team101 at the Wellcome Trust SangerInstitute for useful discussion and advice. H.K.S. was supported by aGlaxo-SmithKline postdoctoral fellowship. S.G.-J. was supported bythe Wellcome Trust and the University of Manchester, and A.J.E. wassupported by the Wellcome Trust.
1. Bartel DP (2004) Cell 116:281–297.
2. Pasquinelli AE, Hunter S, Bracht J (2005) Curr Opin Genet Dev 15:200–205.3. Wightman B, Ha I, Ruvkun G (1993) Cell 75:855–862.4. Giraldez AJ, Mishima Y, Rihel J, Grocock RJ, Van Dongen S, Inoue K, Enright
AJ, Schier AF (2006) Science 312:75–79.5. Lewis BP, Shih IH, Jones-Rhoades MW, Bartel DP, Burge CB (2003) Cell
115:787–798.6. Enright AJ, John B, Gaul U, Tuschl T, Sander C, Marks DS (2003) Genome Biol
5:R1.7. Alvarez-Garcia I, Miska EA (2005) Development (Cambridge, UK) 132:4653–
4662.8. Calin GA, Dumitru CD, Shimizu M, Bichi R, Zupo S, Noch E, Aldler H, Rattan
S, Keating M, Rai K, et al. (2002) Proc Natl Acad Sci USA 99:15524–15529.9. Caudy AA, Myers M, Hannon GJ, Hammond SM (2002) Genes Dev 16:2491–
2496.10. McManus MT (2003) Semin Cancer Biol 13:253–258.11. Calin GA, Sevignani C, Dumitru CD, Hyslop T, Noch E, Yendamuri S, Shimizu
M, Rattan S, Bullrich F, Negrini M, Croce CM (2004) Proc Natl Acad Sci USA101:2999–3004.
12. Calin GA, Ferracin M, Cimmino A, Di Leva G, Shimizu M, Wojcik SE, Iorio MV,
Visone R, Sever NI, Fabbri M, et al. (2005) N Engl J Med 353:1793–1801.13. Lagos-Quintana M, Rauhut R, Yalcin A, Meyer J, Lendeckel W, Tuschl T (2002)Curr Biol 12:735–739.
14. Lu J, Getz G, Miska EA, Alvarez-Saavedra E, Lamb J, Peck D, Sweet-Cordero A, Ebert BL, Mak RH, Ferrando AA, et al. (2005) Nature 435:834–838.
15. Lee Y, Jeon K, Lee JT, Kim S, Kim VN (2002) EMBO J 21:4663–4670.16. Cullen BR (2004) Mol Cell 16:861–865.17. Cai X, Hagedorn CH, Cullen BR (2004) RNA 10:1957–1966.18. Lee Y, Kim M, Han J, Yeom KH, Lee S, Baek SH, Kim VN (2004) EMBO J
23:4051–4060.19. Rodriguez A, Griffiths-Jones S, Ashurst JL, Bradley A (2004) Genome Res
14:1902–1910.20. Bracht J, Hunter S, Eachus R, Weeks P, Pasquinelli AE (2004) RNA 10:1586–
1594.21. Houbaviy HB, Dennis L, Jaenisch R, Sharp PA (2005) RNA 11:1245–1257.22. Borchert GM, Lanier W, Davidson BL (2006) Nat Struct Mol Biol 13:1097–1101.23. Gu J, He T, Pei Y, Li F, Wang X, Zhang J, Zhang X, Li Y (2006) Mamm Genome
17:1033–1041.
24. Zhou X, Ruan J, Wang G, Zhang W (2007) PLoS Comput Biol 3:e37.
25. Stormo GD (2000) Genome Res 10:394–397.26. Down TA, Hubbard TJ (2002) Genome Res 12:458–461.27. Altuvia Y, Landgraf P, Lithwick G, Elefant N, Pfeffer S, Aravin A, Brownstein
MJ, Tuschl T, Margalit H (2005) Nucleic Acids Res 33:2697–2706.28. Bird AP (1986) Nature 321:209–213.29. Lujambio A, Ropero S, Ballestar E, Fraga MF, Cerrato C, Setien F, Casado S,
Suarez-Gauthier A, Sanchez-Cespedes M, Gitt A, et al. (2007) Cancer Res67:1424–1429.
30. Saito Y, Liang G, Egger G, Friedman JM, Chuang JC, Coetzee GA, Jones PA(2006) Cancer Cell 9:435–443.
31. Barad O, Meiri E, Avniel A, Aharonov R, Barzilai A, Bentwich I, Einav U, GiladS, Hurban P, Karov Y, et al. (2004) Genome Res 14:2486–2494.
32. Sempere LF, Freemantle S, Pitha-Rowe I, Moss E, Dmitrovsky E, Ambros V(2004) Genome Biol 5:R13.
33. Pruitt KD, Tatusova T, Maglott DR (2005) Nucleic Acids Res 33:D501–D504.34. Karolchik D, Baertsch R, Diekhans M, Furey TS, Hinrichs A, Lu YT, Roskin KM,
Schwartz M, Sugnet CW, Thomas DJ, et al. (2003) Nucleic Acids Res 31:51–54.35. Sethupathy P, Megraw M, Barrasa MI, Hatzifeorgiou AG (2005) Lecture Notes
Comput Sci 3746:457–468.
36. Xie X, Lu J, Kulbokas EJ, Golub TR, Mootha V, Lindblad-Toh K, Lander ES,Kellis M (2005) Nature 434:338–345.
37. Liu H, Han H, Li J, Wong L (2005) Bioinformatics 21:671–673.38. Ng P, Wei CL, Sung WK, Chiu KP, Lipovich L, Ang CC, Gupta S, Shahab A,
Ridwan A, Wong CH, et al. (2005) Nat Methods 2:105–111.39. Peters BA, Velculescu VE (2005) Nat Methods 2:93–94.40. Griffiths-Jones S, Grocock RJ, van Dongen S, Bateman A, Enright AJ (2006)
Nucleic Acids Res 34:D140–D144.41. Birney E, Andrews D, Caccamo M, Chen Y, Clarke L, Coates G, Cox T,
CunninghamF, CurwenV, Cutts T, etal. (2006) Nucleic AcidsRes 34:D556–D561.42. Stabenau A, McVicker G, Melsopp C, Proctor G, Clamp M, Birney E (2004)
Genome Res 14:929–933.43. Matys V, Fricke E, Geffers R, Gossling E, Haubrock M, Hehl R, Hornischer K,
Karas D, Kel AE, Kel-Margoulis OV, et al. (2003) Nucleic Acids Res 31:374–378.44. Hinrichs AS, Karolchik D, Baertsch R, Barber GP, Bejerano G, Clawson H,
Diekhans M, Furey TS, Harte RA, Hsu F, et al. (2006) Nucleic Acids Res34:D590–D598.
17724 www.pnas.orgcgidoi10.1073pnas.0703890104 Saini et al .