genomic selection –from theory to practice
TRANSCRIPT
Genomic selection – from theory to practice
J.M. Hickey

Outline• Genomic selection– How it works
– Its performance• Factors affecting performance• Impact on design of genomic selection system
– A system to perform it • Training population• Imputation

Concept of Genomic Selection

Genomic selection
• Meuwissen, Hayes, Goddard (2001) Genetics
• Complete coverage of genome with markers
• All QTL in linkage disequilibrium with at least 1 marker
• No QTL size thresholds needed
• Accurate breeding values of individuals at birth

Genomic selection
• Meuwissen, Hayes, Goddard (2001) Genetics
• Complete coverage of genome with markers
• Exploits linkage disequilibrium between markers and QTL
• No QTL size thresholds needed
• Accurate breeding values of individuals at birth
Was based on common QTL of large sizeRelatively easy to find
Work across the populationEasy
BUT
Real data results indicate that the true model is polygenic

Performance of Genomic Selection

Genomic selection – what has been achieved?
• Performance measured by correlation with true breeding value
• 0.85 achieved in simulation
• 0.83 for Holstein-Friesian cattle

Genomic selection – what has been achieved?
• Example of results from US dairy industry– Wiggans et al. (2010) WCGALP
Trait Parent average reliability
Genomic reliability
Increase in reliability
Milk (kg) 38.5 71.0 32.5Fat (kg) 38.5 75.6 37.1Protein (kg) 38.5 65.6 27.2Fat (kg) 38.5 90.8 52.3Protein (kg) 38.5 78.5 40.0PL (months) 31.6 60.4 28.7SCS 34.2 61.6 27.3DPR (%) 30.7 48.1 17.4

Genomic selection – what has been achieved?
• 0.00 achieved in simulation
• 0.01 to 0.71 for Australian sheep
Accuracy for a sample of traits and breedsTrait Merino Border Leicester Terminal
Post Weaning Weight 54% 39% 8%
Scanned Eye Muscle Depth 66% 24% 47%
Scanned Fat Depth 57% 13% 30%

Why the different results?
• Genomic selection parameterises:– QTL effects – Relationships
• Good performance in simulation– Small number of large QTL effects
• Good performance in real data– Closely related individuals– Measure of accuracy reflect breed / genetic group effects?
Genomic selection – why the different results?
• Poor performance in simulation– Distant relationships– Infinitesimal model / many QTL of very small effect
• Poor performance in real data– Distant relationships– Very little evidence of QTL effects of estimable size

What the current literature tells us?
• Increasing evidence in the literature that most traits are not controlled by common mutations with large effect
• Visscher, 2008 (Nature Genetics)– Common variants of estimable size only explain 10% of variance in human height
• Yang et al., 2010 (Nature Genetics)– Most of the remaining variance is in common variants of small effect
• Buckler et al., 2009 (Science)– Common loci with many variants
• Jannink et al., 2010 (Briefings in Functional Genomics)– Based on a review of several empirical studies concluded that polygenic model is more
likely

Habier et al., 2010

Habier et al. 2010
• Constructed data sets such that relationships between training and validation data sets vary
• How does this affect accuracy?

Habier et al. 2010

What this means for genomic predictions?
• QTL effects versus Relationships– Different selection possibilities
• Accurately estimated QTL effects– Predictions persist across families and breeds
• Accurately estimated relationships– Predictions only work within closely related individuals
• Are we selecting between families or within families?– This will affect inbreeding rates

Summarising all of this• Genomic selection is an excellent tool
• It has delivered in the industry
• Most of the predictive power comes from linkage or relationship information
• All published empirical measures of accuracy are meaningless unless the relationship between the training and target/validation data sets are known
• Its practical implementation is outpacing its theoretical basis

The design of a system to perform genomic selection

Genomic selection- design of a system to perform it
• Size and diversity of reference population
• X’X-1
• Relationship of selection candidates to reference
• Ability to separate effects of LD, Linkage, and genetic group
• Validation– Measure of performance– How well can we distinguish
between full sibs?

As the number of animals in training population increases the accuracy increases
Size of training data set

As the number of animals in training population increases the accuracy increases
Size of training data set
These equations are based on LD and QTL of with estimable effect sizes and do not model
the effect of relationships
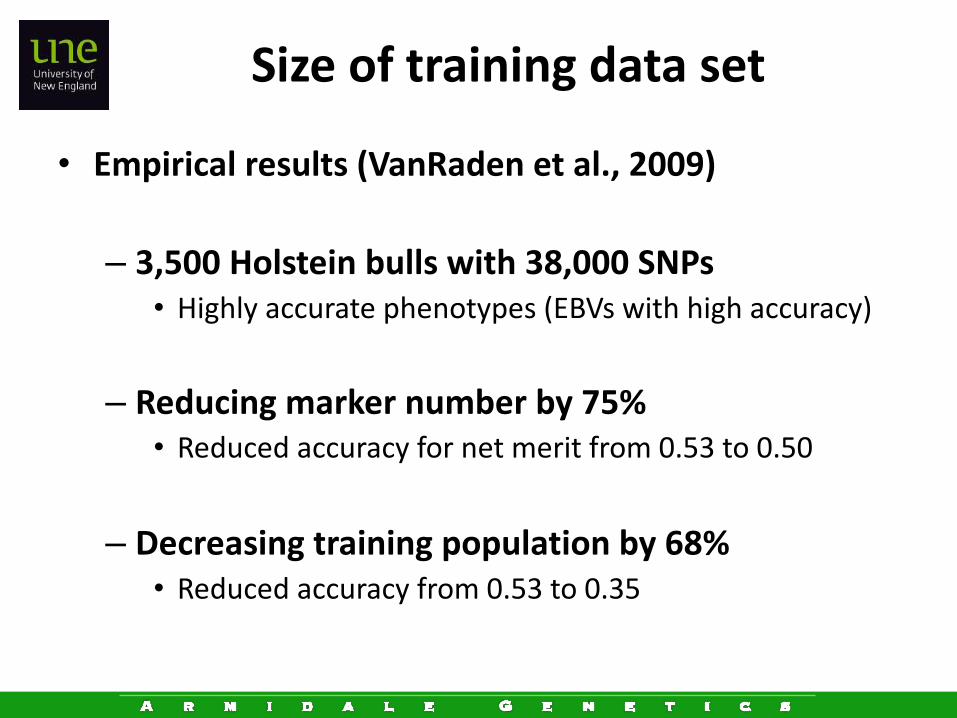
Size of training data set
• Empirical results (VanRaden et al., 2009)
– 3,500 Holstein bulls with 38,000 SNPs• Highly accurate phenotypes (EBVs with high accuracy)
– Reducing marker number by 75% • Reduced accuracy for net merit from 0.53 to 0.50
– Decreasing training population by 68% • Reduced accuracy from 0.53 to 0.35

The promise and problem of sequence data

The design of a system to perform genomic selection
What can imputation add?

Imputation• Filling in missing data
• Can be used to reduce genotyping costs
• Genotype – small subset of individuals for all markers – some individuals for some markers– remaining animals for NO MARKERS
• Fill in missing markers
• Based on tracking of haplotypes– Bits of genome inherited from a parent without a recombination

Example of haplotypes

Segregation analysis and haplotype library imputation
• Individual’s are densely, sparsely, or not genotyped
• Pedigree information available
• Single locus segregation analysis for each SNP
• Match each pair of haplotypes with low density genotypes and genotype probabilities
1 2
7 8 119 10
13
6543
14 15
Haplotype library for population
General pedigree with its haplotypes represented

Segregation analysis and haplotype library imputation
• Individual’s are densely, sparsely, or not genotyped
• Pedigree information available
• Single locus segregation analysis for each SNP
• Match each pair of haplotypes with low density genotypes and genotype probabilities
1 2
7 8 119 10
13
6543
14 15
Haplotype library for population
Genotyping strategy in terms of high density, low density and not genotyped

Probability of carrying a given genotype
1 2 2 0 1? ? ? ? ? ? ? ? ? ? ? ? ? ? ?
.1 .2 .2 .2 .1 .0 1 .3 .1 .3 .5 .4 .7 .1 .3
.3 .4 .5 .8 .6 .5 .0 .7 .3 .5 .3 .4 .2 .3 .6
.6 .4 .3 .0 .3 .5 .0 .0 .6 .2 .2 .2 .1 .4 .11 2 2 0 1
1 2 2 0 12 1 0 1 1 2 1 0 1 2 0 0 1 1 0
1 0 1 0 2 1 1 2 1 0 0 1 0 2 0 0 1 1 0 0
1 .1 .4 .2 1 [LogSum of these]
High density genotype
Low density genotype
Genotype probabilities
A candidate haplotype pair
“Genotype probability”

Pedigree free imputation• fastPHASE and IMPUTE2 are popular software
• How it works– Haplotypes are assumed to form clusters
– Observed gametes are mosaics of segments originating from different clusters
– Alleles at adjacent loci usually originate in the same cluster but with a transition probability of changing to another cluster
– Missing genotypes are filled in based on probability of belonging to each cluster and the frequency of each allele in each cluster

Imputation – Effect on accuracy of genomic selection
• Weigel et al., 2010 (JDS)– Jersey cattle– Method for imputation used IMPUTE2– Average accuracy using all 42000 SNPs• 0.70 across 3 traits
Average accuracy when masking and imputing % of SNPs% Markersgenotyped
Imputation accuracy
Average accuracy of GEBV with imputation
Average accuracy of GEBV without imputation
7 0.90 0.68 0.64
4 0.86 0.64 0.57
2 0.78 0.58 0.54
1 0.73 0.44 0.48

CIMMYT Maize project• Data– 4 different association mapping panels of Global Maize Program
• Drought• Low Nitrogen• Carotenoids• Nutritional Quality
– 1227 lines genotyped for 53,401 SNP
• Routine edits– 35,081 SNP– 1163 lines

Conclusions and summary

My opinion• Genomic selection works best in close relatives
– Move to an IBD / linkage based framework– Imputation should focus more on imputation of IBD rather than genotype
• Design of your reference population and its relationship to the prediction population is vital
• SNPs can parameterise breed effects, linkage and relationship effects and LD / large QTL effects– These have different economic values to breeding programs
• What is being predicted and parameterised?• How well are the breeding values of full sibs distinguished?

Armidale Animal Breeding Summer
Course February 2011
Statistical methods and design in plant breeding and genomicsDr Ian MackayNational Institute of Agricultural Botany
Cambridge, UK
IBD inference in genome association studiesProfessor Elizabeth ThompsonUniversity of Washington
Seattle, WA, USA
http://www-personal.une.edu.au/~jvanderw/aabc2011.htm
Google “Julius van der Werf Armidale” and follow links to summer course

Acknowledgements• Supervision and mentoring
– Julius van der Werf– Brian Kinghorn– Bruce Tier
• Useful discussions– Matt Cleveland
• Funding – Australian Research Council– Genus PTY– Aviagen LTD– Pfizer Animal Genetics– Sheep CRC

“Genetics thrives in Armidale!”

Methods to estimate breeding values from Genomic Data

Methods to perform genomic selection
• Genomic BLUP
• Random Regression BLUP
• Bayesian methods – A, B, C, Cpi, Lasso
• Other methods

Methods to perform genomic selection
• GBLUP– Replaces the traditional relationship matrix in the BLUP
equations with genomic relationship matrix
• Random regression BLUP– Simultaneously fits all SNPs individually– Fitted as random effects– Homogeneous shrinkage parameter for each SNP– Algebraically identical to GBLUP
• Bayesian methods– Simultaneously fits all SNPs individually– Fitted as random effects– Heterogeneous shrinkage parameter for each SNP

Bayesian methods – some detail
• Random regression BLUP – Homogeneous shrinkage parameter for each SNP
• Bayes A– Heterogeneous shrinkage parameter for each SNP– Effects are exponentially distributed a priori– SNPs can have effects close to zero but crucially never zero
• Bayes B – Heterogeneous shrinkage parameter for each SNP– Effects are exponentially distributed a priori– A parameter π forces a proportion of SNP to have zero effect

BLUP based methods
• Misztal and co-workers
• Combine Genomic BLUP and classical pedigree based BLUP
• Method– Augment pedigree based relationship matrix with genomic
relationship matrix
• Problems

Alpha Programs• AlphaBayes
– Performs Bayesian GWAS and Genomic selection
– BayesA, B, C, Cpi, Lasso, Random Regression BLUP
– Classical BLUP and variance component estimation
– Fixed effects, Pedigree effects, SNP effects
• AlphaPhase– General haplotyping software
– Performs equally well with and without pedigree information
– Does not require specific family structures
• AlphaImpute– Imputation program
– Under development
– Expected to be released in January 2011
http://sites.google.com/site/hickeyjohn/home