genomics in medicine: an introduction to genomics: breast cancer
TRANSCRIPT
Lawrence Brody, Ph.D.
An Introduction to Genomics: Breast cancer genes, risk assessment and screening
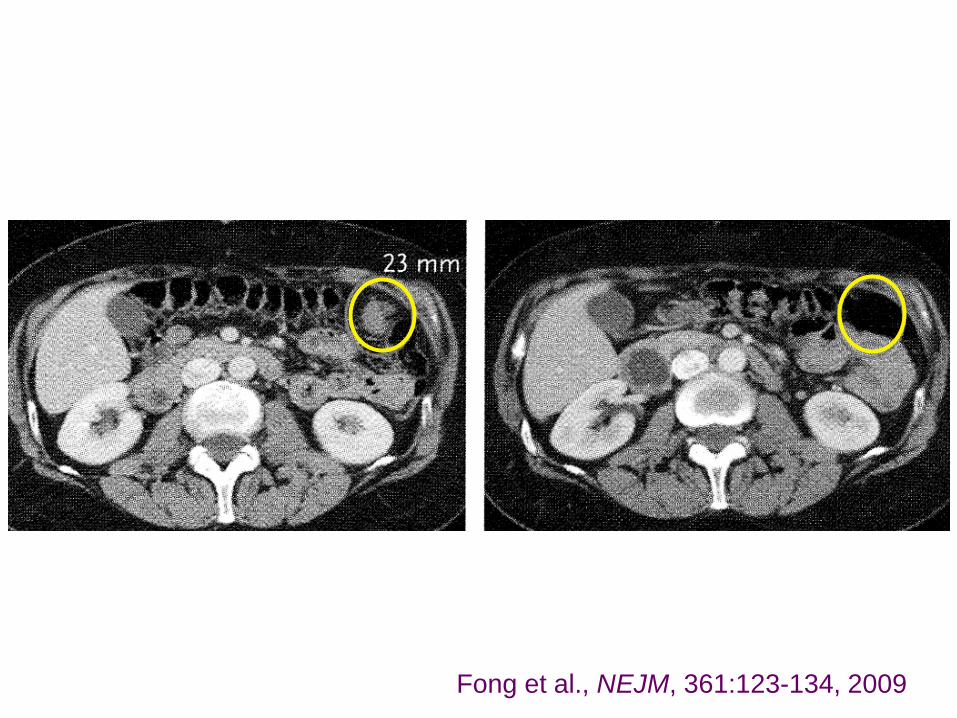
Fong et al., NEJM, 361:123-134, 2009
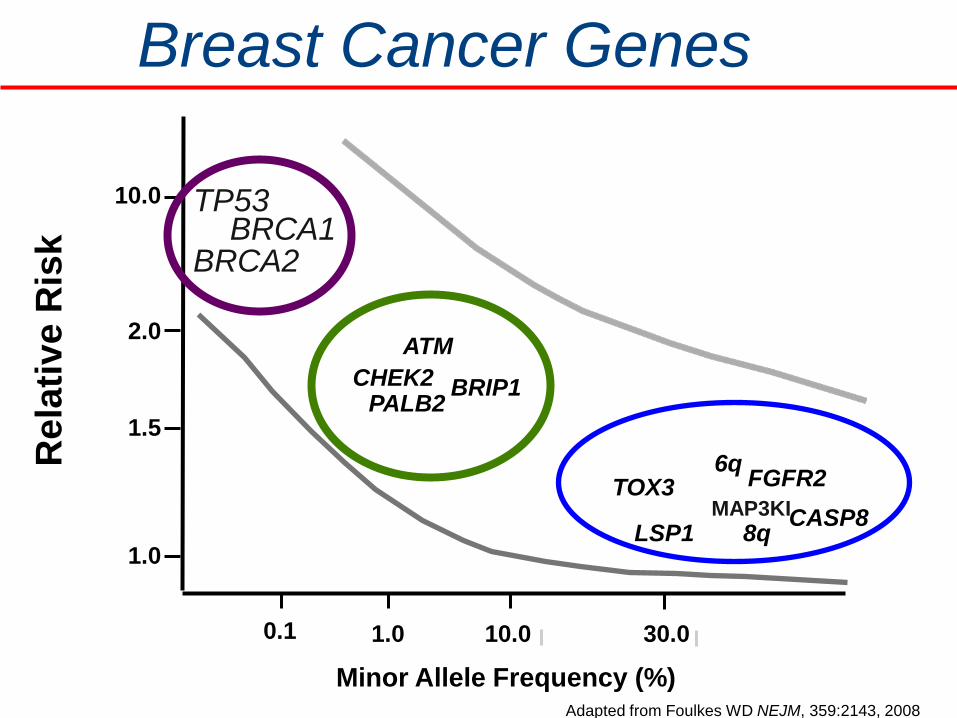
Breast Cancer Genes
What are they?
How do we find them?
What is their function?
How can they be used to improve health?
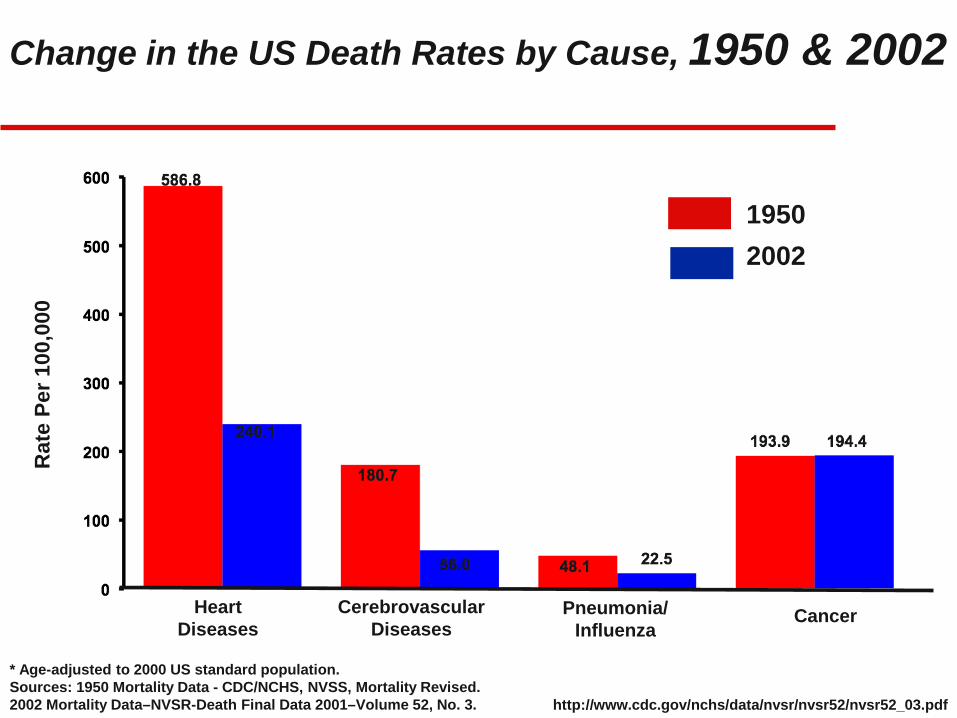
Change in the US Death Rates by Cause, 1950 & 2002
* Age-adjusted to 2000 US standard population. Sources: 1950 Mortality Data - CDC/NCHS, NVSS, Mortality Revised. 2002 Mortality Data–NVSR-Death Final Data 2001–Volume 52, No. 3.
Heart Diseases
Cerebrovascular Diseases
Pneumonia/ Influenza
Cancer
1950 2002
Rat
e Pe
r 100
,000
http://www.cdc.gov/nchs/data/nvsr/nvsr52/nvsr52_03.pdf
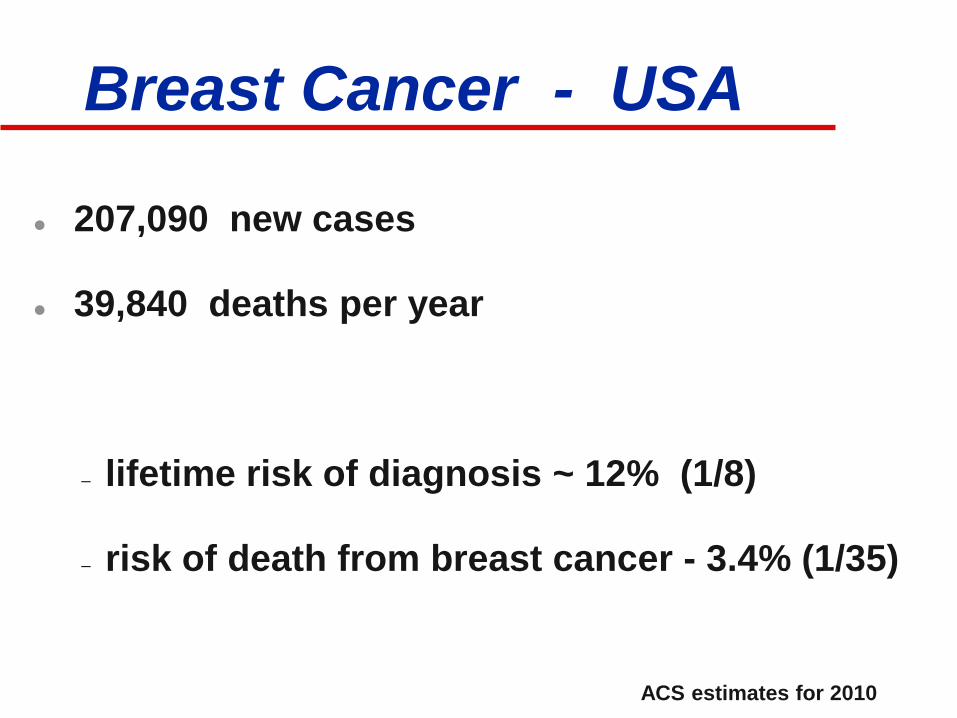
Breast Cancer - USA
207,090 new cases
39,840 deaths per year
– lifetime risk of diagnosis ~ 12% (1/8)
– risk of death from breast cancer - 3.4% (1/35)
ACS estimates for 2010
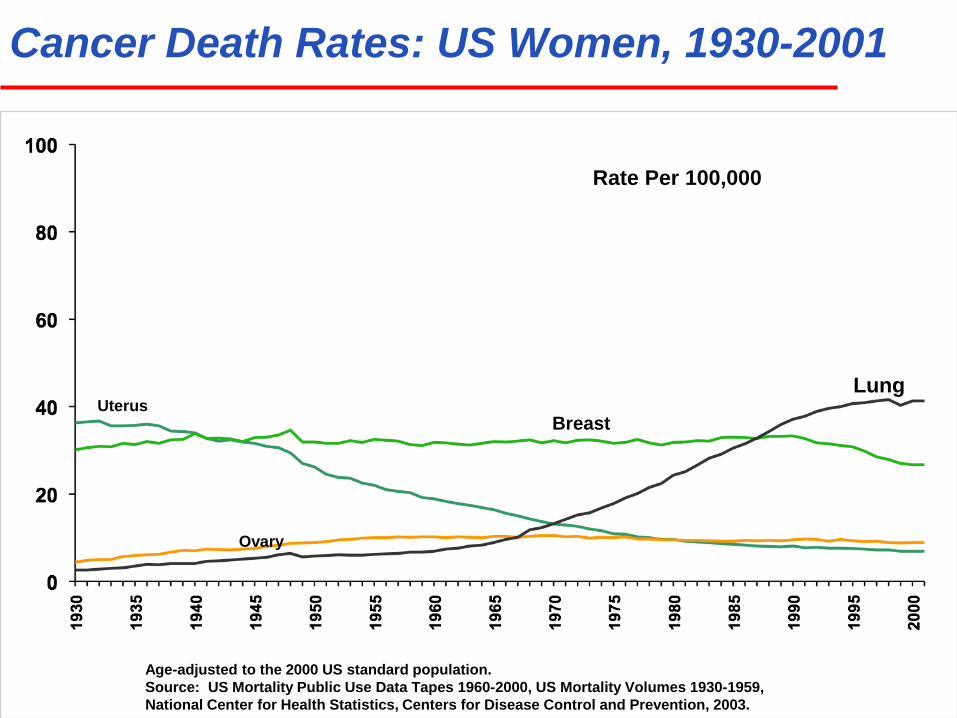
Cancer Death Rates: US Women, 1930-2001
Age-adjusted to the 2000 US standard population. Source: US Mortality Public Use Data Tapes 1960-2000, US Mortality Volumes 1930-1959, National Center for Health Statistics, Centers for Disease Control and Prevention, 2003.
Lung Uterus
Breast
Ovary
Rate Per 100,000

Cancer Incidence: US Women, 1978-2008
SEER Data
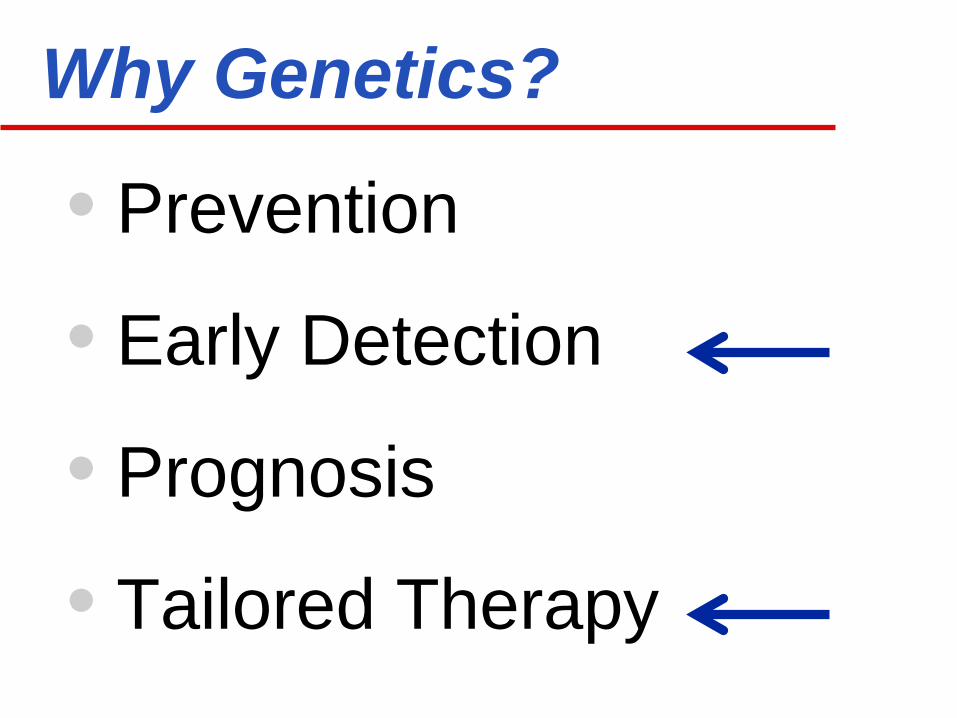
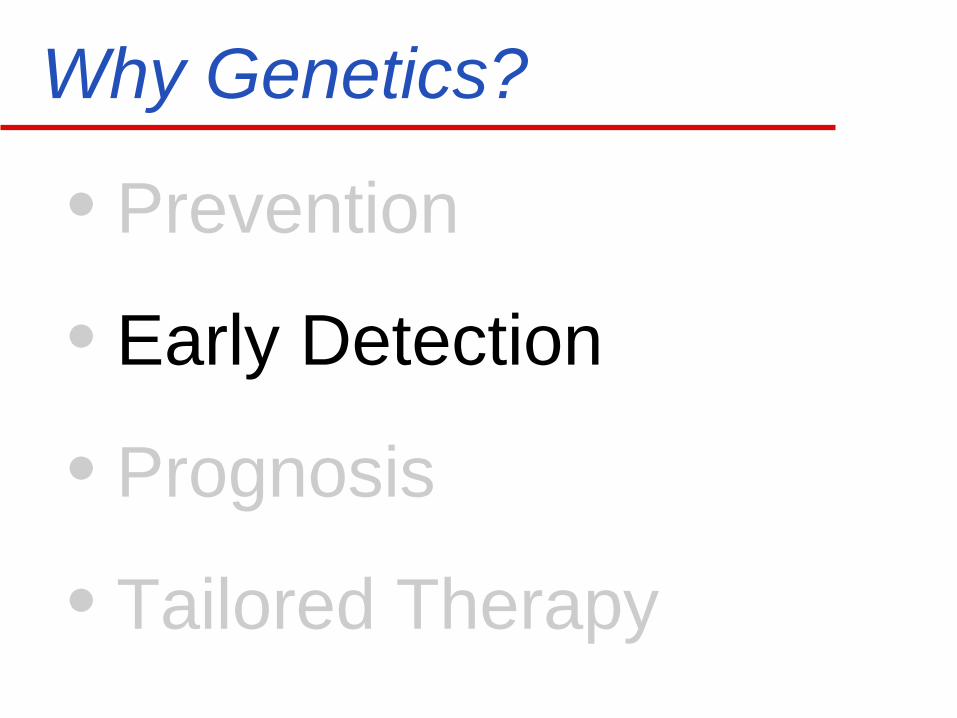
Why Genetics?
• Prevention
• Early Detection
• Prognosis
• Tailored Therapy
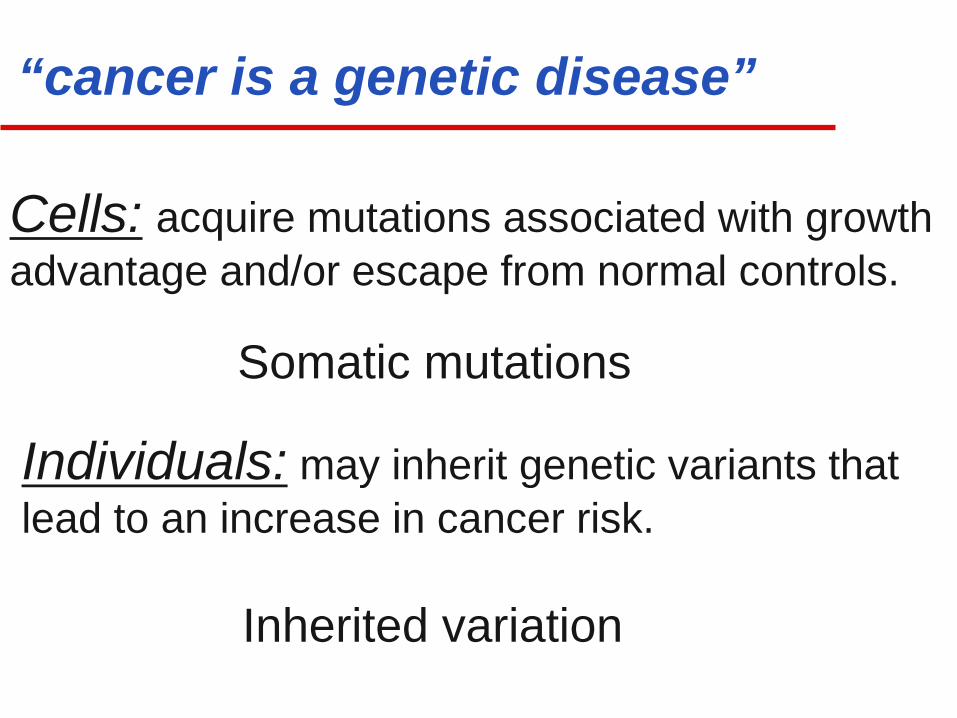
Individuals: may inherit genetic variants that lead to an increase in cancer risk.
Cells: acquire mutations associated with growth advantage and/or escape from normal controls.
Somatic mutations
“cancer is a genetic disease”
Inherited variation
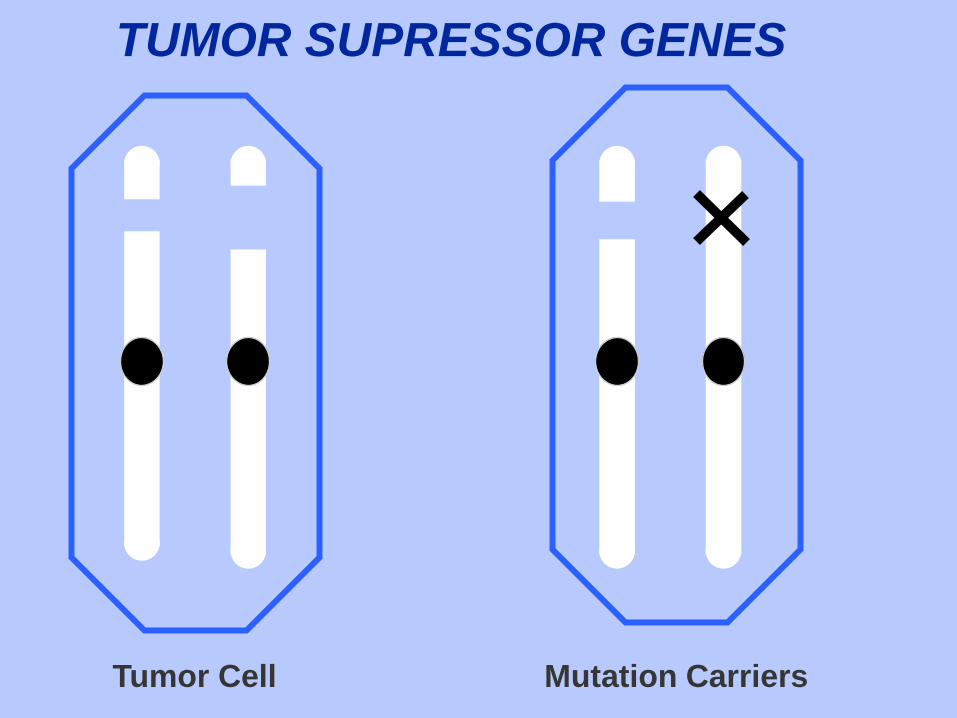
TUMOR SUPRESSOR GENES
Mutation Carriers Tumor Cell
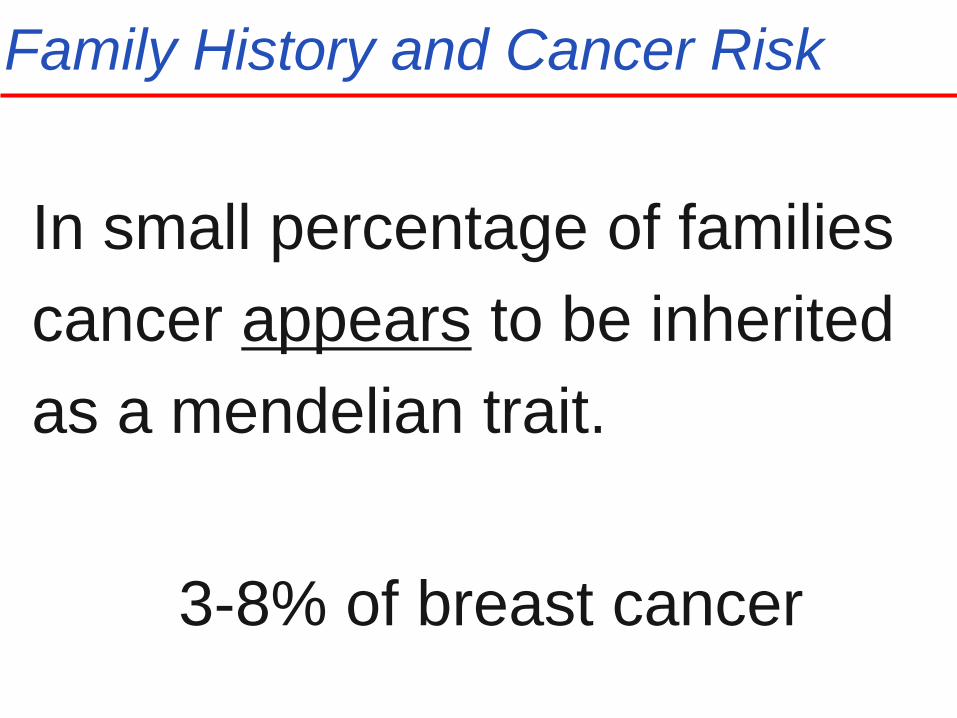
Family History and Cancer Risk
In small percentage of families cancer appears to be inherited as a mendelian trait.
3-8% of breast cancer
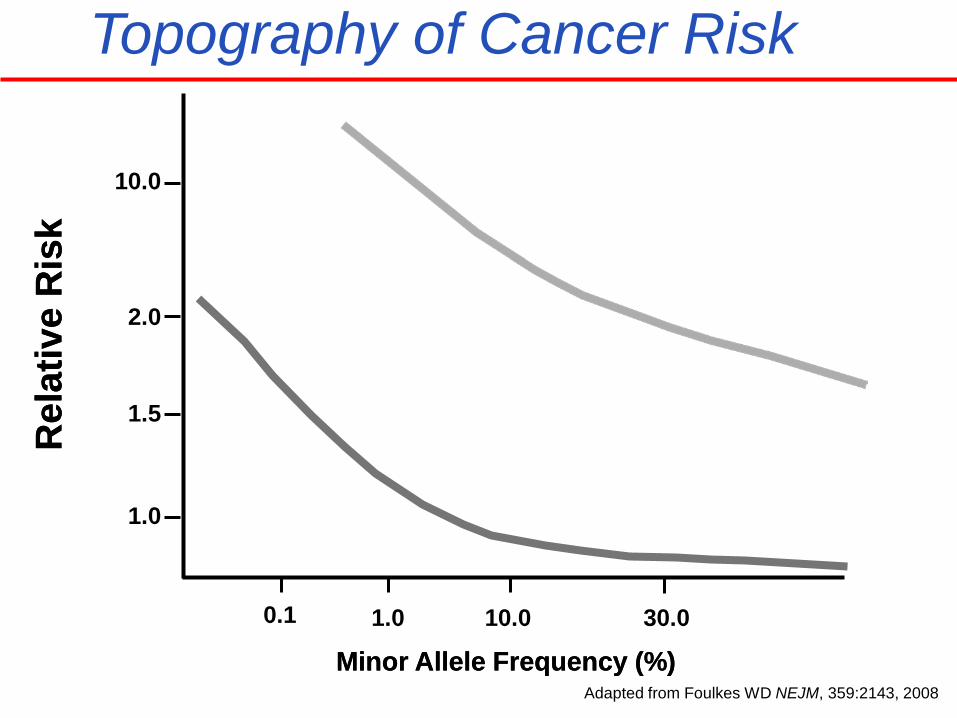
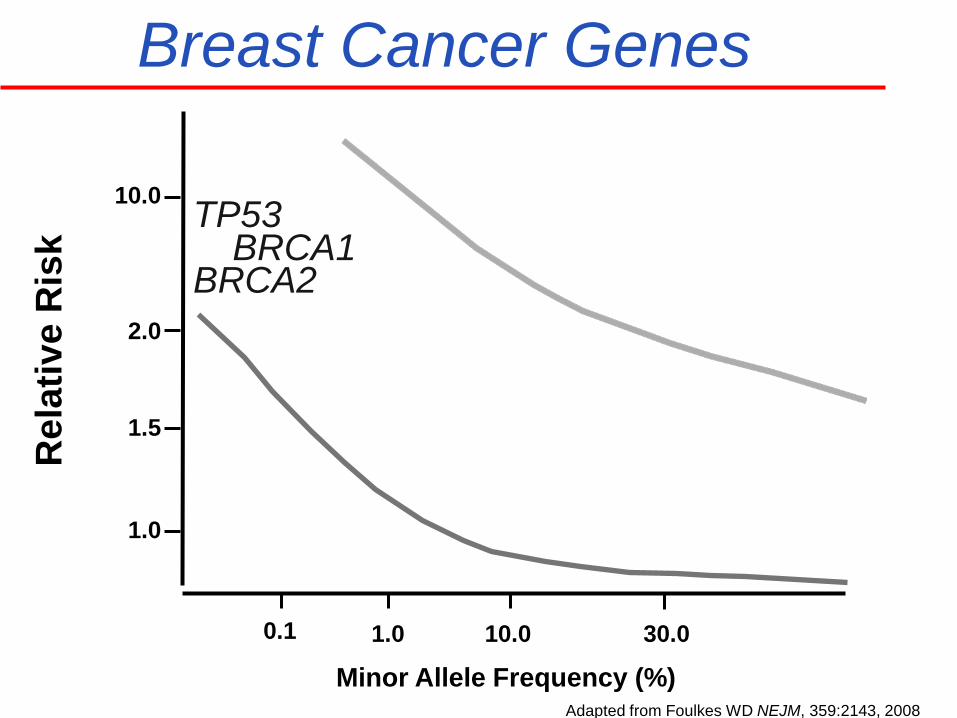
Topography of Cancer Risk
Rel
ativ
e R
isk
Minor Allele Frequency (%)
Rel
ativ
e R
isk
Minor Allele Frequency (%)
10.0
2.0
1.0
0.1 1.0 10.0 30.0
1.5
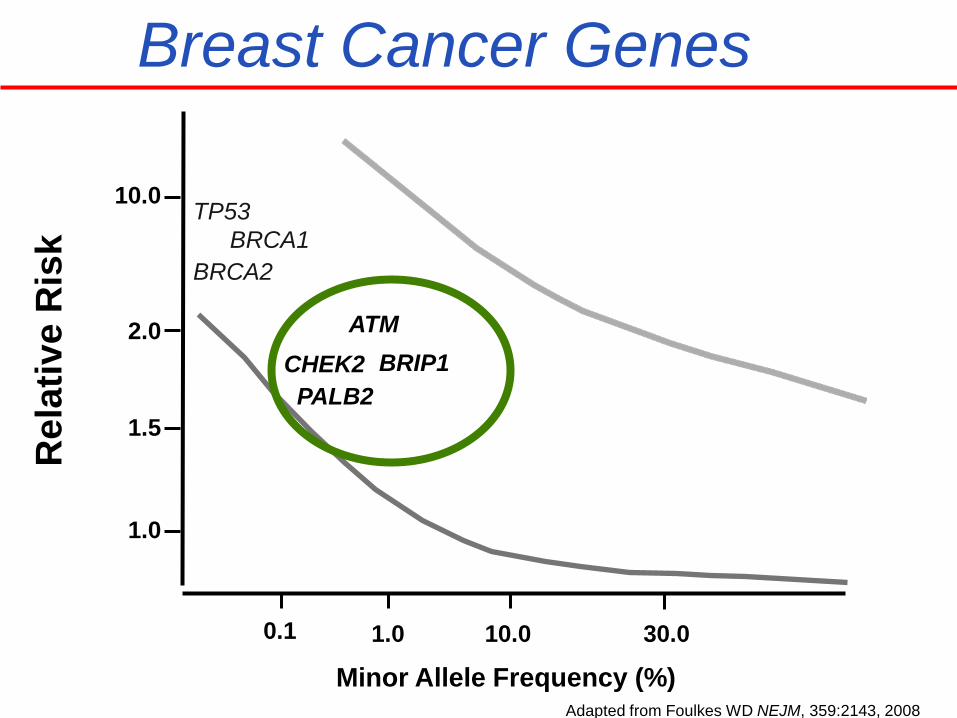
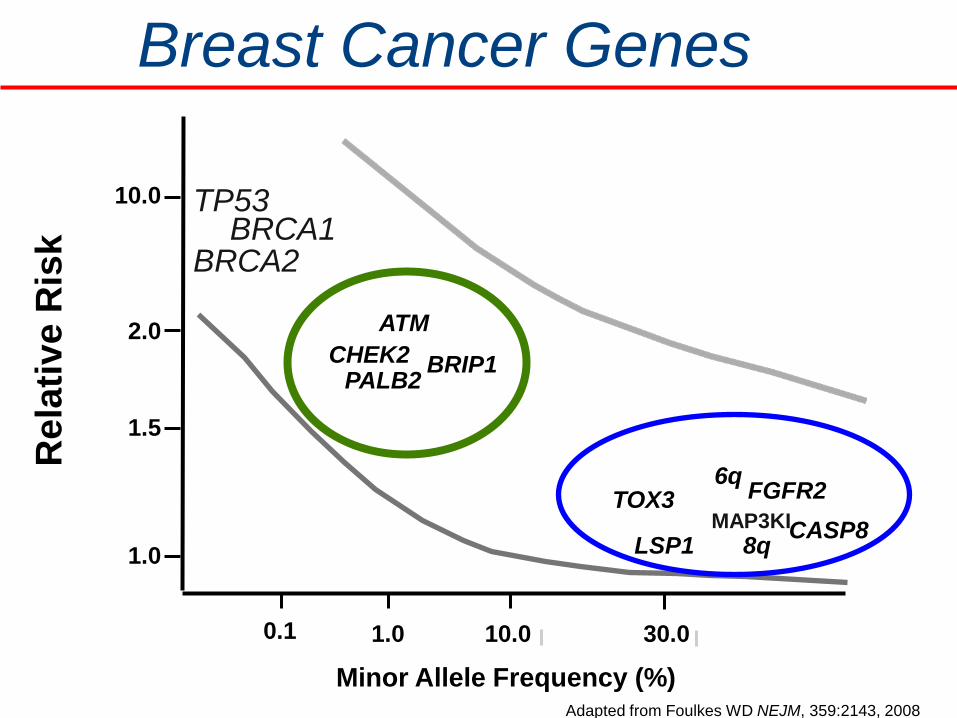
Adapted from Foulkes WD NEJM, 359:2143, 2008
Topography of Cancer Risk
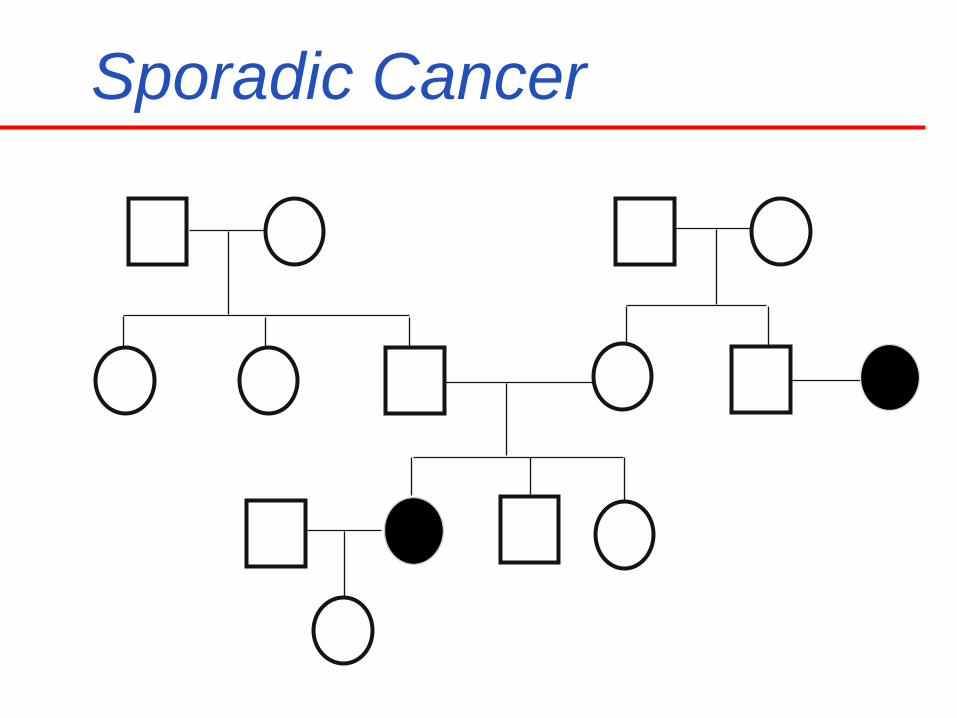
Sporadic Cancer

Inherited Cancer
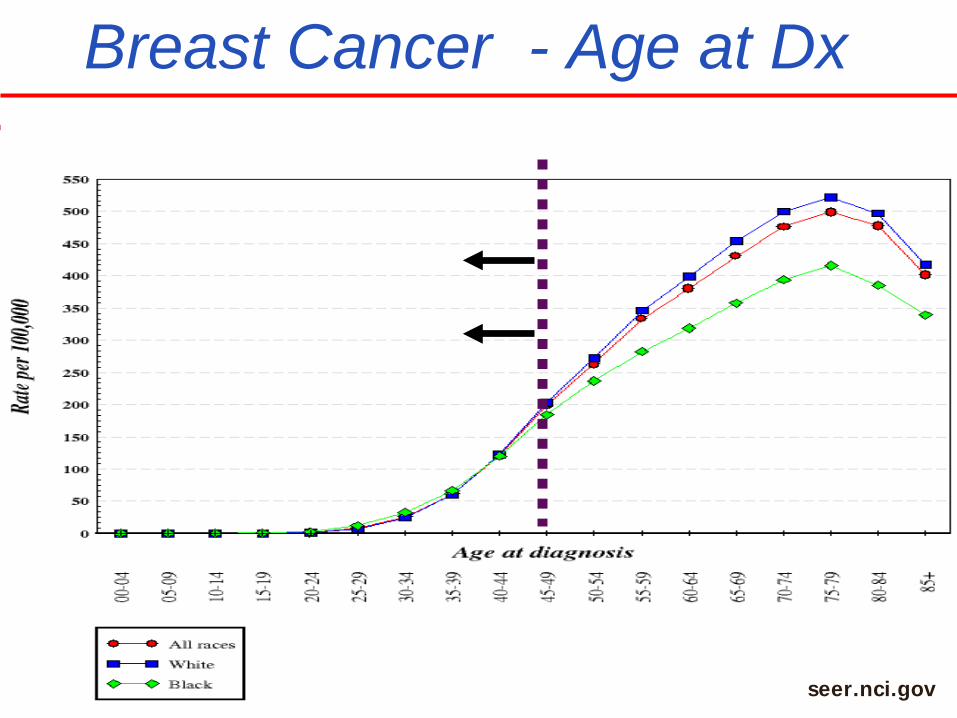
Breast Cancer - Age at Dx
seer.nci.gov
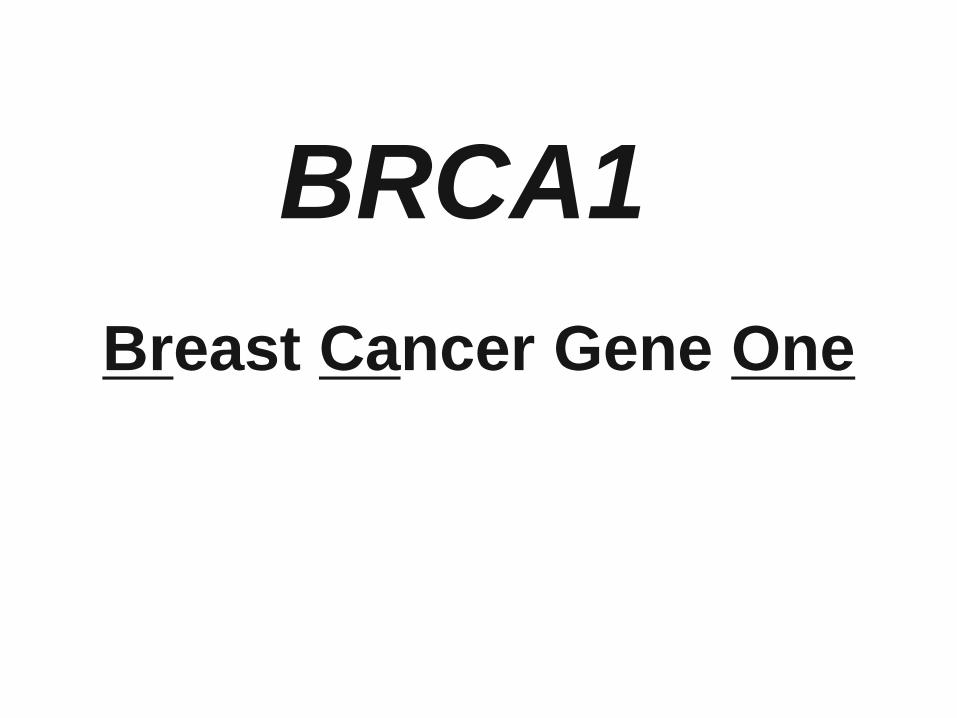
BRCA1 Breast Cancer Gene One
BRCA2
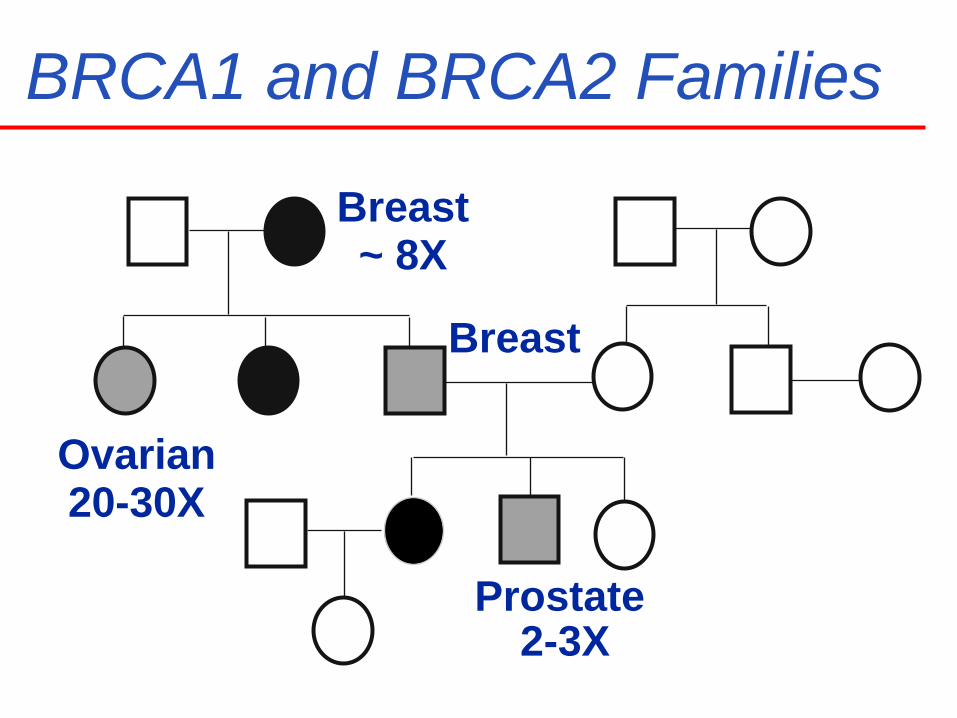
BRCA1 and BRCA2 Families
Breast ~ 8X
Prostate 2-3X
Breast
Ovarian 20-30X
Rel
ativ
e R
isk
Minor Allele Frequency (%)
10.0
2.0
1.0
0.1 1.0 10.0 30.0
1.5
Adapted from Foulkes WD NEJM, 359:2143, 2008
Breast Cancer Genes
BRCA2 BRCA1
TP53
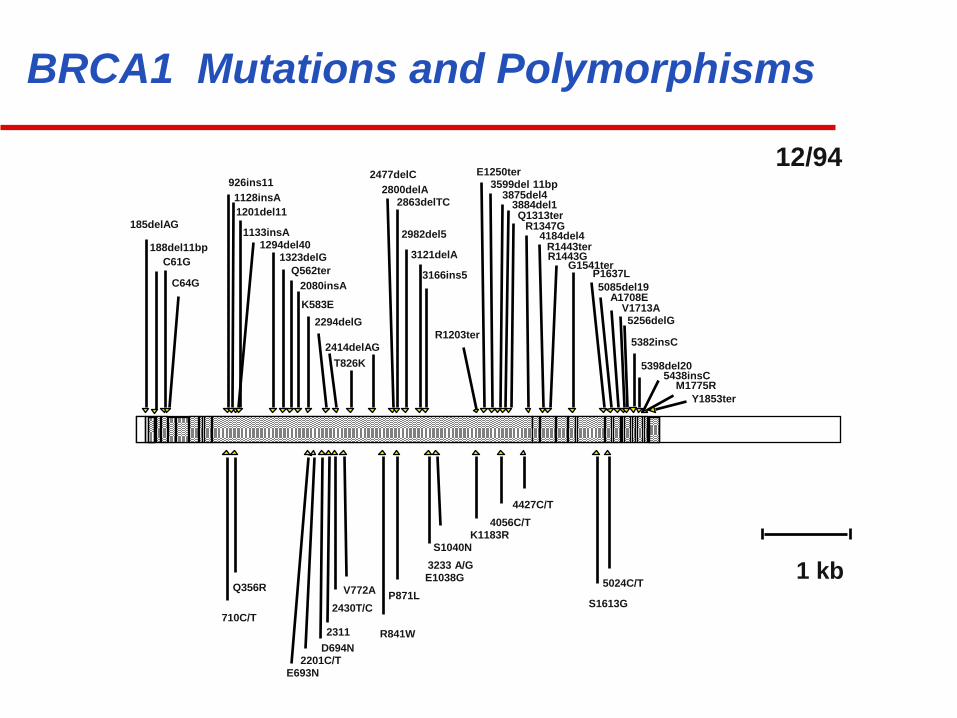
BRCA1 Mutations and Polymorphisms
1 kb
188del11bp
Q1313ter
G1541ter P1637L
A1708E
M1775R
C64G
1294del40
E1250ter
3875del4
R1443ter R1443G
5085del19
5382insC
185delAG
C61G
710C/T
1133insA
Q356R
E693N 2201C/T
2430T/C V772A
R841W
P871L E1038G 3233 A/G S1040N
K1183R 4056C/T
R1347G
4427C/T
S1613G
5024C/T
V1713A
5398del20 5438insC
1323delG
K583E
3599del 11bp
5256delG
926ins11 1128insA 1201del11
Q562ter 2080insA
2294delG
2414delAG T826K
2477delC 2800delA
2863delTC
2982del5
3121delA
3166ins5
R1203ter
3884del1
4184del4
Y1853ter
2311 D694N
12/94
BRCA1 & BRCA2
The World’s most sequenced genes.
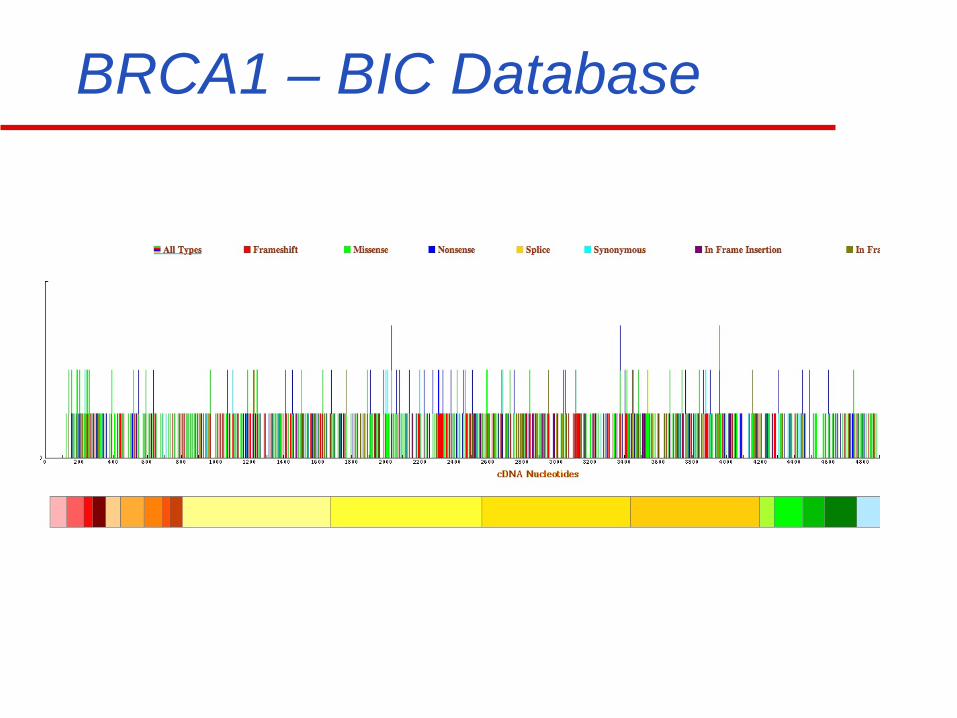
BRCA1 – BIC Database
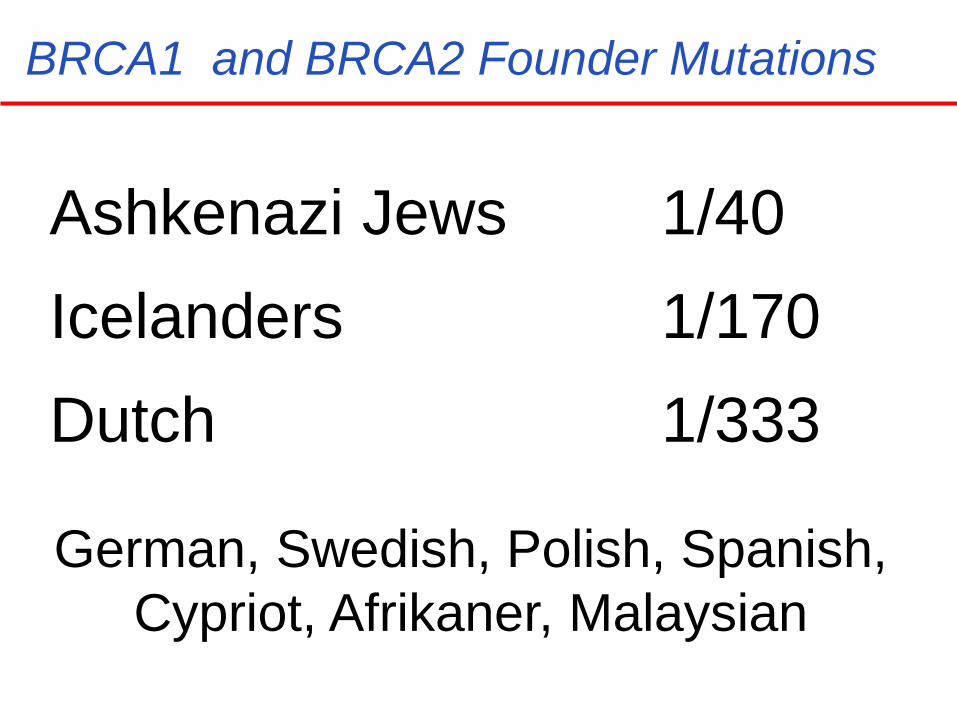
BRCA1 and BRCA2 Founder Mutations
1/40 1/170 1/333
Icelanders Dutch
German, Swedish, Polish, Spanish, Cypriot, Afrikaner, Malaysian
Ashkenazi Jews
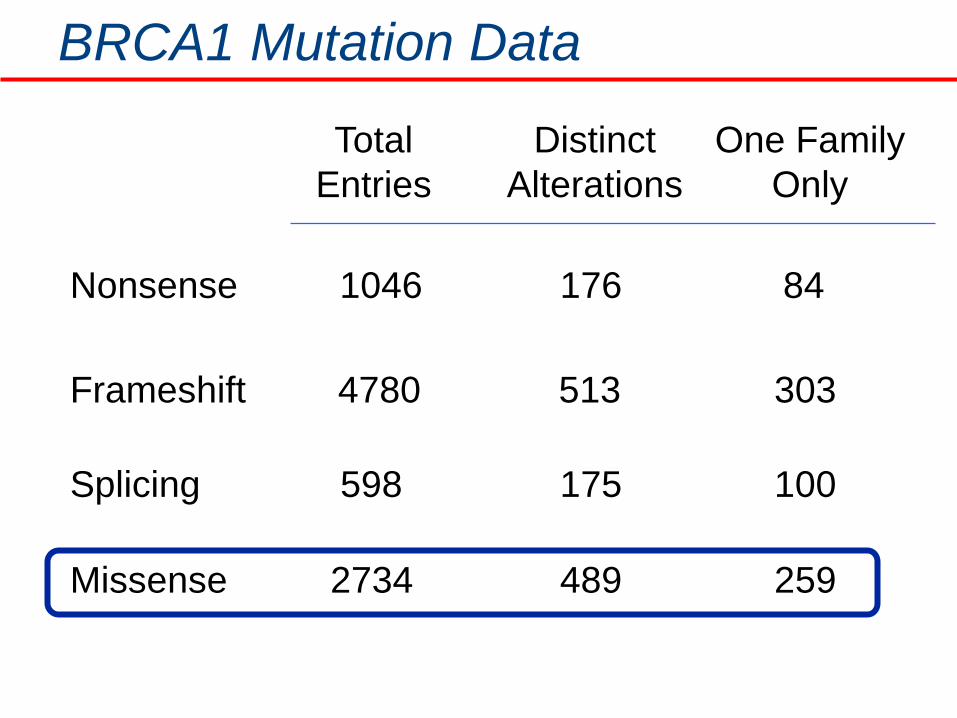
BRCA1 Mutation Data
Total Entries
Distinct Alterations
One Family Only
Missense 2734 489 259
Nonsense 1046 176 84
Frameshift 4780 513 303
Splicing 598 175 100
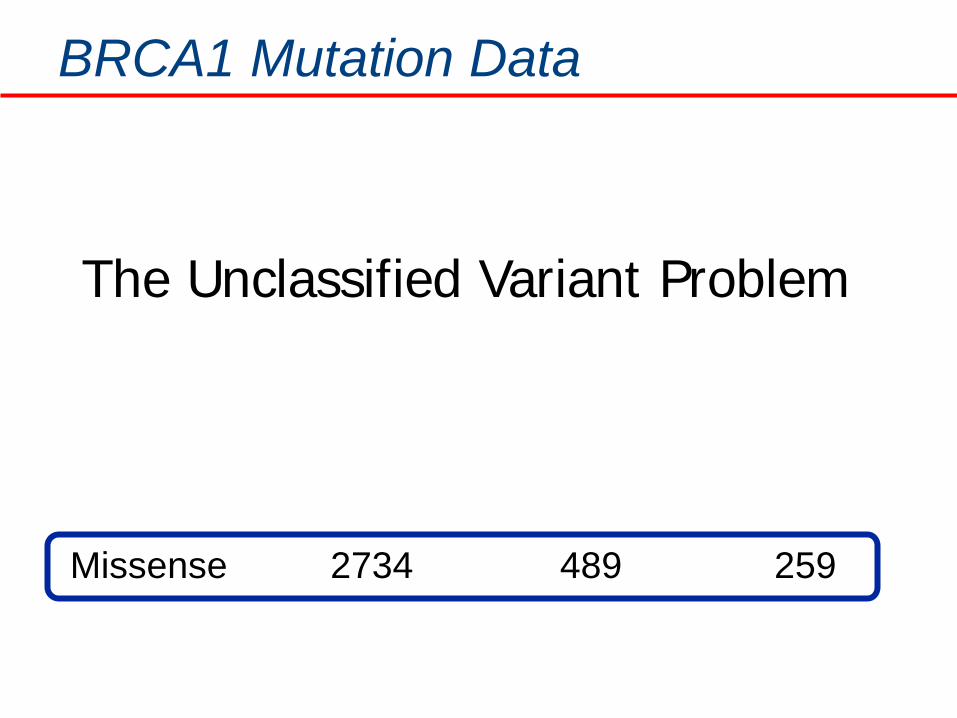
BRCA1 Mutation Data
Missense 2734 489 259
The Unclassified Variant Problem
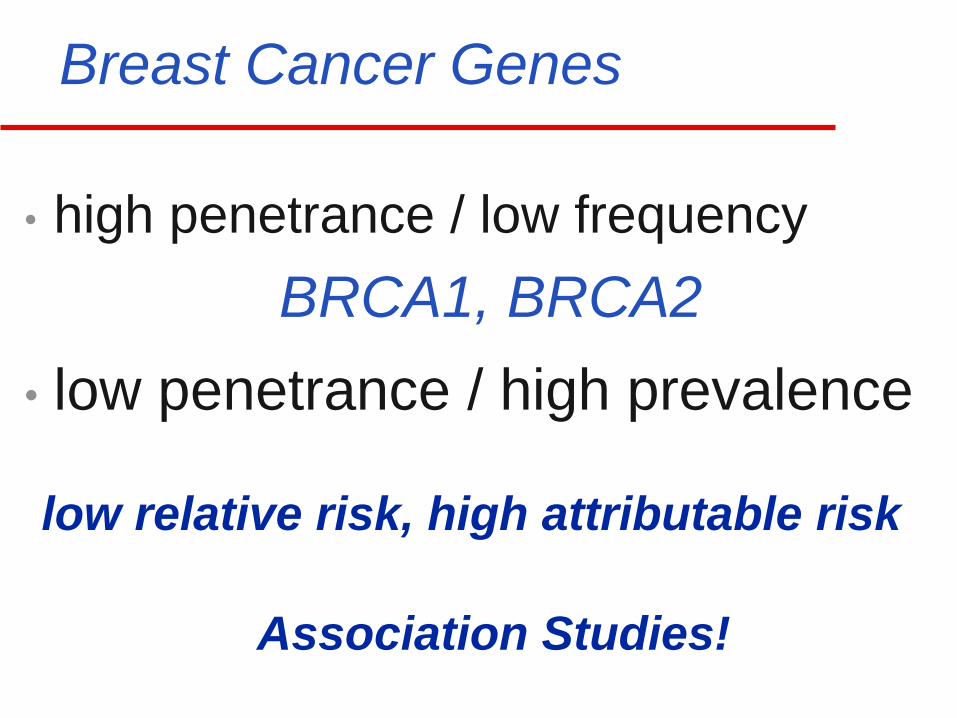
Breast Cancer Genes
• high penetrance / low frequency
• low penetrance / high prevalence BRCA1, BRCA2
low relative risk, high attributable risk
Association Studies!
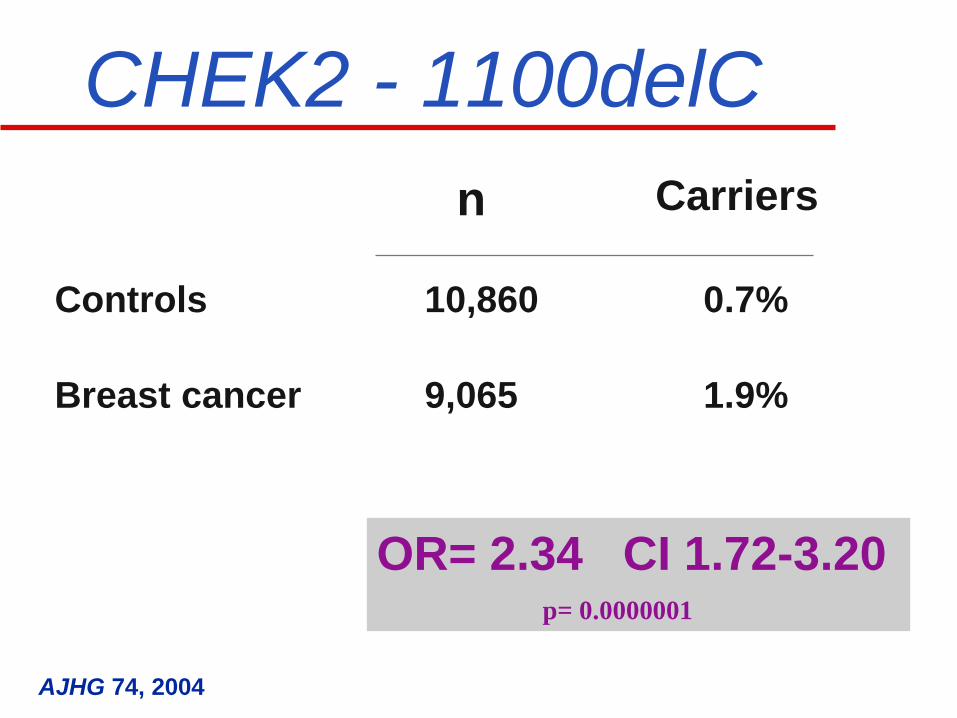
CHEK2 - 1100delC
Controls 10,860 0.7%
Carriers n
p= 0.0000001
OR= 2.34 CI 1.72-3.20
AJHG 74, 2004
Breast cancer
9,065 1.9%
Rel
ativ
e R
isk
Minor Allele Frequency (%)
10.0
2.0
1.0
0.1 1.0 10.0 30.0
1.5
Adapted from Foulkes WD NEJM, 359:2143, 2008
Breast Cancer Genes
BRCA2 BRCA1
TP53
ATM BRIP1 CHEK2
PALB2
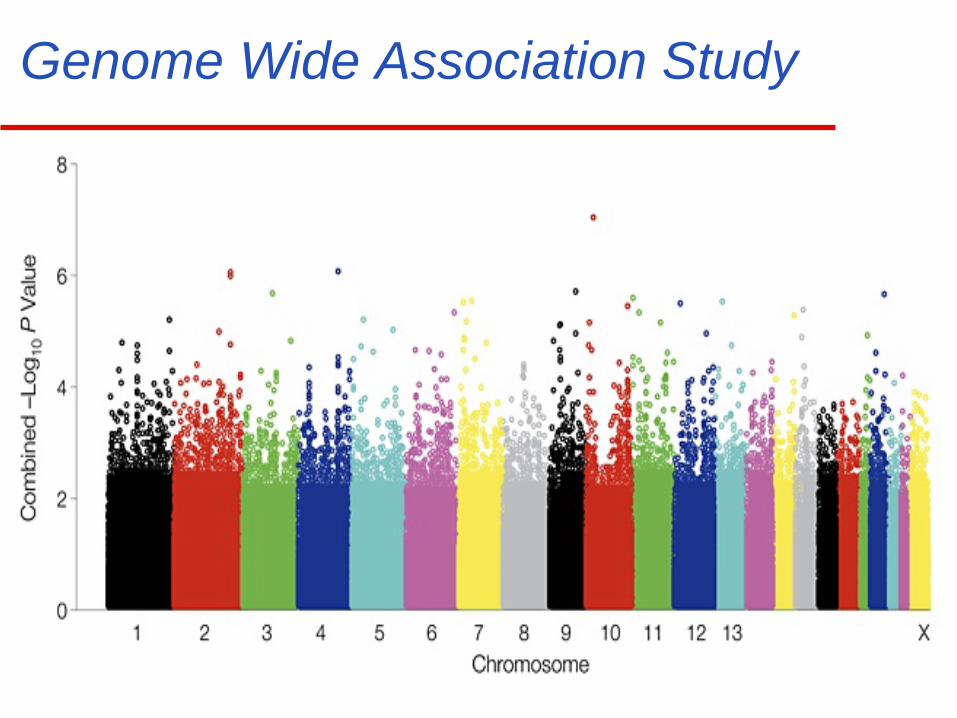
Genome Wide Association Study
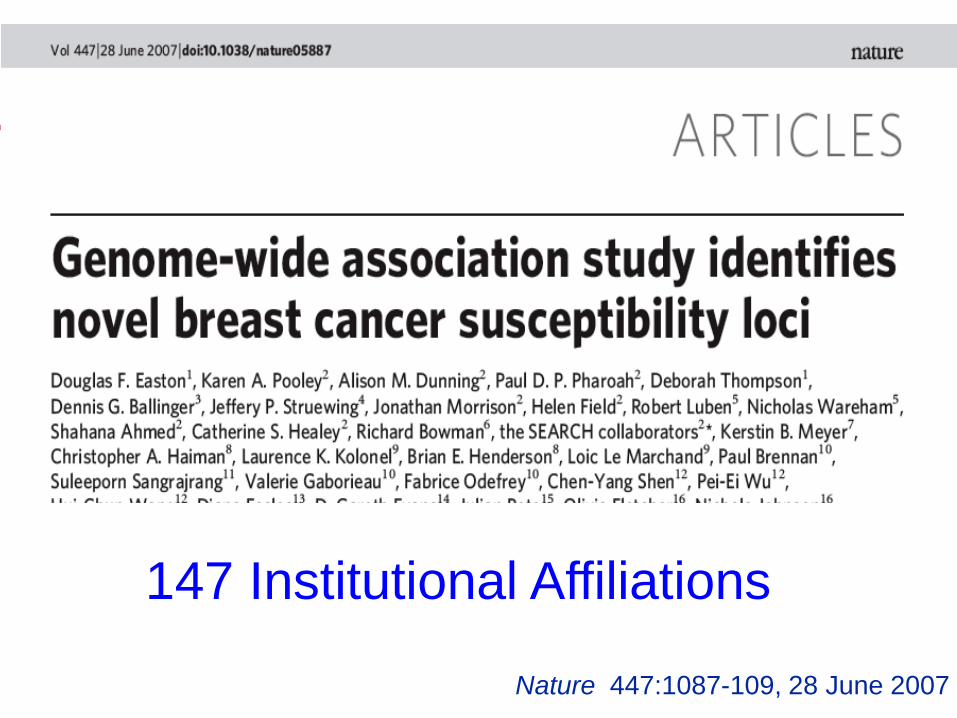
Nature 447:1087-109, 28 June 2007
147 Institutional Affiliations
Rel
ativ
e R
isk
Minor Allele Frequency (%)
10.0
2.0
1.0
0.1 1.0 10.0 30.0
1.5
Adapted from Foulkes WD NEJM, 359:2143, 2008
Breast Cancer Genes
BRCA2 BRCA1
TP53
ATM BRIP1 CHEK2
PALB2
MAP3KI 8q
TOX3 6q
CASP8 LSP1
FGFR2
Topography of Cancer Risk
Why Genetics?
• Prevention
• Early Detection
• Prognosis
• Tailored Therapy
Rel
ativ
e R
isk
Minor Allele Frequency (%)
10.0
2.0
1.0
0.1 1.0 10.0 30.0
1.5
Adapted from Foulkes WD NEJM, 359:2143, 2008
Breast Cancer Genes
BRCA2 BRCA1
TP53
ATM BRIP1 CHEK2
PALB2
MAP3KI 8q
TOX3 6q
CASP8 LSP1
FGFR2
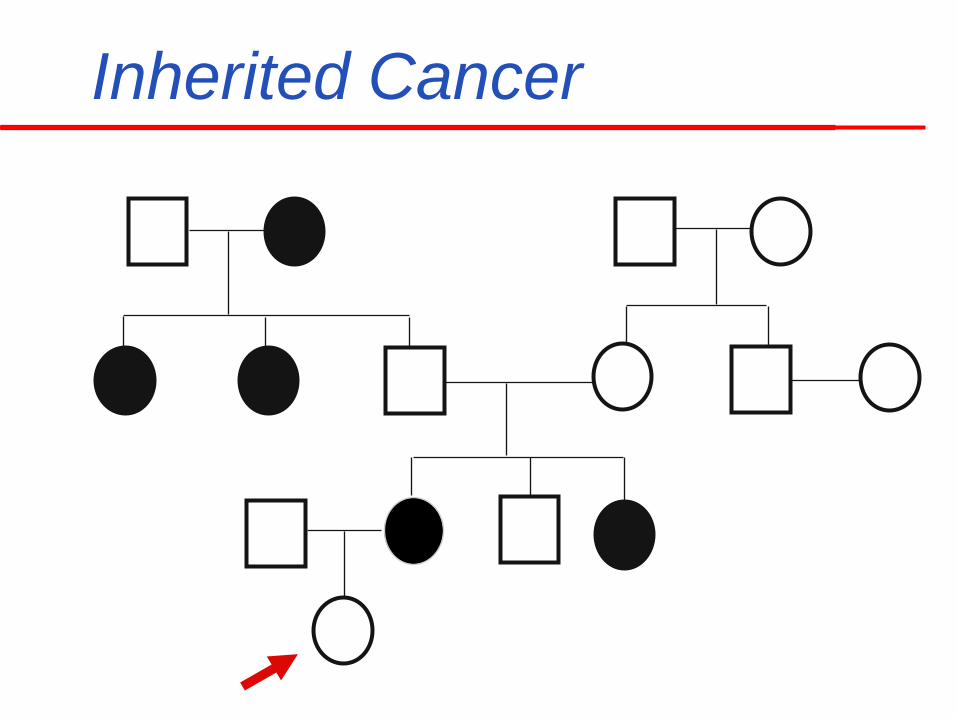
Inherited Cancer
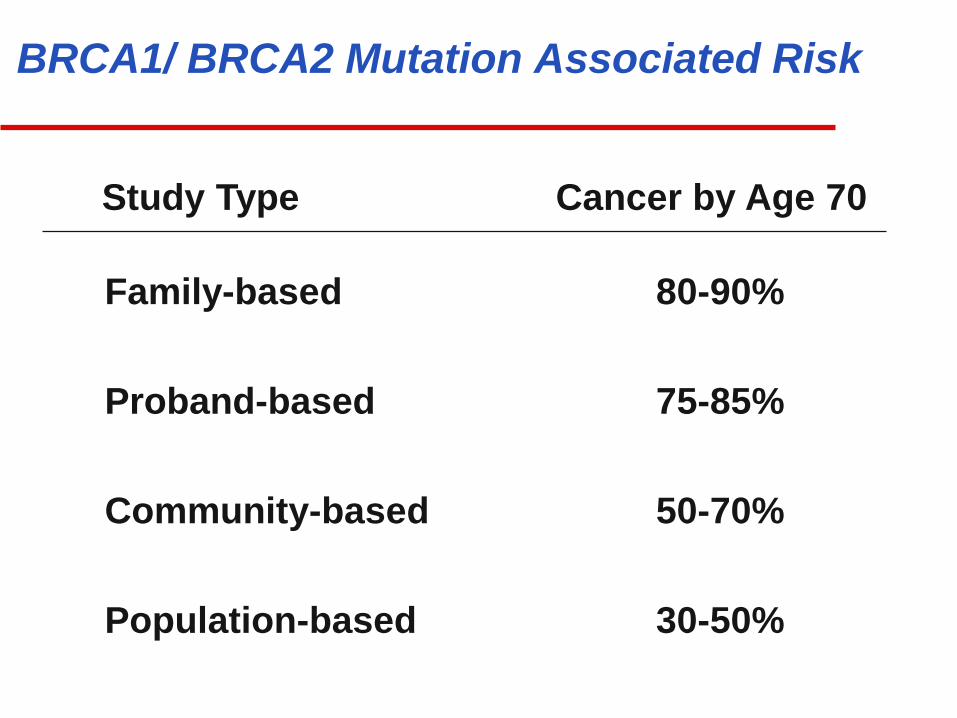
BRCA1/ BRCA2 Mutation Associated Risk
Study Type Cancer by Age 70
Family-based 80-90%
Population-based 30-50%
Community-based 50-70%
Proband-based 75-85%
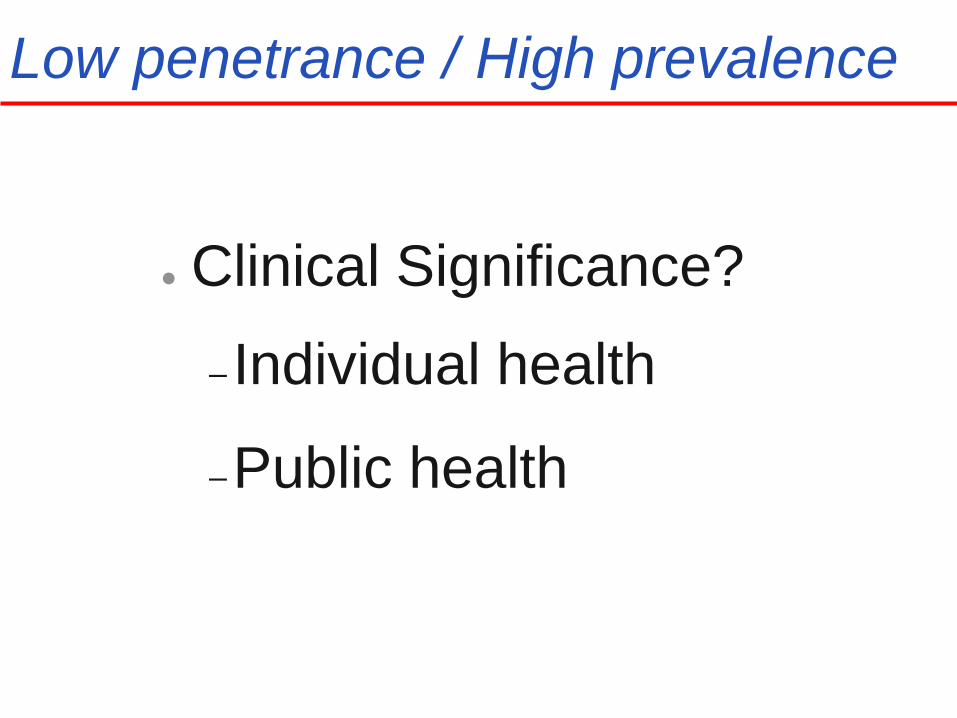
Low penetrance / High prevalence
Clinical Significance?
– Individual health
–Public health
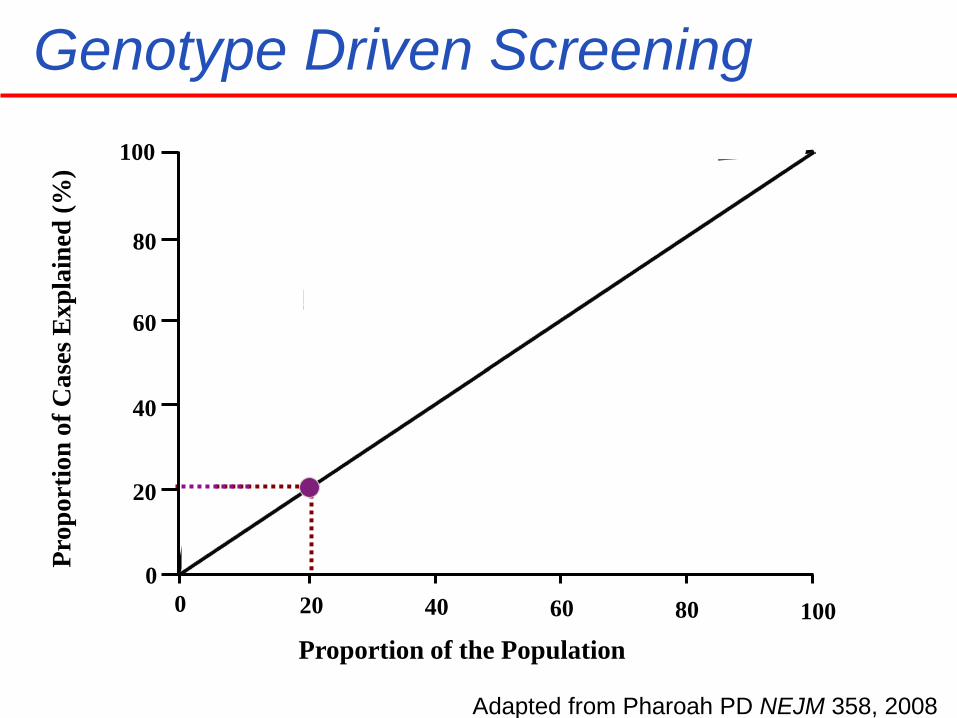
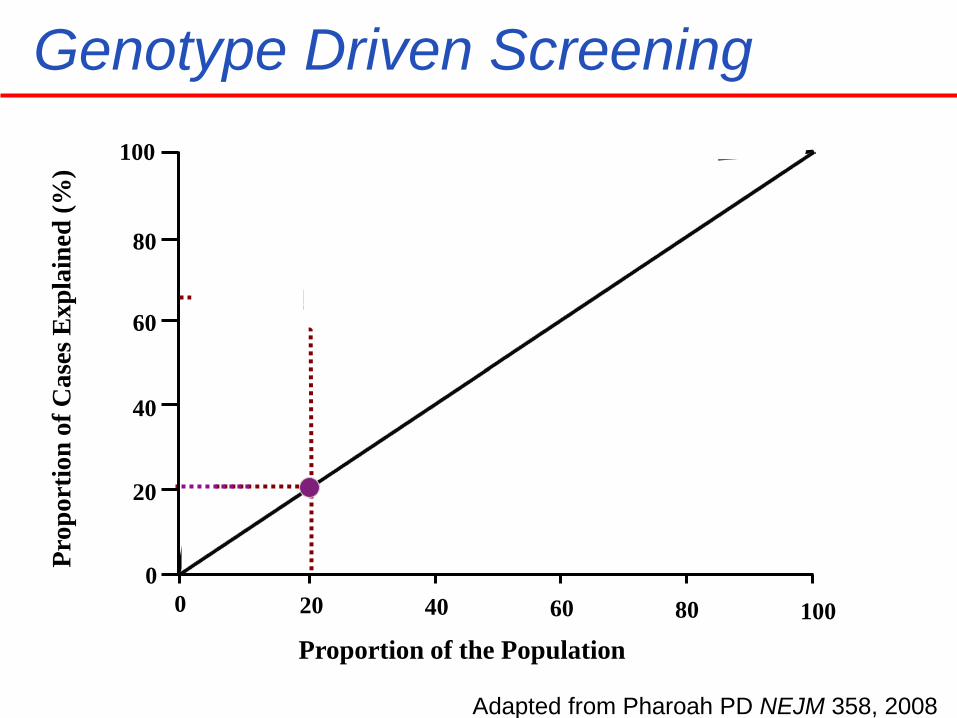
Genotype Driven Screening Pr
opor
tion
of C
ases
Exp
lain
ed (%
)
100
80
60
40
20
0 0 20 40 60 80 100
Proportion of the Population
Adapted from Pharoah PD NEJM 358, 2008
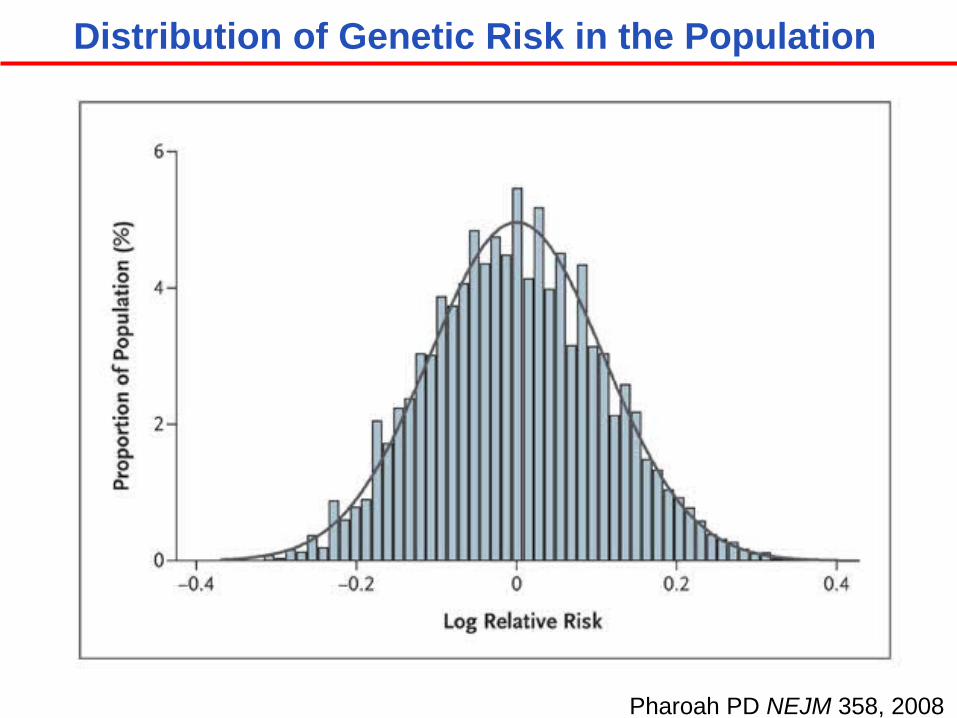
Distribution of Genetic Risk in the Population
Pharoah P et al. N Engl J Med 2008;358:2796-2803 Pharoah PD NEJM 358, 2008
Genotype Driven Screening Pr
opor
tion
of C
ases
Exp
lain
ed (%
)
100
80
60
40
20
0 0 20 40 60 80 100
Proportion of the Population
Adapted from Pharoah PD NEJM 358, 2008
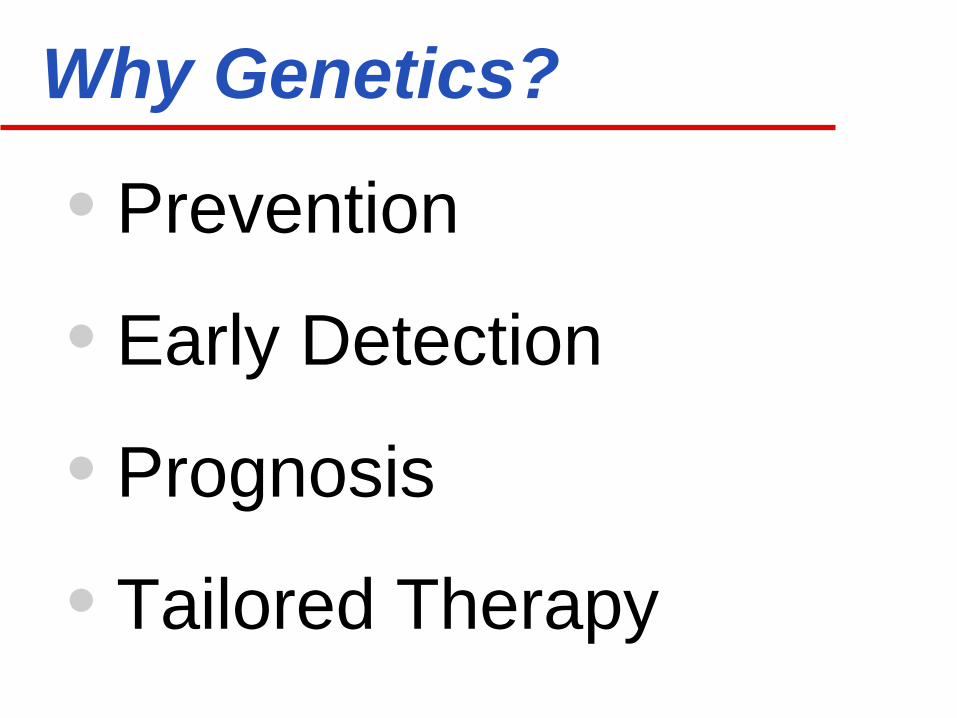
Why Genetics?
• Prevention
• Early Detection
• Prognosis
• Tailored Therapy
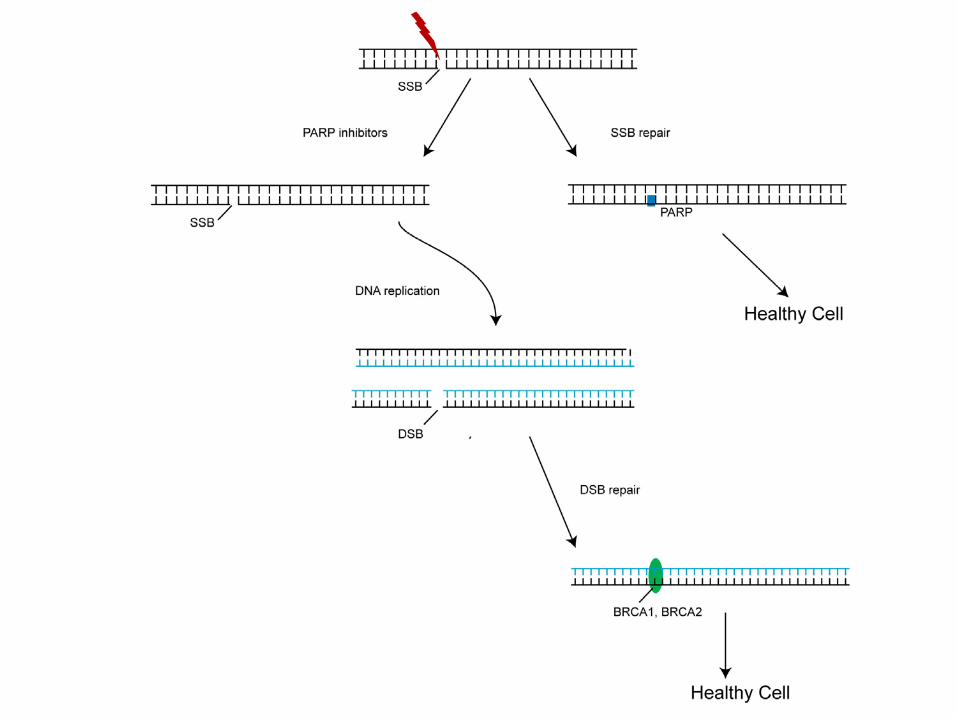
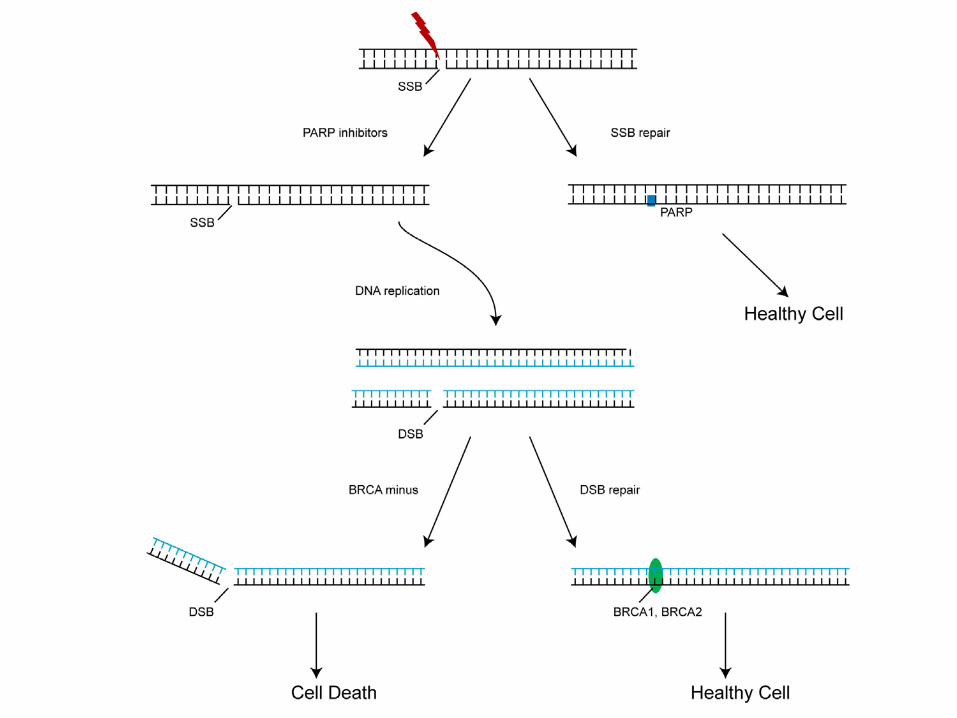
BRCA1 & BRCA2 are DNA repair proteins
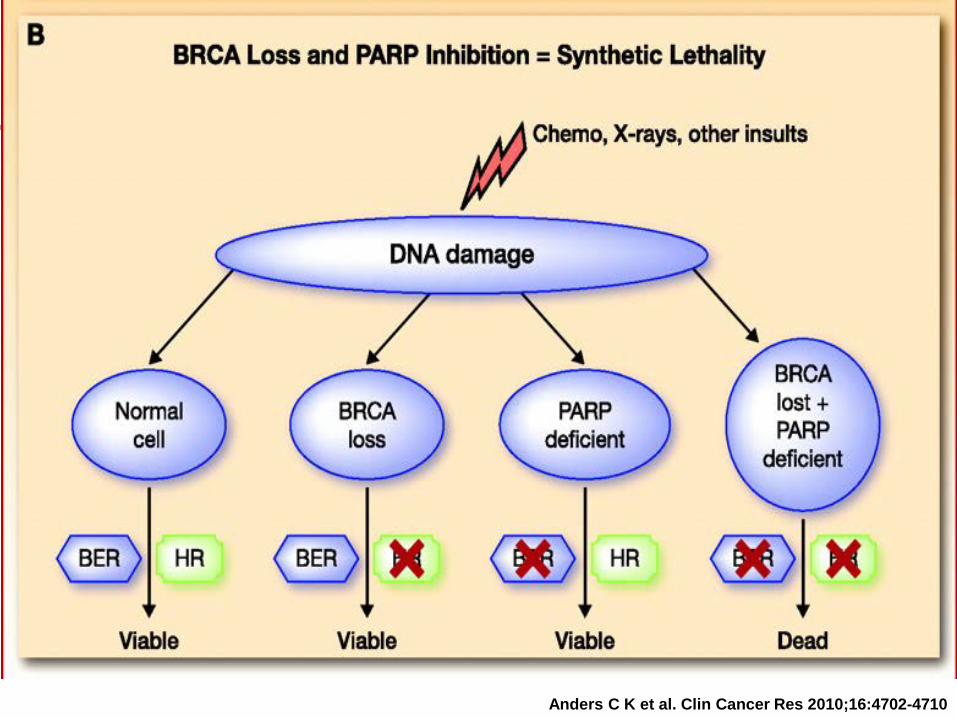
Anders C K et al. Clin Cancer Res 2010;16:4702-4710
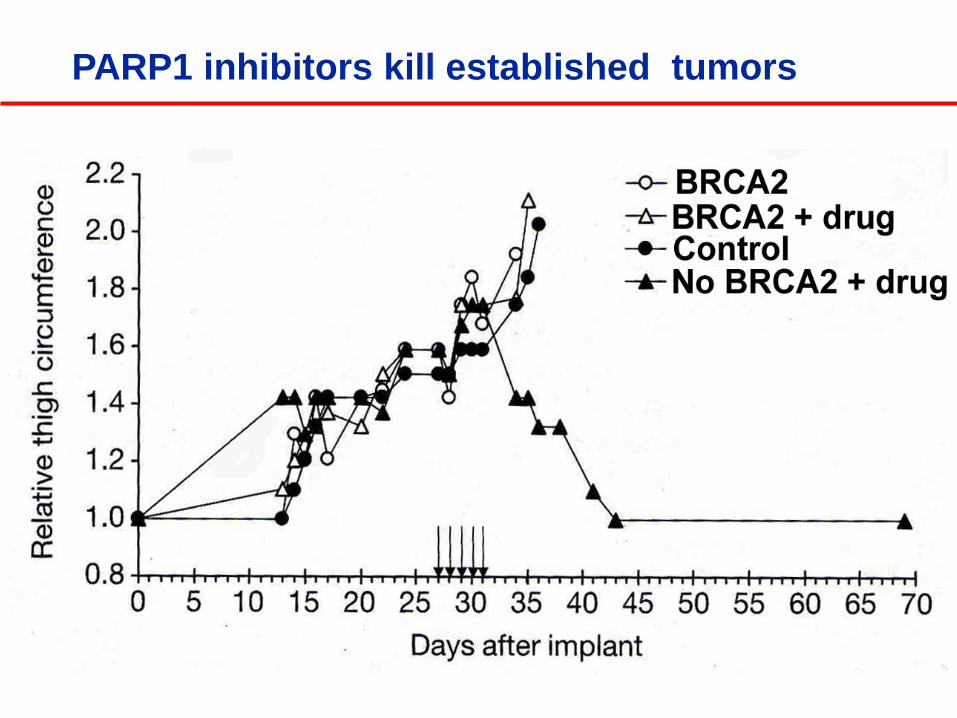
PARP1 inhibitors kill established tumors
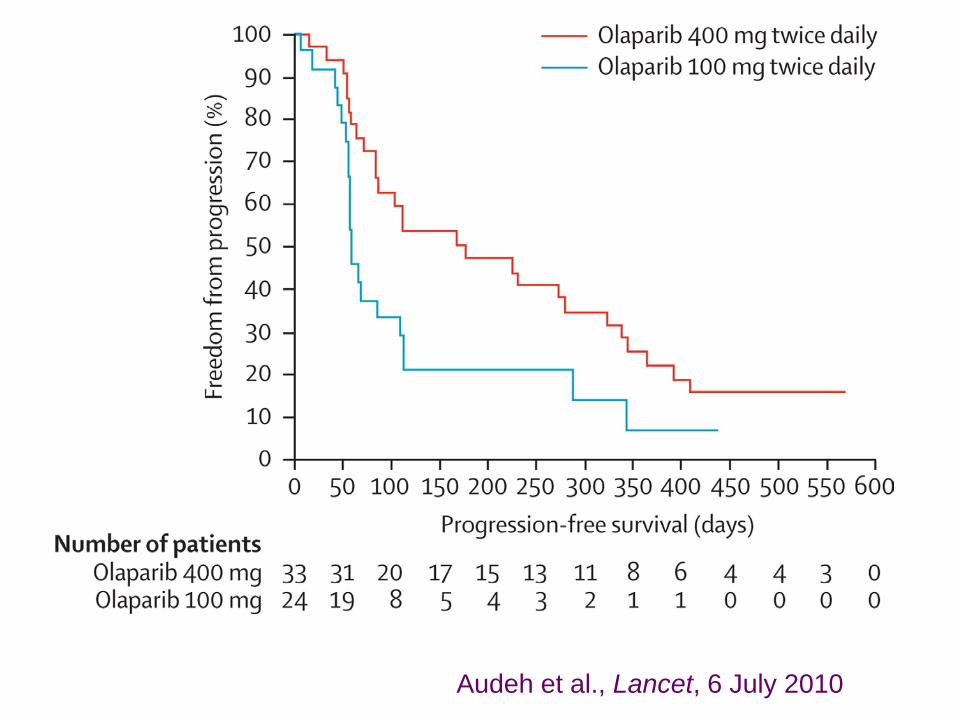
Audeh et al., Lancet, 6 July 2010
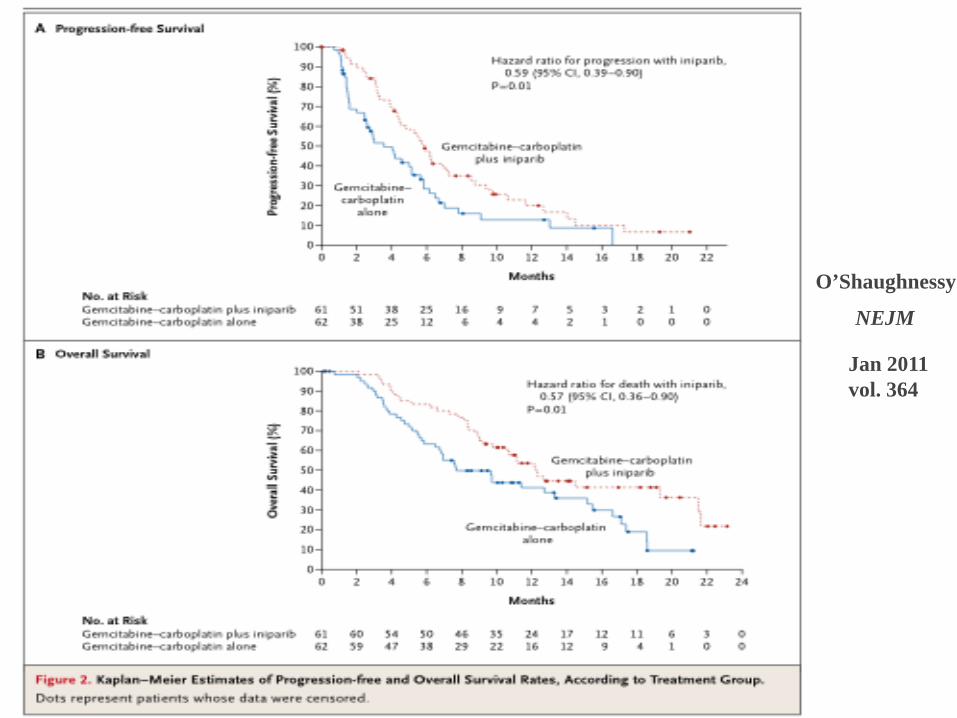
O’Shaughnessy
Jan 2011 vol. 364
NEJM
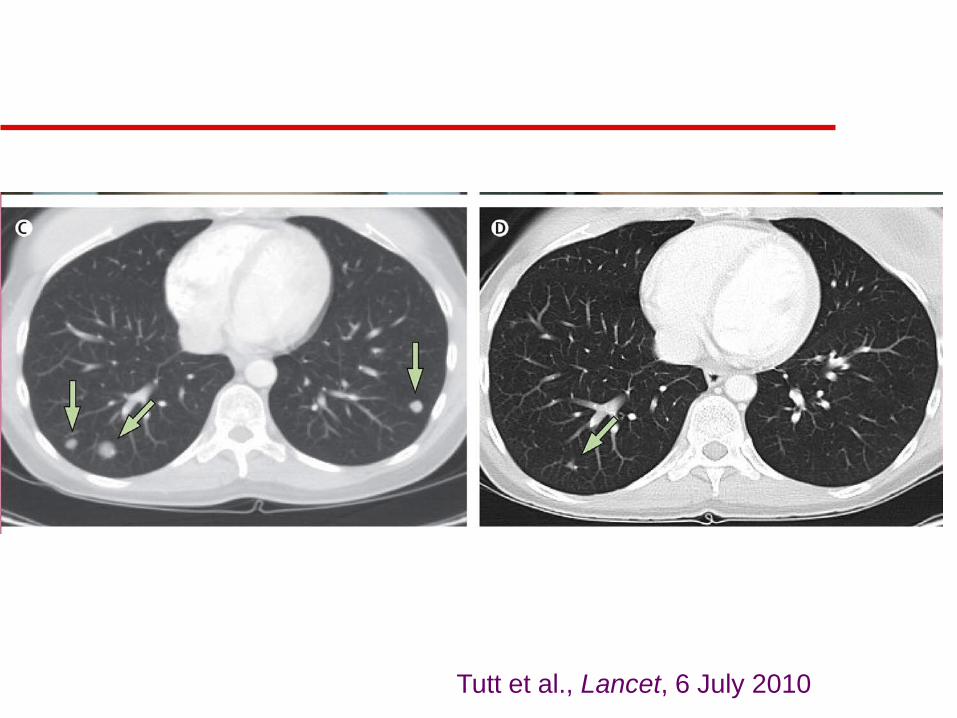
Tutt et al., Lancet, 6 July 2010
Why Genetics?
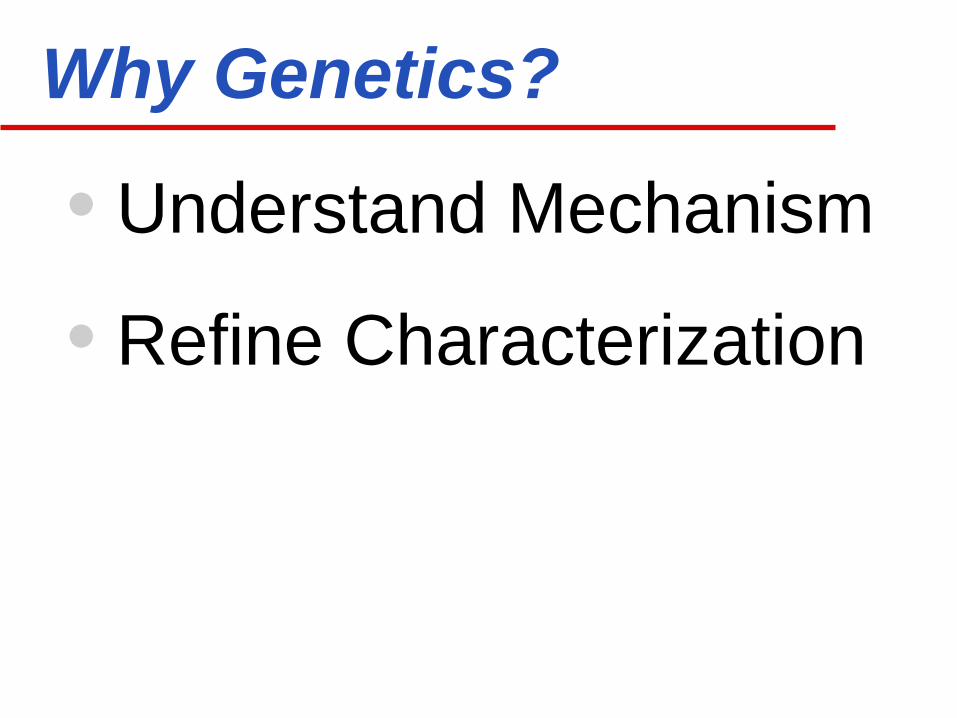
• Understand Mechanism
• Refine Characterization
Why Genetics?
• Prevention
• Early Detection
• Prognosis
• Tailored Therapy

Last slide
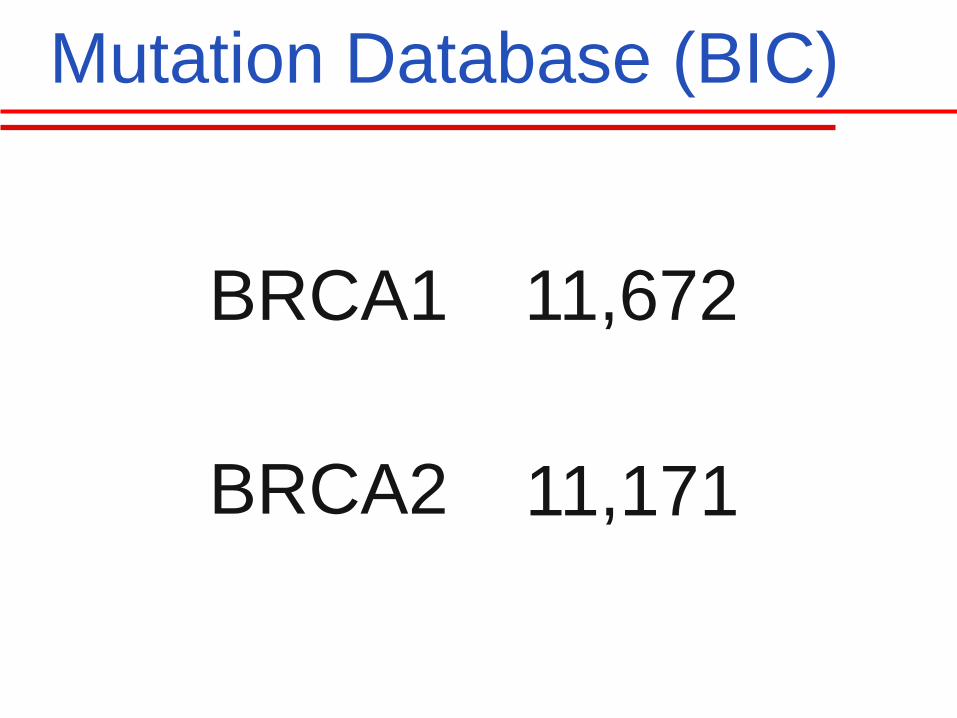
Mutation Database (BIC)
BRCA1 11,672
BRCA2 11,171
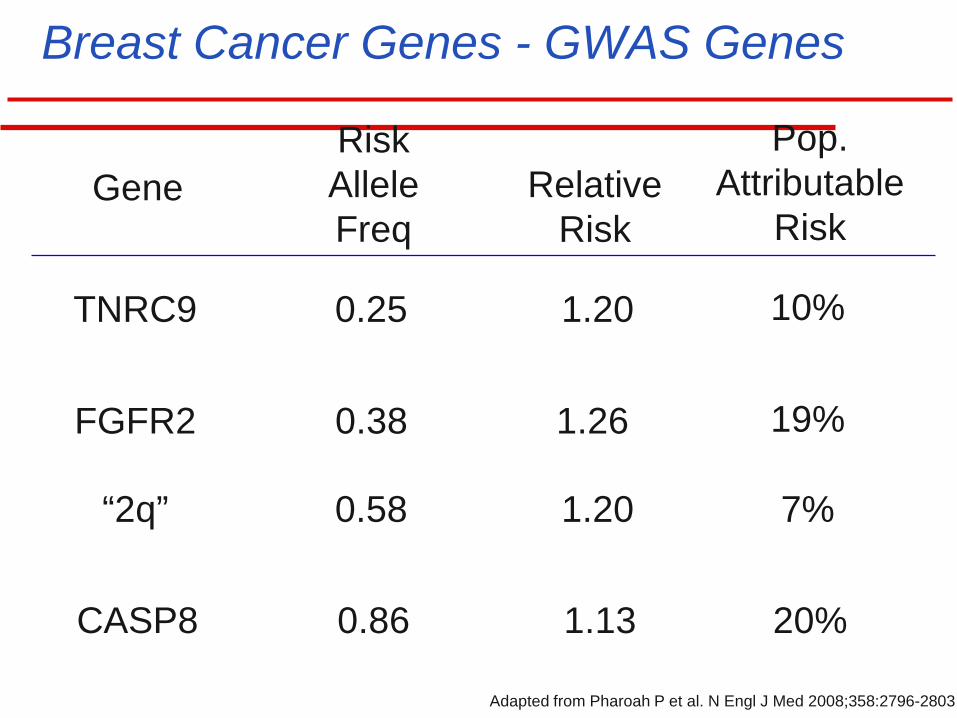
Breast Cancer Genes - GWAS Genes
Risk Allele Freq
Relative Risk
Pop. Attributable
Risk
CASP8 0.86 1.13 20%
FGFR2 0.38 1.26 19%
TNRC9 0.25 1.20 10%
“2q” 0.58 1.20 7%
Gene
Adapted from Pharoah P et al. N Engl J Med 2008;358:2796-2803
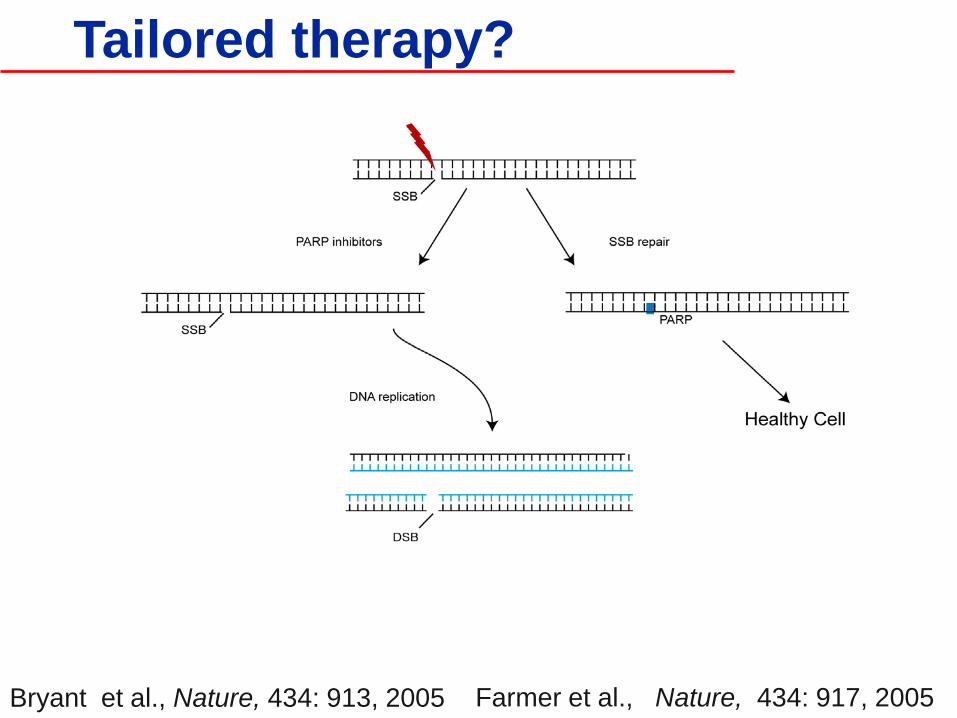
Farmer et al., Nature, 434: 917, 2005 Bryant et al., Nature, 434: 913, 2005
Tailored therapy?