genotype- and mutation site–specific qt adaptation during
TRANSCRIPT

Genotype- and Mutation Site–Specific QT AdaptationDuring Exercise, Recovery, and Postural Changes in
Children With Long-QT SyndromePeter F. Aziz, MD; Tammy S. Wieand, MS; Jamie Ganley, RN; Jacqueline Henderson, RN;
Akash R. Patel, MD; V. Ramesh Iyer, MD; R. Lee Vogel, MD; Michael McBride, PhD;Victoria L. Vetter, MD; Maully J. Shah, MBBS
Background—Exercise stress testing has shown diagnostic utility in adult patients with long-QT syndrome (LQTS);however, the QT interval adaptation in response to exercise in pediatric patients with LQTS has received little attention.
Methods and Results—One-hundred fifty-eight patients were divided into 3 groups: Those with LQTS type 1 (LQT1) orLQTS type 2 (LQT2) and normal control subjects without cardiovascular disease. Each patient underwent a uniformexercise protocol with a cycle ergometer followed by a 9-minute recovery phase with continuous 12-lead ECGmonitoring. Each patient underwent a baseline ECG while resting in the supine position and in a standstill positionduring continuous ECG recording to determine changes in the QT and RR intervals. Fifty patients were gene-positivefor LQTS (n�29 for LQT1 and n�21 for LQT2), and the control group consisted of 108 patients. QT interval adaptationwas abnormal in the LQT1 patients compared with LQT2 and control patients (P�0.001). A corrected QT interval(QTc) �460 ms in the late recovery phase at 7 minutes predicted LQT1 or LQT2 versus control subjects with 96%specificity, 86% sensitivity, and a 91% positive predictive value. A recovery �QTc(7 min�1 min) �30 ms predicted LQT2versus LQT1 with 75% sensitivity, 82% specificity, and a 75% positive predictive value. The postural �QT wassignificantly different between LQTS and control groups (P�0.005).
Conclusions—Genotype-specific changes in repolarization response to exercise and recovery exist in the pediatricpopulation and are of diagnostic utility in LQTS. An extended recovery phase is preferable to assess the repolarizationresponse after exercise in the pediatric population. (Circ Arrhythm Electrophysiol. 2011;4:867-873.)
Key Words: ion channels � long-QT syndrome � pediatrics � exercise stress test
Congenital long-QT syndrome (LQTS) is an inherited chan-nelopathy characterized by a prolonged QT interval, syn-
cope, ventricular arrhythmias, and sudden death.1,2 Children andadolescents with LQTS have been shown to be at high risk of afirst cardiac event.3,4 The diagnosis of LQTS can be challengingin the presence of a borderline prolonged QT or normal QTinterval (“concealed LQTS” [cLQTS]), and additional tests arenecessary for clinical evaluation.5 Significant advances in themolecular understanding of LQTS have resulted in genetictesting for 13 LQTS susceptibility genes, with the majority ofmutations involving the LQTS type 1 (KCNQ1) or LQTS type 2(KCNH2) genes. However, there are several limitations togenetic testing: It is expensive, it is not universally available, andit may be negative in one third of clinically diagnosed patients.6
Additional tests that aid in the diagnosis and genetic character-ization of this potentially lethal syndrome are necessary. Exer-cise stress testing (EST) and assessment of the corrected QT
interval (QTc) with postural changes are provocative teststhat can be readily performed and promptly interpreted inoutpatient clinical practice.
Clinical Perspective on p 873There are emerging data regarding genotype-specific repo-
larization responses with EST that pertain to adult LQTSpatients.7–9 However, genotype-specific QT adaptation duringexercise, recovery, and postural changes has received littleattention in children and adolescents with LQTS.10 In addi-tion, it has not been determined whether the location of genemutations also influences repolarization responses. The aimof the present study was to determine the diagnostic signifi-cance of EST and QT adaptation during exercise, recovery,and postural changes in children with common LQTS geno-types (LQT1 and LQT2) compared with normal controlsubjects.
Received March 21, 2011; accepted August 29, 2011.From The Children’s Hospital of Philadelphia, Division of Cardiology, and the University of Pennsylvania School of Medicine, Philadelphia, PA.The online-only Data Supplement is available with this article at http://circep.ahajournals.org/lookup/suppl/doi:10.1161/
CIRCEP.111.963330/-/DC1.Presented at the 2010 Heart Rhythm Society Annual Scientific Meeting in Denver, CO, as an oral abstract.Correspondence to Peter F. Aziz, MD, The Cardiac Center, 8th Floor, Main Bldg, 34th St and Civic Center Blvd, Philadelphia, PA 19104. E-mail
[email protected]© 2011 American Heart Association, Inc.
Circ Arrhythm Electrophysiol is available at http://circep.ahajournals.org DOI: 10.1161/CIRCEP.111.963330
867
by guest on March 29, 2018
http://circep.ahajournals.org/D
ownloaded from
by guest on M
arch 29, 2018http://circep.ahajournals.org/
Dow
nloaded from
by guest on March 29, 2018
http://circep.ahajournals.org/D
ownloaded from
by guest on M
arch 29, 2018http://circep.ahajournals.org/
Dow
nloaded from
by guest on March 29, 2018
http://circep.ahajournals.org/D
ownloaded from

MethodsStudy PopulationThe study group consisted of patients referred to the PediatricArrhythmia Clinic at The Children’s Hospital of Philadelphia forevaluation of suspected LQTS between January 1998 and January2010. Inclusion criteria for the present study were (1) patients �21years of age, (2) patients who were genotype-positive for LQT1(KCNQ1) or LQT2 (KCNH2) genes, and (3) patients who had ESTwith a uniform protocol that used a cycle ergometer performed at ourinstitution during their referral evaluation for LQTS. Genetic muta-tional analysis of 5 LQTS susceptibility genes (KCNQ1, KCNH2,SCN5A, KCNE1, and KCNE2) was performed on all patients througha commercial laboratory (Familion, PGxHealth, New Haven, CT).Genetic mutations of the KCNQ1 amino acid sequence were cate-gorized into 3 locations: prepore region, including the N-terminus(1–278th amino acid), pore region (279–354th amino acid), andpostpore region, including the C-terminus (�354th amino acid).11,12
Genetic mutations of the KCNH2 amino acid sequence were char-acterized into a pore and nonpore region. The pore region wasdefined as the area that extended from S5 to the mid portion of S6,which involved amino acid residues 550 through 650.13,14 Thecontrol group consisted of age- and sex-comparable control subjectsevaluated for cardiovascular symptoms and with EST performed atour institution who were dismissed from follow-up because of theabsence of cardiovascular disease.
To obtain an age- and sex-comparable control group, we subdi-vided the study group into 4 categories: (1) 4 to 7 years of age, (2)8 to 10 years of age, (3) 11 to 14 years of age, and (4) 15 to 21 yearsof age. An equal number of males and females were present in eachage category in the study and control groups. Family-reportedethnicity data were also included in our data analysis. Patientsexcluded from the study were those with clinically suspected LQTSwithout a positive genetic test. Because of insufficient sample size,patients with less common LQTS genotypes were also excluded.
The study protocol was approved by The Children’s Hospital ofPhiladelphia’s Institutional Review Board.
EST ProtocolAll patients underwent a uniform exercise protocol that used a cycleergometer (SensorMedics, Yorba Linda, CA). The initial phaseconsisted of 3 minutes of pedaling in an unloaded state followed bya ramp increase in work rate (watts) to maximal exercise. Theprogression of cycle resistance was determined by subject weight inkilograms and designed to achieve predicted peak work rate in 10 to12 minutes of cycling time.15 After the 3-minute warm-up phase,resistance was increased at 1-minute intervals until maximal volitionwas achieved. Maximal volition was defined as a respiratory ex-change quotient of �1.10 and was an indication that the patient hadreached peak exercise capacity. After reaching peak exercise, eachpatient completed the EST with a 9-minute recovery period. AllESTs were performed at The Children’s Hospital of Philadelphia.
EST Cardiac MonitoringA l2-lead ECG (Marquette Case 8000; GE Marquette MedicalSystems, Milwaukee, WI) at a paper speed of 25 mm/s was recordedwith the subject at rest in the supine and standing positions and at1-minute intervals during the exercise phase and during the first 9minutes of recovery.
EST ECG MeasurementsECG measurements were made by 2 independent investigators (PFAand JG) who were both blinded to the patient’s LQTS status.Interobserver variability was assessed in 40 randomly selectedpatients, which resulted in an intraclass correlation coefficient of0.51 and with 69% of the readings within 20 ms of one another,which indicates a moderate degree of consistency in QTc measure-ments between 2 observers. The QT interval was defined as beingfrom the beginning of the QRS complex to the end of the T wave.In cases in which the T-wave end point did not reach the isoelectric
line of the ECG, the maximum downslope of the T wave and theintersection with the isoelectric line of the T-P segment wasconsidered to be the end of the T wave.16 U waves less than half ofthe T-wave amplitude were not included as a portion of the QTinterval.17 QT interval measurements were made in ECG leads II andV5. QT intervals at rest (supine and standing), at peak exercise, andin recovery (1, 3, 5, 7, and 9 minutes) were measured. QTc was thencalculated according to the Bazett formula (QTc�QT/�RR).18
“Concealed” LQTS and Recovery �QTcPatients with cLQTS, defined as a supine resting QTc �460 ms,were subanalyzed. We determined an additional parameter: Recov-ery �QTc(7 min�1 min), or the difference in QTc measured at the7-minute and 1-minute time points of the recovery periods.
Postural QT MeasurementsResting ECGs were obtained after the patients had rested in thesupine position for 5 minutes, and the QT, RR, and QTc intervalswere calculated (in milliseconds). With continuous ECG monitoring,the patients were asked to immediately stand upright, and the QT,RR, and QTc calculations were repeated within 1 minute. Thepostural �QT was defined as the difference in the QT intervalbetween the standing and supine positions.7 Similarly, the postural�RR was defined as the difference in heart rate acceleration (in beatsper minute) between the standing and supine positions. The postural�QTc was defined as the difference between the heart rate–correctedQT intervals between the standing and supine positions. Postural QTand QTc measurements were analyzed only in patients who were ina drug-free state, because �-blockers could potentially blunt the heartrate response.
Statistical AnalysisMean QT, RR, and QTc measurements were plotted against time inEST, and differences between the LQT1, LQT2, and control groupswere assessed. The differences in mean QT and RR intervals in thesupine and standing positions were also assessed in the LQTS andcontrol patients. Patients were subdivided on the basis of age, sex,and �-blocker therapy to assess for confounding variables. Differ-ences in EST characteristics between subgroups classified accordingto mutation location were evaluated by standard statistical methods.At each time point, a linear mixed-effects model with age and sex ascovariates, genotype as a fixed effect, and family as a random effectwas used to analyze the association between QTc and genotype.Bonferroni correction was used for post hoc pairwise comparisonamong the 3 study groups. All analyses were made by a statisticianusing SAS version 9.1 (SAS Institute Inc, Cary, NC). P�0.05 wasconsidered statistically significant. For pairwise comparison,P�0.017 (0.05/3) was considered statistically significant.
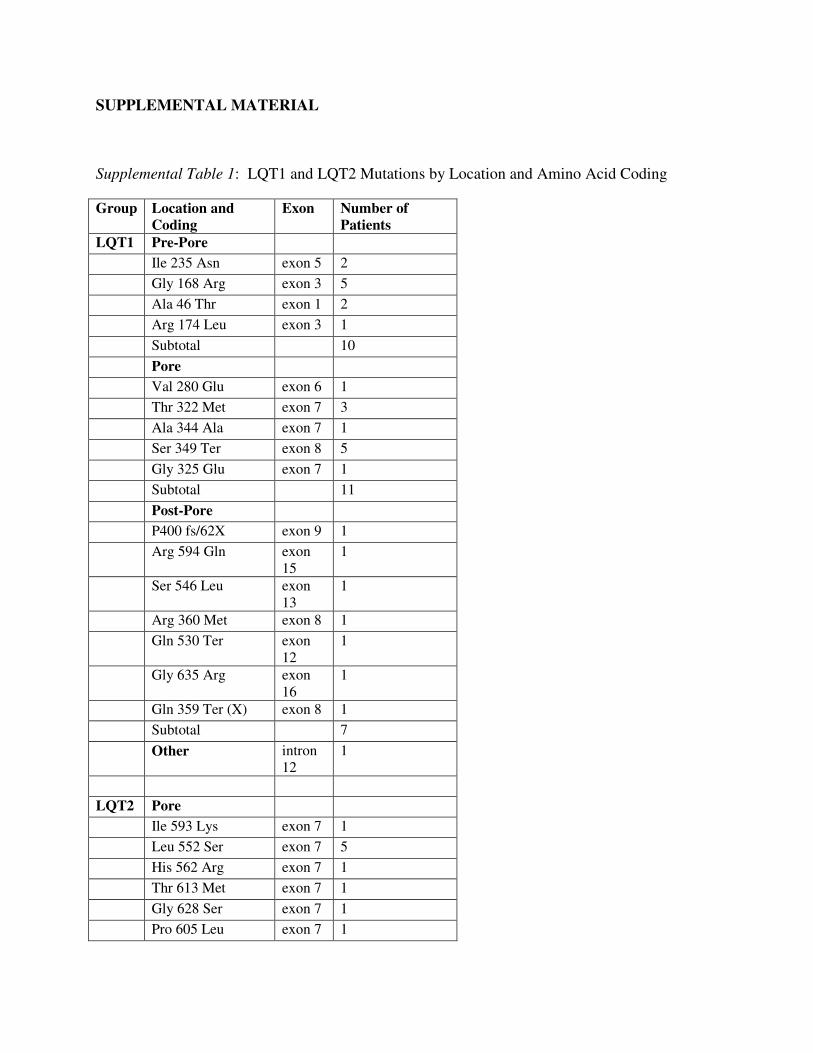
ResultsPatient and Genotype CharacteristicsBetween 1998 and 2010, 267 patients were referred for LQTSgenetic testing. Genetic testing was feasible in 188 patients(70%); the remaining patients were deferred because offinancial or insurance constraints. A disease-causing LQTSgene mutation was identified in 76 patients (40%). FiftyLQTS patients fulfilled study inclusion criteria and wereenrolled in the study. The control group consisted of 108patients. There were no major ethnic differences between theLQTS and control group, with the majority of patients beingself-categorized as white (92% of LQTS patients versus 80%of control subjects, P�NS). The clinical presentation ofLQTS patients is summarized in Figure 1. Genotype data,including mutation location, for patients with LQT1 andLQT2 are summarized in Table I in the online-only DataSupplement. In both the LQT1 and LQT2 groups, transmem-
868 Circ Arrhythm Electrophysiol December 2011
by guest on March 29, 2018
http://circep.ahajournals.org/D
ownloaded from
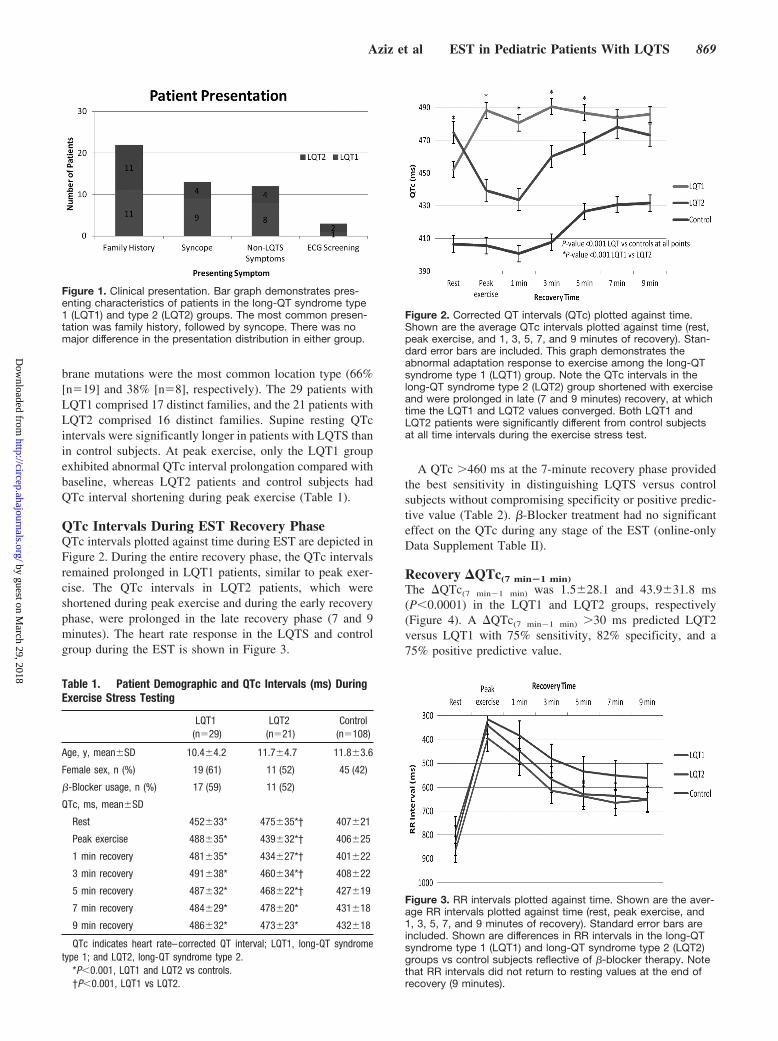
brane mutations were the most common location type (66%[n�19] and 38% [n�8], respectively). The 29 patients withLQT1 comprised 17 distinct families, and the 21 patients withLQT2 comprised 16 distinct families. Supine resting QTcintervals were significantly longer in patients with LQTS thanin control subjects. At peak exercise, only the LQT1 groupexhibited abnormal QTc interval prolongation compared withbaseline, whereas LQT2 patients and control subjects hadQTc interval shortening during peak exercise (Table 1).
QTc Intervals During EST Recovery PhaseQTc intervals plotted against time during EST are depicted inFigure 2. During the entire recovery phase, the QTc intervalsremained prolonged in LQT1 patients, similar to peak exer-cise. The QTc intervals in LQT2 patients, which wereshortened during peak exercise and during the early recoveryphase, were prolonged in the late recovery phase (7 and 9minutes). The heart rate response in the LQTS and controlgroup during the EST is shown in Figure 3.
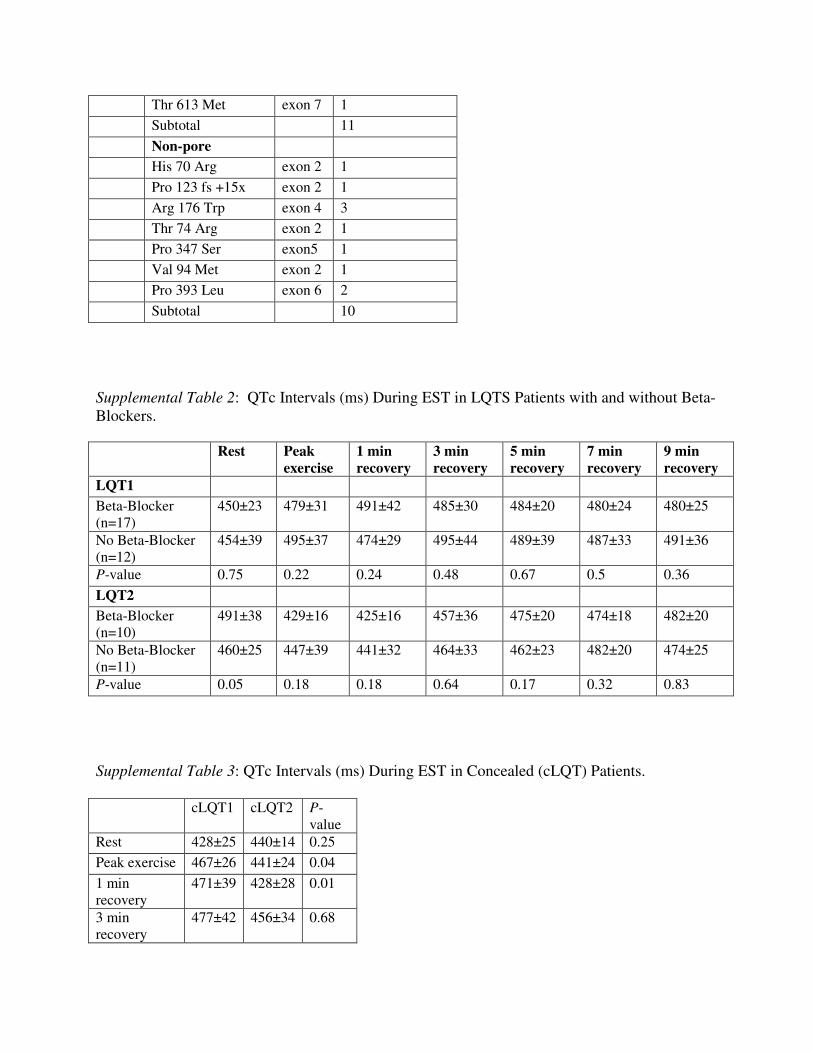
A QTc �460 ms at the 7-minute recovery phase providedthe best sensitivity in distinguishing LQTS versus controlsubjects without compromising specificity or positive predic-tive value (Table 2). �-Blocker treatment had no significanteffect on the QTc during any stage of the EST (online-onlyData Supplement Table II).
Recovery �QTc(7 min�1 min)The �QTc(7 min�1 min) was 1.5�28.1 and 43.9�31.8 ms(P�0.0001) in the LQT1 and LQT2 groups, respectively(Figure 4). A �QTc(7 min�1 min) �30 ms predicted LQT2versus LQT1 with 75% sensitivity, 82% specificity, and a75% positive predictive value.
Figure 1. Clinical presentation. Bar graph demonstrates pres-enting characteristics of patients in the long-QT syndrome type1 (LQT1) and type 2 (LQT2) groups. The most common presen-tation was family history, followed by syncope. There was nomajor difference in the presentation distribution in either group.
Table 1. Patient Demographic and QTc Intervals (ms) DuringExercise Stress Testing
LQT1(n�29)
LQT2(n�21)
Control(n�108)
Age, y, mean�SD 10.4�4.2 11.7�4.7 11.8�3.6
Female sex, n (%) 19 (61) 11 (52) 45 (42)
�-Blocker usage, n (%) 17 (59) 11 (52)
QTc, ms, mean�SD
Rest 452�33* 475�35*† 407�21
Peak exercise 488�35* 439�32*† 406�25
1 min recovery 481�35* 434�27*† 401�22
3 min recovery 491�38* 460�34*† 408�22
5 min recovery 487�32* 468�22*† 427�19
7 min recovery 484�29* 478�20* 431�18
9 min recovery 486�32* 473�23* 432�18
QTc indicates heart rate–corrected QT interval; LQT1, long-QT syndrometype 1; and LQT2, long-QT syndrome type 2.
*P�0.001, LQT1 and LQT2 vs controls.†P�0.001, LQT1 vs LQT2.
Figure 2. Corrected QT intervals (QTc) plotted against time.Shown are the average QTc intervals plotted against time (rest,peak exercise, and 1, 3, 5, 7, and 9 minutes of recovery). Stan-dard error bars are included. This graph demonstrates theabnormal adaptation response to exercise among the long-QTsyndrome type 1 (LQT1) group. Note the QTc intervals in thelong-QT syndrome type 2 (LQT2) group shortened with exerciseand were prolonged in late (7 and 9 minutes) recovery, at whichtime the LQT1 and LQT2 values converged. Both LQT1 andLQT2 patients were significantly different from control subjectsat all time intervals during the exercise stress test.
Figure 3. RR intervals plotted against time. Shown are the aver-age RR intervals plotted against time (rest, peak exercise, and1, 3, 5, 7, and 9 minutes of recovery). Standard error bars areincluded. Shown are differences in RR intervals in the long-QTsyndrome type 1 (LQT1) and long-QT syndrome type 2 (LQT2)groups vs control subjects reflective of �-blocker therapy. Notethat RR intervals did not return to resting values at the end ofrecovery (9 minutes).
Aziz et al EST in Pediatric Patients With LQTS 869
by guest on March 29, 2018
http://circep.ahajournals.org/D
ownloaded from

Concealed LQTSTwenty-three patients (46%; LQT1 and LQT2 subgroups)had cLQTS. Their resting QTc was 432�22 ms. ECGpatterns are shown in Figure 5. Patients with cLQTS hadlonger QTc intervals at all time intervals of the EST thancontrol patients (Figure 6). A QTc �460 ms at the 7-minuterecovery phase predicted cLQTS versus control with 96%specificity, 82% sensitivity, and an 82% positive predictivevalue. A QTc �445 ms at the 7-minute recovery phaseyielded a sensitivity of 96%, specificity of 78%, and positivepredictive value of 67%. Genotype cLQTS data are providedin supplemental Table III in the online-only DataSupplement.
Mutation Site–Specific Changes of QTc IntervalDuring ESTThe QTc intervals at peak exercise and during each timeinterval of the recovery phase did not differ significantlybetween the LQT1 patients with prepore, pore, and postporemutations. Similarly, the QTc intervals at peak exercise andduring each time interval of the recovery phase did not differbetween the LQT2 patients with pore and nonpore mutations(online-only Data Supplement Table IV).
Postural QT and QTc Interval ChangesThere were 23 LQTS patients not treated with �-blockers, ofwhom 12 (52%) had LQT1 and 11 (48%) had LQT2. Inresponse to standing, LQTS patients had blunted heart rate
acceleration compared with the control group (an increase of10.5�15.5 versus 18.8�15.3 bpm, P�0.02).
The postural �QT of the control group was �13.6�16.2ms, whereas the �QT of the LQTS patients was �2.2�25.3ms (P�0.003). However, the �QTc did not change signifi-cantly in the control versus LQTS patients (26.3�37.8 versus32�31.0 ms, P�0.55). When patients with LQT1 and LQT2were compared, there was no significant difference in pos-tural �QT, postural �QTc, or postural �RR.
DiscussionThe primary findings of the present study were as follows: (1)Postural changes in the QT interval were useful in distin-guishing LQTS patients from control subjects but were notuseful to discriminate between LQT1 and LQT2 genotypes.(2) A threshold value of QTc �460 ms during the laterecovery phase (7 minutes) of the EST was useful indistinguishing LQTS children, including the cLQTS subco-hort, from normal patients. (3) LQT1 and LQT2 patientsdemonstrated unique QT adaptation patterns during exerciseand the recovery phase. (4) �QTc(7 min�1 min) �30 ms, whichreflects the repolarization difference between the late andearly recovery phases, was useful in distinguishing betweenLQT2 and LQT1 genotypes in children. The latter findingssuggest that an extended EST recovery phase may be usefulin the assessment of children and adolescents with LQTS.EST protocols for evaluation of LQTS in adult cohorts arelimited to a recovery period of 4 to 5 minutes, with QTcmeasurements performed up to 4 minutes in the recoveryphase.8 Children have a more gradual deceleration in theirheart rates during the recovery phase of the EST (Figure 3).
The length of the recovery phase becomes crucial as thepredominant cellular repolarization currents come into play atcritical heart rates. The slow (IKs) component of the delayedrectifying current is enhanced at faster heart rates, withresultant adaptation or shortening of the QTc interval. TheLQT1 (KCNQ1) gene encodes for the IKs potassium channel,and in the absence of functional IKs, this results in paradoxicalQTc prolongation at fast heart rates, ie, during peak exerciseand the early recovery phase.19 In the present study, QTcprolongation was observed to persist throughout the recoveryphase of 9 minutes in LQT1 patients, ostensibly because ofslower deceleration of the heart rate throughout the recoveryphase. This is in variance with the recovery profile of adultLQTS patients reported by Chattha et al,8 in whom QTcprolongation was only seen in the early recovery phase, witha decrease in the QTc interval during late recovery. However,in that study, the entire recovery phase consisted of a totalduration of 4 minutes, at which time the heart rate haddecreased to baseline values. The time frame of the recoveryphase may become even more important in patients withLQT2 who have an impaired rapid component of the delayedrectifying current (IKr). IKr is more likely to play a significantrole in cardiac repolarization at intermediate heart rates.During peak exercise and phases of recovery when the heartrate remains relatively fast, LQT2 patients will have normalQTc adaptation and minimal QTc prolongation.10 Therefore,in pediatric patients, if the QTc is measured during anabbreviated recovery phase (ie, 3–5 minutes) when the heart
Table 2. Sensitivity, Specificity, and Positive Predictive ValueWith a QTc of >460 ms at Different Recovery Intervals
460 (LQTS vs Control) Sensitivity Specificity PPV
3 min 64 98 94
5 min 78 98 95
7 min 86 96 91
QTc indicates heart rate–corrected QT interval; LQTS, long-QT syndrome;and PPV, positive predictive value.
All values are percentages.
Figure 4. Change in corrected QT interval between 7 minutesand 1 minute of recovery [�QTc(7�1)]. Box plots show the differ-ence in �QTc(7�1) between the long-QT syndrome type 1 andtype 2 (LQT1 and LQT2) groups. The �QTc(7�1) is a useful pa-rameter in differentiating LQT1 vs LQT2, because LQT2 patientshave a significantly longer �QTc.
870 Circ Arrhythm Electrophysiol December 2011
by guest on March 29, 2018
http://circep.ahajournals.org/D
ownloaded from

rate remains relatively fast and has not decreased to interme-diate rates, it is possible that the opportunity to capture LQT2patients may be missed. As shown in Figure 2, in the patientcohort in the present study, the significant increase in QTcvalues in LQT2 patients did not occur until approximately 7minutes into the recovery phase, a time line when both theLQT1 and LQT2 QTc interval curves appear to merge. Forthese reasons, a recovery phase of 8 to 10 minutes or until theheart rate returns to baseline is preferable in pediatric patientsto maximize the sensitivity of the EST.
In the present study, we found a QTc threshold value of�460 ms in the late recovery period to be useful in differ-entiating cLQTS patients from normal control subjects. Inadult cLQTS cohorts, QTc �445 ms at the end of recoveryhas been used to differentiate affected individuals from
normal control subjects.7,8,20 A QTc �460 ms rather than�445 ms improved the specificity and positive predictivevalue of diagnosing LQTS without compromising sensitivityin the present study cohort. The recovery �QTc(7 min�1 min) isa simple calculation that can be made using the patient as hisor her own control. A greater separation in the QTc intervalsbetween the end- and early-recovery phases (�QTc(7 min�1 min)
�30 ms) favors the diagnosis of LQT2. The patterns of QTcresponse during peak exercise and recovery were not signif-icantly altered secondary to treatment with �-blockers in thecurrent and previous studies.8,21 This observation is helpful inclinical practice because it obviates the need to stop�-blockers to perform the EST. In contrast, other provocativetests such as epinephrine infusion require �-blocker washoutbefore the test is performed.22,23
The QT interval predominantly shortened in response tostanding in control subjects but either remained unchanged,minimally shortened, or actually increased in LQTS patientsin the present study. Similar to the observations in adultLQTS patients, the response of the QT interval to a standingposition is impaired in children with LQTS. In the study byViskin et al,24 LQTS patients and control subjects had similarheart rate acceleration in response to standing. A bluntedheart rate acceleration was observed in LQTS patients in thepresent study compared with the control group. Sinus rateresponse in LQTS patients is controversial, with some studiesdemonstrating sinus node impairment, especially in LQT1patients.25–27 Because of the possibility of blunted heart rateacceleration in LQTS patients, postural QT rather than QTcchange should be assessed in patients evaluated for LQTS.We did not find an added benefit of postural QT changes indifferentiating between LQT1 and LQT2 genotypes.
To the best of our knowledge, this is the first study toexamine whether mutation location in the KCNQ1 andKCNH2 genes determines QT adaptation in response toexercise. Moss and colleagues11 found a markedly increasedrisk for cardiac events with mutations in the pore region of the
Figure 5. ECG tracing in patients withlong-QT syndrome during exercise stresstesting. Examples of ECG tracings reflectgene-specific repolarization responses.The control patient had a normal restingheart rate–corrected QT interval (QTc;416 ms), which shortened in early recov-ery (389 ms) and returned to near base-line at 7 minutes of recovery (424 ms).The patient with long-QT syndrome type1 (LQT1) had characteristic QTc prolonga-tion at rest (471 ms) that was prolongedfurther in early recovery (496 ms) andremained prolonged at 7 minutes ofrecovery (490 ms). The patient withlong-QT syndrome type 2 (LQT2) also hadcharacteristic QTc prolongation at rest(489 ms) that shortened in early recovery(416 ms) and was prolonged at 7 minutesof recovery (482 ms). Patients with con-cealed long-QT syndrome (cLQT1 andcLQT2) had similar patterns.
Figure 6. Heart rate–corrected QT intervals (QTc) plottedagainst time in patients with concealed long-QT syndrome(cLQT, cLQT1, and cLQT2). Shown are the average QTc inter-vals plotted against time (rest, peak exercise, and 1, 3, 5, 7, and9 minutes of recovery) in patients with resting QTc intervals�460 ms (cLQT). cLQTS (cLQT1 and cLQT2) patients had lon-ger QTc intervals than control subjects at all time intervals ofthe exercise stress test.
Aziz et al EST in Pediatric Patients With LQTS 871
by guest on March 29, 2018
http://circep.ahajournals.org/D
ownloaded from

KCNH2 gene. Similarly, mutations located in the transmem-brane portion were found to be important independent riskfactors of clinical events in LQT1 patients.28 However,neither study investigated the influence of location of muta-tion on repolarization response to exercise.11,13,28 In thepresent study, we did not find a correlation between mutationlocation and repolarization response to exercise, and wespeculate that additional factors may be responsible forgenotype-specific repolarization changes.
The present study has several limitations. It is a retrospec-tive study with a modest sample size limited to 2 commonLQTS genotypes, which limits the generalizability of results.Certain mutations have the likelihood of being overrepresentedbecause of individuals being genetically related, but themajority of our study participants came from unrelatedfamilies, which may strengthen the study. We did not performsex adjustment for QT thresholds because the majority of ourstudy and control population were children of peripubertalage or younger. Zareba et al4 have shown no sex differencesin QTc duration among LQT1 and LQT2 subjects �15 yearsof age. We attempted to evaluate the influence of specificmutation locations to QT adaptation, but the results may havebeen obscured by the small sample size. We recognize thatthe type of QTc response observed during bicycle ergometryEST used in the present study should be interpreted withcaution because it may not carry over to other types of ESTprotocols. Finally, the present study only included patientswith confirmed genetic results, which could be a source ofbias.
ConclusionsChildren and adolescents with LQTS have an abnormal QTadaptation response during the recovery phase of EST that isgenotype-specific but not mutation site–specific. An extendedrecovery phase may be preferable to assess the repolarizationresponse after exercise in the pediatric population. A QTc�460 ms in the late recovery phase can distinguish LQTSfrom unaffected individuals, and a recovery �QTc(7 min�1 min)
�30 ms is useful in discriminating LQT1 from LQT2genotypes. These findings are relevant to our cycle ergometerprotocol and should not be generalized to other forms of EST.Our findings need to be validated prospectively in a largercohort before being implemented as a clinical diagnostic tool.
Sources of FundingThis study was supported in part by the National Heart, Lung, andBlood Institute (NHLBI-T32), grant #HL007915.
DisclosuresR.I. serves as a consultant for Purdue Pharmaceuticals. M.J.S. is partof a speakers’ bureau fellows symposium for Biotronik. The remain-ing authors declare no conflicts.
References1. Ackerman MJ, Clapham DE. Mechanisms of disease: ion channels: basic
science and clinical disease. N Engl J Med. 1997;336:1575–1586.2. Schwartz PJ, Moss AJ, Vincent GM, Crampton RS. Diagnostic criteria
for the long QT syndrome. Circulation. 1993;88:782–784.3. Liu JF, Jons C, Moss AJ, McNitt S, Peterson DR, Qi M, Zareba W,
Robinson JL, Barsheshet A, Ackerman MJ, Benhorin J, Kaufman ES,Locati EH, Napolitano C, Priori SG, Schwartz PJ, Towbin J, Vincent M,
Zhang L, Goldenberg I. Risk factors for recurrent syncope and subsequentfatal or near-fatal events in children and adolescents with long QTsyndrome. J Am Coll Cardiol. 2011;57:941–950.
4. Zareba W, Moss AJ, Locati EH, Lehmann MH, Peterson DR, Wall WJ,Schwartz PJ, Vincent GM, Priori SG, Benhorin J, Towbin JA, RobinsonJL, Andrews ML, Napolitano C, Timothy K, Zhang L, Medina A. Mod-ulating effects of age and gender on the clinical course of long QTsyndrome by genotype. J Am Coll Cardiol. 2003;42:103–109.
5. Vincent GM, Timothy K, Leppert M, Keating MT. The spectrum ofsymptoms and QT intervals in carriers of the gene for the long QTsyndrome. N Engl J Med. 1992;327:846–852.
6. Bai R, Napolitano C, Bloise R, Monteforte N, Priori SG. Yield of geneticscreening in inherited cardiac channelopathies: how to prioritize access togenetic testing. Circ Arrhythm Electrophysiol. 2009;2:6–15.
7. Wong JA, Gula LJ, Klein GJ, Yee R, Skanes AC, Krahn AD. Utility oftreadmill testing in identification and genotype prediction in long QTsyndrome. Circ Arrhythm Electrophysiol. 2010;3:120–125.
8. Chattha IS, Sy RW, Yee R, Gula LJ, Skanes AC, Klein GJ, Bennett MT,Krahn AD. Utility of the recovery electrocardiogram after exercise: anovel indicator for the diagnosis and genotyping of long QT syndrome?Heart Rhythm. 2010;7:906–911.
9. Horner JM, Horner MM, Ackerman MJ. The diagnostic utility oftreadmill exercise stress testing in the evaluation of congenital long QTsyndrome. Heart Rhythm. 2009;7:S45–S87.
10. Swan H, Toivonen L, Viitasalo M. Rate adaptation of QT intervals duringand after exercise in children with congenital long QT syndrome. EurHeart J. 1998;19:508–513.
11. Splawski I, Shen J, Timothy K, Lehmann MH, Priori S, Robinson JL,Moss AJ, Schwartz PJ, Towbin JA, Vincent GM, Keating MT. Spectrumof mutations in long-QT syndrome genes: KVLQT1, HERG, SCN5A,KCNE1, and KCNE2. Circulation. 2000;102:1178–1185.
12. Zareba W, Moss AJ, Sheu G, Kaufman ES, Priori S, Vincent GM,Towbin JA, Benhorin J, Schwartz PJ, Napolitano C, Hall WJ, KeatingMT, Qi M, Robinson JL, Andrews ML. Location of mutation in theKCNQ1 and phenotypic presentation of long QT syndrome. J CardiovascElectrophysiol. 2003;14:1149–1153.
13. Moss AJ, Zareba W, Kaufman ES, Gartman E, Peterson DR, Benhorin J,Towbin JA, Keating MT, Priori S, Schwartz PJ, Vincent GM, RobinsonJL, Andrews ML, Feng C, Hall WJ, Medina A, Zhang L, Wang Z.Increased risk of arrhythmic events in long-QT syndrome with mutationsin the pore region of the human ether-a-go-go-related gene potassiumchannel. Circulation. 2002;105:794–799.
14. Sanguinetti MC, Curran ME, Spector PS, Keating MT. Spectrum ofHERG K�-channel dysfunction in an inherited cardiac arrhythmia. ProcNatl Acad Sci U S A. 1996;93:2208–2212.
15. Rowland TW. Pediatric Laboratory Exercise Testing. Champaign, IL:Human Kinetics; 1993.
16. Lepeschkin E, Surawicz B. The measurement of the Q-T interval of theelectrocardiogram. Circulation. 1952;6:378–388.
17. Rautaharju PM, Surawicz B, Gettes LS. AHA/ACCF/HRS recommen-dations for the standardization and interpretation of the electrocardio-gram. J Am Coll Cardiol. 2009;53:982–991.
18. Bazett H. An analysis of the time-relations of electrocardiograms. Heart.1920;7:353–370.
19. Takenaka K, Ai T, Shimizu W, Kobori A, Ninomiya T, Otani H, KubotaT, Takaki H, Kamakura S, Horie M. Exercise stress test amplifies geno-type-phenotype correlation in the LQT1 and LQT2 forms of the long-QTsyndrome. Circulation. 2003;107:838–844.
20. Walker BD, Krahn AD, Klein GJ, Skanes AC, Yee R. Burst bicycleexercise facilitates diagnosis of latent long QT syndrome. Am Heart J.2005;150:1059–1063.
21. Kaltman JR, Ro PS, Stephens P, McBride MG, Cohen MI, Tanel RE,Vetter VL, Rhodes LA. Effects of beta-adrenergic antagonists on the QTmeasurements from exercise stress tests in pediatric patients with long QTsyndrome. Pediatr Cardiol. 2003;24:553–558.
22. Shimizu W, Noda T, Takaki H, Nagaya N, Satomi K, Kurita T, SuyamaK, Aihara N, Sunagawa K, Echigo S, Miyamoto Y, Yoshimasa Y,Nakamura K, Ohe T, Towbin JA, Priori SG, Kamakura S. Diagnosticvalue of epinephrine test for genotyping LQT1, LQT2, and LQT3 formsof congenital long QT syndrome. Heart Rhythm. 2004;1:276–283.
23. Vyas H, Hejlik J, Ackerman MJ. Epinephrine QT stress testing in theevaluation of congenital long-QT syndrome: diagnostic accuracy of theparadoxical QT response. Circulation. 2006;113:1385–1392.
24. Viskin S, Postema PG, Bhuiyan ZA, Rosso R, Kalman JM, Vohra JK,Guevara-Valdivia ME, Marquez MF, Kogan E, Belhassen B, Glikson M,
872 Circ Arrhythm Electrophysiol December 2011
by guest on March 29, 2018
http://circep.ahajournals.org/D
ownloaded from

Strasberg B, Antzelevitch C, Wilde AA. The response of the QT intervalto the brief tachycardia provoked by standing: a bedside test for diag-nosing long QT syndrome. J Am Coll Cardiol. 2010;55:1955–1961.
25. Swan H, Viitasalo M, Piippo K, Laitinen P, Kontula K, Toivonen L. Sinusnode function and ventricular repolarization during exercise stress test inlong QT syndrome patients with KvLQT1 and HERG potassium channeldefects. J Am Coll Cardiol. 1999;34:823–829.
26. Schwartz PJ, Periti M, Malliani A. The long Q-T syndrome. Am Heart J.1975;89:378–390.
27. Eggeling T, Osterhues HH, Hoeher M, Gabrielsen FG, Weismueller P,Hombach V. Value of Holter monitoring in patients with the long QTsyndrome. Cardiology. 1992;81:107–114.
28. Moss AJ, Shimizu W, Wilde AM, Towbin JA, Zareba W, Robinson JL,Qi M, Vincent GM, Ackerman MJ, Kaufman ES, Hofman N, Seth R,Kamakura S, Miyamoto Y, Goldenberg I, Andrews ML, McNitt S.Clinical aspects of type-1 long-QT syndrome by location, coding type,and biophysical function of mutations involving the KCNQ1 gene. Cir-culation. 2007;115:2481–2489.
CLINICAL PERSPECTIVEOur study focuses on the repolarization response during exercise stress testing (EST) in pediatric patients with long-QTsyndrome (LQTS). Using a cycle ergometer, we examined EST in 50 genotype-positive LQTS patients and 108 controlsubjects. The primary findings of this study were as follows: (1) Postural changes in the QT interval were useful indistinguishing LQTS patients from control subjects but were not useful to discriminate between LQT1 and LQT2genotypes. (2) A threshold heart rate–corrected QT interval (QTc) value of �460 ms during an extended recovery phase(7 minutes) of EST was useful in distinguishing LQTS children from both control patients and children with “concealed”LQTS. (3) LQT1 and LQT2 patients demonstrated unique QT interval adaptation patterns during exercise and the recoveryphase. (4) �QTc(7min-1min) �30 ms, which reflects the repolarization difference between the late and early recovery phases,was useful in distinguishing between LQT2 and LQT1 genotypes in children. The relatively gradual deceleration of heartrate in the recovery phase compared with adults explains the need for an extended recovery phase in the pediatricpopulation. Although this is the first study in genotyped pediatric LQTS patients to evaluate repolarization reserve and QTinterval adaptation during EST, our results need to be prospectively validated by a larger cohort. Additionally, our resultsare limited to bicycle ergometry and should not be extrapolated to other exercise protocols.
Aziz et al EST in Pediatric Patients With LQTS 873
by guest on March 29, 2018
http://circep.ahajournals.org/D
ownloaded from

Ramesh Iyer, R. Lee Vogel, Michael McBride, Victoria L. Vetter and Maully J. ShahPeter F. Aziz, Tammy S. Wieand, Jamie Ganley, Jacqueline Henderson, Akash R. Patel, V.
Postural Changes in Children With Long-QT SyndromeSpecific QT Adaptation During Exercise, Recovery, and−Genotype- and Mutation Site
Print ISSN: 1941-3149. Online ISSN: 1941-3084 Copyright © 2011 American Heart Association, Inc. All rights reserved.
Avenue, Dallas, TX 75231is published by the American Heart Association, 7272 GreenvilleCirculation: Arrhythmia and Electrophysiology
doi: 10.1161/CIRCEP.111.9633302011;4:867-873; originally published online September 28, 2011;Circ Arrhythm Electrophysiol.
http://circep.ahajournals.org/content/4/6/867World Wide Web at:
The online version of this article, along with updated information and services, is located on the
http://circep.ahajournals.org/content/suppl/2011/09/28/CIRCEP.111.963330.DC1Data Supplement (unedited) at:
http://circep.ahajournals.org//subscriptions/
is online at: Circulation: Arrhythmia and Electrophysiology Information about subscribing to Subscriptions:
http://www.lww.com/reprints Information about reprints can be found online at: Reprints:
document. Answer
Permissions and Rights Question andunder Services. Further information about this process is available in thepermission is being requested is located, click Request Permissions in the middle column of the Web pageClearance Center, not the Editorial Office. Once the online version of the published article for which
can be obtained via RightsLink, a service of the CopyrightCirculation: Arrhythmia and Electrophysiologyin Requests for permissions to reproduce figures, tables, or portions of articles originally publishedPermissions:
by guest on March 29, 2018
http://circep.ahajournals.org/D
ownloaded from
SUPPLEMENTAL MATERIAL
Supplemental Table 1: LQT1 and LQT2 Mutations by Location and Amino Acid Coding
Group Location and
Coding
Exon Number of
Patients
LQT1 Pre-Pore
Ile 235 Asn exon 5 2
Gly 168 Arg exon 3 5
Ala 46 Thr exon 1 2
Arg 174 Leu exon 3 1
Subtotal 10
Pore
Val 280 Glu exon 6 1
Thr 322 Met exon 7 3
Ala 344 Ala exon 7 1
Ser 349 Ter exon 8 5
Gly 325 Glu exon 7 1
Subtotal 11
Post-Pore
P400 fs/62X exon 9 1
Arg 594 Gln exon
15
1
Ser 546 Leu exon
13
1
Arg 360 Met exon 8 1
Gln 530 Ter exon
12
1
Gly 635 Arg exon
16
1
Gln 359 Ter (X) exon 8 1
Subtotal 7
Other intron
12
1
LQT2 Pore
Ile 593 Lys exon 7 1
Leu 552 Ser exon 7 5
His 562 Arg exon 7 1
Thr 613 Met exon 7 1
Gly 628 Ser exon 7 1
Pro 605 Leu exon 7 1
Thr 613 Met exon 7 1
Subtotal 11
Non-pore
His 70 Arg exon 2 1
Pro 123 fs +15x exon 2 1
Arg 176 Trp exon 4 3
Thr 74 Arg exon 2 1
Pro 347 Ser exon5 1
Val 94 Met exon 2 1
Pro 393 Leu exon 6 2
Subtotal 10
Supplemental Table 2: QTc Intervals (ms) During EST in LQTS Patients with and without Beta-
Blockers.
Rest Peak
exercise
1 min
recovery
3 min
recovery
5 min
recovery
7 min
recovery
9 min
recovery
LQT1
Beta-Blocker
(n=17)
450±23 479±31 491±42 485±30 484±20 480±24 480±25
No Beta-Blocker
(n=12)
454±39 495±37 474±29 495±44 489±39 487±33 491±36
P-value 0.75 0.22 0.24 0.48 0.67 0.5 0.36
LQT2
Beta-Blocker
(n=10)
491±38 429±16 425±16 457±36 475±20 474±18 482±20
No Beta-Blocker
(n=11)
460±25 447±39 441±32 464±33 462±23 482±20 474±25
P-value 0.05 0.18 0.18 0.64 0.17 0.32 0.83
Supplemental Table 3: QTc Intervals (ms) During EST in Concealed (cLQT) Patients.
cLQT1 cLQT2 P-
value
Rest 428±25 440±14 0.25
Peak exercise 467±26 441±24 0.04
1 min
recovery
471±39 428±28 0.01
3 min
recovery
477±42 456±34 0.68

5 min
recovery
474±27 466±23 0.49
7 min
recovery
475±34 472±17 0.78
9 min
recovery
472±34 471±19 0.95
Supplemental Table 4: QTc intervals during EST Based on LQT1 and LQT2 Gene Location
Peak Exercise 1 minute 3 minutes 5 minutes 7 minutes 9 minutes
LQT1
Pre-Pore 456±40 458±37 472±41 482±25 481±21 482±30
Pore 471±30 456±37 470±30 470±23 480±27 475±26
Post-Pore 482±60 461±45 490±40 484±23 490±30 473±25
LQT2
Non-Pore 471±34 458±28 472±32 471±30 476±27 479±24
Pore 472±51 475±52 488±53 489±42 485±27 489±37
P-value NS for comparison of LQT1 pre-pore vs. pore vs post pore
P-value NS for comparison of LQT2 non-pore vs. pore