genotype by environment interaction in slash pine and
TRANSCRIPT

UNIVERSIDADE ESTADUAL PAULISTA “JÚLIO DE MESQUITA FILHO”
FACULDADE DE ENGENHARIA
CAMPUS DE ILHA SOLTEIRA
MAXIMILIANO KAWAHATA PAGLIARINI
GENOTYPE BY ENVIRONMENT INTERACTION IN SLASH PINE AND
METHODOLOGIES COMPARISON FOR RADIATA PINE WOOD PROPERTIES
Ilha Solteira
2016
MAXIMILIANO KAWAHATA PAGLIARINI
Agronomist Engineer / Master
GENOTYPE BY ENVIRONMENT INTERACTION IN SLASH PINE AND
METHODOLOGIES COMPARISON FOR RADIATA PINE WOOD PROPERTIES
Thesis presented to Faculdade de Engenharia of
Ilha Solteira – UNESP as part of the requirements
for obtaining the title of Doctor. Speciality:
Production System.
Advisor: Prof. Dra. Ananda Virginia de Aguiar
Ilha Solteira
2016


To God for life and received opportunities.
To my parents Miguel Pagliarini and Antonia Dalva Kawahata Pagliarini that raised me with
love, respect and dedication.
In the middle of many difficulties,
They had love, courage,
Persistence and wisdom,
Allowing me to move on forever.
I DEDICATE

OFFERING
To my sister Juliana, my brother-in-law Anderson and my friends: Thiago Marchetti, Adilson
Araújo, Alexandre Cardoso, Alfredo Zambrano, Andressa Lopes, Barbara Moreira, Carla
Gordin, Carolina Arias, Cleber Barufaldi, Danielle Camara, Erica Moreira, Federica Brunoni,
Flávia Mariano-Nasser, Giselle Arnaud, Haleh Hayatgheibi, Heverton Schneider, Juliana
Moreira, Juliana Rebequi, Juliana Santos, Kaio Barcelos, Maria Cecília Cavalini, Maurício
Nasser, Natália Blaite, Regina Castilho, Sandro Naia, Uéliton Silva e Veridiana Mendonça.
Dear and true friends.

ACKNOWLEDGEMENTS
I wish to thank everyone who helped me complete this thesis. Without their continued efforts
and support, I would have not been able to bring my work to a successful completion.
To Faculdade de Engenharia of Universidade Estadual Paulista, Graduate course in
Agronomy, speciality Production Systems, for hosting and learning conditions offered
throughout the course.
To Embrapa Forests for internship opportunity and research development.
To Coordenação de Aperfeiçoamento de Pessoal de Nível Superior – CAPES – by granting
scholarships, in Brazil throughout agreement signed with Embrapa Florestas, and abroad
throughout inter-university exchange program (PDSE/CAPES).
To my advisor Profa. Dra. Ananda Virginia de Aguiar, for friendship, trust, opportunity and
teachings. Her competence, dedication and love for forest improvement are encouraging and
aroused in me curiosity to develop this work. I will bring her into my life as example of
researcher and mainly as person.
To my teachers who contributed to my professional formation since bachelor degree in
particular teachers of UNESP graduate, research line “Genetics” and “Plant Breeding and Plant
Propagation”: Prof. Dr. Alexandre Magno Sebbenn, Profa. Dra. Ananda Virginia de Aguiar,
Profa. Dra. Heloiza Ferreira Alves do Prado, Prof. Dr. João Antonio da Costa Andrade, Prof.
Dr. Mário Luiz Teixeira de Moraes, Prof. Dr. Miguel Luiz Menezes Freitas, Prof. Dr. Pedro
Cesar dos Santos who passed all their knowledge about plant breeding and quantitative genetics,
essential knowledge to foundation and development of this work.
To Umeå Plant Science Center – Swedish University of Agricultural Science, for the possibility
of exchange between universities, host and offered learning.
To supervisors in Sweden, Prof. Dr. Harry X. Wu e Prof. Dr. Anders Fries for teachings and
competence.
To graduate program coordinator Prof. Dr. Mário Luiz Teixeira de Moraes, for opportunity and
friendship.
To laboratory technician Selma Maria Bozzite Moraes, for teachings and friendship.
To Professors Dra. Daniela Araújo, Dra. Camila Regina Silva Baleroni Recco, Dr. Enes Furlani
Junior, Dr. Mário Luís Teixeira de Moraes, Dr. Alan Rodrigo Panosso, Dr. Evandro Vagner
Tambarussi and Dr. João Antonio da Costa Andrade for corrections in qualification, thesis and
friendship.
To Empresa Pinara Reflorestamento e Administração Ltda. for seedlings production and field
trials management.
To Embrapa – Forests technicians for experiment installation and conduction.

To graduate friends: Belisa, Cecília, Danilla, Diego, Francine, Janaina, Kelly, Maiara, Marília
(e Mainha), Ricardo, Thaisa, Wanderley, Willian and all those who, directly or indirectly, in a
special way, collaborated on another stage of my life.
To Embrapa Forests trainees Wesllen Kieras and Matheus Theodorovicz for their assistance in
field data.
To my friends in Sweden: Ainhoa, Alfredo, Biyue, Carolina, Chen, Federica, Francisco
(Paquito), Giselle, Haleh, Hong, Ilka, Irena, Jenny, Jhon, Mateusz, Mercedes, Pieter, RuiQui,
Tamara, QuiFu, Sonali, Tomas; to my officemates: Delphine, Siamsa, Tomas, Ogona for good
welcome and friendship.
To my friends in Brazil by living and support during the doctoral period: Thiago, Adilson,
Alberto (Beto), Alexandre, Alexandre Andrade, Barbara Moreira, Carla, Cleber, Daniela,
Danielle, Denis, Erica, Fernando Proietti, Fernando Rocha, Flávia, Guilherme, Heverton, Jorge,
Kaio, Juliana Moreira, Juliana Rebequi, Juliana Santos, Kaio, Luis Neves, Maria Cecília,
Maristela, Maurício, Natália, Regina, Sandro, Uéliton, Veridiana e Vilma.
To my grandmothers Glória and Honir; to my ants Fátima, Regina, Mitiko (in memorian), Ieda
and Cenira; to my uncle Roberto (Beto); to my cousins Humberto, Adriano, Fernando, Bárbara,
Barbara, Bianca, Bruno, Daniele and Gisele who always believed and cheered for my
professional success.
To all who directly or indirectly contributed to this work.
Last but not least, to God for having guided me and always taking me to meet special people
and achieve all my purposes.

“My scientific studies have afforded me great gratification; and I am convinced that it will not
be long before the whole world acknowledge the results of my work”
Gregor Johann Mendel

ABSTRACT
Exotic forest species have been introduced in Brazil in order to promote improvements in
socioeconomic development and help to reduce the pressure caused to native forests. With
growing demand for these species, research on genetic improvement has increased to find new,
more productive germplasm and preferably in less time. Two species were used in the study:
slash pine (Pinus elliottii Engelm. var. elliottii) and radiata pine (Pinus radiata D. Don). The
first part of the study had the purpose to identify the stability, adaptability, productivity and
genetic parameters, in addition to selection gain and genetic divergence in slash pine open
pollinated second generation progenies considering phenotypic trait. Two tests were
established, one in Ponta Grossa-PR with 24 progenies and one in Ribeirão Branco-SP with 44
progenies, both in Brazil, to identify the most productive genotypes for commercial planting
areas in both sites. There was significant variation (p<0.01) among progenies for growth and
form traits. The high coefficients of genetic variation for wood volume (14.31% to 16.24% -
Ribeirão Branco-SP and 31.78% to 33.77% - Ponta Grossa-PR) and heritability (0.10 to 0.15 –
Ribeirão Branco-SP and 0.36 to 0.48 – Ponta Grossa-PR) have shown low environmental
influence on phenotypic variation, which is important for the prediction of genetic gain by
selecting and confirming genetic potential in both places, especially Ponta Grossa. The effect
of genotype x environment interaction is simple. Progenies planted in one site can also be
planted in the other. Among these C-197, C-189-1, C-084-2 and C-032-2 progenies are suitable
for plantations in both studied region of São Paulo and Paraná. Although larger number of
progenies in Ribeirão Branco, it was found the same number of clusters through UPGMA and
Tocher methods in both tests. There is genetic diversity among slash pine progenies. For
breeding programs, it is recommended to cross progenies between different groups to increase
genetic variation, and consequently the genetic gain in subsequent generations, not forgetting
to take into account the performance of interest trait. The objective of the study in Radiata pine
was relate wood quality traits obtained from two methods Pilodyn and SilviScan to validate an
efficient phenotyping methodology for a greater number of samples. A test with 30 progenies
of Radiata pine was established in Flynn Australia. The evaluated traits were wood density,
microfibril ange and modulus of elasticity. Genetic and phenotypic correlation between traits
of wood quality obtained from two methods and narrow-sense individual heritability were
estimated. The Pilodyn data showed high heritability and high genetic and phenotypic
correlation between wood density and moderate with microfibril angle and modulus of
elasticity. The results confirm that the Pylodyn is an effective indirect and rapid method for
evaluation of genetic parameters for wood quality traits in Radiata pine.
Keywords: Pinus elliottii Engelm. var. elliottii. Pinus radiata D. Don. Genetic diversity.
Genotype by environment interaction. Pilodyn. SilviScan.

RESUMO
Espécies exóticas de Pinus foram introduzidas no Brasil para promoverem o crescimento
socioeconômico do país e ajudar na redução da pressão causada pelo uso de florestas nativas
Com a crescente demanda por essas espécies, pesquisas em melhoramento genético tem
aumentado na busca de novos germoplasma mais produtivos em menor tempo. Duas espécies
foram utilizadas no presente trabalho: Pinus elliottii Engelm. var. elliottii e Pinus radiata D.
Don. A primeira parte do trabalho teve a finalidade de identificar a estabilidade, a
adaptabilidade, a produtividade e os parâmetros genéticos, além do ganho de seleção e
diversidade genética em progênies de polinização aberta de segunda geração de P. elliottii var.
elliottii considerando os caracteres fenotípicos. Foram estabelecidos dois testes, um em Ponta
Grossa-PR com 24 progênies e outro em Ribeirão Branco-SP com 44 progênies visando
identificar os genótipos mais produtivos para áreas de plantio comercial em ambos locais. Foi
observada variação significativa (p<0,01) entre as progênies para os caracteres de crescimento
e alguns caracteres de forma. Os altos coeficientes de variação genética para volume de madeira
(14,31% a 16,24% - Ribeirão Branco e 31,78% a 33,77% - Ponta Grossa) e herdabilidade (0,10
a 0,15 – Ribeirão Branco e 0,36 a 0,48 – Ponta Grossa) mostraram baixa influência do ambiente
na variação fenotípica, o que é importante para a predição do ganho genético mediante a seleção
e confirmam potencial genético em ambos os locais, especialmente Ponta Grossa. O efeito da
interação genótipo x ambiente é simples. As progênies plantadas em um local poderão também
ser plantadas no outro. Dentre essas as C-197, C-189-1, C-084-2 e C-032-2 são indicadas para
plantações tanto na região estudada do estado de São Paulo quanto do Paraná. Apesar de um
número maior de progênies em Ribeirão Branco, constatou-se o mesmo número de
agrupamentos de progênies pelo método UPGMA e de otimização de Tocher em ambos os
testes. Existe diversidade genética entre as progênies de P. elliottii. Para programas de
melhoramento, recomenda-se o cruzamento entre progênies de grupos divergentes para
aumentar a variação genética, e consequentemente, o ganho genético nas gerações
subsequentes, sem esquecer de se levar em consideração a performance do caráter de interesse.
O objetivo do trabalho em P. radiata foi relacionar os resultados de características da madeira
obtidas a partir de dois métodos Pilodyn e SilviScan visando validar uma metodologia eficiente
para fenotipagem de um maior número de amostras. Um teste com 30 progênies de P. radiata
foi estabelecido em Flynn na Austrália. As características avaliadas foram densidade da
madeira, o ângulo microfibrilar e o módulo de elasticidade. A correlação genética e fenotípica
entre os caracteres da madeira obtidas a partir dos dois métodos e a herdabilidade individual no
sentido restrito foram estimadas. Os dados de Pilodyn apresentaram alta herdabilidade e alta
correlação genética e fenotípica entre densidade de madeira e moderada com ângulo
microfibrilar e módulo de elasticidade. Os resultados confirmam que o Pylodyn é um efetivo
método indireto e rápido para avaliação de parâmetros genéticos para caracteres de qualidade
madeira em P. radiata.
Palavras-chave: Pinus elliottii Engelm. var. elliottii. Pinus radiata D. Don. Diversidade
genética. Interação genótipo x ambiente. Pilodyn. SilviScan.

LIST OF FIGURE
Figure 1 - Percentage distribution of pine forest plantations in Brazil in
2014
20
Figure 2 - Natural geographic distribution of slash pine in USA,
highlighted in green. 26
Figure 3
- Slash pine reproductive structures: female strobilus (A), male
strobilus (B) and female strobilus already developed, called cone
(C).
27
Figure 4
- Radiata pine natural geographic distribution in the United State
highlighted in green and yellow.
28
Figure 5
- Radiata pine reproductive structures: female strobilus (A), male
strobilus (B) and female strobilus already developed, called cone
(C).
29
Figure 6 - Total precipitation and monthly temperature mean for
municipalities of Ribeirão Branco-SP and Ponta Grossa-PR,
Brazil, from April 2009 to April 2015. 53
Figure 7 - Geographical localization of municipalities of Ribeirão Branco-
SP and Ponta Grossa-PR, respectively, in Brazil. 54
Figure 8
-
Mean values, likelihood ratio test (LRT) and significance levels
for slash pine growth traits in municipalities of Ribeirão Branco
and Ponta Grossa, Brazil. (LRT above dashed line = p<0.05;
above dotted line = p<0.01 and below dashed line = not
significant). 60
Figure 9
-
Mean values, likelihood ratio test (LRT) and significance levels
for slash pine form traits in municipalities of Ribeirão Branco
and Ponta Grossa, Brazil. (LRT above dashed line = p<0.05;
above dotted line = p<0.01 and below dashed line = not
significant – BA: branch angle, BT: branch thickness, FOR: fork,
FT: fox tail, NB: number of branches, SS: stem straightness). 60
Figure 10
-
Coefficients of experimental variation, individual additive
genetic variation and accuracy for growth traits for Slash pine
tests in municipalities of Ribeirão Branco and Ponta Grossa,
Brazil. 62
Figure 11
-
Coefficient of experimental variation, individual additive genetic
variation and accuracy for Slash pine progenies test in Ribeirão
Branco-SP and Ponta Grossa-PR, Brazil. (BA: branch angle, BT:
branch thickness, FOR: fork, FT: fox tail, NB: number of
branches, SS: stem straightness).
63
Figure 12 - Individual narrow-sense heritability estimates for height, dbh
and wood volume for Slash pine published works.
64
Figure 13
-
Narrow-sense individual heritability and progeny heritability
mean for slash pine growth traits in municipalities of Ribeirão
Branco and Ponta Grossa, Brazil. 66
Figure 14
-
Narrow-sense individual heritability and progeny heritability
mean for slash pine form traits in municipalities of Ribeirão
Branco and Ponta Grossa, Brazil. (BA: branch angle, BT: branch
thickness, FOR: fork, FT: fox tail, NB: number of branches, SS:
stem straightness). 66
Figure 15
-
Estimates of genetic correlations (Ponta Grossa = above the
diagonal, Ribeirão Branco = below the diagonal) between
growth and forms traits for Slash pine progenies in Brazil.
69
Figure 16 - Estimates of phenotypic correlations (Ponta Grossa = above the
diagonal, Ribeirão Branco = below the diagonal) between
growth and forms traits for Slash pine progenies in Brazil.
71
Figure 17 - Total precipitation and monthly temperature mean for
municipalities of Ribeirão Branco-SP and Ponta Grossa-PR,
Brazil, from April 2009 to April 2015.
88
Figure 18 - Geographical localization of municipalities of Ribeirão Branco-
SP and Ponta Grossa-PR, respectively, in Brazil.
89
Figure 19 - Dendrogram resulting from analysis of 44 progenies of slash
pine in municipality of Ribeirão Branco, Brazil, obtained by
UPGMA clustering method based on the Mahalanobis distance.
The coefficient of cophenetic value (r) is 0.90.
96
Figure 20 - Dendrogram resulting from analysis of 24 progenies of slash
pine in municipality of Ponta Grossa, Brazil, obtained by
UPGMA clustering method based on the Mahalanobis distance.
The coefficient of cophenetic value (r) is 0.76.
97
Figure 21 - Likelihood ratio test (LRT) and significance level for diameter at
breast height (DBH), microfibril angle (MFA), modulus of
elasticity (MOE) and wood density (DEN) measured by
SilviScan and Pilodyn penetration (PP) for Flynn trial, Australia.
(LRT above dashed line = p<0,05; above dotted line = p<0,10;
PP = p<0,01).
111
Figure 22 - Mean values for diameter at breast height (DBH), microfibril
angle (MFA), modulus of elasticity (MOE) and wood density
(DEN) measured by SilviScan and Pilodyn penetration (PP) for
Flynn trial, Australia.
111

Figure 23 - Narrow-sense individual heritability (hi2) for diameter at breast
height (DBH), microfibril angle (MFA), modulus of elasticity
(MOE) and wood density (DEN) measured by SilviScan and
Pilodyn penetration (PP) for Flynn trial, Australia.
112
Figure 24 - Genetic and phenotypic correlations between Pilodyn
penetration and diameter at breast height (DBH), microfibril
angle (MFA), modulus of elasticity (MOE) and wood density
measured by SilviScan for Flynn trial, Australia. 114

LIST OF TABLE
Table 1 - Details of slash pine progeny tests deployed in municipalities of
Ribeirão Branco-SP and Ponta Grossa-PR, Brazil.
53
Table 2 - Scoring for form traits of slash pine progenies in municipalities
of Ribeirão Branco and Ponta Grossa, Brazil.
55
Table 3 - Selection strategies based on wood volume (VOL) and stem
straightness (SS) for slash pine progenies in municipalities of
Ribeirão Branco and Ponta Grossa, Brazil at five and four years
old respectively. Strategy: I) Individual selection of 80 best trees;
II) best two individuals per progeny and III) best 50% individuals
per progeny.
68
Table 4 - Estimate of genetic parameters and genotype x environment
interaction for height, diameter at breast height (DBH), wood
volume and stem straightness (SS) in four years old slash pine
progenies in Ribeirão Branco-SP and Ponta Grossa-PR, Brazil.
73
Table 5 - Slash pine progenies selection based on wood volume for
stability (MHVG), adaptability (PRVG) and simultaneously to
productivity, stability and adaptability (MHPRVG), at four years
of age in municipalities of Ribeirão Branco and Ponta Grossa,
Brazil.
75
Table 6 - Details of slash pine progeny tests deployed in municipalities of
Ribeirão Branco-SP and Ponta Grossa-PR, Brazil.
91
Table 7 - Scoring for form traits of slash pine progenies in municipalities
of Ribeirão Branco and Ponta Grossa, Brazil.
88
Table 8 - Generalized Mahalanobis Distance (D2) in percentage between
slash pine progenies in municipality of Ribeirão Branco-SP,
Brazil in relation to grater progeny distance.
90
Table 9 - Generalized Mahalanobis Distance (D2) in percentage between
slash pine progenies in municipality of Ponta Grossa-PR, Brazil
in relation to grater progeny distance.
94
Table 10 - Progeny rank for wood volume at four years of age at Ribeirão
Branco and three years of age for Ponta Grossa, Brazil (a:
additive genetic effect).
95
Table 11 - Groups formed by Tocher Optimization method for slash pine
progenies in municipality of Ribeirão Branco, Brazil.
99
Table 12 - Groups formed by Tocher Optimization method for slash pine
progenies in municipality of Ponta Grossa, Brazil. 99

SUMÁRIO
1 INTRODUCTION 16
2
2.1 LITERATURE REVIEW
THE GENUS Pinus
19
19
2.2 MAIN GENUS Pinus USES 20
2.3 CHARACTERISTICS OF PINE WOOD 21
2.3.1 Wood density 22
2.3.2 Wood stiffness (Modulus of elasticity) 22
2.3.3 Microfibril angle 23
2.3.4 Methodologies for wood quality traits evaluation 24
2.4 Pinus elliottii ENGELM. var. elliottii 25
2.5 Pinus radiata D. DON 27
2.6 FOREST BREEDING 29
2.7 GENETIC PARAMETERS ESTIMATES 31
2.8 EARLY AGE SELECTION 33
2.9 GENOTYPE X ENVIRONMENT INTERACTION (G X E) 33
REFERENCES 37
3 CHAPTER 1
ESTIMATE OF ADAPTABILITY, STABILITY, PRODUCTIVITY
AND GENETIC PARAMETERS IN EARLY AGE SLASH PINE
SECOND-GENERATION PROGENIES 49
3.1 INTRODUCTION 51
3.2 MATERIALS AND METHODS 53
3.2.1 The trials 53
3.2.2 Traits measurement 54
3.2.3 Estimates of variance components and genetic parameters 55
3.2.4 Individual analysis and estimation of genetic parameters 55
3.2.5 Effective population sizes and expected selection gains 57
3.2.6 Trait-trait and age-age genetic and phenotypic correlations 58
3.2.7 Productivity, stability and adaptability 58
3.3 RESULTS AND DISCUSSION 59
3.3.1 Individual deviance analysis and genetic parameters estimation 59
3.3.2 Effective population sizes and expected selection gains 66
3.3.3 Age-age and trait-trait genetic and phenotypic correlation 69
3.3.4 Joint analysis 71
3.3.5 Productivity, stability and adaptability 73
4.4 CONCLUSIONS 76
REFERENCES 77
4
CHAPTER II
GENETIC DIVERGENCE AND DIFFERENT CLUSTERING
METHODS AMONG SLASH PINE SECOND GENERATION
PROGENIES IN EARLY AGE 84
4.1 INTRODUCTION 86
4.2 MATERIALS AND METHODS 88
4.2.1 The trials 88

4.2.2 Traits measurement 89
4.2.3 Estimates of genetic divergence 90
4.3 RESULTS AND DISCUSSION 92
4.3.1 Generalized Mahalanobis distance 92
4.3.2 Comparison between clustering methods 95
4.4 CONCLUSIONS 100
REFERENCES 101
5
CHAPTER III
COMPARISON BETWEEN TWO METODOLOGIES FOR WOOD
QUALITY TRAITS IN RADIATA PINE 104
5.1 INTRODUCTION 106
5.2 MATERIALS AND METHODS 108
5.2.1 The trial 108
5.2.2 SilviScan and Pilodyn measurements 108
5.2.3 Statistical analyses 108
5.3 RESULTS AND DISCUSSION 110
5.3.1 Wood quality traits means 110
5.3.2 Narrow-sense individual heritability 112
5.3.3 Genetic and phenotypic correlations 113
5.4 CONCLUSIONS 115
REFERENCES 116
APPENDICES 120

16
1 INTRODUCTION
Forest species are important for Brazilian economy as row material sources for timber
and non-timber products used mainly in building, biomass for cellulose pulp and paper
production, industrial energy source, as well as material for cosmetics, pharmaceutical and food
industries (STUDART-GUIMARÃES et al., 2003). In 2014, planted forest area for industrial
use in Brazil achieved 7.74 million hectares, and it has increased 1.8% compared to 2013. Two
genus stand out on the national scenarios, first is Eucalyptus occupying 5.56 million hectares,
which represents 71.9% of total established mainly in Minas Gerais (25.2%), São Paulo (17.6%)
and Mato Grosso do Sul (14.5%) states. Second is Pinus with 1.59 million hectares concentrated
in Paraná (42.4%) and Santa Catarina (34.1%) states (BRAZILIAN TREE INDUSTRY – IBÁ,
2015).
Pine species are widely used in homogeneous reforestation in many parts of the globe
due to the large adaptation to climate diversity and wide application of their products (wood,
resins, fibres, plates, pulp, paper, etc.) (SEBBENN, 1994). In Brazil, research institutions,
universities and forest companies have conducted several researches for decades with this genus
in breeding programs and silvicultural management (MOURA; VALE, 2002). The species
introduced in Brazil are from many places occurring naturally in North and Central America,
northern Europe and Asia (LIMA; JARÁ; ALFONSO, 1988).
Based on forest industry demand, trees with desirable phenotypic traits have been
selected over time and incorporated into breeding programs in order to obtain more productive
genotypes (GARTLAND, 2003). Although improvement programs have contributed
significantly to increase productivity in forestry sector, they have run into consequent
limitations of intrinsic characteristics, especially pine species, highlighting the long term
needed for plants reach a phenotypic stability, reproductive maturity and difficulty of control
in crosses between species (DIOUF, 2003; POUPIN; ARCE-JOHNSON, 2005).
Early pine researches were held in 1936 in the Garden of Cantareira in São Paulo state,
at that time called Serviço Florestal of São Paulo (now Instituto Florestal of São Paulo - IFSP).
European species were introduced first, however, they failed to succeed due to their poor
adaptation to the tested region climate. From 1948, species introduction studies have been
intensified, with special attention to "southern yellow pine of United States "(Pinus elliottii,
Pinus taeda, Pinus palustris and Pinus echinata) (PINTO JÚNIOR et al., 2013).
Initially, in Brazilian forests, subtropical species as Pinus elliottii and Pinus taeda
highlighted in the South and Southeast regions of the country. From 1960s, with expansion of

17
forest sector, tropical species have been brought to other regions such as Pinus caribaea, Pinus
oocarpa and Pinus patula (SHIMIZU, 2005a).
Slash pine (Pinus elliottii Engelm. var. elliottii) has been planted in cold and high
regions of São Paulo and Paraná states because of similar environmental characteristics where
the species comes from. It is used for timber production aiming mechanical processing and
resin extraction. Although this species is not the most productive in volume it produces high-
quality physical and mechanical wood. Production begins at age seven or eight with wood for
processing and use in structures, carpentry, packaging and building. Good adaptability to
different environmental conditions such as shallow, stony and soaked soils; frost tolerance;
produces few branches which implies higher production of clean wood (without knots) as well
as being slightly attacked by wasp-of-wood (AGUIAR et al., 2011; SHIMIZU, 2008).
With introduction of new species and the demand for more wood it was necessary to
produce more in less time, therefore, breeding programs for each species needed to be
developed. The main objectives of breeding programs are: increment of productivity,
obtainment of higher quality raw materials, improvement in adaptive species conditions and
maintenance of genetic variability, fundamental requirement for obtaining genetic gains in long
term (ZOBEL; TALBERT, 1984). Although more wood production in a shorter period of time
has been essential, the quality of this wood must be taken into consideration to achieve market
standards requirement. Among the most important wood quality traits, it is possible to highlight
wood density, wood stiffness (measured as its modulus of elasticity – MOE), and microfibril
angle (MFA). Nevertheless, a serious problem faced by research is how to measure wood
properties. Methods may be expensive, slow and mainly destructive (WU et al., 2010).
Therefore, non-destructive methods started to be tested and considerably reduced those
limitations (WENG et al., 2015).
Non-destructive methodologies for assessment of wood quality traits have been studied
for years in many pine species and two of them may be highlighted. For measuring the density
variation on field, a method to be applied may be the use of an instrument called Pilodyn
(MICKO et al., 1982). The depth penetration of the pin is indicated on the instrument and
readings are correlated with the wood density. Pilodyn does not provide density estimates, but
the instrument has already been calibrated for trees wood density measurements in several
studies (HÖGBERG et al., 2014; CHEN et al., 2015). The second technique estimate wood
quality traits based on data provided by SilviScan (CIESZEWSKI et al., 2013; HONG et al.,
2015). The equipment is used to evaluate the properties of wood from pith to the bark quickly

18
using a combination of X-ray densitometry, X-ray diffraction and image analysis (BALL;
McCONCHIE; COWN, 2005).
Thus, the objectives of this study were: (i) estimate genetic parameters for quantitative
traits in slash pine progenies, aiming early selection for wood production, (ii) identify more
productive genotypes for commercial planting in São Paulo and Paraná states, (iii) verify
genotypes productivity, stability and adaptability deployed in two different soil and climatic
conditions in São Paulo and Paraná states from MHVG (harmonic mean of breeding values)
statistical procedures, PRVG (relative performance of breeding values) and MHPRVG
(harmonic mean of breeding values relative performance) predicted via BLUP, (iv) estimate the
genetic distance among progenies through growth and form traits by multivariate procedures in
order to guide future hybridization in breeding programs aiming wood production and (v)
estimate narrow-sense individual heritability for Pilodyn penetration and wood quality traits for
radiata pine progenies, (vi) verify whether Pilodyn penetration measurements may predict wood
density, MFA, MOE according to phenotypic and genotypic correlation with SilviScan
measurements for radiata pine progenies.

19
2 LITERATURE REVIEW
2.1 THE GENUS Pinus
Exotic forest species have been introduced in Brazil in order to promote improvements
in socioeconomic development and help to reduce the pressure caused to native forests
(SAMPAIO et al., 2000). European immigrants introduced Pinus genus in decade of 1930s
aiming wood production and garnish purpose (FIER; KIKUTI, 1993). However, due to climate
differences from origin place, there was no success adaptation for introduction of first species.
Several plants originating from United States, Mexico, Central America, Caribbean Islands and
Asia were later introduced. But, species from North and Central America have better adaptation
and economic importance (SILVA, 2005).
The main use of these species is as a source of raw material for wood, resin, pulp and
paper industries. The establishment and management of planted forests with pine have enabled
the timber supply, which, previously, was supplied by Brazilian pine (Araucaria angustifolia
Kuntze) exploration. Thus, this practice has established itself as an important ally (confederate)
of native forest ecosystems supplying an increasing necessity of wood (SHIMIZU;
MEDRADO, 2005). The potential of pine species as wood production for industrial processing
was the main motivation for many species and provenances testing by government agencies
and private companies (SHIMIZU; SEBBENN, 2008; PIRES et al., 2013; MOREIRA et al.,
2014).
Pine species are valuables by light colour wood, ranging from white to yellowish;
softwood, suitable for high-strength paper manufacturing for packaging, newsprint and other
kinds of papers; possibility of resin extraction on a commercial scale, in some species; including
hardiness and tolerance for agriculture marginal soils aggregating value to the land with wood
production (SHIMIZU; MEDRADO, 2005). Large areas, in Brazil, have been planted with this
genus taking advantage of tax income to provide the demand of wood, pulp and paper
industries. According to the Brazilian Institute for Forest Development - IBDF in 1986 the area
planted with this genus, through tax incentives, in South and Southeast regions totalled 1.7
million hectares, 400,000 ha in São Paulo state (AZEREDO, 1988). Currently, the planted area
reduced to 1,588,997 ha and it is concentrated in the South region (88.1%), due to
environmental conditions and location of processor centres for this type of wood, mainly in
Paraná (42.4%) and Santa Catarina (34.1%) states (Figure 1) (IBÁ, 2015).

20
Figure 1 – Percentage distribution of pine forest plantations in Brazil in 2014.
Source: Ibá (2015) and adapted by the author.
2.2 MAIN GENUS Pinus USES
Pine wood is a material with mechanical strength comparable to steel, safeguarding all
proportions. However, their use is not widespread, due to some characteristics still considered
disadvantageous in relation to other materials (SUN; HAWKE, 1996).
Physical and mechanical properties of wood are important regarding to the applications
of each material. Thus, combined with other aspects (economic, aesthetic, durability,
workability, etc.), wood can be classified and grouped into more suitable uses as structures, use
indoor and outdoor housing, furniture, panels, packaging, etc. (MORAES NETO; TELES;
RODRIGUES, 2009). Among main wood physical properties, we can highlighted density
(weight per volume) and dimensional stability (shrinkage and swelling due to moisture content).
For mechanical properties the most important are resistant to compressive stresses, flexural,
tensile, shear and cracking (ARAÚJO, 2002).

21
Wood chemical components can be grouped in two: cellulose with high molecular
weight components and hemicelluloses and lignin with low molecular weight components
(PANSHIN; ZEEUW, 1970). According to Fengel and Wegener (1989) proportions and
chemical composition differ in conifers and broadleaved trees. While in conifers cellulose and
hemicellulose content is 42% and 27%, respectively, in broadleaved trees content is higher than
45% and 30%. Regarding, conifers have higher lignin content than broadleaved trees (28% and
20%, respectively).
Many pine species have advantage of multiple uses, in addition to wood production, it
is possible to include the recovery of degraded areas and pulp and paper production (RIGHT;
SABOURIN; DVORAK, 1995). In this case the growing demand for pulp and paper,
globalization of its markets and environment concernment have been increasing researches to
find new appropriate raw materials and less polluting. In Brazil, the pine wood is an example
due to the intensity of studies for this genus (BIRKLAND, 1990). Furthermore, secondary wood
presents tracheids and resiniferous ducts enabling resin production (SUASSUNA, 1977).
2.3 CHARACTERISTICS OF PINE WOOD
The use of pine wood emerged as an alternative to lack of Brazilian pine wood and other
native species from south country. Due to the inherent genus characteristics as good slightly
acidic soil adaptation, resistance and easy field deployment, adaptation was possible (COELHO
et al., 2010). Therefore, characterize the mechanical behaviour of wood, for example, is
necessary to take into account some anatomical, physical and chemical properties to indicate
certain species to certain location.
Genetic analysis of conifers wood quality properties were held, mainly in larger scale
for economically important species such as Pinus radiata (BALTUNIS; WU; POWELL, 2007;
WU et al., 2007, 2008), Pinus taeda (ISIK; MORA; SCHIMLECK, 2011; ANTONY et al.,
2011) and Pinus sylvestris (HONG; FRIES; WU, 2015). Most of these studies have focused on
evaluating wood density, wood stiffness (by modulus of elasticity – MOE) and microfibril angle
(MFA). In Pinus sylvestris, genetic parameters for wood mechanical components were
examined and the conclusion was that selective breeding for wood quality traits should result
in considerable genetic gain (HANNRUP; EKBERG, 1998; FRIES, 2012; HONG; FRIES;
WU, 2014).

22
2.3.1 Wood density
Basic density is closely linked to wood quality and it is well used by researchers and
breeders to determine final use of wood. Species, provenances and progenies of pine have
shown highly wood density variation. This trait presents high heritability, according to growth
traits. In forest genetic improvement, selections are usually directed to growth and form aspects,
such as gains in volume and form. In the other hand, less attention has been given to
technological aspects and wood quality. These are considered only in the secondary selection
processes (BRASIL; NICCOLLETO; VEIGA, 1980).
Wood density is expressed as the ratio between dried green mass and volume of
sampling unit (BOWYER; SHMULSKY; HAYGREEN, 2007). It is often referred as "density"
or dry weight divided by volume of water-saturated wood. The relationship between mass and
volume is one of the simplest and most important functional properties of wood index and
reflect different attributes for life story of tree species (MULLER-LANDAU, 2004;
WILLIAMSON; WIEMANN, 2011).
Despite of complex nature of this property, variations in wood density may be difficult
to interpret because certain density value can be derived from various combinations of
components (GASPAR et al., 2008), for instance, precipitation is positively linked to wood
density, mainly winter rainfalls. Dry season can cause temporary reduction in growth resulting
false rings (MEAD, 2013). In addition to this, silvicultural practices as thinning and fertilizing
can interfere in wood density, after thinning, wood density can reduce (WILKES, 1987;
COWN, 1999) and after fertilizing deficient sites tends to restore density (GERISCHER;
VILLERS, 1963). Moreover, density is different along the stem where pith presents higher
values than the bark.
2.3.2 Wood stiffness (Modulus of elasticity)
Modulus of elasticity (MOE) or stiffness is a portion of the distortion that wood
undertakes when subject to an applied weight, and it is measured as a ratio between stress and
tension. It is a property of particular interest to farmers and processors of structural lumber as
it determines the end-use and value of lumber cut from a tree (ANTONY et al., 2012).
According to Roth et al. (2007) and Soto, Valenzuela and Lasserre (2012), wood with high
MOE is more rigid material, and, therefore, harder to deflect, thus, high MOE values mean
better wood quality.

23
MOE is also a key property for determining quality of laminated veneer wood. Low
MOE in radiata pine, for example, restricts exploitation possibilities, and is more predominant
when trees are developed on fertile sites over short rotations designed for fast achievement of
large piece-size (BURDON; BRITTON; WALFORD, 2001).
Corewood MOE is highly variable and affected by genetic, environmental and
silvicultural influences (DUNGEY et al., 2006; WATT et al., 2009; WAGHORN; WATT;
MASON, 2007). In softwood of radiata pine and slash pine huge genetic difference in wood
stiffness has been found at young trees, with medium to high heritabilities (KUMAR, 2004;
DUNGEY et al., 2006; LI et al., 2007). As wood density, corewood MOE may be influenced
by site conditions and silvicultural practices ranging widely across environmental gradients
(WATT et al., 2009).
The wood stiffness of many pine species is largely correlated upon their density,
microfibril angle (MFA) and MOE. According to researches high MFA and low specific gravity
are found near the pith (corewood zone) associated with low MOE. The opposite is also true,
low MFA, high specific gravity and MOE means stiffer wood, mainly near the bark (outerwood
zone) (DOWNES et al., 2002; ANTONY et al., 2012; FUJIMOTO et al., 2015; WESSELS et
al., 2015).
2.3.3 Microfibril angle
Microfibril angle (MFA) is the average orientation of the cellulose microfibrils in the
S2 layer of the wood cell wall in relation to longitudinal axis. It is one of the key determinants
of solid wood performance due to its strong effect on stiffness, strength, and shrinkage
properties and dimensional stability of structural wood (CAVE; WALKER, 1994), timber
properties improve as far as MFA decreases (WINCK; FASSOLA, ÁREA, 2015). In conifers,
values of MFA are commonly higher near the pith (usually 25° to 30° in the first few growth
rings) and decline fast in the first 10 to 15 growth rings before forthcoming more stable value
(approximately 10° to 12°) in mature wood (BARNETT; BONHAM, 2004; ALTEYRAC;
CLOUTIER; ZHANG, 2006). Despite the influence of the MFA in wood properties research is
limited because its difficulty to measure, however, some authors used orientation scores and
crossing fields on tracheids wall for measuring MFA as it is indicative of microfibrils alignment
(WINCK; FASSOLA, ÁREA, 2015).

24
2.3.4 Methodologies for wood quality traits evaluation
Accurate measurements of wood quality traits require laboratory measurements with
destructive samples use, which is not applicable for monitoring purposes, therefore, non-
destructive techniques started to be studied. Non-destructive measurements is the evaluation of
a material’s properties without damaging its end use (ROSS; BRADSHAW; PELLERIN,
1998). The eldest non-destructive evaluation of wood was visual examination, mostly used for
load-carrying members classification (BUCUR, 2006). A machine stress assessment system
was introduced lately, which is one of the most used methods in lumber grading and has been
commercially used since the 1960’s (GALLIGAN; McDONALD, 2000). Advances in
equipment have made it possible to use scientific non-destructive tools for the last two decades.
Vibration and ultrasonic wave velocity are mainly significant in finding, for instance, modulus
of elasticity. Ultrasonic wave velocity has more benefits over other methods in practical terms
(ESTEBAN; FERNANDEZ; DE PALACIOS, 2009).
Another developed non-destructive technique with many studies is near infrared
spectroscopy (NIRS). It has high potential for the fast evaluation of various wood
characteristics, including wood stiffness (TSUCHIKAWA; KOBORI, 2015; FUJIMOTO et al.,
2015). A distinguished benefit of NIRS is that it can be used to measure multiple traits
concurrently. When selection is done to improve economic values of tree growth and wood
properties, it is commonly applied to several traits all together and not just one, because
economic value depends on more than one trait (FALCONER; MACKAY, 1996).
For measuring density variation range at field level a method to be applied may be the
use of spring call Pilodyn (MICKO et al., 1982), which is an instrument originally developed
for determining rot degree of telephone poles (HANSEN, 2000). Pilodyn measures the
resistance to penetration of wood when a steel pin with a determined force is introduced into it
by a spring (SPRAGUE et al., 1983; GREAVES et al., 1996; LEE; CONNOLLY, 2010).
Penetration depth of pin is indicated on the instrument and readings are correlated with wood
density. The instrument itself does not provide density estimates, however, it was calibrated for
wood density measurements in several studies (MICKO et al., 1982; SPRAGUE et al., 1983;
HÖGBERG et al., 2014; MURPHY; COWN, 2015). Another way of analysing physical wood
properties is through X-rays methodologies. Many equipment has been developed including the
SilviScan. It is a set of automated tools for rapid assessment of physical wood properties, using
a combination of X-ray densitometry, X-ray diffraction and image analysis. SilviScan is used

25
for its ability to evaluate these properties from pith to bark in a quickly way (BALL;
McCONCHIE; COWN, 2005).
Many technologies have been proposed and developed along the years and all of them
have their advantages and disadvantages. It is up to each breeder to test the possibilities to find
the best way to evaluate wood quality traits either using existing methodologies or creating new
ones.
2.4 Pinus elliottii ENGELM. var. elliottii
This species is commonly known as slash pine or Florida pine. The origin centre is
located in the south-eastern North America at Alabama, Florida, Georgia, Louisiana,
Mississippi, North Carolina, South Carolina and Texas states (Figure 2).
A special feature of slash pine is the tolerance to wet soils it can be planted in areas
where water table is near surface. It is suitable for planting in South and Southeast regions of
Brazil, because tolerates frost and a moderate degree of water stress, which can be planted in
areas of Dense Ombrophylous Forest, Mixed Ompbrophylous Forest and their transition zones
to Cerrado (Brazilian Savannah) and semi-deciduous forests of Paraná and São Paulo states
(DORMAN; SQUILLACE, 1974).
Although slash pine is widely used in the manufacture of pulp and paper in the United
States, the same does not occur in Brazil. Due to high resin content in the wood, an additional
manufacturing process would be necessary to separate that component from raw material.
Therefore, the use of this species in Brazil is limited to timber production for mechanical
processing and resin extraction of standing trees (SHIMIZU; SEBBENN, 2008).

26
Figure 2 – Natural geographic distribution of slash pine in United State,
highlighted in green.
Source: United States Department of Agriculture (2016).
Slash pine has got fast growth and may live for more than 200 years, its height can
achieve 18 to 30 m, stem is straight and cylindrical with diameter ranging from 0.60 m to 0.80
m. Bark is grooved with scaly plaques grey in young plants and brown-red tone in adult. There
is natural pruning of branches and canopy opens greater than 3.0 m radius creating a light shade.
Needles are sharp and thin, bright green colour and length between 18 cm and 24 cm, branches
are grouped into two or three units with constant falling forming thick blanket in under forest.
Flowering usually occurs in spring, pinecone weight may be over 46 g with 12.5 cm x 4.5 cm
dimensions, producing a mean of 10 g of seeds, usually triangular shape, black and winged
(BUBNA, 2013; GILMAN; WATSON, 1994).
Each megasporophyll (carpel scale) carries two eggs and it is protected by a sterile leaf
and coverage scale. This scale does not develop after fertilization and incorporated into the base
of carpel scale growing and becoming woody. Seeds often winged formed from a portion of the
carpel scale easily spread on across landscape, and sometimes may become invasive. Male
flowers are formed in dense elongated strobilus and each microsporophyll carries two pollen
bags (Figure 3B). Cones or female strobilus are formed by numerous small megasporophyll

27
supported by protective external scales (Figures 3A and 3B). In each megasporophyll two eggs
have grown with the upper part thereof (SUASSUNA, 1977).
Root system is very aggressive competing with plants around. It presents some
sensitivity to diseases and pests that affect its health with appearance of chlorosis, wood rot,
rust and canker (GILMAN; WATSON, 1994).
Figure 3 – Slash pine reproductive structures: female strobilus (A), male
strobilus (B) and female strobilus already developed, called cone
(C).
Source: Ananda Aguiar (A e B) and the author (C).
2.5 Pinus radiata D. DON
Radiata pine, also known as Monterey pine, is naturally ranged in a very limited and
largest found in the central part of California coast in United State. In this region is possible to
find natural portions next to Monterey Peninsula around the city of Cambria and Swanton
(Figure 4). This pine species can also be found naturally in Guadalupe Island distant 300 km
off the Californian coast. However, radiata pine was introduced and well adapted to climatic
A B
C

28
conditions of New Zealand, Australia, Chile, South Africa, Spain, Argentina and Uruguay
(ROY, 1966).
Figure 4 – Radiata pine natural geographic distribution in the United State
highlighted in green and yellow.
Source: Floristic Synthesis of North America (2016).
The species may achieve around 15-30 m of height in natural conditions and more than
60 m in ideal conditions under cultivation, branches pointing up and a rounded top. Needles are
light green, in groups of three, slender and 8-15 cm long (ROY, 1966).
Flowering time is in winter and early spring. Female strobilus (Figure 5A) are formed
in a spiral or nodal groups from three to seven both on stem or on branches where they can be
subterminal or head side (LINDSAY, 1932). This pine is multinodal and normally produces
one to three nodes each year, thus one to three groups of cones are also produced. Male strobilus
(Figura 5B) is usually produced in secondary branches. Pollination is most effective during first
and second week after female flowers opening. Cones are developed only after receiving viable
pollen (Figure 5C), in some cases pollen may be unable to produce seeds (PAWSEY, 1961), if
it has not happened cones have died within three months or less. In other cases, cones apparently
mature may be found empty or only with wings of seed formed. Cones maturity happen in
autumn of the second year and open releasing seeds during the first warm days of following
spring (ROY, 1966).

29
Figure 5 – Radiata pine reproductive structures: female strobilus (A), male
strobilus (B) and female strobilus already developed, called
cone (C).
Source: Carols Cornwall (A), Phil Bendle (B), Ruth Tittherson(C) (2016).
2.6 FOREST BREEDING
Genetics is the science related to two major distinct areas (i) heredity whose concept is
equal tend to generate equal, explaining the fact that offspring resemble their ancestors and (ii)
variation as being all environmental or genetic differences between organisms related to
descent. Thus, variations can be due to the environment which individual is inserted, and
therefore not hereditary, but can also be produced by changes in the genetic constitution, in
which case, hereditary (RAMALHO; SANTOS; PINTO, 2004). The principal objective of
breeding programs is to detect genotypes whose offspring will grow well in commercial
plantations (EGBÄCK et al., 2012). Researches emphasise on volume growth, including height
and diameter at breast height (BERLIN et al., 2009a), wood quality properties, resistance to
diseases (ROSVALL et al., 2002) and maintenance of genetic variability, fundamental
requirement for obtaining long-term genetic gains (MORI, 1993).
A B
C

30
According to Ramalho, Santos and Pinto (2004), forest genetic improvement is
relatively a new science. It has made great advances since 1950 and the first large-scale
improved species were Pinus elliottii and Pinus taeda in the United States and Acacia mearnsii
(black wattle) in South Africa. In Brazil, first researches in forest breeding have begun in the
early twentieth century, where the main objective was wood production due to process of
natural forests destruction and impossibility replacement with native species (FERREIRA;
SANTOS, 1997). Assis (1996) explains that the restrictions on native forests wood use
combined with the urgent need to supply the domestic market are cited as major factor that led
search of fast growing species (Eucalyptus and Pinus) and the development of appropriate
technologies to achieve industries demand.
The introduction of exotic forest species in Brazil provide great benefits for socio-
economic development of different regions, especially in areas whose soil characteristics and
climate discouraged agricultural activity. The development of improved populations that satisfy
the requirements of forest productivity depends on ability to identify genotypes characteristics
in under selection population (MORI, 1993). A proven strategy for genotypes selection is the
combination of provenance and progeny tests. These tests and estimate genetic parameters have
allowed breeders to simultaneously obtain information on the geographic variation and genetic
differences between trees of each provenance (SHIMIZU; PINTOJÚNIOR, 1988).
In forest breeding it is possible to mention many types of selection such as recurrent
selections, in which, can be separate in recurrent selection intrapopulation and interpopulation.
Reciprocal recurrent selection is a breeding scheme developed aiming the improvement of
performance of two distinct crossings population heterosis groups. In this method, genotypes
of two populations are evaluated in reciprocal crosses (half-sib interpopulation progenies), and
the best of each population are selected, and its S1 offspring recombined to lead improved
population (COMSTOCK; ROBINSON; HARVEY, 1949; HALLAUER; EBERHART, 1970).
In the other hand, in intrapopulation recurrent selection the objective is to improve performance
of trees inside the same population (HALLAUER, 1985; SOUZA JÚNIOR, 1993).
The selection based on progeny test, in which genetic parameters is estimated, is always
more efficient than simply performed based on the phenotype of plants individually. In this
case, both individuals and their progenies are selected (PAIVA; RESENDE; CORDEIRO,
2002). For Robertson (1960) genetic gain depend essentially on genetic variability which is
maintained through selection cycles being unconstrained by recombination when the cycle
ends. Thus, breeding population should be established on the basis of genetic variability. Assis

31
(1996) and Resende and Barbosa (2005) include progenies and clones in breeding or selected
populations in which breeders can manipulate them for further breeding.
Intense individual selection for a high heritability trait should be used with caution,
according to Kageyama and Vencovsky (1983). High intensities can cause early elimination or
loss of valuable alleles responsible for other traits. Authors also argued that to reduce risk of
loss only (i) if pure or adapted species are used, (ii) if matrices are selected in normal
environmental conditions, (iii) if high effective population number (𝑁𝑒) is held and (iv) if short-
term programs are used. In case of medium and long-term programs should be used moderate
selection intensities. Another important adoption for breeding strategic efficiency is the use of
accurate selection methods depending on heritability of trait, individual, between and within
progenies, combined methods, etc (RESENDE et al ., 1995). Furthermore, it should also be
noted that many factors that affecting final results are out of breeders control, such as, pests and
diseases attack, mechanical damage of cultural tract contributing to the reduction of
experimental precision (VERONESI et al., 1995).
2.7 GENETIC PARAMETERS ESTIMATES
Provenance and progeny tests are mainly used to distinguish genetically different
materials in breeding programs (OTSUBO et al., 2015). Progeny tests are aimed population
conservation, determination of genetic structure, production of improved seeds, selection
individuals or progenies for recurrent selection and genetic parameters estimates (SHIMIZU;
KAGEYAMA; HIGA, 1982). The term parameter is used to specify the constant characteristics
of a population, particularly mean and variance. In case of populations used in breeding
programs, the parameters of interest are grouped into two: genetic and non-genetic. The
estimation of genetic parameters is necessary to (i) obtain information about genes action
involved in inheritance of characters under investigation and (ii) establish basis for breeding
methods choice applicable to the population. In discussing of genetic parameters estimation it
must consider that obtained estimates are valid only for population from which experimental
material was collected and for environments conditions in which the study was conducted.
When the objective is estimate experimentally genetic variances, both genotypes the trial
environments should be appropriately sampled for population and geographical area of interest
(COCKERHAM, 1956; ROBINSON; COCKERHAM, 1965).
According to Falconer and MacKay (1996), selection success basically depends on the
degree of correspondence between the phenotypic value and breeding value presented by metric

32
character in circumstances of environment and population where it was evaluated. This degree
of correspondence reflected in practical terms in analysed trait heritability. For breeders, the
most important is the existence of additive genetic variability which is expressed as a variance
and its magnitude relative to the total phenotypic variance. This is because most of desire
interest traits for breeders are controlled by multiple genes, so the variation follow an
approximately normal distribution, therefore, there is a tendency to rely on quantitative
variances studies (ZOBEL; TALBERT, 1984). Thus, the total phenotypic variance (𝑉𝑝) for a
given trait is estimated by genetic variance (𝑉𝑔), environment variance (𝑉𝑒) and variance of
interaction (𝑉𝑔𝑒): 𝑉𝑝 = 𝑉𝑔 + 𝑉𝑒 + 𝑉𝑔𝑒. Moreover, proportion of genetic and environmental
components may vary widely between traits. Diameter at breast height (DBH) has a large
influence of environment, while wood density is largely controlled by genetic components.
Thus, density of wood density has relatively high heritability in comparison with diameter
(MEAD, 2013).
Among quantitative genetic parameters we can highlight, coefficient of heritability,
which expresses genetic heritage present in phenotypic variation. This coefficient, according to
Falconer and MacKay (1996), Zobel and Talbert (1984) and Vencovsky and Barriga (1992) is
a proper parameter of population in a given environment, it not being property of species and
could vary in different environments and age (SEBBENN, 1998).
Significant genetic variation for growth and form traits and resin production in tests of
Pinus caribaea var. bahamensis progenies was reported by Sebbenn (1994), Zheng, Ennos and
Wang (1994), Gurgel-Garrido, Romanelli and Garrido (1996), Gurgel-Garrido et al. (1999) and
Missio (2004). In addition to this, they found selection gains up to 23.4% for height, 30.6% for
DAP (ZHENG; ENNOS; WANG, 1994), 8.26% for real volume (SEBBENN, 1994) and
46.23% for the production of resin (GURGEL-GARRIDO et al., 1999). These results
demonstrate the great potential of pine species for improvement of several economic traits to
different locations.
Some statistical parameters have been used to assess the accuracy and quality of forest
experiment as the coefficient of experimental variation (𝐶𝑉𝑒) and accuracy (𝑟â𝑎). The coefficient
of experimental variation should be maintained at appropriate levels for each species and trait.
𝐶𝑉𝑒 value depends exclusively on residual variations as a ratio of experimental mean
(RESENDE; DUARTE, 2007). The accuracy refers to the correlation between the true
genotypic value and that predicted or estimated from experimental data. As regards a correlation
it can vary from 0 to 1, being the most suitable values closest to unity or 100%. Thus, it is

33
common high accuracy values are estimated in forest improvement experiments, so this
parameter is much higher than smaller the absolute differences between the observed and
estimated breeding values (RESENDE; DUARTE, 2007).
2.8 EARLY AGE SELECTION
The efficiency of breeding program can be expressed by genetic gain per unit of time.
For forest species time to complete a selection cycle is the main obstacle in breeding programs.
Pine, for example, takes 15 to 20 years to complete selection cycle. Therefore, the interval of
time between generations must be reduced to maximize gains per unit of time and early age
selection has an important role in this case (BORRALHO; COTERRILL; KANOWISKI, 1992;
PEREIRA et al., 1997; GONÇALVES et al., 1998).
Early age selection aims to assess traits in early age that are seen as predictors and
economically important at rotation age (adult). This practice has been advantageous for genetic
gain per unit of time. With time reduction it is possible to eliminate quicker lower genetic
material, consequently there are earlier recommendations of new individuals for commercial
plantations, reduced breeding cycles, and, consequently, to reduce time between generations
(REZENDE; BERTOLUCCI; RAMALHO, 1994). This method of selection may increase
genetic gain rate of great importance in forest breeding programs. Thus, it is important to
remember selection efficiency is closely linked to the existence of genetic correlation between
traits in youth or adulthood (FALCONER; MACKAY, 1996).
The use of early selection in forest sector has taken important results seen in studies
with Eucalyptus spp. (PEREIRA et al., 1997; BELTRAME et al., 2012), Hevea brasiliensis
(GONÇALVES et al., 1998), Pinus elliottii (ROMANELLI; SEBBENN, 2004), Pinus taeda
(GWAZE et al., 2000; XIANG, LI, MCKEAND, 2000), Pinus sylvestris (HAAPANEM, 2001;
KROON et al., 2011), Pinus pinaster (KUSNANDAR et al., 1998), Pinus contorta (XIE;
YIANG, 1996; CHEN et al., 2003), Pinus banksiana (RIEMENSCHNEIDER, 1988; CARTER
et al., 1990; WENG et al., 2007) and Pinus menziesii (JONSON; SNIEZKI; MANDEL, 1997;
DEAN; STONECYPHER, 1997).
2.9 GENOTYPE X ENVIRONMENT INTERACTION (G X E)
Shelbourne (1972) defines G x E interaction as being the genotype changes in response
to different environmental conditions, since metric phenotypic expression is a result of the

34
synchronized effect between specific genotype, environment and the interaction between them
(MAIA et al., 2009). Environment can be defined as all intra and extracellular factors that
influence the genotype expression (BREWBAKER, 1965). For Cruz, Regazzi and Carneiro
(2004), physiological and biochemical factors are the causes of inherent interaction to each
individual and genotype development in dynamic systems with constant changes; therefore
there is a separate behaviour of each progeny in relation to responses to environmental
variations. Furthermore, Robertson (1959), suggest a classification for G x E interaction:
simple, when it is provided by the difference in variability between genotypes in environments,
and complex when denoting lack of correlation between measurements of the same genotype
in different environments and indicates that there is inconsistency in superiority of genotypes
to environmental variations causing increased bias to breeders work. For interactions with
genotypes occurs, environmental conditions may be predictable as environment variations
especially with regard to the type of soil, climate, and systematic characteristics, such as day
length, degree of insulation, etc., and unpredictable as rainfall, temperature changes, in case of
pine occurrence of frosts (VENCOVSKY; BELLY, 1992).
In Brazil, the most limiting climatic factors for pine cultivation are temperature and
precipitation. Based on these effects observation under reforestation areas (experimental tests)
it has been established two growing areas for pine species in Brazil, tropical regions with
varieties of Pinus caribaea (caribaea, hondurensis and bahamensis), Pinus tecunumanii and
sub-tropical / temperate zone, whose more adapted species were Pinus taeda, Pinus greggii and
Pinus patula (SHIMIZU; SPIR, 1999; FONSECA et al., 1978). In addition to these species,
Pinus elliottii adapted well to Brazilian environmental conditions making it the second most
widely planted species of the genus Pinus for wood production and first for resin extraction
(ROMANELLI; SEBBENN, 2004).
Despite of exotic species introduced in Brazil, as slash pine, have promoted forest
increment production, many researches focused on obtaining higher quality raw materials,
improved adaptive conditions, tolerance to pests and diseases and still maintain genetic
variability (MORI, 1993), however, more specific issues such as genotype x environment
interaction (G x E) were less prioritized, especially for this genus.
The importance of the G x E interaction in radiata pine breeding programs, for instance,
is still under debate. Spanish researchers suggest that for most of traits it is possible to select
trees showing good combination of capacity, therefore, no need to explore the G x E interactions
(CODESIDO; FERNÁNDEZ-LÓPEZ, 2009). For this species, the G x E interaction
exploitation would be worthwhile for frost resistance. However, in traditional breeding

35
programs based on seed production in seed orchards, further gains to be made using G x E
interactions is often small in relation to the effort needed (CARSON, 1991).
In general, there are few studies for this topic in forest species. Consequently it is
indispensable to evaluate the maximum number of environments and the adoption of more
rigorous as possible in order to obtain data with high accuracy, which allows you to select the
best materials to be multiplied on a commercial scale for various environments. To make this
recommendation as reliable as possible a detailed study is required for the temporal stability of
genotypes and with regard to their economically important traits (CRUZ, 2006). Nevertheless,
despite its importance, the simple analysis of genotype x environment interaction does not give
complete and accurate input on the behaviour of each genotype in various environmental
conditions. Thus, it is recommended statistical procedures for materials with more stable
performance identification that respond predictably to environmental variations through
adaptability, stability and productivity analysis (SILVA; DUARTE, 2006).
Adaptability refers to genotypes ability of responding to environmental stimulation and
stability is the ability of genotypes maintain the same performance under various environmental
conditions (ALWALA et al., 2010). Stability and adaptability analysis allows to identify
genotypes with predictable behaviours (production) in various environments (CRUZ;
REGAZZI; CARNEIRO, 2004). Considering the range of planting zones and diversity
existence in pine material used in commercial plantation, more detailed investigation about its
behaviour will generate important information of more productive crops establishment.
Whence, selection of methodologies that combine stability and adaptability in a single statistic
can be considered superior, compared to those that only use production as selection criteria
(RESENDE; DUARTE, 2007; VERARDI et al., 2009).
Harmonic Mean of the Relative Performance of Genetic Values method (MHPRVG) is
based on analysis of genetic values using mixed models selecting genotypes through
simultaneous consideration of individual productivity, stability and adaptability (RESENDE,
2007). The model considers genotypic as random effects and therefore provides genotypic
stability and adaptability, allowing unbalanced data analysis, non-orthogonal designs and
heterogeneity of variances. In addition to this, model allows to consider correlated errors within
sites as well as individual selection stability and adaptability within progenies; provides
breeding values with instability discount; and can be applied to any number of environments.
The method generates results in its unit or in evaluated trait scale, interpreted directly as
breeding values, an additional factor in relation to other methods. This model allows additional
inferences such as: selecting specific genotypes for each site; selection of stable genotypes

36
across sites; selection of responsive genotypes (with high adaptability); and simultaneous
selection by three attributes (productivity, stability and adaptability).
The estimated Harmonic Mean for Genetic Values (MHVG), Relative Performance of
Genetic Values (PRVG) and the Harmonic Mean of Relative Performance of Genetic Values
(MHPRVG) are used to measure genotypic stability and perennials adaptability and are
employed as different criteria to productivity, stability and adaptability simulation selection.
Another method widely used for stability and adaptability analyses is based on bissegmented
regression. The method includes the formation of favourable environment groups, when
environmental indices have positive values, and unfavourable environments, when indexes are
negative (CRUZ; REGAZZI; CARNEIRO, 2004).
Environmental stratification process consists on subdivision of heterogeneous regions
in more uniform subregion, where any significant G x E interaction is excluded or in other cases
a significant interaction with predominant single portion, not compromising cultivars
recommendation. The aim of this method is to find environments with similar genotypic
classification regardless of the environmental quality. However, bissegmented regression has
consistency only for G x E interaction and not for genotypes x age, genotype x harvest or
genotypes x sites x age interactions (OLIVEIRA et al., 2005). Comparing this two
methodologies, MHPRVG method presents more advantages in relation to bissegmented
regression and others ones such as: consider phenotypic effects as random; allows to handle
with variances heterogeneity; allows to deal with unbalanced data; allows to tackle with non-
orthogonal designs; consider correlated errors within sites; provides values with discounted
genetic instability and generates results with own magnitude scale or evaluated trait scale
(RESENDE, 2004).

37
REFERENCES
ALTEYRAC, J.; CLOUTIER, A.; ZHANG, S. Y. Characterization of juvenile wood to
mature wood transition age in black spruce (Picea mariana (Mill.) BSP) at different stand
densities and sampling heights. Wood Science Technology, Berlin, v. 40, n. 2, p. 124-138,
2006.
ALWALA, S.; KWOLEK, T.; McPHERSON, M.; PELLOW, J.; MEYER, D. Comprehensive
comparison between Eberhart and Russell joint regression and GGE biplot analyses to
identify stable and high yielding maize hybrids. Field Crops Research, New York, v. 119, n.
2, p. 225-230, 2010.
ANTONY, F.; SCHIMLOCK, L. R.; JORDAN, L.; CLARCK, A.; DANIELS, R. F. Effect of
early age woody and herbaceous competition control on wood properties of loblolly pine.
Forest Ecology and Management, New York, v. 262, v. 8, p. 1639-1647, 2011.
ANTONY, F.; SCHIMLECK, L. R.; JORDAN, L.; DANIELS, R. F.; CLARK III, A.
Modeling the effect of initial planting density on within tree variation of stiffness in loblolly
pine. Annals of Forest Science, Les Ulis, v. 69, n. 5, p. 641-650, 2012.
ARAUJO, H. J. Agrupamento das espécies madeireiras ocorrentes em pequenas áreas
sob manejo florestal do Projeto de Colonização Pedro Peixoto (AC) por similariedade
das propriedades físicas e mecânicas. 2002. 168 f. Dissertação (Mestrado)- Escola Superior
de Agricultura “Luiz de Queiroz, Piracicaba, Universidade de São Paulo, Piracicaba, 2002.
ASSIS, T.F. Melhoramento genético de eucalipto. Informe Agropecuário, Belo
Horizonte, v. 189, p. 32-51, 1996.
AZEREDO, N. R. S. de. Atual situação de oferta e demanda de matéria prima de
reflorestamento. In: SEMINÁRIO SOBRE PROCESSAMENTO E UTILIZAÇÃO DE
MADEIRA DE REFLORESTAMENTO. 2, Curitiba, 1988. Proceedings… Curitiba: [s.n.],
1988. p. 120-38.
BALL, R. D.; McCONCHIE, M. S.; COWN, D. J. Evidence for associations between
SilviScan-measured wood properties and intraring checking in a study of twenty-nine 6-year-
old Pinus radiata. Canadian Journal of Forest Research, Ottawa, v. 35, n. 5, p. 1156-1172,
2005.
BALTUNIS, B. S.; WU, H. X.; POWELL, M. B. Inheritance of density, microfibril angle,
and modulus of elasticity in juvenile wood of Pinus radiata. Canadian Journal of Forest
Research, Ottawa, v. 37, n. 11, p. 2164–2174, 2007.
BARNETT, J. R.; BONHAM, V. A. Cellulose microfibril angle in the cell wall of wood
fibres. Biological Reviews, Cambridge, v. 79, n. 2, p. 461-472, 2004.
BELTRAME, R.; BISOGNIN, D.S.; MATTOS, B.O.; CARGNELUTTI FILHO, A.;
HASELEIN, C.R.; GATTO, D.A.; SANTOS, G.A. Desempenho silvicultural e seleção
precoce de clones de híbridos de eucalipto. Pesquisa Agropecuária Brasileira, Brasília, DF,
v. 47, n. 6, p. 791-796, 2012.

38
BIRKLAND, R. Efficient process for quality products. In: IUFRO WORLD CONGRESS,
19., 1990. Proceedings… [S.l.: s.n.], 1990. p. 139-147.
BORRALHO, N. M. G.; COTERRILL, P. P.; KANOWISKI, P. J. Genetic control of growth of
Eucaluptus globulus in Portugal. II Efficiencies of early selection. Silvae Genetica, Frankfurt,
v. 41, n. 2, p. 70-77, 1992.
BOWYER, J. L.; SHMULSKY, R.; HAYGREEN, J.G. Forest products and wood science:
an introduction. 5th ed. Iowa: Blackwell Publishing, 2007. 557 p.
BRASIL, M. A. M.; NICOLLELO, N.; VEIGA, R. A. A. Variação da densidade básica da
madeira de Pinus oocarpa Schiede em diversas idades na região de Agudos - SP. Revista
Floresta, Curitiba, v.11, n.1, p. 33-39, 1980.
BREWBAKER, J. L. Agricultural genetics. Biometrische Zeitschrift, Weinheim, v. 9, n. 2,
p. 146-150, 1965.
BUBNA, T. Resina de pinus. [S.l.: s.n., 200-). Available in:
<http://resinadepinus.blogspot.com.br/2013/01/serie-pinus-e-resina-pinus-elliottii.html>.
Access in: 29 mar. 2014.
BUCUR, V. Acoustics of wood. Berlin: Springer-Verlag, 2006.
BURDON, R. D.; BRITTON, R. A. J.; WALFORD, G. B. Wood stiffness and bending
strength in relation to density in four native provenances of Pinus radiata. New
Zealand Journal of Forestry Science, Heidelberg, v. 31, n. 1, p. 130-146, 2001.
CARSON, M.; CARSON, S. New pine varieties help increase plantation profitability. New
Zealand Tree Grower, Wellington, v. 32, n. 1, p. 28-31, 2011.
CARTER, K. K.; ADAMS, G. W.; GREENWOOD, M. S.; NITSCHKE, P. Early family
selection in jack pine. Canadian Journal of Forest Research, Ottawa, v. 20, n. 3, p. 168-
175, 1990.
CAVE, I. D.; WALKER, J. C. F. Stiffness of wood in fast-grown plantation softwoods: the
influence of microfibril angle. Forest Products Journal, Peachtree Corners, v. 44, n. 5, p.
43-48, 1994
COCKERHAM, C. C. Effects of linkage on the covariances between relatives. Genetics,
Bethesda, v. 41, n. 1, p.138-141, 1956.
CODESIDO, V.; FERNÁNDEZ-LÓPEZ, J. Implications of genotype x site interactions on
Pinus radiata breeding in Galicia. New Forests, Houten, v. 37, n. 1, p. 17–34, 2009.
COELHO, V. C. M. Avaliação da produção econômica da madeira de Pinus taeda L. com
características qualitativas superiores. 2010. 117 f. Tese (Doutorado)- Departamento de
Ciências Agrícolas, Universidade Federal do Paraná, Curitiba, 2010.
COWN, D. J. New Zealand pine and Douglas fir: suitability for processing. FRI. Rotorua:
New Zealand: Forest Research Institute, 1999. (Bulletin, 216).

39
COMSTOCK, R. F.; ROBINSON, H. F.; HARVEY, P. H. A breeding procedure designed to
make maximum use of both general and specific combining ability. Agronomy Journal,
Madison, v. 41, n. 5, p. 360-367, 1949.
CHEN, X. Y.; HAWKINS, B.; XIE, C.; YIANG, C. C. Age trends in genetic parameters and
early selection of lodgepole pine provenances with particular reference to the Lambeth model.
Forest Genetics, Zvolen, v. 10, n. 3, p. 249-258, 2003.
CHEN, Z.; KARLSSON, B.; LUNDQVIST, S.; GIL, M. R. G.; OLSSON, L. WU, H. X.
Estimating solid wood properties using Pilodyn and acoustic velocity on standing trees of
Norway spruce. Annals of Forest Science, Les Ulis, v. 72, n. 4, p. 499-508, 2015.
CIESZEWSKI, C. J.; STRUB, M.; ANTONY, F.; BETTINGER, P.; DAHLEN, J.; LOWE, R.
C. Wood quality assessment of tree trunk from the tree branch sample and auxiliary data
based on nir spectroscopy and SilviScan. Mathematical and Computational Forestry &
Natural-Resource Sciences, Athens, v. 5, n. 1, p. 86-111, 2011.
CRUZ, C. D.; REGAZZI, A. J.; CARNEIRO, P. C. S. Modelos biométricos aplicados ao
melhoramento genético. 3. ed. Viçosa: UFV, 2004.
CRUZ, C. D. Programa genes: análise multivariada e simulação. Viçosa: UFV, 2006.
DEAN, C. A.; STONECYPHER, R. W. Early selection of Douglas-Fir across south central
Coastal Oregon. USA. Silvae Genetica, Frankfurt, v. 55, n. 3, p. 135-141, 2006.
DIOUF, D. Genetic transformation of forest trees. African Journal Biotechnology, Victoria
Island, v. 2, n. 10, p. 328-333, 2003.
DORMAN, K. W.; SQUILLACE, A. E. Genetics of slash pine. USDA Forest Service
Research Paper, Utah, v. 20, n. 1, p. 01-20, 1974.
DOWNES, G. M.; NYAKUENGAMA, J. G.; EVANS, R.; NORTHWAY, R.;
BLAKEMORE, P.; DICKSON, R. L.; LAUSBERG, M. Relationship between wood density,
microfibril angle and stiffness in thinned and fertilized Pinus radiata. IAWA Journal,
Leiden, v. 23, n. 3, p. 253–265, 2002.
DUNGEY, H. S.; MATHESON, A. C.; KAIN, D.; EVANS, R. Genetics of wood stiffness
and its component traits in Pinus radiata. Canadian Journal of Forest Research, Ottawa, v.
36, n. 5, p. 1165–1178. 2006.
EGBÄCK, S.; LIZINIEWICZ, M.; HÖGBERG, K.; EKÖ, P.; NILSSON, U. Influence of
progeny and initial stand density on growth and quality traits of 21 year old half-sib Scots
pine (Pinus sylvestris L.). Forest Ecology and Management, Amsterdam, v. 286, n. 1, p. 1-
7, 2012.
ESTEBAN, L. G.; FERNANDEZ, F. G.; DE PALACIOS, P. MOE prediction in Abies
pinsapo Boiss. timber: Application of an artificial neural network using nondestructive
testing. Computers and Structures, Kidlington, v. 87, n. 21, p. 1360-1365, 2009.

40
FALCONER, D. S.; MACKAY, T. F. C. Introduction to quantitative genetics. London:
Longman Group, 1996.
FENGEL, D.; WEGENER, O. Wood: chemistry, ultrastructure, reactions.
Berlin: Walter de Gruyter, 1989.
FERREIRA, M.; SANTOS, P. E. T. Melhoramento genético florestal dos Eucalyptus no
Brasil: breve histórico e perspectivas. In: CONFERENCE ON SILVICULTURE AND
IMPROVEMENT OF EUCALYPT- IUFRO, 2, 1997, Colombo. Proceedings... Colombo:
Embrapa-CNPF, 1997. p.14-34.
FIER, I. S. N.; KIKUTI, P. Perspectivas para a utilização de espécies de Pinus spp. Do
México e América Central na região de Telêmaco Borba-PR. In: CONGRESSO
FLORESTAL PANAMERICANO, 1; CONGRESSO FLORESTAL BRASILEIRO, 7. 1993,
Curitiba. Proceedings... São Paulo: SBS, SBEF, 1993. v.1, p.139-143.
FRIES, A. Genetic parameters, genetic gain and correlated responses in growth, fibre
dimensions and wood density in a Scots pine breeding population. Annals of Forest Science,
Les Ulis, v. 69, n. 7, p. 783–794, 2012.
FONSECA, S. M.; JACOB, W. S.; KAGEYAMA, P. Y.; FERREIRA, M. Síntese do
programa de melhoramento genético de Pinus spp. que vem sendo conduzido sob a
coordenação do IPEF, na região sul do Brasil. Boletim Informativo do IPEF, Piracicaba,
1978.
FUJIMOTO, T.; CHIYODA, K.; YAMAGUCHI, K.; ISODA, K. Heritability estimates for
wood stiffness and its related nearinfrared spectral bands in sugi (Cryptomeria japonica)
clones. Journal of Forest Research, Kudan-kita, v. 20, n. 1, p. 206-212, 2015.
GALLIGAN, W. L.; McDONALD, K. A. Machine grading of lumber: practical concerns
for lumber producers. [S.l.]: USDA Forest Service, 2000. (General Technical Report FPL-
GTR-7).
GARTLAND, K. M. A. Genetically modified trees: production, properties, and potential.
Journal of Arboriculture, Champaign, v. 29, n. 5, p. 259-266, 2003.
GASPAR, M. J. et al. Age trends in genetic parameters of wood density components in 46
half-sibling families of Pinus pinaster. Canadian Journal of Forest Research, Ottawa, v.
38, n. 6, p. 1470-1477, 2008.
GERISCHER, G. F. R.; VILLERS, A. M. The effect of heavy pruning on timber properties.
Forestry in South Africa, Pretoria, v. 3, n. 1, p. 15–41, 1963.
GILMAN, E. F.; WATSON, D. G. Pinus elliottii: fact sheet ST-463. [Gainesville]: United
States Forest Service-Environmental Horticulture Department, Florida Cooperative Extension
Service, Institute of Food and Agricultural Sciences, University of Florida, 1994. 4 p.
GONÇALVES, P. S.; BORTOLETTO, N.; FONSECA, F. S.; BATAGLIA, O. C.;
ORTOLONI, A.A. Early selection for growth vigor in rubber tree genotypes in northwestern

41
São Paulo state (Brazil). Genetics and Molecular Biology, Ribeirão Preto, v. 21, n. 4, p.620-
630, 1998.
GREAVES, B. L.; BORRALHO, N. M. G.; RAYMOND, C. A.; FARRINGTON, A. Use of a
Pilodyn for the indirect selection of basic density in Eucalyptus nites. Canadian Journal of
Forest Research, Ottawa, v. 26, n. 8, p. 1643–1650, 1996.
GURGEL-GARRIDO, L. M. A.; ROMANELLI, R. C.; GARRIDO, M. A. O. Variabilidade
genética de produção de resina, DAP e altura em Pinus caribaea Mor. var. bahamensis.
Barr.et Golf. Revista do Instituto Florestal, São Paulo, v. 8, n. 1, p. 89-98, 1996.
GWAZE, D.; BRIDGWATER, F. E.; BYRAM, T. D.; WOOLLIAMS, J. A.; WILLIAMS, C.
G. Predicting age-age genetic correlations in tree-breeding programs: a case study of Pinus
taede L. Theoretical and Applied Genetics, Heidelberg, v. 100, n. 2, p. 199-206, 2000.
HAAPANEN, M. Time trends in genetic parameter estimates and selection efficiency for
Scots pine in relation to field testing method. Forest Genetics, Zvolen, v. 8, n. 2, p. 129-
144, 2001.
HALLAUER, A. R. Compedium of recurrent selection methods and their application. Review
in Plant Scie Critical Reviews in Plant Science, v. 3, n. 1, p. 1-34, 1985.
HALLAUER, A.R.; EBERHART, S.A. Reciprocal full-sib selection. Crop Science, Madison
v. 10, n.5, p. 315-316, 1970.
HANNRUP, B.; EKBERG, I. Age–age correlations for tracheid length and wood density in
Pinus sylvestris. Canadian Journal of Forest Research, Ottawa, v. 28, n. 9, p. 1373–1379,
1998.
HANSEN, C. P. Application of the pilodyn in forest tree improvement. [S.l.]: Danida
Forest Seed Centre. 2002. (Technical Note, 55). Available in: <
http://dfsc.dk/pdf/Publications/Technical%20Note%2055.pdf>. Access in: 11 fev. 2016
HÖGBERG, K.; HALLINGBÄCK, H. R.; SÄLL, H.; JOHANSSON, M.; JANSSONE, G.
The potential for the genetic improvement of sawn timber traits in Picea abies. Canadian
Journal of Forest Research, Ottawa, v. 44, n. 4, p. 273-280, 2014.
HONG, Z.; FRIES, A.; WU, H. X. Age trend of heritability, genetic correlation, and
efficiency of early selection for wood quality traits in Scots pine. Canadian Journal of
Forest Research, Ottawa, v. 45, n. 7, p. 817-825, 2015.
HONG, Z.; FRIES, A.; WU, H. X. High negative genetic correlations between growth traits
and wood properties suggest incorporating multiple traits selection including economic
weights for the future Scots pine breeding programs. Annals of Forest Science, Les Ulis, v.
71, n. 4, p. 463–472, 2014.
INDÚSTRIA BRASILEIRA DE ÁRVORES- IBÁ. Relatório Ibá 2015. Brasília: [s.n.], 2015.
62 p.

42
ISIK, F.; MORA, C. R.; SCHIMLECK, L. R. Genetic variation in Pinus taeda wood
properties predicted using non-destructive techniques. Annals of Forest Science, Les Ulis, v.
68, n. 2, p. 283-293, 2011.
JONSON, G. R.; SNIEZKO, R. A.; MANDEL, N. L. Age trends in Douglas-fir genetic
parameters and implications for optimum selection age. Silvae Genetica, Frankfurt, v. 46, n.
6, p. 349-258, 1997.
KAGEYAMA, P. Y.; VENCOVSKY, R. Variação genética em progênies de uma população
de Eucalyptus grandis (Hill) Maiden. IPEF, Piracicaba, v. 24, n. 1, p. 9-26, 1983.
KROON, J.; ERICSSON, T.; JANSSON, G.; ANDERSSON, B. Patterns of genetic
parameters for height in field genetic tests of Picea abies and Pinus sylvestris in Sweden.
Tree Genetics & Genomes, Berlin, v. 7, n. 6, p. 1099-1111, 2011.
KUMAR, S. Genetic parameter estimates for wood stiffness, strength, internal checking, and
resin bleeding for radiata pine. Canadian Journal of Forest Research, Ottawa, v. 34, n. 12,
p. 2601–2610, 2004.
KUSNANDAR, D.; GALWEY, N. W.; HERTZLER, G. L.; BUTCHER, T. B. Age trends in
variance and heritabilities for diameter and height in maritime pine (Pinus pinaster) in
western Australia. Slivae Genetica, Frankfurt, v. 47, n. 2, p. 136-141, 1998.
LARSON, P. R. The physiological basis for wood specific gravity in conifers. In: IUFRO
DIVISION MEETING, 5., 1973, Stellenbosch. Proceedings… Stellenbosch: [s.n.], 1973, v.
2, p. 672-680.
LEE, S. J.; CONNOLLY, T. Finalizing the selection of parents for the Sitka spruce (Picea
sitchensis (Bong.) Carr) breeding population in Britain using Mixed Model Analysis.
Forestry, Oxford, v. 83, n. 4, p. 423–431, 2010.
LI, X.B.; HUBER, A.; POWELL, G.L.; WHITE, T.L.; PETER, G.F. Breeding for improved
growth and juvenile corewood stiffness in slash pine. Canadian Journal of Forest Research,
Ottawa, v. 37, n. 10, p. 1886–1893, 2007.
LIMA, A. F.; JARÁ, E. R. P.; ALFONSO, V. A. Madeira como matéria-prima para
fabricação de pasta celulósica. In: PHILIPP, P.; D’ALMEIDA, M. L. O. Celulose e papel:
tecnologia de fabricação de pasta celulósica. 2. ed. São Paulo: IPT, 1988. p. 129-167.
LINDSAY, A. D. Report on Monterey pine (Pinus radiata D. Don) in its native habitat.
Australia: Commonwealth (Austral.) Forestry Bureau Bulletin, 1932. 57 p. (Commonwealth
Scientific and Industrial Research Organization. Division of Forest Research. Bulletins, 10).
MAIA, M. C. C.; RESENDE, M. D. V.; PAIVA, J. R.; CAVALCANTI, J. J. V.; BARROS,
L. M. Seleção simultânea para produção, adaptabilidade e estabilidade genotípicas em clones
de cajueiro, via modelos mistos. Pesquisa Agropecuária Tropical, Goiânia, v. 39, n. 1, p.
43-50, 2009.
MEAD, D. J. Sustainable management of Pinus radiata plantations. Rome: FAO, 2013.
(Forestry Paper, 170).

43
MICKO, M. M.; WANG, E. I. C.; TAYLOR, F. W.; YANCHUK, A. D. Determination of
wood specific gravity in standing white spruce using a Pilodyn tester. The Forestry
Chronicle, Mattawa, v. 15, n. 7, p.178–180, 1982.
MISSIO, R. F. Variação genética em progênies de Pinus caribaea Morelet var.
bahamensis. 2004. 129 f. Dissertação (Mestrado) - Faculdade de Engenharia, Universidade
Estadual Paulista, Ilha Solteira, 2004.
MORAES NETO, S. P.; TELES, R. F.; RODRIGUES, T. O. Caracterização de madeira de
cinco procedências de Pinus tecunumanii implantadas no Cerrado do DF. Planaltina-DF:
Embrapa Cerrados, 2009. (Boletim técnico).
MOREIRA, J. P.; SHIMIZU, J. Y.; SOUSA, V. A.; MORAES, M. L. T.; MOURA, N. F.;
AGUIAR, A. V. Ganho esperado na seleção de progênies de Pinus elliottii var. elliottii em
idade precoce para produção de madeira. Pesquisa Florestal Brasileira, Colombo, v. 34, n.
78, p. 99-109, 2014.
MORI, E. S. Variabilidade genética em uma população de Eucalyptus grandis Hill ex
Maiden submetida a diferentes intensidades de seleção. 1993. 119 f. Tese (Doutorado) -
Escola Superior de Agricultura “Luiz de Queiroz”, Universidade de São Paulo, Piracicaba,
1993.
MOURA, V. P. G.; VALE, A. T. Variabilidade genética da densidade básica da Madeira de
Pinus tecunumanii procedente do México e da América Central, no cerrado. Scientia
Florestalis, Piracicaba, n. 62, p. 104-113, 2002.
MULLER-LANDAU, H. C. Interspecific and inter-site variation in wood specific gravity of
tropical trees. Biotropica, Hoboken, v. 36, n. 1, p. 20-32, 2004.
MURPHY, G.; COWN, D. Stand, stem and log segregation based on wood properties: a
review. Scandinavian Journal of Forest Research, Kalmar, v. 30, n. 8, p. 757-770, 2015.
OLIVEIRA, G. V. de; CARNEIRO, P. C. de S.; DIAS, L. A. dos S.; CARNEIRO, J. E. de S.;
CRUZ, C. D. Factor analysis in the environment stratification for the evaluation of common
bean cultivars. Crop Breeding and Applied Biotechnology, Brasília, DF, v. 5, n. 2, p. 166-
173, 2005.
OTSUBO, H. C. B.; MORAES, M. L. T.; MORAES, M. A.; JOSÉ NETO, M.; FREITAS, M.
L. M.; COSTA, R. B.; RESENDE, M. D. V.; SEBBENN, A. M. Variação genética para
caracteres silviculturais em três espécies arbóreas da região do bolsão sul-mato-grossense.
Cerne, Lavras, v. 21, n. 4, p. 535-544, 2015.
PAIVA, J. R.; RESENDE, M. D. V.; CORDEIRO, E. R. Índice multiefeitos (BLUP) e
estimativas de parâmetros genéticos aplicados ao melhoramento da acerola. Pesquisa
Agropecuária Brasileira, Brasília, DF, v. 37, n. 6, p. 799 – 807, 2002.
PAWSEY, C. K. Hand pollination of monterey pine. Australia: Forestry Timber Bureau
Leaflets, 1961. 13 p. (Commonwealth Scientific and Industrial Research Organization.
Division of Forest Research. Leaflets, 78)

44
PEREIRA, A. B.; MARQUES JUNIOR, O. G.; RAMALHO, M. A. P.; ALTHOFF, P.
Eficiência da seleção precoce em famílias de meios-irmãos de Eucalyptus camaldulensis
Dehnh, avaliadas na região noroeste do estado de Minas Gerais. Cerne, Lavras, v. 3, n. 1, p.
67-81, 1997.
PINTO JÚNIOR, J. E.; SANTOS, P. E. T.; AGUIAR, A. V.; KALIL FILHO, A. N.;
PALUDZYSZYN FILHO, E.; STURION, J. A.; RESENDE, M. D. V.; SOUSA, V. A.
Melhoramento genético de espécies arbóreas na Embrapa Florestas: uma visão histórica.
Dados eletrônicos. Colombo: Embrapa Florestas, 2013. (Documentos / Embrapa Florestas –
259).
PIRES, V. C. M.; MARTINS, K.; VILAS BÔAS, O.; FREITAS, M. L. M.; SEBBENN, A. M.
Variabilidade genética de caracteres silviculturais em progênies de polinização aberta de
Pinus caribaea var. bahamensis. Scientia Forestalis, Piracicaba, v. 41, n. 97, p. 113-119,
2013.
POUPIN, M.; ARCE-JOHNSON, P. Transgenic trees for a new era. In Vitro Cell
Development Biology Plant, Heidelberg, v. 41, n. 2, p. 91-101, 2005.
RAMALHO, M. A. P.; SANTOS, J. B. dos; PINTO, C. B. Genética na agropecuária.
Lavras: UFLA. 3ed. rev. 2004.
RESENDE, M. D. V.; ARAÚJO, A. I.; SAMPAIO, P. T. B.; WIECHETECK, M. S. S.
Acurácia seletiva, intervalo de confiança e variância de ganhos genéticos associados a 22
métodos de seleção em Pinus caribaea var. hondurensis. Revista Floresta, Curitiba, v. 24, n.
1, p. 35-45, 1995.
RESENDE, M. D. V. de. Novas abordagens estatísticas na análise de experimentos de
campo. Colombo: Embrapa Florestas, 2004. 60 p. (Documentos, 100).
RESENDE, M. D. V. SELEGEN‑REML/BLUP: sistema estatístico e seleção genética
computadorizada via modelos lineares mistos. Colombo: Embrapa Florestas, 2007. 359 p.
RESENDE, M. D. V.; BARBOSA, M. H. P. Melhoramento genético de plantas de
propagação assexuada. Colombo: Embrapa Floresta, 2005. 975 p.
RESENDE, M. D. V.; DUARTE, J. B. Precisão e controle de qualidade em experimentos de
avaliação de cultivares. Pesquisa Agropecuária Tropical, Goiânia, v. 37, n. 3, p. 182-194,
2007.
REZENDE, G. D. S. P.; BERTOLUCCI, F. L. G.; RAMALHO, M. A. P. Eficiência da
seleção precoce na recomendação de clones de eucalipto avaliados no norte do Espírito Santo
e sul da Bahia. Revista Ceres, Lavras v. 1, n. 1, p. 45-50, 1994.
RIEMENSCHNEIDER, D. E. Heritability, age-age correlations, and inference regarding
juvenile selection in jack pine. Forest Science, Zvolen, v. 34, n. 4, p. 1076-1082, 1988.

45
RIGHT, J. A.; SABOURIN, M. J.; DVORAK, W. S. Laboratory results of TMP and CTMP
trials with Pinus patula, P. tecunumanii and P. caribaea var. hondurensis. Tappi Journal, Peachtree Corners, v. 78, n. 1, p. 91-96, 1995.
ROBERTSON, A. A. Experimental design on the measurement of herdabilities and
genetic correlations: biometrical genetics. New York: Pergamon, 1959. 186 p.
ROBERTSON, A. A. Theory of limits in artificial selection. Proceedings of the Royal
Society of London, Londres, v. 153, n. 951, p. 234-249, 1960.
ROBINSON, H. F.; COCKERHAM, C. C. Estimación y significado de los parámetros
genéticos. Fitotecnía LatinoAmericana, San José, v. 2, n. 1, p. 23-38, 1965.
ROMANELLI, R. C.; SEBBENN, A. M. Parâmetros genéticos e ganhos na seleção para
produção de resina em Pinus elliottii var. elliottii, no Sul do Estado de São Paulo. Revista do
Instituto Florestal, São Paulo, v. 16, n. 1, p. 11-23, 2004.
ROSA, P. R. F. Teste de procedência de Pinus oocarpa Schiede em três regiões do Estado
de São Paulo. 1981. 79 f. Dissertação (Mestrado)- Faculdade de Ciências Agrárias e
Veterinária de Jaboticabal, Universidade Estadual Paulista, Jaboticabal, 1981.
ROSS, R. J.; BRADSHAW, B. K.; PELLERIN, R. F. Nondestructive evaluation of wood.
Forest Products Journal, Peachtree Corners, v. 48, n. 1, p. 14-19, 1998.
ROSVALL, O.; JANSSON, G.; ANDERSSON, B.; ERICSSON, T.; KARLSSON, B.;
SONESSON, J.; STENER, L. G. Predicted genetic gain from existing and future seed
orchards and clone mixes in Sweden. In: INTEGRATING TREE BREEDING AND
FORESTRY, 3., 2002, Vantaa. Proceedings … Vantaa: Nordic Group for Management of
Genetic Resources of Trees, 2002. p. 71-85, (Meeting at Mekrijärvi, 2001. Research papers
842, Finnish Forest Research Institute).
ROTH, B.; LI, X.; HUBER, D.; PETER, G. Efects of management intensity, genetic sand
planting density on Wood stiffness in a plantation of juvenile loblolly pine in the south
eastern USA. Forest Ecology and Management, Amsterdam, v. 246, n. 2, p. 155-162, 2007.
ROY, D. F. Silvical characteristics of Monterey Pine. Berkeley: Forest Service – U. S.
Department of Agriculture, 1966. (Research Paper PSW-31, Forest and Range Experiment
Station).
SAMPAIO, P. T. B.; RESENDE, M. D. V.; ARAÚJO, A. J. Estimativas de parâmetros
genéticos e métodos de seleção para o melhoramento genético de Pinus
caribaea var. hondurensis . Pesquisa Agropecuária Brasileira, Brasília, DF, v. 35, n. 11, p.
2243-2253, 2000.
SEBBENN, A. M.; SIQUEIRA, A. C. M. F.; KAGEYAMA, P. Y.; MACHADO, J. A. R.
Parâmetros genéticos na conservação da cabreúva – Myroxylon peruiferum L.F. Allemão.
Scientia Forestalis, Piracicaba, n. 53, p. 31-38, 1998.
SEBBENN, A. M.; VILAS BOAS, O.; MAX, J. C. M.; FREITAS, M. L. M. Estimativa de
parâmetros genéticos e ganhos na seleção para caracteres de crescimento em teste de

46
progênies de Pinus caribaea var. hondurensis e var bahamensis, em Assis-SP. Revista do
Instituto Florestal, São Paulo, v. 22, n. 2, p. 279-288, 2010.
SEBBENN, A. M. Variação genética em progênies de meios-irmãos de Pinus caribaea Mor.
var. bahamensis Bar. et Gol. na região de Bebedouro-SP. Revista do Instituto Florestal, São
Paulo, v. 6, n. 1, p. 63-73. 1994.
SHELBOURNE, C. Genotype environment interaction: its study and its implications in forest
tree improvement. In: IUFRO GENETIC SABRAO JOINT SYMPOSIA, 1., 1972, Tokyo.
Proceedings... Tokyo: [s.n.], 1972. p. 1-27.
SHIMIZU, J. Y.; KAGEYAMA, P. Y.; HIGA, A. R. Procedimentos e recomendações para
estudos de progênies de essências florestais. Curitiba: EMBRAPA-URPFCS, 1982. 34 p.
(Documentos, 11).
SHIMIZU, J. Y.; MEDRADO, M. J. S. Cultivo do Pinus. Embrapa Florestas: Sistemas de
Produção, 2005. Available in: < http://sistemasdeproducao.cnptia.embrapa.br/FontesHTML/Pinus/CultivodoPinus/index.htm>
. 2005. Access in: 25 abr. 2012.
SHIMIZU, J. Y.; PINTO JÚNIOR, J. E. Diretrizes para credenciamento de fontes de
material genético melhorado para reflorestamento. Curitiba: Embrapa-CNPF, 1988. 15 p.
(Documentos, 18).
SHIMIZU, J. Y.; SEBBENN, A. M. Espécies de Pinus na silvicultura brasileira. In:
SHIMIZU, J. Y. (Ed). Pinus na silvicultura brasileira. Colombo: Embrapa Floresta, 2008. p.
49-74.
SHIMIZU, J. Y.; SPIR, I. H. Z. Seleção de Pinus elliottii pelo valor genético para alta
produção de resina. Boletim de Pesquisa Florestal, Colombo, n. 38, p. 103-117, 1999.
SILVA, J. M. Análise genética em progênies de Pinus caribaea var. caribaea por
caracteres quantitativos e marcadores moleculares. 2005. 129 f. Dissertação (Mestrado)–
Faculdade de Engenharia, Universidade Estadual Paulista, Ilha Solteira, 2005.
SILVA, W. C. J.; DUARTE, J. B. Métodos estatísticos para estudo de adaptabilidade e
estabilidade fenotípica em soja. Pesquisa Agropecuária Brasileira, Brasília, DF, v. 41, n. 1,
p. 23–30, 2006.
SOTO, L.; VALENZUELA, L.; LASSERRE, J. P. efecto de la densidad de plantación inicial
em el módulo de elasticidad dinámico de árboles en pie y trozas de una plantación de pino
radiata de 28 años, en la zona de arenales, Chile. Maderas: Ciencia y Tecnologia,
Concepcion, v. 14, n. 2, p. 209-224, 2012.
SOUZA JÚNIOR, C. L. Melhoramento de espécies alógamas. In: NASS, L.L.; VALOIS, A.
C. C.; MELO, I. S. de, VALADARES-INGLIS, M. C. (Org.) Recursos genéticos e
melhoramento de plantas. Rondonópolis: Fundação MT, 2001. v. 1, p. 159-199.

47
SPRAGUE, J. R.; TALBERT, J. T.; JETT, J. B.; BRYANT, R. L. Utility of the Pilodyn in
selection for mature wood specific gravity in loblolly pine. Forest Science, Zvolen, v. 29, n. 4,
p. 696–701, 1983.
STUDART-GUIMARÃES, C.; LACORTE, C.; BRASILEIRO, A. C. M. Transformação
genética em espécies florestais. Ciência Florestal, Santa Maria, v. 13, n. 1, p. 167-178, 2003.
SUASSUNA, J. A cultura do pinus: uma perspectiva e uma preocupação. Revista Brasil
Florestal, Brasília, DF, v. 8, n. 29, p. 2-7, 1977.
SUN, B. C.; HAWKE, R. N. Flexural strengths of performance-designed wood fiber
composites. Journal of Advanced Materials, Corvina, v. 27, n. 3, p. 45-50, 1996.
TSUCHIKAWA, S.; KOBORI, H. A review of recent application of near infrared
spectroscopy to wood science and technology. Journal of Wood Science, Kudan-kita, v. 61,
n. 4, p. 213–220, 2015.
VENCOVSKY, R. Tamanho populacional na coleta e preservação de germoplasmas de
espécies alógamas. IPEF, Piracicaba, n. 35, p. 79-84, abr. 1987.
VENCOSVSKY, R.; BARRIGA, P. Genética biométrica no fitomelhoramento. Ribeirão
Preto: Sociedade Brasileira de Genética, 1992. 496 p.
VERONESI, J. A.; CRUZ, C. D.; CORRÊA, L. A.; SCAPIM, C. A. Comparação de métodos
de ajuste do rendimento de parcelas com estandes variados. Pesquisa Agropecuária
Brasileira, Brasília, DF, v. 30, n. 2, p. 169-174, 1995.
WENG, Y. H.; LU, P.; ADAMS, G. W.; FULLARTON, M. S.; TOSHA, K. J. Genetic
paramenters of growth and stem quality traits for jack pine second-generation progeny tested
in New Brunswick. Canadian Journal of Forest Research, Ottawa, v. 45, n. 1, p. 36-43,
2015.
WAGHORN, M. J.; WATT, M. S.; MASON, M. G. Influence of tree morphology, genetics,
and initial stand density on outerwood modulus of elasticity of 17-year-old Pinus radiata.
Forest Ecology Management, Amsterdam, v. 244, n. 1, p. 86–92, 2007.
WATT, M. S.; CLINTON, P. W.; PARFITT, R. L.; ROSS, C.; COKER, G. W. R. Modelling
the influence of site and weed competition on juvenile modulus of elasticity in Pinus radiata
across broad environmental gradients. Forest Ecology Management, Amsterdam, v. 258, n.
7, p. 1479–1488, 2009.
WESSELS, C. B.; MALAN, F. S.; KIDD, M.; RYPSTRA, T. The variation of microfibril
angle in South African grown Pinus patula and its influence on the stiffness of structural
lumber. Southern Forest, Grahamstown, v. 77, n. 3, p. 213-219, 2015.
WILLIAMSON, G. B.; WIEMANN, M. C. Age versus size determination of radial variation
in wood specific gravity: lessons from eccentrics. Trees, Berlim, v. 25, v. 4, p. 585-591,
2011.

48
WINCK, R. A.; FASSOLA, H. E.; ÁREA, M. C. efecto del raleo sobre las propriedades
anatómicas de la madera de Pinus taeda. Madera: Ciencia y tecnología, Concepcion, v. 17,
n. 2, p. 391-406, 2015.
WU, H. X.; ELDRIDGE, K. G.; MATHESON, A. C.; POWELL, M. B.; MCRAEB, T. A.;
BUTCHERC, T. B.; JOHNSON, I. G. Achievement in forest tree improvement in Australia
and New Zealand. Successful introduction and breeding of radiata pine to Australia.
Australian Forest, Yarralumla, v. 70, n. 4, p. 215–225, 2007.
WU, H. X.; IVKOVIĆ, M.; GAPARE, W. J.; MATHESON, A. C.; BALTUNIS, B. S.
Breeding for wood quality and profit in Pinus radiata: a review of genetic parameter
estimates and implications for breeding and deployment. New Zealand Journal of Forest
Science, Wellington, v. 38, n. 1, p. 56–87, 2008.
WU, S. J.; XU, J. M.; LI, G. Y.; RISTO, V.; LU, Z. H.; LI, B. Q.; WANG, W. Use of Pilodyn
for assessing wood properties in standing trees of Eucalypt clones. Journal of Forest
Research, Kudan-kita, v. 21, n. 1, p. 68-72, 2010.
XIANG, B.; LI, B.; MCKEAND, S. Genetic gain and selection efficiency of loblolly pine in
three geographic regions. Forest Science, Zvolen, v. 49, n. 2, p. 196-208, 2003.
XIE, C. Y.; YING, C. C. Heritabilities, age-age correlations, and early selection in lodgepole
pine (Pinus contorta ssp. latifolia). Silvae Genetica, Frankfurt, v. 45, n. 3, p. 101-107, 1996.
ZHENG, Y.; ENNOS, R.; WANG, H. Provenance variation and genetic parameters in a trial
of Pinus caribaea var. bahamensis Barr. and Golf. Forest Genetics, Zvolen, v. 1, n. 3, p. 167-
174, 1994.
ZOBEL, B.; TALBERT, J. Applied forest tree improvement. New York: John Wiley, 1984.
505 p.

49
3 CHAPTER I
ESTIMATE OF ADAPTABILITY, STABILITY, PRODUCTIVITY AND GENETIC
PARAMETERS IN EARLY AGE SLASH PINE SECOND-GENERATION
PROGENIES
ABSTRACT
The study was conducted to estimate the stability, adaptability, productivity and genetic
parameters in Slash pine second-generation open pollinated progenies considering phenotypic
traits in early age for forty-four progenies from a first generation seed orchard planted in
Colombo-PR, Brazil. Two progenies tests were established in a randomized complete block
design. The first test was implemented in March 2009 in Ribeirão Branco, São Paulo state,
Brazil, containing 40 blocks, one tree per plot, 44 treatments (progenies) and 6 controls.
Another test was implemented in Ponta Grossa, Paraná state, Brazil, using the same
experimental design and number of plants per plot, and with 24 treatments, 32 blocks, both in
3.0 x 3.0 meters spacing. The growth traits evaluated were total height, diameter at breast height
and wood volume, within five years. The form traits evaluated were stem form, branch
thickness, branch angle, number of branches, fork and fox tail five years after planting.
Deviance analysis and estimates of stability, adaptability, productivity and genetic parameters
were performed using the methods of best linear unbiased predictor (BLUP) and residual
maximum likelihood (REML). There was significant variation (p<0.01) among progenies for
growth and form traits. Considerable genetic variation was detected mainly for wood volume
as moderate to high coefficients of genetic variation (14.31% to 16.24% - Ribeirão Branco-SP
and 31.78% to 33.77% - Ponta Grossa-PR) and heritability (0.10 to 0.15 – Ribeirão Branco-SP
and 0.36 to 0.48 – Ponta Grossa-PR) evidencing high genetic control for the traits is significant
and the possibility of genetic gains with selection. The effect of genotype x environment
interaction is simple which means progenies planted in one site can also be planted in the other.
Genotypes such as C-197, C-189-1, C-084-2 and C-032-2 are indicated to plantations in both
studied regions in São Paulo and Paraná states according to stability, adaptability and
simultaneously productivity, stability and adaptability.
Keywords: Pinus elliottii Engelm. var. elliottii. Seed production. Selection gain.
REML/BLUP.

50
RESUMO
O objetivo deste trabalho foi estimar a estabilidade, a adaptabilidade, a produtividade e os
parâmetros genéticos em progênies de polinização aberta de segunda geração de Pinus elliottii
var. elliottii considerando os caracteres fenotípicos em idade precoce de quarenta e quatro
progênies provenientes de um pomar de sementes de primeira geração instalados em Colombo,
PR, Brasil. Dois testes de progênies foram estabelecidos em um delineamento em blocos
completos casualizados. O primeiro teste foi implantado em março de 2009 em Ribeirão
Branco, SP, contendo 40 repetições, uma planta por parcela e 44 tratamentos (progênies) e 6
testemunhas comerciais. Em Ponta Grossa, PR, foi implantado outro teste utilizando o mesmo
delineamento experimental e mesmo número de plantas por parcela com 24 tratamentos, 32
repetições, ambos no espaçamento 3,0 x 3,0 metros. Foram avaliados sobrevivência, caracteres
de crescimento como altura total, diâmetro à altura do peito e volume de madeira, nos cinco
anos subsequentes e caracteres de forma como forma de fuste, espessura de galho, ângulo de
galho, número de galhos, bifurcação e fox tail cinco anos após o plantio. Análise de Deviance
e as estimativas da estabilidade, a adaptabilidade, a produtividade e parâmetros genéticos foram
realizadas a partir dos métodos de melhor preditor linear não-viesado (BLUP) e máxima
verossimilhança residual (REML). Foi observada variação significativa (p<0,01) entre as
progênies para os caracteres de crescimento. Variação genética considerável, principalmente
para o caráter volume foi constatada. Os altos coeficientes de variação genética para esse caráter
(14,31% a 16,24% - Ribeirão Branco e 31,78% a 33,77% - Ponta Grossa) e herdabilidade (0,10
a 0,15 – Ribeirão Branco e 0,36 a 0,48 – Ponta Grossa) mostraram baixa influência do ambiente
na variação fenotípica, o que é importante para a predição do ganho genético mediante a
seleção. O efeito da interação genótipo x ambiente é simples, ou seja, progênies plantadas em
um local podem também ser plantadas no outro. Genótipos como C-197, C-189-1, C-084-2 e
C-032-2 são indicados para plantações tanto na região estudada de São Paulo e Paraná de acordo
com a estabilidade, adaptabilidade e simultaneamente produtividade, estabilidade e
adaptabilidade.
Palavras-chave: Pinus elliottii Engelm. var. elliottii. Produção de sementes. Ganho de seleção.
REML/BLUP.

51
3.1 INTRODUCTION
The Pinus genus species are widely used in homogeneous reforestation in many parts
of the globe due to the large adaptation to climate diversity and the wide application of their
products (wood, resins, fibers, cellulose, etc.) (MOREIRA et al., 2015). In addition, they present
much higher phenotypic plasticity than the other exotic tree species (SEBBENN, 1994).
In Brazil, the most limiting climatic factors for pine cultivation are temperature and
precipitation. Based on these effects observation under reforestation areas (experimental tests)
it has been established two growing areas for pine species in Brazil, tropical regions with
varieties of Pinus caribaea (caribaea, hondurensis and bahamensis), Pinus tecunumanii and
sub-tropical / temperate zone, whose more adapted species were Pinus taeda, Pinus greggii and
Pinus patula (SHIMIZU; SPIR., 1999; FONSECA et al., 1978). In addition to these species,
Pinus elliottii adapted well to Brazilian environmental conditions making it the second most
widely planted species of the genus Pinus for wood production and first for resin extraction
(ROMANELLI; SEBBENN, 2004).
Slash pine (Pinus elliottii Engelm. var. elliottii) occurs on coastal plains all over the
Indian River Lagoon area, and in freshwater upland areas. It may be found on coastal plains
from South Carolina to Central Florida, and west to Louisiana. Slash pine was introduced in
Kentucky, Virginia and eastern Texas in the 1900's, and now reproduces naturally within these
states (UNITED STATES DEPARTMENT OF AGRICULTURE – USDA, 2004).
The introduction of exotic species in Brazil, as Slash pine, have driven the forest
breeding mainly for increasing productivity, obtaining raw materials of higher quality,
improving species adaptive conditions, tolerance to pests and diseases and maintaining genetic
variability (MORI, 1993). More specific issues such as genotype x environment interaction
were less prioritized, especially for this genus. In general, there are few studies about this topic
in forest species. Therefore, it is indispensable to evaluate the maximum number of
environments and the adoption of more rigorous methods of improvement as possible in order
to obtain data with high accuracy, which allows the selection of the best materials to be
multiplied on a commercial scale for many environments. To make this recommendation as
reliable as possible, a detailed study is required for the temporal stability of genotypes and with
regard to their most important economically traits (CRUZ, 2006). Analysis of adaptability,
stability and productivity are statistical procedures to identify more stable and performance
materials that respond predictably to environmental variations (SILVA; DUARTE, 2006).

52
Adaptability refers to genotypes ability of responding to environmental stimulation and
stability is genotypes ability of maintaining the same performance under various environmental
conditions (ALWALA et al., 2010). Adaptability and stability analysis allows, in this way, the
identification of predictable genotypes behaviours (production) in different environments
(CRUZ; REGAZZI; CARNEIRO, 2004). Considering the range of planting zones and the
existence of diversity in the used material in commercial pine plantations more detailed
investigation in relation to the behaviour of genotypes will generate important information for
establishment of more productive plantings. Furthermore, all intents and purposes to be
considered to estimate genetic parameters such as adaptability, stability and productivity for
forest species trials, a major impediment faced by forest breeders is the traditional perennial
species breeding cycle, which can be very long, 25 years for pine (PEREIRA et al., 1997). The
use of biotechnology in many stages of the process and estimation of genetic parameters at early
ages, especially genetic correlations, accuracies and heritability are the alternatives to reduce
the selection cycle. Thus, silvicultural traits of economic interest in juvenile trees are measured
in order to predict the performance of each individual in adulthood (GONCALVES et al., 1998).
In this way, in the forest improvement, the early age selection has shown great advantage
shortening the interval between generations by reducing the breeding cycle. Thus, it can obtain
more genetic gain per unit of time (year) if a strong genetic correlation exists between the initial
stages and the end of the production cycle (NANSON, 1970; LAMBETH, 1980; McKEAND,
1988; MATHESON et al., 1994; SILVA et al, 2014).
Then, the study was conducted (i) to estimate the stability, adaptability, productivity,
genetic diversity and genetic parameters in slash pine second-generation open pollinated
progenies considering the phenotypic traits at early age, and (ii) to identify more productive
genotypes for commercial plantations in the two Pine planting regions in São Paulo and Paraná
states.

53
3.2 MATERIALS AND METHODS
3.2.1 The trials
Forty-four progenies originated from a slash pine first generation seed orchard
established in Colombo-PR, Brazil, were used in this study. The seedlings were produced in
municipality of Ribeirão Branco-SP, Brazil, in 2008. In March of the following year two second
generation progeny tests they were installed, one in Ponta Grossa-PR and another one in
Ribeirão Branco-SP, Brazil (Table 1, Figures 6 and 7).
Table 1 – Details of slash pine progeny tests deployed in municipalities of Ribeirão Branco-SP
and Ponta Grossa-PR, Brazil.
Ribeirão Branco-SP Ponta Grossa-PR
Progenies number 44 24
Blocks 40 32
Controls 6 -
Spacing 3m x 3m
Plating date March/2009
Border 2 lines
Latitude 25° 05' 42'' S 24° 13' 15'' S
Longitude 50° 09' 43'' W 48° 45' 56'' W
Altitude 969 m 875 m
Pluviosity 1,346 mm 1,495 mm
Clime Cfb Cfb
Average temperature 18 °C 17.5 °C
Soil type Cambissolo Cambissolo Source: The author.
Figure 6 – Total precipitation and monthly temperature mean for municipalities of Ribeirão
Branco-SP and Ponta Grossa-PR, Brazil, from April 2009 to April 2015.
Source: Prepared by the author based on data provided by the National Institute of Meteorology.
0
5
10
15
20
25
30
0
50
100
150
200
250
300
350
400
450
Ap
r-09
Jul-
09
Oct
-09
Jan
-10
Ap
r-10
Jul-
10
Oct
-10
Jan
-11
Ap
r-11
Jul-
11
Oct
-11
Jan
-12
Ap
r-12
Jul-
12
Oct
-12
Jan
-13
Ap
r-13
Jul-
13
Oct
-13
Jan
-14
Ap
r-14
Jul-
14
Oct
-14
Jan
-15
Ap
r-15
Aver
age
Tem
per
ature
(°C
)
Plu
vio
sity
(m
m)
Pluviosity (Ponta Grossa) Pluviosity (Ribeirão Branco)
Average Temperature (Ponta Grossa) Average Temperature (Ribeirão Branco)

54
Figure 7 – Geographical localization of municipalities of Ribeirão Branco-SP
and Ponta Grossa-PR, respectively, in Brazil.
Source: IBGE cartographic base, adapted by Ananda Aguiar and the author.
3.2.2 Traits measurement
Data was obtained within five years after planting and traits were: survival rate; total
height, diameter at breast height (dbh) and wood volume, computed based on the total height
of data and diameter at breast height, according to the following equation:
𝑉𝑂𝐿 =𝜋(𝐷𝐵𝐻)2.𝐹𝐹
40000 𝑇𝐻 (1)
Where VOL was wood volume, dbh was the diameter at breast height, FF was the stem
form factor and TH was total height. The height trait was measured using a telescopic ruler,
circumference at breast height was measured with a tape calculating from these values the
diameter at breast height and survival was adopted "1" to alive and "0" to dead plants. Form
traits were visually scored as follows (Table 2).

55
Table 2 – Scoring for form traits of slash pine progenies in municipalities of Ribeirão Branco
and Ponta Grossa, Brazil.
Scale Description
Traits Ribeirão Ponta Ribeirão Ponta
Branco Grossa Branco Grossa
Stem straightness 1-3 1-5
1 = most crooked
steams, 3 = straightest
stems
1 = most crooked
steams, 5 =
straightest stems
Branch thickness 1-3 1 = thicker, 3 = thinner
Branch angle 1-3 1 = less than 45º, 2 = greater than 45º and 3 =
approximately 90º
Number of branches 1-7 1 = 42 to 48 branches, 7
= 1 to 6 branches
1 = 17 to 18
branches, 7 = 0 to 2
branches
Fork 1 and 2 “1” for absence and “2” for presence
Fox tail (only for Ponta
Grossa trial)
1 and 2 “1” for absence and “2” for presence
Source: The author.
3.2.3 Estimates of variance components and genetic parameters
Estimates of variance and genetic parameters components were obtained by REML /
BLUP method (restricted maximum likelihood/best linear unbiased prediction) from
unbalanced data, using genetic-statistical software SELEGEN-REML/BLUP, developed by
Resende (2007a). Different models were used to perform statistical analyses and estimate
genetic parameters, as described below.
3.2.4 Individual analysis and estimation of genetic parameters
The model applied to perform the deviance analysis of half-sib progenies tests was
randomized complete block, one tree per plot, one place:
𝑦 = 𝑿𝒓 + 𝒁𝒂 + 𝒆 (2)
Where y is the data vector r is the vector of replication effects (assumed to be fixed)
added to the general average, a is the vector of individual additive genetic effects (assumed to
be random), e is the error vector or residues (random). The capital letters represent the incidence
matrices for these purposes. To use this model, it was necessary to assume that the open
pollinated progenies of slash pine are half-sibs. Thus, the first step was carried out analysis
considering all treatments including the control (for Ribeirão Branco). Later, controls were
removed, proceeding further analysis to estimate the parameters and predict genetic values.

56
The significance test was performed using the likelihood ratio test (LRT), obtained by
the difference between deviances for models with and without effect to be tested and using the
chi-square test. The genetic parameters estimated were:
a) Narrow sense individual heritability
ℎ𝑎2 =
𝜎𝑎2
𝜎𝑎2+ 𝜎𝑒
2 (3)
Where 𝜎𝑎2 is additive genetic variance and 𝜎𝑒
2 is residual variance.
b) Average heritability of progenies
ℎ𝑚2 =
[1+(𝑛−1)𝜌𝑎] ℎ𝑎2
1+(𝑛−1) (𝜌𝑎ℎ𝑎2)
(4)
Where 𝜌𝑎 is additive genetic correlation intraclass between individuals of considered
progeny type, 𝑛 in number of trees per progeny and ℎ𝑎2 narrow sense individual heritability.
c) Accuracy
𝑟â𝑎 = √
𝑛
𝑛+(4−ℎ𝑎
2
ℎ𝑎2 )
(5)
Where 𝑛 in number of trees per progeny and ℎ𝑎2 narrow sense individual heritability.
d) Individual phenotypic variance
�̂�𝑓2 = �̂�𝑎
2 + �̂�𝑒2 (6)
Where 𝜎𝑎2 is additive genetic variance and 𝜎𝑒
2 is residual variance.
e) Coefficient of individual genetic variance
𝐶𝑉𝑔𝑖 = 100.√𝜎𝑎
2̂
𝜇 (7)
Where 𝜎𝑎2 is additive genetic variance and 𝜇 is the overall trait mean.
f) Coefficient of genetic variation between progenies
𝐶𝑉𝑔𝑝 = 100.√0,25�̂�𝑎
2
µ (8)
Where 𝜎𝑎2 is additive genetic variance and 𝜇 is the overall trait mean.

57
g) Coefficient of experimental variation
𝐶𝑉𝑒 = 100.√𝑆𝑀𝑟𝑒𝑠
𝜇 (9)
Where 𝑆𝑀𝑟𝑒𝑠 is residual square mean and 𝜇 is the overall trait mean.
3.2.5 Effective population sizes and expected selection gains
To select superior genotypes for commercial plantations and seed orchards formation
were simulated different selection methods from BLUP classification of each tests. Wood
volume was chosen due to higher narrow-sense individual heritability and because it is the most
important trait to wood industry. After obtaining additive values for selected trees, according
to individual classification obtained by BLUP procedure, genetic gain in percentage was
estimated by the expression: SG (%) = (mean of the additive genetic values of selected
individuals / m) x 100, where m is the overall average of the experiment for a given trait.
Selection strategies were: i) selecting of the 80 best individuals from each site to form a
clonal orchard; ii) selecting the two best individuals per progeny for the next breeding cycle
and iii) selecting the best 50% individuals per progenies to form a seedling seed orchard.
To guide the selection strategy adopted in order to avoid excessive loss of genetic
variability after application of the proposed selection methods, the effective population size
(𝑁𝑒) and genetic diversity (�̂�) were estimated from the equation 10 and 11.
𝑁𝑒 = 4 𝑁𝑓 𝑘𝑓̅̅̅̅
[𝑘𝑓̅̅̅̅ +3+(𝜎𝑘𝑓
2
𝑘𝑓̅̅ ̅̅ )]
(10)
Where 𝑁𝑓 is number of selected progenies, 𝑘𝑓̅̅ ̅ is the average number of individuals
selected per progeny and 𝜎𝑘𝑓
2 is variance of selected individuals per progeny.
�̂� =𝑁𝑒𝑓
𝑁𝑓𝑜 (11)
Where 0 < �̂� ≤ 1, 𝑁𝑒𝑓 is effective number of selected progenies and 𝑁𝑓𝑜 is original
number of progenies.

58
3.2.6 Trait-trait and age-age genetic and phenotypic correlations
Genetic and phenotypic correlations between traits and ages were undertaken with
genetic-statistical software SELEGEN-REML/BLUP, developed by Resende (2007a) to
determine the relationship between them.
3.2.7 Productivity, stability and adaptability
For joint analysis, considering the two sites, was used statistical procedure MHPRVG
(harmonic mean of the relative performance of the breeding values) predicted by BLUP,
according to Resende (2007b).
The model used was:
𝑦 = 𝑿𝒓 + 𝒁𝒈 + 𝑾𝒊 + 𝒆 (12)
Where y is the data vector r is the vector of replication effects (assumed to be fixed)
added to the general average, g is the vector of genotypic effects (assumed to be random), i is
the vector of the effects of genotype x environment interaction (random) and e is the vector of
errors or residues (random). The capital letters represent the incidence matrices for these
purposes. The vector r includes all measurements in all replications in multiple sites
simultaneously and adjusts to all these effects and their interactions (Resende, 2007b). In
addition to the narrow sense individual heritability (ℎ𝑎2), average heritability of progenies (ℎ𝑚
2 ),
accuracy (𝑟â𝑎), coefficient of individual additive genetic variation (𝐶𝑉𝑔𝑖) and coefficient of
residual variation (𝐶𝑉𝑒 − %) were estimated:
a) Coefficient of determination for genotype x environment interaction
𝐶𝑖𝑛𝑡2 =
𝜎𝑖𝑛𝑡2
𝜎𝑎2 (13)
Where 𝜎𝑖𝑛𝑡2 is variance of interaction between genotypes and environment.
b) Genotypic correlation between progenies in different environments (Type b correlation)
𝑟𝑔𝑙𝑜𝑐 =𝜎𝑎
2
𝜎𝑎2+ 𝜎𝑖𝑛𝑡
2 (14)

59
3.3 RESULTS AND DISCUSSION
3.3.1 Individual deviance analysis and genetic parameters estimation
Survival rate was high in Ribeirão Branco-SP five years after planting (95%) while in
Ponta Grossa-PR was relatively low, only 65% (Figure 8). Yang et al. (2013) showed the first
years are important to plant recover the root system and adapt to the new environment, if this
does not occur, mortality rate of seedlings may be high, as can be observed in Ponta Grossa.
Furthermore, lack of water in the first weeks after planting may be responsible for plant
mortality, the first month after planting there was less rainfall in relation to the normal April
month at Ponta Grossa. According to Schultz (1997), pine productivity is positively associated
to places with mild temperatures and mostly smaller water deficit.
Total height, diameter at breast height (dbh) and wood volume means ranging from 1.08
m to 5.82 m, 7.38 cm to 10.73 cm and 0.01 m3.arv-1 to 0.03 m3.arv-1 and 0.91 m to 6.04 m, 7.35
cm to 11.52 cm and 0.01 m3.arv-1 to 0.03 m3.arv-1, respectively, in Ribeirão Branco-SP and
Ponta Grossa-PR. This shows that there was little difference in relation to second-generation
slash pine progenies productive performance in both assays. Significant variation among
progenies was observed for most of evaluated growth traits at 5% and 1% of probability, except
for the survival trait in both tests and one year after planting in Ponta Grossa trial (Figure 8).
In Ribeirão Branco, commercial controls of slash pine were planted in the experiment
aiming to compare performance of established trees with new progenies which can be as
adaptable as the previous one. The best commercial control was I123, however, comparing to
test progenies it is possible to notice that, for wood volume at age three, only two progenies
were better than this control (C-098-1 and C-100-2). Two years later, at age five, the tested
progenies were more adapted to new environment and in this case it is possible to highlight five
better progenies than I123, such as C-063-2, C-098-1, C-228, C-001-1 and C-100-2 (Appendix
12).
In relation to form traits, there was statistical difference only for stem straightness and
number of branches for Ribeirão Branco and stem straightness, branch thickness, branch angle
and fox tail to Ponta Grossa (Figure 9). Form traits mean were similar to both sites, except stem
straightness and number of branches. Ponta Grossa produced trees with score mean of 3.34 and
Ribeirão Branco of 2.11, in other words, greater numbers indicates straighter trees.

60
Figure 8 – Mean values, likelihood ratio test (LRT) and significance levels for slash pine
growth traits in municipalities of Ribeirão Branco and Ponta Grossa, Brazil.
(LRT above dashed line = p<0.05; above dotted line = p<0.01 and below dashed
line = not significant).
Source: The author.
Figure 9 – Mean values, likelihood ratio test (LRT) and significance levels for slash pine
form traits in municipalities of Ribeirão Branco and Ponta Grossa, Brazil.
(LRT above dashed line = p<0.05; above dotted line = p<0.01 and below
dashed line = not significant – BA: branch angle, BT: branch thickness, FOR:
fork, FT: fox tail, NB: number of branches, SS: stem straightness).
Source: The author.

61
Experimental design showed good precision for majority growth and form traits (Figure
10 and 11). Coefficient of experimental variation (𝐶𝑉𝑒) ranging from 8.55% (fork) to 28.94%
(stem straightness) for Ribeirão Branco and 8.33% (number of branches) to 34.67% (branch
thickness) for Ponta Grossa (Figure 11). Experimental variation between 10% and 20% can be
considered low in tests if it occurs plant competition (PIMENTEL-GOMES; GARCIA, 2002).
These results may indicate a good experimental control and therefore good accuracy in genetic
parameters estimation.
Considerable genetic variation for wood volume may be found across the magnitudes
of coefficient of individual genetic variation (𝐶𝑉𝑔𝑖) which are from 14.31% to 16.24% in
Ribeirão Branco and from 33.77 to 31.78% in Ponta Grossa (Figure 10), as stem straightness
and branch thickness for Ponta Grossa trial (14.74% and 21.81%, respectively (Figure 11).
These values have provided high magnitude of individual heritability.
Other traits expressed medium to low magnitude for genetic variation. For height 𝐶𝑉𝑔𝑖
ranged from 3.29% to 6.55% in Ribeirão Branco and 9.01% to 11.60% in Ponta Grossa. For
dbh, estimates ranged between 4.86% and 5.38% in the first site and 9.05% and 11.90% in the
second one. Fork presented low 𝐶𝑉𝑔𝑖 estimation for both sites 1.91% (Ribeirão Branco) and
5.92% (Ponta Grossa).
These estimates were considered high in relation to those reported in other studies of
slash pine (ROMANELLI; SEBBENN, 2004; MAX et al., 2008), Pinus caribaea var.
bahamensis (SEBBENN, 1994; SEBBENN et al., 2010), Pinus tecunumanii (SEBBENN et al.,
2005) and scots pine (FRIES, 2012). In contrast, Gapare at al. (2012) obtained genetic variation
for Radiata pine closer to Ponta Grossa trail, but higher than Ribeirão Branco. Thus, the results
of this study confirm the genetic potential of this progenies in both tests, especially Ponta
Grossa. Consequently, genotypes with the highest genetic values may be selected for
commercial plantations and subsequent breeding generations. According to Miranda et al.
(2015), as higher the coefficient of genetic variation as greater the chances of finding superior
individuals.
Low genetic variation for fork can be related to binary factor. When the trait is binary
both phenotypic and genetic variances may be affected by low frequency (WENG et al., 2015).
According to quantitative genetic theories, estimation of heritability for binary traits is due to
its incidence rate it means as lower the incidence as lower will be the phenotypic and genetic
variances (FALCONER; MACKAY, 1996).

62
In early and intermediate stages of breeding programs accuracy around 70% or higher
are desirable. Most of growth traits in both tests showed values more than 70% (Figure 8).
Accuracy is the ratio between true genetic value and the predicted one and as higher the value,
as higher the accuracy selection and genetic gain obtained. It can be considered low in the range
from 0.10 to 0.40; median from 0.41 to 0.70 and high if major than 0.70 (RESENDE et al.,
1995). Consequently, the estimated accuracy for height can be considered median in Ribeirão
Branco and mid-high in Ponta Grossa. For dbh and wood volume accuracies were high for both
sites. Therefore, there is great expectation to reduce errors in the applied selection, and
consequently, the selected material in the test will maintain their potential productive in
commercial plantations and experiments.
Figure 10 – Coefficients of experimental variation, individual additive genetic variation
and accuracy for growth traits for Slash pine tests in municipalities of
Ribeirão Branco and Ponta Grossa, Brazil.
Source: The author.

63
Figure 11 – Coefficient of experimental variation, individual additive genetic variation
and accuracy for Slash pine progenies test in Ribeirão Branco-SP and Ponta
Grossa-PR, Brazil. (BA: branch angle, BT: branch thickness, FOR: fork,
FT: fox tail, NB: number of branches, SS: stem straightness).
Source: The author.
Estimates of narrow sense individual heritability (ℎ𝑎2), for Ribeirão Branco site were
considered low for all growth traits and moderate to high for number of branches. Ponta Grossa
presented medium values for growth traits and moderate to high for stem straightness, branch
thickness and branch angle. Resende et al. (1995) considered values from 0.01 to 0.15 as low,
0.16 to 0.50 as medium and more than 0.50, higher.
Dornan and Squillace (1974), Hodge and White (1992), Dieters, White and Hodge
(1995) and Dieters (1996), previously reported low growth traits ℎ𝑎2 (Figure 12) as well as in
Ribeirão Branco. In the same way, Ettori et al. (2004) found lower ℎ𝑎2 values in thin-leaf pine
(Pinus maximinoi Moore) as Silva et al. (2011) in Pinus caribaea var. caribaea.
In the other hand, Parayi et al. (1996) and Zobel (1961) estimated median and high
values also for Pinus caribaea var. caribaea. at 5, 8, 14 and 15 years of age, Aguiar, Souza
and Shimizu (2010) for Gregg’s pine (Pinus greggii Engelm.) at 13 years old and Missanjo,
Kamanga-Thole and Manda (2013) for Khasi pine (Pinus kesiya Royle ex Gordon) at 18 years
old in South Africa as in Ponta Grossa.

64
Figure 12 – Individual narrow-sense heritability estimates for height, dbh and wood volume
for Slash pine published works.
Source: The author.
Wood volume is one of the most important trait to analyse if objective is wood
production. Individual narrow-sense heritabilities for Ribeirão Branco were around 0.07 to 0.10
(Figure 13), similar results found by Atwood, White and Huber (2002) and Sierra-Lucero
(1999) in 3-11 years old Loblolly pine progenies at Florida, Georgia, Mississippi and Alabama
states. In Ponta Grossa, ℎ𝑎2 were higher between 0.36 and 0.48 (Figure 13). When different
works are analysed together the aim is not to compare and conclude one is better than the other,
because there are several factors that may cause this differences, the main idea is to infer if the
studied material is promising for a region.
Hodge and White (1992) affirm although it may be possible to compare previous
estimates for Slash pine with other conifers, the low ℎ𝑎2 found in Ribeirão Branco are not due
to differences between species. The authors said there is a tendency not to publish very low or
negative results of ℎ𝑎2 estimates. Furthermore there is different ways to estimate this parameter
and also many things may interfere at the results such as number of progenies per test or
environmental homogeneity (WHITE; ADAMS; NEALE, 2007).
In general, family heritability means were higher in Ponta Grossa than Ribeirão Branco
(Figure 13). Although they have got the same progenies, different weather conditions in Ponta
Grossa, such as frost occurrence, may have contributed to a different behaviour of some
progenies show their genetic potential. These results indicate that the traits genetic control is
high for average level, medium for individual level within progenies. Thus, the results show

65
low environmental influence on phenotypic variation, which is important for the prediction of
genetic gain by selection.
Heritability estimates vary with age, environment and species. Overall, estimates of
family heritability mean for growth traits in pine species varies from 0.42 to 0.76 for P. caribaea
var. bahamensis and slash pine (MISSIO et al., 2004; ROMANELLI; SEBBENN, 2004;
SEBBENN et al., 2008). Olsson and Ericsson (2002) found low family heritability mean for six
years old scots pine progenies in Sweden. They also affirm the estimate of this parameter
increases as trial age also increase. As a result, considering the age of the progenies tests, they
have a good prediction for traits of economic importance, which is interesting when it aims
early age selection.
Deviations in shape, caused by sinuosity, stem malformation, apex loss or damage, and
even fork may decrease the volume and the value of economic parts of the stem increasing the
price of handling and transportation (Codesido; Fernández-López, 2008). In this case, fork is
not easily transmissible to present lower ℎ𝑎2 0.05 (Ribeirão Branco) and 0.07 (Ponta Grossa)
possibly due to the lower incidence of forked trees (Figure 14). Cotterill and Zed (1980) also
found low ℎ𝑎2 for fork (0.02-0.04) in radiata pine progenies.
The stem straightness presented ℎ𝑎2 of 0.07 and 0.33 in Ribeirão Branco and Ponta
Grossa, respectively (Figure 14). The average of this estimate varies considerably in relation to
other species of pine as observed by: Wu et al. (2008) for radiata pine progenies - 0.02 to 0.57;
Gwaze, Woolliams and Kanowski (1997) for loblolly pine - 0.13 to 0.55 and Weng et al. (2015)
for jack pine - 0.11 to 0.22. Narrow-sense heritability for branch angle was 0.06 (Ribeirão
White) and 0.17 (Ponta Grossa) (Figure 14), similar results found by Arregui et al. (1999),
Espinel and Aragones (1997) and Codesido and Fernández-López (2008) in radiara pine trees.
Taking everything into consideration, genetic selection for high heritabilities both
individual and family mean levels indicate that these progenies have evolutionary potential to
respond to environmental changes, because significant part of genetic variability is from genetic
origin.

66
Figure 13 – Narrow-sense individual heritability and family heritability mean for slash
pine growth traits in municipalities of Ribeirão Branco and Ponta Grossa,
Brazil.
Source: The author.
Figure 14 – Narrow-sense individual heritability and family heritability mean for slash pine
form traits in municipalities of Ribeirão Branco and Ponta Grossa, Brazil. (BA:
branch angle, BT: branch thickness, FOR: fork, FT: fox tail, NB: number of
branches, SS: stem straightness).
Source: The author.

67
3.3.2 Effective population sizes and expected selection gains
Three-selection strategies for each site were proposed base on individual BLUP (Table
3). This form of selection, enables, according to Resende and Higa (1994), explore fractions of
additive genetic variance that are not considered in the selection among and within progenies,
leading to accuracy selection maximization, although the inclusion of plot and blocks effects
can change the selection.
Strategy I selected 80 best trees from each site with intention to establish clonal seed
orchards. In Ribeirão Branco from 44 progenies, 19 were selected based on volume and eight
for stem straightness, creating genetic diversity of 21% and 15%, respectively. In contrast, from
24 progenies in Ponta Grossa trial 15 were selected for both chosen traits, creating genetic
diversity of 31% for both (Table 3).
After applying strategy, selection gain (𝑆𝑔) was 8.65% (wood volume) and 4.04% (stem
straightness) in Ribeirão Branco and 23.52% (wood volume) and 10.52% (stem straightness).
It is notable percentage of genetic gain was greater in Ponta Grossa in relation to Ribeirão
Branco for both traits with the same selected plant number. This superiority is due to greater
genetic variation estimated at Ponta Grossa (Figure 10 and 11).
As experiment was planted in one-tree-plot design Strategy II selected two best trees
per progeny to compose the next generation of improvement. As all progenies were chosen,
genetic diversity was 100% for both local and traits (Table 3).
After thinning, 𝑆𝑔 were 4.95% (wood volume) and 1.73% (stem straightness) in
Ribeirão Branco while in Ponta Grossa were 16.09% (wood volume) and 7.63% (stem
straightness). Adoption of blander selection intensity (strategy II) within progenies decreased
the percentage of gain selection in Ribeirão Branco and Ponta Grossa trials. However, Ponta
Grossa still showed higher selection gains due to higher genetic variation.
Strategy III selected 50% of best trees per progeny, as previous selection all progenies
were selected obtaining 100% of genetic diversity (Table 5). With a bland selection there was
𝑆𝑔 decreased for all traits and sites except stem straightness in Ponta Grossa where it is possible
to see 𝑆𝐺 increment compared to other strategies.
Although intense selection, as Strategy I, of high heritability values may lead to early
elimination of important alleles (KAGEYAMA; VENCOVSKY, 1983), and result of genetic
drift in combination with selection processes (PEREIRA; VENCOVSKY, 1988), in this case
occurred increment of gain percentage. Moreover, estimative of these parameters confirm that

68
for subsequent breeding program cycles and seedling seed orchard formation it is necessary to
leave at least one tree per progeny to avoid excessive loss of variability and commitment of
genetic gain in the next cycles, as observed in increment of genetic diversity when it happened.
To form clonal and commercial plantations (as Strategies I and II) smaller selection intensities
may be adopted to avoid loss of good material. The reason, if you consider intrapopulation
recurrent selection the proposal is to increase, gradually, the frequency of desirable alleles
(HALLAUER, 1992), mainly in early selection. According to Prescher (2007), while genetic
gain increase, seed orchard produce genetically better material.
In theory, the selection made by BLUP create greater gains due to progeny effects
(PAIVA et al., 2002), but nevertheless possibility of making different selections in different
sites should be taking into consideration which would provide greater efficiency of genetic gain
maintaining high genetic diversity, fundamental premise for breeding.
Table 3 – Selection strategies based on wood volume (VOL) and stem straightness (SS) for
slash pine progenies in municipalities of Ribeirão Branco and Ponta Grossa, Brazil
at five and four years old respectively. Strategy: I) Individual selection of 80 best
trees; II) best two individuals per progeny and III) best 50% individuals per progeny.
Site Traits 𝑁
𝑆𝐼 (%)
𝑁𝑓𝑜 𝑁𝑓 𝑘𝑓 𝜎𝑘𝑓2 𝑁𝑒 𝑀𝐸𝐼
𝑆𝐺
(%) �̂� �̅�
I
Ribeirão
Branco
Vol 80 4.8 44 19 4.21 19.18 13.43 0.009 8.65 0.21 0.104
SS 80 4.8 44 8 10.00 21.43 17.80 0.121 4.04 0.15 3.00
Ponta
Grossa
Vol 80 16.1 24 15 5.33 30.52 11.37 0.012 23.52 0.31 0.053
SS 80 16.1 24 15 5.33 20.52 15.7 0.466 10.52 0.37 4.43
II
Ribeirão
Branco
Vol 88 5.2 44 44 2.00 0.00 70.40 0.005 4.95 1.00 0.103
SS 88 5.2 44 44 2.00 0.00 70.40 0.051 1.73 1.00 2.99
Ponta
Grossa
Vol 48 9.7 24 24 2.00 0.00 38.40 0.009 16.09 1.00 0.055
SS 48 9.7 24 24 2.00 0.00 38.40 0.356 7.63 1.00 4.67
III
Ribeirão
Branco
Vol 828 50.0 44 44 18.82 0.48 151.42 0.004 4.42 1.00 0.10
SS 828 50.0 44 44 18.82 0.48 151.42 0.029 1.17 1.00 2.50
Ponta
Grossa
Vol 246 50.0 24 24 10.13 2.46 71.07 0.002 5.07 1.00 0.037
SS 246 50.0 24 24 10.25 2.11 71.75 0.621 13.80 1.00 4.50
Number of selected trees (𝑁); selection intensity (𝑆𝐼); original number of progenies (𝑁𝑓𝑜 ); number of selected
progenies (𝑁𝑓); number of selected individuals per progeny (𝑘𝑓); variance of number of selected individuals per
progeny (𝜎𝑘𝑓2 ); effective number (𝑁𝑒); a: additive genetic effect = 𝑀𝐸𝐼: multi-effect index; selection gain (𝑆𝐺(%));
genetic diversity (�̂�); general mean (�̂�). Source: The author.

69
3.3.3 Age-age and trait-trait genetic and phenotypic correlation
Coefficients of genetic correlation (Figure 15) were positive and significant for all
evaluated pairs of growth traits ranging from 0.60 to 0.96 for different ages in Ribeirão Branco.
However, form traits presented genetic correlation values with low to moderate magnitude,
positive and negative, it include non-significant variables. Ponta Grossa presented positive and
significant genetic correlation coefficients for all pairs of growth traits with values between
0.80 and 0.97. Most of pairs with form traits showed negative genetic correlation and some not
significant among it.
Figure 15 – Estimates of genetic correlations (Ponta Grossa = above the diagonal, Ribeirão
Branco = below the diagonal) between growth and forms traits for Slash pine
progenies in Brazil.
H1, H2, H3, H4 and H5 = height at one, two, three, four and five years after planting; DBH3, DBH4 and DBH5 =
diameter at breast height at three, four and five years after planting; VOL3, VOL4 and VOL5 = wood volume at
three, four and five years after planting; SS = stem straightness; BT = branch thickness; BA = branch angle; NB =
number of branches; FOR = fork. Source: The author.

70
High and significant genetic correlation values between different assessments of height
and dbh in early age indicate that both traits are controlled by the same group of genes and
allows a great reliability in the early selection. According to Phillips et al. (2013) and Sant’Ana
et al. (2013), when the selection is made on traits with positive and high magnitude correlation
it is possible to achieve high correlated response occurring an advantage on selection.
Favourable genetic correlations were found between the growth traits and stem
straightness and fork indicating the selection of trees with high growth rate will result in trees
straighter stems and no fork. These results have a practical implication, especially when the
purpose is wood for sawing. Opposite result was found by Adams and Bastien (1994) in
Douglas fir progenies and Cumbie, Isik and McKeand (2012) and Xiong et al. (2014) for
Loblolly pine.
Fork and stem straightness had desirable genetic correlations only for Ponta Grossa. It
means straightest trees will have less probability to present fork. Similar results were found in
loblolly pine by Xiong et al. (2010). For the same authors, positive genetic correlation between
traits imply that improvement of one trait can automatically lead to the improvement of the
other one.
Phenotypic correlations were strongly positive and significant between pairs of growth
traits to both sites (Figure 16). Exception was noted among fork and growth traits in Ribeirão
Branco. Selection on one trait of a pair that is controlled by genetic correlation caused by
pleiotropic effects will also stimulate response in unselected trait. Since the correlations we
report here are possibly of this nature, truncation selection to improve height or dbh in slash
pine is expected to cause increased wood volume (ROBERDS et al., 2003).
Genetic correlations were mostly higher than phenotypic correlations to both sites.
According Gwaze (2009), models based on phenotypic correlations will underestimate the
genetic progress and unnecessarily delay selection. Similar results have also shown that
difference in other species of conifers as Loblolly pine (GWAZE; BRIDGWATER, 2002) and
Jack pine (RIEMENSCHNEIDER, 1988).
For that reason, genetic correlations are important for making decision in forest breeding
programs because, breeders can know if a trait can affect the improvement of another.
Evaluation of genetic correlation between characters is needed to determine whether there will
be favourable or unfavourable benefits for breeding program and if these correlations are
required for the determination of multi-trait selection index (ATWOOD; WHITE; HUBER,
2002).

71
Figure 16 – Estimates of phenotypic correlations (Ponta Grossa = above the diagonal, Ribeirão
Branco = below the diagonal) between growth and forms traits for Slash pine
progenies in Brazil.
H1, H2, H3, H4 and H5 = height at one, two, three, four and five years after planting; DBH3, DBH4 and DBH5 =
diameter at breast height at three, four and five years after planting; VOL3, VOL4 and VOL5 = wood volume at
three, four and five years after planting; SS = stem straightness; BT = branch thickness; BA = branch angle; NB =
number of branches; FOR = fork. Source: The author.
3.3.4 Joint analysis
Likelihood ratio test (LRT) was significant only for height and wood volume for
conjoint analysis, indicating that there are genetic differences for slash pine progenies in both
sites (Table 4).
Individual narrow-sense heritability (ℎ𝑎2) in the combined analysis showed low
magnitude for all traits (Table 4), reaffirming the differences between trees at sites. On the other
hand, the estimate family heritability mean level (ℎ𝑚2 ) were high (> 0.53 - dbh, and SS) implying
that most of total variation observed is from genetic origin leading to high estimates accuracy

72
(𝑟â𝑎) at conjoint analysis (> 0.73 - dbh and SS). These values show high genetic control and
efficiency in a general selection involving two experiments, in case conjoint analysis be adopt
as base.
Coefficients of genotype x environment interaction ( ), which quantifies the portion
of the total variation (phenotypic), which is represented by the variation of G x E interaction,
showed low values for all traits. However, led to high magnitude of genetic correlation between
the performance of progeny and environments (𝑟𝑏 – type b correlation) (Table 4), suggesting
low G x E interaction.
Type b genetic correlations estimate genotypic performance correlation in different
environments and provide an indication of the importance of G x E interaction (MCKEAND et
al., 2006). Mulder et al. (2006) and Raymond (2011) affirm type b correlation levels should be
greater than 0.60 to suggest an improvement level. Therefore, the situation is very favourable
for application selection in both sites, in this case, height, dbh and stem. Similarly, Hodge and
White (1992) and Dieters et al. (1995) also found type b correlation values greater than 0.60 in
five years old slash pine progenies. The same way, Jayawickrama (2001) and Baltunis and
Brawner (2010) reported relatively high type-b genetic correlations in New Zealand, for
different radiata pine progenies sites, for most important traits demonstrating open-pollinated
progenies are well protected against environmental variation. However, authors affirm also that
results interpretation should be viewed carefully, mainly, if the experiments cover a
representative species plantation area.
Progeny ranking for both sites was similar being able to indicate the same progenies for
both growing region. Moraes (2013) also found type b correlation above 0.60 for height and
dbh in three progenies tests of Eucalyptus urophylla at age 12 and 24 months, concluding that
there was simple type G x E interaction. According to the authors, these results infer that
although individuals presenting different behaviour in different sites, the environment does not
affect productivity.
The coefficient of genetic variation (𝐶𝑉𝑔𝑖) was high only for wood volume (10.04%)
compared to the other traits (2.67% - height, 3.04% - dbh and 3.27% - SS) (Table 4). Martinez
et al. (2012) also observed this tendency in loblolly pine progenies for height and DBH. The
authors assert that the variance components differences between conjoint and individual
analysis is due to the fact that conjoint analysis generate average components between sites.
𝐶𝑖𝑛𝑡2

73
Table 4 – Estimate of genetic parameters and genotype x environment interaction for height,
diameter at breast height (DBH), wood volume and stem straightness (SS) in four
years old slash pine progenies in Ribeirão Branco-SP and Ponta Grossa-PR, Brazil.
Height DBH Volume SS
(m) (cm) (m3 tree-1)
ℎ𝑎2 0.03 (±0.01) 0.02 (±0.01) 0.05 (±0.01) 0.02 (±0.01)
ℎ𝑚2 0.60 0.53 0.62 0.53
𝑟â𝑎 0.77 0.73 0.79 0.73
𝐶𝑖𝑛𝑡2 0.01 0.01 0.04 0.00
𝑟𝑏 0.72 0.61 0.58 0.89
𝐶𝑉𝑔𝑖(%) 2.67 3.04 10.04 3.27
𝐶𝑉𝑒(%) 15.57 19.42 41.93 25.23
µ 5.86 10.92 0.03 2.10
LRT 4.24* 3.00ns 5.13* 3.16ns
Narrow sense individual heritability (ℎ𝑎2); average heritability of progenies (ℎ𝑚
2 ); accuracy (𝑟â𝑎); coefficient of
determination of genotype x environment interaction (𝐶𝑖𝑛𝑡2 ); genetic correlation between progenies between sites
– type b correlation (𝑟𝑏); coefficient of individual additive genetic variation (CVgi); coefficient of residual variation
(CVe); general mean (µ); likelihood ratio test (LRT); significant to 1% (*) with 1 degree of freedom; (ns) not
significant. Source: The author.
3.3.5 Productivity, stability and adaptability
If the four best progenies were taken into consideration (E-197, E-189-1, E-084-2 and
E-032-2) there is 100% of coincidence based on the adaptability (PRVG), stability (MHVG)
and adaptability, stability and productivity criteria simultaneously (MHPRVG) for wood
volume (Table 5). Although the selection order of 24 tested progenies at two sites is not exactly
the same, the best progenies agreed for conjoint analysis, revealing that the most productive
progenies are the most stable and high adaptability. The PRVG and MHPRVG values indicate
the average genotype superiority in relation to the environmental in which it is grown
(RESENDE, 2007b; ZENI NETO et al., 2008). For example, the best progeny (E-197) for wood
production showed superiority over 1.27 times the average of environment in which it is
located. MHPRVG * MH value shows the average genotypic value of the progenies in the two
sites, and this amount has already been penalized by instability and capitalized by adaptability
(CARBONELL et al. 2007). According to Gonçalves et al. (2003), environmental variations
can interfere at G x E interactions, thus it is important and necessary to identify stable genotypes
that produce well in various conditions.
In general, there were not many changes in the ordering of progenies (79% of
coincidence). This is due to the high correlation of progeny genetic behaviour on sites,
therefore, it is suggested that the MHVG, PRVG and MHPRVG methods present ranking

74
agreement for progenies and the use of this selection criteria confer improvement of selection
in deducting secure genetic values predictions and concomitantly for productivity, stability and
adaptability (PINTO JUNIOR et al, 2006;. RESENDE, 2007b).
For inferences about the expected productivity, the genotypic values should be
considered as the characteristics of the planting site. If plantings are carried out in several other
sites with varying G x E interaction patterns it should be considered the genotypic values
(genetic means) for sites average, penalized by instability and capitalized by the adaptability
(MHPRVG). In addition to these, MHVG values should be considered if the planting is done
in others unknown sites or with different interaction of experimental network pattern or high
heterogeneity within sites. If the sites present the same G x E interaction pattern of planting
environment should be based on the sites average in order to capitalize the responsiveness of
each progeny in relation to environment improving, PRVG values will be prioritized. For
planting in the same sites of the experiments consider the genotypic values (genetic means) of
each local (individual analysis).
Taking everything into consideration, it is important to test a major number of progenies
in major number of sites as possible to verify adaptability and stability of them in relation to
next breeding cycles. With this practice will be possible to create plantations zones which could
decreased time and increased productivity.

75
Table 5 – Slash pine progenies selection based on wood volume for stability (MHVG),
adaptability (PRVG) and simultaneously to productivity, stability and adaptability
(MHPRVG), at four years of age in municipalities of Ribeirão Branco and Ponta
Grossa, Brazil.
Stability Adaptability Stability and adaptability
Pro MHVG Pro PRVG PRVG*MG Pro MHPRVG MH PRVG*MG
C-197 0.034 C-197 1.268 0.034 C-197 1.259 0.034
C-189-1 0.031 C-189-1 1.165 0.032 C-189-1 1.162 0.032
C-084-2 0.031 C-084-2 1.142 0.031 C-084-2 1.140 0.031
C-032-2 0.029 C-032-2 1.083 0.029 C-032-2 1.083 0.029
C-228 0.029 C-012-3 1.082 0.029 C-012-3 1.082 0.029
C-012-3 0.029 C-228 1.079 0.029 C-228 1.079 0.029
C-128-2 0.029 C-128-2 1.076 0.029 C-128-2 1.076 0.029
C-067-1 0.029 C-067-1 1.054 0.029 C-067-1 1.053 0.029
C-083-1 0.027 C-083-1 1.004 0.027 C-016-2 1.002 0.027
C-016-2 0.027 C-016-2 1.003 0.027 C-083-1 1.000 0.027
C-048-2 0.027 C-048-2 0.995 0.027 C-048-2 0.995 0.027
C-013 0.027 C-013 0.979 0.027 C-013 0.979 0.027
C-068-1 0.027 C-068-1 0.974 0.026 C-068-1 0.973 0.026
C-025-3 0.026 C-025-3 0.970 0.026 C-025-3 0.970 0.026
C-047-1 0.026 C-047-1 0.966 0.026 C-047-1 0.966 0.026
C-019-1 0.026 C-019-1 0.949 0.026 C-019-1 0.949 0.026
C-217-1 0.025 C-217-1 0.935 0.025 C-217-1 0.935 0.025
C-036-1 0.025 C-032-1 0.917 0.025 C-032-1 0.917 0.025
C-032-1 0.025 C-010-1 0.915 0.025 C-010-1 0.915 0.025
C-010-1 0.025 C-036-1 0.914 0.025 C-036-1 0.914 0.025
C-039-2 0.025 C-039-2 0.908 0.025 C-039-2 0.906 0.025
C-023-1 0.024 C-023-1 0.899 0.024 C-023-1 0.898 0.024
C-272-1 0.024 C-272-1 0.892 0.024 C-272-1 0.892 0.024
C-225 0.023 C-225 0.834 0.023 C-225 0.834 0.023 Pro = Progeny. Source: The author.

76
3.4 CONCLUSIONS
There are significant differences among open-pollinated juvenile progenies in Ribeirão
Branco and Ponta Grossa trials for growth traits in Brazil. Considerable genetic variation,
especially for wood volume was found in Ribeirão Branco (14.31% to 16.24%) and Ponta
Grossa (31.78% to 33.77%) sites as high narrow-sense individual heritability (0.36 to 0.48) for
Ponta Grossa evidencing high genetic control for the traits is significant and the possibility of
genetic gains with selection.
The percentage of selection gain based on wood volume and tem straightness were
8.65% and 4.04% (Ribeirão Branco) and 23.52% and 10.52% (Ponta Grossa) when higher
intensity is applied aiming clonal orchard formation.
Positive and significant genetic correlation were found for all evaluated pairs of growth
traits ranging from 0.60 to 0.96 for different ages in Ribeirão Branco and 0.80 and 0.97 in Ponta
Grossa. In relation to form traits it was found values with low to moderate magnitude, positive
and negative for both site.
The effect of genotype x environment interaction is simple which means progenies
planted in one site can also be planted in the other.
Genotypes such as C-197, C-189-1, C-084-2 and C-032-2 are indicated to plantations
in both São Paulo and Paraná states according to stability (MHVG), adaptability (PRVG) and
simultaneously productivity, stability and adaptability (MHPRVG).

77
REFERENCES
ADAMS, W. T.; BASTIEN, J. C. Genetics of second flushing in a French plantation of
coastal Douglas-fir. Silvae Genetica, Frankfurt, v. 43, n. 5, p. 345-352, 1994.
AGUIAR, A.V.; SOUZA, V. A; SHIMIZUO, J. Y. Seleção genética de progênies de Pinus
greggii para formação de pomares de sementes. Pesquisa Agropecuária Brasileira,
Colombo, v. 30, n. 62, p. 107-117, 2010.
ARREGUI, A.; ESPINEL, S.; ARAGONÉS, A.; SIERRA DE GRADO, R. Estimación de
prámetros genéticos em um ensayo de progenies de Pinus radiata D. Don en el País Vasco.
Investigacíon Agraria: Sistemas y Recursos Forestales, Coruña, v. 8, n. 1, p. 119-128,
1999.
ALWALA, S.; KWOLEK, T.; McPHERSON, M.; PELLOW, J.; MEYER, D. Comprehensive
comparison between Eberhart and Russell joint regression and GGE biplot analyses to
identify stable and high yielding maize hybrids. Field Crops Research, New York, v. 119, n.
2, p. 225-230, 2010.
ATWOOD, R. A.; WHITE, T. L.; HUBER, D. A. Genetic parameters and gain for growth and
wood properties in Florida source loblolly pine in the southeastern United State. Canadian
Journal of Forest Research, Ottawa, v. 32, n. 5, p. 1025-1038, 2002.
BALTUNIS, B. S.; BRAWNER, J. T. Clonal stability in Pinus radiata across New Zealand
and Australia. I. Growth and form traits. New Forests, Houten, v. 40, n. 3, p. 305-322, 2010.
CARBONELL, S. A. M.; CHIORATO, A. F.; RESENDE, M. D. V.; DIAS, L. A. S;
BERALDO, A. L. A; PERINA, E. F. Estabilidade em cultivares e linhagens de feijoeiro e
diferentes ambientes no estado de São Paulo. Bragantia, Campinas, v. 66, n. 2, p. 193-201,
2007.
CODESIDO, V.; FERNÁNDEZ-LÓPEZ, J. Juvenile genetic parameter estimates for vigour,
stem form, branching habit and survival in three radiate pine (Pinus radiate D. Don) progeny
test in Galicia, NW Spain. European Journal of Forest Research, Heidelberg, v. 127, n. 4,
p. 315-325, 2008.
COTTERILL, P. P.; ZED, P. G. Estimates of genetic parameters for growth and form traits in
four Pinus radiata D. Don progeny tests in South Australia. Australian Forest Research,
Melbourne, v. 10, n. 2, p. 155–167, 1980.
CRUZ, C. D. Programa genes: análise multivariada e simulação. Viçosa: UFV, 2006.
CRUZ, C. D.; REGAZZI, A. J.; CARNEIRO, P. C. S. Modelos biométricos aplicados ao
melhoramento genético. 3. ed. Viçosa: UFV, 2004.
CUMBIE, W. P.; ISIK, F.; MCKEAND, S. E. Genetic improvement of saw timber potential
in loblolly pine. Forest Science, Bethesda, v. 58, n. 2, p. 168-177, 2012.

78
DIETERS, M. J. Genetic parameters fos slash pine (Pinus elliottii) grown in south-east
Queensland, Australia: Growth, steam straightness and crown defects. Forest Genetics,
Zvolen, v. 3, n. 1, p. 27-36, 1996.
DIETERS, M. J.; WHITE, T. L.; HODGE, G. R. Genetic parameter estimates for volume
from full-sib testes of slash pine (Pinus elliottii). Canadian Journal of Forest Research,
Ottawa, v. 25, n. 5, p. 1397-1408, 1995.
DORMAN, K. W.; SQUILLACE, A. E. Genetics of Slash Pine. USDA Forest Service
Research Paper, Utah, v. 20, n. 1, p. 01-20, 1974.
ESPINEL, S.; ARAGONÉS, A. Genetic parameters for Pinus radiata D.Don in Basque
Country. New Zealand Journal Forestry Science, Rotorua, v. 27, n. 3, p. 272–279, 1997.
ETTORI, L. C. Variação genética em procedências e progênies mexicanas de Pinus
maximinoi. Revista do Instituto Florestal, São Paulo, v. 16, n. 1, p. 01-09, 2004.
FALCONER, D. S.; MACKAY, T. F. C. Introduction to quantitative genetics. London:
Longman Group, 1996.
FRIES, A. Genetic parameters, genetic gain and correlated responses in growth, fibre
dimensions and wood density in a Scots pine breeding population. Annals of Forest Science,
Paris, v. 69, n. 1, p.783-794, 2012.
FONSECA, S. M.; JACOB, W. S.; KAGEYAMA, P. Y.; FERREIRA, M. Síntese do
programa de melhoramento genético de Pinus spp. que vem sendo conduzido sob a
coordenação do IPEF, na região sul do Brasil. Boletim Informativo do IPEF, Piracicaba,
1978.
GAPARE, W. J.; IVKOVIĆ, M.; DUTKOWSKI, G. W.; SPENCER, D. J.; BUXTON, P.;
WU, H. X. Genetic parameters and provenance variation of Pinus radiata D. Don. ‘Eldridge
collection’ in Australia 1: growth and form traits. Tree Genetics & Genomes, Heidelberg, v.
8, n. 1, p. 391-407, 2012.
GONÇALVES, P. S.; BORTOLETTO, N.; FONSECA, F. S.; BATAGLIA, O. C.;
ORTOLONI, A. A. Early selection for growth vigor in rubber tree genotypes in northwestern
São Paulo state (Brazil). Genetics and Molecular Biology, Ribeirão Preto, v. 21, n. 4, p. 620-630, 1998.
GONÇALVES, P. S.; Nelson BORTOLETTO, N.; MARTINS, A.L.M.; COSTA, R. B.;
GALLO, P. B. Genotype-environment interaction and phenotypic stability for girth growth
and rubber yield of Hevea clones in São Paulo State, Brazil. Genetics and Molecular
Biology, Ribeirão Preto, v. 26, n. 4, p. 441-448, 2003.
GWAZE, D. P. Optimum selection age for height in shortleaf pine. New Forests, Dordrecht,
v. 37, n. 1, p. 9-16, 2009.
GWAZE, D. P.; BRIDGWATER, F. E. Determining optimum selection age for diameter and
height in loblolly pine (Pinus taeda). Forest Genetics, Bethesda, v. 9, n. 2, p. 159-165, 2002.

79
GWAZE, D. P.; WOOLLIAMS, J. A.; KANOWSKI, P. J. Genetic parameters for height and
stem straightness in Pinus taeda L. in Zimbabwe. Forest Genetics, Bethesda, v. 4, n. 2, p.
159-169, 1997.
HODGE, G. R.; WHITE, T. L. Genetic parameter estimates for growth traits at diferente ages
in slash pine na some implications for breeding. Silvae Genetica, Frankfurt, v. 41, n. 5, p.
252-262, 1992.
JAYAWICKRAMA, K. J. S. Genetic parameter estimates for radiata pine in New Zealand
and New South Wales: a synthesis of results. Silvae Genetica, Frankfurt, v. 50, n. 2, p. 45–
53, 2001.
KAGEYAMA, P. Y.; VENCOVSKY, R. Variação genética em progênies de uma população
de Eucalyptus grandis (Hill) Maiden. IPEF, Piracicaba, v. 24, p. 9-26, 1983.
LAMBETH, C. C. Juvenile-mature correlations in Pinaceae and implications for early
selection. Forest Science, Bethesda, v. 26, n. 4, p. 571–580, 1980.
MARTINEZ, D. T.; RESENDE, M. D. V.; COSTA, R.B.; HIGA, A.R.; SANTOS, G.A.;
FIER, I.S.N. Estudo da interação genótipo x ambiente em progênies de Pinus taeda por meio
da análise de parâmetros genéticos. Revista Floresta, Curitiba, v. 42, n. 3, p. 539-552, 2012.
MATHESON, A.; SPENCER, D. J.; MAGNUSSEN, D. Optimum age for selection in Pinus
radiata using basal area under bark for age-age correlations. Silvae Genetica, Frankfurt, v.
43, n. 5, p. 352–357, 1994.
MAX, J.C.M.; VILAS BÔAS, O.; SEBBENN, A. M. Altas herdabilidades e ganhos na
seleção para caracteres de crescimento em teste de progênies de polinização aberta de Pinus
elliottii Engelm var. elliottii aos 25 anos de idade em Assis–SP. Revista do Instituto
Florestal, São Paulo, v. 20, n. 2, p. 95-102, 2008.
MCKEAND, S. E. Optimum age for family selection for growth in genetic test of loblolly
pine. Forest Science, Bethesda, v. 34, n. 4, p. 400–411, 1988.
MCKEAND, S. E.; JOKELA, E. J.; HUBER, D. A.; BYRAM, T. D.; ALLEN, H. L.; LI, B.;
MULLIN, T. J. Performance of improved genotypes of loblolly pine across different soils,
climates, and silvicultural inputs. Forest Ecology and Management, Amsterdam, v. 227, n.
2, p. 178-184, 2006.
MIRANDA, A. C.; MORAES, M. L. T.; SILVA, P. H. M.; SEBBENN, A. M. Ganhos de
seleção pelo método do índice multi-efeitos em progênies polinização livre de Eucalyptus
grandis Hill ex Maiden. Scientia Forestalis, Piracicaba, v. 43, n. 105, p. 01-07, 2015.
MISSANJO, E.; KAMANGA-THOLE, G.; MANDA, V. Estimation of genetic and
phenotypic parameters for growth traits in a clonal seed orchard of Pinus kesiya in
Malawi. ISRN Forestry, New York, v. 2013, p. 1-6, 2013.
MISSIO, R. F. Variação genética em progênies de Pinus caribaea Morelet var.
bahamensis. 2004. 129 f. Mestrado (Dissertação)- Faculdade de Engenharia, Universidade
Estadual Paulista, Ilha Solteira, 2004.

80
MORAES, C. B. Variabilidade genética em progênies de polinização aberta de
Eucalyptus urophylla para tolerância ao frio. 2013. 90 f. Tese (Doutorado) -Faculdade de
Ciências Agronômicas, Universidade Estadual Paulista, Botucatu, 2013.
MOREIRA, J. M. M. A. P.; OLIVEIRA, E. B.; LIEBSCH, D.; MIKISH, S. B. Avaliação
econômica do cultivo de Pinus sp.: para um sistema de produção modal nos estados do
Paraná e Santa Catarina. Dados eletrônicos. Colombo: Embrapa Florestas, 2015.
(Documentos, 289).
MORI, E. S. Variabilidade genética em uma população de Eucalyptus grandis Hill ex
Maiden submetida a diferentes intensidades de seleção. 1993. 119 f. Tese (Doutorado) –
Escola Superior de Agricultura “Luiz de Queiroz”, Universidade de São Paulo, Piracicaba,
1993.
MULDER, H. A.; VEERKAMP, R. F.; DUCRO, B. J.; van ARENDONK, J. A.; BIJMA, P.
Optimization of dairy cattle breeding programs for different environments with genotypes by
environment interaction. Journal Dairy Science, New York, v. 89, n. 5, p. 1740-1752, 2006.
NANSON, A. Juvenile and correlated trait selection and its effect on selection programs. In:
MEETING OF WORKING GROUP ON QUANTITATIVE GENETICS – IUFRO, 2., 1970,
Louisina. Proceedings… Louisina: [s.n.], 1970. p. 17–25.
OLSSON, T.; ERICSSON, T. Genetic parameter estimates of growth and survival of Pinus
sylvestris with mixed model multiple-trait restricted maximum likelihood analysis.
Scandinavian Journal of Forest Research, Kalmar, v. 17, n. 1, p.103-110, 2002.
PAIVA, J. R.; RESENDE, M. D. V.; CORDEIRO, E. R. Índice multiefeitos (BLUP) e
estimativas de parâmetros genéticos aplicados ao melhoramento da acerola. Pesquisa
Agropecuária Brasileira, Brasília, DF, v. 37, n. 6, p. 799-807, 2002.
PEREIRA, A. B.; MARQUES JUNIOR, O. G.; RAMALHO, M. A. P.; ALTHOFF, P.
Eficiência da seleção precoce em famílias de meios-irmãos de Eucalyptus camaldulensis
Dehnh, avaliadas na região noroeste do estado de Minas Gerais. Cerne, Lavras, v. 3, n. 1, p.
67-81, 1997.
PEREIRA, M. B.; VENCOVSKY, R. Limites da seleção recorrente: 1- fatores que afetam o
acréscimo das frequências alélicas. Pesquisa Agropecuária Brasileira, Brasília, DF, v. 23, n.
7, p. 769-780, 1988.
PIMENTEL-GOMES, F.; GARCIA, C. H. Estatística aplicada a experimentos
agronômicos e florestais: exposição com exemplos e orientações para uso de aplicativos.
Piracicaba: FEALQ, 2002. 309 p.
PIMENTEL, F. G. Curso de estatística experimental. 14. ed. Piracicaba: Degaspari, 2000.
477 p.
PINTO JÚNIOR, J. E.; STURION, J. A.; RESENDE, M. D. V.; RONZELLI JÚNIOR, P.
Avaliação simultânea de produtividade, adaptabilidade e estabilidade genotípica de
Eucalyptus grandis em distintos ambientes do estado de São Paulo. Colombo: Embrapa,
2006. p. 79-108. (Boletim de Pesquisa Florestal, n. 53).

81
PRESCHER, F. Seed orchards - genetic considerations on function, management and
seed procurement. 2007. 101 f. Thesis (Ph.D in Agricultural Sciences)- Swedish University
of Agricultural Sciences, Umeå, Sweden, 2007.
PSWARAYI, I. Z.; BARNES, R. D.; BIRKS J. S.; KANOWSKI, P. J. Genetic parameter
estimate for production and quality traits of Pinus elliottii Engelm. var. elliottii Iin Zimbabwe.
Silvae Genetica, Frankfurt, v. 45, n. 4, p. 216-222, 1996.
RAYMOND. C. A. Genotype by environment interactions for Pinus radiate in New Wales,
Australia. Tree Genetics Genomes, Heidelberg, v. 7, n. 4, p. 819-83, 2011.
RESENDE, M. D. V. Matemática e estatística na análise de experimento e no
melhoramento genético. Colombo: Embrapa Florestas, 2007b. 362 p.
RESENDE, M. D. V. Software SELEGEM – REML/BLUP: sistema estatístico e seleção
genética computadorizada via modelos lineares mistos. Colombo: Embrapa Florestas, 2007a.
359 p.
RESENDE, M. D. V.; ARAÚJO, A. I.; SAMPAIO, P. T. B.; WIECHETECK, M. S. S.
Acurácia seletiva, intervalo de confiança e variância de ganhos genéticos associados a 22
métodos de seleção em Pinus caribaea var. hondurensis. Revista Floresta, Curitiba, v. 24, n.
1, p.35-45, 1995.
RESENDE, M. D. V.; HIGA, A. R. Maximização da eficiência da seleção em testes de
progênies de Eucalyptus através da utilização de todos os efeitos do modelo matemático.
Boletim de Pesquisa Florestal, Colombo, n. 28-29, p. 37-55, 1994.
RIEMENSCHNEIDER, D. E. Heritability, age-age correlations, and inferences regarding
juvenile selection in jack pine. Forest Science, Bethesda, v. 34, n. 4, p. 1076-1082, 1988.
ROBERDS, J. H.; STROM, B. L.; HAIN, F. P.; GWAZE, D. P.; MCKEAND, S. E.; LOTT,
L. H. Estimates of genetic parameters for oleoresin and growth traits in juvenile loblolly pine.
Canadian Journal of Forest Reearch, Ottawa, v. 33, p. 2469–2476, 2003.
ROMANELLI, R. C.; SEBBENN, A. M. Parâmetros genéticos e ganhos na seleção para
produção de resina em Pinus elliottii var. elliottii, no Sul do Estado de São Paulo. Revista do
Instituto Florestal, São Paulo, v. 16, n. 1, p. 11-23, 2004.
SANT’ANA, V. Z.; FREITAS, M. L. M.; MORAES, M. L. T.; ZANATA, M.; ZANATTO,
A. C. S.; MORAES, M. A.; SEBBENN, A. M. Parâmetros genéticos em progênies de
polinização aberta de Enterolobium contortisiliquum (Vell.) Morong em Luiz Antonio, SP,
Brasil. Hoehnea, São Paulo, v. 40, n. 3, p. 515-520, 2013.
SCHULTZ, R. P. Loblolly pine: the ecology and culture of Loblolly pine (Pinus taeda
L.). New Orleans: USDA, Forest Service, Southern Experiment Station, 1997. 493 p.
SEBBENN, A. M.; FREITAS, M. L. M.; MORAIS, E.; ZANATTO, A. C. S. Variação
genética em procedências e progênies de Pinus patula ssp. tecunumanii no noroeste do Estado
de São. Revista do Instituto Florestal, São Paulo, v. 17, n. 1, p. 1-15, 2005.

82
SEBBENN, A. M. Variação genética em progênies de meios-irmãos de Pinus caribaea Mor.
var. bahamensis Bar. et Gol. na região de Bebedouro-SP. Revista do Instituto Florestal, São
Paulo, v. 6, n. 1, p. 63-73. 1994.
SEBBENN, A. M.; VILAS BOAS, O.; MAX, J. C. M.; FREITAS, M. L. M. Estimativa de
parâmetros genéticos e ganhos na seleção para caracteres de crescimento em teste de
progênies de Pinus caribaea var. hondurensis e var bahamensis, em Assis-SP. Revista do
Instituto Florestal, São Paulo, v. 22, n. 2, p. 279-288, 2010.
SHIMIZU, J. Y.; SPIR, I. H. Z. Seleção de Pinus elliottii pelo valor genético para alta
produção de resina. Boletim de Pesquisa Florestal, Colombo, n. 38, p. 103-117, 1999.
SILVA, G. A. P.; GOUVÊA, L. R. R.; VERARDI, C. K.; OLIVEIRA, A. L. B.;
GONÇALVES, P. S. Annual growth increment and stability of rubber yield in the tapping
phase in rubber tree clones: Implications for early selection. Industrial Crops and Products,
Amsterdam, v. 52, n. 4, p. 801-808, 2014.
SILVA, J. M.; AGUIAR, A. V.; MORI, E. S.; MORAES, M. L. T. Variação genética e ganho
esperado na seleção de progênies de Pinus caribaea var. caribaea em Selvíria, MS. Scientia
Forestalis, Piracicaba, v. 39, n. 90, p. 241-252, 2011.
SILVA, W. C. J., DUARTE, J. B. Métodos estatísticos para estudo de adaptabilidade e
estabilidade fenotípica em soja. Pesquisa Agropecuária Brasileira, Brasília, DF, v. 41, n. 1,
p. 23–30, 2006.
UNITED STATES DEPARTMENT OF AGRICULTURE – USDA. Slash Pine: Pinus
elliottii engelm. [S.l.: s.n., 200-]. Available in: < http://plants.usda.gov/plantguide/pdf/pg_piel.pdf>. Access in: 10 jan. 2016.
WENG, Y. H.; LU, P.; ADAMS, G. W.; FULLARTON, M. S.; TOSHA, K. J. Genetic
paramenters of growth and stem quality traits for jack pine second-generation progeny tested
in New Brunswick. Canadian Journal of Forest Research, Ottawa, v. 45, n. 1, p. 36-43,
2015.
WHITE, T. L.; ADAMS, W. T.; NEALE, D. B. Forest genetics. Wallingford: CAB
International, 2007.
WU, H. X.; IVKOVIĆ, M.; GAPARE, W. J.; MATHESON, A. C.; BALTUNIS, B. S.
Breeding for wood quality and profit in Pinus radiata: a review of genetic parameter
estimates and implications for breeding and deployment. New Zealand Journal of Forest
Science, Rotorua, v. 38, n. 1, p. 56–87, 2008.
XIONG, J. S.; MCKEAND, S. E.; WHETTEN, R. W.; ISIK, F. T. Genetics of steam forking
and ramicorn branches in a clonal loblolly pine family. Forest Science, Bethesda, v. 60, n. 2,
p. 360-366, 2014.
XIONG. J. S.; ISIK, F. T.; MCKEAND, S. E.; WHETTEN, R. W. Genetic variation of stem
forking in loblolly pine. Forest Science, v. 56, n. 5, p. 429-436, 2010.

83
YANG, H.; LIU, T.; LIU, C.; WANG, J.; CHEN, K.; ZHONG, W.; CHEN, B.; HUANG, S.
Genetic parameters and efficiency of early selection for half rotation-aged growth and form
traits in Pinus taeda in China. Silvae Genetica, Frankfurt, v. 62, n. 6, p. 277-284, 2013.
ZENI NETO, H.; OLIVEIRA, R. A.; DAROS, E.; BESPALHOK FILHO, J. C.; ZAMBON, J.
L. C.; IDO, O. T.; WEBER, H. Seleção para produtividade, estabilidade e adaptabilidade de
clones de cana-de-açúcar em três ambientes no estado do Paraná via modelos mistos. Scientia
Agraria, Piracicaba, v. 9, n. 4, p. 425-430, 2008.
ZOBEL, B. J. Inheritance of wood properties in conifers. Silvae Genetica, Frankfurt, v. 10, n.
3, p. 67-70, 1961.

84
4 CHAPTER II
GENETIC DIVERGENCE AND TWO DIFFERENT CLUSTERING METHODS MID
SLASH PINE SECOND GENERATION PROGENIES IN EARLY AGE
ABSTRACT
The objective of this study was to estimate the genetic divergence and test two different
clustering methods in slash pine open-pollinated progenies from growth and form traits at early
age. Seeds from 44 parent trees were collected from a first generation seed orchard in Colombo,
PR, Brazil. With this material, it was established two progeny tests in a randomized complete
block. The first test was implemented in March 2009 in Ribeirão Branco, São Paulo state,
Brazil, containing 40 blocks, one tree per plot, 44 treatments (progenies) and 6 controls. The
second was established in Ponta Grossa, PR using the same experimental design and number
of plants per plot with 24 treatments, 32 repetitions. The 3.0 x 3.0 meters spacing has been
adopted in both tests. We evaluated growth traits as total height, diameter at breast height and
wood volume in the five years following planting. Form traits as stem straightness, stem
thickness, branch angle, number of branches, fork, survival and fox tail were evaluated only for
five years after planting. The genetic divergence was estimated from Mahalanobis distance.
Based on matrices of distances were applied and compared two methods of hierarchical
groupings UPGMA method (Unweighted Pair Group Method using Arithmetical Averages) and
Tocher optimization. There was agreement between clustering methods. Five and ten groups
were identified by UPGMA and Tocher grouping respectively for Ribeirão Branco and Ponta
Grossa. For breeding programs, it is recommended to cross-divergent groups progenies to
increase genetic variation and genetic gain in subsequent generations.
Keywords: Pinus elliottii Engelm. var. elliottii. Mahalanobis distance. UPGMA. Tocher
optimization.

85
RESUMO
O objetivo deste trabalho foi estimar a divergência genética e testar dois diferentes métodos de
agrupamento em progênies de polinização aberta de segunda geração de P. elliottii var. elliottii
a partir caracteres de crescimento e forma em idade precoce. Sementes de 44 árvores matrizes
foram coletadas de um pomar de sementes de primeira geração em Colombo, PR, Brasil. Com
esse material, foram estabelecidos dois testes de progênies em delineamento de blocos
completos casualizados. O primeiro teste foi implantado em março de 2009 em Ribeirão
Branco, SP, contendo 40 repetições, uma planta por parcela e 44 tratamentos (progênies) e 6
testemunhas comerciais. O segundo foi estabelecido em Ponta Grossa, PR utilizando o mesmo
delineamento experimental e número de plantas por parcela, com 24 tratamentos e 32
repetições. O espaçamento 3,0 x 3,0 metros foi adotado em ambos os testes. Foram avaliados
os caracteres de crescimento como altura total, diâmetro à altura do peito e volume de madeira
nos cinco anos subsequentes ao plantio. Os caracteres de forma de fuste, espessura de galho,
ângulo de galho, número de galhos, bifurcação, sobrevivência e fox tail foram avaliados
somente aos cinco anos após o plantio. A divergência genética foi estimada a partir da distância
generalizada de Mahalanobis. Com base nas matrizes de distâncias foram aplicados e
comparados dois métodos de agrupamentos métodos hierárquico UPGMA (Unweighted Pair
Group Method using Arithmetical Averages) e o otimização Tocher. Existe divergência
genética entre as progênies de P. elliottii avaliadas em ambos testes. Houve concordância entre
os métodos de agrupamentos. Cinco e dez grupos foram discriminados pelo agrupamento
UPGMA e Tocher, respectivamente para Ribeirão Branco e Ponta Grossa. Para programas de
melhoramento, recomenda-se o cruzamento entre progênies de grupos divergentes para
aumentar a variação genética e ganho genético nas gerações subsequentes.
Palavras-chave: Pinus elliottii Engelm. var. elliottii. Distância de Mahalanobis. UPGMA.
Otimização de Tocher.

86
4.1 INTRODUCTION
Exotic forest species were initially introduced in Brazil in order to improve economy
development for being an alternative way to native forest exploration (SAMPAIO; REZENDE;
ARAÚJO, 2000). European immigrants introduced the first pine species in the country in the
late 1936 for ornamental and wood production purpose (FIER; KIKUTI, 1993). However, this
first attempt was unsuccessful by climate difference between the two continents making these
species do not adapt well to new habitat. Subsequently, several forest species from the United
States, Mexico, Central America, Caribbean Islands and Asia have been introduced in country
(SILVA et al., 2012). Nowadays, those pine species are more important economically and more
used by forestry sector.
Among the species of this genus we can highlight slash pine (P. elliottii Engelm. var.
elliottii), tree originating from southern United States, economically important and widely
cultivated in subtropical regions of Brazil due to its plasticity and ability to adapt in different
environments (UNITED STATES DEPARTMENT OF AGRICULTURE – USDA, 2004).
Besides the good adaptability, population must present good genetic divergence to increase
genetic variability among progenies. In breeding programs, the divergence is one of the most
important parameters evaluated, especially in early age. It is possible to identify parents when
crossed, enable a higher heterotic effect (CARVALHO et al., 2003).
Genetic divergence may be estimated based on dialelics analysis, however, in perennial
plants, tend to be disadvantageous and costly. Another measure method is the predictive nature,
which is more feasible and used based on the morphological, agricultural and molecular
differences. It is performed from the clustering methods to express the degree of diversity
among progenies (CRUZ; REGAZZI; CARNEIRO, 2004). The same authors affirm predictive
methods of genetic divergence are widely used, mainly because they are based on
morphological and physiological genotypes differences, between these methods we can
mention those that quantify the genetic diversity by cluster methods such as Mahalanobis and
Euclidean generalized distances. The first offers more advantage than the second, because it
takes into account the correlation among traits, however, it is necessary experimental trials with
repetition. With distance estimates between each pair of genotype, results can be presented in
symmetric matrix, and from it can easily visualize and interpret distances through cluster
methods or dispersion graphic (CRUZ; REGAZZI; CARNEIRO, 2004). Several authors
demonstrate the feasibility of Mahalanobis distance as a way to parent’s choice (MALUF;

87
FERREIRA; MIRANDA, 1983; DIAS; KAGEYAMA, 1997; MACHADO et al., 2002;
SUINAGA et al., 2003).
Cluster methods tend to separate a group of initial observations in multiple subgroups in
order to obtain similarity and distinguish between subgroups, hierarchical and optimization are
the most common in plant breeding (BERTAN et al., 2006). In relation to hierarchical methods,
progenies are grouped by a series of methods which are reproduced in various levels
establishing a dendrograma, without number of groups regardless. The representation of cluster
structure can be made by different methods, as average distance between all pairs of progenies,
called method of average distance (UPGMA) (CRUZ; REGAZZI; CARNEIRO, 2004). The
optimization methods, on the other hand, formed groups by improving certain clustering criteria
what differ from the first one by the fact that it creates another specific groups. In the
optimization method proposed by Tocher, criteria used is to maintain the average distance
always lower intragroup at any distance groups (RAO, 1952; CRUZ; REGAZZI; CARNEIRO,
2004).
The genetic diversity is of great importance for plant breeding, therefore, adequately
explored, it can reduce vulnerability to diseases and at the same time accelerate genetic progress
for certain trait (CUI et al., 2001). More divergent are the parents, greater is resulting variability
at segregating population, and greater the probability to regroup alleles in new favourable
combinations (MANFIO et al., 2012). Thus, the objective of this study was to estimate the
genetic distance among slash pine progenies and compare two clustering methods through
growth and form traits by multivariate procedures in order to guide future control pollination
in breeding programs aiming wood production.
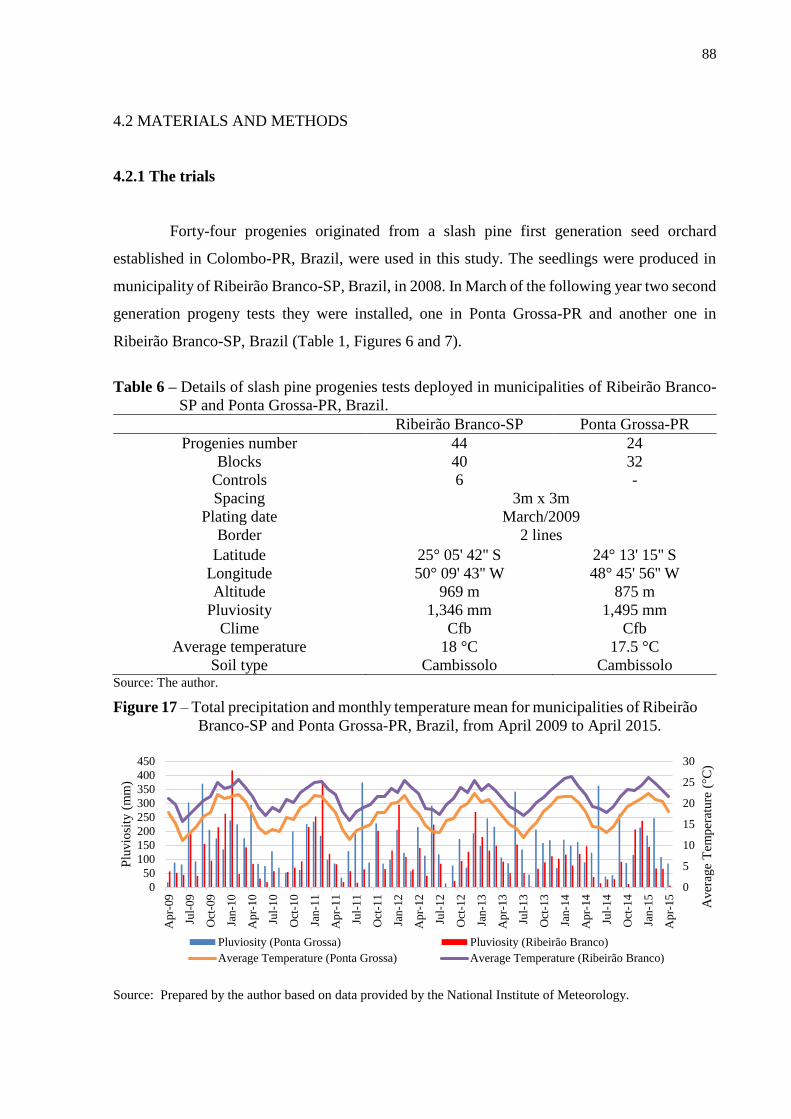
88
4.2 MATERIALS AND METHODS
4.2.1 The trials
Forty-four progenies originated from a slash pine first generation seed orchard
established in Colombo-PR, Brazil, were used in this study. The seedlings were produced in
municipality of Ribeirão Branco-SP, Brazil, in 2008. In March of the following year two second
generation progeny tests they were installed, one in Ponta Grossa-PR and another one in
Ribeirão Branco-SP, Brazil (Table 1, Figures 6 and 7).
Table 6 – Details of slash pine progenies tests deployed in municipalities of Ribeirão Branco-
SP and Ponta Grossa-PR, Brazil.
Ribeirão Branco-SP Ponta Grossa-PR
Progenies number 44 24
Blocks 40 32
Controls 6 -
Spacing 3m x 3m
Plating date March/2009
Border 2 lines
Latitude 25° 05' 42'' S 24° 13' 15'' S
Longitude 50° 09' 43'' W 48° 45' 56'' W
Altitude 969 m 875 m
Pluviosity 1,346 mm 1,495 mm
Clime Cfb Cfb
Average temperature 18 °C 17.5 °C
Soil type Cambissolo Cambissolo Source: The author.
Figure 17 – Total precipitation and monthly temperature mean for municipalities of Ribeirão
Branco-SP and Ponta Grossa-PR, Brazil, from April 2009 to April 2015.
Source: Prepared by the author based on data provided by the National Institute of Meteorology.
0
5
10
15
20
25
30
0
50
100
150
200
250
300
350
400
450
Ap
r-09
Jul-
09
Oct
-09
Jan
-10
Ap
r-10
Jul-
10
Oct
-10
Jan
-11
Ap
r-11
Jul-
11
Oct
-11
Jan
-12
Ap
r-12
Jul-
12
Oct
-12
Jan
-13
Ap
r-13
Jul-
13
Oct
-13
Jan
-14
Ap
r-14
Jul-
14
Oct
-14
Jan
-15
Ap
r-15
Aver
age
Tem
per
ature
(°C
)
Plu
vio
sity
(m
m)
Pluviosity (Ponta Grossa) Pluviosity (Ribeirão Branco)
Average Temperature (Ponta Grossa) Average Temperature (Ribeirão Branco)

89
Figure 18 – Geographical localization of municipalities of Ribeirão Branco-
SP and Ponta Grossa-PR, respectively, in Brazil.
Source: IBGE cartographic base, adapted by Ananda Aguiar and the author.
4.2.2 Traits measurement
Data was obtained within five years after planting and traits were: survival rate; total
height, diameter at breast height (dbh) and wood volume, computed based on the total height
of data and diameter at breast height, according to the following equation:
𝑉𝑂𝐿 =𝜋(𝐷𝐵𝐻)2.𝐹𝐹
40000 𝑇𝐻 (15)
Where VOL was wood volume, dbh was the diameter at breast height, FF was the stem
form factor and TH was total height. The height trait was measured using a telescopic ruler,
circumference at breast height was measured with a tape calculating from these values the
diameter at breast height and survival was adopted "1" to alive and "0" to dead plants. Form
traits were visually scored as follows (Table 2).

90
Table 7 – Scoring for form traits of slash pine progenies in municipalities of Ribeirão Branco
and Ponta Grossa, Brazil.
Scale Description
Traits Ribeirão Ponta Ribeirão Ponta
Branco Grossa Branco Grossa
Stem straightness 1-3 1-5
1 = most crooked
steams, 3 = straightest
stems
1 = most crooked
steams, 5 =
straightest stems
Branch thickness 1-3 1 = thicker, 3 = thinner
Branch angle 1-3 1 = less than 45º, 2 = greater than 45º and 3 =
approximately 90º
Number of branches 1-7 1 = 42 to 48 branches, 7
= 1 to 6 branches
1 = 17 to 18
branches, 7 = 0 to 2
branches
Fork 1 and 2 “1” for absence and “2” for presence
Fox tail (only for Ponta
Grossa trial)
1 and 2 “1” for absence and “2” for presence
Source: The author.
4.2.3 Estimates of genetic divergence
Genetic diversity among progenies was estimated by Generalized Mahalanobis Distance
(D2), and this methodology suitable for quantitative data analysis by considering the standard
deviation and invariant scale. Thus, D2 is estimated by expression (CRUZ; REGAZZI;
CARNEIRO, 2004):
(16)
Where:
= Mahalanobis distance between genotype i and i’;
= [d1, d2, ..., dv], where 𝑑𝑗 = 𝑌𝑖𝑗 − 𝑌𝑖′𝑗;
= residual variance and covariance matrices;
𝑌𝑖𝑗 = average of the ith genotype with respect to the ith variable.
In quantitative data analysis, this methodology is appropriate for considering the
variances matrices and residual covariances between measured traits.
With Mahalanobis distance matrix estimated by genetic statistical software SELEGEN-
REML / BLUP (RESENDE, 2007) we can build a hierarchical structure dendrogram format by
the average distance method (UPGMA - Unweighted Pair Group Method using Arithmetical
Averages). To carry out this analysis we used the statistical software R version 3.2.0.
12
'ii 'D
2
'iiD
'

91
With getting D2, Tocher optimization method was applied, in order to recognize groups
of homogeneous genotypes. This method adopt average D2 values (intracluster) criteria and
must be lower than the D2 values (inter-cluster) (CRUZ; REGAZZI; CARNEIRO, 2004).

92
4.3 RESULTS AND DISCUSSION
4.3.1 Generalized Mahalanobis distance
Mahalanobis generalized quantitative distances (D2) between pairs of slash pine
progenies varied from 7.59 to 72.38 and from 10.34 to 41.63 for Ribeirão Branco and Ponta
Grossa, respectively. The maximum distance between progenies in Ribeirão Branco was
observed between C-053-1/C-197 and the minimum between C-084-2/C-112-1 (Appendix 15).
For better understanding results, we consider the maximum distance as 100% and the minimum
distance as 10.5% of it which means closer individuals (Table 8). In Ponta Grossa, the
maximum distance was between progenies C-047-1 and C-023-1 and the minimum distance
was between C-084-2 and C-025-3 (Appendix 16). The same way as in Ribeirão Branco, the
minimum distance would correspond to 24.8% of it (Table 9). As noticed, progenies in Ribeirão
Branco presented bigger distances among them in relation to Ponta Grossa. This difference can
be due to the number of progenies in each site, Ribeirão Branco has got 44 progenies and Ponta
Grossa 24. Based on these results individuals will be selected according to their superior genetic
divergence and production performance and/or greater genotypic value to make controlled
crossings. Thus, cross between C-197 x C-053-1 and C-047-1 x C-023-1 could perform better
other progeny pairs. These combinations should be exploited for future hybridization,
especially for detailed studies of heterosis effects on quantitative traits.
For Martins, Pires and Oliveira (2002), the choice of crossed individuals based only on
their genetic divergence, without taking into account their performance, must be avoided. The
most appropriate, according to the authors, is to recommend crossings between divergent
individuals that exhibit higher performances to main features. Checking progeny rank (Table
10) it is possible to notice that the most distant progenies are not the most productive for wood
volume in both sites. In this case it is better to consider the choices between the most distant
and the most productive individuals. However, this comparison should be cautious as the
genetic divergence takes into account all traits.
Estimates of distance measures, obtained by Mahalanobis generalized quantitative
distances for slash pine in both sites were higher than observed by Silva et al. (2012) for Pinus
caribaea var. caribaea at age 14 without and with thinning; Missio, Moraes and Dias (2007)
for Pinus caribaea var. bahamensis at age 13 also without and with thinning; and Santos et al.
(2016) for Pinus caribaea var. hondurensis in relation to Ribeirão Branco. It is possible to note

93
that the current material with five years of age presents more genetic divergence than older
materials.
According to Dias and Kageyama (1997), pairs of greater genetic divergence guides the
hybridization process. Thus, pairs more divergent must be used for generating more heterosis,
while less divergent, differentiated primarily by transferred gene allow recover recurrent parent
quickly through backcross. Heterosis is dependent on the presence of directional dominance,
epistasis and allele frequency differences. Heterotic groups in cross-pollinated species have
been created and enhanced by creating groups and families that differ in allele frequencies in
genes affecting target trait (BETRÁN; MORENO-GONZÁLEZ; ROMAGOSA, 2009). In
addition to this, hybrid superiority may ascend by heterosis, epistasis and also by trait
complementarity. Complementarity is found over additive effects and results from independent
traits synergy according to particular environments where parents are less well adapted than
their hybrid, in addition to these, it may happen when non divergent individuals are crossed to
forest species (NICHOLAS 1987; SEDGLEY; GRIFFIN 1989; MARTIN 1989).
It is important to notice the relative contribution of each trait for the genetic divergence
has got great importance to identify the traits with highest contribution and also to assist in the
disposal of those which contribute less to genotypes discrimination, reducing, thus, manpower,
time and cost spent on experimentation (CORREA; CONÇALVES, 2012).

94
Table 8 – Generalized Mahalanobis Distance (D2) in percentage between slash pine progenies
in municipality of Ribeirão Branco-SP, Brazil in relation to grater progeny distance.
D2 Mahalanobis
Distance
Progeny Greater
(%) Progeny
Smaller
(%) Progeny Progeny
Greater
(%) Progeny
Smaller
(%) Progeny
C-016-2 72.6 C-098-1 23.0 C-013 C-032-1 65.6 C-081-3 28.6 C-025-3
C-082-1 61.6 C-047-1 19.9 C-084-2 C-068-1 59.6 C-159-1 27.2 C-063-2
C-082-1 73.2 C-071-1 18.3 C-032-2 C-053-1 71.8 C-217-1 30.9 C-048-2
C-074-2 65.2 C-010-1 18.6 C-045-1 C-053-1 75.2 C-048-2 24.9 C-059-1
C-082-1 61.3 C-023-1 21.4 C-112-1 C-053-1 65.2 C-272-1 21.3 C-043-3
C-053-1 70.4 C-100-2 23.7 C-001-1 C-053-1 62.0 C-128-2 62.0 C-053-1
C-197 55.1 C-084-2 10.5 C-112-1 C-053-1 65.5 C-032-1 35.8 C-043-3
C-082-1 59,7 C-120-1 59.7 C-082-1 C-063-2 55.76 C-053-1 48.5 C-032-2
C-053-1 69.3 C-036-1 18.7 C-048-2 C-047-2 77.0 C-068-1 33.5 C-043-3
C-053-1 82.5 C-012-3 26.0 C-045-1 C-019-1 60.4 C-063-2 40.3 C-013
C-082-1 67.3 C-151-1 21.5 C-039-1 C-016-2 64.9 C-042-1 24.4 C-013
C-082-1 69.4 C-045-1 23.3 C-189-1 C-218-1 50.5 C-043-3 25.0 C-032-2
C-082-1 70.2 C-112-1 11.6 C-218-1 C-025-3 49.8 C-047-2 25.0 C-218-1
C-053-1 76.9 C-001-1 35.0 C-189-1 C-067-1 49.1 C-039-1 25.0 C-013
C-197 68.3 C-039-2 12.5 C-272-1 C-025-3 64.4 C-067-1 23.0 C-032-2
C-053-1 66.6 C-225 16.9 C-013 C-016-2 55.8 C-218-1 25.2 C-019-1
C-074-2 83.9 C-082-1 46.7 C-059-1 C-016-2 58.7 C-013 31.8 C-059-1
C-197 68.5 C-189-1 25.2 C-048-2 C-025-3 42.8 C-019-1 16.0 C-059-1
C-053-1 74.6 C-083-1 33.2 C-047-2 C-059-1 39.0 C-025-3 33.8 C-016-2
C-197 86.7 C-074-2 40.7 C-272-1 C-016-2 33.7 C-032-2 30.8 C-059-1
C-068-1 65.8 C-228 22.3 C-047-2 C-059-1 25.9 C-016-2
C-053-1 100.0 C-197 52.3 C-272-1
Maximum: 100.0 progenies: C-053-1 and C-197
Minimum: 10.5 progenies: C-084-2 and C-112-1
Source: The author.
Table 9 – Generalized Mahalanobis Distance (D2) in percentage between slash pine progenies
in municipality of Ponta Grossa-PR, Brazil in relation to grater progeny distance.
D2 Mahalanobis
Distance
Progeny Greater
(%) Progeny
Smaller
(%) Progeny Progeny
Greater
(%) Progeny
Smaller
(%) Progeny
C-047-1 80.1 C-084-2 24.8 C-025-3 C-047-1 96.5 C-019-1 36.8 C-012-3
C-197 95.4 C-025-3 52.1 C-083-1 C-047-1 88.9 C-067-1 44,3 C-217-1
C-019-1 89.6 C-010-1 46.5 C-016-2 C-047-1 67.1 C-012-3 32.5 C-083-1
C-039-2 94.2 C-068-1 48.0 C-032-1 C-047-1 83.0 C-225 62.0 C-228
C-047-1 81.7 C-016-2 34.5 C-012-3 C-189-1 85.6 C-036-1 60.9 C-083-1
C-128-2 85.7 C-272-1 37.1 C-083-1 C-047-1 93.0 C-228 62.0 C-083-1
C-036-1 90.7 C-128-2 53.3 C-083-1 C-048-2 93.0 C-189-1 47.0 C-083-1
C-048-2 86.5 C-032-1 30.1 C-012-3 C-047-1 68.6 C-048-2 47.3 C-083-1
C-217-1 91.4 C-013 47.4 C-067-1 C-047-1 94.5 C-197 70.7 C-217-1
C-189-1 86.3 C-032-2 44.2 C-012-3 C-047-1 75.6 C-083-1 60.6 C-217-1
C-023-1 78.3 C-039-2 14.08 C-225 C-217-1 84.4 C-047-1
C-047-1 100.0 C-023-1 33.8 C-036-1
Maximum: 100.0 progenies: C-047-1 and C-023-1
Minimum: 24.8 progenies: C-084-2 and C-025-3
Source: The author.

95
Table 10 – Progeny rank for wood volume at four years of age at Ribeirão Branco and three
years of age for Ponta Grossa, Brazil (a: additive genetic effect).
Site Rank Progeny a Gain New mean Rank Progeny a Gain New mean
Rib
erão
Bra
nco
1 C-063-2 0.0139 0.0139 0.0642 23 C-120-1 -0.0002 0.0042 0.0545
2 C-098-1 0.0098 0.0118 0.0622 24 C-012-3 -0.0003 0.0040 0.0543
3 C-228 0.0092 0.0109 0.0613 25 C-159-1 -0.0008 0.0038 0.0541
4 C-001-1 0.0090 0.0105 0.0608 26 C-013 -0.0009 0.0036 0.0539
5 C-100-2 0.0089 0.0101 0.0605 27 C-218-1 -0.0010 0.0034 0.0538
6 C-071-1 0.0071 0.0096 0.060 28 C-032-1 -0.0015 0.0033 0.0536
7 C-067-1 0.0056 0.0091 0.0594 29 C-036-1 -0.0017 0.0031 0.0534
8 C-032-2 0.0045 0.0085 0.0588 30 C-068-1 -0.0027 0.0029 0.0532
9 C-189-1 0.0042 0.0080 0.0583 31 C-043-3 -0.0028 0.0027 0.053
10 C-083-1 0.0041 0.0076 0.0580 32 C-039-2 -0.0031 0.0025 0.0529
11 C-047-2 0.0037 0.0073 0.0576 33 C-019-1 -0.0039 0.0023 0.0527
12 C-197 0.0035 0.0070 0.0573 34 C-217-1 -0.0043 0.0021 0.0525
13 C-053-1 0.0030 0.0066 0.0570 35 C-010-1 -0.0046 0.0019 0.0523
14 C-039-1 0.0028 0.0064 0.0567 36 C-025-3 -0.0050 0.0018 0.0521
15 C-084-2 0.0018 0.0061 0.0564 37 C-082-1 -0.0055 0.0016 0.0519
16 C-151-1 0.0015 0.0058 0.0561 38 C-023-1 -0.0058 0.0014 0.0517
17 C-042-1 0.0013 0.0055 0.0559 39 C-225 -0.0071 0.0011 0.0515
18 C-081-3 0.0013 0.0053 0.0556 40 C-045-1 -0.0075 0.0009 0.0513
19 C-128-2 0.0008 0.0051 0.0554 41 C-016-2 -0.0087 0.0007 0.051
20 C-047-1 0.0001 0.0048 0.0551 42 C-059-1 -0.0089 0.0005 0.0508
21 C-048-2 0.0000 0.0046 0.0549 43 C-074-2 -0.0096 0.0002 0.0506
22 C-112-1 -0.0001 0.0044 0.0547 44 C-272-1 -0.0100 0.0000 0.0503
Po
nta
Gro
ssa
1 C-197 0.0272 0.0272 0.0579 13 C-048-2 -0.0025 0.0054 0.0362
2 C-189-1 0.0157 0.0214 0.0522 14 C-068-1 -0.0040 0.0047 0.0355
3 C-084-2 0.0136 0.0188 0.0496 15 C-032-1 -0.0043 0.0041 0.0349
4 C-128-2 0.0063 0.0157 0.0464 16 C-023-1 -0.0045 0.0036 0.0344
5 C-012-3 0.0056 0.0137 0.0444 17 C-019-1 -0.0046 0.0031 0.0339
6 C-032-2 0.0039 0.0120 0.0428 18 C-217-1 -0.0048 0.0027 0.0334
7 C-016-2 0.0026 0.0107 0.0415 19 C-010-1 -0.0053 0.0023 0.0330
8 C-228 0.0024 0.0097 0.0404 20 C-083-1 -0.0055 0.0019 0.0326
9 C-067-1 0.0006 0.0087 0.0394 21 C-272-1 -0.0068 0.0015 0.0322
10 C-025-3 -0.0010 0.0077 0.0384 22 C-036-1 -0.0080 0.0010 0.0318
11 C-047-1 -0.0017 0.0068 0.0376 23 C-039-2 -0.0105 0.0005 0.0313
12 C-013 -0.0023 0.0061 0.0368 24 C-225 -0.0123 0.0000 0.0308 Source: The author.
4.3.2 Comparison between clustering methods
Based on Mahalanobis distance matrix among progenies a dendrogram by UPGMA
method was obtained. We observed the formation of five distinct groups in Ribeirão Branco

96
(Figure 19) and 10 groups in Ponta Grossa (Figure 20). In this graph it can check easily the
closest and most distant progeny that were provided by Tables 8 and 9. Coefficient of
cophenetic correlation were 0.90 and 0.76 in Ribeirão Branco and Ponta Grossa, respectively,
making good adequation between distances graphical representation and its new matrix
(ROHLF, 2000). For genetic improvement, the hierarchical method of average distance
(UPGMA) is higher than the nearest neighbour and farthest neighbour (SNEATH; SOKAL,
1973; DUDLEY, 1994).
Figure 19 – Dendrogram resulting from analysis of 44 progenies of slash pine in municipality
of Ribeirão Branco, Brazil, obtained by UPGMA clustering method based on the
Mahalanobis distance. The coefficient of cophenetic value (r) is 0.90.
Source: The author.

97
Figure 20 – Dendrogram resulting from analysis of 24 progenies of slash pine in municipality
of Ponta Grossa, Brazil, obtained by UPGMA clustering method based on the
Mahalanobis distance. The coefficient of cophenetic value (r) is 0.76.
Source: The author.
Tocher optimization method separated Ribeirão Branco progenies into five groups
(Table 11). Group I included 91% of the progenies, while Groups II, III, IV and V contemplated
2.25% of each progeny. Ponta Grossa (Table 12) formed 10 groups, group I contains 58.3% of
progenies, while group II contains 8.3% and the groups III to X have 4.2% each. As confirmed
genetic divergence among progenies in Ponta Grossa is higher than Ribeirão Branco because
formation of more distinct groups. Crosses between more productive materials and divergent
groups should be prioritized in order to increase the likelihood of obtaining high specific
combining ability and heterosis. For example, more productive trees of genotype C-197 (group
III) should be crossed with C-098-1 belonging to the group I, obtaining full-sib. Crosses
between trees of Ribeirão Branco and divergent groups of Ponta Grossa test should also be

98
prioritized. This clustering method tends to separate progenies with uniformity within group
and heterogeneity among groups, keeping the criterion that intra-group distances are always
smaller than the distances between groups. Thus, Cruz, Regazzi and Carneiro (2004)
recommend not crossing progenies of same group for not restrict the genetic variability, and
avoid loss in gain selection.
The highest distance found by Mahalanobis generalized quantitative distances (Tables
8 and 9) reveals that there is a greater variability possibly between these progenies and
comparing the results with obtained by Tocher grouping (Tables 11 and 12). We can note
progenies with greater distance are in different group, while progenies with smaller distances
belong to the same group. These groups report distances in numerical order, however, not
reveals which of arrays really are the most distant, within the same group, comparing them with
other groups.
The clustering by UPGMA method showed to be similar to Tocher method for forming
groups of more divergent genotypes. It can be observed because of progenies belonging to
groups II, III, IV and V of Tocher method in Ribeirão Branco (Table 11) were the same as those
groupings of greater distance by UPGMA (Figure 15) with the exception of C-225, C-019-1
and C-048-2 that presented different groups from each other.
Observing the mean value of each group formed by Tocher optimization, in Ribeirão
Branco we can cross individuals from group I and IV. These groups presented the greatest
means in relation to other groups and bigger than the total mean. In the same way, for Ponta
Grossa, it is recommended to cross individuals from groups IV and IX, according to group
means. In a breeding program, it is desirable to prioritize crosses between materials with high
means ad high genetic divergence among themselves in order to identify productive materials
that complement each other to use existing non-additive fraction into genetic variance
(NASCIMENTO et al., 2014).
Nikles and Griffin (1992) reported that, in addition to this, high genetic divergence is
essential for intraspecific hybrids development, also most productive performance or
complementary traits, aiming to obtain more productive hybrids and these hybrid superiority
may occur from heterosis per se, epistasis or trait complementarity (additive effect).
However, when breeding program aims to the genes recovery of recurrent parents
crosses should be done with the most similar genetically progenies. low genetic divergence,
because the use of similar progenitors basically differentiated by the gene to be transferred
allows recovery faster the recurrent parent (MORAES, 2001). The use of similar progenitors

99
basically differentiated by the gene to be transferred allows recovery faster the recurrent parent
(MORAES, 2001).
Table 11 – Groups formed by Tocher Optimization method and mean value for height (H),
diameter at breast height (DBH), wood volume (VOL) and stem straightness (SS)
at age five for slash pine progenies in municipality of Ribeirão Branco, Brazil.
GROUP PROGENIES TOTAL H DBH VOL SS
(m) (cm) (m3 tree-1)
C-098-1 C-047-1 C-071-1 C-010-1
C-023-1 C-100-2 C-084-2 C-120-1
C-036-1 C-012-3 C-151-1 C-045-1
C-112-1 C-001-1 C-039-2 C-225
I C-189-1 C-083-1 C-228 C-081-3
C-159-1 C-217-1 C-048-2 C-272-1
40
7.31
13.64
0.05
2.11
C-128-2 C-032-1 C-068-1
C-063-2 C-042-1 C-043-3 C-047-2
C-039-1 C-067-1 C-218-1 C-013
C-019-1 C-025-3 C-032-2 C-016-2
C-059-1
II C-074-2 1 6.94 12.68 0.04 2.11
III C-197 1 7.24 13.47 0.05 1.97
IV C-053-1 1 7.45 13.85 0.05 2.14
V C-082-1 1 7.13 13.06 0.05 2.31
TOTAL 44 7.25 13.34 0.05 2.15
Source: The author.
Table 12 – Groups formed by Tocher Optimization method and mean value for height (H),
diameter at breast height (DBH), wood volume (VOL) and stem straightness (SS)
at age four for slash pine progenies in municipality of Ponta Grossa, Brazil.
GROU
P PROGENIES TOTAL
H
(m)
DBH
(cm)
VOL
(m3 tree-1)
SS
C-084-2 C-025-3 C-016-2
C-272-1 C-032-1 C-032-2 C-039-2
I C-019-1 C-012-3 C-225 C-036-1 14 5.95 11.32 0.03 2.06
C-048-2 C-083-1 C-217-1
II C-013 C-067-1 2 6.02 11.44 0.03 2.10
III C-010-1 1 6.08 10.80 0.03 2.10
IV C-189-1 1 6.64 13.19 0.04 2.13
V C-128-2 1 6.38 11.85 0.03 2.04
VI C-228 1 6.13 11.96 0.03 2.05
VII C-068-1 1 5.78 11.20 0.03 1.95
VIII C-047-1 1 6.18 11.50 0.03 2.07
IX C-197 1 6.86 13.97 0,05 2.10
X C-023-1 1 5.41 10.06 0.03 2.05
TOTAL 24 6.14 11.73 0.03 2.07
Source: The author.

100
4.4 CONCLUSIONS
There is genetic divergence among slash pine progenies detected by form and growth
traits.
The most similar progenies are C-084-2 and C-112-1 in Ribeirão Branco, while in Ponta
Grossa are C-084-2 and C-025-3. The most dissimilar are C-053-1 e C-197 in the first and C-
047-1 and C-023-1 in the second planting site.
Crossings must be chosen not only by distances between formed groups, but it is
necessary to take into account the productivity rank because the most distant
individuals/progenies not always be the most productive.
By Tocher grouping method, progenies were separated into five groups in Ribeirão
Branco and ten groups in Ponta Grossa. For breeding programs, it is recommended to cross
individuals between different and more productive groups to increase genetic diversity, and
consequently genetic gain.
The clustering by UPGMA method was concordant to Tocher optimization method for
forming groups of more divergent genotypes.

101
REFERENCES
BETRÁN, J.; MORENO-GONZÁLEZ, J.; ROMAGOSA, I. Theory and application of plant
breeding for quantitative traits. In: CECCARELLI, S.; GUIMARÃES, E.P.; WELTIZIEN, E.
(Ed.) Plant breeding and farmer participation. [S.l.]: Food And Agriculture Organization
Of The United Nations – FAO, 2009.
CARVALHO, L. P.; LANZA, M. A.; FALLIERI, J.; SANTOS, J. W. Análise da divergência
genética entre acessos de banco ativo de germoplasma de algodão. Pesquisa Agropecuária
Brasileira, Brasília, DF, v. 38, n. 10, p. 1149-1155, 2003.
CORREA, A. M.; GONÇALVES, M. C. Divergência genética em genótipos de feijão comum
cultivados em Mato Grosso do Sul. Revista Ceres, Viçosa, v. 59, n. 2, p. 206-212, 2012.
CRUZ, C. D.; REGAZZI, A. J.; CARNEIRO, P.C.S. Modelos biométricos aplicados ao
melhoramento genético. Viçosa: UFV, 2004. 279 p.
CUI, Z.; THOMAS, E.; CARTER, J. R.; JOSEPH, W. B.; RANDY, W. Phenotypic diversity
of modern Chinese and North American soybean cultivars. Crop Science, Madison, n. 41, n.
6, p. 1954-1967, 2001.
DIAS, L. A.; KAGEYAMA, P. Y. Multivariate genetic divergence and hybrid performance of
cacao (Theobroma cacao L.). Revista Brasileira de Genética, Ribeirão Preto, v. 20, n. 1, p.
63-70, 1997.
DUDLEY, J. W. Comparison of genetic distance estimators using molecular marker data.
In:______. Analysis of molecular marker data. Corvallis: American Society for
Horticultural Science, Crop Science Society of America, 1994. 137 p. (Joint Plant Breeding
Symposia Series).
FIER, I. S. N.; KIKUTI, P. Perspectivas para a utilização de espécies de Pinus spp. Do
México e América Central na região de Telêmaco Borba-PR. In: CONGRESSO
FLORESTAL 98 PANAMERICANO, 1.; CONGRESSO FLORESTAL BRASILEIRO, 7.
1993, Curitiba. Proceedings... São Paulo: SBS, SBEF, 1993. v.1, p.139-143.
MACHADO, C. F.; NUNES, G. H. S.; FERREIRA, D. F.; SANTOS, J. B. Divergência
genética entre genótipos de feijoeiro a partir de técnicas multivariadas. Ciência Rural, Santa
Maria, v. 32, n. 2, p.251-258, 2002.
MALUF, W. R.; FERREIRA, P. E.; MIRANDA, J. E. C. Genetic divergence in tomatoes and
its relationship with heterosis for yield in F1 hybrids. Revista Brasileira de Genética,
Ribeirão Preto, v. 3, n. 3, p.453-460, 1983.
MANFIO, C. E.; MOTOIKE, S. Y.; RESENDE, M. D. V.; SANTOS, C. E. M.; SATO, A.Y.
Avaliação de progênies de macaúba na fase juvenil e estimativas de parâmetros genéticos e
diversidade genética. Pesquisa Florestal Brasileira, Colombo, v. 32, n. 69, p. 63-68, 2012.
MARTINS, I. S.; PIRES, I. E.; OLIVEIRA, M. C. Divergência genética em progênies de uma
população de Eucalyptus camaldulensis Dehn. Floresta e Ambiente, Rio de Janeiro, v. 9, n.
1, p. 81-89, 2002.

102
MARTIN, B. The benefits of hybridization. How do you breed for them? In ‘Breeding
Tropical Trees: Population structure and genetic improvement strategies in clonal and
seedling forestry. In: IUFRO CONFERENCE, 10. 1989, Pattaya. Proceedings… Oxford,
United Kingdom; Arlington, Virginia, USA: Oxford Forestry Institute; Winrock International,
1989, p. 79-92
MISSIO, R. F.; MORAES, M. L. T.; DIAS, L. A. S. Efeito do desbaste seletivo sobre a
divergência genética em progênies de Pinus caribaea Morelet var. bahamensis. Scientia
Forestalis, Piracicaba, v. 73, n. 1, p. 27-36, 2007.
MORAES, M. L. T. Variação genética e aplicação da análise multivariada em progênies
de Pinus caribaea var. hondurensis Barret e Golfari. 2001. 124 f. Tese (Livre Docência)–
faculdade de Engenharia, Universidade Estadual Paulista, Ilha Solteira, 2001.
NASCIMENTO, W. M. O.; GURGEL, F. L.; BHERING, L. L.; RIBEIRO, O. D. Pré-
melhoramento do camucamuzeiro: estudo de parâmetros genéticos e dissimilaridade Ceres,
Viçosa, v. 61, n. 4, p. 538-543, 2014.
NICHOLAS, F. W. Veterinary Genetics. [S.l.]. (Clarendon Press: Oxford.), 1987.
NIKLES, D. G.; GRIFFIN, A. R. Breeding hybrids of forest trees: definitions, theory, some
practical examples, and guidelines on strategy with tropical acacias. Proceedings… Canberra:
ACIAR, 1992. p. 101-109.
RAO, R. C. Advanced statistical methods in biometric research. New York: John Wiley,
1952. 390 p.
RESENDE, M. D. V. Software SELEGEM – REML/BLUP: sistema estatístico e seleção
genética computadorizada via modelos lineares mistos. Colombo: Embrapa Florestas, 2007.
359 p.
ROHLF, F. J. Ntsys-pc: numerical taxonomy and multivariate analysis system: version 2.1.
NewYork: Exeter Software, 2000. 83 p.
SAMPAIO, P. T. B.; RESENDE, M. D. V.; ARAÚJO, A. J. Estimativas de parâmetros
genéticos e métodos de seleção para o melhoramento genético de Pinus
caribaea var. hondurensis. Pesquisa Agropecuária Brasileira, Brasília, DF, v. 35, n.11, p.
2243-2253, 2000.
SANTOS, W.; ARAÚJO, E. G.; SOUZA, D. C. L.; SILVA, J. R.; RECCO, C. R. S. B.;
MORAES, M. L. T.; AGUIAR, A. V. Divergência genética entre progênies de polinização
aberta de Pinus caribaea var. hondurensis a partir de caracteres quantitativos. Pesquisa
Florestal Brasileira, Colombo, v. 38, n. 86, p. 127-133, 2016.
SEDGLEY, M.; GRIFFIN, A. R. Sexual reproduction of tree crops.[S.l.]. (Academic
Press: London.), 1989.
SILVA, J. M.; AGUIAR, A.V.; MORI, E. S.; MORAES, M. L. T. Divergência genética entre
progênies de Pinus caribaea var. caribaea com base em caracteres quantitativos. Pesquisa
Florestal Brasileira, Colombo, v. 32, n. 69, p. 69-77, 2012.

103
SNEATH, P. H. A.; SOKAL, R. R. Numerical taxonomy. San Francisco: W.R. Freeman,
1973. 573 p.
SUINAGA, F. A.; CASALI, V. W. D.; SILVA, D. J. H.; PICANÇO, M. C. Dissimilaridade
genética de fontes de resistência de Lycopersicon spp. A Tuta absoluta (Meyrick, 1917)
(Lepidoptera: Gelechidae). Revista Brasileira de Agrociência, Pelotas, v. 9, n. 4, p. 371-376,
2003.
UNITED STATES DEPARTMENT OF AGRICULTURE – USDA. Slash pine: Pinus
elliottii Engelm. [S.l.: s.n., 200-]. Available in: <
http://plants.usda.gov/plantguide/pdf/pg_piel.pdf>. Access in: 10 jan. 2016.

104
5 CHAPTER III
COMPARISON BETWEEN METODOLOGIES FOR WOOD QUALITY TRAITS IN
RADIATA PINE
ABSTRACT
We compared results of Pilodyn penetration and SilviScan analysis based on wood quality traits
aiming to evaluate if Pilodyn penetration measurements may predict wood traits. Thirty Pinus
radiata progenies were selected from Flynn, Australia, planted in 1969. Pilodyn penetration
depth (PP) was measured using a 2.0-mm diameter pin, without removing bark. The
measurements were made at approximately 1.3 m above the ground twice for each tree at age
29. For SilviScan measurements 12-mm-thick wood increment cores were collected from each
tree at breast height (1.3 m) evaluating wood density (DEN), microfibril angle (MFA) and
modulus of elasticity (MOE), beyond diameter at breast height (DBH). Deviance analysis and
narrow-sense individual heritability was applied for PP, MFA, MOE, DEN and DBH, as well
as genetic and phenotypic correlations between all measured traits and PP. There was a
significant difference (p <0.10) for DEN to ages eight, nine, 23, 24 and 27, MFA (p <0.05) from
nine to 22 years old tress, PP (p <0.01) at age 29. And there was no significant difference for
MOE and DBH. DBH ranged from 2.06 mm to 126.01 mm during the assessment years. DEN
decreased at age thee, however, increased in the last year of analysis. MFA had lower mean
values at age 29, while MOE ranged from 3.50 Gpa one year after implantation and 14.03 Gpa
at last measurement. Individual heritability for Pilodyn penetration was considered high (0.34),
as genetic correlation with wood density (-0.99), DBH (0.99) and low to moderate for MOE (-
0.61) and MFA (-0.33). Pilodyn penetration measurements showed good heritability and high
genetic correlation with wood density and moderate with MOE and MFA. It can be considered
as an effective indirect trait to evaluate genetic parameters for Radiata pine wood density.
Keywords: Pinus radiata D. Don. Wood properties. MFA. MOE. Wood density.

105
RESUMO
Comparou-se resultados de penetração do Pilodyn e análises de SilviScan baseados em
propriedades de madeira com a finalidade de avaliar se dados de penetração do Pilodyn podem
predizer caracteres de qualidade de madeira. Foram selecionadas 30 progênies de Pinus radiata
em Flynn, Austrália, plantadas em 1969. Penetração do Pilodyn (PP) foi mensurada com um
pino de ferro de 2 mm de diâmetro, sem remoção da casca, à altura do peito duas vezes por
árvore aos 29 anos de idade. Para análise no SilviScan foram retiradas amostras de 12 mm de
espessura à altura do peito, avaliando-se densidade de madeira (DEN), ângulo de microfibrilas
(AMF), módulo de elasticidade (MOE) além do diâmetro à altura do peito (DAP) de um a 29
anos. Foram realizadas análise de deviance e estimativa de herdabilidade para PP, AMF, MOE,
DEN e DAP, além de correlações genéticas e fenotípicas entre todos os caracteres mensurados
e PP. Houve diferença significativa (p<0,10) para DEN aos oito, nove, 23, 24 e 27 anos, AMF
(p<0,05) dos nove aos 22 anos, PP (p<0,01) aos 29 anos. Não houve diferença significativa para
MOE e DAP. DAP variou de 2,06 mm a 126,01 mm durante os anos de avaliação. DEN
diminuiu aos 3 anos, porém, aumentou no último ano de análise. AMF apresentou menores
médias aos 29 anos, enquanto que MOE variou de 3,50 Gpa um ano após a implantação e 14,03
Gpa aos 29 anos. A herdabilidade individual da PP foi considerada alta (0,34), assim como
correlação genética com densidade de madeira (-0,99), DAP (0,99) e baixa a moderada para
MOE (-0,61) e AMF (-0,33). A penetração do Pilodyn pode ser considerado como um
importante e efetivo caráter de avaliação de parâmetros genéticos para caracteres de qualidade
de madeira em Pinus radiata.
Palavras-chave: Pinus radiata D. Don. Propriedades de madeira. AMF. MOE. Densidade de
madeira.

106
5.1 INTRODUCTION
Analysis of quantitative genetic for coniferous species, mainly for wood properties was
mostly lead on fast developing for some important species such as Pinus taeda L. (ISIK;
MORA; SCHIMLECK, 2011; ANTONY et al., 2011), Picea abis K. (CHEN et al., 2014, 2015;
PIISPANEN et al., 2014), Picea sitchensis Bong. (KENNEDY; CAMERON; LEE, 2013),
Pinus sylvestris L. (HONG; FRIES; WU, 2014) and Pinus radiata D. Don (LI; WU, 2005;
BALTUNIS; WU, POWELL, 2007; WU et al., 2008). The last one is extensively grown as a
cultivated area tree, especially in New Zealand and Australia (LI; WU, 2005; GAPARE, 2015).
Among most important wood quality traits, it is possible to highlight wood density,
wood stiffness (measured as its modulus of elasticity), and microfibril angle. Wood density is
intensely correlated to other wood properties and growth traits. Moreover, it may determine the
capacity of biomass accumulation for each progeny and consequently affects forest carbon
sequestration performance (FUKATSU et al., 2011). Modulus of elastic (MOE) has an
important influence on mechanical timber grade. This is mainly determined by the purpose to
intensify the recovery of structural and appearance-grade products, which gives a higher
economic return (DUNGEY et al., 2006). Microfibril angle (MFA) refers to the angle between
the longitudinal wood cell centre line and the cellulose microfibril in the fibres and tracheids
secondary wall (BARNETT; BONHAM, 2004).
Nevertheless, a serious problem faced by research is how to measure wood properties.
Methods may be expensive, slow and mainly destructive (WU et al., 2010). Therefore, non-
destructive methods started to be tested and considerably reduced those limitations (WANG et
al., 2010).
Accurate measurements of wood density based on volume and weight of samples
require laboratory procedures with destructive methods, which is not applicable for monitoring
purposes. For measuring the density variation on field, a method to be applied may be the use
of an instrument called Pilodyn (MICKO et al., 1982), which is initially developed for
determining the rot degree of telephone poles (HANSEN, 2000). The Pilodyn measures the
resistance to penetration when a steel pin is introduced with a determined force through the
wood by a spring (SPRAGUE et al., 1983; GREAVES et al., 1996; LEE; CONNOLLY, 2010).
The depth penetration of the pin is indicated on the instrument and readings are correlated with
the wood density. Pilodyn does not provide density estimates, but the instrument has already
been calibrated for trees wood density measurements in several studies (MICKO et al., 1982;

107
SPRAGUE et al., 1983; WU et al., 2011; FUKATSU et al., 2011; HÖGBERG et al., 2014;
CHEN et al., 2015; MURPHY; COWN, 2015).
Another non-destructive technique widely used to estimate wood quality traits is based
on data provided by SilviScan (SHELBOURNE et al., 1997; WU et al. 2007; CIESZEWSKI et
al., 2013; HONG et al., 2015). The equipment is used to evaluate the properties of wood from
pith to the bark quickly using a combination of X-ray densitometry, X-ray diffraction and image
analysis (BALL; McCONCHIE; COWN, 2005).
The aim of this work was to evaluate whether Pilodyn penetration measurements may
predict wood density, MFA, MOE according to phenotypic and genotypic correlation with
SilviScan measurements.

108
5.2 MATERIALS AND METHODS
5.2.1 The trial
One mature genetic trial with 30 open pollinated progenies was chosen among 11 sites
across Australia and sampled for this study. Seeds of the 30 progenies were collected in 1968
from the Tallaganda seed orchard in New South Wales (BROWN, 1971). The trial was planted
in 1969 on a sand loam soil at Flynn, Victoria (38° 12’S, 140° 40’E, elevation 100 m) with an
average annual rainfall of 760 mm. The field design was completely randomized blocks with
nine replicates of 2 x 3 tree plots. This site was not thinned, as a result, competition was severe
and some trees died or stopped growing due to suppression. Therefore, only 90 non-supressed
trees from three replications (one from each plot) were selected for SilviScan analysis and 615
trees were selected for Pilodyn measurements.
5.2.2 SilviScan and Pilodyn measurements
A 12-mm-thick wood increment core was collected from each tree at breast height (1.3
m). Cores from a total of 90 trees were sampled, and wood properties were analysed by
SilviScan®.
Wood density from SilviScan was measured using dry volume and weight at about 7%
relative humidity under about 20 °C in contrast with green volume (100% relative humidity) ad
oven-dry weight (bone dry) used in WinDENDRO X-ray densitometry. SilviScan predicted
dynamic MOE was derived from measured MFA and density according to method described
by Evans and Illic, 2001.
Pilodyn penetration depth was measured using a Pilodyn 6J Forest (POCEQ, Zurich,
Switzerland) with a 2.0-mm diameter pin, without removing bark. The measurements were
made at approximately 1.3 m above the ground twice for each tree.
5.2.3 Statistical analyses
Components of variance and covariance for genetic analyses were estimated using
ASREML 3.0 (GILMOUR et al., 2009), and the following linear mixed model for individual
tree analysis was fitted as follow:

109
𝑌𝑖𝑗𝑙 = 𝝁 + 𝑹𝒊 + 𝑭𝒋 + 𝒆𝒊𝒋𝒍 (17)
Where 𝑌𝑖𝑗𝑙 is the observation of the 𝑙𝑡ℎ tree from the 𝑗𝑡ℎ progeny in 𝑖𝑡ℎ replication, 𝜇 is the
overall mean, both 𝑅𝑖 (replication) and 𝐹𝑗 (progeny) were considered as random effect.
The open-pollinated offspring of progenies were assumed as open pollinated, and
additive genetic variance for each trait was calculated as 4 times the progeny variance
(FALCONER; MCKAY, 1996). Narrow-sense heritability (ℎ𝑖2) was computed for each year
assuming half-sib family structure as:
ℎ𝑖2 =
4 𝜎𝑝𝑟𝑜𝑔𝑒𝑛𝑦2
𝜎𝑝𝑟𝑜𝑔𝑒𝑛𝑦2 + 𝜎𝑒
2 (18)
Where 𝜎𝑝𝑟𝑜𝑔𝑒𝑛𝑦2 is progeny variance and 𝜎𝑒
2 is the residual variance.
Phenotypic and genetic correlation between traits 𝑥 and 𝑦 were estimated as:
𝑟𝑥,𝑦 =�̂�𝑥,𝑦
√�̂�𝑥2 �̂�𝑦
2 (19)
where �̂�𝑥2 and �̂�𝑦
2 are the estimated phenotypic or genetic variances for traits 𝑥 and 𝑦,
respectively, �̂�𝑥,𝑦 is the estimated phenotypic or genetic covariance between traits 𝑥 and 𝑦.

110
5.3 RESULTS AND DISCUSSION
5.3.1 Wood quality traits means
There were not significant differences between progenies for Modulus of elasticity
(MOE) and diameter at breast height (DBH) in various ages. Wood density (DEN) had been
significant only for 10% of probability at ages eight, nine, 23, 24, 27 and, Pilodyn penetration
(PP) and microfibril angle (MFA) for ages nine to 22 had been at 5% and 1% probability,
respectively (Figure 21). The lower or absence statistical significance for wood quality traits
may be due the small size of samples in the current work.
DBH varied from 2.06 mm to 126.01 mm at age one until 29; DEN decreased at age
three (389.92 kg m-3), however, it increased to 541.19 kg m-3 at last age. MFA presented smaller
mean value at age 29 (17.71°). MOE showed increasing range during the time from 3.50 Gpa
with one year old to 14.03 at age 29 and PP presented 11.20 mm at 29 years old (Figure 22).
Faster growth rate is directly related to lower densities in Radiata pine, according to
Baltunis, Wu and Powell (2007). The authors reported range of wood density from 376.5 to
551.60 kg m-3, with a mean of 459.70 kg m-3 for 10 year-old progenies at the same region
(Flynn). For the same age the current work presented almost the same average density (471.72
kg m-3). Furthermore, the trial presented MFA and MOE average of 28.6° and 7.40 GPa,
respectively, while in the present research the mean for the same age was 24.74° and 8.26 GPa.
Low MFA is desirable, it means higher stiffness and it is related to height and DBH in
moderately way for genotypic level (LENZ et al., 2013). The results were expected because
according to Macdonald and Hubert (2002) and Watt et al. (2010) juvenile wood normally
presents low density, thin cell walls, short tracheids, high microfibril angle and low modulus of
elasticity. Therefore, juvenile wood has low strength and stiffness if compared with late wood.
It is important to highlight that MFA was inversely proportional to MOE, decreasing along the
years. The increment in stocking may be related to it, as reported by Waghorn et al. (2007),
Lasserre et al. (2008, 2009) for Radiata pine and Chuang and Wang (2001) for Japanese cedar
and Zhang et al. (2002) for Black spruce.

111
Figure 21 - Likelihood ratio test (LRT) and significance level for diameter at breast height
(DBH), microfibril angle (MFA), modulus of elasticity (MOE) and wood density
(DEN) measured by SilviScan and Pilodyn penetration (PP) for Radiata pine trial,
Australia. (LRT above dashed line = p<0,05; above dotted line = p<0,10; PP =
p<0,01).
Source: The author.
Figure 22 - Mean values for diameter at breast height (DBH), microfibril angle (MFA),
modulus of elasticity (MOE) and wood density (DEN) measured by SilviScan and
Pilodyn penetration (PP) for Radiata pine trial, Australia.
Source: The author.

112
5.3.2 Narrow-sense individual heritability
Narrow-sense individual heritability (ℎ𝑖2) for Pilodyn penetration was 0.39 (Figure 23).
In general, the heritability increased according to the ages for all traits. However, it showed less
fluctuation for wood density, MOE and MFA. High heritabilities may provide effective
selection and indicate that these traits are under moderate to high genetic control. Standard
errors were high for SilviScan measurements because the number of samples was small
compared to Pilodyn.
Heritability for DBH was similar to reported by Chen et al. (2015) for Norway spruce
at 12 and 21 years but higher in relation to wood density, MFA and MOE. Ukrainetz et al.
(2008) also reported DBH heritability for Douglas-fir progenies similarly to the current work,
Bian et al. (2014) for Chinease-fir, Yang et al. (2013) for Loblolly pine and Egbäck et al. (2012)
for Scots pine. For MFA and MOE, Gapare et al. (2012) found heritability coefficients for
Radiata pine near to the present work, as well as Hallingbäck, Jansson and Hannrup (2010) for
Pilodyn penetration in trials with Norway spruce.
Figure 23 - Narrow-sense individual heritability (ℎ𝑖2) for diameter at breast height (DBH),
microfibril angle (MFA), modulus of elasticity (MOE) and wood density (DEN)
measured by SilviScan and Pilodyn penetration (PP) for Radiata Pine trial,
Australia.
Source: The author.

113
5.3.3 Genetic and phenotypic correlations
In general, phenotypic correlation between Pilodyn and SilviScan measurements was
negatively moderate for DEN and MOE, positively moderate for DBH and very low for MFA
as expected (Figure 24).
The genetic correlations were higher than the phenotypic ones, as observed in Figure
24, this is probably because environment interaction. Pilodyn penetration had very high
negative genetic correlation with DEN and high positive genetic correlation with DBH. For
MOE and MFA the correlation was moderate to low. It is important to note the phenotypic
correlation involves environmental and genetic part. If the genetic correlation is greater than
the phenotypic, meaning that any relation between traits has more genetic influence. According
to Cruz, Regazzi and Carneiro (2004) the environment may becomes a cause of correlation
between two traits when they are influenced by variations in environmental conditions.
MOE and DEN correlates well with Pilodyn penetration measurements both genetically
and phenotypically. When PP decreases DEN and MOE increase. It means more wood in the
same volume and stiffer wood. This proposes that the improvement or control of wood stiffness
could be executed with field measurements and Pilodyn can be used to assess the wood MOE.
Högberg et al. (2014) and Chen et al. (2015) both for Norway spruce found similar results, as
well as, Wu et al. (2011) for Eucalypt clones and Kennedy, Cameron and Lee (2013) for Sitka
spruce. For progeny level, Pilodyn penetration also showed high reliability for correlation with
wood density in progenies of Lodgepole pine and Douglas-fir as reported by Adams et al.
(1993) and Wang et al. (1999), respectively.
We may see wood properties vary according both genetic and environment situations,
as age, origin, location source, and spacing, rate of growth among species and even between
trees of the same species. The main thing to take into consideration is to determine the finality
of the wood. Agreeing with Evans, Stuart and Van Der Touw (1996), for instance, the
mechanical properties of the paper are powerfully predisposed by the strength and stiffness of
the wood fibres.

114
Figure 24 - Genetic and phenotypic correlations between Pilodyn penetration and diameter at
breast height (DBH), microfibril angle (MFA), modulus of elasticity (MOE) and
wood density measured by SilviScan for Radiata pine trial, Australia.
Source: The author.

115
6.4 CONCLUSIONS
DBH ranged from 2.06 mm to 126.01 mm during the assessment years. DEN decreased
at age thee, however, increased in the last year of analysis. MFA had lower mean values at age
29, while MOE ranged from 3.50 Gpa one year after implantation and 14.03 Gpa at last
measurement.
Individual heritability for Pilodyn penetration was considered high (0.34) as genetic
correlation with Pilodyn and wood density (-0.99), DBH (0.99) and low to moderate correlation
between Pilodyn and MOE (-0.61) and MFA (-0.33).
Pilodyn can be considered as an effective indirect trait to evaluate genetic parameters
for Radiata pine wood density.

116
REFERENCES
ADAMS, W. T.; AITKEN, S. N.; BALDUMAN, L.; SCHERMANN, N. Pacific northwest
tree improvement research cooperative 1992-1993 Annual report. Corvallis: Forest
Research Laboratory, Oregon State University, [199?].
ANTONY, F.; SCHIMLECK, L. R.; JORDAN, L.; CLARK, A.; DANIELS, R. F. Effect of
early age woody and herbaceous competition control on wood properties of loblolly pine.
Forest Ecology Management, Amsterdam, v. 262, n. 8, p. 1639–1647, 2011.
BALL, R. D.; McCONCHIE, M. S.; COWN, D. J. Evidence for associations between
SilviScan-measured wood properties and intraring checking in a study of twenty-nine 6-year-
old Pinus radiata. Canadian Journal of Forest Research, Ottawa, v. 35, n. 5, p. 1156-1172,
2005.
BALTUNIS, B. S.; WU, H. X.; POWELL, M. B. Inheritance of density, microfibril angle,
and modulus of elasticity in juvenile wood of Pinus radiata at two locations in Australia.
Canadian Journal of Forest Research, Ottawa, v. 37, n. 11, p. 2164–2174, 2007.
BARNETT, J. R.; BONHAM, V. A. Cellulose microfibril angle in the cell wall of wood
fibres. Biological Reviews, Chichester, v. 79, n. 2, p. 461–472, 2004.
BIAN, L. SHI, J.; ZHENG, R., CHEN, J., WU, H. X. Genetic parameters and genotype-
environment interactions of Chinese-fir (Cunninghamia lanceolata) in Fujian Province.
Canadian Journal of Forest Research, Ottawa, v. 44, n. 6, p. 582-592, 2014.
BROWN, A. G. Experience in management of a radiata pine seed orchard at Tallaganda State
Forest, New South Wales. Australian Forest Research, Melbourne, v. 5, n. 1, p. 15-30,
1971.
CHEN, Z.; GIL, M. R. G.; KARLSSON, B.; LUNDQVIST, S.; OLSSON, L. WU, H. X.
Inheritance of growth and solid wood quality traits in a large Norway spruce population tested
at two locations in southern Sweden. Tree Genetics and Genome, Heidelberg, v. 10, n. 5, p.
1291-1303, 2014.
CHEN, Z.; KARLSSON, B.; LUNDQVIST, S.; GIL, M. R. G.; OLSSON, L. WU, H. X.
Estimating solid wood properties using Pilodyn and acoustic velocity on standing trees of
Norway spruce. Annals of Forest Science, Paris, v. 72, n. 4, p. 499-508, 2015.
CHUANG, S. T.; WANG, S. Y. Evaluation of standing tree quality of Japanese cedar grown
with different spacing using stress-wave and ultrasonic-wave methods. Journal of Wood
Science, Kudan-kita, v. 47, n. 4, p. 245–253, 2001.
CIESZEWSKI, C. J.; STRUB, M.; ANTONY, F.; BETTINGER, P.; DAHLEN, J.; LOWE,
R.C. Wood quality assessment of tree trunk from the tree branch sample and auxiliary data
based on nir spectroscopy and SilviScan. Mathematical and Computational Forestry &
Natural-Resource Sciences, Athens, v. 5, n. 1, p. 86-111, 2011.
CRUZ, C. D.; REGAZZI, A. J.; CARNEIRO, P. C. S. Modelos biométricos aplicados ao
melhoramento genético. 3. ed. Viçosa: UFV, 2004.

117
DUNGEY, H. S.; MATHESON, A. C.; KAIN, D.; EVANS, R. Genetics of wood stiffness
and its component traits in Pinus radiata. Canadian Journal of Forest Research, Ottawa, v.
36, n. 5, p. 1165–1178, 2006.
EGBÄCK, S.; LIZINIEWICZ, M.; HÖGBERG, K.; EKÖ, P.; NILSSON, U. Influence of
progeny and initial stand density on growth and quality traits of 21 year old half-sib Scots
pine (Pinus sylvestris L.). Forest Ecology and Management, Amsterdam, v. 286, n. 1, p. 1-
7, 2012.
EVANS, R.; ILIC, J. Rapid prediction of wood stiffness from microfibril angle and density.
Forest Production Journal, Peachtree Corners, v. 51, n. 3, p. 53–57, 2001.
EVANS, R.; STUART, S. A.; VAN DER TOUW, J. Microfibril angle scanning of increment
cores by X-ray diffractometry. Appita Journal, Bundoora, v. 49, n. 6, p. 411-421, 1996.
FALCONER, D. S.; MACKAY, T. F. C. Introduction to quantitative genetics. 4th. ed.
New York: Addison Wesley Longman, 1996. 464 p.
FUKATSU, E.; TAMURA, A.; TAKAHASHI, M.; FUKUDA, Y. NAKADA, R.; KUBOTA,
M.; KURINOBU, S. Efficiency of indirect selection and the evaluation of genotype by
environment interaction using Pilodyn for the genetic improvement of wood density in
Cryptomeria japonica. Journal of Forest Research, Kudan-Kita, v. 16, n. 2, p. 128-135,
2011.
GAPARE, W. J.; IVKOVIĆ, M.; DILLON, S. K.; CHEN, F.; EVANS, R.; WU, H. X.
Genetic parameters and provenance variation of Pinus radiata D. Don. ‘Eldridge collection’
in Australia 2: wood properties. Tree Genetics and Genomes, Heidelberg, v. 8, n. 4, p. 895-
910, 2012.
GAPARE, W. J.; IVKOVIĆ, M.; LIEPE, K. J.; HAMANN, A.; LOW, C. B. Drivers of
genotype by environment interaction in radiata pine as indicated by multivariate regression
trees. Forest Ecology and Management, Amsterdam, v. 353, n. 1, p. 21-29, 2015.
GILMOUR, A.R.; GOGEL, B.; CULLIS, B.; THOMPSON, R. ASReml user guide release
3.0. Hemel Hempstead: VSN International, 2009.
GREAVES, B. L.; BORRALHO, N. M. G.; RAYMOND, C. A.; FARRINGTON, A. Use of a
Pilodyn for the indirect selection of basic density in Eucalyptus nites. Canadian Journal of
Forest Research, Ottawa, v. 26, n. 8, p. 1643–1650, 1996.
HALLINGBÄCK, H. R.; JANSSON, G.; HANNRUP, B. Genetic correlation between spiral
grain and growth and quality traits in Picea abies. Canadian Journal of Forest Research,
Ottawa, v. 40, n. 2, p. 173-183, 2010.
HANSEN, C. P. Application of the pilodyn in forest tree improvement. [S.l.]: Danida
Forest Seed Centre, 2002. (Technical Note, 55).

118
HÖGBERG, K.; HALLINGBÄCK, H. R.; SÄLL, H.; JOHANSSON, M.; JANSSONE, G.
The potential for the genetic improvement of sawn timber traits in Picea abies. Canadian
Journal of Forest Research, Ottawa, v. 44, n. 4, p. 273-280, 2014.
HONG, Z.; FRIES, A.; LUNDQVIST, S.; GULL, B. A.; WU, H. X. Measuring stiffness using
acoustic tool for Scots pine breeding selection. Scandinavian Journal of Forest Research,
Stockholm, v. 30, n. 4, p. 363-372, 2015.
HONG, Z.; FRIES, A.; WU, H. X. High negative genetic correlations between growth traits
and wood properties suggest incorporating multiple traits selection including economic
weights for the future Scots pine breeding programs. Annals of Forest Science, Paris, v. 71,
n. 4, p. 463-472, 2014.
ISIK, F.; MORA, C. R.; SCHIMLECK, L. R. Genetic variation in Pinus taeda wood
properties predicted using non-destructive techniques. Annals of Forest Science, Paris, v. 68,
n. 2, p. 283–293, 2011.
KENNEDY, S. G.; CAMERON, A. D.; LEE, S. J. Genetic relationship between wood quality
traits and diameter growth of juvenile core wood in Sitka spruce. Canadian Journal of
Forest Research, Ottawa, v. 43, n 1, p. 1-6, 2013.
LASSERRE, J.; MASON, E.G.; WATT, M.S.; MOORE, J.R. Influence of initial planting
spacing and genotype on microfibril angle, wood density, fibre properties and modulus of
elasticity in Pinus radiata D. Don corewood. Forest Ecology and Management, Amsterdam,
v. 258, n. 9, p. 1924-1931, 2009.
LASSERRE, J. P.; MASON, E. G.; WATT, M. S. Influence of the main and interactive
effects of site, stand density and clone on Pinus radiata D. Don corewood modulus of
elasticity. Forest Ecology and Management, Amsterdam, v. 255, p. 3455–3459, 2008.
LEE, S. J.; CONNOLLY, T. Finalizing the selection of parents for the Sitka spruce (Picea
sitchensis (Bong.) Carr) breeding population in Britain using mixed model analysis. Forestry,
Oxford, v. 83, n. 4, p. 423–431, 2010.
LENZ, P.; AUTY, D.; ACHIM, A.; BEAULIEU, J.; MACKAY, J. Genetic improvement of
white spruce mechanical wood traits – early screening by means of acoustic velocity. Forests,
Houten, v. 4, n. 3, p. 575-594, 2013.
LI, L; WU, H. X. Efficiency of early selection for rotation-aged growth and wood density
traits in Pinus radiata. Canadian Journal of Forest Research, Ottawa, v. 35, n. 8, p. 2019-
2029, 2005.
MICKO, M. M.; WANG, E. I. C.; TAYLOR, F. W.; YANCHUK, A. D. Determination of
wood specific gravity in standing white spruce using a Pilodyn tester. The Forestry
Chronicle, Mattawa, v. 15, n. 7, p.178–180, 1982.
MURPHY, G.; COWN, D. Stand, stem and log segregation based on wood properties: a
review. Scandinavian Journal of Forest Research, Stockholm, v. 30, n. 8, p. 757-770, 2015.

119
PIISPANEN, R.; HEINONEN, J.; VALKONEN, S.; MAKINEN, H.; LUNDQVIST, S. Wood
density of Norway spruce in uneven-aged stands. Canadian Journal of Forest Research,
Ottawa, v. 44, n. 2, p. 136-144, 2014.
SPRAGUE, J. R.; TALBERT, J. T.; JETT, J. B.; BRYANT, R. L. Utility of the Pilodyn in
selection for mature wood specific gravity in loblolly pine. Forest Science, Zvolen, v. 29, n. 4,
p. 696–701, 1983.
UKRAINETZ, N. K.; KANG, K.; AITKEN, S. N.; STOEHR, M.; MANSFIELD, S.D.
Heritability and phenotypic and genetic correlations of coastal Douglas-fir (Pseudotsuga
menziesii) wood quality traits. Canadian Journal of Forest Research, Ottawa, v. 38, n. 6, p.
1536-1546, 2008.
WAGHORN, M. J.; WATT, M. S.; MASON, E. G. Influence of tree morphology, genetics,
and initial stand density on outerwood modulus of elasticity of 17-year-old Pinus radiata.
Forest Ecology and Management, Amsterdam, v. 244, p. 86–92, 2007.
WALKER, J. Wood quality: a perspective from New Zealand. Forests, Houten, v. 4, n. 2, p.
234–250, 2013.
WANG, T.; AITKEN, S. N.; ROZENBERG, P.; CARLSON, M. R. Selection for height
growth and Pilodyn pin penetration in Lodgepole pine: effects on growth traits, wood
properties, and their relationship. Canadian Journal of Forest Research, Ottawa, v. 29, n. 4,
p. 434-445, 1999.
WANG, X.; ROSS, R. J.; McCLELLAN, M.; BARBOUR, R. J.; ERICKSON, J. R.;
FORSMAN, J. W.; McGINNIS, G. D. Strength and stiffness assessment of standing trees
using a non-destructive stress wave technique. Madison: US Department of Agriculture,
Madison, 2010. (Research paper FLP-RP-585).
WU, H. X.; IVKOVIĆ, M.; GAPARE, W. J.; BALTUNIS, B. S.; POWELL, M. B.; McRAE,
T.A. Breeding for wood quality and profit in radiata pine: a review of genetic parameters.
New Zealand Journal of Forest Science, Rotorua, v. 38, n. 1, p. 56–87, 2008.
WU, S. J.; XU, J. M.; LI, G. Y.; RISTO, V.; LU, Z. H.; LI, B. Q.; WANG, W. Estimation of
basic density and modulus of elasticity of Eucalypt clones in Southern China using non-
destructive methods. Journal of Tropical Sciences, Selangor Darul Ehsan, v. 23, n. 1, p. 51-
56, 2011.
WU, S. J.; XU, J. M.; LI, G. Y.; RISTO, V.; LU, Z.H.; LI, B. Q.; WANG, W. Use of Pilodyn
for assessing wood properties in standing trees of Eucalypt clones. Journal of Forest
Research, Kudan-kita, v. 21, n. 1, p. 68-72, 2010.
YANG, H.; LIU, T.; LIU, C.; WANG, J.; CHEN, K.; ZHONG, W.; CHEN, B.; HUANG, S.
Genetic parameters and efficiency of early selection for half rotation-aged growth and form
traits in Pinus taeda in China. Silvae Genetica, Frankfurt, v. 62, n. 6, p. 277-284, 2013.
ZHANG, S. Y.; CHAURET, G.; REN, H. Q.; DESJARDINS, R. Impact of initial spacing on
plantation black spruce lumber grade yield, bending properties, and MSR yield. Wood and
Fiber Science, Monona, v. 34, n. 3, p. 460–475, 2002.

120
APPENDIX 1 – Deviance analysis and significant levels for growth and form traits in slash pine progenies in municipality of Ribeirão Branco-
SP, Brazil.
Effect Height (1 year) Effect DBH (4 years) Effect Stem straightness
Deviance LRT Deviance LRT Deviance LRT
Progeny -3110.95 11.80** Progeny 3663.03 13.35** Progeny 211.90 6.82**
Model -3122.75 Model 3649.68 Model 205.08
Effect Height (2 years) Effect DBH (5 years) Effect Branch thickness
Deviance LRT Deviance LRT Deviance LRT
Progeny -688.03 15.04** Progeny 4193.45 16.84** Progeny -574.64 0.91ns
Model -703.07 Model 4176.61 Model -575.55
Effect Height (3 years) Effect Volume (3 years) Effect Branch angle
Deviance LRT Deviance LRT Deviance LRT
Progeny 353.38 13.06** Progeny -16332.31 11.62** Progeny -117.88 4.54*
Model 340.32 Model -16343.93 Model -122.42
Effect Height (4 years) Effect Volume (4 years) Effect Number of branches
Deviance LRT Deviance LRT Deviance LRT
Progeny 1065.52 12.69** Progeny -13190.52 23.01** Progeny 1329.01 19.88**
Model 1052.83 Model -13213.53 Model 1309.13
Effect Height (5 years) Effct Volume (5 years) Effect Fork
Deviance LRT Deviance LRT Deviance LRT
Progeny 1590.77 5.87* Progeny -10962.97 19.37** Progeny -371.82 0.00ns
Model 1584.90 Model -10982.34 Model -371.82
Effect DBH (3 years) Effect Survival (5 years)
Deviance LRT Deviance LRT
Progeny 2806.86 6.60* Progeny -3532.40 0.00ns
Model 2800.26 Model -3532.40
Tabulated chi-square: 3.84 e 6.63 for significant levels of 5% (*) and 1% (**), respectively and ns not significant. Source: The author.

121
APPENDIX 2 – Deviance analysis and significant levels for growth and form traits in slash pine progenies in municipality of Ponta
Grossa-PR, Brazil.
Effect Height (1 year) Effect Volume (3 years) Effect Number of branches
Deviance LRT Deviance LRT Deviance LRT
Progeny -764.87 2.67ns Progeny -4492.63 19.24** Progeny -28.97 0.00ns
Model -767.54 Model -4511.87 Model -28.97
Effect Height (2 years) Effect Volume (4 years) Effect Fork
Deviance LRT Deviance LRT Deviance LRT
Progeny -35.86 11.07** Progeny -3348.67 28.69** Progeny -306.38 1.39ns
Model -46.93 Model -3377.36 Model -307.77
Effect Height (3 years) Effect Survival (4 years) Effect Fox tail
Deviance LRT Deviance LRT Deviance LRT
Progeny 369.69 16.73** Progeny -252.86 0.01ns Progeny -167.81 5.56*
Model 352.96 Model -252.87 Model -173.37
Effect Height (4 years) Effect Stem straightness
Deviance LRT Deviance LRT
Progeny 511.04 20.00** Progeny -565.27 2.87ns
Model 491.04 Model -568.14
Effect DBH (3 years) Effect Branch thickness
Deviance LRT Deviance LRT
Progeny 1098.11 4.19* Progeny 67.77 20.00**
Model 1093.92 Model 47.77
Effect DBH (3 year) Effect Branch angle
Deviance LRT Deviance LRT
Progeny 1361.99 16.45** Progeny -494.32 4.99*
Model 1345.54 Model -499.31
Tabulated chi-square: 3.84 e 6.63 for significant levels of 5% (*) and 1% (**), respectively and ns not significant. Source: The author.

122
APPENDIX 3 – Square mean (SM) of block effect for slash pine progenies for growth and
form traits in municipalities of Ribeirão Branco-SP and Ponta Grossa-PR,
Brazil.
Site Traits Age SM (block)
(years)
Rib
eirã
o B
ranco
Height (m)
1 0.52
2 1.14
3 2.36
4 2.21
5 6.31
DBH (cm)
3 16.41
4 6.40
5 13.84
Volume (m3 tree-1)
3 0.0001
4 0.0002
5 0.0020
Survival 5 0.05
Stem straightness 5 0.64
Branch thickness 5 0.74
Branch angle 5 0.92
Number of branches 5 1.80
Fork 5 0.04
Fox tail 5 -
Po
nta
Gro
ssa
Height (m)
1 0.18
2 0.52
3 0.93
4 1.89
DBH (cm) 3 3.98
4 8.79
Volume (m3 tree-1) 3 0.000
4 0.001
Survival 4 0.27
Stem straightness 4 1.51
Branch thickness 4 0.61
Branch angle 4 0.21
Number of branches 4 45.55
Fork 4 0.35
Fox tail 4 0.41

123
APPENDIX 4 – Variance estimates for slash pine growth traits in municipalities of Ribeirão
Branco-SP and Ponta Grossa-PR, Brazil.
Site Traits Age 𝜎𝑎2 𝜎𝑒
2 𝜎𝑓2
(years) R
ibei
rão B
ranco
Height (m)
1 0.005 0.05 0.05
2 0.025 0.20 0.22
3 0.044 0.37 0.42
4 0.066 0.58 0.64
5 0.057 0.83 0.89
DBH (cm)
3 0.127 1.73 1.86
4 0.328 2.80 3.13
5 0.528 3.82 4.34
Volume (m3 tree-1)
3 0.000002 0.0000 0.00002
4 0.000020 0.0001 0.00010
5 0.000100 0.0004 0.00040
Survival 5 0.000100 0.0400 0.04000
Ponta
Gro
ssa
Height (m)
1 0.007 0.06 0.06
2 0.070 0.21 0.28
3 0.124 0.45 0.67
4 0.338 0.57 0.91
DBH (cm) 3 0.442 2.70 3.14
4 1.878 3.82 5.70
Volume (m3 tree-1) 3 0.00001 0.00001 0.00002
4 0.00001 0.00001 0.00002
Survival 4 0.00100 0.23 0.23
Additive genetic variance (𝜎𝑎2); Non-additive environment residual variance (𝜎𝑒
2); individual phenotypic variance
(𝜎𝑓2
). Source: The author
APPENDIX 5 – Variance estimates for slash pine form traits in municipalities of Ribeirão
Branco-SP and Ponta Grossa-PR, Brazil.
Site Traits 𝜎𝑎2 𝜎𝑒
2 𝜎𝑓2
Rib
eirã
o
Bra
nco
Stem straightness 0.0270 0.355 0.382
Branch thickness 0.0060 0.231 0.237
Branch angle 0.0180 0.295 0.313
Number of branches 0.1030 0.652 0.756
Fork 0.0004 0.007 0.007
Ponta
Gro
ssa
Stem straightness 0.2420 0.482 0.724
Branch thickness 0.1270 0.225 0.352
Branch angle 0.0180 0.088 0.106
Number of branhes 0.0020 0.285 0.287
Fork 0.0110 0.148 0.160
Fox tail 0.0330 0.181 0.213
Additive genetic variance (𝜎𝑎2); Non-additive environment residual variance (𝜎𝑒
2); individual phenotypic variance
(𝜎𝑓2
). Source: The author

124
APPENDIX 6 – Variance estimates for slash pine growth and form traits in joint analysis in
municipalities of Ribeirão Branco-SP and Ponta Grossa-PR, Brazil, four
years of age.
Height DBH Volume Stem straightness
𝜎𝑎2 0,025 0,110 0,00001 0,005
𝜎𝑖𝑛𝑡2 0,010 0,069 0,00001 0,001
𝜎𝑒2 0,833 4,499 0,0001 0,282
𝜎𝑓2 0,867 4,678 0,0001 0,287
Additive genetic variance (𝜎𝑎2); genotype x variância da interação genótipo x ambiente (𝜎𝑖𝑛𝑡
2) variância residual
ambiental não aditiva (𝜎𝑒2); variância fenotípica individual (𝜎𝑓
2). Source: The author
APPENDIX 7 – Estimates of genetic parameters for slash pine growth traits in municipalities
of Ribeirão Branco-SP and Ponta Grossa-PR, Brazil.
Site Traits Age �̅� 𝐶𝑉𝑒 𝐶𝑉𝑔𝑖 𝐶𝑉𝑔𝑝 LRT
(years) (%) (%) (%)
Rib
eirã
o B
ranco
Height (m)
1 1.08 20.79 6.55 2.27 11.80**
2 2.48 18.66 6.38 3.19 15.04**
3 4.20 15.15 4.97 2.49 13.06**
4 5.81 13.63 4.43 2.21 12.69**
5 7.30 12.80 3.29 1.65 5.87*
DBH (cm)
3 7.36 18.34 4.86 2.43 6.60*
4 10.68 16.34 5.38 2.69 13.35**
5 13.61 15.08 5.34 2.67 16.84**
Volume
(m3 tree-1)
3 0.01 5.32 14.31 7.16 11.62**
4 0.02 41.29 16.24 8.12 23.01**
5 0.05 39.87 14.80 7.40 19.37**
Survival (%) 5 95.00 21.77 1.03 0.52 0.00ns
Ponta
Gro
ssa
Height (m)
1 0.91 27.21 9.01 4.50 2.67 ns
2 2.28 22.54 11.60 5.80 11.07**
3 4.12 19.00 11.24 5.62 16.73**
4 6.02 15.08 9.64 4.82 20.00**
DBH (cm) 3 7.34 23.71 9.05 4.53 4.19**
4 11.51 19.87 11.90 5.95 16.45**
Volume
(m3 tree-1)
3 0.01 50.52 31.78 15.89 19.24**
4 0.03 46.65 33.77 16.88 28.69**
Survival (%) 4 65.00 73.79 3.60 1.80 0.01 ns
Overall mean (�̅�); coefficient of experimental variation (CVe); coefficient of individual additive genetic variation
(CVgi); coefficient of progeny genetic variation (CVgp); likelihood ratio test (LRT); **significant to 1%,
*significant to 5% with 1 degree of freedon and ns not significant. Source: The author

125
APPENDIX 8 – Estimates of genetic parameters for slash pine form traits in municipalities of
Ribeirão Branco-SP and Ponta Grossa-PR, Brazil.
Site Traits �̅� 𝐶𝑉𝑒 𝐶𝑉𝑔𝑖 𝐶𝑉𝑔𝑝 LRT
(%) (%) (%) R
ibei
rão
Bra
nco
Stem straightness 2.11 28.94 7.78 3.89 6.82**
Branch thickness 1.76 27.52 4.21 2.10 0.91ns
Branch angle 2.36 23.49 5.64 2.92 4.54*
Number of branches 5.19 16.45 6.20 3.10 19.88**
Fork 1.00 8.55 1.91 0.95 0.00ns
Ponta
Gro
ssa
Stem straightness 3.34 24.39 14.74 7.37 23.58**
Branch thickness 1.63 34.67 21.81 10.90 20.00**
Branch angle 2.02 15.80 6.73 3.36 4.99**
Number of branches 6.41 8.33 0.62 0.31 0.00ns
Fork 1.8 22.05 5.92 2.96 1.39ns
Fox tail 1.68 26.96 10.77 5.39 5.56** Overall mean (�̅�); coefficient of experimental variation (CVe); coefficient of individual additive genetic variation
(CVgi); coefficient of progeny genetic variation (CVgp); likelihood ratio test (LRT); **significant to 1%,
*significant to 5% with 1 degree of freedon and ns not significant. Source: The author
.
APPENDIX 9 – Estimates of genetic parameters for slash pine form traits in municipalities of
Ribeirão Branco-SP and Ponta Grossa-PR, Brazil.
Site Traits ℎ𝑎2
ℎ𝑚
2 ℎ𝑎𝑑2 𝑟â𝑎
(%)
Rib
eirã
o
Bra
nco
Stem straightness 0.07 (±0.04) 0.42 0.05 0.65
Branch thickness 0.02 (±0.02) 0.19 0.02 0.44
Branch angle 0.06 (±0.03) 0.37 0.04 0.60
Number of branches 0.14 (±0.05) 0.59 0.11 0.78
Fork 0.05 (±0.10) 0.32 0.04 0.57
Ponta
Gro
ssa
Stem straightness 0.33 (±0.15) 0.75 0.27 0.86
Branch thickness 0.36 (±0.15) 0.76 0.30 0.87
Branch angle 0.17 (±0.11) 0.59 0.14 0.77
Number of branches 0.01 (±0.02) 0.04 0.00 0.21
Fork 0.07 (±0.07) 0.37 0.05 0.60
Fox tail 0.15 (±0.10) 0.56 0.12 0.75 Narrow-sense individual heritability (ℎ𝑎
2); family heritability mean (ℎ𝑚2 ); additive heritability within progenies
(ℎ𝑎𝑑2 ) and accuracy (𝑟â𝑎). Source: The author
.

126
APPENDIX 10 – Estimates of genetic parameters for slash pine growth traits in municipalities
of Ribeirão Branco-SP and Ponta Grossa-PR, Brazil.
Site Trait Age ℎ𝑎2 ℎ𝑚
2 ℎ𝑎𝑑2 𝑟â𝑎
(years) (%) R
ibei
rão B
ranco
Height (m)
1 0.10 (±0.04) 0.50 0.07 0.71
2 0.11 (±0.05) 0.54 0.09 0.73
3 0.10 (±0.04) 0.52 0.08 0.72
4 0.10 (±0.04) 0.51 0.08 0.72
5 0.07 (±0.04) 0.40 0.05 0.63
DBH (cm)
3 0.07 (±0.04) 0.41 0.05 0.64
4 0.11 (±0.05) 0.52 0.08 0.72
5 0.12 (±0.05) 0.56 0.09 0.75
Volume
(m3 tree-1)
3 0.10 (±0.04) 0.50 0.07 0.71
4 0.15 (±0.05) 0.61 0.12 0.78
5 0.13 (±0.05) 0.58 0.10 0.76
Survival (%) 5 0.00 (±0.01) 0.02 0.00 0.15
Ponta
Gro
ssa
Height (m)
1 0.11 (±0.08) 0.47 0.08 0.68
2 0.25 (±0.13) 0.68 0.20 0.82
3 0.32 (±0.14) 0.74 0.26 0.86
4 0.37 (±0.15) 0.77 0.31 0.88
DBH (cm) 3 0.14 (±0.10) 0.54 0.11 0.73
4 0.33 (±0.15) 0.74 0.27 0.86
Volume
(m3 tree-1)
3 0.36 (±0.15) 0.76 0.30 0.87
4 0.48 (±0.18) 0.81 0.41 0.90
Survival (%) 4 0.00 (±0.01) 0.02 0.00 0.14
Narrow-sense individual heritability (ℎ𝑎2); family heritability mean (ℎ𝑚
2 ); additive heritability within progenies
(ℎ𝑎𝑑2 ) and accuracy (𝑟â𝑎). Source: The author.

127
APPENDIX 11 – Individual selection of 80 best slash pine trees based on wood volume and
stem straightness in municipalities of Ribeirão Branco-SP and Ponta
Grossa-PR, Brazil, at age five and four, respectively.
MEI - 𝑘𝑓: variable
Strategy I
Ribeirão Branco Ponta Grossa
Volume 2014 Stem straightness Volume 2013 Stem straightness
Progeny 𝑘𝑓 Progeny 𝑘𝑓 Progeny 𝑘𝑓 Progeny 𝑘𝑓
C-001-1 4 C-010-1 3 C-012-3 6 C-010-1 6
C-032-2 4 C-036-1 13 C-013 1 C-012-3 2
C-036-1 1 C-039-2 4 C-016-2 1 C-013 3
C-047-2 2 C-043-3 15 C-023-1 2 C-019-1 4
C-053-1 3 C-048-2 7 C-025-3 1 C-032-2 2
C-063-2 18 C-082-1 13 C-032-2 5 C-039-2 4
C-067-1 2 C-083-1 12 C-067-1 6 C-047-1 7
C-071-1 4 C-225 13 C-084-2 15 C-048-2 3
C-081-3 1 C-128-2 6 C-067-1 3
C-083-1 3 C-189-1 10 C-083-1 6
C-084-2 2 C-197 19 C-189-1 4
C-098-1 12 C-217-1 1 C-197 5
C-100-2 8 C-225 1 C-217-1 2
C-112-1 1 C-228 5 C-225 9
C-151-1 1 C-272-1 1 C-272-1 20
C-189-1 3
C-197 3
C-217-1 1
C-228 7
𝑁 80 80 80 80
𝑁𝑓𝑜 44 44 24 24
𝑁𝑓 19 8 15 15
𝑘𝑓 4.21 10.00 5.33 5.33
𝜎𝑘𝑓2 19.18 21.43 30.52 20.52
𝑁𝑒 13.43 17.80 11.37 15.7
𝑀𝐸𝐼 0.009 0.121 0.012 0.466
𝐺𝑠(%) 8.65 4.04 23.52 10.52
�̂� 0.21 0.15 0.31 0.31
�̅� 0.104 3.00 0.053 4.43 Number of selected trees (𝑁); number of original progenies (𝑁𝑓𝑜 ); number of selected progenies (𝑁𝑓); number of
selected trees per progeny (𝑘𝑓); variance of the number of selected trees per progeny (𝜎𝑘𝑓2 ); effective population
size (𝑁𝑒); a: additive genetic effect = MEI: Multi-effect index; selection gain (𝐺𝑠(%)); genetic diversity (�̂�);
overall mean (�̅�). Source: The author.

128
APPENDIX 12– Selection of two best slash pine trees per progeny based on wood volume and
stem straightness in municipalities of Ribeirão Branco-SP and Ponta Grossa-
PR, Brazil, at age five and four, respectively.
MEI - 𝑘𝑓: variable
Strategy II
Ribeirão Branco Ponta Grossa
Volume 2014 Stem straightness Volume 2013 Stem straightness
Progeny 𝑘𝑓 Progeny 𝑘𝑓 Progeny 𝑘𝑓 Progeny 𝑘𝑓 Progeny 𝑘𝑓 Progeny 𝑘𝑓
C-001-1 2 C-071-1 2 C-001-1 2 C-071-1 2 C-010-1 2 C-010-1 2
C-010-1 2 C-074-2 2 C-010-1 2 C-074-2 2 C-012-3 2 C-012-3 2
C-012-3 2 C-081-3 2 C-012-3 2 C-081-3 2 C-013 2 C-013 2
C-013 2 C-082-1 2 C-013 2 C-082-1 2 C-016-2 2 C-016-2 2
C-016-2 2 C-083-1 2 C-016-2 2 C-083-1 2 C-019-1 2 C-019-1 2
C-019-1 2 C-084-2 2 C-019-1 2 C-084-2 2 C-023-1 2 C-023-1 2
C-023-1 2 C-098-1 2 C-023-1 2 C-098-1 2 C-025-3 2 C-025-3 2
C-025-3 2 C-100-2 2 C-025-3 2 C-100-2 2 C-032-1 2 C-032-1 2
C-032-1 2 C-112-1 2 C-032-1 2 C-112-1 2 C-032-2 2 C-032-2 2
C-032-2 2 C-120-1 2 C-032-2 2 C-120-1 2 C-036-1 2 C-036-1 2
C-036-1 2 C-128-2 2 C-036-1 2 C-128-2 2 C-039-2 2 C-039-2 2
C-039-1 2 C-151-1 2 C-039-1 2 C-151-1 2 C-047-1 2 C-047-1 2
C-039-2 2 C-159-1 2 C-039-2 2 C-159-1 2 C-048-2 2 C-048-2 2
C-042-1 2 C-189-1 2 C-042-1 2 C-189-1 2 C-067-1 2 C-067-1 2
C-043-3 2 C-197 2 C-043-3 2 C-197 2 C-068-1 2 C-068-1 2
C-045-1 2 C-217-1 2 C-045-1 2 C-217-1 2 C-083-1 2 C-083-1 2
C-047-1 2 C-218-1 2 C-047-1 2 C-218-1 2 C-084-2 2 C-084-2 2
C-047-2 2 C-225 2 C-047-2 2 C-225 2 C-128-2 2 C-128-2 2
C-048-2 2 C-228 2 C-048-2 2 C-228 2 C-189-1 2 C-189-1 2
C-053-1 2 C-272-1 2 C-053-1 2 C-272-1 2 C-197 2 C-197 2
C-059-1 2 C-059-1 2 C-217-1 2 C-217-1 2
C-063-2 2 C-063-2 2 C-225 2 C-225 2
C-067-1 2 C-067-1 2 C-228 2 C-228 2
C-068-1 2 C-068-1 2 C-272-1 2 C-272-1 2
𝑁 88 88 48 48
𝑁𝑓𝑜 44 44 24 24
𝑁𝑓 44 44 24 24
𝑘𝑓 2.00 2.00 2.00 2.00
𝜎𝑘𝑓2 0.00 0.00 0.00 0.00
𝑁𝑒 70.40 70.40 38.40 38.40
𝑀𝐸𝐼 0.005 0.051 0.009 0.356
𝐺𝑠(%) 4.95 1.73 16.09 7.63
�̂� 1.00 1.00 1.00 1.00
�̅� 0.103 2.99 0.055 4.67
Number of selected trees (𝑁); number of original progenies (𝑁𝑓𝑜 ); number of selected progenies (𝑁𝑓); number of
selected trees per progeny (𝑘𝑓); variance of the number of selected trees per progeny (𝜎𝑘𝑓2 ); effective population
size (𝑁𝑒); a: additive genetic effect = MEI: Multi-effect index; selection gain (𝐺𝑠(%)); genetic diversity (�̂�);
overall mean (�̅�). Source: The author.

129
APPENDIX 13 - Selection of 50% best slash pine trees per progeny based on wood volume and
stem straightness in municipalities of Ribeirão Branco-SP and Ponta Grossa-
PR, Brazil, at age five and four, respectively.
MEI - 𝑘𝑓: variable
Strategy III
Ribeirão Branco Ponta Grossa
Volume 2014 Stem straightness Volume 2013 Stem straightness
Progeny 𝑘𝑓 Progeny 𝑘𝑓 Progeny 𝑘𝑓 Progeny 𝑘𝑓 Progeny 𝑘𝑓 Progeny 𝑘𝑓
C-001-1 17 C-071-1 19 C-001-1 17 C-071-1 19 C-010-1 10 C-010-1 10
C-010-1 18 C-074-2 19 C-010-1 18 C-074-2 19 C-012-3 10 C-012-3 10
C-012-3 19 C-081-3 19 C-012-3 19 C-081-3 19 C-013 8 C-013 9
C-013 19 C-082-1 19 C-013 19 C-082-1 19 C-016-2 10 C-016-2 10
C-016-2 19 C-083-1 19 C-016-2 19 C-083-1 19 C-019-1 13 C-019-1 13
C-019-1 19 C-084-2 18 C-019-1 19 C-084-2 18 C-023-1 9 C-023-1 10
C-023-1 20 C-098-1 19 C-023-1 20 C-098-1 19 C-025-3 12 C-025-3 12
C-025-3 19 C-100-2 19 C-025-3 19 C-100-2 19 C-032-1 11 C-032-1 11
C-032-1 19 C-112-1 20 C-032-1 19 C-112-1 20 C-032-2 9 C-032-2 9
C-032-2 18 C-120-1 19 C-032-2 18 C-120-1 19 C-036-1 11 C-036-1 11
C-036-1 18 C-128-2 18 C-036-1 19 C-128-2 18 C-039-2 9 C-039-2 9
C-039-1 18 C-151-1 19 C-039-1 18 C-151-1 19 C-047-1 7 C-047-1 7
C-039-2 19 C-159-1 19 C-039-2 19 C-159-1 19 C-048-2 9 C-048-2 9
C-042-1 18 C-189-1 19 C-042-1 18 C-189-1 19 C-067-1 12 C-067-1 12
C-043-3 19 C-197 19 C-043-3 19 C-197 18 C-068-1 10 C-068-1 10
C-045-1 19 C-217-1 19 C-045-1 19 C-217-1 19 C-083-1 9 C-083-1 9
C-047-1 20 C-218-1 19 C-047-1 20 C-218-1 19 C-084-2 11 C-084-2 11
C-047-2 19 C-225 17 C-047-2 19 C-225 17 C-128-2 13 C-128-2 13
C-048-2 19 C-228 19 C-048-2 19 C-228 19 C-189-1 8 C-189-1 9
C-053-1 18 C-272-1 20 C-053-1 18 C-272-1 20 C-197 10 C-197 10
C-059-1 19 C-059-1 19 C-217-1 9 C-217-1 9
C-063-2 19 C-063-2 19 C-225 12 C-225 12
C-067-1 20 C-067-1 20 C-228 10 C-228 10
C-068-1 18 C-068-1 18 C-272-1 11 C-272-1 11
𝑁 828 828 243 246
𝑁𝑓𝑜 44 44 24 24
𝑁𝑓 44 44 24 24
𝑘𝑓 18.82 18.82 10.13 10.25
𝜎𝑘𝑓2 0.48 0.48 2.46 2.11
𝑁𝑒 151.42 151.42 71.07 71.75
𝑀𝐸𝐼 0.004 0.029 0.002 0.621
𝐺𝑠(%) 4.42 1.17 5.07 13.80
�̂� 1.00 1.00 1.00 1.00
�̅� 0.10 2.50 0.037 4.5 Number of selected trees (𝑁); number of original progenies (𝑁𝑓𝑜 ); number of selected progenies (𝑁𝑓); number of
selected trees per progeny (𝑘𝑓); variance of the number of selected trees per progeny (𝜎𝑘𝑓2 ); effective population
size (𝑁𝑒); a: additive genetic effect = MEI: Multi-effect index; selection gain (𝐺𝑠(%)); genetic diversity (�̂�);
overall mean (�̅�). Source: The author.
.

130
APPENDIX 14 – Ranking for slash pine progenies and witnesses (controls) at municipality of Ribeirão Branco-SP, Brazil.
Trait Height DBH Volume SS BT BA NB For
Age 1 2 3 4 5 3 4 5 3 4 5 5 5 5 5 5
Ran
kin
g
1 C-012-3 C-100-2 C-100-2 C-063-2 C-063-2 C-098-1 C-098-1 C-098-1 C-098-1 C-100-2 C-063-2 I73 C-043-3 C-081-3 IR02 C-045-1
2 C-098-1 C-001-1 C-063-2 C-100-2 C-081-3 C-067-1 C-071-1 C-063-2 C-100-2 C-001-1 C-098-1 TEST C-053-1 C-053-1 C-074-2 I117
3 C-039-1 C-039-1 C-039-1 C-039-1 C-001-1 C-228 C-063-2 C-228 I123 C-063-2 C-228 C-043-3 C-067-1 C-010-1 C-225 C-012-3
4 C-100-2 C-098-1 C-001-1 C-001-1 C-039-1 C-071-1 C-001-1 C-071-1 C-063-2 I123 C-001-1 C-225 C-045-1 C-228 C-016-2 C-189-1
5 C-001-1 C-012-3 C-098-1 C-067-1 C-100-2 C-039-1 C-100-2 C-067-1 C-197 C-098-1 C-100-2 C-036-1 C-272-1 C-128-2 C-025-3 C-217-1
6 C-063-2 C-063-2 I123 I123 C-067-1 C-032-2 C-032-2 C-001-1 C-039-1 C-071-1 I123 C-082-1 TEST C-016-2 C-071-1 C-047-2
7 C-228 C-128-2 C-012-3 C-098-1 C-228 C-063-2 C-228 C-032-2 C-228 C-228 C-071-1 I85 C-032-2 C-039-1 C-039-2 C-098-1
8 C-067-1 I123 C-071-1 C-012-3 C-083-1 C-128-2 C-067-1 C-100-2 C-001-1 C-197 C-067-1 C-083-1 C-068-1 C-025-3 I30 C-047-1
9 C-128-2 C-067-1 C-151-1 C-228 C-098-1 C-218-1 I123 C-047-2 C-071-1 C-032-2 C-032-2 C-039-2 C-010-1 C-083-1 C-217-1 C-100-2
10 C-197 C-151-1 C-067-1 C-081-3 C-084-2 C-001-1 C-012-3 I123 C-067-1 C-067-1 C-189-1 C-048-2 C-151-1 C-068-1 I117 C-151-1
11 C-151-1 C-228 C-228 C-128-2 C-053-1 C-120-1 C-039-1 C-083-1 I30 C-083-1 C-083-1 C-010-1 C-083-1 IR02 C-272-1 C-001-1
12 I123 C-039-2 C-128-2 C-151-1 C-151-1 C-083-1 C-083-1 C-042-1 C-128-2 C-039-1 C-047-2 C-013 C-012-3 C-045-1 C-059-1 C-032-1
13 C-082-1 C-120-1 C-189-1 C-032-2 C-071-1 TEST C-081-3 C-189-1 C-032-2 C-189-1 C-197 C-032-2 C-074-2 C-032-2 C-023-1 C-042-1
14 C-218-1 C-068-1 C-197 C-071-1 C-159-1 C-047-2 C-084-2 TEST C-083-1 C-081-3 C-053-1 C-272-1 C-081-3 TEST C-019-1 C-197
15 C-071-1 C-197 C-032-2 C-197 I123 C-081-3 C-048-2 C-039-1 C-047-2 C-012-3 C-039-1 C-032-1 C-071-1 C-047-2 C-010-1 C-128-2
16 C-047-2 C-081-3 C-016-2 C-084-2 C-032-2 I123 C-042-1 C-048-2 C-081-3 C-084-2 C-084-2 C-074-2 C-016-2 C-043-3 C-032-2 C-063-2
17 C-120-1 C-189-1 C-084-2 C-189-1 C-120-1 C-084-2 C-128-2 C-053-1 C-084-2 C-047-2 C-151-1 I30 I85 I85 I85 C-039-1
18 C-013 C-043-3 C-081-3 C-047-2 C-047-2 C-100-2 C-189-1 C-128-2 C-120-1 C-128-2 C-042-1 I117 C-039-2 C-047-1 C-013 C-067-1
19 C-084-2 C-032-2 C-043-3 C-120-1 C-128-2 C-112-1 C-120-1 C-084-2 C-012-3 C-120-1 C-081-3 C-047-1 I30 C-151-1 C-098-1 C-019-1
20 C-039-2 C-071-1 C-039-2 C-016-2 C-189-1 C-012-3 C-047-2 C-012-3 C-218-1 C-151-1 C-128-2 I123 C-225 I123 I123 C-025-3
21 I30 I30 C-047-2 C-043-3 C-012-3 I30 C-112-1 C-151-1 C-112-1 C-042-1 I30 C-063-2 I123 C-189-1 C-081-3 I30
22 C-025-3 C-013 C-159-1 C-159-1 C-068-1 C-053-1 TEST C-218-1 TEST C-048-2 C-047-1 C-120-1 C-120-1 C-120-1 C-045-1 I123
23 C-159-1 C-016-2 C-083-1 C-068-1 C-112-1 C-048-2 C-218-1 C-013 C-151-1 C-068-1 C-048-2 C-067-1 C-082-1 C-217-1 C-048-2 C-023-1
24 C-081-3 C-218-1 C-112-1 C-083-1 C-013 C-197 C-068-1 C-120-1 C-043-3 C-112-1 C-112-1 C-081-3 C-019-1 C-112-1 C-128-2 I73
Continue...

131
...Continuation
Trait Height DBH Volume SS BT BA BN For
Age 1 2 3 4 5 3 4 5 3 4 5 5 5 5 5 5
25 C-048-2 C-159-1 C-068-1 C-039-2 C-042-1 C-025-3 C-013 C-081-3 C-039-2 C-043-3 C-120-1 C-059-1 C-039-1 C-272-1 C-112-1 C-120-1
26 C-032-2 C-084-2 C-120-1 C-042-1 C-218-1 C-019-1 C-197 C-112-1 C-068-1 C-013 C-012-3 C-098-1 C-042-1 C-067-1 C-159-1 C-016-2
27 C-217-1 C-047-2 C-082-1 C-019-1 C-039-2 C-039-2 C-053-1 C-036-1 C-189-1 TEST TEST C-053-1 C-047-1 C-001-1 C-151-1 C-036-1
28 C-189-1 C-025-3 C-025-3 C-013 C-047-1 C-043-3 C-043-3 C-197 C-053-1 C-218-1 C-159-1 IR02 I117 C-084-2 C-228 C-059-1
29 C-016-2 C-272-1 C-218-1 C-218-1 C-197 C-042-1 C-151-1 C-159-1 C-019-1 C-053-1 C-218-1 C-071-1 C-218-1 C-074-2 C-218-1 C-039-2
30 C-010-1 C-032-1 TEST C-112-1 I30 C-159-1 C-019-1 C-047-1 C-048-2 C-039-2 C-013 C-128-2 C-036-1 C-197 TEST E-074-2
31 C-272-1 C-112-1 C-053-1 C-053-1 C-048-2 C-036-1 C-025-3 C-043-3 C-025-3 C-019-1 C-032-1 C-217-1 C-025-3 C-063-2 C-039-1 C-228
32 C-068-1 C-053-1 C-013 C-048-2 C-019-1 C-013 C-159-1 I30 C-013 I30 C-036-1 C-039-1 C-098-1 C-032-1 C-032-1 C-048-2
33 C-112-1 TEST I30 E-059-1 C-043-3 C-151-1 C-036-1 C-019-1 C-036-1 C-159-1 C-068-1 C-025-3 C-112-1 C-071-1 C-047-1 C-272-1
34 C-036-1 C-082-1 C-036-1 C-047-1 C-025-3 I73 C-082-1 C-217-1 C-082-1 C-082-1 C-043-3 C-068-1 C-228 C-012-3 C-120-1 C-043-3
35 C-042-1 C-036-1 C-019-1 I30 C-016-2 C-082-1 C-039-2 C-068-1 C-159-1 C-016-2 C-039-2 C-189-1 C-059-1 C-036-1 C-043-3 TEST
36 C-225 C-083-1 C-048-2 C-082-1 C-082-1 C-068-1 C-217-1 C-032-1 C-016-2 C-036-1 I73 C-045-1 C-197 C-048-2 C-084-2 C-068-1
37 C-043-3 C-074-2 C-047-1 TEST TEST C-217-1 C-059-1 C-039-2 C-042-1 C-047-1 C-019-1 C-023-1 C-189-1 C-023-1 C-053-1 C-084-2
38 C-083-1 C-042-1 C-272-1 C-025-3 C-036-1 C-272-1 I30 I73 C-047-1 C-025-3 C-217-1 C-047-2 C-013 C-082-1 C-197 C-083-1
39 TEST C-048-2 C-032-1 C-036-1 C-010-1 C-010-1 C-047-1 C-010-1 C-272-1 C-217-1 C-010-1 C-159-1 C-084-2 C-218-1 C-189-1 C-081-3
40 C-032-1 C-010-1 C-059-1 C-272-1 C-217-1 C-059-1 C-016-2 C-025-3 C-032-1 C-059-1 C-025-3 C-001-1 I73 C-159-1 C-012-3 C-159-1
41 C-059-1 C-047-1 C-042-1 C-217-1 C-225 C-189-1 C-010-1 C-082-1 I73 C-010-1 C-082-1 C-042-1 C-032-1 C-019-1 C-082-1 I85
42 C-053-1 C-019-1 C-074-2 C-032-1 C-059-1 C-016-2 I73 C-225 C-059-1 C-032-1 C-023-1 C-151-1 C-047-2 C-039-2 C-100-2 C-218-1
43 C-045-1 C-225 C-010-1 C-010-1 C-032-1 C-047-1 C-272-1 C-023-1 C-010-1 I73 I117 C-016-2 C-001-1 C-225 C-042-1 C-013
44 I117 C-217-1 C-045-1 C-045-1 C-272-1 C-032-1 C-032-1 C-045-1 C-217-1 C-272-1 C-225 C-084-2 C-128-2 I73 C-047-2 C-071-1
45 C-047-1 C-059-1 C-225 C-225 C-045-1 I85 C-225 I117 C-225 C-045-1 C-045-1 C-197 C-023-1 C-059-1 C-036-1 C-010-1
46 C-019-1 I73 I117 I117 C-074-2 C-225 C-045-1 C-059-1 I85 C-225 C-016-2 C-012-3 IR02 C-013 I73 C-032-2
47 C-023-1 C-045-1 C-217-1 I73 I117 I117 I117 IR02 C-023-1 C-023-1 C-059-1 C-019-1 C-159-1 C-100-2 C-083-1 C-112-1
48 I73 C-023-1 I73 C-074-2 C-023-1 C-023-1 C-023-1 I85 I117 I117 C-074-2 C-218-1 C-217-1 I117 C-068-1 C-225
49 I85 I85 C-023-1 C-023-1 I73 IR02 I85 C-272-1 C-074-2 C-074-2 IR02 C-228 C-063-2 C-042-1 C-067-1 IR02
50 C-074-2 I117 IR02 IR02 IR02 C-045-1 IR02 C-074-2 C-045-1 I85 C-272-1 C-112-1 C-048-2 C-098-1 C-001-1 C-082-1
51 IR02 IR02 I85 I85 I85 C-074-2 C-074-2 C-016-2 IR02 IR02 I85 C-100-2 C-100-2 I30 C-063-2 C-053-1
DBH: diameter at breast height, SS: stem straightness, BT: branch thickness, BA: branch angle, NB: number of branches, For: fork. Witnesses are I30, I73, I117, TEST, I85,
IR02, I123.

132
APPENDIX 15 – Estimates of genetic correlation (𝑟𝑔 = above diagonal) and phenotypic (𝑟𝑓 = below diagonal) between slash pine growth
and form traits in municipality of Ribeirão Branco-SP, Brazil.
Height DBH Volume
SS BT BA NB FOR
Traits Age 1 2 3 4 5 3 4 5 3 4 5
Rib
eirã
o B
ran
co
Hei
gh
t
1
- 0.85** 0.80** 0.78** 0.64** 0.72** 0.73** 0.62** 0.79** 0.74** 0.62** -0.32** -0.23** -0.11** -0.37** 0,07** 2
0.76** - 0.91** 0.86** 0.74** 0.67** 0.70** 0.60** 0.83** 0.78** 0.66** -0.31** -0.09** 0.03ns -0.40** 0,12**
3
0.69** 0.82** - 0.94** 0.83** 0.72** 0.80** 0.68** 0.90** 0.88** 0.76** -0.32** -0.13** 0.07** -0.47** 0,07**
4
0.56** 0.73** 0.87** - 0.89** 0.78** 0.86** 0.75** 0.91** 0.92** 0.79** -0.36** -0.13** 0.05* -0.53** 0,12**
5
0.47** 0.58** 0.70** 0.78** - 0.79** 0.85** 0.83** 0.85** 0.87** 0.87** -0.28** -0.14** 0.14** -0.60** 0,02ns
DB
H 3
0.67** 0.68** 0.72** 0.67** 0.61** - 0.90** 0.82** 0.90** 0.81** 0.76** -0.22** -0.09** 0.07** -0.42** 0,02ns
4
0.60** 0.67** 0.73** 0.72** 0.60** 0.80** - 0.91** 0.90** 0.95** 0.88** -0.26** -0.20** -0.06** -0.53** 0,08**
5
0.52** 0.58** 0.64** 0.66** 0.71** 0.72** 0.80** - 0.83** 0.88** 0.96** -0.20** -0.22** -0.05* -0.58** 0,08**
Vo
lum
e 3
0.71** 0.75** 0.82** 0.72** 0.63** 0.93** 0.77** 0.70** - 0.94** 0.87** -0.33** -0.18** 0.04ns -0.50** 0,09**
4
0.63** 0.73** 0.79** 0.81** 0.67** 0.75** 0.94** 0.78** 0.83** - 0.92** -0.31** -0.24** -0.04ns -0.57** 0,11**
5
0.52** 0.60** 0.66** 0.69** 0.81** 0.67** 0.73** 0.94** 0.73** 0.80** - -0.26** -0.28** -0.01ns -0.63** 0,06*
SS
-0,09** -0.05* -0.03ns 0.01 ns 0.02ns -0.02ns 0.00ns 0.01ns -0.03ns -0.01ns -0.01ns - 0.30** 0.04ns 0.09** -0.18**
BT
0,16** 0.15** 0.10** 0.07** 0.05* 0.14** 0.17** -0.19** 0.15** 0.18** 0.18** 0.16** - 0.38** 0.12** -0.18**
BA
0,01** 0.01ns 0.08** 0.07** 0.11** 0.05* 0.01ns 0.01ns 0.05* 0.02ns 0.01ns 0.10** 0.29** - 0.01ns -0.13**
NB
-0,17** -0.22** -0.24** -0.27** -0.33** -0.22** -0.27** -0.38** -0.22** -0.29** -0.39** -0.07** -0.13** -0.09** - 0.08**
FO
R
0,08** 0.05* 0.08** 0.05ns 0.05* 0.05* 0.10** 0.05* 0.06* 0.09** 0.05ns 0.03ns 0.06* 0.03ns -0.23** -
**(p<0,01); *(p<0,05); ns not significant, by t test. SS = stem straightness; BT = branch thickness; BA = branch angle; NB = number of branches; FOR = fork.
Source: The author.

133
APPENDIX 16 - Estimates of genetic correlation (𝑟𝑔 = above diagonal) and phenotypic (𝑟𝑓 = below diagonal) between slash pine growth and form
traits in municipality of Ponta Grossa-PR, Brazil.
Height DBH Volume SS BT BA NB FOR FT
Trait Age 1 2 3 4 3 4 3 4
Ponta
Gro
ssa
Hei
ght
1
- 0.83** 0.86** 0.80** 0.85** 0.81** 0.84** 0.79** -0.19** -0.44** 0.00ns 0.08* -0.30** -0,33**
2
0.76** - 0.96** 0.93** 0.89** 0.91** 0.94** 0.89** -0.22** -0.41** 0.05ns -0.04ns -0.28** -0,19**
3
0.69** 0.84** - 0.94** 0.89** 0.90** 0.93** 0.89** -0.14** -0.38** -0.02ns -0.06ns -0.31** -0,16**
4
0.58** 0.75** 0.87** - 0.86** 0.88** 0.91** 0.90** -0.13** -0.33** 0.03ns -0.10** -0.34** -0,19**
DB
H
3
0.68** 0.83** 0.83** 0.77** - 0.89** 0.92** 0.83** -0.10** -0.26** 0.05ns 0.05ns -0.29** -0,11**
4
0.62** 0.77** 0.81** 0.78** 0.83** - 0.96** 0.97** -0.14** -0.40** -0.14** 0.18** -0.31** -0,10**
Volu
me
3
0.68** 0.84** 0.86** 0.78** 0.93** 0.83** - 0.97** -0.14** -0.43** -0.11** 0.04ns -0.28** -0,16**
4
0.61** 0.77** 0.81** 0.83** 0.80** 0.94** 0.88** - -0.13** -0.46** -0.20** 0.10** -0.29** -0,13**
SS
-0,06ns -0.05ns 0.01ns 0.05ns -0.02ns -0.02ns -0.02ns -0.01ns - 0.48** 0.08* -0.11** 0.49** 0.60**
BT
-0,24** -0.25ns -0.18** -0.16** -0.24** -0.23** -0.24** -0.23** 0.30ns - 0.55** -0.37** 0.33** 0.66**
BA
-0,10** -0.08* -0.02ns -0.02ns -0.08* -0.05ns -0.09* -0.06ns 0.16ns 0.29** - -0.37** 0.19** 0.28**
NB
0,11** 0.13** 0.09* 0.11** 0.11** 0.08* 0.16** 0.12** -0.05ns -0.12** -0.13** - -0.36** -0.10**
FO
R
-0,04ns -0.02ns 0.04ns 0.07ns 0.04ns 0.01ns 0.01ns 0.00ns 0.42** 0.14** 0.09* -0.06ns - 0.48**
FT
-0,13** -0.11* -0.09** -0.08* -0.13** -0.08* -0.12** -0.08** 0.49** 0.38** 0.24** -0.16** 0.07ns - **(p<0,01); *(p<0,05); ns not significant, by t test. SS = stem straightness; BT = branch thickness; BA = branch angle; NB = number of branches; FOR = fork; FT = fox tail..
Source: The author.

134
APPENDIX 17 – Generalized Mahalanobis Distance (D2) between slash pine progenies in
municipality of Ribeirão Branco-SP, Brazil.
D2 Mahalanobis
Distance
Progeny Greater Progeny Smaller Progeny Progeny Greater Progeny Smaller Progeny
C-016-2 52.57 C-098-1 16.63 C-013 C-032-1 47.47 C-081-3 20.67 C-025-3
C-082-1 44.61 C-047-1 14.41 C-084-2 C-068-1 43.17 C-159-1 19.70 C-063-2
C-082-1 53.01 C-071-1 13.24 C-032-2 C-053-1 52.00 C-217-1 22.37 C-048-2
C-074-2 47.19 C-010-1 13.49 C-045-1 C-053-1 54.46 C-048-2 18.02 C-059-1
C-082-1 44.36 C-023-1 15,46 C-112-1 C-053-1 47.18 C-272-1 15.42 C-043-3
C-053-1 50.92 C-100-2 17.18 C-001-1 C-053-1 44.88 C-128-2 44.88 C-053-1
C-197 39.85 C-084-2 7.59 C-112-1 C-053-1 47.39 C-032-1 25.90 C-043-3
C-082-1 43.21 C-120-1 43.21 C-082-1 C-063-2 55.76 C-053-1 35.14 C-032-2
C-053-1 50.16 C-036-1 13.56 C-048-2 C-047-2 47.60 C-068-1 24.27 C-043-3
C-053-1 59.71 C-012-3 18.80 C-045-1 C-019-1 43.73 C-063-2 29.15 C-013
C-082-1 48.72 C-151-1 15.57 C-039-1 C-016-2 46.95 C-042-1 17.64 C-013
C-082-1 50.22 C-045-1 16.88 C-189-1 C-218-1 36.53 C-043-3 12.25 C-032-2
C-082-1 50.82 C-112-1 8.36 C-218-1 C-025-3 36.08 C-047-2 18.10 C-218-1
C-053-1 55.66 C-001-1 25.31 C-189-1 C-067-1 35.54 C-039-1 18.07 C-013
C-197 49.43 C-039-2 9.07 C-272-1 C-025-3 46.79 C-067-1 16.64 C-032-2
C-053-1 48.22 C-225 12.22 C-013 C-016-2 40.42 C-218-1 18.27 C-019-1
C-074-2 60.74 C-082-1 33.82 C-059-1 C-016-2 42.47 C-013 23.04 C-059-1
C-197 49.57 C-189-1 18.24 C-048-2 C-025-3 31.00 C-019-1 11.56 C-059-1
C-053-1 54.02 C-083-1 24.02 C-047-2 C-059-1 28.25 C-025-3 24.48 C-016-2
C-197 62.76 C-074-2 29.43 C-272-1 C-016-2 24.36 C-032-2 22.32 C-059-1
C-068-1 47.61 C-228 16.16 C-047-2 C-059-1 17.78 C-016-2
C-053-1 72.38 C-197 37.89 C-272-1
Maximum: 72.38 progenies: C-053-1 and C-197
Minimum: 7.59 progenies: C-084-2 and C-112-1
Source: The author.
APPENDIX 18 – Generalized Mahalanobis Distance (D2) between slash pine progenies in
municipality of Ponta Grossa-PR, Brazil.
D2 Mahalanobis
Distance
Progeny Greater Progeny Smaller Progeny Progeny Greater Progeny Smaller Progeny
C-047-1 33.36 C-084-2 10.34 C-025-3 C-047-1 40.16 C-019-1 15.33 C-012-3
C-197 39.75 C-025-3 21.71 C-083-1 C-047-1 37.02 C-067-1 18.46 C-217-1
C-019-1 37.31 C-010-1 19.34 C-016-2 C-047-1 27.94 C-012-3 13.53 C-083-1
C-039-2 39.25 C-068-1 19.97 C-032-1 C-047-1 34.55 C-225 25.83 C-228
C-047-1 34.02 C-016-2 14.38 C-012-3 C-189-1 35.63 C-036-1 25.34 C-083-1
C-128-2 35.67 C-272-1 15.46 C-083-1 C-047-1 38.74 C-228 25.80 C-083-1
C-036-1 40.27 C-128-2 22.17 C-083-1 C-048-2 37.81 C-189-1 19.55 C-083-1
C-048-2 36.03 C-032-1 12.54 C-012-3 C-047-1 28.54 C-048-2 19.87 C-083-1
C-217-1 38.07 C-013 19.73 C-067-1 C-047-1 39.34 C-197 29.42 C-217-1
C-189-1 35.93 C-032-2 18.39 C-012-3 C-047-1 31.49 C-083-1 25.21 C-217-1
C-023-1 32.58 C-039-2 14.08 C-225 C-217-1 35.12 C-047-1
C-047-1 41.63 C-023-1 23.94 C-036-1
Maximum: 41.63 progenies: C-047-1 and C-023-1
Minimum: 10.34 progenies: C-084-2 and C-025-3
Source: The author.

135
APPENDIX 19 – Genetic and phenotypic correlations between Pilodyn penetration and wood
density (DEN), modulus of elasticity (MOE), microfibril angle (MFA) and
diameter at breast height (DBH) for Radiata pine planted in Flynn, Australia
from age one to 29.
Genetic Phenotipic
Age DEN MOE MFA DBH DEN MOE MFA DBH
1 - -0.09 - - -0.30 0.29 -0.13 -0.13
2 - -0.11 - - -0.27 0.03 -0.07 -0.03
3 - -0.1 - - -0.47 0.04 -0.03 0.06
4 - -0.11 -0.33 - -0.42 -0.09 -0.02 0.07
5 -0.92 -0.11 -0.28 - -0.43 -0.13 -0.02 0.08
6 -0.76 -0.10 -0.25 - -0.38 -0.17 0.01 0.12
7 -0.76 -0.09 -0.24 0.24 -0.36 -0.21 0.04 0.18
8 -0.67 -0.16 -0.18 0.59 -0.35 -0.27 0.07 0.23
9 -0.72 -0.25 -0.16 0.99 -0.38 -0.32 0.10 0.27
10 -0.6 -0.26 -0.17 0.99 -0.42 -0.33 0.09 0.33
11 -0.83 -0.29 -0.16 0.99 -0.45 -0.35 0.10 0.35
12 -0.86 -0.30 -0.16 0.99 -0.47 -0.36 0.10 0.37
13 -0.86 -0.28 -0.18 0.99 -0.48 -0.36 0.10 0.38
14 -0.88 -0.25 -0.19 0.99 -0.50 -0.35 0.08 0.38
15 -0.88 -0.29 -0.19 0.99 -0.51 -0.36 0.08 0.37
16 -0.9 -0.32 -0.20 0.99 -0.52 -0.37 0.07 0.37
17 -0.91 -0.34 -0.20 0.98 -0.52 -0.38 0.07 0.37
18 -0.93 -0.36 -0.20 0.97 -0.54 -0.40 0.08 0.36
19 -0.97 -0.37 -0.20 0.99 -0.55 -0.41 0.08 0.36
20 -0.99 -0.39 -0.19 0.99 -0.56 -0.42 0.08 0.36
21 -1.00 -0.41 -0.21 0.99 -0.56 -0.43 0.08 0.35
22 -1.00 -0.43 -0.21 0.99 -0.56 -0.43 0.08 0.35
23 -1.00 -0.46 0.24 0.99 -0.56 -0.44 0.06 0.35
24 -1.00 -0.47 -0.26 0.99 -0.57 -0.44 0.06 0.34
25 -1.00 -0.47 -0.27 - -0.54 -0.43 0.05 0.32
26 -1.00 -0.49 -0.27 - -0.54 -0.43 0.05 0.32
27 -1.00 -0.51 -0.26 - -0.55 -0.45 0.06 0.32
28 -1.00 -0.49 -0.25 - -0.55 -0.43 0.05 0.34
29 -1.00 -0.61 -0.29 - -0.52 -0.43 0.05 0.32