genworth 2014 cost of care survey
TRANSCRIPT
Cost of Care Survey 2014
130568 03/25/14
Genworth 2014Cost of Care SurveyHome Care Providers, Adult Day Health Care Facilities, Assisted Living Facilities and Nursing Homes

Build a Better Plan with the Genworth 2014 Cost of Care Survey
Genworth has been providing insights on the importance of planning for long term care since 2004 with its annual Cost of Care Survey. The Cost of Care data has helped Americans plan for the potential need for long term care in their preferred location and setting. Genworth’s 2014 Cost of Care Survey, conducted by CareScout®, is the most comprehensive survey of its kind and covers over 14,800 long term care providers in 440 regions nationwide. This unique level of detail can help you plan for long term care costs in your desired location and care setting.
For nearly 40 years, Genworth has been a leading provider of long term care insurance.* We are also proud to be considered a thought leader when educating and empowering American families, financial professionals, policymakers and others about the importance of having a long term care plan.
Long term care is something many people may need as they age. The Genworth 2014 Cost of Care Survey can help individuals identify the financial impact a long term care event may have. This survey will provide you with current costs and potential future growth rates. Effective planning can help manage this impact. A long term care strategy can help families and individuals formalize their wants, needs and goals.
We hope you find this data insightful and valuable when starting your plan. You can also access the data online at genworth.com/costofcare or by downloading the free app for iPhone® and iPad® from the App Store on iTunes.
* Long term care insurance is underwritten by Genworth Life Insurance Company and in New York by Genworth Life Insurance Company of New York. Administrative Office: Richmond, VA.
Cost of Care Survey 2014

3
Cost of Care Survey 2014
Contents
Understanding Long Term Care
Summary of 2014 Survey Findings........................................................................................................... 4
How to Pay for Long Term Care ............................................................................................................... 6
The True Impact of Long Term Care ....................................................................................................... 8
Start the Planning Process ......................................................................................................................... 9
Cost of Care Maps
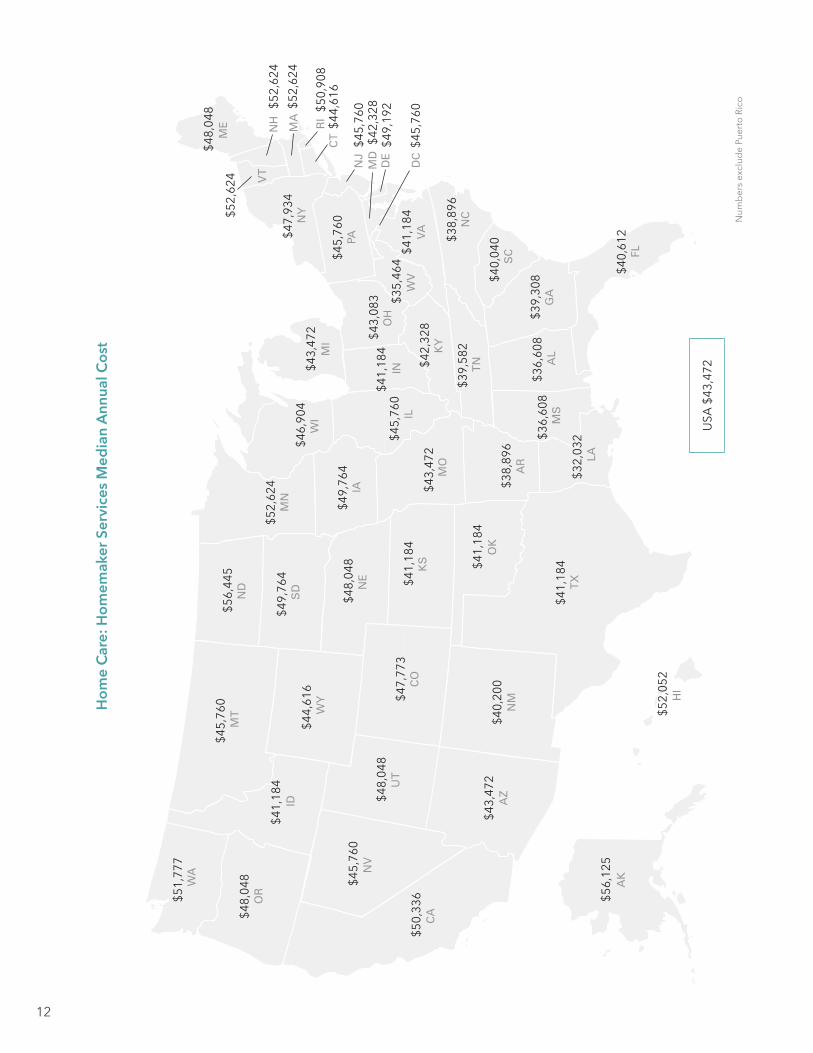
Homemaker Services ............................................................................................................................... 12
Home Health Aide Services .................................................................................................................... 13
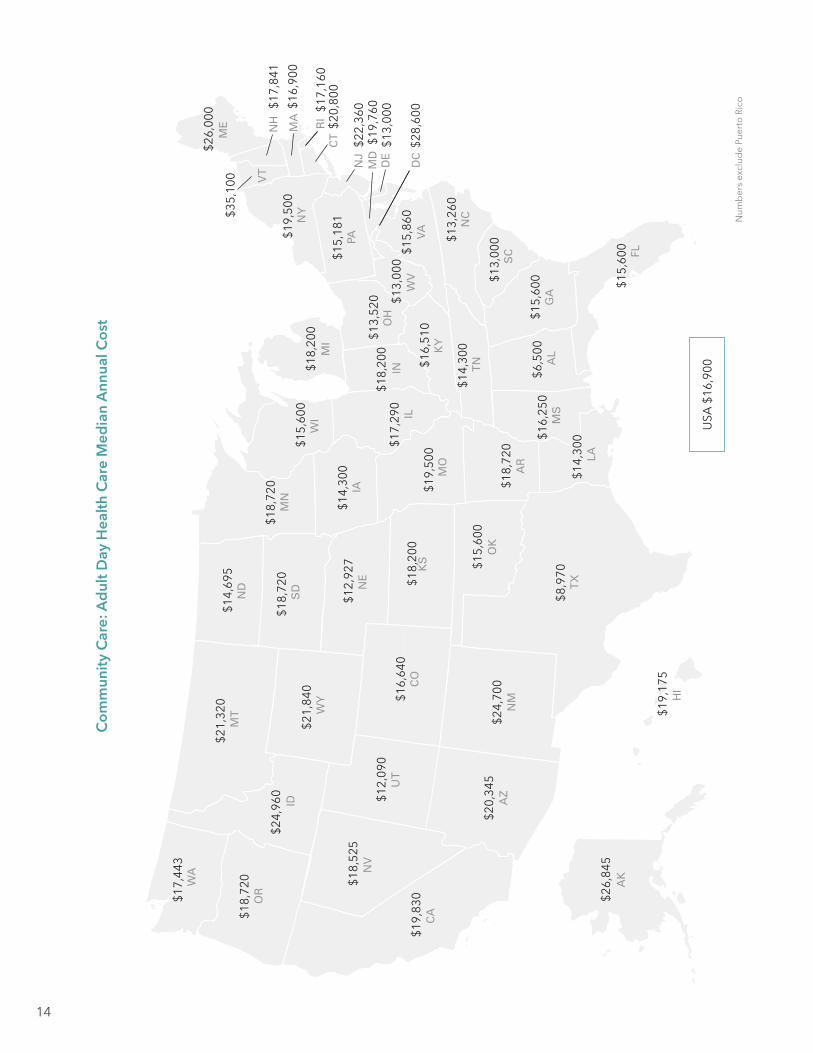
Adult Day Health Care ............................................................................................................................. 14
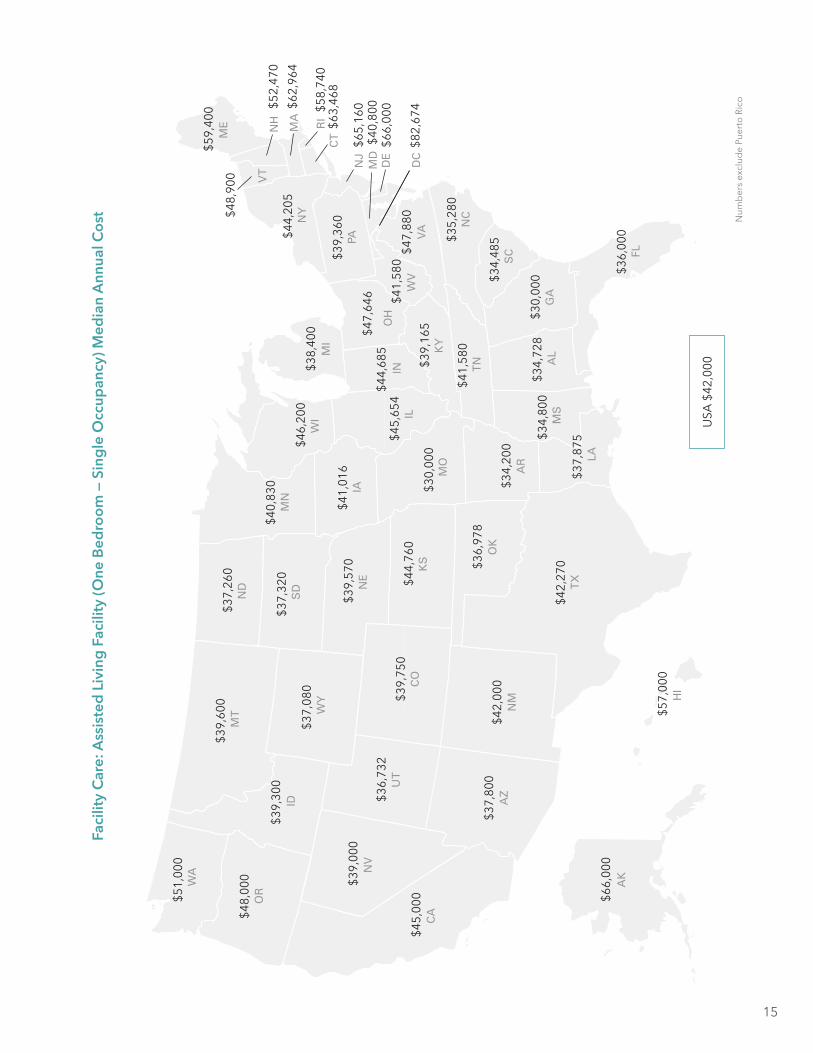
Assisted Living Facility (One Bedroom - Single Occupancy) ............................................................. 15
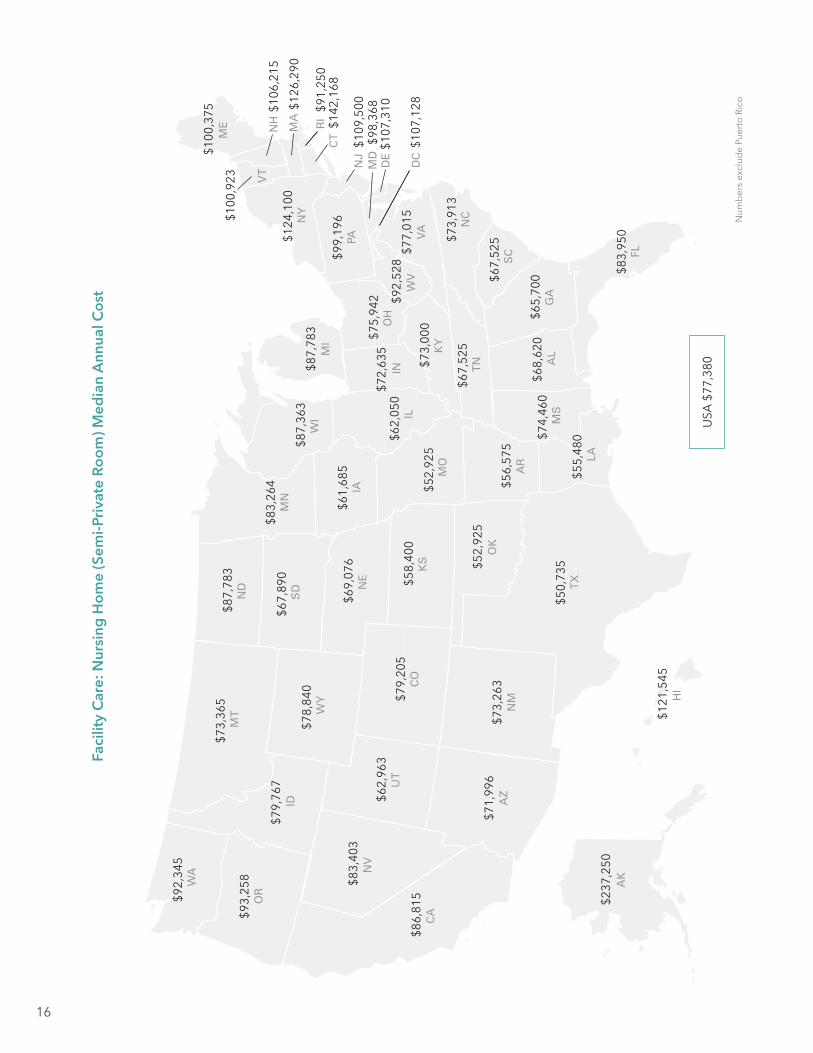
Nursing Home (Semi-Private Room) ...................................................................................................... 16
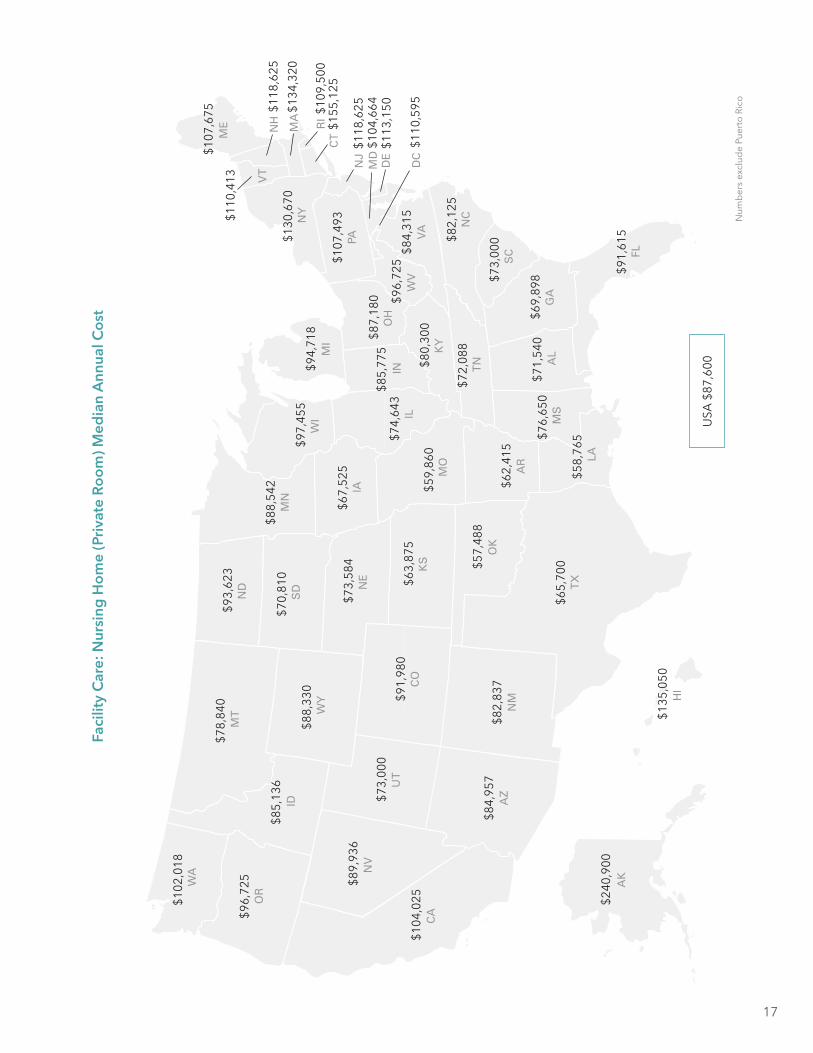
Nursing Home (Private Room) ................................................................................................................ 17
National and State Cost of Care Tables ................................................................................................. 18
Homemaker Services
Home Health Aide Services
Adult Day Health Care
Assisted Living Facility (One Bedroom - Single Occupancy)
Nursing Home (Semi-Private Room)
Nursing Home (Private Room)
Data Table End Notes .............................................................................................................................. 71
Appendix
Region Definitions (Counties) .................................................................................................................. 72
Methodology ............................................................................................................................................. 85
4
Cost of Care Survey 2014
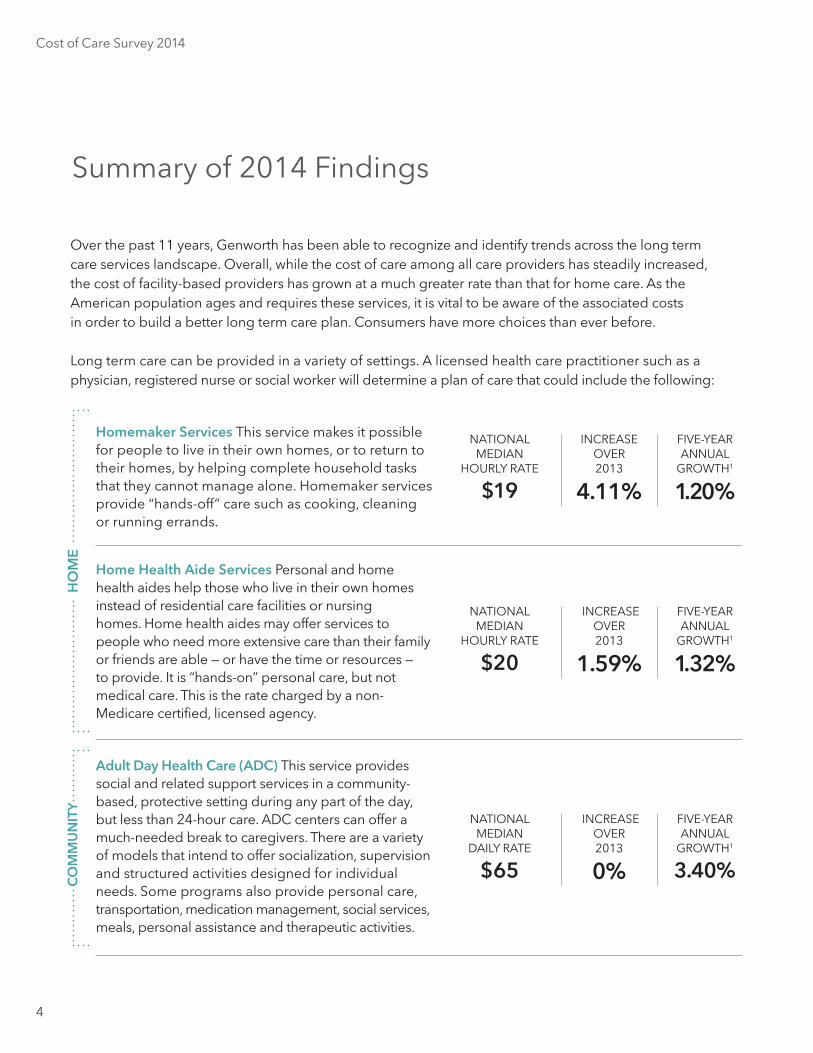
Over the past 11 years, Genworth has been able to recognize and identify trends across the long term care services landscape. Overall, while the cost of care among all care providers has steadily increased, the cost of facility-based providers has grown at a much greater rate than that for home care. As the American population ages and requires these services, it is vital to be aware of the associated costs in order to build a better long term care plan. Consumers have more choices than ever before.
Long term care can be provided in a variety of settings. A licensed health care practitioner such as a physician, registered nurse or social worker will determine a plan of care that could include the following:
Summary of 2014 Findings
NATIONAL MEDIAN
HOuRLY RATE
$20
INCREASE OVER 2013
1.59%
FIVE-YEAR ANNuAL
GROWTH1
1.32%
NATIONAL MEDIAN
DAILY RATE
$65
INCREASE OVER 2013
0%
FIVE-YEAR ANNuAL
GROWTH1
3.40%
NATIONAL MEDIAN
HOuRLY RATE
$19
INCREASE OVER 2013
4.11%
FIVE-YEAR ANNuAL
GROWTH1
1.20%
Ho
Me
Homemaker Services This service makes it possible for people to live in their own homes, or to return to their homes, by helping complete household tasks that they cannot manage alone. Homemaker services provide “hands-off” care such as cooking, cleaning or running errands.
Home Health Aide Services Personal and home health aides help those who live in their own homes instead of residential care facilities or nursing homes. Home health aides may offer services to people who need more extensive care than their family or friends are able — or have the time or resources — to provide. It is “hands-on” personal care, but not medical care. This is the rate charged by a non- Medicare certified, licensed agency.
Adult Day Health Care (ADC) This service provides social and related support services in a community- based, protective setting during any part of the day, but less than 24-hour care. ADC centers can offer a much-needed break to caregivers. There are a variety of models that intend to offer socialization, supervision and structured activities designed for individual needs. Some programs also provide personal care, transportation, medication management, social services, meals, personal assistance and therapeutic activities.
Co
MM
UN
iTy
5
Cost of Care Survey 2014
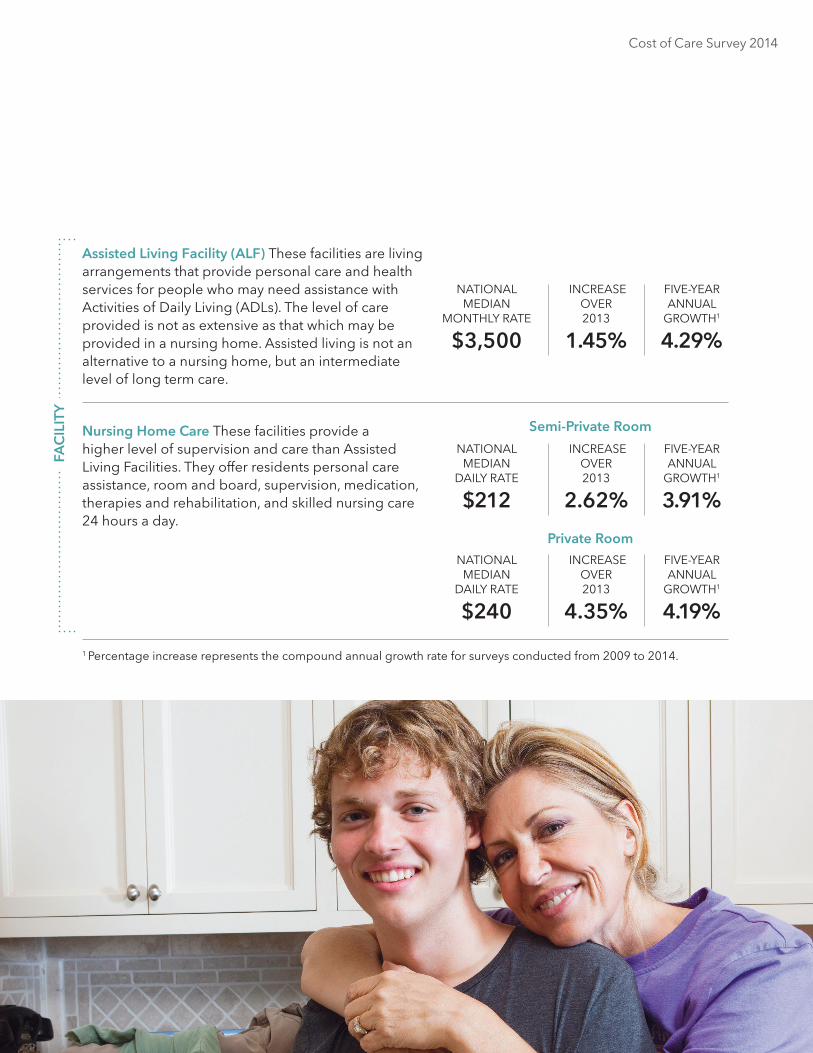
Assisted Living Facility (ALF) These facilities are living arrangements that provide personal care and health services for people who may need assistance with Activities of Daily Living (ADLs). The level of care provided is not as extensive as that which may be provided in a nursing home. Assisted living is not an alternative to a nursing home, but an intermediate level of long term care.
Nursing Home Care These facilities provide a higher level of supervision and care than Assisted Living Facilities. They offer residents personal care assistance, room and board, supervision, medication, therapies and rehabilitation, and skilled nursing care 24 hours a day.
NATIONAL MEDIAN
MONTHLY RATE
$3,500
NATIONAL MEDIAN
DAILY RATE
$212
NATIONAL MEDIAN
DAILY RATE
$240
INCREASE OVER 2013
1.45%
INCREASE OVER 2013
2.62%
INCREASE OVER 2013
4.35%
FIVE-YEAR ANNuAL
GROWTH1
4.29%
FIVE-YEAR ANNuAL
GROWTH1
3.91%
FIVE-YEAR ANNuAL
GROWTH1
4.19%
FAC
iLiT
y
Semi-Private Room
Private Room
1 Percentage increase represents the compound annual growth rate for surveys conducted from 2009 to 2014.
6
Cost of Care Survey 2014
How To Pay for Long Term Care
With median costs increasing year after year, it is important to investigate the various methods of paying for long term care. The costs can add up quickly, so knowing the different options is vital.
People generally think of four basic ways to pay for long term care: out-of-pocket, private long term care insurance, Medicare or Medicaid.
Self-insure (out-of-Pocket Payment)As you page through this report, you can look up the costs of various types of care in your state — private and semi-private nursing homes, assisted living facilities, home health aides and homemaker services. These costs can give you a good idea of how much money you or your family will need if you or a loved one requires long term care.
Long Term Care insuranceLong term care insurance helps pay for your care and protect your assets by paying for covered expenses up to the amounts set forth in your policy. Depending upon the type of policy you choose and your plan of care, this insurance can pay for a wide variety of home, community-based and facility care services, and can offer care options that may not be covered through government programs.
Many states participate in the Long Term Care Insurance Partnership Program. Designed to encourage planning for long term care, the Partnership Program allows individuals to retain more assets than would otherwise be allowed under state Medicaid eligibility requirements. As a result, policyholders are able to retain assets they would otherwise have to spend down prior to qualifying for Medicaid benefits.
Generally, individuals can participate in their state’s Partnership Program by owning a long term care insurance policy that meets the requirements for the Partnership Program. Policies qualifying under the Partnership Program generally do not cost more than non-qualified policies with similar benefits.
MedicareGenerally, Medicare is the federal program that provides hospital and medical insurance to people age 65 or older and to certain ill or disabled persons. Benefits may be available for home health care, but only if certain conditions are met.
Medicare may pay for up to 100 days of care in a skilled nursing facility per benefit period — 100 percent for the first 20 days (after a three-day hospital stay, provided skilled care is needed). Then, for days 21–100, Medicare requires a co-payment. To help cover the co-payment, many seniors also have a Medicare supplement insurance policy. In general, once Medicare stops paying for care, the supplement payment also will end.
7
Cost of Care Survey 2014
MedicaidMedicaid (referred to as Medi-Cal in California) generally pays for certain health services and nursing home care for those with low incomes and limited resources. Medicaid may also pay for some long term care services at home and in the community.
Medicaid sets limitations on the amount of assets you may own and the amount of income you may receive each month before you are eligible for benefits. Who is eligible and what services are covered vary from state to state. There also are restrictions on transferring assets to others in order to qualify for Medicaid.
8
Cost of Care Survey 2014
Long term care is becoming an increasingly important issue in this country. The aging Baby Boomer population in the u.S. is approaching 80 million. At least 70 percent of people over age 65 will need long term care services and support at some point in their lifetime.2
Long term care is the type of care you may need if you have a prolonged physical illness, disability or severe cognitive impairment. These limitations may prevent you from living independently and from carrying out basic self-care tasks.
As highlighted within this survey, long term care can have a major financial impact. While anticipating this aspect is extremely important, it is only one of many components to address when planning. The impacts can extend far beyond dollars, affecting careers and personal lives.
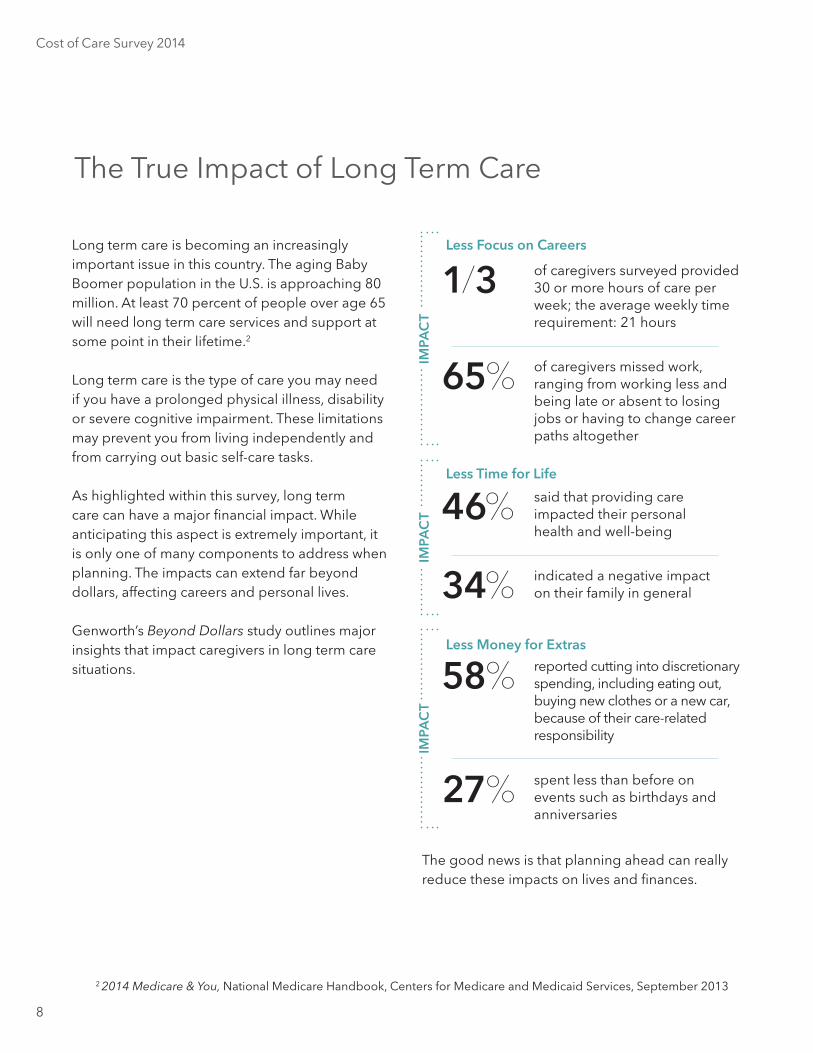
Genworth’s Beyond Dollars study outlines major insights that impact caregivers in long term care situations.
Less Focus on Careers
Less Time for Life
Less Money for extras
The good news is that planning ahead can really reduce these impacts on lives and finances.
The True Impact of Long Term Care
2 2014 Medicare & You, National Medicare Handbook, Centers for Medicare and Medicaid Services, September 2013
1/3
65%
46%
58%
34%
27%
of caregivers surveyed provided 30 or more hours of care per week; the average weekly time requirement: 21 hours
of caregivers missed work, ranging from working less and being late or absent to losing jobs or having to change career paths altogether
said that providing care impacted their personal health and well-being
reported cutting into discretionary spending, including eating out, buying new clothes or a new car, because of their care-related responsibility
indicated a negative impact on their family in general
spent less than before on events such as birthdays and anniversaries
iMPA
CT
iMPA
CT
iMPA
CT
9
Cost of Care Survey 2014
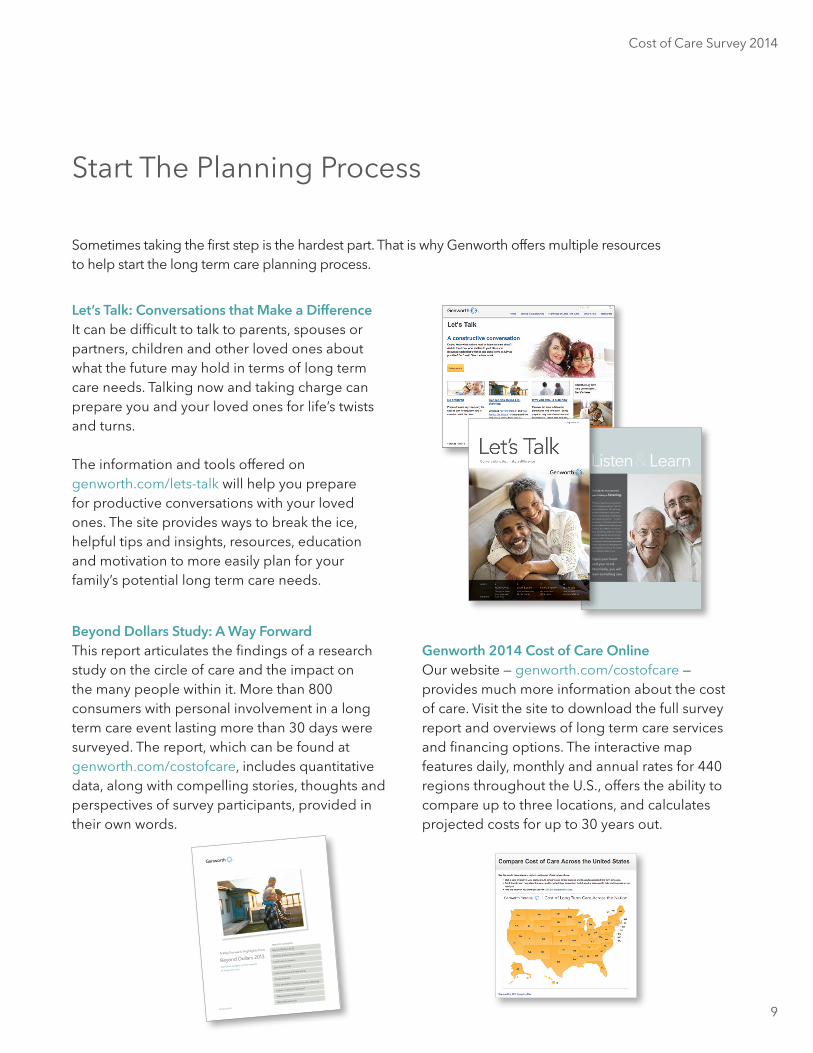
Start The Planning Process
Let’s Talk: Conversations that Make a DifferenceIt can be difficult to talk to parents, spouses or partners, children and other loved ones about what the future may hold in terms of long term care needs. Talking now and taking charge can prepare you and your loved ones for life’s twists and turns.
The information and tools offered on genworth.com/lets-talk will help you prepare for productive conversations with your loved ones. The site provides ways to break the ice, helpful tips and insights, resources, education and motivation to more easily plan for your family’s potential long term care needs.
Beyond Dollars Study: A Way ForwardThis report articulates the findings of a research study on the circle of care and the impact on the many people within it. More than 800 consumers with personal involvement in a long term care event lasting more than 30 days were surveyed. The report, which can be found at genworth.com/costofcare, includes quantitative data, along with compelling stories, thoughts and perspectives of survey participants, provided in their own words.
Genworth 2014 Cost of Care onlineOur website — genworth.com/costofcare — provides much more information about the cost of care. Visit the site to download the full survey report and overviews of long term care services and financing options. The interactive map features daily, monthly and annual rates for 440 regions throughout the u.S., offers the ability to compare up to three locations, and calculates projected costs for up to 30 years out.
157453CW 10/09/13
TABLE OF CONTENTS
Beyond Dollars 2013
Impacts that go beyond dollars
Less focus on careers
Less time for life
Less money for the little extras
A way forward
Four principles of long term care planning
Is there a role for insurance?
Taking control of the future
About the research
Our latest insights on the impacts
of long term care
Beyond Dollars 2013A Way Forward: Highlights from
Listen & Learn
When you have these conversations,
start by asking questions. And then
listen. Really listen. This will help
get the conversation going and,
even more important, it will let you
know what your parent — or other
loved one — is thinking, which may
be very different from what you are
thinking. You might be focused on
legal documents, while your mother
is wondering who will care for her
dogs in a crisis. Listening is valuable
because you now know what matters
to her, and once you’ve listened and
addressed her concerns, she may be
more willing to listen to you.
Open your heart
and your mind.
Most likely, you will
learn something new.
1. Ask questions.Then pause. Give them time to respond. Make sure they
have finished before you begin talking. True understanding
comes from being still long enough to absorb the meaning
and intent behind what people tell you.
What are their fondest memories? Biggest regrets? What
do they want/dread as they grow older? What are their
hopes and fears and goals? What matters most to them
now? If you have a specific issue to address, learn what
they think before you begin expressing your thoughts.
2. Wait.That might mean counting silently to five, but it also might
mean letting them think on it and then continuing the
conversation several days later. These are big issues;
give them time.
3. Be open.You might not know this person or this situation as well
as you think you do. We don’t know what it is to be our
parents’ ages or to walk in their shoes. We sometimes slip
into prescribed roles within our families. Occasionally,
our notions of the role a loved one plays cloud our
vision of who they actually are, what they think and more
importantly, how they feel. Plus, with time, their needs
and wishes may have changed. Evolve with them.
Things you can do today to become a better listener.
3
genworth.com/lets-talk 7
My father talks to me or my wife,
Tracy, on the phone at least once a
week, and he has dinner at our house
most weekends. It never occurred
to me that we needed to talk about
anything because we talk so often
already. But one night my uncle was
talking about their grandfather, who
lived with them for many years, and
he was saying what a pill he was.
My father said something offhanded
about how he would never live with
his kids. Tracy and I were baffled.
We always assumed he would live
with us if it came to that.
At first, I didn’t think he meant it.
But I brought it up a few days later
and he said flat out, no, he would
never live with any of his kids. We’ve
talked about it since, and it’s been
eye-opening. We discussed where
he might live — he doesn’t like the
idea of being alone with an aide so
we’ve considered other options,
including assisted living. I’m still
hoping he’ll change his mind and
decide he could live with us, but I
don’t sense that’s going to happen.
Regardless, it’s been an interesting
process. I’ve learned a lot about him.
- Ben, age 49
“
”
Ironically, the most important
part of talking is listening.
Sometimes taking the first step is the hardest part. That is why Genworth offers multiple resources to help start the long term care planning process.

11
Cost of Care Survey 2014Cost of Care Survey 2014
Genworth 2014 Cost of Care Maps
Genworth 2014 Cost of Care National and State Data Tables
12
Ho
me
Car
e: H
om
emak
er S
ervi
ces
Med
ian
Ann
ual C
ost
TX
HI
CA
NV
CO
NM
KS
OK
NE
SD
ND
MN
IA
MO
AR
IL
KY
WI
MI
INO
H
WV
PA
NY
VT
NH
MA
MD
DE
NJ
CTM
E
UT
AZ
OR
WA
ID
WY
MT
AK
FL
NC
SC
GA
AL
MS
TN
LA
VA
RI
DC
$56,
125
$36,
608
$38,
896
$43,
472
$50,
336
$47,
773
$40,
612
$39,
308
$52,
052
$49,
764
$41,
184
$45,
760
$41,
184
$41,
184
$42,
328
$32,
032
$48,
048
$43,
472
$52,
624 $4
3,47
2
$36,
608
$45,
760
$38,
896
$56,
445
$48,
048
$40,
200
$45,
760
$47,
934
$43,
083
$41,
184
$48,
048
$45,
760
$40,
040
$49,
764
$39,
582
$41,
184
$48,
048
$41,
184$5
2,62
4
$51,
777
$46,
904
$35,
464
$44,
616
uSA
$43
,472
Num
ber
s ex
clud
e Pu
erto
Ric
o
$44,
616
$45,
760
$49,
192$5
2,62
4
$42,
328$5
2,62
4
$45,
760$5
0,90
8

13
Num
ber
s ex
clud
e Pu
erto
Ric
o
Ho
me
Car
e: H
om
e H
ealt
h A
ide
Serv
ices
Med
ian
Ann
ual C
ost
TX
HI
CA
NV
CO
NM
KS
OK
NE
SD
ND
MN
IA
MO
AR
IL
KY
WI
MI
INO
H
WV
PA
NY
VT
NH
MA
MD
DE
NJ
CTM
E
UT
AZ
OR
WA
ID
WY
MT
AK
FL
NC
SC
GA
AL
MS
TN
LA
VA
RI
DC
$56,
125
$36,
608
$38,
896
$44,
616
$52,
624
$50,
336
$42,
328
$41,
184
$57,
772
$50,
771
$42,
328
$47,
476
$45,
005
$43,
358
$44,
616
$34,
320
$50,
336
$45,
623
$58,
916 $4
4,34
1
$38,
621
$48,
048
$40,
040
$57,
589
$51,
480
$43,
472
$50,
336
$50,
336
$43,
472
$45,
074
$49,
764
$45,
760
$41,
184
$49,
764
$41,
184
$41,
184
$48,
048
$43,
472$5
3,76
8
$52,
624
$50,
336
$36,
608
$45,
074
uSA
$45
,188
$49,
192
$45,
760
$52,
624$5
7,20
0
$45,
760$5
6,05
6
$48,
345$5
4,91
2
14
TX
HI
CA
NV
CO
NM
KS
OK
NE
SD
ND
MN
IA
MO
AR
IL
KY
WI
MI
INO
H
WV
PA
NY
VT
NH
MA
MD
DE
NJ
CTM
E
UT
AZ
OR
WA
ID
WY
MT
AK
FL
NC
SC
GA
AL
MS
TN
LA
VA
RI
DC
$26,
845
$6,5
00
$18,
720
$20,
345
$19,
830
$16,
640
$15,
600
$15,
600
$19,
175
$14,
300
$24,
960
$17,
290
$18,
200
$18,
200
$16,
510
$14,
300
$26,
000
$18,
200
$18,
720 $1
9,50
0
$16,
250
$21,
320
$13,
260
$14,
695
$12,
927
$24,
700
$18,
525
$19,
500
$13,
520
$15,
600
$18,
720
$15,
181
$13,
000
$18,
720
$14,
300
$8,9
70
$12,
090
$15,
860$3
5,10
0
$17,
443
$15,
600
$13,
000
$21,
840
Co
mm
unit
y C
are:
Ad
ult D
ay H
ealt
h C
are
Med
ian
Ann
ual C
ost
uSA
$16
,900
Num
ber
s ex
clud
e Pu
erto
Ric
o
$20,
800
$28,
600
$13,
000$1
6,90
0
$19,
760$1
7,84
1
$22,
360$1
7,16
0
15
TX
HI
CA
NV
CO
NM
KS
OK
NE
SD
ND
MN
IA
MO
AR
IL
KY
WI
MI
INO
H
WV
PA
NY
VT
NH
MA
MD
DE
NJ
CTM
E
UT
AZ
OR
WA
ID
WY
MT
AK
FL
NC
SC
GA
AL
MS
TN
LA
VA
RI
DC
$66,
000
$34,
728
$34,
200
$37,
800
$45,
000
$39,
750
$36,
000
$30,
000
$57,
000
$41,
016
$39,
300
$45,
654
$44,
685
$44,
760
$39,
165
$37,
875
$59,
400
$38,
400
$40,
830 $3
0,00
0
$34,
800
$39,
600
$35,
280
$37,
260
$39,
570
$42,
000
$39,
000
$44,
205
$47,
646
$36,
978
$48,
000
$39,
360
$34,
485
$37,
320
$41,
580
$42,
270
$36,
732
$47,
880$4
8,90
0
$51,
000
$46,
200
$41,
580
$37,
080
Faci
lity
Car
e: A
ssis
ted
Liv
ing
Fac
ility
(one
Bed
roo
m —
Sin
gle
occ
upan
cy) M
edia
n A
nnua
l Co
st
uSA
$42
,000
Num
ber
s ex
clud
e Pu
erto
Ric
o
$63,
468
$82,
674
$66,
000$6
2,96
4
$40,
800$5
2,47
0
$65,
160$5
8,74
0
16
Faci
lity
Car
e: N
ursi
ng H
om
e (S
emi-P
riva
te R
oo
m) M
edia
n A
nnua
l Co
st
TX
HI
CA
NV
CO
NM
KS
OK
NE
SD
ND
MN
IA
MO
AR
IL
KY
WI
MI
INO
H
WV
PA
NY
VT
NH
MA
MD
DE
NJ
CTM
E
UT
AZ
OR
WA
ID
WY
MT
AK
FL
NC
SC
GA
AL
MS
TN
LA
VA
RI
DC
$237
,250
$68,
620
$56,
575
$71,
996
$86,
815
$79,
205
$83,
950
$65,
700
$121
,545
$61,
685
$79,
767
$62,
050
$72,
635
$58,
400
$73,
000
$55,
480
$100
,375
$87,
783
$83,
264 $5
2,92
5
$74,
460
$73,
365
$73,
913
$87,
783
$69,
076
$73,
263
$83,
403
$124
,100
$75,
942
$52,
925
$93,
258
$99,
196
$67,
525
$67,
890
$67,
525
$50,
735
$62,
963
$77,
015$1
00,9
23
$92,
345
$87,
363
$92,
528
$78,
840
uSA
$77
,380
Num
ber
s ex
clud
e Pu
erto
Ric
o
$142
,168
$107
,128
$107
,310$1
26,2
90
$98,
368$1
06,2
15
$109
,500$9
1,25
0
17
Faci
lity
Car
e: N
ursi
ng H
om
e (P
riva
te R
oo
m) M
edia
n A
nnua
l Co
st
TX
HI
CA
NV
CO
NM
KS
OK
NE
SD
ND
MN
IA
MO
AR
IL
KY
WI
MI
INO
H
WV
PA
NY
VT
NH
MA
MD
DE
NJ
CTM
E
UT
AZ
OR
WA
ID
WY
MT
AK
FL
NC
SC
GA
AL
MS
TN
LA
VA
RI
DC
$240
,900
$71,
540
$62,
415
$84,
957
$104
,025
$91,
980
$91,
615
$69,
898
$135
,050
$67,
525
$85,
136
$74,
643
$85,
775
$63,
875
$80,
300
$58,
765
$107
,675
$94,
718
$88,
542 $5
9,86
0
$76,
650
$78,
840
$82,
125
$93,
623
$73,
584
$82,
837
$89,
936
$130
,670
$87,
180
$57,
488
$96,
725
$107
,493
$73,
000
$70,
810
$72,
088
$65,
700
$73,
000
$84,
315$1
10,4
13
$102
,018
$97,
455
$96,
725
$88,
330
uSA
$87
,600
Num
ber
s ex
clud
e Pu
erto
Ric
o
$155
,125
$110
,595
$113
,150$1
34,3
20
$104
,664$1
18,6
25
$118
,625$1
09,5
00

18
Homemaker Services
Hourly Rates
Home Health Aide Services
Hourly Rates
Adult Day Health Care
Daily Rates
Nursing Home(Private Room)
Daily Rates
Nursing Home (Semi-Private Room)
Daily Rates
Assisted Living Facility (One Bedroom – Single Occupancy)
Monthly Rates
RATE RANGE MINIMUM MEDIAN MAXIMUM
MEDIANANNUAL RATE1
FIVE-YEARANNUAL
GROWTH2
Ho
me
Co
mm
uN
ity
FAC
iLit
y
uSA
USA I Cost of Care Survey 2014
$8 $19 $39 $43,472 1%
$9 $20 $39 $45,188 1%
$12 $65 $215 $16,900 3%
$750 $3,500 $10,412 $42,000 4%
$94 $212 $800 $77,380 4%
$104 $240 $954 $87,600 4%

19
Homemaker Services
Hourly Rates
Home Health Aide Services
Hourly Rates
Adult Day Health Care
Daily Rates
Nursing Home(Private Room)
Daily Rates
Nursing Home (Semi-Private Room)
Daily Rates
Assisted Living Facility (One Bedroom – Single Occupancy)
Monthly Rates
RATE RANGE MINIMUM MEDIAN MAXIMUM
MEDIANANNUAL RATE1
FIVE-YEARANNUAL
GROWTH2
Ho
me
Co
mm
uN
ity
FAC
iLit
y
USA I Cost of Care Survey 2014
Alabama
Cost of Care Survey 2014 I Alabama
$13 $16 $25 $36,608 2%
$13 $16 $27 $36,608 1%
$15 $25 $175 $6,500 0%
$900 $2,894 $5,760 $34,728 3%
$133 $188 $318 $68,620 4%
$150 $196 $326 $71,540 3%

20
Homemaker Services
Hourly Rates
Home Health Aide Services
Hourly Rates
Adult Day Health Care
Daily Rates
Nursing Home(Private Room)
Daily Rates
Nursing Home (Semi-Private Room)
Daily Rates
Assisted Living Facility (One Bedroom – Single Occupancy)
Monthly Rates
RATE RANGE MINIMUM MEDIAN MAXIMUM
MEDIANANNUAL RATE1
FIVE-YEARANNUAL
GROWTH2
Ho
me
Co
mm
uN
ity
FAC
iLit
y
Alaska I Cost of Care Survey 2014
Alaska
$16 $25 $30 $56,125 11%
$16 $25 $30 $56,125 11%
$80 $103 $164 $26,845 3%
$3,390 $5,500 $7,500 $66,000 4%
$515 $650 $670 $237,250 2%
$452 $660 $954 $240,900 5%

21
Homemaker Services
Hourly Rates
Home Health Aide Services
Hourly Rates
Adult Day Health Care
Daily Rates
Nursing Home(Private Room)
Daily Rates
Nursing Home (Semi-Private Room)
Daily Rates
Assisted Living Facility (One Bedroom – Single Occupancy)
Monthly Rates
RATE RANGE MINIMUM MEDIAN MAXIMUM
MEDIANANNUAL RATE1
FIVE-YEARANNUAL
GROWTH2
Ho
me
Co
mm
uN
ity
FAC
iLit
y
Alaska I Cost of Care Survey 2014
Arizona
Cost of Care Survey 2014 I Arizona
$14 $19 $28 $43,472 0%
$14 $20 $28 $44,616 0%
$62 $78 $140 $20,345 1%
$1,100 $3,150 $6,700 $37,800 3%
$145 $197 $295 $71,996 3%
$167 $233 $350 $84,957 1%

22
Homemaker Services
Hourly Rates
Home Health Aide Services
Hourly Rates
Adult Day Health Care
Daily Rates
Nursing Home(Private Room)
Daily Rates
Nursing Home (Semi-Private Room)
Daily Rates
Assisted Living Facility (One Bedroom – Single Occupancy)
Monthly Rates
RATE RANGE MINIMUM MEDIAN MAXIMUM
MEDIANANNUAL RATE1
FIVE-YEARANNUAL
GROWTH2
Ho
me
Co
mm
uN
ity
FAC
iLit
y
Arkansas I Cost of Care Survey 2014
Arkansas
$13 $17 $23 $38,896 3%
$14 $17 $23 $38,896 1%
$61 $72 $102 $18,720 3%
$1,400 $2,850 $5,538 $34,200 4%
$110 $155 $221 $56,575 4%
$110 $171 $250 $62,415 3%

23
Homemaker Services
Hourly Rates
Home Health Aide Services
Hourly Rates
Adult Day Health Care
Daily Rates
Nursing Home(Private Room)
Daily Rates
Nursing Home (Semi-Private Room)
Daily Rates
Resident Care Facility(One Bedroom – Single Occupancy)
Monthly Rates
RATE RANGE MINIMUM MEDIAN MAXIMUM
MEDIANANNUAL RATE1
FIVE-YEARANNUAL
GROWTH2
Ho
Me
Co
MM
UN
iTy
FAC
iLiT
y
Arkansas I Cost of Care Survey 2014
California
Cost of Care Survey 2014 I California
$11 $22 $36 $50,336 2%
$11 $23 $36 $52,624 2%
$40 $76 $150 $19,830 0%
$987 $3,750 $9,000 $45,000 5%
$136 $238 $800 $86,815 5%
$136 $285 $800 $104,025 5%

24
Homemaker Services
Hourly Rates
Home Health Aide Services
Hourly Rates
Adult Day Health Care
Daily Rates
Nursing Home(Private Room)
Daily Rates
Nursing Home (Semi-Private Room)
Daily Rates
Assisted Living Facility (One Bedroom – Single Occupancy)
Monthly Rates
RATE RANGE MINIMUM MEDIAN MAXIMUM
MEDIANANNUAL RATE1
FIVE-YEARANNUAL
GROWTH2
Ho
me
Co
mm
uN
ity
FAC
iLit
y
Colorado I Cost of Care Survey 2014
Colorado
$9 $21 $32 $47,773 2%
$11 $22 $35 $50,336 2%
$40 $64 $90 $16,640 3%
$1,752 $3,313 $8,700 $39,750 2%
$170 $217 $261 $79,205 3%
$175 $252 $435 $91,980 4%

25
Homemaker Services
Hourly Rates
Home Health Aide Services
Hourly Rates
Adult Day Health Care
Daily Rates
Nursing Home(Private Room)
Daily Rates
Nursing Home (Semi-Private Room)
Daily Rates
Assisted Living Facility (One Bedroom – Single Occupancy)
Monthly Rates
RATE RANGE MINIMUM MEDIAN MAXIMUM
MEDIANANNUAL RATE1
FIVE-YEARANNUAL
GROWTH2
Ho
me
Co
mm
uN
ity
FAC
iLit
y
Colorado I Cost of Care Survey 2014
Connecticut
Cost of Care Survey 2014 I Connecticut
$13 $20 $25 $44,616 1%
$15 $22 $31 $49,192 0%
$70 $80 $144 $20,800 2%
$2,000 $5,289 $9,200 $63,468 7%
$266 $390 $550 $142,168 3%
$296 $425 $595 $155,125 3%

26
Homemaker Services
Hourly Rates
Home Health Aide Services
Hourly Rates
Adult Day Health Care
Daily Rates
Nursing Home(Private Room)
Daily Rates
Nursing Home (Semi-Private Room)
Daily Rates
Assisted Living Facility (One Bedroom – Single Occupancy)
Monthly Rates
RATE RANGE MINIMUM MEDIAN MAXIMUM
MEDIANANNUAL RATE1
FIVE-YEARANNUAL
GROWTH2
Ho
me
Co
mm
uN
ity
FAC
iLit
y
Delaware I Cost of Care Survey 2014
Delaware
$20 $22 $23 $49,192 4%
$22 $23 $25 $52,624 3%
$50 $50 $50 $13,000 N/A
$2,995 $5,500 $5,910 $66,000 7%
$215 $294 $311 $107,310 7%
$228 $310 $322 $113,150 6%

27
Homemaker Services
Hourly Rates
Home Health Aide Services
Hourly Rates
Adult Day Health Care
Daily Rates
Nursing Home(Private Room)
Daily Rates
Nursing Home (Semi-Private Room)
Daily Rates
Assisted Living Facility (One Bedroom – Single Occupancy)
Monthly Rates
RATE RANGE MINIMUM MEDIAN MAXIMUM
MEDIANANNUAL RATE1
FIVE-YEARANNUAL
GROWTH2
Ho
me
Co
mm
uN
ity
FAC
iLit
y
Delaware I Cost of Care Survey 2014
District of Columbia
Cost of Care Survey 2014 I District of Columbia
$17 $20 $25 $45,760 N/A
$17 $20 $25 $45,760 N/A
$82 $110 $110 $28,600 N/A
$4,650 $6,890 $8,610 $82,674 N/A
$200 $294 $401 $107,128 N/A
$250 $303 $432 $110,595 N/A

28
Homemaker Services
Hourly Rates
Home Health Aide Services
Hourly Rates
Adult Day Health Care
Daily Rates
Nursing Home(Private Room)
Daily Rates
Nursing Home (Semi-Private Room)
Daily Rates
Assisted Living Facility (One Bedroom – Single Occupancy)
Monthly Rates
RATE RANGE MINIMUM MEDIAN MAXIMUM
MEDIANANNUAL RATE1
FIVE-YEARANNUAL
GROWTH2
Ho
me
Co
mm
uN
ity
FAC
iLit
y
Florida I Cost of Care Survey 2014
Florida
$11 $18 $28 $40,612 1%
$13 $19 $33 $42,328 1%
$30 $60 $120 $15,600 2%
$850 $3,000 $7,920 $36,000 5%
$148 $230 $440 $83,950 4%
$180 $251 $443 $91,615 4%

29
Homemaker Services
Hourly Rates
Home Health Aide Services
Hourly Rates
Adult Day Health Care
Daily Rates
Nursing Home(Private Room)
Daily Rates
Nursing Home (Semi-Private Room)
Daily Rates
Assisted Living Facility (One Bedroom – Single Occupancy)
Monthly Rates
RATE RANGE MINIMUM MEDIAN MAXIMUM
MEDIANANNUAL RATE1
FIVE-YEARANNUAL
GROWTH2
Ho
me
Co
mm
uN
ity
FAC
iLit
y
Florida I Cost of Care Survey 2014
Georgia
Cost of Care Survey 2014 I Georgia
$10 $17 $28 $39,308 1%
$12 $18 $29 $41,184 2%
$20 $60 $85 $15,600 2%
$850 $2,500 $7,950 $30,000 2%
$116 $180 $240 $65,700 3%
$116 $192 $271 $69,898 3%

30
Homemaker Services
Hourly Rates
Home Health Aide Services
Hourly Rates
Adult Day Health Care
Daily Rates
Nursing Home(Private Room)
Daily Rates
Nursing Home (Semi-Private Room)
Daily Rates
Assisted Living Facility (One Bedroom – Single Occupancy)
Monthly Rates
RATE RANGE MINIMUM MEDIAN MAXIMUM
MEDIANANNUAL RATE1
FIVE-YEARANNUAL
GROWTH2
Ho
me
Co
mm
uN
ity
FAC
iLit
y
Hawaii I Cost of Care Survey 2014
Hawaii
$19 $23 $25 $52,052 2%
$22 $25 $28 $57,772 2%
$54 $74 $170 $19,175 3%
$1,906 $4,750 $9,000 $57,000 6%
$263 $333 $571 $121,545 1%
$263 $370 $690 $135,050 0%

31
Homemaker Services
Hourly Rates
Home Health Aide Services
Hourly Rates
Adult Day Health Care
Daily Rates
Nursing Home(Private Room)
Daily Rates
Nursing Home (Semi-Private Room)
Daily Rates
Assisted Living Facility (One Bedroom – Single Occupancy)
Monthly Rates
RATE RANGE MINIMUM MEDIAN MAXIMUM
MEDIANANNUAL RATE1
FIVE-YEARANNUAL
GROWTH2
Ho
me
Co
mm
uN
ity
FAC
iLit
y
Hawaii I Cost of Care Survey 2014
Idaho
Cost of Care Survey 2014 I idaho
$14 $18 $25 $41,184 2%
$14 $19 $27 $42,328 2%
$40 $96 $175 $24,960 5%
$998 $3,275 $5,250 $39,300 3%
$183 $219 $300 $79,767 4%
$188 $233 $334 $85,136 3%

32
Homemaker Services
Hourly Rates
Home Health Aide Services
Hourly Rates
Adult Day Health Care
Daily Rates
Nursing Home(Private Room)
Daily Rates
Nursing Home (Semi-Private Room)
Daily Rates
Assisted Living Facility (One Bedroom – Single Occupancy)
Monthly Rates
RATE RANGE MINIMUM MEDIAN MAXIMUM
MEDIANANNUAL RATE1
FIVE-YEARANNUAL
GROWTH2
Ho
me
Co
mm
uN
ity
FAC
iLit
y
illinois I Cost of Care Survey 2014
Illinois
$15 $20 $25 $45,760 2%
$15 $21 $25 $47,476 2%
$30 $67 $100 $17,290 0%
$1,048 $3,805 $6,500 $45,654 4%
$115 $170 $375 $62,050 3%
$133 $205 $405 $74,643 4%

33
Homemaker Services
Hourly Rates
Home Health Aide Services
Hourly Rates
Adult Day Health Care
Daily Rates
Nursing Home(Private Room)
Daily Rates
Nursing Home (Semi-Private Room)
Daily Rates
Assisted Living Facility (One Bedroom – Single Occupancy)
Monthly Rates
RATE RANGE MINIMUM MEDIAN MAXIMUM
MEDIANANNUAL RATE1
FIVE-YEARANNUAL
GROWTH2
Ho
me
Co
mm
uN
ity
FAC
iLit
y
illinois I Cost of Care Survey 2014
Indiana
Cost of Care Survey 2014 I indiana
$12 $18 $26 $41,184 1%
$14 $20 $32 $45,005 1%
$50 $70 $140 $18,200 2%
$1,095 $3,724 $8,220 $44,685 5%
$124 $199 $400 $72,635 4%
$149 $235 $500 $85,775 4%

34
Homemaker Services
Hourly Rates
Home Health Aide Services
Hourly Rates
Adult Day Health Care
Daily Rates
Nursing Home(Private Room)
Daily Rates
Nursing Home (Semi-Private Room)
Daily Rates
Assisted Living Facility (One Bedroom – Single Occupancy)
Monthly Rates
RATE RANGE MINIMUM MEDIAN MAXIMUM
MEDIANANNUAL RATE1
FIVE-YEARANNUAL
GROWTH2
Ho
me
Co
mm
uN
ity
FAC
iLit
y
iowa I Cost of Care Survey 2014
Iowa
$16 $22 $35 $49,764 2%
$16 $22 $35 $50,771 2%
$18 $55 $150 $14,300 3%
$930 $3,418 $8,620 $41,016 4%
$120 $169 $259 $61,685 4%
$135 $185 $289 $67,525 4%

35
Homemaker Services
Hourly Rates
Home Health Aide Services
Hourly Rates
Adult Day Health Care
Daily Rates
Nursing Home(Private Room)
Daily Rates
Nursing Home (Semi-Private Room)
Daily Rates
Assisted Living Facility (One Bedroom – Single Occupancy)
Monthly Rates
RATE RANGE MINIMUM MEDIAN MAXIMUM
MEDIANANNUAL RATE1
FIVE-YEARANNUAL
GROWTH2
Ho
me
Co
mm
uN
ity
FAC
iLit
y
iowa I Cost of Care Survey 2014
Kansas
Cost of Care Survey 2014 I Kansas
$9 $18 $32 $41,184 2%
$10 $19 $32 $43,358 1%
$45 $70 $90 $18,200 3%
$1,700 $3,730 $6,975 $44,760 5%
$125 $160 $251 $58,400 3%
$145 $175 $302 $63,875 3%

36
Homemaker Services
Hourly Rates
Home Health Aide Services
Hourly Rates
Adult Day Health Care
Daily Rates
Nursing Home(Private Room)
Daily Rates
Nursing Home (Semi-Private Room)
Daily Rates
Assisted Living Facility (One Bedroom – Single Occupancy)
Monthly Rates
RATE RANGE MINIMUM MEDIAN MAXIMUM
MEDIANANNUAL RATE1
FIVE-YEARANNUAL
GROWTH2
Ho
me
Co
mm
uN
ity
FAC
iLit
y
Kentucky I Cost of Care Survey 2014
Kentucky
$14 $19 $25 $42,328 2%
$14 $20 $25 $44,616 3%
$37 $63 $101 $16,510 3%
$1,181 $3,264 $8,400 $39,165 5%
$162 $200 $285 $73,000 4%
$180 $220 $285 $80,300 4%

37
Homemaker Services
Hourly Rates
Home Health Aide Services
Hourly Rates
Adult Day Health Care
Daily Rates
Nursing Home(Private Room)
Daily Rates
Nursing Home (Semi-Private Room)
Daily Rates
Assisted Living Facility (One Bedroom – Single Occupancy)
Monthly Rates
RATE RANGE MINIMUM MEDIAN MAXIMUM
MEDIANANNUAL RATE1
FIVE-YEARANNUAL
GROWTH2
Ho
me
Co
mm
uN
ity
FAC
iLit
y
Kentucky I Cost of Care Survey 2014
Louisiana
Cost of Care Survey 2014 I Louisiana
$10 $14 $25 $32,032 0%
$10 $15 $25 $34,320 1%
$20 $55 $87 $14,300 0%
$2,050 $3,156 $5,760 $37,875 6%
$104 $152 $300 $55,480 3%
$104 $161 $350 $58,765 3%

38
Homemaker Services
Hourly Rates
Home Health Aide Services
Hourly Rates
Adult Day Health Care
Daily Rates
Nursing Home(Private Room)
Daily Rates
Nursing Home (Semi-Private Room)
Daily Rates
Assisted Living Facility (One Bedroom – Single Occupancy)
Monthly Rates
RATE RANGE MINIMUM MEDIAN MAXIMUM
MEDIANANNUAL RATE1
FIVE-YEARANNUAL
GROWTH2
Ho
me
Co
mm
uN
ity
FAC
iLit
y
Maine
$16 $21 $29 $48,048 1%
$16 $22 $29 $50,336 1%
$27 $100 $135 $26,000 2%
$3,200 $4,950 $8,040 $59,400 5%
$208 $275 $366 $100,375 3%
$220 $295 $413 $107,675 2%
Maine I Cost of Care Survey 2014

39
Homemaker Services
Hourly Rates
Home Health Aide Services
Hourly Rates
Adult Day Health Care
Daily Rates
Nursing Home(Private Room)
Daily Rates
Nursing Home (Semi-Private Room)
Daily Rates
Assisted Living Facility (One Bedroom – Single Occupancy)
Monthly Rates
RATE RANGE MINIMUM MEDIAN MAXIMUM
MEDIANANNUAL RATE1
FIVE-YEARANNUAL
GROWTH2
Ho
me
Co
mm
uN
ity
FAC
iLit
y
Maine I Cost of Care Survey 2014
Maryland
Cost of Care Survey 2014 I Maryland
$10 $19 $29 $42,328 0%
$10 $20 $35 $45,760 0%
$48 $76 $96 $19,760 1%
$900 $3,400 $8,800 $40,800 3%
$165 $270 $628 $98,368 6%
$190 $287 $628 $104,664 6%

40
Homemaker Services
Hourly Rates
Home Health Aide Services
Hourly Rates
Adult Day Health Care
Daily Rates
Nursing Home(Private Room)
Daily Rates
Nursing Home (Semi-Private Room)
Daily Rates
Assisted Living Facility (One Bedroom – Single Occupancy)
Monthly Rates
RATE RANGE MINIMUM MEDIAN MAXIMUM
MEDIANANNUAL RATE1
FIVE-YEARANNUAL
GROWTH2
Ho
me
Co
mm
uN
ity
FAC
iLit
y
Massachusetts I Cost of Care Survey 2014
Massachusetts
$12 $23 $32 $52,624 0%
$17 $25 $35 $57,200 1%
$40 $65 $95 $16,900 3%
$1,263 $5,247 $7,613 $62,964 4%
$235 $346 $440 $126,290 4%
$235 $368 $508 $134,320 4%

41
Homemaker Services
Hourly Rates
Home Health Aide Services
Hourly Rates
Adult Day Health Care
Daily Rates
Nursing Home(Private Room)
Daily Rates
Nursing Home (Semi-Private Room)
Daily Rates
Assisted Living Facility (One Bedroom – Single Occupancy)
Monthly Rates
RATE RANGE MINIMUM MEDIAN MAXIMUM
MEDIANANNUAL RATE1
FIVE-YEARANNUAL
GROWTH2
Ho
me
Co
mm
uN
ity
FAC
iLit
y
Massachusetts I Cost of Care Survey 2014
Michigan
Cost of Care Survey 2014 I Michigan
$13 $19 $26 $43,472 1%
$13 $20 $26 $45,623 2%
$30 $70 $128 $18,200 2%
$750 $3,200 $7,850 $38,400 6%
$152 $241 $313 $87,783 4%
$180 $260 $495 $94,718 4%

42
Homemaker Services
Hourly Rates
Home Health Aide Services
Hourly Rates
Adult Day Health Care
Daily Rates
Nursing Home(Private Room)
Daily Rates
Nursing Home (Semi-Private Room)
Daily Rates
Assisted Living Facility (One Bedroom – Single Occupancy)
Monthly Rates
RATE RANGE MINIMUM MEDIAN MAXIMUM
MEDIANANNUAL RATE1
FIVE-YEARANNUAL
GROWTH2
Ho
me
Co
mm
uN
ity
FAC
iLit
y
Minnesota I Cost of Care Survey 2014
Minnesota
$8 $23 $39 $52,624 1%
$15 $26 $39 $58,916 0%
$45 $72 $120 $18,720 2%
$867 $3,403 $7,200 $40,830 6%
$140 $228 $357 $83,264 5%
$155 $243 $377 $88,542 4%

43
Homemaker Services
Hourly Rates
Home Health Aide Services
Hourly Rates
Adult Day Health Care
Daily Rates
Nursing Home(Private Room)
Daily Rates
Nursing Home (Semi-Private Room)
Daily Rates
Assisted Living Facility (One Bedroom – Single Occupancy)
Monthly Rates
RATE RANGE MINIMUM MEDIAN MAXIMUM
MEDIANANNUAL RATE1
FIVE-YEARANNUAL
GROWTH2
Ho
me
Co
mm
uN
ity
FAC
iLit
y
Minnesota I Cost of Care Survey 2014
Mississippi
Cost of Care Survey 2014 I Mississippi
$13 $16 $28 $36,608 1%
$13 $17 $28 $38,621 2%
$20 $63 $71 $16,250 -3%
$800 $2,900 $7,875 $34,800 3%
$152 $204 $276 $74,460 3%
$157 $210 $291 $76,650 3%

44
Homemaker Services
Hourly Rates
Home Health Aide Services
Hourly Rates
Adult Day Health Care
Daily Rates
Nursing Home(Private Room)
Daily Rates
Nursing Home (Semi-Private Room)
Daily Rates
Assisted Living Facility (One Bedroom – Single Occupancy)
Monthly Rates
RATE RANGE MINIMUM MEDIAN MAXIMUM
MEDIANANNUAL RATE1
FIVE-YEARANNUAL
GROWTH2
Ho
me
Co
mm
uN
ity
FAC
iLit
y
Missouri I Cost of Care Survey 2014
Missouri
$16 $19 $28 $43,472 1%
$16 $19 $28 $44,341 1%
$45 $75 $96 $19,500 1%
$1,095 $2,500 $6,780 $30,000 5%
$115 $145 $249 $52,925 3%
$120 $164 $297 $59,860 4%

45
Homemaker Services
Hourly Rates
Home Health Aide Services
Hourly Rates
Adult Day Health Care
Daily Rates
Nursing Home(Private Room)
Daily Rates
Nursing Home (Semi-Private Room)
Daily Rates
Assisted Living Facility (One Bedroom – Single Occupancy)
Monthly Rates
RATE RANGE MINIMUM MEDIAN MAXIMUM
MEDIANANNUAL RATE1
FIVE-YEARANNUAL
GROWTH2
Ho
me
Co
mm
uN
ity
FAC
iLit
y
Missouri I Cost of Care Survey 2014
Montana
Cost of Care Survey 2014 I Montana
$17 $20 $25 $45,760 1%
$20 $21 $25 $48,048 2%
$42 $82 $181 $21,320 4%
$1,500 $3,300 $5,859 $39,600 4%
$170 $201 $300 $73,365 3%
$176 $216 $316 $78,840 4%

46
Homemaker Services
Hourly Rates
Home Health Aide Services
Hourly Rates
Adult Day Health Care
Daily Rates
Nursing Home(Private Room)
Daily Rates
Nursing Home (Semi-Private Room)
Daily Rates
Assisted Living Facility (One Bedroom – Single Occupancy)
Monthly Rates
RATE RANGE MINIMUM MEDIAN MAXIMUM
MEDIANANNUAL RATE1
FIVE-YEARANNUAL
GROWTH2
Ho
me
Co
mm
uN
ity
FAC
iLit
y
Nebraska I Cost of Care Survey 2014
Nebraska
$16 $21 $27 $48,048 5%
$19 $23 $27 $51,480 3%
$17 $50 $80 $12,927 4%
$1,075 $3,298 $7,500 $39,570 5%
$110 $189 $381 $69,076 3%
$130 $202 $401 $73,584 2%
47
Homemaker Services
Hourly Rates
Home Health Aide Services
Hourly Rates
Adult Day Health Care
Daily Rates
Nursing Home(Private Room)
Daily Rates
Nursing Home (Semi-Private Room)
Daily Rates
Assisted Living Facility (One Bedroom – Single Occupancy)
Monthly Rates
RATE RANGE MINIMUM MEDIAN MAXIMUM
MEDIANANNUAL RATE1
FIVE-YEARANNUAL
GROWTH2
Ho
me
Co
mm
uN
ity
FAC
iLit
y
Nebraska I Cost of Care Survey 2014
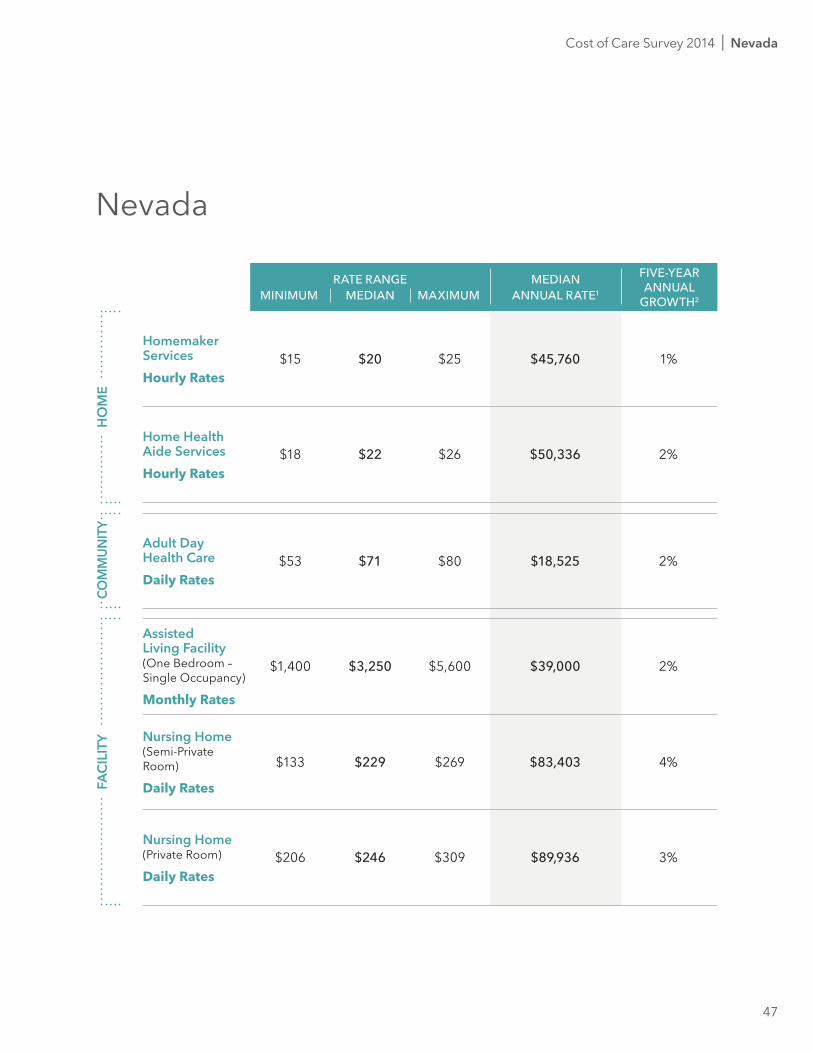
Nevada
Cost of Care Survey 2014 I Nevada
$15 $20 $25 $45,760 1%
$18 $22 $26 $50,336 2%
$53 $71 $80 $18,525 2%
$1,400 $3,250 $5,600 $39,000 2%
$133 $229 $269 $83,403 4%
$206 $246 $309 $89,936 3%
48
Homemaker Services
Hourly Rates
Home Health Aide Services
Hourly Rates
Adult Day Health Care
Daily Rates
Nursing Home(Private Room)
Daily Rates
Nursing Home (Semi-Private Room)
Daily Rates
Assisted Living Facility (One Bedroom – Single Occupancy)
Monthly Rates
RATE RANGE MINIMUM MEDIAN MAXIMUM
MEDIANANNUAL RATE1
FIVE-YEARANNUAL
GROWTH2
Ho
me
Co
mm
uN
ity
FAC
iLit
y
New Hampshire I Cost of Care Survey 2014
New Hampshire
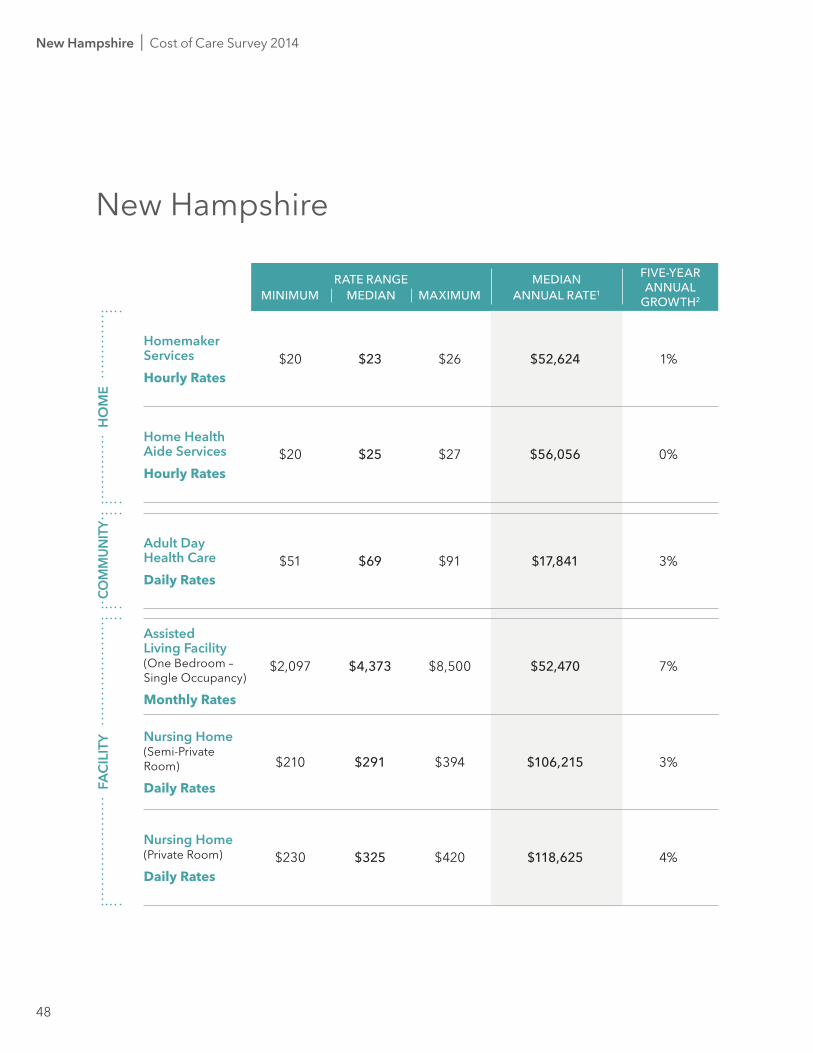
$20 $23 $26 $52,624 1%
$20 $25 $27 $56,056 0%
$51 $69 $91 $17,841 3%
$2,097 $4,373 $8,500 $52,470 7%
$210 $291 $394 $106,215 3%
$230 $325 $420 $118,625 4%

49
Homemaker Services
Hourly Rates
Home Health Aide Services
Hourly Rates
Adult Day Health Care
Daily Rates
Nursing Home(Private Room)
Daily Rates
Nursing Home (Semi-Private Room)
Daily Rates
Assisted Living Facility (One Bedroom – Single Occupancy)
Monthly Rates
RATE RANGE MINIMUM MEDIAN MAXIMUM
MEDIANANNUAL RATE1
FIVE-YEARANNUAL
GROWTH2
Ho
me
Co
mm
uN
ity
FAC
iLit
y
New Hampshire I Cost of Care Survey 2014
New Jersey
Cost of Care Survey 2014 I New Jersey
$11 $20 $27 $45,760 1%
$14 $21 $28 $48,345 1%
$20 $86 $140 $22,360 0%
$2,008 $5,430 $9,300 $65,160 5%
$159 $300 $401 $109,500 2%
$214 $325 $475 $118,625 2%

50
Homemaker Services
Hourly Rates
Home Health Aide Services
Hourly Rates
Adult Day Health Care
Daily Rates
Nursing Home(Private Room)
Daily Rates
Nursing Home (Semi-Private Room)
Daily Rates
Assisted Living Facility (One Bedroom – Single Occupancy)
Monthly Rates
RATE RANGE MINIMUM MEDIAN MAXIMUM
MEDIANANNUAL RATE1
FIVE-YEARANNUAL
GROWTH2
Ho
me
Co
mm
uN
ity
FAC
iLit
y
New Mexico I Cost of Care Survey 2014
New Mexico
$11 $18 $23 $40,200 1%
$11 $19 $25 $43,472 2%
$50 $95 $112 $24,700 N/A
$1,900 $3,500 $6,150 $42,000 7%
$162 $201 $358 $73,263 3%
$175 $227 $459 $82,837 4%

51
Homemaker Services
Hourly Rates
Home Health Aide Services
Hourly Rates
Adult Day Health Care
Daily Rates
Nursing Home(Private Room)
Daily Rates
Nursing Home (Semi-Private Room)
Daily Rates
Assisted Living Facility (One Bedroom – Single Occupancy)
Monthly Rates
RATE RANGE MINIMUM MEDIAN MAXIMUM
MEDIANANNUAL RATE1
FIVE-YEARANNUAL
GROWTH2
Ho
me
Co
mm
uN
ity
FAC
iLit
y
New Mexico I Cost of Care Survey 2014
New York
Cost of Care Survey 2014 I New york
$15 $21 $27 $47,934 3%
$15 $22 $33 $50,336 2%
$26 $75 $215 $19,500 3%
$1,217 $3,684 $10,413 $44,205 4%
$150 $340 $613 $124,100 3%
$150 $358 $650 $130,670 4%

52
Homemaker Services
Hourly Rates
Home Health Aide Services
Hourly Rates
Adult Day Health Care
Daily Rates
Nursing Home(Private Room)
Daily Rates
Nursing Home (Semi-Private Room)
Daily Rates
Assisted Living Facility (One Bedroom – Single Occupancy)
Monthly Rates
RATE RANGE MINIMUM MEDIAN MAXIMUM
MEDIANANNUAL RATE1
FIVE-YEARANNUAL
GROWTH2
Ho
me
Co
mm
uN
ity
FAC
iLit
y
North Carolina I Cost of Care Survey 2014
North Carolina
$10 $17 $23 $38,896 0%
$14 $18 $27 $40,040 0%
$21 $51 $100 $13,260 1%
$1,100 $2,940 $7,895 $35,280 4%
$130 $203 $283 $73,913 3%
$150 $225 $514 $82,125 4%

53
Homemaker Services
Hourly Rates
Home Health Aide Services
Hourly Rates
Adult Day Health Care
Daily Rates
Nursing Home(Private Room)
Daily Rates
Nursing Home (Semi-Private Room)
Daily Rates
Assisted Living Facility (One Bedroom – Single Occupancy)
Monthly Rates
RATE RANGE MINIMUM MEDIAN MAXIMUM
MEDIANANNUAL RATE1
FIVE-YEARANNUAL
GROWTH2
Ho
me
Co
mm
uN
ity
FAC
iLit
y
North Carolina I Cost of Care Survey 2014
North Dakota
Cost of Care Survey 2014 I North Dakota
$20 $25 $26 $56,445 5%
$22 $25 $26 $57,589 5%
$32 $57 $120 $14,695 3%
$1,080 $3,105 $4,625 $37,260 8%
$170 $241 $356 $87,783 9%
$185 $257 $363 $93,623 8%

54
Homemaker Services
Hourly Rates
Home Health Aide Services
Hourly Rates
Adult Day Health Care
Daily Rates
Nursing Home(Private Room)
Daily Rates
Nursing Home (Semi-Private Room)
Daily Rates
Assisted Living Facility (One Bedroom – Single Occupancy)
Monthly Rates
RATE RANGE MINIMUM MEDIAN MAXIMUM
MEDIANANNUAL RATE1
FIVE-YEARANNUAL
GROWTH2
Ho
me
Co
mm
uN
ity
FAC
iLit
y
ohio I Cost of Care Survey 2014
Ohio
$13 $19 $31 $43,083 2%
$13 $19 $31 $43,472 2%
$35 $52 $100 $13,520 1%
$1,385 $3,971 $9,780 $47,646 6%
$138 $208 $315 $75,942 4%
$143 $239 $450 $87,180 4%

55
Homemaker Services
Hourly Rates
Home Health Aide Services
Hourly Rates
Adult Day Health Care
Daily Rates
Nursing Home(Private Room)
Daily Rates
Nursing Home (Semi-Private Room)
Daily Rates
Assisted Living Facility (One Bedroom – Single Occupancy)
Monthly Rates
RATE RANGE MINIMUM MEDIAN MAXIMUM
MEDIANANNUAL RATE1
FIVE-YEARANNUAL
GROWTH2
Ho
me
Co
mm
uN
ity
FAC
iLit
y
ohio I Cost of Care Survey 2014
Oklahoma
Cost of Care Survey 2014 I oklahoma
$15 $18 $25 $41,184 1%
$15 $20 $25 $45,074 2%
$45 $60 $86 $15,600 6%
$1,050 $3,082 $6,400 $36,978 6%
$105 $145 $205 $52,925 3%
$125 $158 $310 $57,488 2%

56
Homemaker Services
Hourly Rates
Home Health Aide Services
Hourly Rates
Adult Day Health Care
Daily Rates
Nursing Home(Private Room)
Daily Rates
Nursing Home (Semi-Private Room)
Daily Rates
Assisted Living Facility (One Bedroom – Single Occupancy)
Monthly Rates
RATE RANGE MINIMUM MEDIAN MAXIMUM
MEDIANANNUAL RATE1
FIVE-YEARANNUAL
GROWTH2
Ho
me
Co
mm
uN
ity
FAC
iLit
y
oregon I Cost of Care Survey 2014
Oregon
$18 $21 $29 $48,048 2%
$18 $22 $31 $49,764 2%
$60 $72 $92 $18,720 -1%
$2,196 $4,000 $5,463 $48,000 7%
$154 $256 $300 $93,258 5%
$227 $265 $425 $96,725 4%

57
Homemaker Services
Hourly Rates
Home Health Aide Services
Hourly Rates
Adult Day Health Care
Daily Rates
Nursing Home(Private Room)
Daily Rates
Nursing Home (Semi-Private Room)
Daily Rates
Assisted Living Facility (One Bedroom – Single Occupancy)
Monthly Rates
RATE RANGE MINIMUM MEDIAN MAXIMUM
MEDIANANNUAL RATE1
FIVE-YEARANNUAL
GROWTH2
Ho
me
Co
mm
uN
ity
FAC
iLit
y
oregon I Cost of Care Survey 2014
Pennsylvania
Cost of Care Survey 2014 I Pennsylvania
$13 $20 $30 $45,760 2%
$13 $20 $30 $45,760 1%
$30 $58 $171 $15,181 3%
$925 $3,280 $7,677 $39,360 5%
$160 $272 $450 $99,196 4%
$168 $295 $450 $107,493 4%

58
Homemaker Services
Hourly Rates
Home Health Aide Services
Hourly Rates
Adult Day Health Care
Daily Rates
Nursing Home(Private Room)
Daily Rates
Nursing Home (Semi-Private Room)
Daily Rates
Assisted Living Facility (One Bedroom – Single Occupancy)
Monthly Rates
RATE RANGE MINIMUM MEDIAN MAXIMUM
MEDIANANNUAL RATE1
FIVE-YEARANNUAL
GROWTH2
Ho
me
Co
mm
uN
ity
FAC
iLit
y
Puerto Rico I Cost of Care Survey 2014
Puerto Rico
N/A N/A N/A N/A N/A
N/A N/A N/A N/A N/A
N/A N/A N/A N/A N/A
$900 $1,300 $11,300 $15,600 N/A
N/A N/A N/A N/A N/A
N/A N/A N/A N/A N/A
59
Homemaker Services
Hourly Rates
Home Health Aide Services
Hourly Rates
Adult Day Health Care
Daily Rates
Nursing Home(Private Room)
Daily Rates
Nursing Home (Semi-Private Room)
Daily Rates
Assisted Living Facility (One Bedroom – Single Occupancy)
Monthly Rates
RATE RANGE MINIMUM MEDIAN MAXIMUM
MEDIANANNUAL RATE1
FIVE-YEARANNUAL
GROWTH2
Ho
me
Co
mm
uN
ity
FAC
iLit
y
Puerto Rico I Cost of Care Survey 2014
Rhode Island
Cost of Care Survey 2014 I Rhode island
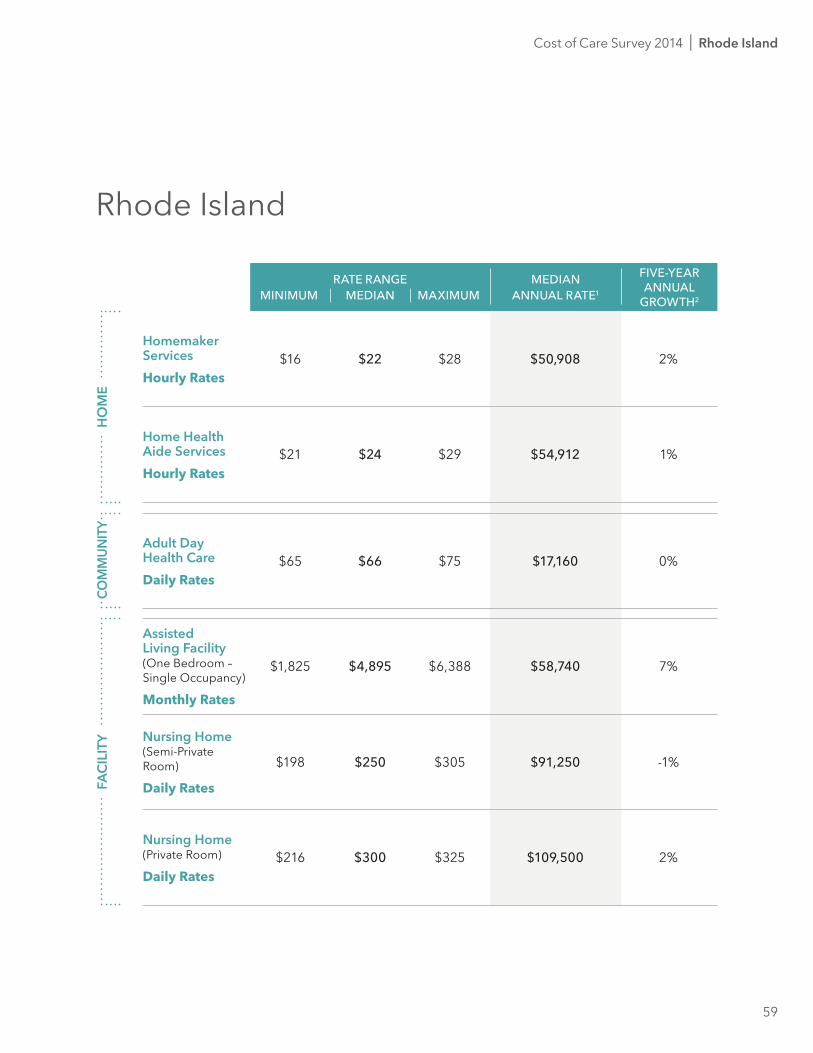
$16 $22 $28 $50,908 2%
$21 $24 $29 $54,912 1%
$65 $66 $75 $17,160 0%
$1,825 $4,895 $6,388 $58,740 7%
$198 $250 $305 $91,250 -1%
$216 $300 $325 $109,500 2%

60
Homemaker Services
Hourly Rates
Home Health Aide Services
Hourly Rates
Adult Day Health Care
Daily Rates
Nursing Home(Private Room)
Daily Rates
Nursing Home (Semi-Private Room)
Daily Rates
Assisted Living Facility (One Bedroom – Single Occupancy)
Monthly Rates
RATE RANGE MINIMUM MEDIAN MAXIMUM
MEDIANANNUAL RATE1
FIVE-YEARANNUAL
GROWTH2
Ho
me
Co
mm
uN
ity
FAC
iLit
y
South Carolina I Cost of Care Survey 2014
South Carolina
$13 $18 $22 $40,040 2%
$13 $18 $23 $41,184 1%
$35 $50 $178 $13,000 1%
$930 $2,874 $5,910 $34,485 1%
$133 $185 $260 $67,525 2%
$150 $200 $300 $73,000 2%

61
Homemaker Services
Hourly Rates
Home Health Aide Services
Hourly Rates
Adult Day Health Care
Daily Rates
Nursing Home(Private Room)
Daily Rates
Nursing Home (Semi-Private Room)
Daily Rates
Assisted Living Facility (One Bedroom – Single Occupancy)
Monthly Rates
RATE RANGE MINIMUM MEDIAN MAXIMUM
MEDIANANNUAL RATE1
FIVE-YEARANNUAL
GROWTH2
Ho
me
Co
mm
uN
ity
FAC
iLit
y
South Carolina I Cost of Care Survey 2014
South Dakota
Cost of Care Survey 2014 I South Dakota
$18 $22 $24 $49,764 5%
$18 $22 $24 $49,764 3%
$64 $72 $88 $18,720 12%
$1,900 $3,110 $6,215 $37,320 5%
$160 $186 $250 $67,890 2%
$167 $194 $311 $70,810 2%

62
Homemaker Services
Hourly Rates
Home Health Aide Services
Hourly Rates
Adult Day Health Care
Daily Rates
Nursing Home(Private Room)
Daily Rates
Nursing Home (Semi-Private Room)
Daily Rates
Assisted Living Facility (One Bedroom – Single Occupancy)
Monthly Rates
RATE RANGE MINIMUM MEDIAN MAXIMUM
MEDIANANNUAL RATE1
FIVE-YEARANNUAL
GROWTH2
Ho
me
Co
mm
uN
ity
FAC
iLit
y
Tennessee I Cost of Care Survey 2014
Tennessee
$13 $17 $29 $39,582 2%
$13 $18 $32 $41,184 1%
$15 $55 $115 $14,300 2%
$1,300 $3,465 $5,600 $41,580 6%
$145 $185 $279 $67,525 3%
$160 $198 $395 $72,088 2%

63
Homemaker Services
Hourly Rates
Home Health Aide Services
Hourly Rates
Adult Day Health Care
Daily Rates
Nursing Home(Private Room)
Daily Rates
Nursing Home (Semi-Private Room)
Daily Rates
Assisted Living Facility (One Bedroom – Single Occupancy)
Monthly Rates
RATE RANGE MINIMUM MEDIAN MAXIMUM
MEDIANANNUAL RATE1
FIVE-YEARANNUAL
GROWTH2
Ho
me
Co
mm
uN
ity
FAC
iLit
y
Tennessee I Cost of Care Survey 2014
Texas
Cost of Care Survey 2014 I Texas
$9 $18 $36 $41,184 2%
$9 $18 $36 $41,184 1%
$12 $35 $100 $8,970 3%
$825 $3,523 $8,605 $42,270 5%
$94 $139 $260 $50,735 3%
$110 $180 $363 $65,700 3%

64
Homemaker Services
Hourly Rates
Home Health Aide Services
Hourly Rates
Adult Day Health Care
Daily Rates
Nursing Home(Private Room)
Daily Rates
Nursing Home (Semi-Private Room)
Daily Rates
Assisted Living Facility (One Bedroom – Single Occupancy)
Monthly Rates
RATE RANGE MINIMUM MEDIAN MAXIMUM
MEDIANANNUAL RATE1
FIVE-YEARANNUAL
GROWTH2
Ho
me
Co
mm
uN
ity
FAC
iLit
y
Utah I Cost of Care Survey 2014
utah
$15 $21 $25 $48,048 3%
$15 $21 $25 $48,048 2%
$20 $47 $50 $12,090 4%
$1,650 $3,061 $6,250 $36,732 3%
$130 $173 $323 $62,963 4%
$140 $200 $500 $73,000 4%

65
Homemaker Services
Hourly Rates
Home Health Aide Services
Hourly Rates
Adult Day Health Care
Daily Rates
Nursing Home(Private Room)
Daily Rates
Nursing Home (Semi-Private Room)
Daily Rates
Assisted Living Facility (One Bedroom – Single Occupancy)
Monthly Rates
RATE RANGE MINIMUM MEDIAN MAXIMUM
MEDIANANNUAL RATE1
FIVE-YEARANNUAL
GROWTH2
Ho
me
Co
mm
uN
ity
FAC
iLit
y
Utah I Cost of Care Survey 2014
Vermont
Cost of Care Survey 2014 I Vermont
$10 $23 $30 $52,624 1%
$10 $24 $30 $53,768 1%
$19 $135 $185 $35,100 2%
$1,620 $4,075 $6,475 $48,900 7%
$250 $277 $340 $100,923 4%
$260 $303 $362 $110,413 4%

66
Homemaker Services
Hourly Rates
Home Health Aide Services
Hourly Rates
Adult Day Health Care
Daily Rates
Nursing Home(Private Room)
Daily Rates
Nursing Home (Semi-Private Room)
Daily Rates
Assisted Living Facility (One Bedroom – Single Occupancy)
Monthly Rates
RATE RANGE MINIMUM MEDIAN MAXIMUM
MEDIANANNUAL RATE1
FIVE-YEARANNUAL
GROWTH2
Ho
me
Co
mm
uN
ity
FAC
iLit
y
Virginia I Cost of Care Survey 2014
Virginia
$8 $18 $26 $41,184 2%
$13 $19 $26 $43,472 1%
$46 $61 $107 $15,860 1%
$1,159 $3,990 $6,681 $47,880 5%
$117 $211 $399 $77,015 4%
$160 $231 $399 $84,315 3%

67
Homemaker Services
Hourly Rates
Home Health Aide Services
Hourly Rates
Adult Day Health Care
Daily Rates
Nursing Home(Private Room)
Daily Rates
Nursing Home (Semi-Private Room)
Daily Rates
Assisted Living Facility (One Bedroom – Single Occupancy)
Monthly Rates
RATE RANGE MINIMUM MEDIAN MAXIMUM
MEDIANANNUAL RATE1
FIVE-YEARANNUAL
GROWTH2
Ho
me
Co
mm
uN
ity
FAC
iLit
y
Virginia I Cost of Care Survey 2014
Washington
Cost of Care Survey 2014 I Washington
$16 $23 $30 $51,777 3%
$16 $23 $30 $52,624 3%
$17 $67 $144 $17,443 3%
$1,000 $4,250 $9,000 $51,000 6%
$100 $253 $362 $92,345 4%
$190 $280 $434 $102,018 4%

68
Homemaker Services
Hourly Rates
Home Health Aide Services
Hourly Rates
Adult Day Health Care
Daily Rates
Nursing Home(Private Room)
Daily Rates
Nursing Home (Semi-Private Room)
Daily Rates
Assisted Living Facility (One Bedroom – Single Occupancy)
Monthly Rates
RATE RANGE MINIMUM MEDIAN MAXIMUM
MEDIANANNUAL RATE1
FIVE-YEARANNUAL
GROWTH2
Ho
me
Co
mm
uN
ity
FAC
iLit
y
West Virginia I Cost of Care Survey 2014
West Virginia
$12 $16 $22 $35,464 4%
$14 $16 $22 $36,608 4%
$38 $50 $67 $13,000 2%
$1,600 $3,465 $6,120 $41,580 7%
$160 $254 $340 $92,528 5%
$165 $265 $350 $96,725 5%

69
Homemaker Services
Hourly Rates
Home Health Aide Services
Hourly Rates
Adult Day Health Care
Daily Rates
Nursing Home(Private Room)
Daily Rates
Nursing Home (Semi-Private Room)
Daily Rates
Assisted Living Facility (One Bedroom – Single Occupancy)
Monthly Rates
RATE RANGE MINIMUM MEDIAN MAXIMUM
MEDIANANNUAL RATE1
FIVE-YEARANNUAL
GROWTH2
Ho
me
Co
mm
uN
ity
FAC
iLit
y
West Virginia I Cost of Care Survey 2014
Wisconsin
Cost of Care Survey 2014 I Wisconsin
$15 $21 $32 $46,904 2%
$17 $22 $32 $50,336 1%
$36 $60 $100 $15,600 2%
$911 $3,850 $9,750 $46,200 4%
$170 $239 $516 $87,363 4%
$195 $267 $516 $97,455 4%
70
Homemaker Services
Hourly Rates
Home Health Aide Services
Hourly Rates
Adult Day Health Care
Daily Rates
Nursing Home(Private Room)
Daily Rates
Nursing Home (Semi-Private Room)
Daily Rates
Assisted Living Facility (One Bedroom – Single Occupancy)
Monthly Rates
RATE RANGE MINIMUM MEDIAN MAXIMUM
MEDIANANNUAL RATE1
FIVE-YEARANNUAL
GROWTH2
Ho
me
Co
mm
uN
ity
FAC
iLit
y
Wyoming I Cost of Care Survey 2014
Wyoming
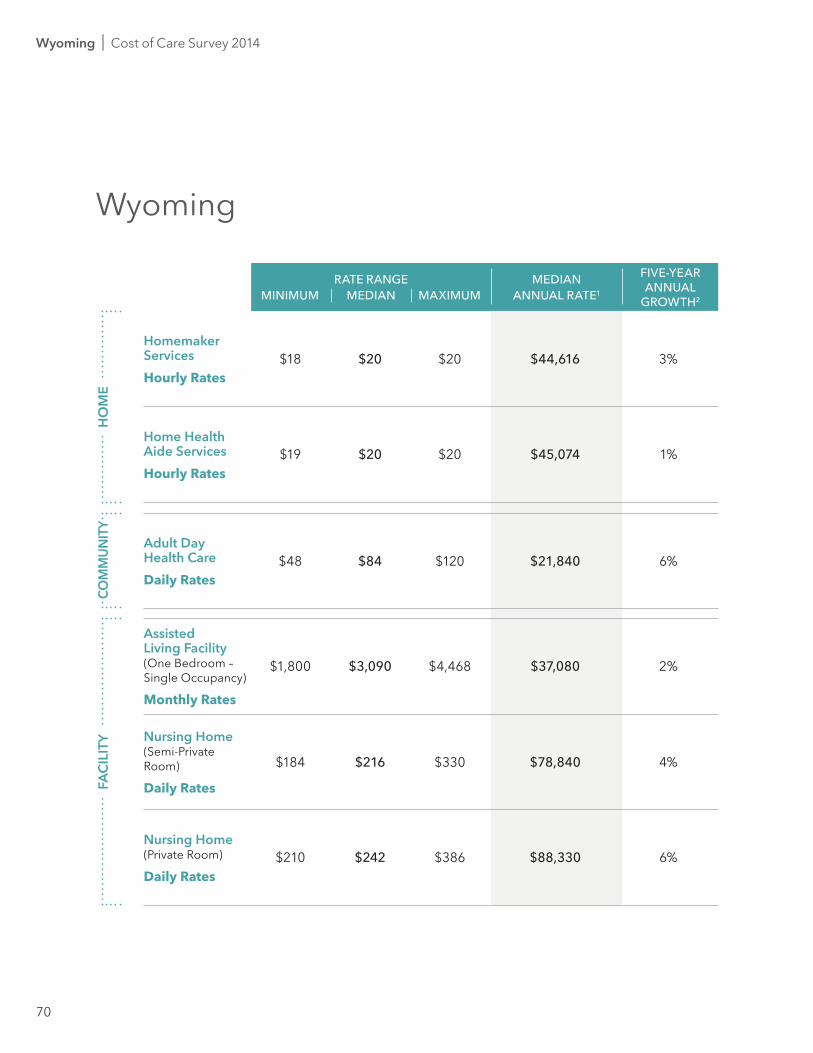
$18 $20 $20 $44,616 3%
$19 $20 $20 $45,074 1%
$48 $84 $120 $21,840 6%
$1,800 $3,090 $4,468 $37,080 2%
$184 $216 $330 $78,840 4%
$210 $242 $386 $88,330 6%
71
Cost of Care Survey 2014Wyoming I Cost of Care Survey 2014
Data Table End Notes
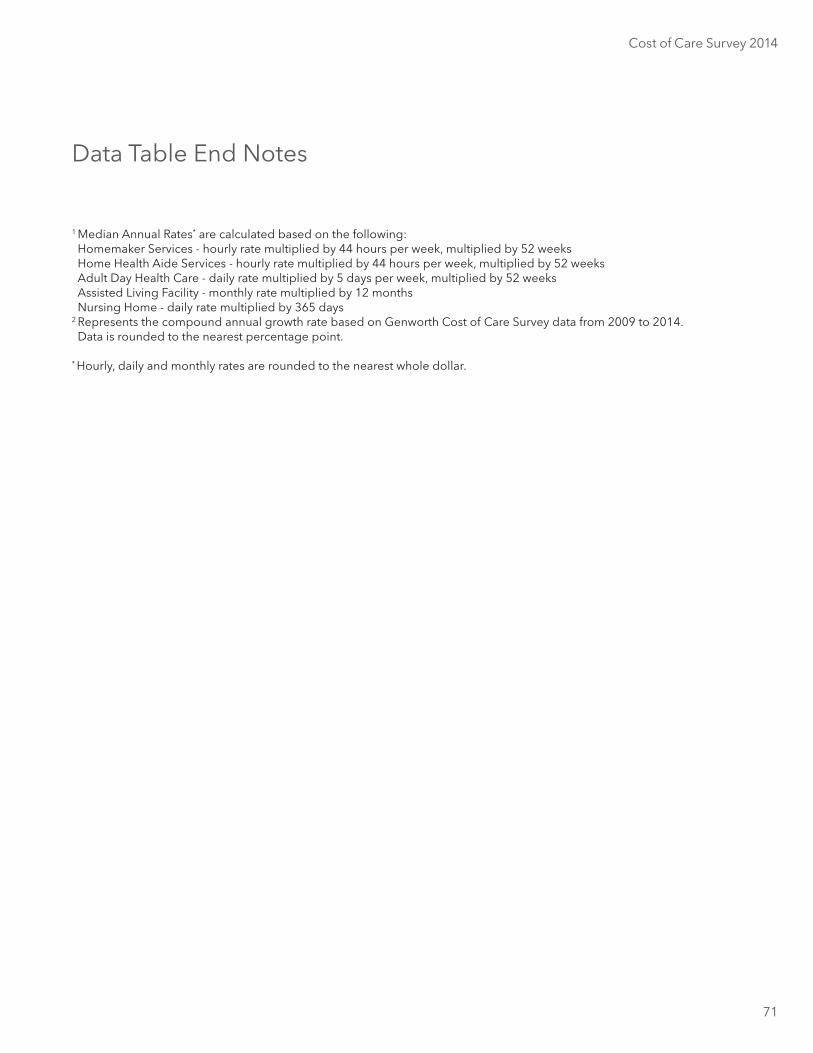
1 Median Annual Rates* are calculated based on the following: Homemaker Services - hourly rate multiplied by 44 hours per week, multiplied by 52 weeks Home Health Aide Services - hourly rate multiplied by 44 hours per week, multiplied by 52 weeks Adult Day Health Care - daily rate multiplied by 5 days per week, multiplied by 52 weeks Assisted Living Facility - monthly rate multiplied by 12 months Nursing Home - daily rate multiplied by 365 days
2 Represents the compound annual growth rate based on Genworth Cost of Care Survey data from 2009 to 2014. Data is rounded to the nearest percentage point.
* Hourly, daily and monthly rates are rounded to the nearest whole dollar.
72
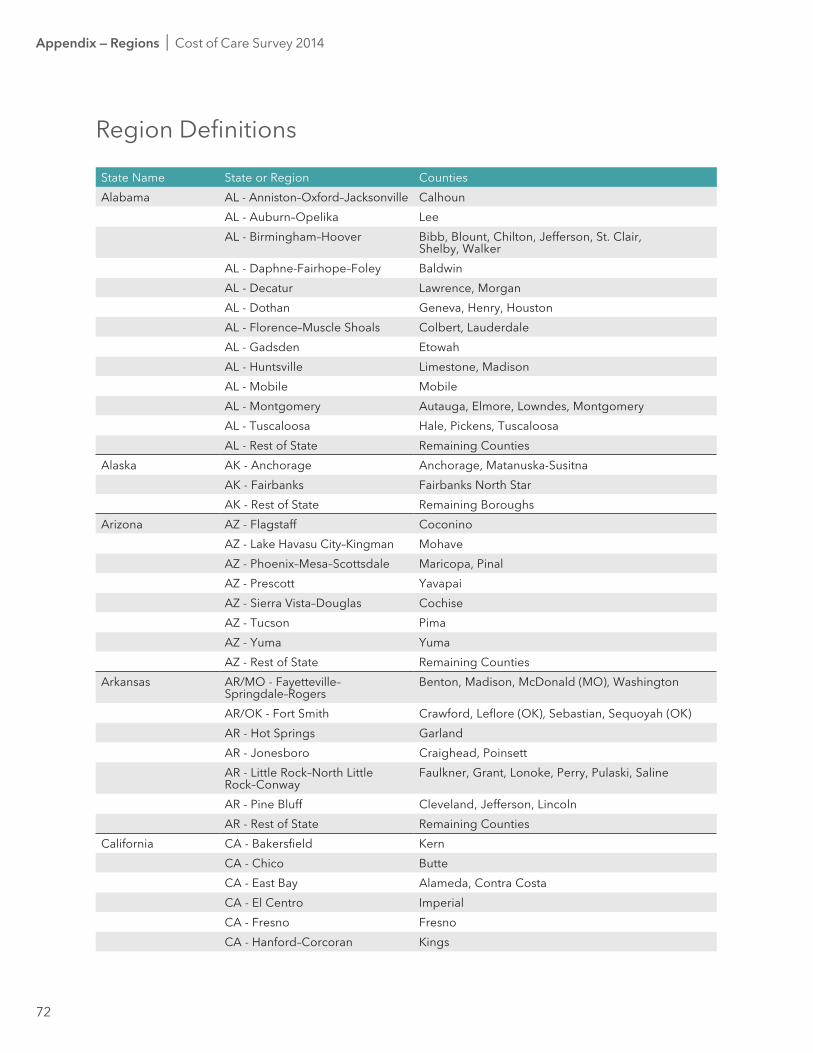
State Name State or Region Counties
Region Definitions
Appendix — Regions I Cost of Care Survey 2014
Alabama AL - Anniston–Oxford–Jacksonville Calhoun
AL - Auburn–Opelika Lee
AL - Birmingham–Hoover Bibb, Blount, Chilton, Jefferson, St. Clair, Shelby, Walker
AL - Daphne-Fairhope–Foley Baldwin
AL - Decatur Lawrence, Morgan
AL - Dothan Geneva, Henry, Houston
AL - Florence–Muscle Shoals Colbert, Lauderdale
AL - Gadsden Etowah
AL - Huntsville Limestone, Madison
AL - Mobile Mobile
AL - Montgomery Autauga, Elmore, Lowndes, Montgomery
AL - Tuscaloosa Hale, Pickens, Tuscaloosa
AL - Rest of State Remaining Counties
Alaska AK - Anchorage Anchorage, Matanuska-Susitna
AK - Fairbanks Fairbanks North Star
AK - Rest of State Remaining Boroughs
Arizona AZ - Flagstaff Coconino
AZ - Lake Havasu City–Kingman Mohave
AZ - Phoenix–Mesa–Scottsdale Maricopa, Pinal
AZ - Prescott Yavapai
AZ - Sierra Vista–Douglas Cochise
AZ - Tucson Pima
AZ - Yuma Yuma
AZ - Rest of State Remaining Counties
Arkansas AR/MO - Fayetteville– Springdale–Rogers
Benton, Madison, McDonald (MO), Washington
AR/OK - Fort Smith Crawford, Leflore (OK), Sebastian, Sequoyah (OK)
AR - Hot Springs Garland
AR - Jonesboro Craighead, Poinsett
AR - Little Rock–North Little Rock–Conway
Faulkner, Grant, Lonoke, Perry, Pulaski, Saline
AR - Pine Bluff Cleveland, Jefferson, Lincoln
AR - Rest of State Remaining Counties
California CA - Bakersfield Kern
CA - Chico Butte
CA - East Bay Alameda, Contra Costa
CA - El Centro Imperial
CA - Fresno Fresno
CA - Hanford–Corcoran Kings
73
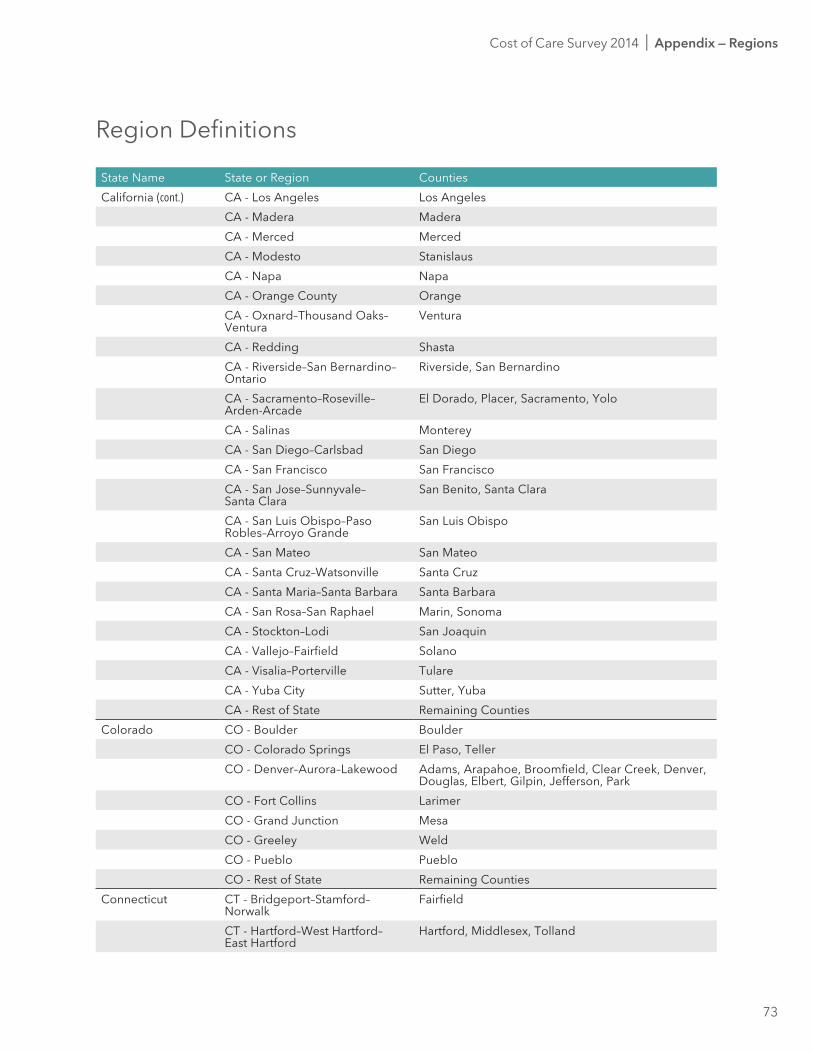
State Name State or Region Counties
Region Definitions
Cost of Care Survey 2014 I Appendix — Regions
California (cont.) CA - Los Angeles Los Angeles
CA - Madera Madera
CA - Merced Merced
CA - Modesto Stanislaus
CA - Napa Napa
CA - Orange County Orange
CA - Oxnard–Thousand Oaks–Ventura
Ventura
CA - Redding Shasta
CA - Riverside–San Bernardino–Ontario
Riverside, San Bernardino
CA - Sacramento–Roseville– Arden-Arcade
El Dorado, Placer, Sacramento, Yolo
CA - Salinas Monterey
CA - San Diego–Carlsbad San Diego
CA - San Francisco San Francisco
CA - San Jose–Sunnyvale– Santa Clara
San Benito, Santa Clara
CA - San Luis Obispo–Paso Robles–Arroyo Grande
San Luis Obispo
CA - San Mateo San Mateo
CA - Santa Cruz–Watsonville Santa Cruz
CA - Santa Maria–Santa Barbara Santa Barbara
CA - San Rosa–San Raphael Marin, Sonoma
CA - Stockton–Lodi San Joaquin
CA - Vallejo–Fairfield Solano
CA - Visalia–Porterville Tulare
CA - Yuba City Sutter, Yuba
CA - Rest of State Remaining Counties
Colorado CO - Boulder Boulder
CO - Colorado Springs El Paso, Teller
CO - Denver–Aurora–Lakewood Adams, Arapahoe, Broomfield, Clear Creek, Denver, Douglas, Elbert, Gilpin, Jefferson, Park
CO - Fort Collins Larimer
CO - Grand Junction Mesa
CO - Greeley Weld
CO - Pueblo Pueblo
CO - Rest of State Remaining Counties
Connecticut CT - Bridgeport–Stamford–Norwalk
Fairfield
CT - Hartford–West Hartford– East Hartford
Hartford, Middlesex, Tolland
74
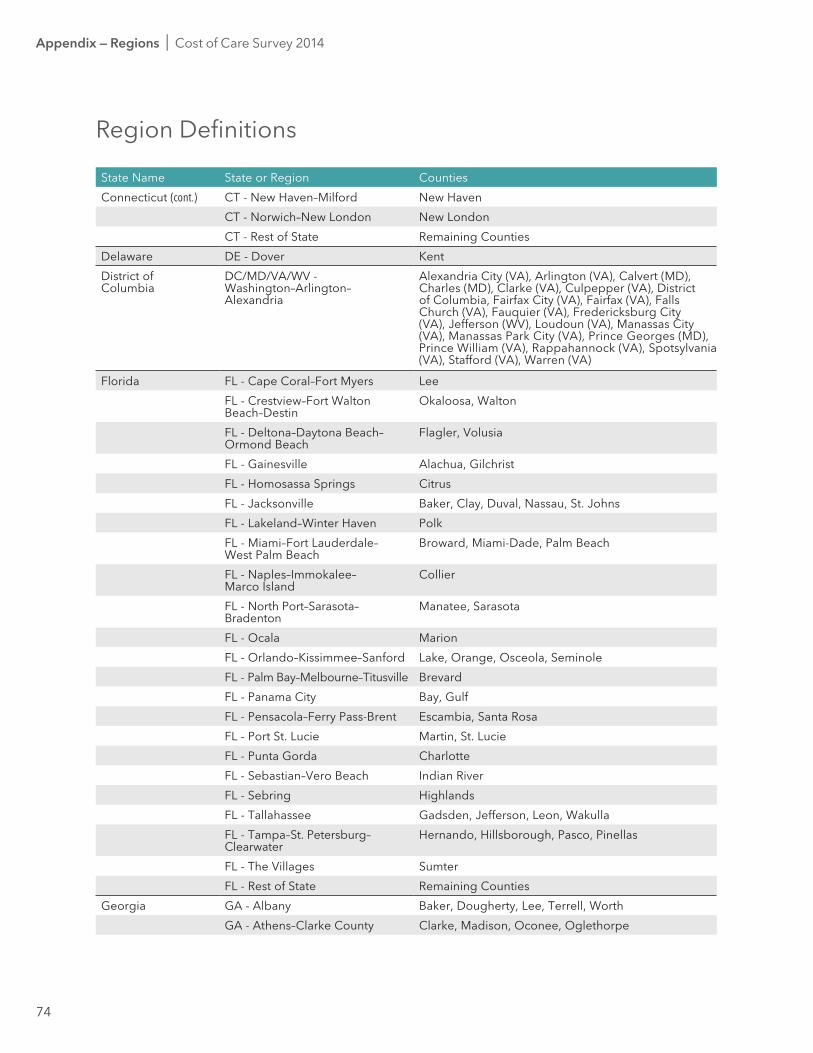
State Name State or Region Counties
Region Definitions
Appendix — Regions I Cost of Care Survey 2014
Connecticut (cont.) CT - New Haven–Milford New Haven
CT - Norwich–New London New London
CT - Rest of State Remaining Counties
Delaware DE - Dover Kent
District of Columbia
DC/MD/VA/WV - Washington–Arlington–Alexandria
Alexandria City (VA), Arlington (VA), Calvert (MD), Charles (MD), Clarke (VA), Culpepper (VA), District of Columbia, Fairfax City (VA), Fairfax (VA), Falls Church (VA), Fauquier (VA), Fredericksburg City (VA), Jefferson (WV), Loudoun (VA), Manassas City (VA), Manassas Park City (VA), Prince Georges (MD), Prince William (VA), Rappahannock (VA), Spotsylvania (VA), Stafford (VA), Warren (VA)
Florida FL - Cape Coral–Fort Myers Lee
FL - Crestview–Fort Walton Beach–Destin
Okaloosa, Walton
FL - Deltona–Daytona Beach–Ormond Beach
Flagler, Volusia
FL - Gainesville Alachua, Gilchrist
FL - Homosassa Springs Citrus
FL - Jacksonville Baker, Clay, Duval, Nassau, St. Johns
FL - Lakeland–Winter Haven Polk
FL - Miami–Fort Lauderdale– West Palm Beach
Broward, Miami-Dade, Palm Beach
FL - Naples–Immokalee– Marco Island
Collier
FL - North Port–Sarasota–Bradenton
Manatee, Sarasota
FL - Ocala Marion
FL - Orlando–Kissimmee–Sanford Lake, Orange, Osceola, Seminole
FL - Palm Bay–Melbourne–Titusville Brevard
FL - Panama City Bay, Gulf
FL - Pensacola–Ferry Pass-Brent Escambia, Santa Rosa
FL - Port St. Lucie Martin, St. Lucie
FL - Punta Gorda Charlotte
FL - Sebastian–Vero Beach Indian River
FL - Sebring Highlands
FL - Tallahassee Gadsden, Jefferson, Leon, Wakulla
FL - Tampa–St. Petersburg–Clearwater
Hernando, Hillsborough, Pasco, Pinellas
FL - The Villages Sumter
FL - Rest of State Remaining Counties
Georgia GA - Albany Baker, Dougherty, Lee, Terrell, Worth
GA - Athens–Clarke County Clarke, Madison, Oconee, Oglethorpe
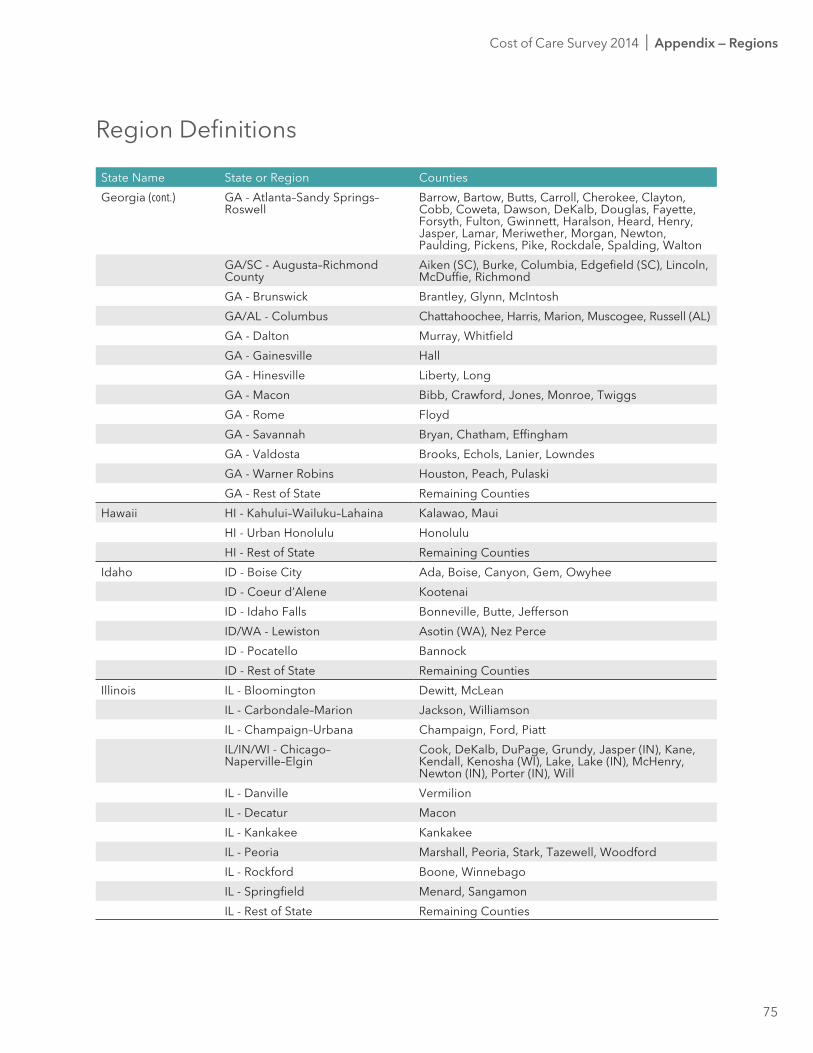
75
State Name State or Region Counties
Region Definitions
Georgia (cont.) GA - Atlanta–Sandy Springs–Roswell
Barrow, Bartow, Butts, Carroll, Cherokee, Clayton, Cobb, Coweta, Dawson, DeKalb, Douglas, Fayette, Forsyth, Fulton, Gwinnett, Haralson, Heard, Henry, Jasper, Lamar, Meriwether, Morgan, Newton, Paulding, Pickens, Pike, Rockdale, Spalding, Walton
GA/SC - Augusta–Richmond County
Aiken (SC), Burke, Columbia, Edgefield (SC), Lincoln, McDuffie, Richmond
GA - Brunswick Brantley, Glynn, McIntosh
GA/AL - Columbus Chattahoochee, Harris, Marion, Muscogee, Russell (AL)
GA - Dalton Murray, Whitfield
GA - Gainesville Hall
GA - Hinesville Liberty, Long
GA - Macon Bibb, Crawford, Jones, Monroe, Twiggs
GA - Rome Floyd
GA - Savannah Bryan, Chatham, Effingham
GA - Valdosta Brooks, Echols, Lanier, Lowndes
GA - Warner Robins Houston, Peach, Pulaski
GA - Rest of State Remaining Counties
Hawaii HI - Kahului–Wailuku–Lahaina Kalawao, Maui
HI - urban Honolulu Honolulu
HI - Rest of State Remaining Counties
Idaho ID - Boise City Ada, Boise, Canyon, Gem, Owyhee
ID - Coeur d’Alene Kootenai
ID - Idaho Falls Bonneville, Butte, Jefferson
ID/WA - Lewiston Asotin (WA), Nez Perce
ID - Pocatello Bannock
ID - Rest of State Remaining Counties
Illinois IL - Bloomington Dewitt, McLean
IL - Carbondale–Marion Jackson, Williamson
IL - Champaign–urbana Champaign, Ford, Piatt
IL/IN/WI - Chicago– Naperville–Elgin
Cook, DeKalb, DuPage, Grundy, Jasper (IN), Kane, Kendall, Kenosha (WI), Lake, Lake (IN), McHenry, Newton (IN), Porter (IN), Will
IL - Danville Vermilion
IL - Decatur Macon
IL - Kankakee Kankakee
IL - Peoria Marshall, Peoria, Stark, Tazewell, Woodford
IL - Rockford Boone, Winnebago
IL - Springfield Menard, Sangamon
IL - Rest of State Remaining Counties
Cost of Care Survey 2014 I Appendix — Regions
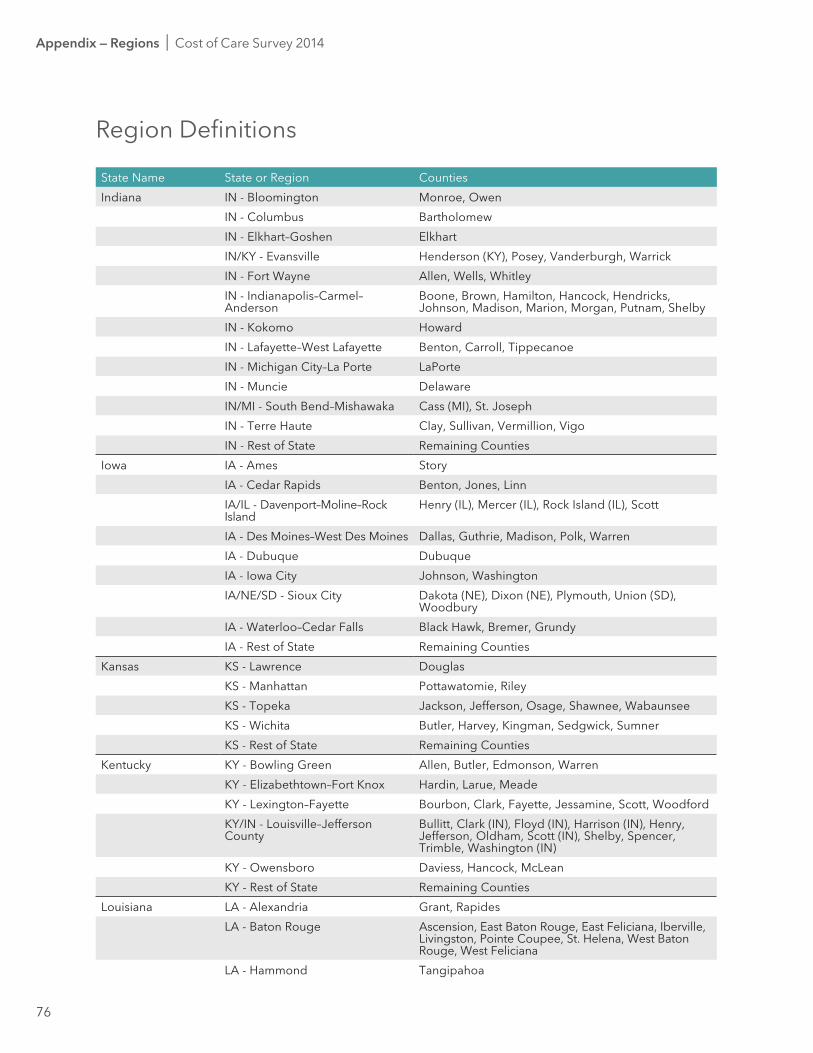
76
State Name State or Region Counties
Region Definitions
Appendix — Regions I Cost of Care Survey 2014
Indiana IN - Bloomington Monroe, Owen
IN - Columbus Bartholomew
IN - Elkhart–Goshen Elkhart
IN/KY - Evansville Henderson (KY), Posey, Vanderburgh, Warrick
IN - Fort Wayne Allen, Wells, Whitley
IN - Indianapolis–Carmel–Anderson
Boone, Brown, Hamilton, Hancock, Hendricks, Johnson, Madison, Marion, Morgan, Putnam, Shelby
IN - Kokomo Howard
IN - Lafayette–West Lafayette Benton, Carroll, Tippecanoe
IN - Michigan City–La Porte LaPorte
IN - Muncie Delaware
IN/MI - South Bend–Mishawaka Cass (MI), St. Joseph
IN - Terre Haute Clay, Sullivan, Vermillion, Vigo
IN - Rest of State Remaining Counties
Iowa IA - Ames Story
IA - Cedar Rapids Benton, Jones, Linn
IA/IL - Davenport–Moline–Rock Island
Henry (IL), Mercer (IL), Rock Island (IL), Scott
IA - Des Moines–West Des Moines Dallas, Guthrie, Madison, Polk, Warren
IA - Dubuque Dubuque
IA - Iowa City Johnson, Washington
IA/NE/SD - Sioux City Dakota (NE), Dixon (NE), Plymouth, union (SD), Woodbury
IA - Waterloo–Cedar Falls Black Hawk, Bremer, Grundy
IA - Rest of State Remaining Counties
Kansas KS - Lawrence Douglas
KS - Manhattan Pottawatomie, Riley
KS - Topeka Jackson, Jefferson, Osage, Shawnee, Wabaunsee
KS - Wichita Butler, Harvey, Kingman, Sedgwick, Sumner
KS - Rest of State Remaining Counties
Kentucky KY - Bowling Green Allen, Butler, Edmonson, Warren
KY - Elizabethtown–Fort Knox Hardin, Larue, Meade
KY - Lexington–Fayette Bourbon, Clark, Fayette, Jessamine, Scott, Woodford
KY/IN - Louisville–Jefferson County
Bullitt, Clark (IN), Floyd (IN), Harrison (IN), Henry, Jefferson, Oldham, Scott (IN), Shelby, Spencer, Trimble, Washington (IN)
KY - Owensboro Daviess, Hancock, McLean
KY - Rest of State Remaining Counties
Louisiana LA - Alexandria Grant, Rapides
LA - Baton Rouge Ascension, East Baton Rouge, East Feliciana, Iberville, Livingston, Pointe Coupee, St. Helena, West Baton Rouge, West Feliciana
LA - Hammond Tangipahoa
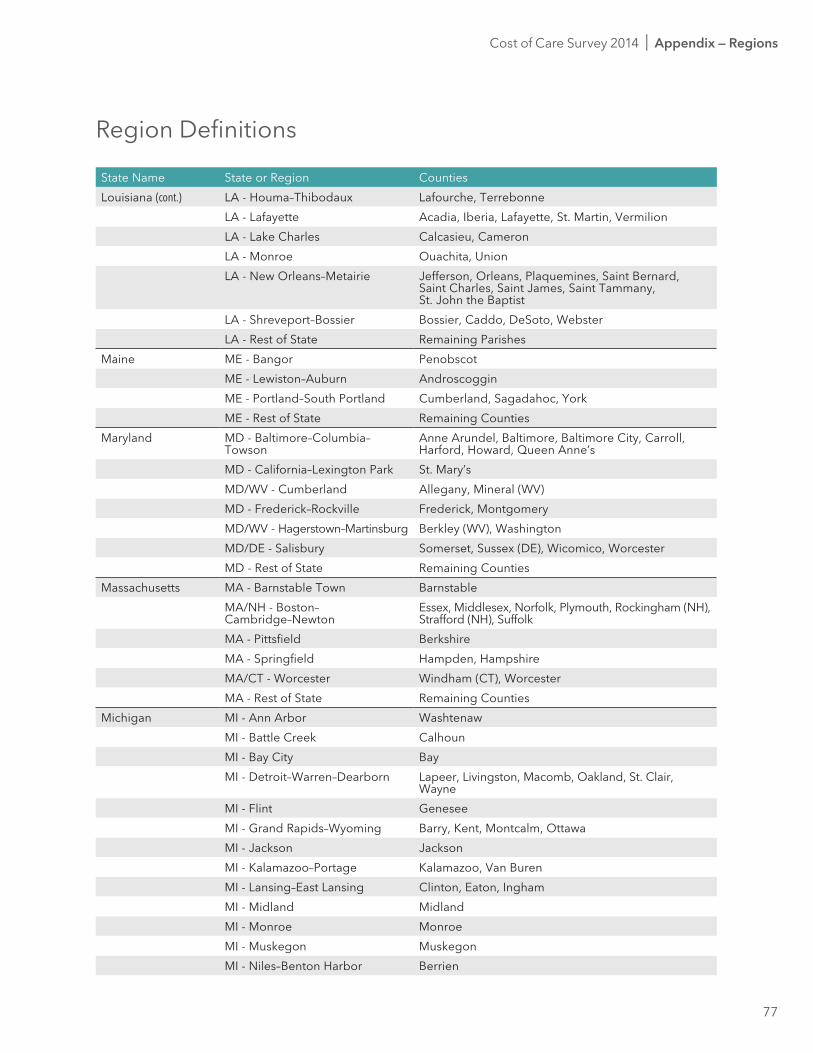
77
State Name State or Region Counties
Region Definitions
Cost of Care Survey 2014 I Appendix — Regions
Louisiana (cont.) LA - Houma–Thibodaux Lafourche, Terrebonne
LA - Lafayette Acadia, Iberia, Lafayette, St. Martin, Vermilion
LA - Lake Charles Calcasieu, Cameron
LA - Monroe Ouachita, union
LA - New Orleans–Metairie Jefferson, Orleans, Plaquemines, Saint Bernard, Saint Charles, Saint James, Saint Tammany, St. John the Baptist
LA - Shreveport–Bossier Bossier, Caddo, DeSoto, Webster
LA - Rest of State Remaining Parishes
Maine ME - Bangor Penobscot
ME - Lewiston–Auburn Androscoggin
ME - Portland–South Portland Cumberland, Sagadahoc, York
ME - Rest of State Remaining Counties
Maryland MD - Baltimore–Columbia–Towson
Anne Arundel, Baltimore, Baltimore City, Carroll, Harford, Howard, Queen Anne’s
MD - California–Lexington Park St. Mary’s
MD/WV - Cumberland Allegany, Mineral (WV)
MD - Frederick–Rockville Frederick, Montgomery
MD/WV - Hagerstown–Martinsburg Berkley (WV), Washington
MD/DE - Salisbury Somerset, Sussex (DE), Wicomico, Worcester
MD - Rest of State Remaining Counties
Massachusetts MA - Barnstable Town Barnstable
MA/NH - Boston– Cambridge–Newton
Essex, Middlesex, Norfolk, Plymouth, Rockingham (NH), Strafford (NH), Suffolk
MA - Pittsfield Berkshire
MA - Springfield Hampden, Hampshire
MA/CT - Worcester Windham (CT), Worcester
MA - Rest of State Remaining Counties
Michigan MI - Ann Arbor Washtenaw
MI - Battle Creek Calhoun
MI - Bay City Bay
MI - Detroit–Warren–Dearborn Lapeer, Livingston, Macomb, Oakland, St. Clair, Wayne
MI - Flint Genesee
MI - Grand Rapids–Wyoming Barry, Kent, Montcalm, Ottawa
MI - Jackson Jackson
MI - Kalamazoo–Portage Kalamazoo, Van Buren
MI - Lansing–East Lansing Clinton, Eaton, Ingham
MI - Midland Midland
MI - Monroe Monroe
MI - Muskegon Muskegon
MI - Niles–Benton Harbor Berrien
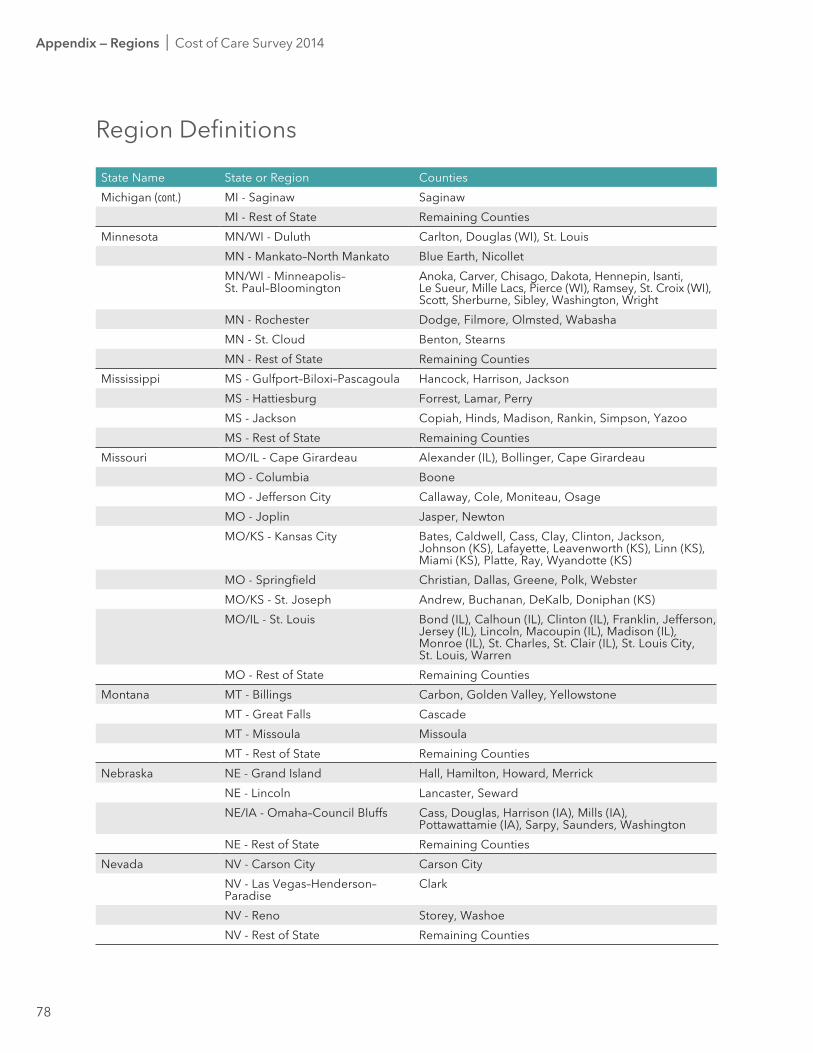
78
State Name State or Region Counties
Region Definitions
Appendix — Regions I Cost of Care Survey 2014
Michigan (cont.) MI - Saginaw Saginaw
MI - Rest of State Remaining Counties
Minnesota MN/WI - Duluth Carlton, Douglas (WI), St. Louis
MN - Mankato–North Mankato Blue Earth, Nicollet
MN/WI - Minneapolis– St. Paul–Bloomington
Anoka, Carver, Chisago, Dakota, Hennepin, Isanti, Le Sueur, Mille Lacs, Pierce (WI), Ramsey, St. Croix (WI), Scott, Sherburne, Sibley, Washington, Wright
MN - Rochester Dodge, Filmore, Olmsted, Wabasha
MN - St. Cloud Benton, Stearns
MN - Rest of State Remaining Counties
Mississippi MS - Gulfport–Biloxi–Pascagoula Hancock, Harrison, Jackson
MS - Hattiesburg Forrest, Lamar, Perry
MS - Jackson Copiah, Hinds, Madison, Rankin, Simpson, Yazoo
MS - Rest of State Remaining Counties
Missouri MO/IL - Cape Girardeau Alexander (IL), Bollinger, Cape Girardeau
MO - Columbia Boone
MO - Jefferson City Callaway, Cole, Moniteau, Osage
MO - Joplin Jasper, Newton
MO/KS - Kansas City Bates, Caldwell, Cass, Clay, Clinton, Jackson, Johnson (KS), Lafayette, Leavenworth (KS), Linn (KS), Miami (KS), Platte, Ray, Wyandotte (KS)
MO - Springfield Christian, Dallas, Greene, Polk, Webster
MO/KS - St. Joseph Andrew, Buchanan, DeKalb, Doniphan (KS)
MO/IL - St. Louis Bond (IL), Calhoun (IL), Clinton (IL), Franklin, Jefferson, Jersey (IL), Lincoln, Macoupin (IL), Madison (IL), Monroe (IL), St. Charles, St. Clair (IL), St. Louis City, St. Louis, Warren
MO - Rest of State Remaining Counties
Montana MT - Billings Carbon, Golden Valley, Yellowstone
MT - Great Falls Cascade
MT - Missoula Missoula
MT - Rest of State Remaining Counties
Nebraska NE - Grand Island Hall, Hamilton, Howard, Merrick
NE - Lincoln Lancaster, Seward
NE/IA - Omaha–Council Bluffs Cass, Douglas, Harrison (IA), Mills (IA), Pottawattamie (IA), Sarpy, Saunders, Washington
NE - Rest of State Remaining Counties
Nevada NV - Carson City Carson City
NV - Las Vegas–Henderson–Paradise
Clark
NV - Reno Storey, Washoe
NV - Rest of State Remaining Counties
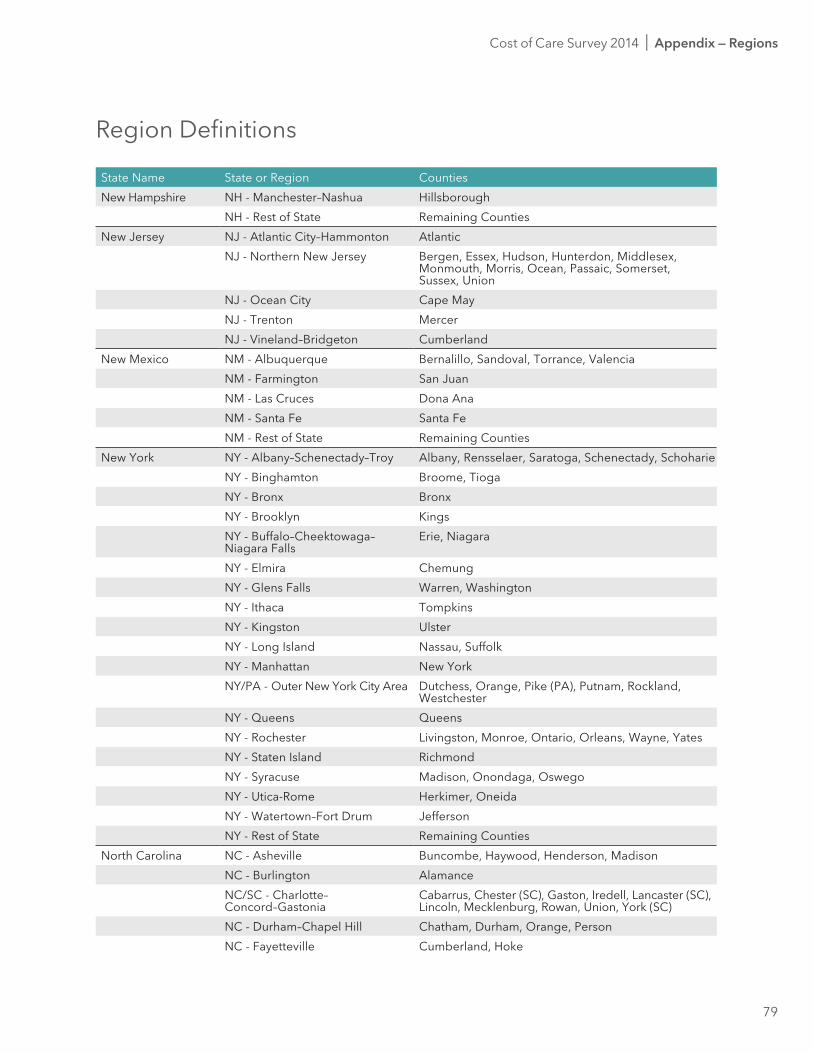
79
State Name State or Region Counties
Region Definitions
Cost of Care Survey 2014 I Appendix — Regions
New Hampshire NH - Manchester–Nashua Hillsborough
NH - Rest of State Remaining Counties
New Jersey NJ - Atlantic City–Hammonton Atlantic
NJ - Northern New Jersey Bergen, Essex, Hudson, Hunterdon, Middlesex, Monmouth, Morris, Ocean, Passaic, Somerset, Sussex, union
NJ - Ocean City Cape May
NJ - Trenton Mercer
NJ - Vineland–Bridgeton Cumberland
New Mexico NM - Albuquerque Bernalillo, Sandoval, Torrance, Valencia
NM - Farmington San Juan
NM - Las Cruces Dona Ana
NM - Santa Fe Santa Fe
NM - Rest of State Remaining Counties
New York NY - Albany–Schenectady–Troy Albany, Rensselaer, Saratoga, Schenectady, Schoharie
NY - Binghamton Broome, Tioga
NY - Bronx Bronx
NY - Brooklyn Kings
NY - Buffalo–Cheektowaga– Niagara Falls
Erie, Niagara
NY - Elmira Chemung
NY - Glens Falls Warren, Washington
NY - Ithaca Tompkins
NY - Kingston ulster
NY - Long Island Nassau, Suffolk
NY - Manhattan New York
NY/PA - Outer New York City Area Dutchess, Orange, Pike (PA), Putnam, Rockland, Westchester
NY - Queens Queens
NY - Rochester Livingston, Monroe, Ontario, Orleans, Wayne, Yates
NY - Staten Island Richmond
NY - Syracuse Madison, Onondaga, Oswego
NY - utica-Rome Herkimer, Oneida
NY - Watertown–Fort Drum Jefferson
NY - Rest of State Remaining Counties
North Carolina NC - Asheville Buncombe, Haywood, Henderson, Madison
NC - Burlington Alamance
NC/SC - Charlotte– Concord–Gastonia
Cabarrus, Chester (SC), Gaston, Iredell, Lancaster (SC), Lincoln, Mecklenburg, Rowan, union, York (SC)
NC - Durham–Chapel Hill Chatham, Durham, Orange, Person
NC - Fayetteville Cumberland, Hoke
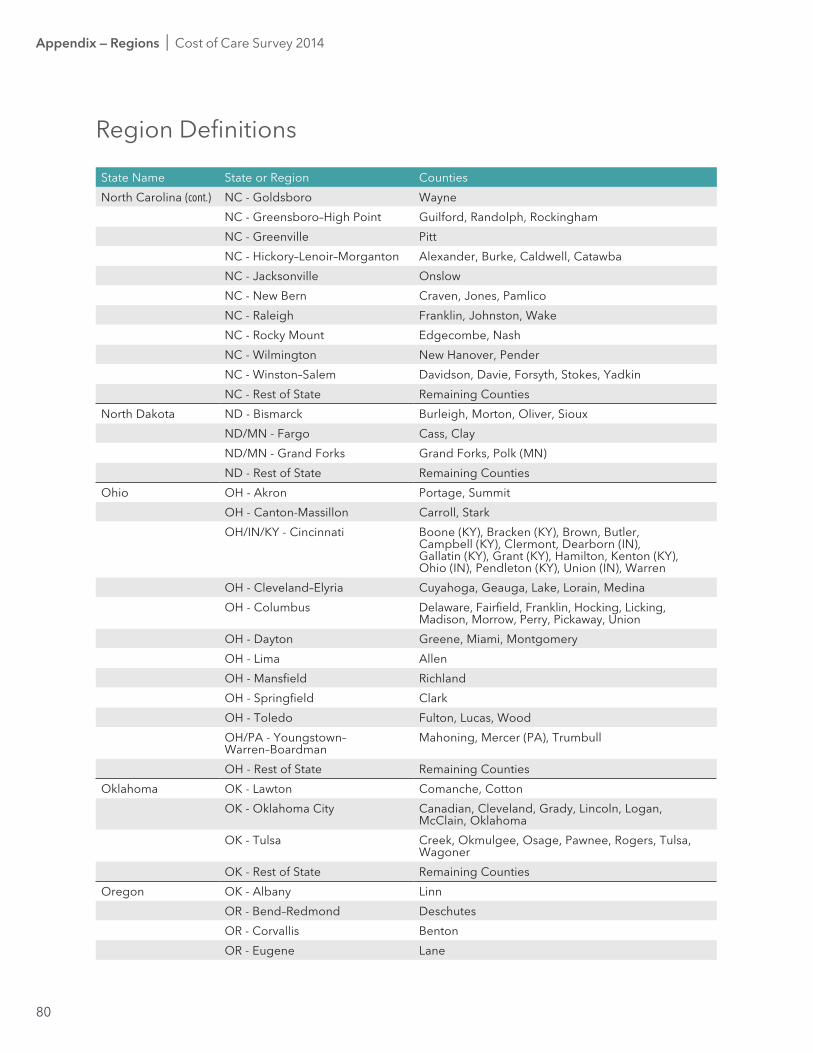
80
State Name State or Region Counties
Region Definitions
Appendix — Regions I Cost of Care Survey 2014
North Carolina (cont.) NC - Goldsboro Wayne
NC - Greensboro–High Point Guilford, Randolph, Rockingham
NC - Greenville Pitt
NC - Hickory–Lenoir–Morganton Alexander, Burke, Caldwell, Catawba
NC - Jacksonville Onslow
NC - New Bern Craven, Jones, Pamlico
NC - Raleigh Franklin, Johnston, Wake
NC - Rocky Mount Edgecombe, Nash
NC - Wilmington New Hanover, Pender
NC - Winston–Salem Davidson, Davie, Forsyth, Stokes, Yadkin
NC - Rest of State Remaining Counties
North Dakota ND - Bismarck Burleigh, Morton, Oliver, Sioux
ND/MN - Fargo Cass, Clay
ND/MN - Grand Forks Grand Forks, Polk (MN)
ND - Rest of State Remaining Counties
Ohio OH - Akron Portage, Summit
OH - Canton-Massillon Carroll, Stark
OH/IN/KY - Cincinnati Boone (KY), Bracken (KY), Brown, Butler, Campbell (KY), Clermont, Dearborn (IN), Gallatin (KY), Grant (KY), Hamilton, Kenton (KY), Ohio (IN), Pendleton (KY), union (IN), Warren
OH - Cleveland–Elyria Cuyahoga, Geauga, Lake, Lorain, Medina
OH - Columbus Delaware, Fairfield, Franklin, Hocking, Licking, Madison, Morrow, Perry, Pickaway, union
OH - Dayton Greene, Miami, Montgomery
OH - Lima Allen
OH - Mansfield Richland
OH - Springfield Clark
OH - Toledo Fulton, Lucas, Wood
OH/PA - Youngstown– Warren–Boardman
Mahoning, Mercer (PA), Trumbull
OH - Rest of State Remaining Counties
Oklahoma OK - Lawton Comanche, Cotton
OK - Oklahoma City Canadian, Cleveland, Grady, Lincoln, Logan, McClain, Oklahoma
OK - Tulsa Creek, Okmulgee, Osage, Pawnee, Rogers, Tulsa, Wagoner
OK - Rest of State Remaining Counties
Oregon OK - Albany Linn
OR - Bend–Redmond Deschutes
OR - Corvallis Benton
OR - Eugene Lane
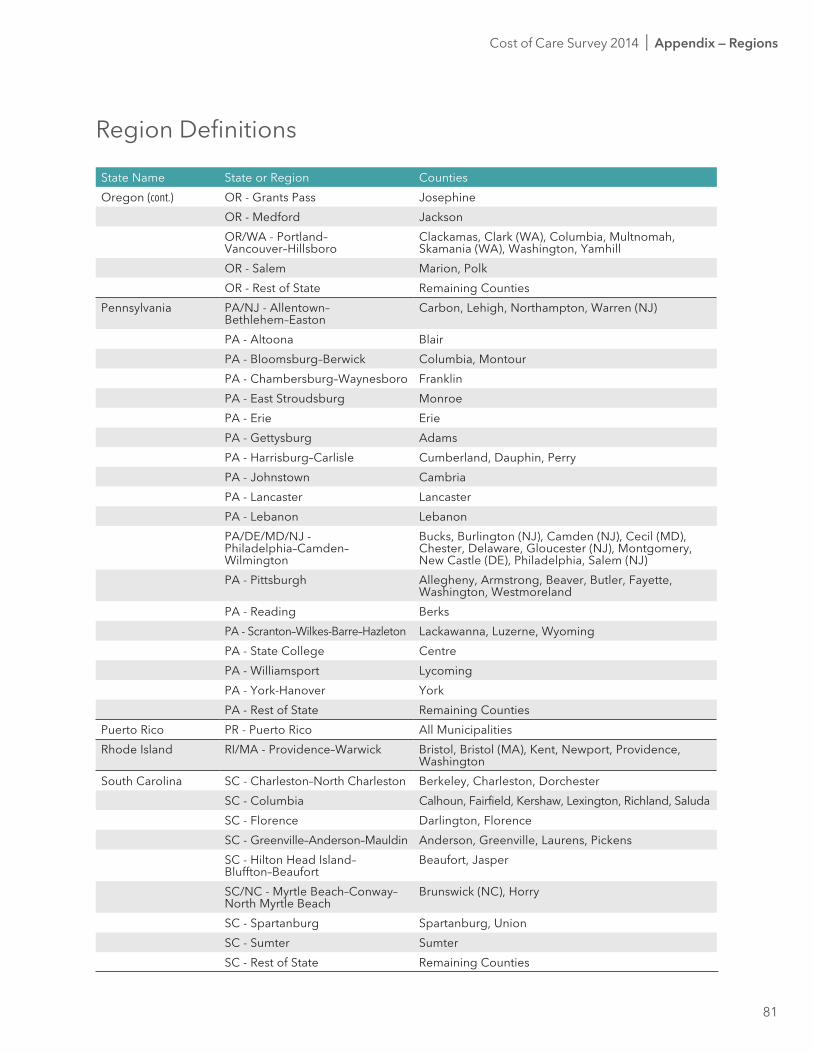
81
State Name State or Region Counties
Region Definitions
Cost of Care Survey 2014 I Appendix — Regions
Oregon (cont.) OR - Grants Pass Josephine
OR - Medford Jackson
OR/WA - Portland– Vancouver–Hillsboro
Clackamas, Clark (WA), Columbia, Multnomah, Skamania (WA), Washington, Yamhill
OR - Salem Marion, Polk
OR - Rest of State Remaining Counties
Pennsylvania PA/NJ - Allentown– Bethlehem–Easton
Carbon, Lehigh, Northampton, Warren (NJ)
PA - Altoona Blair
PA - Bloomsburg–Berwick Columbia, Montour
PA - Chambersburg–Waynesboro Franklin
PA - East Stroudsburg Monroe
PA - Erie Erie
PA - Gettysburg Adams
PA - Harrisburg–Carlisle Cumberland, Dauphin, Perry
PA - Johnstown Cambria
PA - Lancaster Lancaster
PA - Lebanon Lebanon
PA/DE/MD/NJ - Philadelphia–Camden–Wilmington
Bucks, Burlington (NJ), Camden (NJ), Cecil (MD), Chester, Delaware, Gloucester (NJ), Montgomery, New Castle (DE), Philadelphia, Salem (NJ)
PA - Pittsburgh Allegheny, Armstrong, Beaver, Butler, Fayette, Washington, Westmoreland
PA - Reading Berks
PA - Scranton–Wilkes-Barre–Hazleton Lackawanna, Luzerne, Wyoming
PA - State College Centre
PA - Williamsport Lycoming
PA - York-Hanover York
PA - Rest of State Remaining Counties
Puerto Rico PR - Puerto Rico All Municipalities
Rhode Island RI/MA - Providence–Warwick Bristol, Bristol (MA), Kent, Newport, Providence, Washington
South Carolina SC - Charleston–North Charleston Berkeley, Charleston, Dorchester
SC - Columbia Calhoun, Fairfield, Kershaw, Lexington, Richland, Saluda
SC - Florence Darlington, Florence
SC - Greenville–Anderson–Mauldin Anderson, Greenville, Laurens, Pickens
SC - Hilton Head Island– Bluffton–Beaufort
Beaufort, Jasper
SC/NC - Myrtle Beach–Conway– North Myrtle Beach
Brunswick (NC), Horry
SC - Spartanburg Spartanburg, union
SC - Sumter Sumter
SC - Rest of State Remaining Counties
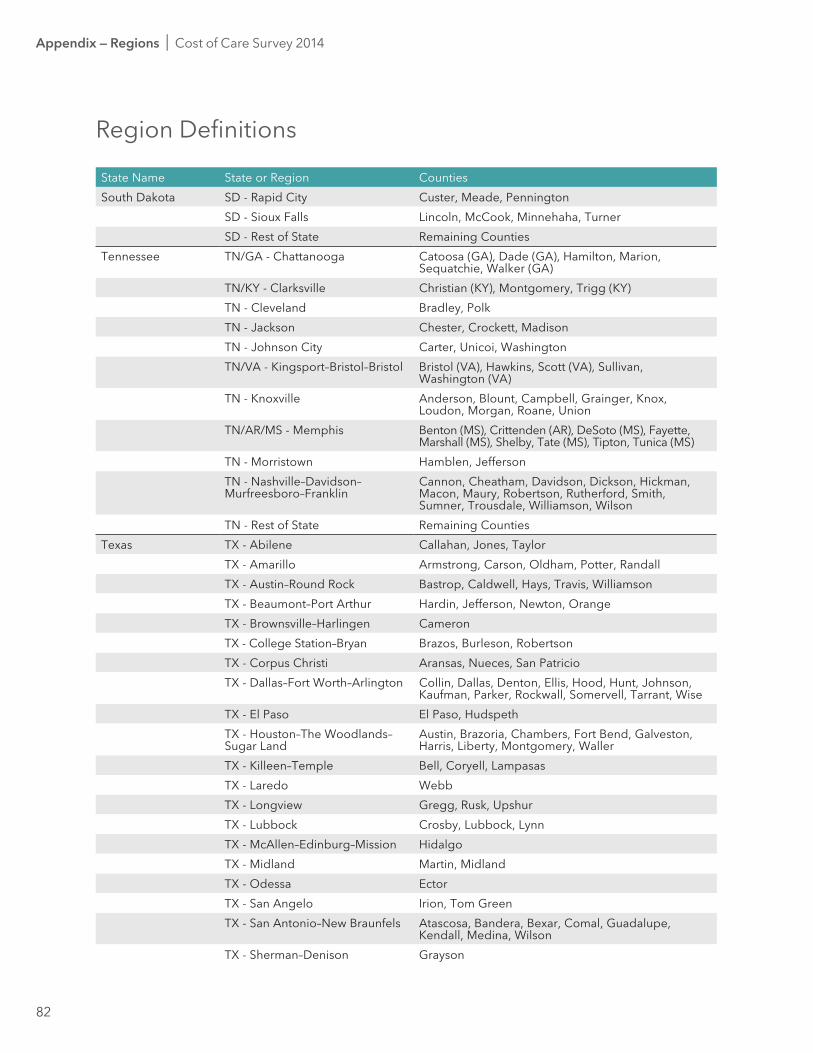
82
State Name State or Region Counties
Region Definitions
Appendix — Regions I Cost of Care Survey 2014
South Dakota SD - Rapid City Custer, Meade, Pennington
SD - Sioux Falls Lincoln, McCook, Minnehaha, Turner
SD - Rest of State Remaining Counties
Tennessee TN/GA - Chattanooga Catoosa (GA), Dade (GA), Hamilton, Marion, Sequatchie, Walker (GA)
TN/KY - Clarksville Christian (KY), Montgomery, Trigg (KY)
TN - Cleveland Bradley, Polk
TN - Jackson Chester, Crockett, Madison
TN - Johnson City Carter, unicoi, Washington
TN/VA - Kingsport–Bristol–Bristol Bristol (VA), Hawkins, Scott (VA), Sullivan, Washington (VA)
TN - Knoxville Anderson, Blount, Campbell, Grainger, Knox, Loudon, Morgan, Roane, union
TN/AR/MS - Memphis Benton (MS), Crittenden (AR), DeSoto (MS), Fayette, Marshall (MS), Shelby, Tate (MS), Tipton, Tunica (MS)
TN - Morristown Hamblen, Jefferson
TN - Nashville–Davidson–Murfreesboro–Franklin
Cannon, Cheatham, Davidson, Dickson, Hickman, Macon, Maury, Robertson, Rutherford, Smith, Sumner, Trousdale, Williamson, Wilson
TN - Rest of State Remaining Counties
Texas TX - Abilene Callahan, Jones, Taylor
TX - Amarillo Armstrong, Carson, Oldham, Potter, Randall
TX - Austin–Round Rock Bastrop, Caldwell, Hays, Travis, Williamson
TX - Beaumont–Port Arthur Hardin, Jefferson, Newton, Orange
TX - Brownsville–Harlingen Cameron
TX - College Station–Bryan Brazos, Burleson, Robertson
TX - Corpus Christi Aransas, Nueces, San Patricio
TX - Dallas–Fort Worth–Arlington Collin, Dallas, Denton, Ellis, Hood, Hunt, Johnson, Kaufman, Parker, Rockwall, Somervell, Tarrant, Wise
TX - El Paso El Paso, Hudspeth
TX - Houston–The Woodlands–Sugar Land
Austin, Brazoria, Chambers, Fort Bend, Galveston, Harris, Liberty, Montgomery, Waller
TX - Killeen–Temple Bell, Coryell, Lampasas
TX - Laredo Webb
TX - Longview Gregg, Rusk, upshur
TX - Lubbock Crosby, Lubbock, Lynn
TX - McAllen–Edinburg–Mission Hidalgo
TX - Midland Martin, Midland
TX - Odessa Ector
TX - San Angelo Irion, Tom Green
TX - San Antonio–New Braunfels Atascosa, Bandera, Bexar, Comal, Guadalupe, Kendall, Medina, Wilson
TX - Sherman–Denison Grayson
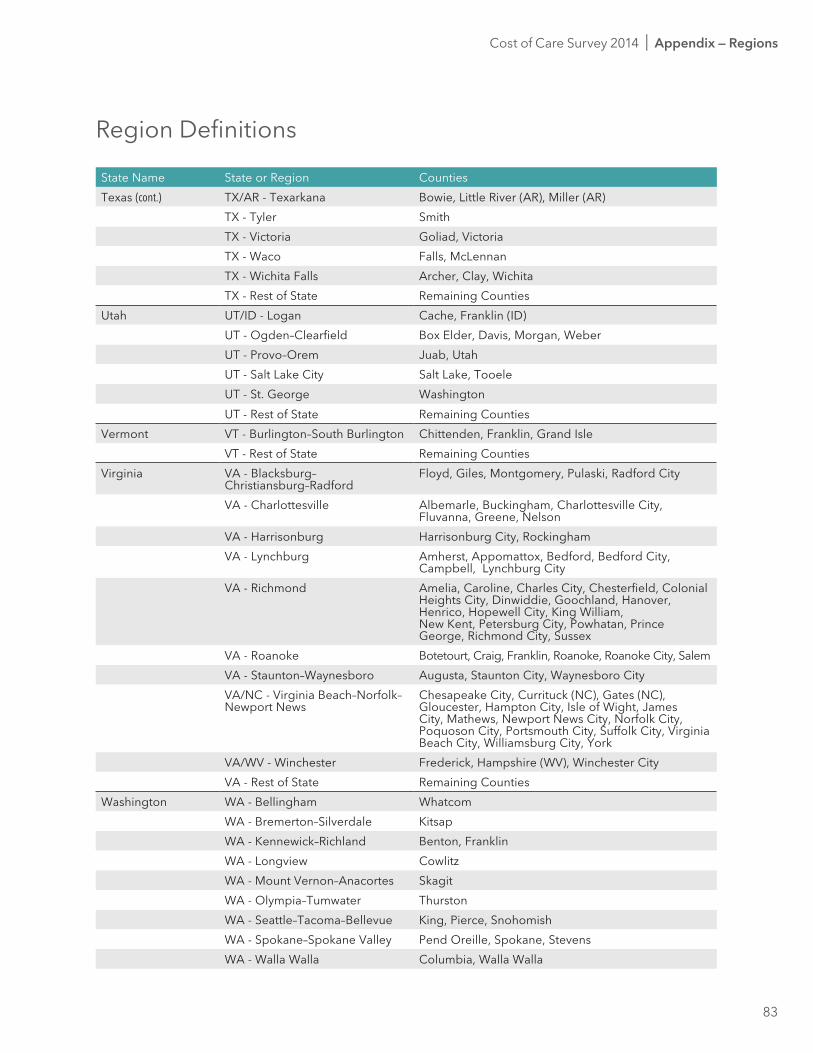
83
State Name State or Region Counties
Region Definitions
Cost of Care Survey 2014 I Appendix — Regions
Texas (cont.) TX/AR - Texarkana Bowie, Little River (AR), Miller (AR)
TX - Tyler Smith
TX - Victoria Goliad, Victoria
TX - Waco Falls, McLennan
TX - Wichita Falls Archer, Clay, Wichita
TX - Rest of State Remaining Counties
utah uT/ID - Logan Cache, Franklin (ID)
uT - Ogden–Clearfield Box Elder, Davis, Morgan, Weber
uT - Provo–Orem Juab, utah
uT - Salt Lake City Salt Lake, Tooele
uT - St. George Washington
uT - Rest of State Remaining Counties
Vermont VT - Burlington–South Burlington Chittenden, Franklin, Grand Isle
VT - Rest of State Remaining Counties
Virginia VA - Blacksburg– Christiansburg–Radford
Floyd, Giles, Montgomery, Pulaski, Radford City
VA - Charlottesville Albemarle, Buckingham, Charlottesville City, Fluvanna, Greene, Nelson
VA - Harrisonburg Harrisonburg City, Rockingham
VA - Lynchburg Amherst, Appomattox, Bedford, Bedford City, Campbell, Lynchburg City
VA - Richmond Amelia, Caroline, Charles City, Chesterfield, Colonial Heights City, Dinwiddie, Goochland, Hanover, Henrico, Hopewell City, King William, New Kent, Petersburg City, Powhatan, Prince George, Richmond City, Sussex
VA - Roanoke Botetourt, Craig, Franklin, Roanoke, Roanoke City, Salem
VA - Staunton–Waynesboro Augusta, Staunton City, Waynesboro City
VA/NC - Virginia Beach–Norfolk–Newport News
Chesapeake City, Currituck (NC), Gates (NC), Gloucester, Hampton City, Isle of Wight, James City, Mathews, Newport News City, Norfolk City, Poquoson City, Portsmouth City, Suffolk City, Virginia Beach City, Williamsburg City, York
VA/WV - Winchester Frederick, Hampshire (WV), Winchester City
VA - Rest of State Remaining Counties
Washington WA - Bellingham Whatcom
WA - Bremerton–Silverdale Kitsap
WA - Kennewick–Richland Benton, Franklin
WA - Longview Cowlitz
WA - Mount Vernon–Anacortes Skagit
WA - Olympia–Tumwater Thurston
WA - Seattle–Tacoma–Bellevue King, Pierce, Snohomish
WA - Spokane–Spokane Valley Pend Oreille, Spokane, Stevens
WA - Walla Walla Columbia, Walla Walla
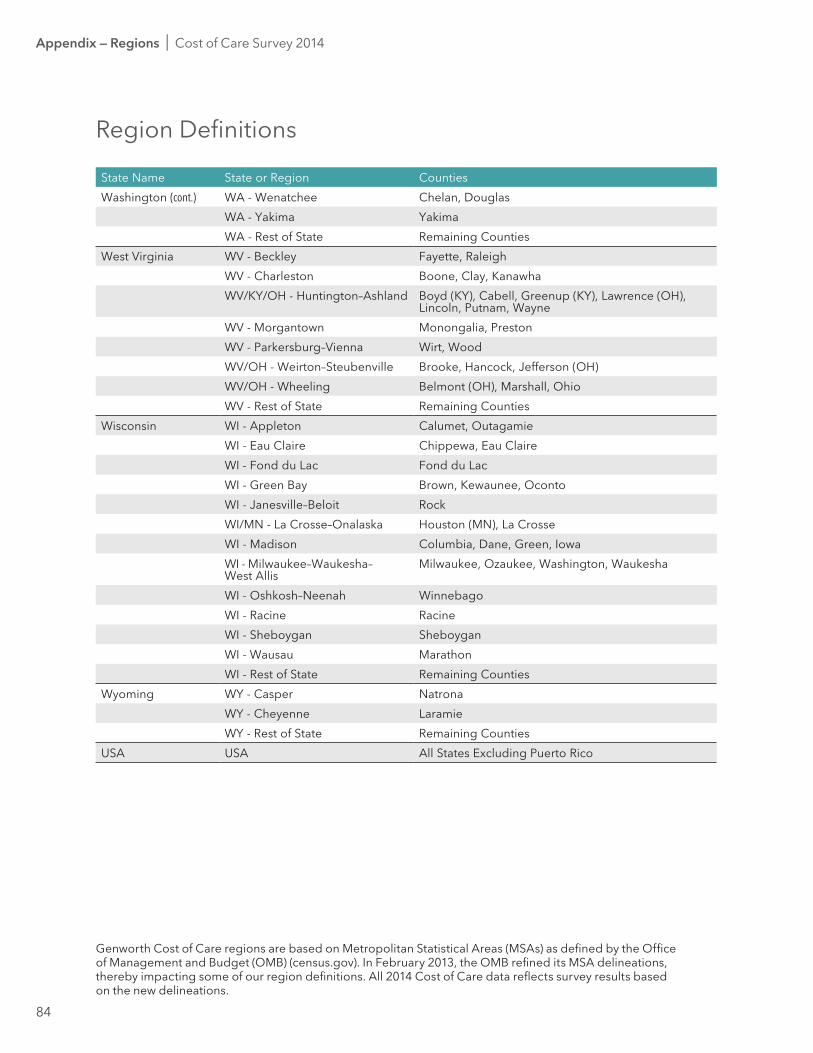
84
State Name State or Region Counties
Region Definitions
Appendix — Regions I Cost of Care Survey 2014
Washington (cont.) WA - Wenatchee Chelan, Douglas
WA - Yakima Yakima
WA - Rest of State Remaining Counties
West Virginia WV - Beckley Fayette, Raleigh
WV - Charleston Boone, Clay, Kanawha
WV/KY/OH - Huntington–Ashland Boyd (KY), Cabell, Greenup (KY), Lawrence (OH), Lincoln, Putnam, Wayne
WV - Morgantown Monongalia, Preston
WV - Parkersburg–Vienna Wirt, Wood
WV/OH - Weirton–Steubenville Brooke, Hancock, Jefferson (OH)
WV/OH - Wheeling Belmont (OH), Marshall, Ohio
WV - Rest of State Remaining Counties
Wisconsin WI - Appleton Calumet, Outagamie
WI - Eau Claire Chippewa, Eau Claire
WI - Fond du Lac Fond du Lac
WI - Green Bay Brown, Kewaunee, Oconto
WI - Janesville–Beloit Rock
WI/MN - La Crosse–Onalaska Houston (MN), La Crosse
WI - Madison Columbia, Dane, Green, Iowa
WI - Milwaukee–Waukesha– West Allis
Milwaukee, Ozaukee, Washington, Waukesha
WI - Oshkosh–Neenah Winnebago
WI - Racine Racine
WI - Sheboygan Sheboygan
WI - Wausau Marathon
WI - Rest of State Remaining Counties
Wyoming WY - Casper Natrona
WY - Cheyenne Laramie
WY - Rest of State Remaining Counties
uSA uSA All States Excluding Puerto Rico
Genworth Cost of Care regions are based on Metropolitan Statistical Areas (MSAs) as defined by the Office of Management and Budget (OMB) (census.gov). In February 2013, the OMB refined its MSA delineations, thereby impacting some of our region definitions. All 2014 Cost of Care data reflects survey results based on the new delineations.
85
* Various provider categories used in the survey may not be the same as the definitions used in a long term care insurance policy. ** Not all states require a license for home care. Data includes certain states where unlicensed providers are included because the
state does not offer or does not have HH license requirements.
Methodology
CareScout® CareScout has conducted the Genworth Cost of Care Survey annually since 2004. Located in Waltham, Massachusetts, CareScout has specialized in helping families find long term care providers nationwide since 1997.
This year, CareScout — a Genworth company — contacted more than 43,300 providers* to complete over 14,800 surveys of nursing homes, assisted living facilities, adult day health facilities and home care providers. Potential respondents were selected randomly from the CareScout nationwide database of providers in each category of long term care services. Survey respondents representing all 50 states, the District of Columbia and Puerto Rico were contacted by phone during January and February of 2014. Survey respondents were informed that survey data provided would be included in the Genworth 2014 Cost of Care Survey results. Survey questions varied based on the type of care provider.
Considered the most comprehensive survey of its kind, the Genworth Cost of Care Survey publishes costs in 440 regions based on the 381 u.S. Metropolitan Statistical Areas (MSAs). MSA definitions are established by the u.S. Office of Management and Budget and include approximately 85 percent of the u.S. population. The survey also includes some counties outside of the MSA regions. To create accurate historical trends for this expanded scope, CareScout recast the base data from the 2009 survey into the current region structure. As a result, CareScout is able to report a five-year compound annual growth rate for each region.
Home Care (HC)Surveyors completed more than 3,600 interviews with licensed home health care providers representing approximately 19 percent of home care agencies.** The agencies surveyed provided home health care and homemaker services where a skilled nurse does not need to be present. A home health aide will typically help with bathing, dressing, transferring and toileting, but not with catheters or injections. Most of these agencies also provide homemaker services that typically include assistance with shopping, finances, cooking, errands and transportation. Homemaker services may also be employed for the purpose of providing companionship.
Annual rates are based on 44 hours of care per week, multiplied by 52 weeks. Where a rate range was provided, the midpoint was used. The survey excludes holiday rates.
Adult Day Health Care (ADH)Across 440 regions, surveyors polled more than 25 percent of adult day health care facilities, resulting in nearly 1,200 completed surveys. ADH is designed to meet the needs of adults who are functionally and/or severely cognitively impaired. Programs are intended to be structured and comprehensive, and to take place in a protective setting that promotes well-being through a variety of health, social and other support services. These services are intended to help enable individuals live more independently in the community. These services may also be used to provide relief for family caregivers.
Cost of Care Survey 2014 I Appendix — Methodology
86
ADH facility rates are structured in a variety of ways: some charge by the hour, some by the half-day and others for the full day, regardless of utilization. All rates used in Genworth’s survey were extrapolated to a daily (6-8 hours) rate.
ADH facility rates may be subsidized by the government or the community. A government subsidy is based on the individual’s ability to pay. However, a community subsidy is available to individuals regardless of their income level. This survey captures the full private pay rates or, where applicable, the community subsidy rates. This survey does not capture the government subsidy rates.
Annual rates are based on the daily rate multiplied by five days per week, and then multiplied by 52 weeks.
Assisted Living Facilities (ALF)Across 440 regions, surveyors polled more than 15 percent of licensed assisted living facilities, resulting in more than 6,200 completed surveys.
unlike nursing homes, there is no uniform regulatory standard for assisted living facilities. As a consequence, states have instituted licensing standards that vary from state to state. The assisted living facilities polled were licensed according to the licensure requirements of the state in which the assisted living facility was located.
Currently, there are more than 70 different names or designations for facilities licensed as some form of an assisted care facility. Generally, fewer than 40 percent of these care facilities use the term “assisted living facility” as a part of their formal name or licensure designation. For example, some facilities
may be identified as “residential care facilities.” Because of variations in licensing requirements by state, both small group homes and large multi-service facilities qualified as assisted living facilities for the purposes of this study.
Surveyors collected the monthly private pay rates as they ranged from basic care to more substantial care for a one-bedroom unit in an assisted living facility. Where a rate range was provided, the average of the high and low was used in the annual cost calculation. Surveyors also determined whether the facility charges a non-refundable community or entrance fee. This study shows that approximately 43% of survey participants (nearly 2,600) said they charge a one-time, non-refundable fee.
Annual rates are based on the monthly fee multiplied by 12 months.
Nursing Homes (NH)Across all regions of the study, surveyors polled nearly 25 percent of certified and licensed nursing homes, resulting in nearly 3,800 completed surveys.
Surveyors collected the daily rates for private rooms (single occupancy) and semi-private rooms (double occupancy) in Medicare-certified nursing facilities. Medicare-certified nursing homes represent more than 90 percent of all nursing homes in the u.S. The daily room charge usually includes services beyond rent, such as three meals a day, laundry, sundries, basic nurse supervision and generic non-prescription pharmaceuticals.
Annual rates are based on the daily fee multiplied by 365.
Appendix — Methodology I Cost of Care Survey 2014

87
Notes
Cost of Care Survey 2014 I Notes
88
Notes
Notes I Cost of Care Survey 2014

89
Cost of Care Survey 2014
About CareScout®
Headquartered in Waltham, Massachusetts, CareScout helps Americans across the United States find quality care providers for their long term care needs. As an objective source for this provider information, CareScout, a Genworth company, developed the nation’s first quality-of-care ratings system for certified nursing homes and home care providers. Large employers, risk underwriters and families rely on CareScout’s proprietary ratings system, the CareScout network, and its database of about 100,000 providers including nursing homes, assisted living facilities and home care agencies to help find and arrange the most appropriate care for loved ones. For more information, visit carescout.com.
About Genworth Financial
Genworth Financial, Inc. (NYSE: GNW) is a leading Fortune 500 insurance holding company dedicated to helping people secure their financial lives, families and futures. Genworth has leadership positions in offerings that assist consumers in protecting themselves, investing for the future and planning for retirement — including life insurance, long term care insurance, financial protection coverages, and mortgage insurance that helps consumers achieve home ownership while assisting lenders in managing their risk and capital.
Genworth operates through three divisions: U.S. Life Insurance, which includes life insurance, long term care insurance and fixed annuities; Global Mortgage Insurance, containing U.S. Mortgage Insurance and International Mortgage Insurance segments; and the Corporate and Other division, which includes the International Protection and Runoff segments. Products and services are offered through financial intermediaries, independent distributors and sales specialists. Genworth Financial, Inc., headquartered in Richmond, Virginia, traces its roots back to 1871 and became a public company in 2004. For more information, visit genworth.com.
From time to time, Genworth Financial, Inc. releases important information via postings on its corporate website. Accordingly, investors and other interested parties are encouraged to enroll to receive automatic email alerts and Really Simple Syndication (RSS) feeds regarding new postings. Enrollment information is found under the “Investors” section of genworth.com.
Insurance and annuity products:• Are not deposits. • Are not insured by the FDIC or any other federal government agency.• May decrease in value. • Are not guaranteed by the bank or its affiliates.
Visit genworth.com/costofcare to:• Download the Cost of Care mobile application• Compare daily, monthly and annual costs across locations• Calculate future costs of care• Get more information about the Cost of Care Survey
©2014 Genworth Financial, Inc. All rights reserved.