geo-fo2: integrated software for analysis of...
TRANSCRIPT

Geo‐fO2: Integrated Software for Analysisof Magmatic Oxygen FugacityWeikai Li1,2,3, Yuanqi Cheng4 , and Zhiming Yang1,5
1Key Laboratory of Deep‐Earth Dynamics, Institute of Geology, Chinese Academy of Geological Sciences, Beijing, China,2School of Earth and Space Sciences, Peking University, Beijing, China, 3Department of Earth Sciences, University ofGeneva, Geneva, Switzerland, 4Institute of Ocean Research, Peking University, Beijing, China, 5Economic GeologyResearch Centre (EGRU), College of Science and Engineering, James Cook University, Townsville, Queensland, Australia
Abstract Oxygen fugacity (fO2) is a fundamental thermodynamic property governing redox potential insolid Earth systems. Analysis of magmatic fO2 aids our understanding of the valence state and solubility ofmultivalent elements during magma evolution. Specialized software, Geo‐fO2, was developed forcalculating magmatic fO2 on the basis of oxybarometers and thermobarometers for common minerals(amphibole, zircon, and biotite) in intermediate‐silicic magmas. With user‐friendly interfaces, it is easy toinput files (.csv or Excel files), output data in Excel files, and plot results as binary diagrams that can besaved as vector graphics and modified using image‐processing software.
1. Introduction
Oxygen fugacity (fO2) is defined as the partial pressure of oxygen within a system (e.g., Carmichael, 1991;Frost, 1991; Lee et al., 2005) and is a fundamental thermodynamic property governing redox potential insolid Earth systems. In particular, during magma evolution the fO2 controls valence states of multivalent ele-ments (e.g., Fe, Cu, Au, V, S, and C), which in turn controls their crystal/melt partitioning (e.g., Brounceet al., 2014; Canil, 2002) and solubility in silicate magmas (e.g., Carmichael, 1991; Evans & Tomkins,2011; Rowe et al., 2009). This is particularly crucial for ore mineralization in magmatic‐hydrothermal sys-tems (e.g., porphyry‐type deposits; Jugo, 2009; Richards, 2015; Sillitoe, 2010; Simon & Ripley, 2011; Yanget al., 2016; Zajacz et al., 2011) and speciation of volatiles during magma degassing (e.g., Burgisser &Scaillet, 2007; Clémente et al., 2004; Iacono‐Marziano et al., 2012; Jugo et al., 2005; Mathez, 1984; Moretti& Ottonello, 2005; Pawley et al., 1992).
Two early models for the calculation of magmatic fO2 involved bulk Fe3+/Fe2+ (or Fe3+/ΣFe) ratios (e.g.,Kennedy, 1948; Kilinc et al., 1983; Kress & Carmichael, 1991; Sack et al., 1981) and the Fe‐Ti oxideoxybarometer (e.g., Andersen & Lindsley, 1985; Buddington & Lindsley, 1964; Carmichael, 1966; Ghiorso& Sack, 1991). Corresponding programs include QUILF (Andersen et al., 1993), MELTS (Ghiorso et al.,2002; Ghiorso & Sack, 1995; Smith & Asimow, 2005), ILMAT (Lepage, 2003), and Petrolog3(Danyushevsky & Plechov, 2011). However, bulk Fe3+/Fe2+ ratios in rocks are highly susceptible toalteration by weathering, hydrothermal modification, and degassing and also susceptible to early fractionalcrystallization of mafic minerals (e.g., olivine; Cottrell & Kelley, 2011). The Fe–Ti oxide oxybarometer islimited to magmas that precipitate both ilmenite and magnetite solid‐solution during cooling.Additionally, Fe–Ti oxides tend to reequilibration at subsolidus temperatures during slow cooling or dueto hydrothermal alteration (Venezky & Rutherford, 1999). Consequently, the oxybarometer is typicallyapplied to volcanic rather than intrusive systems.
Recently, some newmineral oxybarometers have been calibrated on the basis of the composition of relativelystable and common minerals, which are often found in intermediate‐silicic magmas, such as zircon (Ballardet al., 2002; Burnham & Berry, 2012; Smythe & Brenan, 2016; Trail et al., 2011, 2012, 2015) and amphibole(Ridolfi et al., 2010; Ridolfi & Renzulli, 2012). These oxybarometers, plus previously calibratedoxybarometers for other minerals (e.g., biotite; Wones, 1972, 1981; Wones & Eugster, 1965), make it possibleto track initial magmatic fO2 and its subsequent variations (e.g., Li et al., 2019). A few programs developed forindividual minerals are available for simple estimations of magmatic fO2 (e.g., Ridolfi et al., 2010; Yavuz,2003a, 2003b; Yavuz & Öztaş, 1997); however, specialized software integrating previously and recentlycalibrated oxybarometers that can systematically calculate and visualize magmatic fO2 is lacking.
©2019. American Geophysical Union.All Rights Reserved.
TECHNICALREPORTS: METHODS10.1029/2019GC008273
Key Points:• Oxygen fugacity (fO2) is a
fundamental thermodynamicproperty that governs the redoxpotential in solid Earth systems
• Specialized software, Geo‐fO2, wasdeveloped for analysis of magmaticfO2
• With user‐friendly interfaces,Geo‐fO2 is easy to input files, outputdata in Excel files, and plot results asbinary diagrams
Supporting Information:• Supporting Information S1• Table S1• Table S2• Table S3• Table S4• Table S5• Table S6• Table S7• Table S8• Table S9• Table S10• Figure S1• Figure S2
Correspondence to:Z. Yang,[email protected]
Citation:Li, W., Cheng, Y., & Yang, Z. (2019).Geo‐fO2: Integrated software foranalysis of magmatic oxygen fugacity.Geochemistry, Geophysics, Geosystems,20. https://doi.org/10.1029/2019GC008273
Received 18 FEB 2019Accepted 11 APR 2019Accepted article online 23 APR 2019
LI ET AL. 1

In this study, we developed user‐friendly interfaces for the first version of integrated software, “Geo‐fO2,”written in Python (van Rossum & Drake, 1995, 2011). Geo‐fO2 includes oxybarometers and thermobarom-eters of zircon (Ferry &Watson, 2007; Miller et al., 2003; Trail et al., 2011; Watson &Harrison, 1983), amphi-bole (Ridolfi et al., 2010; Schmidt, 1992), and biotite (Henry et al., 2005; Uchida et al., 2007; Wones, 1972). Itis designed to (1) calculate cations in minerals; (2) calculate thermodynamic parameters of magma (e.g., fO2,temperature, and pressure) during magma ascent and fractional crystallization; and (3) visualize calculatedresults through a plotting interface.
2. Methods2.1. Amphibole Oxybarometer, Thermobarometer, and Hygrometer
Amphibole is an important mineral in hydrous magmas and is stable across a wide P‐T range (700–1100 °C;0.1–25 kbar; Allen & Boettcher, 1978; Eggler, 1972; Nandedkar et al., 2014). Based on electron microprobeanalysis (EMPA) data of amphibole, Ridolfi et al. (2010) produced the ΔNNO–Mg* oxybarometer (ΔNNOis the deviation of logfO2 from the Ni–NiO buffer [NNO; O'Neill & Pownceby, 1993]), Si*‐sensitive thermo-meter, AlT‐sensitive barometer, and VIAl*‐sensitive hygrometer to estimate fO2, temperature, pressure, andH2O contents of magma, respectively, from which amphibole crystallizes, as described by the followingformulae:
ΔNNO ¼ 1:644×Mg*� �
−4:01 σest ¼ ±0:22 log unitð Þ; (1)
where Mg* = Mg + (Si/47) − (AlVI/9) − (1.3 × TiVI) + (Fe3+/3.7) + (Fe2+/5.2) − (BCa/20) − (ANa/2.8) + ((1 − ANa − AK)/9.5); Mg, Si, AlVI, TiVI, Fe3+, and Fe2+ represent the number of atoms of each performula unit based on 13 cations; AlVI and TiVI are the numbers of Al and Ti atoms in octahedral sites;ANa and AK are the Na and K contents of A sites; and BCa is the Ca content of B sites. The σest representsthe standard error of the calibration (Ridolfi et al., 2010); the same below.
T °C� � ¼ −151:487×Si*
� �þ 2041 σest ¼ ±22°C� �
; (2)
where Si* = Si + (AlIV/15) − (2 × TiIV) − (AlVI/2) − (TiVI/1.8) + (Fe3+/9) + (Fe2+/3.3) + (Mg/26) + (BCa/5) + (BNa/1.3)− (ANa/15) + ((1− ANa− AK)/2.3); AlIV and TiIV are the numbers of Al and Ti atoms in tetra-hedral sites; BNa is the Na content of B sites.
P kbarð Þ ¼ 0:19209×e 1:438AlTð Þ σest ¼ ±0:54 kbarð Þ; (3)
where AlT is the total number of Al atoms per amphibole unit formula.
H2O wt:%ð Þ ¼ 5:215 ×VIAl*� �þ 12:28 σest ¼ ±0:4 wt:%ð Þ; (4)
where VIAl* = AlVI + (AlIV/13.9) − ((Si + TiVI)/5) − (CFe2+/3) − (Mg/1.7) + ((BCa + 1 − ANa − AK)/1.2) + (ANa/2.7) − (1.56 × AK) − (Fe#/1.6); CFe2+ is the Fe2+ content of C sites; Fe# = Fe3+/(Fe3+ + Fe2+ + + Mg + Mn).
The classical Al‐in‐amphibole barometer of Schmidt (1992) is also provided:
P kbarð Þ ¼ −3:01þ 4:76×AlTð Þ σest ¼ ±0:6 kbarð Þ; (5)
where AlT is the total number of Al atoms per amphibole unit formula.
2.2. Zircon Oxybarometer, Thermometer, and Ce4+/Ce3+ Ratios
Zircon is an exceptionally durable mineral that retains primary chemistry for most elements and isotopesfrom the time of its igneous crystallization (Cherniak et al., 1997). Zircon saturation temperature can beobtained by using the Zr saturation thermometer of Watson and Harrison (1983):
lnDzircon=meltZr ¼ −3:8– 0:85× M−1ð Þð Þ þ 12; 900= T þ 273:15ð Þð Þ; (6)
where Dzircon=meltZr is the Zr concentration ratio between zircon and melt, T is temperature (°C), and
M = (Na + K + 2Ca)/(Al × Si) is the cation ratio of the bulk components. If the Zr contents of zircons areunknown, an approximate content of 496,000 ppm is used for magmatic zircons (Miller et al., 2003).
10.1029/2019GC008273Geochemistry, Geophysics, Geosystems
LI ET AL. 2

Another revised Ti‐in‐zircon thermometer (Ferry & Watson, 2007) allows calculation of zircon crystalliza-tion temperature (°C) using the Ti content (ppm) of zircon (Tizircon) and activities of SiO2 (aSiO2) and TiO2
(aTiO2) in host melt:
logTizircon ¼ 5:711±0:072ð Þ– 4; 800±86ð Þ= T þ 273:15ð Þ– logaSiO2 þ logaTiO2: (7)
For quartz‐saturated melts, aSiO2 is set to 1.0, and aTiO2 can be estimated using the activity model of Ghiorsoand Gualda (2013). In Geo‐fO2, a manual input box allows the user to input appropriate values of aSiO2 andaTiO2 as described in section 3.
Trail et al. (2011) provided a zircon oxybarometer for determining the redox state of magmas based on the Ceanomaly in zircon. The Ce anomaly is defined as the degree to which the calculated Ce partition coefficientdiffers from that expected based on partition coefficients of its neighboring elements, La and Pr. It isexpressed as (Ce/Ce*)D
Ce=Ce*� �
D ¼ Dzircon=meltCe = Dzircon=melt
La ×Dzircon=meltPr
� �1=2; (8)
ln Ce=Ce*� �
D ¼ 0:1156±0:0050× lnfO2ð Þ þ ð 13; 860±708ð Þ= T þ 273:15ð ÞÞ– 6:15±0:484ð Þ; (9)
where Dzircon=meltCe , Dzircon=melt
La , and Dzircon=meltPr are partition coefficients of Ce, La, and Pr between zircon and
melt, respectively, and T is temperature (°C). If components of the melt are not available, bulk componentsof host rock are allowed to be used as an alternative.
However, the accurate determination of Ce anomalies based on La and Pr contents is often problematicdue to the low La and Pr concentrations in zircon (e.g., Dilles et al., 2015; Qiu et al., 2013; Trail et al.,2012; Wang et al., 2014). Studies of natural zircon/melt partitioning have suggested that it can be reason-ably assumed that (Ce/Ce*)D ≈ (Ce/Ce*)CHUR (e.g., Hinton & Upton, 1991; Sano et al., 2002; Thomas et al.,2002). However, Ce anomaly in the melt during zircon crystallization may have been influenced by somemagmatic processes, that is, calculated (Ce/Ce*)CHUR values may be overestimated under oxidized condi-tions due to fractional crystallization (e.g., monazite; Skora & Blundy, 2010; Stepanov et al., 2012) or con-tamination (Elderfield et al., 1981; Trail et al., 2012). As an alternative, the lattice‐strain model (LSM;Blundy & Wood, 1994) may be used to estimate zircon Ce anomalies (expressed as (Ce/Ce*)LSM) usingmore enriched rare Earth elements (REEs; e.g., Nd, Sm, and Gd–Lu; Qiu et al., 2013; Trail et al., 2012)with better statistics (Burnham & Berry, 2012; Smythe & Brenan, 2016; Zou et al., 2019). (Ce/Ce*)Dwas therefore set at (Ce/Ce*)D = (Ce/Ce*)LSM for Ce anomalies in this study. Specifically, the partitioncoefficient of cation i between zircon and melt is related to the lattice‐strain energy created by substitut-ing a cation with an ionic radius (ri) different to the optimal value for that site (r0; Blundy & Wood, 1994).The corresponding expression is
lnDi ¼ lnD0– 4π×E×NA× ri=3þ r0=6ð Þ× ri−r0ð Þ2� �= R× T þ 273:15ð Þð Þ; (10)
where D0 is the strain‐compensated partition coefficient, E is Young's modulus, NA is Avogadro's number, Ris the gas constant, and T is temperature (°C). Plotting lnDi versus the term (ri/3 + r0/6) × (ri − r0)
2 yields alinear relationship for isovalent series of cations. If the ionic radii of Ce4+ and Ce3+ are known, their parti-tion coefficients can be determined by interpolation (see also in Smythe & Brenan, 2016). The value ofDzircon=melt
Ce lies between the partition coefficients of the two valence‐state end‐members (Ce4+ and Ce3+),and the magmatic fO2 can be determined by combination of equations (8) and (9). REE ionic radii weretaken from Shannon (1976).
Zircon Ce4+/Ce3+ ratios (Ballard et al., 2002) offer another method for estimating magma redox states. Theionic radius of Ce4+ (0.87 Å) is similar to that of Zr4+ (0.72 Å) and smaller than Ce3+ (1.01 Å; Shannon,
10.1029/2019GC008273Geochemistry, Geophysics, Geosystems
LI ET AL. 3

1976), so Ce4+ may substitute for Zr4+ in zircons. Under oxidized conditions, Ce occurs mainly as Ce4+, andhigh Ce4+/Ce3+ ratios thus indicate oxidized conditions:
Ce4þ=Ce3þ ¼ Cemelt−Cezircon=Dzircon=meltCe3þ
� �= Cezircon=D
zircon=meltCe4þ −Cemelt
� �; (11)
Ce4þ ¼ Cemelt−Cezircon=Dzircon=meltCe3þ
� �= 1=Dzircon=melt
Ce4þ −1=Dzircon=meltCe3þ
� �; (11:1)
Ce3þ ¼ Cezircon− Cemelt−Cezircon=Dzircon=meltCe3þ
� �= 1=Dzircon=melt
Ce4þ −1=Dzircon=meltCe3þ
� �; (11:2)
where Cezircon and Cemelt represent Ce concentrations in zircon and melt and Dzircon=meltCe4þ and Dzircon=melt
Ce3þ
represent partition coefficients of Ce4+ and Ce3+ between zircon and melt. The Ce4+/Ce3+ ratio is obtainedby calculating Ce4+ and Ce3+ separately using the LSM.
2.3. Biotite Oxybarometer and Thermobarometer
Biotite is commonly present in igneous rocks and reacts sensitively to changes in physicochemical condi-tions such as temperature, pressure, halogen fugacity, fO2, and magma composition (Speer, 1984).Although biotite tends to reequilibrate at subsolidus temperatures or due to hydrothermal alteration(e.g., Li et al., 2019), equilibrium assemblage biotite‐magnetite‐sanidine (K‐feldspar) can be used to esti-mate magmatic fO2 during crystallization according to the equilibrium reaction and empirical equation(Wones, 1972):
KFe3AlSi3O10 OHð Þ2 þ 0:5O2 ¼ KAlSi3O8 þ Fe3O4 þH2O
logfH2O ¼ 7; 409= T þ 273:15ð Þð Þ þ 4:25þ 0:5× logfO2ð Þ þ 3× logxð Þ− logaKAlSi3O8− logaFe3O4(12)
where fH2O is water fugacity, T is temperature (°C), x is the mole fraction of Fe2+ in the octahedral siteof biotite, and a is the activity of the subscripted components indicated. Waldbaum and Thompson(1969) have shown that alkali feldspar solid solutions are distinctly non‐ideal. Here aKAlSi3O8 is calcu-lated from the ternary feldspar (anorthite‐albite‐orthoclase) model of Elkins and Grove (1990). For thecalculation of fH2O, if either the partial pressure PH2O, the fugacity coefficient γH2O, or the molefraction in the fluid Xfluid
H2O is known, the remaining two parameters for H2O can be solved by usingthe relationships:
PH2O ¼ fH2O=γH2O ¼ f pureH2O×XfluidH2O
� �=γH2O; (13)
where f pureH2O is the fugacity of the pure H2O. The γH2O can be calculated by using the modified Redlich‐Kwongequation (Holloway & Blank, 1994), given critical temperature, critical pressure, and the acentric factor ω(Iacovino, 2014; Prausnitz et al., 1998). Detailed calculation process for γH2O can be found in theAppendix of Holloway and Blank (1994).
The solid‐solution model of Woodland and Wood (1994) is used to calculate aFe3O4:
aFe3O4 ¼ Xmag� �2
×γmag; (14)
R×T× ln γmag
� �¼ 10; 580þ 63; 060×Xmag
� �× 1−Xmag� �2
; (15)
where R is the gas constant, Xmag is the mole fraction of the magnetite endmember in the magnetite‐ulvöspinel solid solution (Carmichael, 1966), and γmag is the activity coefficient of magnetite. Xmag iscalculated using the similar algorithm as in the QUILF program (Andersen et al., 1993). The temperatureof biotite crystallization can be obtained by the Ti‐in‐biotite geothermometer (see below). By substitutingXmag and temperature into equation (15), γmag can be calculated. Combination of equations (14) and (15)gives the value of aFe3O4.
10.1029/2019GC008273Geochemistry, Geophysics, Geosystems
LI ET AL. 4

Ti‐in‐biotite geothermometer is from Henry et al. (2005):
T °C� � ¼ lnTiþ 2:3594þ 1:7283× XMg
� �3� �= 4:6482×10–9� �� �0:333
: (16)
This empirical equation is strictly valid only for XMg =Mg/(Mg + Fe) = 0.275–1.000, Ti = 0.04–0.60 atoms ofeach per formula unit calculated on the basis of 22 oxygen atoms, and T= 480–800 °C. Standard deviation ofthe Ti‐in‐biotite geothermometer is estimated to be ±24 °C at temperatures of 480–600 °C, ±23 °C at 600–700 °C, and ±12 °C at 700–800 °C (Henry et al., 2005). Calibration of this geothermometer was based on com-positions of biotite in metamorphic rocks. To check its applicability to igneous rocks, experimental data formagmatic biotites (Andújar et al., 2008; Andújar & Scaillet, 2012; Fabbrizio et al., 2006; Fabbrizio & Carroll,2008; Mutch et al., 2016; Nandedkar et al., 2014) were used to calculate crystallization temperature usingequation (16). Differences between calculated and experimentally measured temperatures were in the rangeof −26 °C to +65 °C (see supporting information Table S1). In addition, a large number of published biotitedata collected from intermediate‐silicic intrusions worldwide (e.g., Helmy et al., 2004; Hossain & Tsunogae,2014; Sarjoughian et al., 2012; Wang et al., 2014) were used to check the applicability of this geothermometerin igneous systems. In the same intrusion, calculated crystallization temperatures of biotites (magmatic Mg‐biotites) are 5 °C to 228 °C lower than crystallization temperatures of amphiboles (Mg‐amphibole andTschermakites; supporting information Table S1), which match the magmatic crystallization sequencedetermined by petrographic observations of each intrusion.
The pressure of magmatic biotite crystallizationmay be estimated using the TAl‐geobarometer (Uchida et al.,2007):
P kbarð Þ ¼ 3:03×AlT−6:53 σest ¼ ±0:33 kbarð Þ; (17)
where AlT is the total number of Al atoms in biotite calculated on the basis of 22 oxygens.
3. Software Description
Geo‐fO2 is packaged as an installation‐free .exe file that can run in Windows platforms. Under Mac OS plat-forms, the user can also use Geo‐fO2 through an application such as Wine or Winebottler. Control panelinterfaces consist of one main interface and three mineral subinterfaces (Figure 1). The main interfacehas four buttons, “Amphibole,” “Zircon,” “Biotite,” and “Quit” (Figure 1a). Clicking a mineral button bringsup a corresponding mineral subinterface (Figures 1b–1d). The user is able to exit the software by clicking“Quit” or the “×” button in the upper right corner of the main interface. The mineral subinterfaces(Figures 1b–1d) are divided into two parts, which are the left OPERATION panel and right preview windowshowing calculated results. Main operations in the left panel include “Data input,” “Calculate,” “SaveResult,” “Plot,” and “Quit.” The user can return to the main interface by clicking the “Quit” or “×” button.
3.1. Data Input
In the Data input subpanel, the user loads the data file from the desired folder. The user may view and selectthe input file (i.e., .csv, .xlsx, or .xls files) by clicking the “Open” button. The first column of the input filemust contain the names of the oxides and/or trace elements. After selection of the input file, the programautomatically extracts and rearranges data. Although this is automatic, we suggest the user uses therecommended model input Excel tables as the input files in order to avoid calculation errors caused byspecial characters (see supporting information tables: Table S2—model input Excel table of amphibole;Table S3—model input Excel table of zircon; Table S4—model input Excel table of host melt (or host rock)components of corresponding zircon grains used in Table S3, only one set of melt components (or bulkcomponents) is allowed to be used per calculation; Tables S5, S6, and S7—model input Excel tables of biotite,K‐feldspar, and magnetite, respectively).
3.2. Calculation
Calculation is executed by clicking the “Calculate” button in the three mineral subinterfaces(Figures 1b–1d).
10.1029/2019GC008273Geochemistry, Geophysics, Geosystems
LI ET AL. 5

3.2.1. AmphiboleCalculations for amphibole use the EMPA data, with a process as shown in Figure 2. Mineral formulae foramphibole were calculated following the International Mineralogical Association recommendation forcalcic amphiboles, where Fe3+/Fe2+ ratios are determined by charge balance after adjusting total tetrahedral(Si, Al, and Ti) plus octahedral (Al, Ti, Cr, Fe, Mn, and Mg) cations to 13 (Leake et al., 1997; Ridolfi et al.,2010). Because the 13 cation calculation determines the minimum alkali content in A site (i.e.,A(Na + K)) and AlVI, and the maximum Fe3+, calculation on the basis of 15 cations is also provided to getthe maximum A(Na + K) and AlVI, and the minimum Fe3+ (Ridolfi et al., 2010). The calculated cation dataare then used in amphibole classifications according to the principle of Leake et al. (1997, Figure 3 therein)and following calculations of different parameters.
Another four parallel calculations (Figure 2) based on calculated amphibole cation data include P, T, ΔNNOvalue, and H2O content. Calculations of Si*‐sensitive thermometer and ΔNNO‐Mg* oxybarometer are verystable within the conditions of 550–1120 °C and −1 ≤ ΔNNO ≤ +5 (Ridolfi et al., 2010). The calculatedΔNNO is converted into ΔFMQ and ΔHM values (ΔFMQ and ΔHM are the deviation of logfO2 from thefayalite‐magnetite‐quartz buffer [FMQ; O'Neill, 1987] and the hematite‐magnetite buffer [HM; Nasir,1994]), based on two sets of combined values of calculated temperatures and pressures (Figure 2). Theprogram also translates ΔNNO into absolute logfO2. Although calculated standard error of AlT‐sensitivebarometer is 0.54 kbar, it strongly decreases to 0.39 kbar at P < 4.5 kbar, where the average relative error is±14% (Ridolfi et al., 2010). At 1 GPa, the relative error can be as high as 33%, but it decreases to 8% for theamphiboles at the physical‐chemical stability boundaries (Ridolfi et al., 2010). The relative error of this bar-ometer is <11% near the P‐T stability curve, whereas for crystal‐rich (i.e., porphyritic index > 35%) andlower‐T magmas, the relative error increases up to 24%, consistent with depth relative error of ±0.4 km at
Figure 1. The main interface (a) and three mineral subinterfaces (b–d) of Geo‐fO2 illustrating major features of this software.
10.1029/2019GC008273Geochemistry, Geophysics, Geosystems
LI ET AL. 6
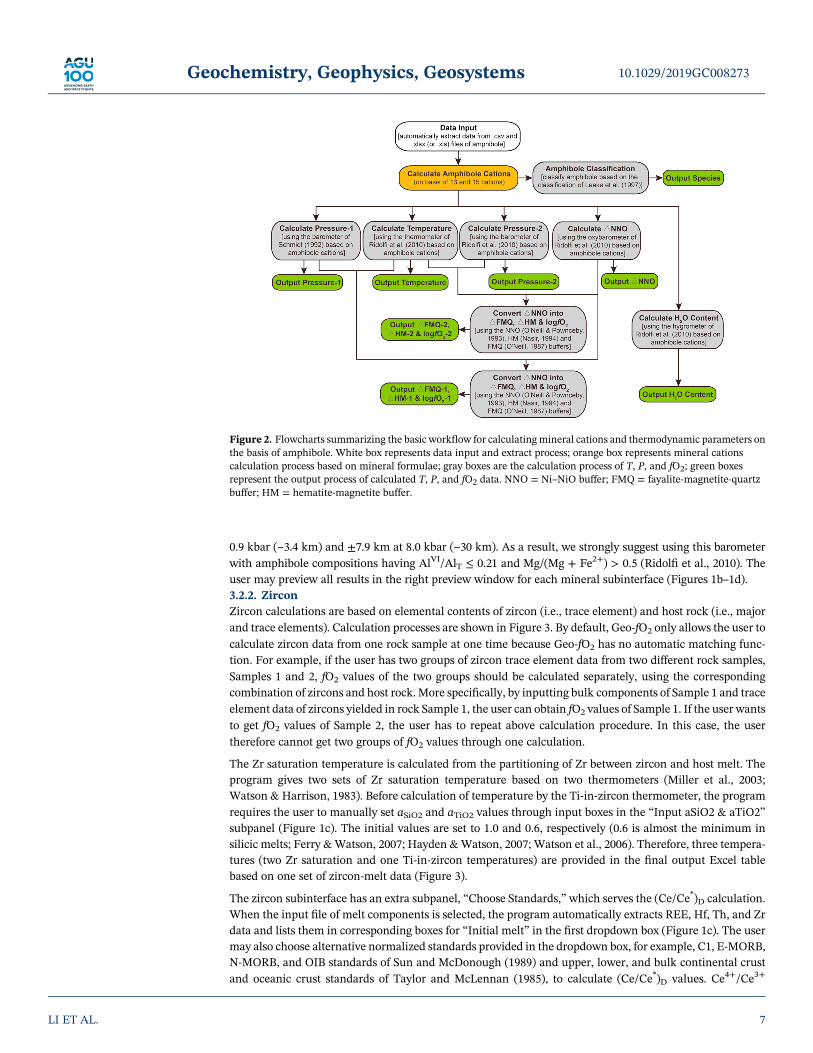
0.9 kbar (~3.4 km) and ±7.9 km at 8.0 kbar (~30 km). As a result, we strongly suggest using this barometerwith amphibole compositions having AlVI/AlT ≤ 0.21 and Mg/(Mg + Fe2+) > 0.5 (Ridolfi et al., 2010). Theuser may preview all results in the right preview window for each mineral subinterface (Figures 1b–1d).3.2.2. ZirconZircon calculations are based on elemental contents of zircon (i.e., trace element) and host rock (i.e., majorand trace elements). Calculation processes are shown in Figure 3. By default, Geo‐fO2 only allows the user tocalculate zircon data from one rock sample at one time because Geo‐fO2 has no automatic matching func-tion. For example, if the user has two groups of zircon trace element data from two different rock samples,Samples 1 and 2, fO2 values of the two groups should be calculated separately, using the correspondingcombination of zircons and host rock. More specifically, by inputting bulk components of Sample 1 and traceelement data of zircons yielded in rock Sample 1, the user can obtain fO2 values of Sample 1. If the user wantsto get fO2 values of Sample 2, the user has to repeat above calculation procedure. In this case, the usertherefore cannot get two groups of fO2 values through one calculation.
The Zr saturation temperature is calculated from the partitioning of Zr between zircon and host melt. Theprogram gives two sets of Zr saturation temperature based on two thermometers (Miller et al., 2003;Watson & Harrison, 1983). Before calculation of temperature by the Ti‐in‐zircon thermometer, the programrequires the user to manually set aSiO2 and aTiO2 values through input boxes in the “Input aSiO2 & aTiO2”subpanel (Figure 1c). The initial values are set to 1.0 and 0.6, respectively (0.6 is almost the minimum insilicic melts; Ferry &Watson, 2007; Hayden &Watson, 2007; Watson et al., 2006). Therefore, three tempera-tures (two Zr saturation and one Ti‐in‐zircon temperatures) are provided in the final output Excel tablebased on one set of zircon‐melt data (Figure 3).
The zircon subinterface has an extra subpanel, “Choose Standards,”which serves the (Ce/Ce*)D calculation.When the input file of melt components is selected, the program automatically extracts REE, Hf, Th, and Zrdata and lists them in corresponding boxes for “Initial melt” in the first dropdown box (Figure 1c). The usermay also choose alternative normalized standards provided in the dropdown box, for example, C1, E‐MORB,N‐MORB, and OIB standards of Sun and McDonough (1989) and upper, lower, and bulk continental crustand oceanic crust standards of Taylor and McLennan (1985), to calculate (Ce/Ce*)D values. Ce4+/Ce3+
Figure 2. Flowcharts summarizing the basic workflow for calculating mineral cations and thermodynamic parameters onthe basis of amphibole. White box represents data input and extract process; orange box represents mineral cationscalculation process based on mineral formulae; gray boxes are the calculation process of T, P, and fO2; green boxesrepresent the output process of calculated T, P, and fO2 data. NNO = Ni–NiO buffer; FMQ = fayalite‐magnetite‐quartzbuffer; HM = hematite‐magnetite buffer.
10.1029/2019GC008273Geochemistry, Geophysics, Geosystems
LI ET AL. 7

ratios are synchronously calculated with (Ce/Ce*)D values through similar processes. The second dropdownbox in the “Choose Standards” subpanel provides two similar sets of radii data (Shannon, 1976), namely, the“R(A)‐1” (crystal radius) and “R(A)‐2” (effective ionic radius), for use in calculating (ri/3 + r0/6) × (ri − r0)
2
for the (Ce/Ce*)D calculation (equation (8)). The user may also enter other numbers in the input boxes, fromwhich the programwill calculate new (Ce/Ce*)D values. Finally, fO2 is calculated on the basis of temperatureand (Ce/Ce*)D (Figure 3).3.2.3. BiotiteCalculations for biotite are based on EMPA data for biotite, K‐feldspar, and magnetite. Again, the first stepconverts oxides to cations on the basis of mineral formulae. Cation data are then used in calculations asshown in Figure 4.
Then three parallel calculations are performed using cation composition of biotite, for x value, P, and T(Figure 4). The user can run multiple biotite, magnetite, and K‐feldspar at the same time, and they willnot be cross‐correlated. However, the three minerals must all be from the same rock. Calculated T and Presults by biotite compositions will be averaged and combined in the subsequent calculation of aKAlSi3O8values with cation components of K‐feldspar (Figure 4). Meanwhile, aFe3O4 values are calculated using aver-age T and cation components of magnetite, and fH2O is calculated using equation (13) with calculated indi-vidual temperature and pressure based on each biotite composition (Figure 4). Finally, fH2O, aKAlSi3O8, andaFe3O4 will be averaged and used to calculate fO2 with x value and T by using equation (12) (Figure 4).
3.3. Data Output
To save calculated results, the user clicks the “Save Result” button for each mineral subinterface(Figures 1b–1d) and selects the desired folder. The program creates Excel tables (.xlsx files) as defaultsaved files.
Figure 3. Flowcharts summarizing the basic workflow for calculating thermodynamic parameters on the basis of thecomposition of zircon and its host melt (or rock). Meanings of different colored boxes are as in Figure 2. NNO = Ni–NiO buffer; FMQ = fayalite‐magnetite‐quartz buffer; HM = hematite‐magnetite buffer.
10.1029/2019GC008273Geochemistry, Geophysics, Geosystems
LI ET AL. 8

3.4. Plotting
The user may enter the plotting interface via the “Plot” button (Figure 1). Plotting and graphic capabilities ofthe program are based on Matplotlib modules (Hunter, 2007). As an example, the plotting interface foramphibole is divided into a left “Operation” panel and right plot window (Figure 5). The user selects Xand Y coordinate axes from the dropdown menu in left “Operation” panel, with these axes sharing the sameoptions, including calculated mineral compositions and thermodynamic parameters (T, P, and fO2). Theuser can respectively rename X and Y axes through manual input boxes (i.e., “X Axes” and “Y Axes”) underdropdownmenu boxes of X and Y (Figure 5), though the initial name of X and Y axes in the rename box is setto the same as that selected in the dropdown menu. Axes ranges are set in the “X Limits” and “Y Limits”boxes (Figure 5). A figure title can be entered in the “Title” box, with linear or logarithmic scales set inthe “Scales” box (Figure 5). Symbols of different color and shape can be selected via the “Color” and“Shape” dropdown menu boxes (Figure 5). After the user chooses linear or logarithmic scale, the programwill automatically judge which axes can be converted to linear or logarithmic scale. Note that the logarith-mic scale does not apply to all chosen axes. For instance, the calculated logfO2 value is often less than 0, thelogarithmic scale for such a negative logfO2 axis does not work and no data will be shown in the rightplot window.
Once axes and symbols are set, the user clicks the “Plot” button to plot data on the binary diagram in theright plot window (Figure 5). Axes and symbols can be adjusted in the left panel before saving the image.However, contents of boxes in left “Operation” panel may be modified many times by the user, clickingthe “Plot” button displays each modified contents in plot window. The “Save Image” button allows savingof the image in the Scalable Vector Graphics (SVG) format. The SVG image may be edited in AdobeIllustrator, Adobe Photoshop, CorelDRAW, or other image‐processing software. The commonly used modeldiagrams are provided in the supporting information diagram file so that the user can use these whenmodifying saved SVG images.
Figure 4. Flowcharts summarizing the basic workflow for calculating mineral cations and thermodynamic parameters onthe basis of biotite, K‐feldspar, and magnetite. Note that the used temperature values in the last step of logfO2 calculationare the calculated individual temperature based on each biotite composition. Meanings of different colored boxes areas in Figure 2. NNO = Ni–NiO buffer; FMQ = fayalite‐magnetite‐quartz buffer; HM = hematite‐magnetite buffer.
10.1029/2019GC008273Geochemistry, Geophysics, Geosystems
LI ET AL. 9

4. Calculation Examples4.1. Amphibole
Take the 91 given amphibole data from Jiru, Qulong, and Jiama deposits in Tibet (Table S8; Wang et al.,2014) as an example, the user can copy them from Table S8 and paste them into the model input ExcelTable S2 of amphibole and save data. Through the subinterface of amphibole (Figure 1b), the user loadsfilled Table S2 and calculates various parameters by clicking the “Calculate” button.
Amphibole of Tibetan samples comprises Tschermakite, Mg‐hastingsite and Mg‐amphibole. The calculatedtemperatures and H2O contents for amphiboles are 758–984 °C and 2.9–6.5 wt.%, respectively (Table S8).Pressure values calculated by equation (3) range from 0.7 to 5.3 kbar (corresponding to a continental depthof 2–20 km), while values calculated by equation (5) range from 1.1 to 8.0 kbar (corresponding to a continen-tal depth of 4–30 km). Based on the two pressure values, Geo‐fO2 will provide two sets of fO2 value (ΔFMQ),respectively, +0.8 to +2.7, and +1.0 to +2.8 (Table S8).
4.2. Zircon
Trace element data and calculated results of zircon from Jiru (JR) and Xueba (XB) area in Tibet (Wang et al.,2014) are provided in Table S9. Table S9 also contains three corresponding bulk component data of JR‐2,JR11‐06, and XB‐12. As mentioned above, Geo‐fO2 has no automatic matching function, so the user needsto calculate fO2 values of JR‐2, JR11‐06, and XB‐12 separately. For example, the user can copy bulk compo-nent data of JR‐2 and three trace element data of zircons (i.e., JR‐2_3, JR‐2_4, and JR‐2_5) yielded in rock JR‐2 from Table S9 then respectively paste them into the model input Excel Tables S4 and S3 and save data. Byinputting Tables S4 and S3 through the zircon subinterface, the user can obtain Ce4+/Ce3+ ratio (82–119;Table S9), temperature, and fO2 values of JR‐2. As Geo‐fO2 contains three thermometers of zircon (Ferry& Watson, 2007; Miller et al., 2003; Watson & Harrison, 1983), three sets of fO2 values (i.e.,ΔFMQ = +3.73 to +5.13; +3.69 to +5.09; +3.07 to +4.67; Table S9) therefore will be calculated respectivelybased on three temperature results (i.e., 734–735 °C; 733 °C; 708–740 °C; Table S9). Then calculated tem-perature and fO2 values will be saved in output file by clicking the “Save Result” button in zircon subinter-face (Figure 1c). Through repeating above calculation procedure, the user can respectively get Ce4+/Ce3+
ratio, temperature, and fO2 values of sample JR11‐06 and XB12‐3 (see results in Table S9). In order to avoiderror caused by incorrect operation, only column B in Table S4 is allowed to input the only one set of bulkcomponent data at one time, while other columns are locked.
Figure 5. Plotting subinterface of amphibole showing the procedure to plot the binary diagrams. Data source is Table S8.
10.1029/2019GC008273Geochemistry, Geophysics, Geosystems
LI ET AL. 10

4.3. Biotite
Table S10 contains EMPA data and calculated results of biotite, K‐feldspar, and magnetite from the Pulangdeposit (Li et al., 2019). Each example of each mineral are from the same rock sample (i.e., 15PL‐04; Liet al., 2019).
As calculation in biotite section does not require cross correlation among data of three minerals, the user canpaste the six given EMPA data (Table S10) of biotite into model input Excel Table S5, the five given EMPAdata of K‐feldspar into Table S6, and the three given EMPA data of magnetite into Table S7 and save data ineach table. After input Tables S5, S6, and S7 in biotite subinterface (Figure 1d), the user can get the crystal-lization temperature and pressure of biotite (T = 731–748 °C; P = 0.9–1.1 kbar; Table S10). The average tem-perature and pressure (741 °C and 1.0 kbar) will be joined into the calculation of fH2O, aKAlSi3O8, and aFe3O4.
Finally, the fO2 values (△FMQ = +1.1 to +1.5; Table S10) will be calculated through equation (12).
5. Summary
Geo‐fO2 is specialized software for calculating and visualizing magmatic fO2 based on oxybarometers andthermobarometers for amphibole, zircon, and biotite in intermediate‐silicic magmas. It runs in Windowsplatforms and requires no installation. It automatically extracts data from Excel tables or .csv files, with cal-culated results being displayed in Excel tables. With user‐friendly interfaces, it is able to plot data on manydifferent binary diagrams, which may be saved in SVG format.
ReferencesAllen, J. C., & Boettcher, A. L. (1978). Amphiboles in andesite and basalt: II. Stability as a function of P‐T‐fH2O‐fO2.AmericanMineralogist,
63(11‐12), 1074–1087.Andersen, D. J., & Lindsley, D. H. (1985). New (and final!) models for the Ti‐magnetite/ilmenite geothermometer and oxygen barometer.
Abstract AGU 1985 Spring Meeting Eos Transactions. American Geophysical Union 66 (18), 416.Andersen, D. J., Lindsley, D. H., & Davidson, P. M. (1993). QUILF: A pascal program to assess equilibria among Fe‐M‐Mn‐Ti oxides,
pyroxenes, olivine, and quartz. Computers & Geosciences, 19(9), 1333–1350. https://doi.org/10.1016/0098‐3004(93)90033‐2Andújar, J., Costa, F., Martí, J., Wolff, J. A., & Carroll, M. R. (2008). Experimental constraints on pre‐eruptive conditions of phonolitic
magma from the caldera‐forming El Abrigo eruption, Tenerife (Canary Islands). Chemical Geology, 257(3‐4), 173–191. https://doi.org/10.1016/j.chemgeo.2008.08.012
Andújar, J., & Scaillet, B. (2012). Experimental constraints on parameters controlling the difference in the eruptive dynamics of pho-nolitic magmas: The case of Tenerife (Canary Islands). Journal of Petrology, 53(9), 1777–1806. https://doi.org/10.1093/petrology/egs033
Ballard, J. R., Palin, M. J., & Campbell, I. H. (2002). Relative oxidation states of magmas inferred from Ce (IV)/Ce (III) in zircon:Application to porphyry copper deposits of northern Chile. Contributions to Mineralogy and Petrology, 144(3), 347–364. https://doi.org/10.1007/s00410‐002‐0402‐5
Blundy, J., & Wood, B. (1994). Prediction of crystal–melt partition coefficients from elastic moduli. Nature, 372, 452–454. https://doi.org/10.1038/372452a0
Brounce, M. N., Kelley, K. A., & Cottrell, E. (2014). Variations in Fe3+/∑Fe of Mariana Arc basalts and mantle wedge fO2. Journal ofPetrology, 55(12), 2513–2536. https://doi.org/10.1093/petrology/egu065
Buddington, A. F., & Lindsley, D. H. (1964). Iron‐titanium oxide minerals and synthetic equivalents. Journal of Petrology, 5(2), 310–357.https://doi.org/10.1093/petrology/5.2.310
Burgisser, A., & Scaillet, B. (2007). Redox evolution of a degassing magma rising to the surface. Nature, 445(7124), 194. https://doi.org/10.1038/nature05509
Burnham, A. D., & Berry, A. J. (2012). An experimental study of trace element partitioning between zircon and melt as a function of oxygenfugacity. Geochimica et Cosmochimica Acta, 95, 196–212. https://doi.org/10.1016/j.gca.2012.07.034
Canil, D. (2002). Vanadium in peridotites, mantle redox and tectonic environments: Archean to present. Earth and Planetary ScienceLetters, 195(1‐2), 75–90. https://doi.org/10.1016/S0012‐821X(01)00582‐9
Carmichael, I. S. E. (1966). The iron‐titanium oxides of salic volcanic rocks and their associated ferromagnesian silicates. Contributions toMineralogy and Petrology, 14(1), 36–64. https://doi.org/10.1007/BF00370985
Carmichael, I. S. E. (1991). The redox states of basic and silicic magmas: A reflection of their source regions? Contributions to Mineralogyand Petrology, 106, 129–141. https://doi.org/10.1007/BF00306429
Cherniak, D. J., Hanchar, J. M., & Watson, E. B. (1997). Rare‐earth diffusion in zircon. Chemical Geology, 134(4), 289–301. https://doi.org/10.1016/S0009‐2541(96)00098‐8
Clémente, B., Scaillet, B., & Pichavant, M. (2004). The solubility of sulphur in hydrous rhyolitic melts. Journal of Petrology, 45(11),2171–2196. https://doi.org/10.1093/petrology/egh052
Cottrell, E., & Kelley, K. A. (2011). The oxidation state of Fe in MORB glasses and the oxygen fugacity of the upper mantle. Earth andPlanetary Science Letters, 305(3), 270–282. https://doi.org/10.1016/j.epsl.2011.03.014
Danyushevsky, L. V., & Plechov, P. (2011). Petrolog3: Integrated software for modeling crystallization processes. Geochemistry, Geophysics,Geosystems, 12, Q07021. https://doi.org/10.1029/2011GC003516
Dilles, J. H., Kent, A. J., Wooden, J. L., Tosdal, R. M., Koleszar, A., Lee, R. G., & Farmer, L. P. (2015). Zircon compositional evidence forsulfur–degassing from ore–forming arc magmas. Economic Geology, 110(1), 241–251. https://doi.org/10.2113/econgeo.110.1.241
Eggler, D. H. (1972). Amphibole stability in H2O‐undersaturated calc‐alkaline melts. Earth and Planetary Science Letters, 15(1), 28–34.https://doi.org/10.1016/0012‐821X(72)90025‐8
10.1029/2019GC008273Geochemistry, Geophysics, Geosystems
LI ET AL. 11
AcknowledgmentsThis work was funded by the NationalKey Research and Development Projectof China (2016YFC0600305) and theNational Natural Science Foundation ofChina (41825005, 41273051, and41473041). We thank Fuat Yavuz,Filippo Ridolfi, Rui Wang, and JuntingQiu for guidance of calculation andYulei Zhao for design of cover icon.Suzanne K. Birner and an anonymousreviewer are thanked for their thoroughand constructive reviews. We appreci-ate Editor Janne Blichert‐Toft and ananonymous Associate Editor ofGeochemistry, Geophysics, Geosystemsfor their constructive comments andediting. Geo‐fO2 is encouraged to bedownloaded from our homepage(http://geo‐fo2.com), on which the lat-est version of the software will beavailable. Our homepage will also servecalculations of fO2 for the long term; allsuggestions for improvement in thesoftware and website are welcome.Model input Excel tables, examples,and model diagrams are provided in thesupporting information.

Elderfield, H., Hawkesworth, C. J., Greaves, M. J., & Calvert, S. E. (1981). Rare earth element zonation in Pacific ferromanganese nodules.Geochimica et Cosmochimica Acta, 45(7), 1231–1234. https://doi.org/10.1016/0016‐7037(81)90146‐0
Elkins, L. T., & Grove, T. L. (1990). Ternary feldspar experiments and thermodynamic models. American Mineralogist, 75(5–6), 544–559.Evans, K. A., & Tomkins, A. G. (2011). The relationship between subduction zone redox budget and arc magma fertility. Earth and
Planetary Science Letters, 308(3‐4), 401–409. https://doi.org/10.1016/j.epsl.2011.06.009Fabbrizio, A., & Carroll, M. R. (2008). Experimental constraints on the differentiation process and pre‐eruptive conditions in the magmatic
system of phlegraean fields (Naples, Italy). Journal of Volcanology and Geothermal Research, 171(1), 88–102. https://doi.org/10.1016/j.jvolgeores.2007.11.002
Fabbrizio, E., Rouse, P. J., & Carroll, M. R. (2006). New experimental data on biotite+magnetite+sanidine saturated phonolitic melts andapplication to the estimation of magmatic water fugacity. American Mineralogist, 91(11–12), 1863–1870. https://doi.org/10.2138/am.2006.2055
Ferry, J. M., & Watson, E. B. (2007). New thermodynamic models and revised calibrations for the ti–in–zircon and zr–in–rutile thermo-meters. Contributions to Mineralogy and Petrology, 154(4), 429–437. https://doi.org/10.1007/s00410‐007‐0201‐0
Frost, B. R. (1991). Introduction to oxygen fugacity and its petrologic importance. In D. H. Lindsley (Ed.), Oxide Minerals: Petrologic andMagnetic Significance. Reviews in Mineralogy (Vol. 25, pp. 1–9). Washington, DC: Mineral. Soc. Am.
Ghiorso, M. S., & Gualda, G. A. (2013). A method for estimating the activity of titania in magmatic liquids from the compositions ofcoexisting rhombohedral and cubic iron–titanium oxides. Contributions to Mineralogy and Petrology, 165(1), 73–81. https://doi.org/10.1007/s00410‐012‐0792‐y
Ghiorso, M. S., Hirschmann, M.M., Reiners, P. W., & Kress, V. C. III (2002). The pMELTS: A revision of MELTS for improved calculation ofphase relations and major element partitioning related to partial melting of the mantle to 3 GPa. Geochemistry, Geophysics, Geosystems,3(5), 1030. https://doi.org/10.1029/2001GC000217
Ghiorso, M. S., & Sack, O. (1991). Fe‐Ti oxide geothermometry: Thermodynamic formulation and the estimation of intensive variables insilicic magmas. Contributions to Mineralogy and Petrology, 108(4), 485–510. https://doi.org/10.1007/BF00303452
Ghiorso, M. S., & Sack, R. O. (1995). Chemical mass transfer in magmatic processes IV. A revised and internally consistent thermodynamicmodel for the interpolation and extrapolation of liquid‐solid equilibria in magmatic systems at elevated temperatures and pressures.Contributions to Mineralogy and Petrology, 119(2‐3), 197–212. https://doi.org/10.1007/BF00307281
Hayden, L. A., &Watson, E. B. (2007). Rutile saturation in hydrous siliceous melts and its bearing on Ti‐thermometry of quartz and zircon.Earth and Planetary Science Letters, 258(3‐4), 561–568. https://doi.org/10.1016/j.epsl.2007.04.020
Helmy, H. M., Ahmed, A. F., El Mahallawi, M. M., & Ali, S. M. (2004). Pressure, temperature and oxygen fugacity conditions of calc‐alkaline granitoids, Eastern Desert of Egypt, and tectonic implications. Journal of African Earth Sciences, 38(3), 255–268. https://doi.org/10.1016/j.jafrearsci.2004.01.002
Henry, D. J., Guidotti, C. V., & Thomson, J. A. (2005). The Ti–saturation surface for low–to–medium pressure metapelitic biotites:Implications for geothermometry and Ti–substitution mechanisms. American Mineralogist, 90(2–3), 316–328. https://doi.org/10.2138/am.2005.1498
Hinton, R. W., & Upton, B. G. J. (1991). The chemistry of zircon: Variations within and between large crystals from syenite and alkali basaltxenoliths. Geochimica et Cosmochimica Acta, 55(11), 3287–3302. https://doi.org/10.1016/0016‐7037(91)90489‐R
Holloway, J. R., & Blank, J. G. (1994). Application of experimental results to C‐O‐H species in natural melts. Reviews in Mineralogy andGeochemistry, 30(1), 187–230.
Hossain, I., & Tsunogae, T. (2014). Crystallization conditions and petrogenesis of the paleoproterozoic basement rocks in Bangladesh: Anevaluation of biotite and coexisting amphibole mineral chemistry. Journal of Earth Science, 25(1), 87–97. https://doi.org/10.1007/s12583‐014‐0402‐1
Hunter, J. D. (2007). Matplotlib: A 2D graphics environment. Computing in Science & Engineering, 9(3), 90–95. https://doi.org/10.1109/MCSE.2007.55
Iacono‐Marziano, G., Gaillard, F., Scaillet, B., Polozov, A. G., Marecal, V., Pirre, M., & Arndt, N. T. (2012). Extremely reducing conditionsreached during basaltic intrusion in organic matter‐bearing sediments. Earth and Planetary Science Letters, 357, 319–326. https://doi.org/10.1016/j.epsl.2012.09.052
Iacovino, K. (2014). An unexpected journey: Experimental insights into magma and volatile transport beneath Erebus volcano, Antarctica(Doctoral dissertation, University of Cambridge). https://doi.org/10.17863/CAM.16442
Jugo, P. J. (2009). Sulfur content at sulfide saturation in oxidized magmas. Geology, 37(5), 415–418. https://doi.org/10.1130/G25527A.1Jugo, P. J., Luth, R. W., & Richards, J. P. (2005). Experimental data on the speciation of sulfur as a function of oxygen fugacity in basaltic
melts. Geochimica et Cosmochimica Acta, 69(2), 497–503. https://doi.org/10.1016/j.gca.2004.07.011Kennedy, G. C. (1948). Equilibrium between volatiles and iron oxides in igneous rocks. American Journal of Science, 246(9), 529–548.Kilinc, A., Carmichael, I. S. E., Rivers, M. L., & Sack, R. O. (1983). The ferric‐ferrous ratio of natural silicate liquids equilibrated in air.
Contributions to Mineralogy and Petrology, 83(1‐2), 136–140. https://doi.org/10.1007/BF00373086Kress, V. C., & Carmichael, I. S. (1991). The compressibility of silicate liquids containing Fe2O3 and the effect of composition, temperature,
oxygen fugacity and pressure on their redox states. Contributions to Mineralogy and Petrology, 108(1‐2), 82–92. https://doi.org/10.1007/BF00307328
Leake, B. E., Woolley, A. R., Arps, C. E. S., Birch, W. D., Gilbert, M. C., Grice, J. D., et al. (1997). Nomenclature of amphiboles: Report of thesubcommittee on amphiboles of the International Mineralogical Association Commission on New Minerals and Mineral Names. TheCanadian Mineralogist, 61(405), 295–310. https://doi.org/10.1180/minmag.1997.061.405.13
Lee, C. T. A., Leeman, W. P., Canil, D., & Li, Z. X. A. (2005). Similar V/Sc systematics in MORB and arc basalts: Implications for the oxygenfugacities of their mantle source regions. Journal of Petrology, 46(11), 2313–2336. https://doi.org/10.1093/petrology/egi056
Lepage, L. D. (2003). ILMAT: An excel worksheet for ilmenite–magnetite geothermometry and geobarometry. Computers & Geosciences,29(5), 673–678. https://doi.org/10.1016/S0098‐3004(03)00042‐6
Li, W. K., Yang, Z. M., Cao, K., Lu, Y. J., & Sun, M. Y. (2019). Redox‐controlled generation of the giant porphyry Cu–Au deposit at Pulang,southwest China. Contributions to Mineralogy and Petrology, 174(2), 12. https://doi.org/10.1007/s00410‐019‐1546‐x
Mathez, E. A. (1984). Influence of degassing on oxidation states of basaltic magmas. Nature, 310(5976), 371. https://doi.org/10.1038/310371a0
Miller, C. F., McDowell, S. M., & Mapes, R. W. (2003). Hot and cold granites? Implications of zircon saturation temperatures and preser-vation of inheritance. Geology, 31(6), 529–532. https://doi.org/10.1130/0091‐7613(2003)031<0529:HACGIO>2.0.CO;2
Moretti, R., & Ottonello, G. (2005). Solubility and speciation of sulfur in silicate melts: The Conjugated Toop‐Samis‐Flood‐Grjotheim(CTSFG) model. Geochimica et Cosmochimica Acta, 69(4), 801–823. https://doi.org/10.1016/j.gca.2004.09.006
10.1029/2019GC008273Geochemistry, Geophysics, Geosystems
LI ET AL. 12

Mutch, E. J. F., Blundy, J. D., Tattitch, B. C., Cooper, F. J., & Brooker, R. A. (2016). An experimental study of amphibole stability in low‐pressure granitic magmas and a revised Al‐in‐hornblende geobarometer. Contributions to Mineralogy and Petrology, 171(10), 85. https://doi.org/10.1007/s00410‐016‐1298‐9
Nandedkar, R. H., Ulmer, P., & Müntener, O. (2014). Fractional crystallization of primitive, hydrous arc magmas: An experimental study at0.7 GPa. Contributions to Mineralogy and Petrology, 167(6), 1015. https://doi.org/10.1007/s00410‐014‐1015‐5
Nasir, S. (1994). PTOXY: Software package for the calculation of pressure–temperature–oxygen fugacity using a selection of metamorphicgeothermobarometers. Computers and Geosciences, 20(9), 1297–1320. https://doi.org/10.1016/0098‐3004(94)90056‐6
O'Neill, H. S. (1987). Quartz‐fayalite‐iron and quartz‐fayalite‐magnetite equilibria and the free energy of formation of fayalite (Fe2SiO4) andmagnetite (Fe3O4). American Mineralogist, 72(1‐2), 67–75.
O'Neill, H. S., & Pownceby, M. I. (1993). Thermodynamic data from redox reactions at high temperatures. I. An experimental and theo-retical assessment of the electrochemical method using stabilized zirconia electrolytes, with revised values for the Fe–“FeO”, Co–CoO,Ni–NiO, and Cu–Cu2O oxygen buffers, and new data for the W–WO2 buffer. Contributions to Mineralogy and Petrology, 114, 296–314.https://doi.org/10.1007/BF01046533
Pawley, A. R., Holloway, J. R., & McMillan, P. F. (1992). The effect of oxygen fugacity on the solubility of carbon–oxygen fluids in basalticmelt. Earth and Planetary Science Letters, 110, 213–225. https://doi.org/10.1016/0012‐821X(92)90049‐2
Prausnitz, J. M., Lichtenthaler, R. N., & de Azevedo, E. G. (1998). Molecular thermodynamics of fluid‐phase equilibria. Pearson Education.Qiu, J. T., Yu, X. Q., Santosh, M., Zhang, D. H., Chen, S. Q., & Li, P. J. (2013). Geochronology and magmatic oxygen fugacity of the Tongcun
molybdenum deposit, northwest Zhejiang, SE China. Mineralium Deposita, 48(5), 545–556. https://doi.org/10.1007/s00126‐013‐0456‐5Richards, J. P. (2015). The oxidation state, and sulfur and Cu contents of arc magmas: implications for metallogeny. Lithos, 233, 27–45.
https://doi.org/10.1016/j.lithos.2014.12.011Ridolfi, F., & Renzulli, A. (2012). Calcic amphiboles in calc‐alkaline and alkaline magmas: Thermobarometric and chemometric empirical
equations valid up to 1,130°C and 2.2 GPa. Contributions to Mineralogy and Petrology, 163(5), 877–895. https://doi.org/10.1007/s00410‐011‐0704‐6
Ridolfi, F., Renzulli, A., & Puerini, M. (2010). Stability and chemical equilibrium of amphibole in calc‐alkaline magmas: An overview, newthermobarometric formulations and application to subduction–related volcanoes. Contributions to Mineralogy and Petrology, 160(1),45–66. https://doi.org/10.1007/s00410‐009‐0465‐7
Rowe, M. C., Kent, A. J., & Nielsen, R. L. (2009). Subduction influence on oxygen fugacity and trace and volatile elements in basalts acrossthe Cascade Volcanic Arc. Journal of Petrology, 50(1), 61–91. https://doi.org/10.1093/petrology/egn072
Sack, R. O., Carmichael, I. S. E., Rivers, M. L., & Ghiorso, M. S. (1981). Ferric‐ferrous equilibria in natural silicate liquids at 1 bar.Contributions to Mineralogy and Petrology, 75(4), 369–376. https://doi.org/10.1007/BF00374720
Sano, Y., Terada, K., & Fukuoka, T. (2002). Highmass resolution ionmicroprobe analysis of rare earth elements in silicate glass, apatite andzircon: Lack of matrix dependency. Chemical Geology, 184(3), 217–230. https://doi.org/10.1016/S0009‐2541(01)00366‐7
Sarjoughian, F., Kananian, A., Haschke, M., Ahmadian, J., Ling, W., & Zong, K. (2012). Magma mingling and hybridization in the Kuh‐eDom pluton, Central Iran. Journal of Asian Earth Sciences, 54, 49–63. https://doi.org/10.1016/j.jseaes.2012.03.013
Schmidt, M. W. (1992). Amphibole composition in tonalite as a function of pressure; an experimental calibration of the Al–in–hornblendebarometer. Contributions to Mineralogy and Petrology, 110, 304–310. https://doi.org/10.1007/BF00310745
Shannon, R. T. (1976). Revised effective ionic radii and systematic studies of interatomic distances in halides and chalcogenides. ActaCrystallographica, Section A: Crystal Physics, Diffraction, Theoretical and General Crystallography, 32(5), 751–767. https://doi.org/10.1107/S0567739476001551
Sillitoe, R. H. (2010). Porphyry copper systems. Economic Geology, 105(1), 3–41. https://doi.org/10.2113/gsecongeo.105.1.3Simon, A. C., & Ripley, E. M. (2011). The role of magmatic sulfur in the formation of ore deposits. Reviews in Mineralogy and Geochemistry,
73(1), 513–578. https://doi.org/10.2138/rmg.2011.73.16Skora, S., & Blundy, J. (2010). High‐pressure hydrous phase relations of radiolarian clay and implications for the involvement of subducted
sediment in arc magmatism. Journal of Petrology, 51(11), 2211–2243. https://doi.org/10.1093/petrology/egq054Smith, P. M., & Asimow, P. D. (2005). Adiabat_1ph: A new public front‐end to the MELTS, pMELTS, and pHMELTS models. Geochemistry,
Geophysics, Geosystems, 6, Q02004. https://doi.org/10.1029/2004GC000816Smythe, D. J., & Brenan, J. M. (2016). Magmatic oxygen fugacity estimated using zircon‐melt partitioning of cerium. Earth and Planetary
Science Letters, 453, 260–266. https://doi.org/10.1016/j.epsl.2016.08.013Speer, J. A. (1984). Micas in igneous rocks. Reviews in Mineralogy and Geochemistry, 13(1), 299–356.Stepanov, A. S., Hermann, J., Rubatto, D., & Rapp, R. P. (2012). Experimental study of monazite/melt partitioning with implications for the
REE, Th and U geochemistry of crustal rocks. Chemical Geology, 300, 200–220. https://doi.org/10.1016/j.chemgeo.2012.01.007Sun, S. S., & McDonough, W. F. (1989). Chemical and isotopic systematics of oceanic basalts: Implications for mantle composition and
processes. Geological Society, London, Special Publications, 42, 313–345. https://doi.org/10.1144/GSL.SP.1989.042.01.19Taylor, S. R., & McLennan, S. M. (1985). The Continental Crust: Its Composition and Evolution. London: Blackwell Scientific Publications.Thomas, J. B., Bodnar, R. J., Shimizu, N., & Sinha, A. K. (2002). Determination of zircon/melt trace element partition coefficients from
SIMS analysis of melt inclusions in zircon. Geochimica et Cosmochimica Acta, 66(16), 2887–2901. https://doi.org/10.1016/S0016‐7037(02)00881‐5
Trail, D., Tailby, N. D., Lanzirotti, A., Newville, M., Thomas, J. B., & Watson, E. B. (2015). Redox evolution of silicic magmas: Insights fromXANES measurements of Ce valence in Bishop Tuff zircons. Chemical Geology, 402, 77–88. https://doi.org/10.1016/j.chemgeo.2015.02.033
Trail, D., Watson, E. B., & Tailby, N. D. (2011). The oxidation state of Hadean magmas and implications for early Earth's atmosphere.Nature, 480(7375), 79–82. https://doi.org/10.1038/nature10655
Trail, D., Watson, E. B., & Tailby, N. D. (2012). Ce and Eu anomalies in zircon as proxies for the oxidation state of magmas. Geochimica etCosmochimica Acta, 97, 70–87. https://doi.org/10.1016/j.gca.2012.08.032
Uchida, E., Endo, S., & Makino, M. (2007). Relationship between solidification depth of granitic rocks and formation of hydrothermal oredeposits. Resource Geology, 57(1), 47–56. https://doi.org/10.1111/j.1751‐3928.2006.00004.x
van Rossum, G., & Drake, F. L. Jr. (1995). Python Tutorial. Amsterdam, The Netherlands: Centrum voor Wiskunde en Informatica.van Rossum, G., & Drake, F. L. (2011). The python language reference manual. Network Theory Ltd.Venezky, D. Y., & Rutherford, M. J. (1999). Petrology and Fe‐Ti oxide reequilibration of the 1991 Mount Unzen mixed magma. Journal of
Volcanology and Geothermal Research, 89(1‐4), 213–230. https://doi.org/10.1016/S0377‐0273(98)00133‐4Waldbaum, D. R., & Thompson, J. B. Jr. (1969). Mixing properties of sanidine crystalline solutions: IV. Phase diagrams from equations of
state. American Mineralogist, 54(9‐10), 1274–1298.
10.1029/2019GC008273Geochemistry, Geophysics, Geosystems
LI ET AL. 13

Wang, R., Richards, J. P., Hou, Z. Q., Yang, Z. M., Gou, Z. B., & DuFrane, S. A. (2014). Increasing magmatic oxidation state from Paleoceneto Miocene in the Eastern Gangdese Belt, Tibet: Implication for collision–related porphyry Cu–Mo–Au mineralization. EconomicGeology, 109(7), 1943–1965. https://doi.org/10.2113/econgeo.109.7.1943
Watson, E. B., & Harrison, T. M. (1983). Zircon saturation revisited: Temperature and composition effects in a variety of crustal magmatypes. Earth and Planetary Science Letters, 64(2), 295–304. https://doi.org/10.1016/0012‐821X(83)90211‐X
Watson, E. B., Wark, D. A., & Thomas, J. B. (2006). Crystallization thermometers for zircon and rutile. Contributions to Mineralogy andPetrology, 151(4), 413. https://doi.org/10.1007/s00410‐006‐0068‐5
Wones, D. R. (1972). Stability of biotite: A reply. American Mineralogist, 57(1–2), 316–317.Wones, D. R. (1981). Mafic silicates as indicators of intensive variables in granitic magmas. Mining Geology, 31(168), 191–212. https://doi.
org/10.11456/shigenchishitsu1951.31.191Wones, D. R., & Eugster, H. P. (1965). Stability of biotite–experiment theory and application. American Mineralogist, 50(9), 1228–1272.Woodland, A. B., & Wood, B. J. (1994). Fe3O4 activities in Fe–Ti spinel solid solutions. European Journal of Mineralogy, 6, 23–37. https://
doi.org/10.1127/ejm/6/1/0023Yang, Z. M., Goldfarb, R., & Chang, Z. S. (2016). Generation of postcollisional porphyry Cu deposits in southern Tibet triggered by sub-
duction of Indian continental plate. Society of Economic Geologists Special Publication, 19, 279–300. https://doi.org/10.5382/SP.19.11Yavuz, F. (2003a). Evaluating micas in petrologic and metallogenic aspect: I—Definitions and structure of the computer program MICA+.
Computers & Geosciences, 29(10), 1203–1213. https://doi.org/10.1016/S0098‐3004(03)00142‐0Yavuz, F. (2003b). Evaluating micas in petrologic and metallogenic aspect: Part II—Applications using the computer program Mica+.
Computers & Geosciences, 29(10), 1215–1228. https://doi.org/10.1016/S0098‐3004(03)00143‐2Yavuz, F., & Öztaş, T. (1997). BIOTERM—A program for evaluating and plotting microprobe analyses of biotite from barren and miner-
alized magmatic suites. Computers & Geosciences, 23(8), 897–907. https://doi.org/10.1016/S0098‐3004(97)00071‐XZajacz, Z., Seo, J. H., Candela, P. A., Piccoli, P. M., & Tossell, J. A. (2011). The solubility of copper in high‐temperature magmatic vapors: A
quest for the significance of various chloride and sulfide complexes. Geochimica et Cosmochimica Acta, 75(10), 2811–2827. https://doi.org/10.1016/j.gca.2011.02.029
Zou, X., Qin, K., Han, X., Li, G., Evans, N. J., Li, Z., & Yang, W. (2019). Insight into zircon REE oxy‐barometers: A lattice strain modelperspective. Earth and Planetary Science Letters, 506, 87–96. https://doi.org/10.1016/j.epsl.2018.10.031
10.1029/2019GC008273Geochemistry, Geophysics, Geosystems
LI ET AL. 14