geoarea auto-key results summary - landfire · geoarea auto-key results summary ... assignment and...
TRANSCRIPT

Improvements #1 Auto-Key Results Summary Page 1
GeoArea Auto-Key Results Summary
19,446 plots available for the analysis, 16,157 plots were able to be ‘auto-keyed’ (83%). The numberof plots not auto-keyed is significant, and should be addressed in the future.
A separate “Recommendations Summary” report was developed and provided. This particularreport is more about results than it is about generalizations or recommendations about modifyingthe sequence tables.
The number of available plots per GA varied significantly, from 1295 to 3827. This situation mirrorswhat is available to the mapping process, which could have an important impact on map qualityvariability by map zone.
ES were often auto-keyed in a GeoArea but were NOT attributed by experts in that GeoArea. Mostof these are spatially peripheral to the particular GeoArea or have limited extents. However,sometimes plots were auto-keyed to ES that likely do not occur in that GeoArea.
Some ES are under-represented in the sample—some are not important to that GA but others areand these should be sampled more intensely in the future. More explicitly, new field inventories areneeded to enhance the number of samples of some ES for both mapping and AA purposes. Thesewould also help to clarify distribution and floristic components of some ES.
Original % Agreement: results low to moderate, with poorest results in HI, AK and SE. Across thecountry as a whole, agreement was in the mid to high 40% range
Recomputed % Agreement: results were primarily moderate, with the exception of HI which was stilllow. Across the nation as a whole, agreement was in the mid to high 50% range, excepting HI. Weconsider this recomputed % agreement to be the more robust number.
The impact of auto-key/expert disagreement on map quality is still unknown---we have not had thetime to connect these results to LF National 1.0.0 map agreement results (not a goal of this project)
Very high agreements (>80%) between the auto-key and experts for individual ES did occur, butwere not the majority. Many of the lower agreements could potentially be attributed to low samplesize for that ES.
Specific recommendations on where to focus future sequence table revisions are defined in eachGeoArea report. Sequence Table teams should refer to the specific relevant GeoArea reports.
Original % Agreement: all cells [agreement floor] Recomputed % Agreement: Eliminated the ‘Not a System’ row and the ‘Can’t Assign’ and ‘Other’
columns in the contingency table [agreement ceiling]
GeoArea Original % Agreement
Recomputed % Agreement
1 36 63
2E 40 51
2W 46 54
3 54 66
4 53 66
5 44 57
6 45 61
7E 40 48
7W 39 48
8 33 49
HI 24 27

Improvements #1 Auto-Key Results Summary Page 2
Specific results copied from GeoArea Reports GeoArea 1 GeoArea 1 encompasses the southern Midwest to the southeast coastal regions extending from the West Gulf Coastal Plain and Mississippi Delta to the Mid-Atlantic Coastal Plain south to the Florida Peninsula (Error! Reference source not found., map zones 37, 45, 46, 55, 56, and 58). This GeoArea includes a total of 6 map zones, originally clustered for purposes of designing and implementing auto-keys (Error! Reference source not found.). The total number of plots in this GeoArea analysis was 1,384. A total of 36 natural ecological system types were assigned to a total of 949 plots by the auto-keys. A total of 78 ecological system types were assigned by experts (i.e., these included individual types that had been aggregated to broader classes by LANDFIRE for sparsely vegetated types or wetland/riparian types). An additional 12 types were assigned by the auto-key but were not assigned by experts:
Crosstimbers Oak Forest and Woodland
Florida Peninsula Inland Scrub
Lower Mississippi River Dune Woodland and Forest
Mississippi Delta Maritime Forest
Southern Atlantic Coastal Plain Dune and Maritime Grassland
Texas Saline Coastal Prairie
Texas-Louisiana Coastal Prairie Pondshore
Caribbean Swamp Systems
Gulf and Atlantic Coastal Plain Floodplain Systems
Gulf and Atlantic Coastal Plain Small Stream Riparian Systems
Gulf and Atlantic Coastal Plain Swamp Systems
Gulf and Atlantic Coastal Plain Tidal Marsh Systems Of the twelve types, six represent the aggregated wetland systems used in the LANDFIRE map legend. For those types, the experts assigned individual ecological system classification to the plots.
Comparison of Auto-key and Expert Assignments
Of the 36 natural ecological system types assigned labels by the auto-keys, 10 types (27%) had fewer than 20 samples available for this analysis (Table 4). These under-sampled types tended to include types that are found on the periphery of their range within this GeoArea (e.g., Caribbean Swamp Systems), while others are generally within this range, but are restricted in extent (e.g. Southern Atlantic Coastal Plain Dune and Maritime Grassland), occupy small extents (e.g. Lower Mississippi River Dune Woodland and Forest), or are degraded with limited high quality sites available for sampling (e.g. Texas Saline Coastal Prairie; Southern Coastal Plain Blackland Prairie). These 10 under-sampled types were excluded from further analysis. Table 1. Under-sampled types within GeoArea 1
EVTCode EVT Name Ecological System elcode
Total Plots
2513 Lower Mississippi River Flatwoods CES203.193 8

Improvements #1 Auto-Key Results Summary Page 3
EVTCode EVT Name Ecological System elcode
Total Plots
2381 Lower Mississippi River Dune Woodland and Forest
CES203.531 5
2328 Southern Coastal Plain Limestone Forest CES203.502 4 2430 Southern Coastal Plain Blackland Prairie and
Woodland CES203.478 2
2306 East Gulf Coastal Plain Northern Loess Plain Oak-Hickory Upland
CES203.482 2
2487 Texas-Louisiana Coastal Prairie Pondshore CES203.541 2
2329 East Gulf Coastal Plain Southern Loess Bluff Forest CES203.556 2
2452 Atlantic Coastal Plain Peatland Pocosin and Canebrake
CES203.267 1
2426 Southern Atlantic Coastal Plain Dune and Maritime Grassland
CES203.273 1
2384 Mississippi Delta Maritime Forest CES203.513 1 Of the 36 types, none had >80% agreement between expert and auto-key assignments. Table 2 represents a summary of the 26 adequately-sampled types where agreement between expert assignment and auto-key ranged from just below 80% down to zero. Further analysis of those grouped within the 60-80% agreement range suggests subtleties within types that left the expert with greater or lesser confidence in their assignment. The following are some specific examples of levels of disagreement and possible explanations based on interpretations from the contingency table in the Results Workbook. For the Atlantic Coastal Plain Fall-line Sandhills Longleaf Pine Woodland (CES203.254) of the ten plots where the experts and the auto-key disagreed, eight of them (17% of the total) had been labeled by the expert as being Atlantic Coastal Plain Upland Longleaf Pine Woodland (CES203.281). Longleaf pine dominance is common to both systems, so subcanopy and understory species composition are central to distinguishing those two systems. Six of the 11 mismatches in the Florida Longleaf Pine Sandhill (CES203.284) assignment had been classed as the Eastern Gulf Coastal Plain Interior Longleaf Pine Woodland (CES203.496). Again longleaf dominance is common, but biogeographic range and subcanopy and understory indicators may be useful in making the distinction. For several ecological systems (e.g. East Gulf Coastal Plain Interior Shortleaf Pine-Oak Forest, Southern Atlantic Coastal Plain Dry and Dry-Mesic Oak Forest) the rapid rate of land use change and disturbed nature of the landscape make assignment to an ecological system difficult. In these cases a portion of the plots that had been assigned by the auto-key as a system were classified by the experts are “can’t assign” or a ruderal vegetation type. In some cases, subtle differences in the descriptions between ecological systems make them difficult to distinguish with limited data provided. For example, the experts have a range of confidence when assigning labels to the plots which had been auto-keyed to Southern Coastal Plain Seepage Swamp and

Improvements #1 Auto-Key Results Summary Page 4
Baygall (CES 203.505). The experts assigned some of those plots to Southern Coastal Plain Mesic Slope Forest (CES203.476; 4 plots), Southern Coastal Plain Dry Upland Hardwood Forest (CES203.560; 1 plot), Atlantic Coastal Plain Streamhead Seepage Swamp, Pocosin and Baygall (CES203.252; 1 plot), and Southern Coastal Plain Nonriverine Cypress Dome (CES203.251; 1 plot). Two of the plots were labeled as “can’t assign”. Table 2. Summary of types with adequate samples where agreement between auto-key and expert was below 80%
Plots with Expert Matches EVT Code
EVT Name System Elcode
Total Plots
Total
% High conf
Med conf
Low conf
2346 Atlantic Coastal Plain Fall-line Sandhills Longleaf Pine Woodland
CES203.254
47 37 79% 29 7 1
2356 Florida Longleaf Pine Sandhill CES203.284
50 39 78% 28 9 2
2372 East Gulf Coastal Plain Interior Shortleaf Pine-Oak Forest
CES203.506
30 23 77% 13 4 6
2349 East Gulf Coastal Plain Interior Upland Longleaf Pine Woodland
CES203.496
50 38 76% 25 13 0
2347 Atlantic Coastal Plain Upland Longleaf Pine Woodland
CES203.281
50 37 74% 17 14 6
2371 West Gulf Coastal Plain Pine-Hardwood Forest
CES203.378
49 36 73% 31 1 4
2348 West Gulf Coastal Plain Upland Longleaf Pine Forest and Woodland
CES203.293
48 32 67% 19 8 5
2307 East Gulf Coastal Plain Northern Dry Upland Hardwood Forest
CES203.483
29 18 62% 12 5 1
2460 Southern Coastal Plain Nonriverine Cypress Dome
CES203.251
15 9 60% 3 6 0
2322 Crowley's Ridge Mesic Loess Slope Forest
CES203.079
10 5 50% 5 0 0
2461 Southern Coastal Plain Seepage Swamp and Baygall
CES203.505
48 22 46% 8 10 4
2453 Central Florida Pine Flatwoods
CES203.382
24 11 46% 2 9 0
2378 West Gulf Coastal Plain Sandhill Oak and Shortleaf Pine Forest and Woodland
CES203.056
28 12 43% 8 4 0

Improvements #1 Auto-Key Results Summary Page 5
Plots with Expert Matches EVT Code
EVT Name System Elcode
Total Plots
Total
% High conf
Med conf
Low conf
2449 Central Atlantic Coastal Plain Wet Longleaf Pine Savanna and Flatwoods
CES203.265
26 10 38% 9 1 0
2335 Southern Atlantic Coastal Plain Dry and Dry-Mesic Oak Forest
CES203.241
47 15 32% 11 4 0
2462 West Gulf Coastal Plain Seepage Swamp and Baygall
CES203.372
10 3 30% 1 2 0
2323 West Gulf Coastal Plain Mesic Hardwood Forest
CES203.280
47 14 30% 9 5 0
2454 East Gulf Coastal Plain Near-Coast Pine Flatwoods
CES203.375
24 6 25% 3 3 0
2468 Atlantic Coastal Plain Streamhead Seepage Swamp-Pocosin-Baygall
CES203.252
48 9 19% 5 2 2
2325 East Gulf Coastal Plain Northern Mesic Hardwood Slope Forest
CES203.477
18 2 11% 1 1 0
2458 West Gulf Coastal Plain Pine-Hardwood Flatwoods
CES203.278
49 4 8% 3 1 0
2330 Southern Coastal Plain Dry Upland Hardwood Forest
CES203.560
49 4 8% 1 2 1
2343 Southern Atlantic Coastal Plain Mesic Hardwood Forest
CES203.242
47 3 6% 1 0 2
2357 Southern Coastal Plain Mesic Slope Forest
CES203.476
49 1 2% 1 0 0
2308 Crosstimbers Oak Forest and Woodland
CES205.682
17 0 0% 0 0 0
2486 Texas Saline Coastal Prairie CES203.543
12 0 0% 0 0 0
The Crosstimbers Oak Forest and Woodland system was expertly labeled with 1 plot to West Gulf Coastal Plain Mesic Hardwood Forest, 1 plot to “can’t assign” and 15 plots to “other”. In the contigency table, “other” refers to other ecological system types that were not in the original sequence tables for the GeoArea, and hence the systems don’t show up in the contigency table. But the expert reviewer determined that the plot represented one of these peripheral ecological systems, and labeled the plot to it. This points to another source of error that might be easy to correct – biogeography and how the types are filtered and made available to the experts for review.
Expert Assignments
As described in the methods section above, the expert reviewers worked directly in the expert attribution database (EADB). Since GeoArea 1 had over 1,000 plots to review, a systematic, efficient process for reviewing and labeling plots was required. The forms provided in the EADB allowed the

Improvements #1 Auto-Key Results Summary Page 6
reviewer to sort and filter on subsets of plots to select groups of them with similar characteristics. For instance, the reviewer could select all plots found within a particular USFS Section or MapZone, then select all plots dominated by trees, then sort alphabetically by the dominant species. The reviewer could also select all treed plots, then select all plots with the same dominant tree species (such as Quercus alba), then sort by % cover of that species, from high to low. For example, in the Atlantic Coastal Plain in the southeast, distinct longleaf pine (Pinus palustris) dominated ecological systems occur. In this region the tree canopy can be dominated by longleaf pine with highly variable cover values (< 10% to > 75%). In these cases, the reviewer would need to use information about the canopy density, as well as subcanopy and understory composition to distinguish between the Atlantic Coastal Plain Upland Longleaf Pine Woodland (CES203.281), Central Atlantic Coastal Plain Wet Longleaf Pine Savanna and Flatwoods (CES203.265), and plots representing dense longleaf pine stands planted for timber management. Error! Reference source not found. shows the main form in the EADB which has these data fields. Additional fields were provided from which to select or sort plots, such as elevation, aspect, slope, and total cover by lifeform in the plot. Once the reviewer had selected a subset of plots for reviewing, the next step was to select an individual plot to review and label. If the expert was working on treed plots first, then they had a further option of selecting the set of ecological systems from which to pick a label for the plots. This was accomplished via a filter on the NLCD land cover class applied to all systems (such as forest and woodland, shrubland, herbaceous, woody wetlands, and so on). For each plot, the expert reviewed environmental and geographic setting, as well as the floristic and vegetation structural characteristics of the plot. In many cases the expert could then assign an ecological system label with no further information. However, in some cases the reviewer might consult the descriptions for a group of similar ecological systems to clarify their understanding of differences in concept, geographic distribution, floristics, or structural characteristics. For example, in the Atlantic Coastal Plain in the southeast, distinct longleaf pine (Pinus palustris) dominated ecological systems occur. In this region the tree canopy can be dominated by longleaf pine with highly variable over values (< 10% to > 75%) can be found. In these cases, the reviewer would need to use information about the canopy density, as well as subcanopy and understory composition to distinguish between the Atlantic Coastal Plain Upland Longleaf Pine Woodland (CES203.281), Central Atlantic Coastal Plain Wet Longleaf Pine Savanna and Flatwoods (CES203.265), and plots representing dense longleaf pine stands planted for timber management. In cases like this, the determination of which ecological system type to assign to the plot might require:
a) review of the image clip for the context of the plot, b) review of where the plot was located geographically (USFS Subsections provide local scale
geographic location), to distinguish between Atlantic Coastal Plain Fall-line Sandhills Longleaf Pine Woodland (CES203.254) and Florida Longleaf Pine Sandhill (CES203.284).
c) consideration of topographic setting (e.g. well drained dry uplands which could support scrub oaks vs. saturated flats suitable for wetland grasses),
d) consideration of any available height data for the plot (e.g. were the longleaf pines all tall, apparently mature trees; or were they short),
e) careful consideration of the full floristic composition of the plot and cover for each species. f) awareness of possible errors in the plot data, such as mis-identification of pine or oak species by
the field crews, unevenness in how the cover values were estimated in the field or converted

Improvements #1 Auto-Key Results Summary Page 7
into the LFRDB (e.g. cover for trees estimated by a person standing on the ground vs. an aerial view of the plot).
Below are some examples of comments relevant to the examples above. Atlantic Coastal Plain Fall-line Sandhills Longleaf Pine Woodland (CES203.254)
Pinus taeda dominated, but xeric oaks, and P. palustris present.
Pinus palustris as an indicator.
Pinus palustris not in data, but it is a turkey oak sandhill, part of the longleaf sandhill system. And the Atlantic Coastal Plain Upland Longleaf Pine Woodland (CES203.281)
May have dominance with Pinus taeda due to lack of fire.
Data are inadequate to make a high confidence assignment, and include some apparent errors (i.e. Persea borbonia and Quercus laurifolia)
There is 2% slope, so this would probably not be a flatwoods.
This is a poor example of CES203.281 Atlantic Coastal Plain Upland Longleaf Pine Woodland, which is dominated by Pinus taeda rather than Pinus palustris. It retains characteristic oaks of CES203.281.
The "Quercus laurifolia" in this sample is presumably Quercus hemisphaerica. Given all of the above, the reviewer had to make a decision for the plot, and assign an ecological system label. In cases where the assignment was not made with high confidence, the reviewer was requested to provide comments as to the factors they used to assign a label to the plot, or what the alternative assignment could be. Report Section 2.3 below discusses some of the results pertinent to confidence of assignment.
Improving the auto-key process
Of the 78 types assigned to plots by experts, 38 had fewer than 10 samples, so are excluded from this particular analysis. From the remaining 40 types, the numbers of samples labeled to a given type ranged from 123 (for West Gulf Coastal Plain Pine-Hardwood Forest) down to 10 (for Southern Atlantic Coastal Plain Wet Pine Savanna and Flatwoods). For 35 (87%) of these types, experts reported moderate confidence in their labels for at least 20% of the type’s plots. Six (6) types indicated low confidence for at least 20% of the type’s plots. These statistics are listed in the Results Workbook. A small sampling of expert comments related to moderate or low confidence plots are included in Table 6. Table 3. A selection of expert comments related to labeling sample plots for types where their confidence was reported as moderate or low
Type Name Expert Comment
Atlantic Coastal Plain Streamhead Seepage Swamp, Pocosin and Baygall
Pinus taeda and Acer rubrum by themselves do not have much indicator value
West Gulf Coastal Plain Small Stream and River Forest
Some obligate wetland plants in here, and some that can be upland or wetland
Atlantic Coastal Plain Blackwater Stream Floodplain Forest
This is a successional ruderal forest dominated by Liriodendron tulipifera, it may be CES203…
East Gulf Coastal Plain Small Stream and River Floodplain
Hard to tell if this is a large river, small stream, or what. Presence of Taxodium ascendens is questionable

Improvements #1 Auto-Key Results Summary Page 8
Forest when Betula nigra is codominant. Southern Coastal Plain Seepage Swamp and Baygall
Persea borbonia is listed, an apparent mistake, more likely in a wetland would be Persea palustris
These and other comments, point to several important aspects for consideration. First, some ecological systems concepts are better known and understood than others. Therefore, a certain degree of classification refinement is likely needed in order to improve auto-keys. Second, the inclusion of some limited landform, soil, and or landscape context information could assist with some determinations within the key, or by a subsequent expert reviewer. In some cases it was not possible to determine if a plot was in a wetland or upland, due to obvious plant misidentifications, no information about plot size, and no environmental or soils information. Similarly, repeated references to photos in the comments further indicates the need for expert review of many types where moderate-low confidence of experts suggest that auto-keys might be prone to error. Third, additional floristic information is cited in some cases where their suspected limitations provide the primary source of expert uncertainty in labeling. Many of the plots included in the expert review had only cursory information on the vegetation and diversity of plants. Other samples were labeled by auto-keys to aggregates of multiple ecological system types. This was because LANDFIRE had mapping objectives focused on uplands where fire regimes are prevalent. That meant that many individual wetland and sparsely-vegetated ecological system types were not treated within the auto-keys. Expert labeling of these samples, however, provides an indication of the feasibility of their inclusion in updated auto-keys. Of 211 samples, experts were able to assign 187 (89%) to an individual ecological system type; a total of 40 individual ecological system types were assigned to these samples. This result indicates the potential for inclusion of these types within subsequent mapping efforts. We cannot yet comment on the issues associated including these types within future regional auto-keys, but this appears to be an issue worthy of exploration. Another set of samples did not contain enough information for the auto-keys to assign a system or system aggregate, or were introduced types with no relevant system; these samples were labeled with broad "unclassified" types, such as "Unclassified Herbaceous" or "Introduced Upland Vegetation-Treed". Of 175 samples, experts were able to assign 121 (69%) to an individual ecological system type; a total of 41 individual ecological system types were assigned to these samples.
GeoArea 2E
GeoArea 2E encompasses 3 map zones (Error! Reference source not found.): the Northwestern Rocky Mountains (10), Northern Rocky Mountains (19), and Middle Rocky Mountains (21). These map zones were originally clustered for purposes of designing and implementing auto-keys. The total number of plots in this GeoArea analysis was 1,971. A total of 40 natural ecological system types were assigned to a total of 1,532 plots by the auto-keys. A total of 49 system types were assigned by experts (i.e., these included individual types that had been aggregated to broader classes by LANDFIRE for either sparsely vegetated types or wetland/riparian types). An additional 9 types were assigned by the auto-key but were not assigned by experts:
Columbia Basin Palouse Prairie
Columbia Plateau Scabland Shrubland
Great Basin Xeric Mixed Sagebrush Shrubland
Rocky Mountain Bigtooth Maple Ravine Woodland

Improvements #1 Auto-Key Results Summary Page 9
Inter-Mountain Basins Montane Riparian Systems
Inter-Mountain Basins Sparsely Vegetated Systems
Rocky Mountain Alpine/Montane Sparsely Vegetated Systems
Rocky Mountain Montane Riparian Systems
Rocky Mountain Subalpine/Upper Montane Riparian Systems
Five of these types are the aggregated types used by the LANDFIRE but the first four are Ecological Systems that could have been selected by the experts. The concepts and descriptions for these types may need to be revisited, with the likelihood of occurrence in the GeoArea reevaluated. If the type is still expected to occur additional guidance on how to apply the system relative to this GeoArea may need to be incorporated into the descriptions.
Comparison of Auto-key and Expert Assignments
Of the 40 natural types assigned labels by the auto-keys, 8 types (20%) had fewer than 10 samples available for this analysis (Table 4). These under sampled types tended to include types that are found on the periphery of their range within this GeoArea (e.g. Great Basin Xeric Mixed Sagebrush Shrubland, Rocky Mountain Subalpine-Montane Limber-Bristlecone Pine Woodland , Columbia Basin Foothill and Canyon Dry Grassland, and Rocky Mountain Bigtooth Maple Ravine Woodland), others are within this range but are relatively rare types (Rocky Mountain Alpine Fell-Field, Rocky Mountain Alpine Turf, Inter-Mountain Basins Greasewood Flat). The Columbia Basin Palouse Prairie was historically extensive but the vast majority of its historic range has been converted to agriculture and representative plots sites are very difficult to find. Table 4. Under-sampled types within GeoArea 2E.
EVTCode EVT Name System elcode
Total Plots
2153 Inter-Mountain Basins Greasewood Flat CES304.780 8
2143 Rocky Mountain Alpine Fell-Field CES306.811 6
2012 Rocky Mountain Bigtooth Maple Ravine Woodland CES306.814 6
2144 Rocky Mountain Alpine Turf CES306.816 5
2079 Great Basin Xeric Mixed Sagebrush Shrubland CES304.774 4
2134 Columbia Basin Foothill and Canyon Dry Grassland CES304.993 4
2142 Columbia Basin Palouse Prairie CES304.792 1
2057 Rocky Mountain Subalpine-Montane Limber-Bristlecone Pine Woodland
CES306.819 1
Of the 40 types, 6 had >80% agreement between expert and auto-key assignments. Table 5 provides a summary of adequately-sampled types where agreement between expert and auto-key ranged from just below 80% down to zero. These types total 26, or 72% of the total types assigned. Further analysis of those grouped within the 60-80% agreement range suggests subtleties within types that left the expert with greater or lesser confidence in their assignment.

Improvements #1 Auto-Key Results Summary Page 10
Table 5. Summary of types with adequate samples where agreement between auto-key and expert was below 80%.
Plots with Expert Matches
EVT Code EVT Name
System Elcode
Total Plots Total %
High conf
Med conf
Low conf
2106 Northern Rocky Mountain Montane-Foothill Deciduous Shrubland
CES306.994 50 39 78% 24 13 2
2124 Columbia Plateau Low Sagebrush Steppe
CES304.080 50 38 76% 33 4 1
2047 Northern Rocky Mountain Mesic Montane Mixed Conifer Forest
CES306.802 51 37 73% 30 7 0
2011 Rocky Mountain Aspen Forest and Woodland
CES306.813 50 35 70% 25 8 2
2080 Inter-Mountain Basins Big Sagebrush Shrubland
CES304.777 50 34 68% 16 18 0
2139 Northern Rocky Mountain Lower Montane-Foothill-Valley Grassland
CES306.040 50 28 56% 19 9 0
2168 Northern Rocky Mountain Avalanche Chute Shrubland
CES306.801 50 26 52% 9 16 1
2126 Inter-Mountain Basins Montane Sagebrush Steppe
CES304.785 50 24 48% 20 4 0
2045 Northern Rocky Mountain Dry-Mesic Montane Mixed Conifer Forest
CES306.805 50 21 42% 14 6 1
2169 Northern Rocky Mountain Subalpine Deciduous Shrubland
CES306.961 50 21 42% 10 10 1
2140 Northern Rocky Mountain Subalpine-Upper Montane Grassland
CES306.806 50 20 40% 17 3 0
2056 Rocky Mountain Subalpine Mesic-Wet Spruce-Fir Forest and Woodland
CES306.830 48 18 38% 10 8 0
2061 Inter-Mountain Basins Aspen-Mixed Conifer Forest and Woodland
CES304.776 50 18 36% 9 7 2
2125 Inter-Mountain Basins Big Sagebrush Steppe
CES304.778 55 16 29% 9 7 0
2145 Rocky Mountain Subalpine-Montane Mesic Meadow
CES306.829 98 27 28% 14 10 3
2115 Inter-Mountain Basins Juniper Savanna
CES304.782 11 3 27% 1 2 0
2046 Northern Rocky Mountain Subalpine Woodland and Parkland
CES306.807 50 11 22% 10 1 0

Improvements #1 Auto-Key Results Summary Page 11
Plots with Expert Matches
EVT Code EVT Name
System Elcode
Total Plots Total %
High conf
Med conf
Low conf
2049 Rocky Mountain Foothill Limber Pine-Juniper Woodland
CES306.955 50 11 22% 5 6 0
2127 Inter-Mountain Basins Semi-Desert Shrub-Steppe
CES304.788 50 7 14% 4 1 2
2161 Northern Rocky Mountain Conifer Swamp
CES306.803 50 7 14% 3 3 1
2166 Middle Rocky Mountain Montane Douglas-fir Forest and Woodland
CES306.959 50 7 14% 6 1 0
2165 Northern Rocky Mountain Foothill Conifer Wooded Steppe
CES306.958 50 0 0% 0 0 0
2167 Rocky Mountain Poor-Site Lodgepole Pine Forest
CES306.960 48 0 0% 0 0 0
2009 Northwestern Great Plains Aspen Forest and Parkland
CES303.681 36 0 0% 0 0 0
2123 Columbia Plateau Steppe and Grassland
CES304.083 19 0 0% 0 0 0
2065 Columbia Plateau Scabland Shrubland
CES304.770 14 0 0% 0 0 0
Analysis of the contingency table (in the Results Workbook for GA 2E) for these types with lesser levels of agreement reveals the many ongoing challenges with finding agreement between experts and auto-keys for complex vegetation types.Three types of disagreement between somewhat floristically similar types in the plot assignments became apparent through this analysis: where change occurs along an elevation gradient or along a moisture gradient and where types have different geographic ranges.
Confusion amongst systems determined along an elevation gradient reduced agreement - In the mountainous Northern Rocky Mountain GeoArea there are a number of Ecological Systems that grade into another somewhat similar, but higher, elevation system.
o Northern Rocky Mountain Lower Montane, Foothill and Valley Grassland and o Northern Rocky Mountain Subalpine-Upper Montane Grassland o Northern Rocky Mountain Montane-Foothill Deciduous Shrubland and o Northern Rocky Mountain Subalpine Deciduous Shrubland o Inter-Mountain Basins Big Sagebrush Steppe and o Inter-Mountain Basin Montane Sagebrush Steppe o Rocky Mountain Limber Pine-Juniper Woodland and o Rocky Mountain Subalpine Montane Limber-Bristlecone Pine Woodland
Confusion between some of these pairs of systems is very high and reduced the agreement between auto-key and expert assignments, for example including plots assigned to the Northern Rocky Mountain Subalpine-Upper Montane Grassland to the totals for the Northern Rocky Mountain Lower Montane Foothill and Valley Grassland increases agreement between the autokey and expert assignments from 56 to 88 percent. Some assignment overlap between these types is to be expected and is likely unavoidable due to their occurrence along an ecological gradient and the many species that they share.

Improvements #1 Auto-Key Results Summary Page 12
The descriptions for most of these types are already relatively detailed with extensive lists of characteristic understory species. The problem when classifying plots to these systems arises when a plot has some species that are characteristic of each system. In this case the expert weighs the coverage of each species and attempts to determine which of the two system descriptions the plot fits most closely. The addition of elevation variables to the sequence table process should help to improve classification of these types and the development of more nuanced rules determining which species presence (or prevalence) trumps the presence of other more generalist species would help provide more consistency in how these systems are assigned through either proccess.
While most of the systems where confusion along an elevation gradient are well described, distinctions between the Rocky Mountain Limber Pine Juniper Woodland and the Rocky Mountain Subalpine-Montane Limber-Bristlecone Pine Woodland are not as clear as they could be. Better description of the range of the Rocky Mountain Subalpine-Montane Limber-Bristlecone Pine Woodland outside the zone of occurrence of Bristlecone Pine would also be helpful. Experts assigned the Rocky Mountain Subalpine-Montane Limber-Bristlecone Pine Woodland to 14 plots in this GeoArea while the AutoKey only used it once. This may indicate some confusion on how common this system should be in the GeoArea.
Confusion amongst systems determined along a moisture gradient reduced agreement- Evaluation of the contingency table indicates that confusion between drier systems and a similar but more mesic system was also a factor in reducing agreement between the auto-key and expert assignments. Examples of these pairs of systems include
o Northern Rocky Mountain Mesic Montane Mixed Conifer Forest o Northern Rocky Mountain Dry-Mesic Montane Mixed Conifer Forest o Rocky Mountain Subalpine Dry-Mesic Spruce-Fir Forest and Woodland o Rocky Mountain Subalpine Mesic-Wet Spruce-Fir Forest and Woodlands o Northern Rocky Mountain Subalpine-Upper Montane Grassland o Rocky Mountain Subalpine-Montane Mesic Meadow
As with the elevation gradient systems, some assignment overlap between these types is to be expected. Again the development of clearer rules on how to handle plots that contain elements of both the drier and more mesic systems would also be helpful in increasing system assignment consistency for these types of systems. Additionally, guidance on the likely relative abundance of one system compared to the other in a pair would be helpful in making a call. For example the auto-key only slightly favored the assignment of the Rocky Mountain Subalpine Dry-Mesic Spruce-Fir Forest and Woodland to the Rocky Mountain Subalpine Mesic-Wet Spruce-Fir Forest and Woodlands (44–38 plots). However, the experts assigned the Rocky Mountain Subalpine Dry-Mesic Spruce-Fir Forest and Woodland much more frequently than the more mesic system (60-21 plots). At least from the point of view of one expert, this was done consciously with the understanding that in this GeoArea the Rocky Mountain Subalpine Dry-Mesic Spruce-Fir Forest and Woodland would be the more prevalent system.
Confusion amongst floristically similar systems with different ranges reduced agreement- Another type of disagreement between the auto-key and expert assignments appears to have arisen due to the application of different geographic ranges to determine the assignment of two somewhat floristically similar systems. Examples of this type of confusion included.
o Northwestern Great Plains Aspen Forest and Woodlands o Rocky Mountain Aspen Forest and Woodland o Middle Rocky Mountain Douglas-Fir Forest and Woodland

Improvements #1 Auto-Key Results Summary Page 13
o Northern Rocky Mountain Dry-Mesic Montane Mixed Conifer Forest o Intermountain Basins Juniper Savanna o Rocky Mountain Foothill Limber Pine-Juniper Woodland
One example of this type of confusion is that 23 of the 63 plots assigned to the Rocky Mountain Aspen Forest and Woodland by the experts were assigned to the Northwestern Great Plains Aspen and Forest and Parkland by the auto key and both of the plots assigned by the experts to the Northwestern Great Plains Aspen Forest and Woodland were assigned by the Auto key to the Rocky Mountain Aspen Forest and Woodland.
Another example is the Middle Rocky Mountain Montane Douglas-fir Forest and Woodland. This system was used much more extensively by the auto-key than by the experts (50-16), a difference that can be at least partially attributed to the different ranges applied in the two attribution processes. The Middle Rocky Mountain Montane Douglas-fir Forest and Woodland is a forest or woodland system dominated by Pseudotsuga menziesii that occurs outside of the range of true firs such as Abies concolor, Abies grandis, and Abies lasiocarpa. The auto-key process assigned plots across the GeoArea to this system if they were dominated by Pseudotsuga menziesii (or closely associated species) and did not contain fir (or closely associated species). This tended to work well for plots that contained sufficiently detailed lists of species but resulted in the inclusion of some Pseudotsuga menziesii dominated plots occurring within the true fir zone that did not include fir species in their species lists. The experts were able to use the FS sections to identify these plots occurring within the true fir zone systems and assign them to more suitable systems.
Better application of reviewed and established ranges documenting where each system occurs and the other does not would greatly reduce this type of disagreement. In areas where two similar systems both occur, the development of more detailed guidance on each systems occurrence and the use of elevation, soil and other non-floristic variable to make plot assignments would increase plot assignment accuracy.
Other points of interest in contingency table evaluation
Inter-Mountain Basins Big Sagebrush Shrubland and Intermountain Basins Big Sagebrush Steppe- There was considerable disagreement between expert and auto-key plots assigned to Inter-Mountain Basins Big Sagebrush Shrubland and Inter-Mountain Big Sagebrush Steppe. Developing greater clarification on how to distinguish these two systems should help to reduce this disagreement.
Rocky Mountain Poor-Site Lodgepole Pine and Rocky Mountain Lodgepole Pine Forest- Forty-seven of the 48 plots assigned to the Rocky Mountain Poor-Site Lodgepole Pine system by the auto-key were assigned to the more generic Rocky Mountain Lodgepole Pine Forest by the experts. The Rocky Mountain Poor-Site Lodgepole pine system occurs on very specific soil types and because soil information was not available the experts may not have felt comfortable making this distinction. Currently the Rocky Mountain Poor-Site Lodgepole system description focuses on where concentrations of this system can be expected to occur in Oregon, describing occurrences in this GeoArea 2E as patchy. More details on where concentrations of this system may occur in this GeoArea would aid in the assignment of plots to this system by either method.
Inter-Mountain Basins Aspen-Mixed Conifer Forest and Woodland- Only thirty-six percent of the auto-key plots assigned this system were assigned it by the experts, while 86% of the plots assigned to this system by the experts were also assigned by the auto-key. The majority of the extra plots assigned this system by the auto-key were assigned to a conifer forest type by the

Improvements #1 Auto-Key Results Summary Page 14
experts. This indicates that the experts were looking for a higher coverage of Populus tremuloides before assigning this system and/or a more restricted range than the auto-key used. This is an example of a system where the concept of it’s geographic range and composition may not be consistently applied by the auto-keys or experts, and requires review.
Northern Rocky Mountain Dry-Mesic Montane Mixed Conifer Forest – The experts assigned plots to this system much more often than the auto-key (132-46). Some of this difference can be explained by the previously discussed differences in the application of the Middle Rocky Mountain Montane Douglas-fir Forest and Woodland but much of it cannot. Expert confidence in assigning this system was generally high with 83% high 15% moderate and 2% low. Because this is a widespread system in this GeoArea further analysis of the discrepancy may be warranted before another classification effort is initiated.
Expert Assignments
As described in the methods section above, the expert reviewers worked directly in the expert attribution database (EADB). Since GeoArea 2E had nearly 2,000 plots to review, a systematic, efficient process for reviewing and labeling plots was required. The forms provided in the EADB allowed the reviewer to sort and filter on subsets of plots to select groups of them with similar characteristics. For instance, the reviewer could select all plots found within a particular USFS Section or MapZone, then select all plots dominated by trees, then sort alphabetically by the dominant species. The reviewer could also select all treed plots, then select all plots with the same dominant tree species (such as Picea engelmannii;), then sort by % cover of that species, from high to low. Error! Reference source not found. shows the main form in the EADB which has these data fields. Additional fields were provided from which to select or sort plots, such as elevation, aspect, slope, and total cover by lifeform in the plot. Once the reviewer had selected a subset of plots for reviewing, the next step was to select an individual plot to review and label. If the expert was working on treed plots first, then they had a further option of selecting the set of ecological systems from which to pick a label for the plots. This was accomplished via a filter on the NLCD land cover class applied to all systems (such as forest and woodland, shrubland, herbaceous, woody wetlands, and so on). For each plot, the expert reviewed environmental and geographic setting, as well as the floristic and vegetation structural characteristics of the plot. In many cases the expert could then assign an ecological system label with no further information. However, in some cases the reviewer might consult the descriptions for a group of similar ecological systems to clarify their understanding of differences in concept, geographic distribution, floristics, or structural characteristics. As an example, in GeoArea 2E spruce and fir species may occur in a large variety of ecological systems including Rocky Mountain Subalpine Dry-Mesic Spruce-Fir Forest and Woodland, Rocky Mountain Subalpine Mesic-Wet Spruce-Fir Forest and Woodland, Northern Rocky Mountain Dry-Mesic Montane Mixed Conifer Forest, Northern Rocky Mountain Mesic Montane Mixed Conifer Forest, Northern Rocky Mountain Subalpine Woodland and Parkland, Rocky Mountain Lodgepole Pine Forest, Northern Rocky Mountain Conifer Swamp, and Rocky Mountain Subalpine-Montane Riparian Woodland. The experts must select the best of these choices using information on a sites elevation, slope, species dominance, tree canopy cover, presence of other tree species, mesic or xeric understory species, photographs, hydrology and soil and geologic information if available In cases like this, the determination of which system type to assign to the plot might require:

Improvements #1 Auto-Key Results Summary Page 15
review of the image clip for the context of the plot,
review of where the plot was located geographically (USFS Subsections provide local scale geographic location), to distinguish Columbia Plateau from Northern Rocky Mountain systems for example..
consideration of topographic setting (e.g. north-facing slopes at lower elevations could support ponderosa pine woodlands),
consideration of any available height data for the plot (e.g. were the ponderosa pines all tall, apparently mature trees; or were they short),
careful consideration of the full floristic composition of the plot and cover for each species.
awareness of possible errors in the plot data, such as mis-identification of juniper species by the field crews, unevenness in how the cover values were estimated in the field or converted into the LFRDB (e.g. cover for trees estimated by a person standing on the ground vs an aerial view of the plot).
Given all of the above, the reviewer had to make a decision for the plot, and assign an ecological system label. In cases where the assignment was not made with high confidence, the reviewer was requested to provide comments as to the factors they used to assign a label to the plot, or what the alternative assignment could be. Report Section 2.3 below discusses some of the results pertinent to confidence of assignment.
Improving the auto-key process
Of the 49 types assigned to plots by experts, 13 had fewer than 10 samples, so are excluded from this particular analysis. From the remaining 36 types, the numbers of samples labeled to a given type ranged from 132 (Northern Rocky Mountain Dry-Mesic Montane Mixed Conifer Forest) down to 12 (Northern Rocky Mountain Conifer Swamp). For 41 (87%) of these types, experts reported moderate confidence in their labels for at least 20% of the type’s plots. 2 types indicated low confidence for at least 20% of the type’s plots. These statistics are listed in the Appendix. A small sampling of expert comments related to moderate or low confidence plots are included in Table 6. Table 6. A selection of expert comments related to labeling sample plots for types where their confidence was reported as moderate or low.
Type Name Expert Comment
Rocky Mountain Cliff, Canyon and Massive Bedrock
Steep borderline sparsely vegetated site with 14% total vegetation cover, with nothing dominant
Northern Rocky Mountain Montane-Foothill Deciduous Shrubland
Plot is sparsely vegetated for this system
Northern Rocky Mountain Lower Montane, Foothill and Valley Grassland
Very limited species information reduced confidence
Rocky Mountain Subalpine Mesic-Wet Spruce-Fir Forest and Woodland
Hydrology information is not provided, if plot is riparian then assignment should be CES306.833
Northern Rocky Mountain Avalanche Chute Shrubland
Cannot tell snowpack conditions from information given
These and other comments point to several important aspects for consideration. First, some ecological systems concepts are better known and understood than others. Therefore, a certain degree of

Improvements #1 Auto-Key Results Summary Page 16
classification refinement is likely needed in order to improve auto-keys. Second, the inclusion of some limited landform, soil, and or landscape context information could assist with some determinations within the key, or by a subsequent expert reviewer. Similarly, repeated references to photos further indicates the need for expert review of many types where moderate-low confidence of experts suggest that auto-keys might be prone to error. Third, additional floristic information is cited in some cases where their suspected limitations provide the primary source of expert uncertainty in labeling. Other samples were those labeled by auto-keys to aggregates of multiple ecological system types. This was because LANDFIRE had mapping objectives focused on uplands where fire regimes are prevalent. That meant that many individual wetland and sparsely-vegetated ecological system types were not treated within the auto-keys. Expert labeling of these samples, however, provides an indication of the feasibility of their inclusion in updated auto-keys. Of 219 samples, experts were able to assign 181 (83%) to an individual ecological system type; a total of 31 individual ecological system types were assigned to these samples. This result indicates the potential for inclusion of these types within subsequent mapping efforts. We cannot yet comment on the issues associated including these types within future regional auto-keys, but this appears to be an issue worthy of exploration. Another class of samples did not contain enough information for the auto-keys to assign a system or system aggregate; these samples were labeled with broad "unclassified" types, such as "Unclassified Grassland" or "None". Of 220 samples, experts were able to assign 172 (78%) to an individual ecological system type; a total of 31 individual ecological system types were assigned to these samples.
GeoArea 2W
GeoArea 2W encompasses 7 map zones (Error! Reference source not found.): Northern Cascades (1), Oregon Coastal Range (2), Cascade Mountain Range (7), Grande Coulee Basin of the Columbia Plateau (8), Blue Mountain Region (9), Snake River Plain (18), and Wyoming Basin (22). These map zones were originally clustered for purposes of designing and implementing auto-keys. The total number of plots in this Geo Area analysis was 3,827. A total of 105 natural ecological system types were assigned to a total of 3,551 plots by the auto-keys. A total of 121 system types were assigned by experts (i.e., these included individual types that had been aggregated to broader classes by LANDFIRE for either sparsely vegetated types or wetland/riparian types). Seventeen types were assigned by the auto-key but were not assigned by experts:
Mediterranean California Mesic Serpentine Woodland and Chaparral
Mediterranean California Subalpine Meadow
Middle Rocky Mountain Montane Douglas-fir Forest and Woodland
Southern Rocky Mountain Mesic Montane Mixed Conifer Forest and Woodland
Western Great Plains Shortgrass Prairie
Inter-Mountain Basins Montane Riparian Systems
Inter-Mountain Basins Sparsely Vegetated Systems
Mediterranean California Sparsely Vegetated Systems
North Pacific Sparsely Vegetated Systems
North Pacific Swamp Systems
Pacific Coastal Dunes and Other Sparsely Vegetated Systems
Pacific Coastal Marsh Systems
Rocky Mountain Alpine/Montane Sparsely Vegetated Systems

Improvements #1 Auto-Key Results Summary Page 17
Rocky Mountain Montane Riparian Systems
Rocky Mountain Subalpine/Upper Montane Riparian Systems
Western Great Plains Floodplain Systems
Western Great Plains Sparsely Vegetated Systems
Twelve of these types are the aggregated types used by the LANDFIRE but the first five are Ecological Systems that could have been selected by the experts. The concepts and descriptions for these types may need to be revisited, with the likelihood of occurrence in the GeoArea reevaluated. All 5 of them are peripheral to the map zones in this GeoArea. If the type is still expected to occur additional guidance on how to apply the system relative to this GeoArea may need to be incorporated into the descriptions.
Comparison of Auto-key and Expert Assignments
Of the 93 natural types assigned labels by the auto-keys, 15 types (16%) had fewer than 10 samples available for this analysis (Table 4). These under sampled types tended to include types that are found on the periphery of their range within this GeoArea (e.g. Great Basin Semi-Desert Chaparral, Southern Rocky Mountain Mesic Montane Mixed Conifer Forest and Woodland, Mediterranean California Subalpine Meadow and Western Great Plains Shortgrass Prairie), others are within this range but are relatively rare types (Rocky Mountain Alpine Fell-Field, and Rocky Mountain Alpine Turf). Some such as the North Pacific Montane Grassland and Northern Rocky Mountain Western Larch Savanna are types that may not be well understood or are obsolete. These concepts may need to be revisited and removed or refined. Table 7. Under-sampled types within GeoArea 2W.
EVTCode EVT Name System elcode
Total Plots
2103 Great Basin Semi-Desert Chaparral CES304.001 7 2086 Rocky Mountain Lower Montane-Foothill
Shrubland CES306.822 7
2138 North Pacific Montane Grassland CES204.100 6
2144 Rocky Mountain Alpine Turf CES306.816 7
2052 Southern Rocky Mountain Mesic Montane Mixed Conifer Forest and Woodland
CES306.825 6
2137 Mediterranean California Subalpine Meadow CES206.940 5
2143 Rocky Mountain Alpine Fell-Field CES306.811 5 2012 Rocky Mountain Bigtooth Maple Ravine Woodland CES306.814 5
2149 Western Great Plains Shortgrass Prairie CES303.672 3
2062 Inter-Mountain Basins Curl-leaf Mountain-mahogany Woodland and Shrubland
CES304.772 4
2107 Rocky Mountain Gambel Oak-Mixed Montane Shrubland
CES306.818 2
2034 Mediterranean California Mesic Serpentine Woodland and Chaparral
CES206.928 1
2114 California Lower Montane Blue Oak-Foothill Pine Woodland and Savanna
CES206.936 1

Improvements #1 Auto-Key Results Summary Page 18
2054 Southern Rocky Mountain Ponderosa Pine Woodland
CES306.648 1
2010 Northern Rocky Mountain Western Larch Savanna CES306.837 1 Of the 76 adequately-sampled types, 17 had >80% agreement between expert and auto-key assignments. Table 5 provides a summary of adequately-sampled types where agreement between expert and auto-key ranged from just below 80% down to zero. These types total 59, or 71% of the total types assigned. Further analysis of those grouped within the 60-80% agreement range suggests subtleties within types that left the expert with greater or lesser confidence in their assignment. Fourteen of the types in Table 3 had 40% or more of the expert assigned plots assigned with moderate or low confidence; the names of these types are bolded within the table. There are a wide variety of reasons for expert unease with their assignments but some patterns may warrant further exploration. Rocky Mountain Foothill Limber Pine-Juniper Woodland was often confused with the Colorado Plateau Pinyon-Juniper Woodland, which reduced expert confidence. Additional clarification on how to distinguish these two systems may be necessary. North Pacific Montane Shrubland showed uncertainty on whether to assign plots to this shrub system or a forested type because the plot was in harvested area. Greater clarification on how to handle these disturbed areas may be helpful in increasing certainty when assigning these types of plots. The Inter-Mountain Basins Aspen-Mixed Conifer Forest and Woodland ecosystem had moderate and low confidence due to uncertainty on whether to place the plot in an Aspen-Mixed conifer system or into the aspen component of a conifer dominated system. Low and moderate plot confidence associated with the Inter-Mountain Basins Semi-Desert Shrub-Steppe indicated some confusion on whether to use this system or other sagebrush systems, especially when a high degree of exotic species were present, further reducing expert confidence in assigning plots to this system. Comments associated with the Sierran-Intermontane Desert Western White Pine-White Fir Woodland indicate some uncertainty on whether to assign this system or Mediterranean California Dry-Mesic Mixed Conifer Forest and Woodland or the California Montane Jeffrey Pine-(Ponderosa Pine) Woodland. Comments related to the Columbia Plateau Steppe and Grassland plots indicated that experts had difficulty selecting between this system and the similar to Columbia Basin Foothill and Canyon Dry Grassland. Often the systems which exhibited lower expert confidence in assigning plots also exhibited lower agreement with the auto-key assigned plots. Table 8. Summary of types with adequate samples where agreement between auto-key and expert was below 80%.
Plots with Expert Matches
EVT Code EVT Name
System Elcode
Total Plots Total %
High conf
Med conf
Low conf
2053 Northern Rocky Mountain Ponderosa Pine Woodland
CES306.030 19 15 79% 15 0 0
2018 East Cascades Mesic Montane Mixed-Conifer Forest and Woodland
CES204.086 50 38 76% 34 4 0
2081 Inter-Mountain Basins Mixed Salt Desert Scrub
CES304.784 50 38 76% 31 6 1
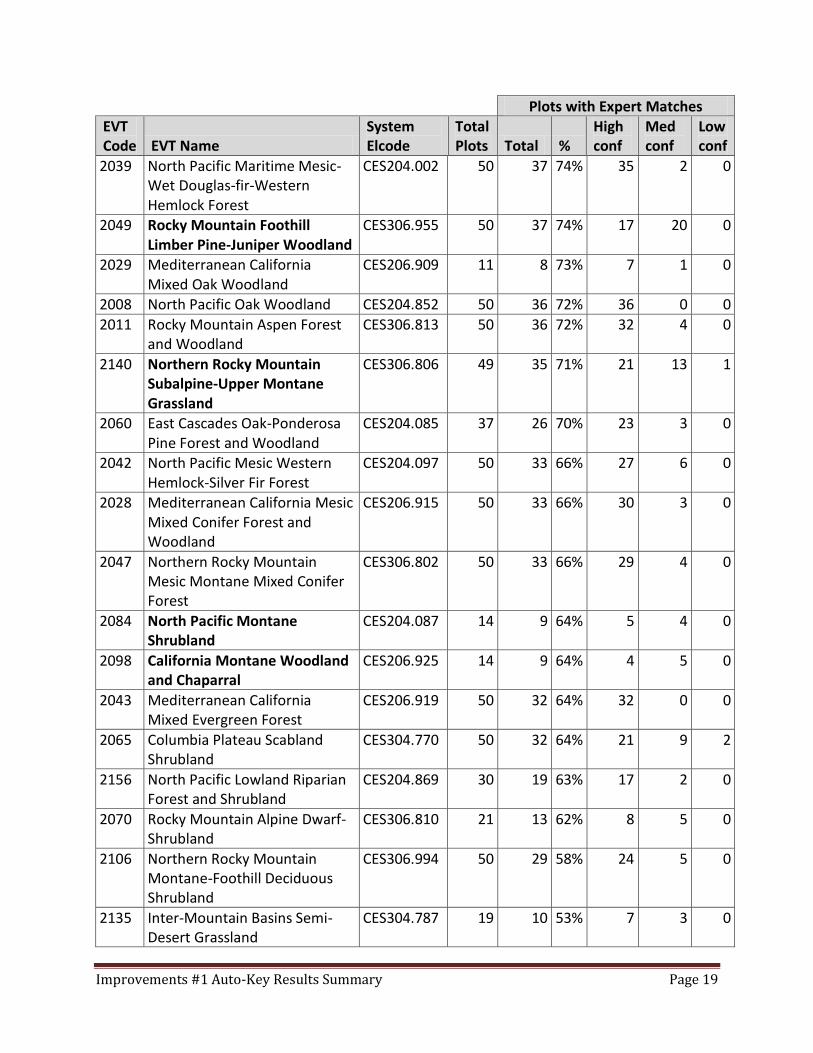
Improvements #1 Auto-Key Results Summary Page 19
Plots with Expert Matches EVT Code EVT Name
System Elcode
Total Plots Total %
High conf
Med conf
Low conf
2039 North Pacific Maritime Mesic-Wet Douglas-fir-Western Hemlock Forest
CES204.002 50 37 74% 35 2 0
2049 Rocky Mountain Foothill Limber Pine-Juniper Woodland
CES306.955 50 37 74% 17 20 0
2029 Mediterranean California Mixed Oak Woodland
CES206.909 11 8 73% 7 1 0
2008 North Pacific Oak Woodland CES204.852 50 36 72% 36 0 0
2011 Rocky Mountain Aspen Forest and Woodland
CES306.813 50 36 72% 32 4 0
2140 Northern Rocky Mountain Subalpine-Upper Montane Grassland
CES306.806 49 35 71% 21 13 1
2060 East Cascades Oak-Ponderosa Pine Forest and Woodland
CES204.085 37 26 70% 23 3 0
2042 North Pacific Mesic Western Hemlock-Silver Fir Forest
CES204.097 50 33 66% 27 6 0
2028 Mediterranean California Mesic Mixed Conifer Forest and Woodland
CES206.915 50 33 66% 30 3 0
2047 Northern Rocky Mountain Mesic Montane Mixed Conifer Forest
CES306.802 50 33 66% 29 4 0
2084 North Pacific Montane Shrubland
CES204.087 14 9 64% 5 4 0
2098 California Montane Woodland and Chaparral
CES206.925 14 9 64% 4 5 0
2043 Mediterranean California Mixed Evergreen Forest
CES206.919 50 32 64% 32 0 0
2065 Columbia Plateau Scabland Shrubland
CES304.770 50 32 64% 21 9 2
2156 North Pacific Lowland Riparian Forest and Shrubland
CES204.869 30 19 63% 17 2 0
2070 Rocky Mountain Alpine Dwarf-Shrubland
CES306.810 21 13 62% 8 5 0
2106 Northern Rocky Mountain Montane-Foothill Deciduous Shrubland
CES306.994 50 29 58% 24 5 0
2135 Inter-Mountain Basins Semi-Desert Grassland
CES304.787 19 10 53% 7 3 0

Improvements #1 Auto-Key Results Summary Page 20
Plots with Expert Matches EVT Code EVT Name
System Elcode
Total Plots Total %
High conf
Med conf
Low conf
2038 North Pacific Maritime Mesic Subalpine Parkland
CES204.837 50 26 52% 20 6 0
2027 Mediterranean California Dry-Mesic Mixed Conifer Forest and Woodland
CES206.916 50 26 52% 24 2 0
2079 Great Basin Xeric Mixed Sagebrush Shrubland
CES304.774 50 26 52% 7 15 4
2045 Northern Rocky Mountain Dry-Mesic Montane Mixed Conifer Forest
CES306.805 50 25 50% 25 0 0
2139 Northern Rocky Mountain Lower Montane-Foothill-Valley Grassland
CES306.040 50 24 48% 20 4 0
2037 North Pacific Maritime Dry-Mesic Douglas-fir-Western Hemlock Forest
CES204.001 50 23 46% 22 1 0
2171 North Pacific Alpine and Subalpine Dry Grassland
CES204.099 50 23 46% 21 2 0
2178 North Pacific Hypermaritime Western Red-cedar-Western Hemlock Forest
CES204.842 50 23 46% 20 3 0
2061 Inter-Mountain Basins Aspen-Mixed Conifer Forest and Woodland
CES304.776 50 23 46% 13 9 1
2063 North Pacific Broadleaf Landslide Forest and Shrubland
CES204.846 50 21 42% 16 5 0
2055 Rocky Mountain Subalpine Dry-Mesic Spruce-Fir Forest and Woodland
CES306.828 50 20 40% 16 3 1
2127 Inter-Mountain Basins Semi-Desert Shrub-Steppe
CES304.788 50 19 38% 11 7 1
2115 Inter-Mountain Basins Juniper Savanna
CES304.782 16 6 38% 2 4 0
2056 Rocky Mountain Subalpine Wet-Mesic Spruce-Fir Forest and Woodland
CES306.830 11 4 36% 4 0 0
2172 Sierran-Intermontane Desert Western White Pine-White Fir Woodland
CES204.101 50 18 36% 3 15 0

Improvements #1 Auto-Key Results Summary Page 21
Plots with Expert Matches EVT Code EVT Name
System Elcode
Total Plots Total %
High conf
Med conf
Low conf
2056 Rocky Mountain Subalpine Mesic-Wet Spruce-Fir Forest and Woodland
CES306.830 39 14 36% 13 1 0
2030 Mediterranean California Lower Montane Black Oak-Conifer Forest and Woodland
CES206.923 50 17 34% 15 2 0
2174 North Pacific Dry-Mesic Silver Fir-Western Hemlock-Douglas-fir Forest
CES204.098 50 16 32% 14 2 0
2126 Inter-Mountain Basins Montane Sagebrush Steppe
CES304.785 50 16 32% 11 4 1
2145 Rocky Mountain Subalpine-Montane Mesic Meadow
CES306.829 50 16 32% 10 5 1
2169 Northern Rocky Mountain Subalpine Deciduous Shrubland
CES306.961 50 14 28% 11 2 1
2031 California Montane Jeffrey Pine(-Ponderosa Pine) Woodland
CES206.918 20 5 25% 5 0 0
2125 Inter-Mountain Basins Big Sagebrush Steppe
CES304.778 49 11 22% 8 2 1
2123 Columbia Plateau Steppe and Grassland
CES304.083 50 8 16% 2 4 2
2161 Northern Rocky Mountain Conifer Swamp
CES306.803 13 2 15% 0 2 0
2158 North Pacific Montane Riparian Woodland and Shrubland
CES204.866 50 7 14% 6 1 0
2053 Northern Rocky Mountain Ponderosa Pine Woodland and Savanna
CES306.030 31 4 13% 4 0 0
2035 North Pacific Dry Douglas-fir (-Madrone) Forest and Woodland
CES204.845 50 5 10% 5 0 0
2033 Mediterranean California Subalpine Woodland
CES206.910 12 1 8% 0 1 0
2142 Columbia Basin Palouse Prairie CES304.792 50 4 8% 0 2 2
2165 Northern Rocky Mountain Foothill Conifer Wooded Steppe
CES306.958 50 4 8% 1 2 1
2083 North Pacific Avalanche Chute Shrubland
CES204.854 50 0 0% 0 0 0

Improvements #1 Auto-Key Results Summary Page 22
Plots with Expert Matches EVT Code EVT Name
System Elcode
Total Plots Total %
High conf
Med conf
Low conf
2173 North Pacific Wooded Volcanic Flowage
CES204.883 50 0 0% 0 0 0
2044 Northern California Mesic Subalpine Woodland
CES206.911 50 0 0% 0 0 0
2167 Rocky Mountain Poor-Site Lodgepole Pine Forest
CES306.960 50 0 0% 0 0 0
2021 Klamath-Siskiyou Lower Montane Serpentine Mixed Conifer Woodland
CES206.917 41 0 0% 0 0 0
2022 Klamath-Siskiyou Upper Montane Serpentine Mixed Conifer Woodland
CES206.914 31 0 0% 0 0 0
2166 Middle Rocky Mountain Montane Douglas-fir Forest and Woodland
CES306.959 25 0 0% 0 0 0
Systems with lower expert confidence that also exhibited lower agreement with the auto-key assignments were evaluated through a contingency table (in the Results Workbook for GA 2W). Three types of disagreement between somewhat floristically similar types in the plot assignments became apparent through this analysis: where change occurs along an elevation gradient or along a moisture gradient and where types have different geographic ranges.
Confusion amongst systems determined along an elevation gradient reduced agreement - In this mountainous GeoArea there are a number of Ecological Systems that grade into other somewhat similar systems, but ones that occur at different elevations.
o Northern Rocky Mountain Lower Montane, Foothill and Valley Grassland and Northern Rocky Mountain Subalpine-Upper Montane Grassland
o Northern Rocky Mountain Montane-Foothill Deciduous Shrubland and Northern Rocky Mountain Subalpine Deciduous Shrubland
o Inter-Mountain Basins Big Sagebrush Steppe and Inter-Mountain Basin Montane Sagebrush Steppe
o North Pacific Maritime Mesic Subalpine Parkland North Pacific Mountain Hemlock Forest
Confusion between some of these pairs of systems is very high and reduced the agreement between auto-key and expert assignments, for example including plots assigned to the Northern Rocky Mountain Subalpine-Upper Montane Grassland to the totals for the Northern Rocky Mountain Lower Montane Foothill and Valley Grassland increases agreement between the autokey and expert assignments from 49-63 percent. Some assignment overlap between these types is to be expected and is likely unavoidable due to their occurrence along an ecological gradient and the many species that they share.
The descriptions for most of these types are already relatively detailed with extensive lists of characteristic understory species. The problem when classifying plots to these systems arises when a

Improvements #1 Auto-Key Results Summary Page 23
plot has some species that are characteristic of each system. In this case the expert weighs the coverage of each species and attempts to determine which of the two system descriptions the plot fits most closely. The addition of elevation information to the sequence table process should help to improve classification of these types and the development of more nuanced rules determining which species presence (or prevalence) trumps the presence of other more generalist species would help provide more consistency in how these systems are assigned through either process.
Confusion amongst systems determined along a moisture gradient-- Evaluation of the
contingency table indicates that confusion between drier systems and a similar but more mesic system was also a factor in reducing agreement between the auto-key and expert assignments. Example of these type of systems include:
1. Northern Rocky Mountain Mesic Montane Mixed Conifer Forest Northern Rocky Mountain Dry-Mesic Montane Mixed Conifer Forest
2. Rocky Mountain Subalpine Dry-Mesic Spruce-Fir Forest and Woodland Rocky Mountain Subalpine Mesic-Wet Spruce-Fir Forest and Woodlands
3. Northern Rocky Mountain Subalpine-Upper Montane Grassland Rocky Mountain Subalpine-Montane Mesic Meadow
4. North Pacific Maritime Dry-Mesic Douglas-fir-Western Hemlock Forest North Pacific Maritime Mesic-Wet Douglas-fir-Western Hemlock Forest
5. North Pacific Mesic Western Hemlock-Silver Fir Forest North Pacific Dry-Mesic Silver Fir-Western Hemlock-Douglas-fir Forest
As with the elevation gradient systems, some assignment overlap between these types is to be expected. Development of clearer rules on how to handle plots contained elements of both the drier and more mesic systems would also be helpful in increasing system assignment consistency.
Confusion amongst floristically similar systems with different ranges - Another type of disagreement between the auto-key and expert assignments appears to have arisen due to the application of different geographic ranges to determine the assignment of two somewhat floristically similar systems. Examples of this type of confusion included:
o Northern Rocky Mountain Ponderosa Pine Woodland and Savanna California Montane Jeffery Pine- (Ponderosa Pine) Woodland Northern Rocky Mountain Foothill Conifer Wooded Steppe
o Intermountain Basins Juniper Savanna Great Basin Pinyon-Juniper Woodland Rocky Mountain Foothill Limber Pine Juniper Woodland
o North Pacific Hypermaritime Western Red-cedar-Western Hemlock Forest North Pacific Mesic Western Hemlock-Silver Fir Forest
One example of this type of confusion is that 22 of the 57 plots assigned to the California Montane Jeffrey Pine-(Ponderosa Pine) Woodland by the experts were assigned to the Northern Rocky Mountain Ponderosa Pine Woodland and Savanna by the auto key. Similarly 10 of the same 57 plots assigned to the California Montane Jeffrey Pine-(Ponderosa Pine) Woodland by the experts were assigned to the Northern Rocky Mountain Foothill Conifer Wooded Steppe by the auto key. Better application of reviewed and established ranges documenting where each system occurs and the other does not would greatly reduce this type of disagreement. In areas where two similar systems both occur, the development of more detailed guidance on each systems occurrence and the use of

Improvements #1 Auto-Key Results Summary Page 24
elevation, soil and other non-floristic variables to make plot assignments would increase plot assignment accuracy.
Other points of interest in contingency table evaluation o Inter-Mountain Basins Big Sagebrush Shrubland and Intermountain Basins Big
Sagebrush Steppe- There was considerable disagreement between expert and auto-key plots assigned to Inter-Mountain Basins Big Sagebrush Shrubland and Inter-Mountain Big Sagebrush Steppe. Twenty of the 94 plot assigned to the Inter-Mountain Basins Big Sagebrush Shrubland by the experts were assigned to the Inter-Mountain Basins Big Sagebrush Steppe by the auto-key. Confusion in the other direction also occurred but was not as substantial-- 5 of the 46 plots the experts assigned to the Inter-Mountain Basins Big Sagebrush Steppe were assigned to the Inter-Mountain Basins Big Sagebrush Shrubland by the auto-key. Developing greater clarification on how to distinguish these two systems should help to reduce this disagreement.
o Inter-Mountain Basins Aspen-Mixed Conifer Forest and Woodland- Only forty-seven percent of the auto-key plots assigned this system were assigned it by the experts, while 100% of the plots assigned to this system by the experts were also assigned by the auto-key. The majority of the extra plots assigned this system by the auto-key were assigned to a conifer forest type by the experts. This indicates that the experts were looking for a higher coverage of Populus tremuloides before assigning this system and/or a more restricted range than the auto-key used. This is an example of a system where the concept of it’s geographic range and composition may not be consistently applied by the auto-keys or experts, and requires review.
o Substantial confusion occurred amongst Columbia Plateau grassland types. The Columbia Plateau Steppe and Grassland will be used as an example as it exhibited the most extensive confusion. The experts and the auto-key both assigned a similar number of plots to this system (52 and 50) but had less than 16% agreement between these assignments. Fourteen of the plots assigned by the experts to this system were assigned by the auto-key to the Columbia Basin Palouse Prairie, with the Inter-Mountain Basin Semi-Desert Shrub-Steppe being the next highest source of disagreement. Twelve of the plots assigned to this system by the auto-key were assigned to the Northern Rocky Mountain Lower Montane Foothill and Valley Grassland and 10 were assigned to the Columbia Basin Foothill and Canyon Dry Grassland. Lower in elevation but similar types of disagreement among the low elevation grassland types in the central portion of this GeoArea indicates a need for better clarification of differences in these types. Some expert comments indicate that the addition of soil and slope information to the assignment process would help to clarify these types.
o The North Pacific Dry and Mesic Alpine Dwarf-Shrubland, Fell-Field and Meadow system was easily confused with the North Pacific Alpine and Subalpine Dry Grassland system. They are floristically similar, and occur adjacent to each other often in an inter-digitated fashion. More nuanced floristic and local environmental information would help clarify the differences between these two ecosystems.
o The North Pacific Broadleaf Landslide Forest and Shrubland was easily confused with the North Pacific Maritime Mesic-Wet Douglas-fir-Western Hemlock Forest. These systems occur within the same geography and elevation and have differences in the abundance of certain key species, indicating recent disturbance. Detailed information that was available to the experts in aerial photographs (proximity to human

Improvements #1 Auto-Key Results Summary Page 25
development) and the percent slope were important additional variables that need to be incorporated into the auto-key.
o Mediterranean California Mixed Evergreen Forest was often miss-labled by the auto key as Mediterranean California Lower Montane Black Oak-Conifer Forest and Woodland, North Pacific Dry Douglas-fir-(Madrone) Forest and Woodland, Mediterranean California Mesic Mixed Conifer Forest and Woodland, or the Mediterranean California Dry-Mesic Mixed Conifer Forest and Woodland. More detailed information on geographic location and species composition is necessary to differentiate between these systems, as they share many of the same floristic details.
o The confirmation of soil information (especially the presence of serpentine soils) would greatly aid in the correct identification of these systems Klamath-Siskiyou Lower Montane Serpentine Mixed Conifer Woodland and Klamath-Siskiyou Upper Montane Serpentine Mixed Conifer Woodland from their surrounding and often similar floristic forests.
Expert Assignments
As described in the methods section above, the expert reviewers worked directly in the expert attribution database (EADB). Since GeoArea 2W had nearly 4,000 plots to review, a systematic, efficient process for reviewing and labeling plots was required. The forms provided in the EADB allowed the reviewer to sort and filter on subsets of plots to select groups of them with similar characteristics. For instance, the reviewer could select all plots found within a particular USFS Section or MapZone, then select all plots dominated by trees, then sort alphabetically by the dominant species. The reviewer could also select all treed plots, then select all plots with the same dominant tree species (such as Picea engelmannii;), then sort by % cover of that species, from high to low. Error! Reference source not found. shows the main form in the EADB which has these data fields. Additional fields were provided from which to select or sort plots, such as elevation, aspect, slope, and total cover by lifeform in the plot. Once the reviewer had selected a subset of plots for reviewing, the next step was to select an individual plot to review and label. If the expert was working on treed plots first, then they had a further option of selecting the set of ecological systems from which to pick a label for the plots. This was accomplished via a filter on the NLCD land cover class applied to all systems (such as forest and woodland, shrubland, herbaceous, woody wetlands, and so on). For each plot, the expert reviewed environmental and geographic setting, as well as the floristic and vegetation structural characteristics of the plot. In many cases the expert could then assign an ecological system label with no further information. However, in some cases the reviewer might consult the descriptions for a group of similar ecological systems to clarify their understanding of differences in concept, geographic distribution, floristics, or structural characteristics. As an example, in GeoArea 2W Engelmann spruce may occur in a large variety of ecological systems including Rocky Mountain Subalpine Dry-Mesic Spruce-Fir Forest and Woodland, Rocky Mountain Subalpine Mesic-Wet Spruce-Fir Forest and Woodland, Northern Rocky Mountain Dry-Mesic Montane Mixed Conifer Forest, Northern Rocky Mountain Mesic Montane Mixed Conifer Forest, Northern Rocky Mountain Subalpine Woodland and Parkland, Rocky Mountain Lodgepole Pine Forest, Northern Rocky Mountain Conifer Swamp, and Rocky Mountain Subalpine-Montane Riparian Woodland. For a plot containing a high coverage of Engelmann spruce the experts must select the best of these choices using information on a site’s elevation, slope, species dominance, tree canopy cover, presence of other tree

Improvements #1 Auto-Key Results Summary Page 26
species, mesic or xeric understory species, photographs, hydrology and soil and geologic information if available. In cases like this, the determination of which system type to assign to the plot might require:
g) review of the image clip for the context of the plot, h) review of where the plot was located geographically (USFS Subsections provide local scale
geographic location), to distinguish Columbia Plateau from Northern Rocky Mountain systems for example..
i) consideration of topographic setting (e.g. north-facing slopes at lower elevations could support ponderosa pine woodlands),
j) consideration of any available height data for the plot (e.g. were the ponderosa pines all tall, apparently mature trees; or were they short),
k) careful consideration of the full floristic composition of the plot and cover for each species. l) awareness of possible errors in the plot data, such as mis-identification of juniper species by the
field crews, unevenness in how the cover values were estimated in the field or converted into the LFRDB (e.g. cover for trees estimated by a person standing on the ground vs an aerial view of the plot).
Given all of the above, the reviewer had to make a decision for the plot, and assign an ecological system label. In cases where the assignment was not made with high confidence, the reviewer was requested to provide comments as to the factors they used to assign a label to the plot, or what the alternative assignment could be. Report Section 2.3 below discusses some of the results pertinent to confidence of assignment.
Improving the auto-key process
Of the 121 types assigned to plots by experts, 44 had fewer than 10 samples, so are excluded from this particular analysis. From the remaining 77 types, the numbers of samples labeled to a given type ranged from 154 (North Pacific Maritime Mesic-Wet Douglas-fir-Western Hemlock Forest) down to 10 (5 systems). For all of these types, experts reported at least moderate confidence in their labels for at least 20% of the type’s plots. 2 types indicated low confidence for at least 20% of the type’s plots. These statistics are listed in the Results Workbook. A small sampling of expert comments related to moderate or low confidence plots are included in Table 6. Table 9. A selection of expert comments related to labeling sample plots for types where their confidence was reported as moderate or low.
Type Name Expert Comment
Great Basin Foothill and Lower Montane Riparian Woodland and Shrubland
Need geomorphology, soils and hydrologic info to determine type of wetland. This may be shrub-swamp or bog/fen.
Mediterranean California Mixed Oak Woodland
May be the Med Cal Lower Montane Black Oak woodland without the Ponderosa Pine
North Pacific Bog and Fen Need soils information to determine type of wetland (organic soils)
Rocky Mountain Alpine Turf high forb & gram cover, high elevation, but not really alpine turf species, could also be subalpine mesic

Improvements #1 Auto-Key Results Summary Page 27
meadow Rocky Mountain Alpine Bedrock and Scree
Not sure if I can assume that the coverage not accounted for in the species list is rock but assuming that it is and there were not other species on the plot that were not recorded I would go with this system.
These and other comments point to several important aspects for consideration. Some ecological systems concepts are better known and understood than others. Therefore, a certain degree of classification refinement is likely needed in order to improve auto-keys. Also, the inclusion of some landform, soil, and or landscape context information could assist with some determinations within the key, or by a subsequent expert reviewer. Similarly, repeated references to photos further indicates the need for expert review of many moderate-low confidence types where auto-keys might be prone to error. Additional floristic information is cited in some cases where suspected limitations provide the primary source of expert uncertainty in labeling. Other samples were labeled by auto-keys to aggregates of multiple ecological system types. This was because LANDFIRE had mapping objectives focused on uplands where fire regimes are prevalent. That meant that many individual wetland and sparsely-vegetated ecological system types were not treated within the auto-keys. Expert labeling of these samples, however, provides an indication of the feasibility of their inclusion in updated auto-keys. Of 311 samples, experts were able to assign 282 (91%) to an individual ecological system type; a total of 63 individual ecological system types were assigned to these samples. This result indicates the potential for inclusion of these types within subsequent mapping efforts. We cannot yet comment on the issues associated including these types within future regional auto-keys, but this appears to be an issue worthy of exploration. Another set of samples did not contain enough information for the auto-keys to assign a system or system aggregate, or were introduced types with no relevant system; these samples were labeled with broad "unclassified" types, such as "Unclassified Grassland" or "Introduced Upland Vegetation-Shrub". Of 276 samples, experts were able to assign 203 (74%) to an individual ecological system type; a total of 69 individual ecological system types were assigned to these samples.
GeoArea 3
GeoArea 3 encompasses Northern California Coastal Range, Southern California Coastal Range, California Central Valley, and Sierra Nevada Mountain Range (Error! Reference source not found.). This GeoArea includes a total of 4 map zones (Map zones 3-6), originally clustered for purposes of designing and implementing auto-keys (Error! Reference source not found.). The total number of plots in this Geo Area analysis was 2,049. A total of 57 natural ecological system types were assigned to a total of 2,099 plots by the auto-keys. A total of 75 system types were assigned by experts (i.e., these included individual types that had been aggregated to broader classes by LANDFIRE for either sparsely vegetated types or wetland/riparian types). An additional 14 types were assigned by the auto-key but were not assigned by experts:
Baja Semi-Desert Coastal Succulent Scrub
California Mesic Serpentine Grassland
Columbia Plateau Western Juniper Woodland and Savanna
Mediterranean California Alpine Fell-Field
North Pacific Maritime Mesic-Wet Douglas-fir-Western Hemlock Forest

Improvements #1 Auto-Key Results Summary Page 28
Northern California Mesic Subalpine Woodland
California Montane Riparian Systems
Inter-Mountain Basins Montane Riparian Systems
Inter-Mountain Basins Sparsely Vegetated Systems
Mediterranean California Sparsely Vegetated Systems
North American Warm Desert Riparian Systems
North American Warm Desert Sparsely Vegetated Systems
Pacific Coastal Dunes and Other Sparsely Vegetated Systems
Pacific Coastal Marsh Systems
Comparison of Auto-key and Expert Assignments
Of the 75 natural types assigned labels by the auto-keys, 17 types (24%) had fewer than 10 samples available for this analysis (Table 4). These under-sampled types tended to include types that are found on the periphery of their range within this GeoArea (e.g., Inter-Mountain Basins Greasewood Flat, Inter-Mountain Basins Aspen-Mixed Conifer Forest and Woodland, Columbia Plateau Western Juniper Woodland and Savanna, Inter-Mountain Basins Big Sagebrush Steppe, Inter-Mountain Basins Mixed Salt Desert Scrub, Inter-Mountain Basins Semi-Desert Grassland, North Pacific Hypermaritime Seasonal Sitka Spruce Forest, North Pacific Maritime Mesic-Wet Douglas-fir-Western Hemlock Forest), while others are generally within this range, but are less common types, or simply have had inadequate sampling effort (for example were difficult to access) across this region. These include Mediterranean California Alpine Dry Tundra, Mediterranean California Alpine Fell-Field, Klamath-Siskiyou Upper Montane Serpentine Mixed Conifer Woodland, California Mesic Serpentine Grassland, Klamath-Siskiyou Lower Montane Serpentine Mixed Conifer Woodland, California Coastal Closed-Cone Conifer Forest and Woodland, Baja Semi-Desert Coastal Succulent Scrub and California Maritime Chaparral. Table 10. Under-sampled types within GeoArea 3
EVT Code
EVT Name System elcode
total Plots
2136 Mediterranean California Alpine Dry Tundra CES206.939 8
2153 Inter-Mountain Basins Greasewood Flat CES304.780 8
2061 Inter-Mountain Basins Aspen-Mixed Conifer Forest and Woodland
CES304.776 7
2022 Klamath-Siskiyou Upper Montane Serpentine Mixed Conifer Woodland
CES206.914 6
2073 Baja Semi-Desert Coastal Succulent Scrub CES206.934 6
2131 California Northern Coastal Grassland CES206.941 5
2130 California Mesic Serpentine Grassland CES206.943 5
2067 Mediterranean California Alpine Fell-Field CES206.900 4
2021 Klamath-Siskiyou Lower Montane Serpentine Mixed Conifer Woodland
CES206.917 4
2177 California Coastal Closed-Cone Conifer Forest and Woodland CES206.922 3 2017 Columbia Plateau Western Juniper Woodland and Savanna CES304.082 3
2125 Inter-Mountain Basins Big Sagebrush Steppe CES304.778 3
2036 North Pacific Hypermaritime Seasonal Sitka Spruce Forest CES204.841 2

Improvements #1 Auto-Key Results Summary Page 29
EVT Code
EVT Name System elcode
total Plots
2039 North Pacific Maritime Mesic-Wet Douglas-fir-Western Hemlock Forest
CES204.002 1
2096 California Maritime Chaparral CES206.929 1
2081 Inter-Mountain Basins Mixed Salt Desert Scrub CES304.784 1
2135 Inter-Mountain Basins Semi-Desert Grassland CES304.787 1 A total of 18 types (or nearly 32% of 57 types) had >80% agreement between expert and auto-key assignments. All of these types had at least 25 sample plots. Expert self-assessment of confidence for these types were predominantly ‘high’. Table 11 provides a summary of adequately-sampled types where agreement between expert and auto-key ranged from just below 80% down to zero. These types total 22, or nearly 39% of the total types assigned. Further analysis of those grouped within the 60-80% agreement range suggests subtleties within types that left the expert with greater or lesser confidence in their assignment. For example some plots assigned by the auto-key to Mediterranean California Mixed Evergreen Forest were most frequently mistaken for Mediterranean California Lower Montane Black Oak-Conifer Forest and Woodland probably because they included Pseudotsuga menziesii and Quercus chrysolepis, which is common to both ecosystems. These types do transition into one another, so additional floristic indicators might be identified to better distinguish them. This same general pattern, one of carefully reviewing the dominant tree, shrub, or grass elements shared among related types, should be the focus of auto-key improvements for these types. Table 11. Summary of types with adequate samples where agreement between auto-key and expert was below 80%
Plots with Expert Matches
EVT Code EVT Name
System Elcode
Total Plots Total %
High conf
Med conf
Low conf
2043 Mediterranean California Mixed Evergreen Forest
CES206.919 49 38 78% 37 1 0
2034 Mediterranean California Mesic Serpentine Woodland and Chaparral
CES206.928 50 38 76% 37 1 0
2097 California Mesic Chaparral CES206.926 50 36 72% 34 2 0
2029 Mediterranean California Mixed Oak Woodland
CES206.909 50 32 64% 32 0 0
2011 Rocky Mountain Aspen Forest and Woodland
CES306.813 33 21 64% 21 0 0
2030 Mediterranean California Lower Montane Black Oak-Conifer Forest and Woodland
CES206.923 38 24 63% 24 0 0
2126 Inter-Mountain Basins Montane Sagebrush Steppe
CES304.785 36 20 56% 20 0 0

Improvements #1 Auto-Key Results Summary Page 30
2088 Sonora-Mojave Mixed Salt Desert Scrub
CES302.749 24 13 54% 13 0 0
2028 Mediterranean California Mesic Mixed Conifer Forest and Woodland
CES206.915 50 25 50% 25 0 0
2099 California Xeric Serpentine Chaparral
CES206.927 47 23 49% 22 1 0
2098 California Montane Woodland and Chaparral
CES206.925 59 28 47% 28 0 0
2027 Mediterranean California Dry-Mesic Mixed Conifer Forest and Woodland
CES206.916 50 19 38% 19 0 0
2033 Mediterranean California Subalpine Woodland
CES206.910 49 18 37% 18 0 0
2118 Southern California Oak Woodland and Savanna
CES206.938 50 17 34% 17 0 0
2112 California Central Valley Mixed Oak Savanna
CES206.935 47 15 32% 15 0 0
2014 Central and Southern California Mixed Evergreen Woodland
CES206.920 50 14 28% 14 0 0
2105 Northern and Central California Dry-Mesic Chaparral
CES206.931 50 14 28% 14 0 0
2108 Sonora-Mojave Semi-Desert Chaparral
CES302.757 50 13 26% 13 0 0
2008 North Pacific Oak Woodland CES204.852 16 3 19% 3 0 0
2082 Mojave Mid-Elevation Mixed Desert Scrub
CES302.742 50 7 14% 6 1 0
2103 Great Basin Semi-Desert Chaparral
CES304.001 16 2 13% 2 0 0
2044 Northern California Mesic Subalpine Woodland
CES206.911 26 0 0% 0 0 0
Analysis of the contingency table (see Results Workbook) for these types with lesser levels of agreement reveals the many ongoing challenges with finding agreement between experts and auto-keys for complex vegetation types. Here we summarize a cross-section of results from GeoArea 3. It’s important to note that the sequence table for these California map zones did not include any ability to key plots based on an elevation criterion. Some of the disagreements between the auto-keyed results and the expert results might be resolved in the future by the addition of elevation rules in the sequence table. The Mediterranean California Mesic Mixed Conifer Forest and Woodland (50%) and the Mediterranean California Dry-Mesic Mixed Conifer Forest and Woodland (38%) are very similar types distiguished on a

Improvements #1 Auto-Key Results Summary Page 31
moisture gradient, and were often confused with each other in the auto-key. Information on elevation, aspect and additional component species composition aided experts in teasing these two systems apart. Auto-key often mistook Great Basin Xeric Mixed Sagebrush Shrubland for Inter-Mountain Basins Montane Sagebrush Steppe, which relies on the identification of the subspecies of several Artemisia species for proper classification; they also intergrade at higher elevation where they transition from one system to the other. Additional elevation and geographic information would help the auto-key process. Mediterranean California Subalpine Woodland (37%) and Northern California Mesic Subalpine Woodland (0%) were often confused with lower elevation forest types. Elevation is a key factor that would aid the auto-key process. Southern California Oak Woodland and Savanna (34%) and California Central Valley Mixed Oak Savanna (32%) were often confused with California Coastal Live Oak Woodland and Savanna as both can have Querus agrifolia mixed with other oak species. For stands with limited species compositional information, the addition of geographical location confirms the type of oak savanna. Chaparral is complex and very diverse in California, so location and geography as well as species composition is critical to classify to the different types. The Auto-key and expert tended to disagree between the Northern and Central California Dry-Mesic Chaparral system and the Southern California Dry-Mesic Chaparral system. The species composition tends to intergrade where the two become adjacent, and correct identification of Ceanothus species becomes critical. Again location/geographic information and accurate species identification will be very helpful.
Expert Assignments
As described in the methods section above, the expert reviewers worked directly in the expert attribution database (EADB). Since GeoArea 3 had over 2,000 plots to review, a systematic, efficient process for reviewing and labeling plots was required. The forms provided in the EADB allowed the reviewer to sort and filter on subsets of plots to select groups of them with similar characteristics. For instance, the reviewer could select all plots found within a particular USFS Section or MapZone, then select all plots dominated by trees, then sort alphabetically by the dominant species. The reviewer could also select all treed plots, then select all plots with the same dominant tree species (such as Pinus contorta), then sort by % cover of that species, from high to low. Error! Reference source not found. shows the main form in the EADB which has these data fields. Additional fields were provided from which to select or sort plots, such as elevation, aspect, slope, and total cover by lifeform in the plot. Once the reviewer had selected a subset of plots for reviewing, the next step was to select an individual plot to review and label. If the expert was working on treed plots first, then they had a further option of selecting the set of ecological systems from which to pick a label for the plots. This was accomplished via a filter on the NLCD land cover class applied to all systems (such as forest and woodland, shrubland, herbaceous, woody wetlands, and so on). For each plot, the expert reviewed environmental and geographic setting, as well as the floristic and vegetation structural characteristics of the plot. In many cases the expert could then assign an ecological system label with no further information. However, in some cases the reviewer might consult the descriptions for a group of similar ecological systems to clarify their understanding of differences in concept, geographic distribution, floristics, or structural characteristics.

Improvements #1 Auto-Key Results Summary Page 32
For example, in the lower foothills of the Sierra-Nevada there is a transition from Mediterranean California Lower Montane Black Oak-Conifer Forest and Woodland to Mediterranean California Dry-Mesic Mixed Conifer Forest and Woodland. In these areas, the tree canopy might be a mix of ponderosa, black oak (Quercus kelloggii), incense cedar (Calocedrus decurrens) and Quercus chrysolepis, along with a variable mixture of deciduous shrubs and grasses. Cover of the trees can vary from 10% to more than 80% . In these cases, the reviewer would encounter plots of mixed composition, and need to determine whether those plots represented Mediterranean California Dry-Mesic Mixed Conifer Forest and Woodland, the Mediterranean California Mesic Mixed Conifer Forest and Woodland or the Mediterranean California Mesic Serpentine Woodland and Chaparral. In cases like this, the determination of which system type to assign to the plot might require:
m) review of the image clip for the context of the plot, n) review of where the plot was located geographically (USFS Subsections provide local scale
geographic location), to distinguish Southern California Coastal Mountains from Northern California Coast, and the Central Valley from Mojave Desert,
o) consideration of topographic setting (e.g. north-facing slopes at lower elevations could support ponderosa pine woodlands),
p) consideration of any available height data for the plot (e.g. were the ponderosa pines all tall, apparently mature trees; or were they short),
q) careful consideration of the full floristic composition of the plot and cover for each species. r) awareness of possible errors in the plot data, such as mis-identification of juniper species by the
field crews, unevenness in how the cover values were estimated in the field or converted into the LFRDB (e.g. cover for trees estimated by a person standing on the ground vs an aerial view of the plot).
Below are some examples of comments relevant to the above example:
Coastal Chaparral species composition changes from north to south, but where northern and southern coastal California intergrade, it is helpful to know if the location is on the drier interior aspect or ocean facing part of the same mountain range. This is particularly useful if the full species composition is unavailable. Information or confirmation of soil types to identify serpentine areas would also be beneficial. Closely aligned chaparral includes California Xeric Serpentine Chaparral, California Maritime Chaparral, Southern California Dry-Mesic Chaparral, Northern and Central California Dry-Mesic Chaparral, and Southern California Coastal Scrub
Coast live oak is the characteristic species of the California Coastal Live Oak Woodland and Savanna, however it is a wide-spread species in California and may occur in the foothills of the Sierra-Nevada or along the western edges of the central valley where it mixes with other oak species and is often a part of the Mediterranean California Mixed Oak Woodland, the California Central Valley Mixed Oak Savanna or the Mediterranean California Mixed Evergreen Forest. Again full species composition and geographic location aid the accuracy of point classification.
Given all of the above, the reviewer had to make a decision for the plot, and assign an ecological system label. In cases where the assignment was not made with high confidence, the reviewer was requested to provide comments as to the factors they used to assign a label to the plot, or what the alternative assignment could be. Report Section 2.3 below discusses some of the results pertinent to confidence of assignment.

Improvements #1 Auto-Key Results Summary Page 33
Improving the auto-key process
Of the 75 types assigned to plots by experts, 32 had fewer than 10 samples, so are excluded from this particular analysis. From the remaining 43 types, the numbers of samples labeled to a given type ranged from 152 (for Southern California Dry-Mesic Chaparral) down to 11 (for Mojave Mid-Elevation Mixed Desert Scrub). For all of these types, experts reported at least moderate confidence in their labels for at least 70% of the type’s plots. In fact the vast majority of plot labels were given with high confidence, and almost no plots were given low confidence. These statistics are listed in the Results Workbook. A small sampling of expert comments related to moderate or low confidence plots are included in Table 6. Table 12. A selection of expert comments related to labeling sample plots for types where their confidence was reported as moderate or low
Type Name Expert Comment
Great Basin Semi-Desert Chaparral Need Quercus species identified
Mediterranean California Mesic Serpentine Woodland and Chaparral
Not sure soils are serpentine
Southern California Coastal Scrub Has half Maritime and half dry Chaparral spp, so it depends on the location of the stand
Sierra Nevada Subalpine Lodgepole Pine Forest and Woodland
need var of lodgepole
These and other comments point to several important aspects for consideration. First, some ecological systems concepts are better known and understood than others. Therefore, a certain degree of classification refinement is likely needed in order to improve auto-keys. Second, the inclusion of some limited landform, soil, and or landscape context information could assist with some determinations within the key, or by a subsequent expert reviewer. Similarly, repeated references to photos further indicates the need for expert review of many types where moderate-low confidence of experts suggest that auto-keys might be prone to error. Third, additional floristic information is cited in some cases where their suspected limitations provide the primary source of expert uncertainty in labeling. Other samples were labeled by auto-keys to aggregates of multiple ecological system types. This was because LANDFIRE had mapping objectives focused on uplands where fire regimes are prevalent. That meant that many individual wetland and sparsely-vegetated ecological system types were not treated within the auto-keys. Expert labeling of these samples, however, provides an indication of the feasibility of their inclusion in updated auto-keys. Of 212 samples, experts were able to assign 209 (99%) to an individual ecological system type; a total of 26 individual ecological system types were assigned to these samples. This result indicates the potential for inclusion of these types within subsequent mapping efforts. We cannot yet comment on the issues associated including these types within future regional auto-keys, but this appears to be an issue worthy of exploration. For example experts were able to differentiate Mediterranean California Foothill and Lower Montane Riparian Woodland, California Central Valley Riparian Woodland and Shrubland and Great Basin Foothill and Lower Montane Riparian Woodland and Shrubland, based on species composition and geographic location, while the Landfire auto-key had these lumped into a single “California Montane Riparian Systems.”

Improvements #1 Auto-Key Results Summary Page 34
Another set of samples did not contain enough information for the auto-keys to assign a system or system aggregate; these samples were labeled with broad "unclassified" types, such as "Unclassified Grassland" or "None". Of 177 samples, experts were able to assign 137 (77%) to an individual ecological system types; a total of 45 individual ecological system types were assigned to these samples.
GeoArea 4
GeoArea 4 encompasses the desert southwest and adjacent interior Rocky Mountains, extending from the heart of the Great Basin (Map zones 12 & 17), east to the Southern Rocky Mountains (Map zone 28), and south throughout the Chihuahuan Desert (Map zones 25-26) (Error! Reference source not found.). This GeoArea includes a total of 11 map zones, originally clustered into grouping for purposes of designing and implementing auto-keys (Error! Reference source not found.). Importantly, this area includes the first set of sequence tables and auto-keys developed for the LANDFIRE, so lessons learned in their development were initiated here. The total number of plots in this Geo Area analysis was 2,127. A total of 75 natural ecological system types were assigned to a total of 1,764 plots by the auto-keys. A total of 97 system types were assigned by experts (i.e., these included individual types that had been aggregated to broader classes by LANDFIRE for either sparsely vegetated types or wetland/riparian types). An additional 9 types were assigned by the auto-key but were not assigned by experts. Those types included:
Rocky Mountain Foothill Limber Pine-Juniper Woodland
Mediterranean California Subalpine Woodland
Madrean Oriental Chaparral
Columbia Plateau Low Sagebrush Steppe
Rocky Mountain Alpine Fell-Field
Sonoran Brittlebush-Ironwood Desert Scrub
Western Great Plains Foothill and Piedmont Grassland
Columbia Plateau Western Juniper Woodland and Savanna
Columbia Plateau Steppe and Grassland Of the 75 natural types assigned labels by the auto-keys, 18 types (24%) had fewer than 20 samples available for this analysis (Table 4). These under-sampled types tended to include types that are found on the periphery of their range within this GeoArea (e.g., Columbia Plateau Low Sagebrush Steppe [n=5], Western Great Plains Foothill and Piedmont Grassland [n=1], Madrean Upper Montane Conifer-Oak Forest and Woodland [n=4], or Sierra Nevada Subalpine Lodgepole Pine Forest and Woodland [n=2]), while others are generally within this range, but are less common types, or simply have had inadequate sampling effort across this region. These include Rocky Mountain Alpine Turf, Rocky Mountain Alpine Dwarf-Shrubland, Rocky Mountain Alpine Fell-Field, Chihuahuan Sandy Plains Semi-Desert Grassland, Sonoran Granite Outcrop Desert Scrub, and Chihuahuan-Sonoran Desert Bottomland and Swale Grassland. Table 13. Under-sampled types within GeoArea 4.
EVT Code Ecological System Name
NatureServe CES code
Number of plots
2033 Mediterranean California Subalpine Woodland CES206.910 13
2101 Madrean Oriental Chaparral CES302.031 12

Improvements #1 Auto-Key Results Summary Page 35
EVT Code Ecological System Name
NatureServe CES code
Number of plots
2144 Rocky Mountain Alpine Turf CES306.816 10
2133 Chihuahuan Sandy Plains Semi-Desert Grassland CES302.736 9
2070 Rocky Mountain Alpine Dwarf-Shrubland CES306.810 7
2124 Columbia Plateau Low Sagebrush Steppe CES304.080 5
2090 Sonoran Granite Outcrop Desert Scrub CES302.760 5
2122 Chihuahuan Gypsophilous Grassland and Steppe CES302.732 4
2111 Western Great Plains Mesquite Woodland and Shrubland CES303.668 4
2026 Madrean Upper Montane Conifer-Oak Forest and Woodland CES305.798 4
2504 Chihuahuan-Sonoran Desert Bottomland and Swale Grassland CES302.746 3
2143 Rocky Mountain Alpine Fell-Field CES306.811 2
2058 Sierra Nevada Subalpine Lodgepole Pine Forest and Woodland CES206.912 2
2089 Sonoran Brittlebush-Ironwood Desert Scrub CES302.758 1
2147 Western Great Plains Foothill and Piedmont Grassland CES303.817 1
2017 Columbia Plateau Western Juniper Woodland and Savanna CES304.082 1
2123 Columbia Plateau Steppe and Grassland CES304.083 1
2031 California Montane Jeffrey Pine(-Ponderosa Pine) Woodland CES206.918 1
A total of 23 types (or nearly 31% of 75 types) had >80% agreement between expert and auto-key assignments. All of these types had at least 25 sample plots. Expert self-assessment of confidence for these types were predominantly ‘high’ although the several types with more ‘moderate’ or even ‘low’ confidence included Western Great Plains Sandhill Steppe, Inter-Mountain Basins Mixed Salt Desert Scrub, and Rocky Mountain Gambel Oak-Mixed Montane Shrubland.
Table 5 provides a summary of adequately-sampled types where agreement between expert and auto-key ranged from just below 80% down to zero. These types total 35, or nearly 47% of the total types assigned. Further analysis of those grouped within the 60-80% agreement range suggests subtleties within types that left the expert with greater or lesser confidence in their assignment. For example, some plots assigned by the auto-key to Colorado Plateau Pinyon-Juniper Woodland were most frequently mistaken for Madrean Pinyon-Juniper Woodland because they included Madrean floristic elements (Juniperus coahuilensis). These types do transition into one another, so additional floristic indicators might be identified to better distinguish them. This same general pattern, one of carefully reviewing the dominant tree, shrub, or grass elements shared among related types, should be the focus of auto-key improvements for these types. Table 14. Summary of types with adequate samples where agreement between auto-key and expert was below 80%.
EVT Code EVT Name
NatureServe Code
# Plots
# Agree %
High Conf
Med Conf
Low Conf
2016 Colorado Plateau Pinyon-Juniper Woodland CES304.767 30 23 77% 21 2 0
2074 Chihuahuan Creosotebush Desert Scrub CES302.731 30 22 73% 17 5 0
2012 Rocky Mountain Bigtooth Maple CES306.814 30 22 73% 21 1 0

Improvements #1 Auto-Key Results Summary Page 36
Ravine Woodland
2064 Colorado Plateau Mixed Low Sagebrush Shrubland CES304.762 30 21 70% 20 1 0
2146 Southern Rocky Mountain Montane-Subalpine Grassland CES306.824 30 21 70% 20 1 0
2116 Madrean Juniper Savanna CES301.730 22 15 68% 9 6 0
2075 Chihuahuan Mixed Salt Desert Scrub CES302.017 30 20 67% 15 5 0
2135 Inter-Mountain Basins Semi-Desert Grassland CES304.787 30 19 63% 17 0 2
2121 Apacherian-Chihuahuan Semi-Desert Grassland and Steppe CES302.735 30 18 60% 13 3 2
2127 Inter-Mountain Basins Semi-Desert Shrub-Steppe CES304.788 30 18 60% 16 1 1
2051
Southern Rocky Mountain Dry-Mesic Montane Mixed Conifer Forest and Woodland CES306.823 30 18 60% 11 6 1
2059 Southern Rocky Mountain Pinyon-Juniper Woodland CES306.835 30 18 60% 12 6 0
2503 Chihuahuan Loamy Plains Desert Grassland CES302.061 30 16 53% 4 12 0
2100 Chihuahuan Mixed Desert and Thornscrub CES302.734 30 16 53% 13 1 2
2082 Mojave Mid-Elevation Mixed Desert Scrub CES302.742 30 16 53% 10 6 0
2149 Western Great Plains Shortgrass Prairie CES303.672 30 15 50% 4 11 0
2061 Inter-Mountain Basins Aspen-Mixed Conifer Forest and Woodland CES304.776 30 15 50% 8 7 0
2119 Southern Rocky Mountain Juniper Woodland and Savanna CES306.834 30 14 47% 9 5 0
2093 Southern Colorado Plateau Sand Shrubland CES304.793 29 13 45% 9 4 0
2109 Sonoran Paloverde-Mixed Cacti Desert Scrub CES302.761 30 13 43% 5 7 1
2117 Southern Rocky Mountain Ponderosa Pine Savanna CES306.649 28 12 43% 6 6 0
2095 Apacherian-Chihuahuan Mesquite Upland Scrub CES302.733 30 12 40% 2 5 5
2125 Inter-Mountain Basins Big Sagebrush Steppe CES304.778 30 12 40% 6 6 0
2056
Rocky Mountain Subalpine Mesic-Wet Spruce-Fir Forest and Woodland CES306.830 30 12 40% 11 1 0
2144 Rocky Mountain Alpine Turf CES306.816 10 4 40% 4 0 0

Improvements #1 Auto-Key Results Summary Page 37
Analysis of the contingency table (Appendix spreadsheet) for these types with lesser levels of agreement reveals the many ongoing challenges with finding agreement between experts and auto-keys for complex vegetation types. Here we summarize a cross-section of results from GeoArea 4. Desert scrub types can present challenges where relatively few species are reliably present and canopy cover varies from relatively dense to quite sparse, all relative to the size of a given sample plot. Autokey-assigned plots for Mojave Mid-Elevation Mixed Desert Scrub (53% agreement) was most commonly assigned by experts to Inter-Mountain Basins Semi-Desert Shrub Steppe, Great Basin Pinyon-Juniper Woodland, and Inter-Mountain Basin Mixed Salt Desert Scrub. Each of these types would be commonly found immediately adjacent and share some small portion of their floristics. Auto-key assigned plots for Sonoran Paloverde-Mixed Cacti Desert Scrub (43% agreement) included somewhat greater uncertainty reported by experts, but was most commonly assigned to Sonora-Mojave Creosotebush-White Bursage Desert Scrub, Sonoran Mid-Elevation Desert Scrub, Apacherian-Chihuahuan and Semi-Desert Grassland and Steppe. The shared component of Creosotebush likely explains the first and most substantial discrepancy. Grass species found with the other types may have triggered confusion with other types. Auto-key assigned plots for Chihuahuan Succulent Desert Scrub (34%) also included somewhat greater uncertainty reported by experts, but was most commonly assigned to Apacherian-Chihuahuan Semi-Desert Grassland and Steppe and Chihuahuan Mixed Desert and Thornscrub; two types sharing key floristic components of either grass or succulent plant species.
Auto-key assigned plots for Rocky Mountain Subalpine Mesic-Wet Spruce-Fir Forest and Woodland (40%) appear to have had high confidence from experts, but were only assigned to one other type, the Rocky Mountain Dry-Mesic Spruce-Fir Forest. Apparently additional floristic information (below tree and shrub canopy) would have enabled better assignment of these types.
2076 Chihuahuan Stabilized Coppice Dune and Sand Flat Scrub CES302.737 30 11 37% 6 5 0
2077 Chihuahuan Succulent Desert Scrub CES302.738 29 10 34% 2 2 6
2091 Sonoran Mid-Elevation Desert Scrub CES302.035 30 8 27% 7 1 0
2115 Inter-Mountain Basins Juniper Savanna CES304.782 30 8 27% 4 4 0
2145 Rocky Mountain Subalpine-Montane Mesic Meadow CES306.829 27 5 19% 5 0 0
2052
Southern Rocky Mountain Mesic Montane Mixed Conifer Forest and Woodland CES306.825 30 5 17% 0 5 0
2108 Sonora-Mojave Semi-Desert Chaparral CES302.757 21 3 14% 3 0 0
2086 Rocky Mountain Lower Montane-Foothill Shrubland CES306.822 30 3 10% 0 3 0
2103 Great Basin Semi-Desert Chaparral CES304.001 30 2 7% 0 2 0
2049 Rocky Mountain Foothill Limber Pine-Juniper Woodland CES306.955 29 0 0% 0 0 0

Improvements #1 Auto-Key Results Summary Page 38
Auto-key assigned plots for Southern Rocky Mountain Mesic Montane Mixed Conifer Forest and Woodland (17%) appear to have had only moderate confidence from experts, but was by far most often assigned to Southern Rocky Mountain Dry-Mesic Montane Mixed Conifer Forest and Woodland. Again, additional floristic information (below tree and shrub canopy) would have enabled better assignment of these types. Finally, auto-key-assigned plots for Rocky Mountain Lower Montane-Foothill Shrubland (10%) tended to be assigned by experts to Rocky Mountain Gambel Oak-Mixed Montane Shrubland, Inter-Mountain Basins Montane Sagebrush Steppe, Southern Rocky Mountain Dry-Mesic Montane Mixed Conifer Forest and Woodland. Each of these types tends to occur adjacent to this shrubland type, with greater or lesser degrees of shared floristics.
Expert Assignments As described in the methods section above, the expert reviewers worked directly in the expert attribution database (EADB). Since GeoArea 4 had over 2,000 plots to review, a systematic, efficient process for reviewing and labeling plots was required. The forms provided in the EADB allowed the reviewer to sort and filter on subsets of plots to select groups of them with similar characteristics. For instance, the reviewer could select all plots found within a particular USFS Section or MapZone, then select all plots dominated by trees, then sort alphabetically by the dominant species. The reviewer could also select all treed plots, then select all plots with the same dominant tree species (such as Pinus edulis), then sort by % cover of that species, from high to low. Error! Reference source not found. shows the main form in the EADB which has these data fields. Additional fields were provided from which to select or sort plots, such as elevation, aspect, slope, and total cover by lifeform in the plot. Once the reviewer had selected a subset of plots for reviewing, the next step was to select an individual plot to review and label. If the expert was working on treed plots first, then they had a further option of selecting the set of ecological systems from which to pick a label for the plots. This was accomplished via a filter on the NLCD land cover class applied to all systems (such as forest and woodland, shrubland, herbaceous, woody wetlands, and so on). For each plot, the expert reviewed environmental and geographic setting, as well as the floristic and vegetation structural characteristics of the plot. In many cases the expert could then assign an ecological system label with no further information. However, in some cases the reviewer might consult the descriptions for a group of similar ecological systems to clarify their understanding of differences in concept, geographic distribution, floristics, or structural characteristics. For example, in the lower montane areas of the southwest, transitions from ponderosa pine woodlands to pinyon-juniper woodlands occur. In these areas, the tree canopy might be a mix of ponderosa, pinyon, and juniper, along with a variable mixture of deciduous shrubs and grasses. Cover of the trees can vary from 10% to more than 80% . In these cases, the reviewer would encounter plots of mixed composition, and need to determine whether those plots represented Southern Rocky Mountain Ponderosa Pine Woodland, Southern Rocky Mountain Pinyon-Juniper Woodland, Madrean Pinyon-Juniper Woodland or Colorado Plateau Pinyon-Juniper Woodland. In cases like this, the determination of which system type to assign to the plot might require:
a) review of the image clip for the context of the plot,

Improvements #1 Auto-Key Results Summary Page 39
b) review of where the plot was located geographically (USFS Subsections provide local scale geographic location), to distinguish Colorado Plateau from Southern Rocky Mountain systems or from Madrean,
c) consideration of topographic setting (e.g. north-facing slopes at lower elevations could support ponderosa pine woodlands),
d) consideration of any available height data for the plot (e.g. were the ponderosa pines all tall, apparently mature trees; or were they short),
e) careful consideration of the full floristic composition of the plot and cover for each species. f) awareness of possible errors in the plot data, such as mis-identification of juniper species by the
field crews, unevenness in how the cover values were estimated in the field or converted into the LFRDB (e.g. cover for trees estimated by a person standing on the ground vs an aerial view of the plot).
Below are some examples of comments relevant to the above ponderosa pine/pinyon-juniper example:
Pinus ponderosa is dominant conifer after Juniperus scopulorum which has low diagnostic value.
Pinus ponderosa is < 10%. Similar to CES305.797 Madrean Pinyon-Juniper Woodland but without Madrean oaks. Juniper deppeana is not a strong indicator of Madrean as it occurs in Southern Rocky Mtns.
Presense of Madrean element, Juniperus coahuilensis suggestes this is CES305.797 Madrean Pinyon-Juniper Woodland stand, but location on Kaibab Plateau indicates Colorado Plateau Pinyon-Juniper Woodland.
Juniperus deppeana alone is not enough to label to Madrean woodland system because Juniperus deppeana is also found in the Southern Rocky Mountains.
Given all of the above, the reviewer had to make a decision for the plot, and assign an ecological system label. In cases where the assignment was not made with high confidence, the reviewer was requested to provide comments as to the factors they used to assign a label to the plot, or what the alternative assignment could be. Report Section 2.3 below discusses some of the results pertinent to confidence of assignment.
Improve Auto Keys Of the 97 types assigned to plots by experts, 23 had fewer than 10 samples, so are excluded from this particular analysis. From the remaining 74 types, the numbers of samples labeled to a given type ranged from 72 (for Southern Rocky Mountain Ponderosa Pine Woodland) down to 10 (for Rocky Mountain Cliff, Canyon and Massive Bedrock). For 36 (50%) of these types, experts reported moderate confidence in their labels for at least 20% of the type’s plots. Several (6) indicated low confidence for at least 20% of the type’s plots. These statistics are listed in the Appendix. A small sampling of expert comments related to moderate or low confidence plots are included in Table 6.
Table 15. A selection of expert comments related to labeling sample plots for types where their confidence was reported as moderate or low.
Type Name Expert Comment Inter-Mountain Basins Semi-Desert Shrub-Steppe (39% mod conf)
Landform, substrate (sand?) and hydrology information would improve assignment confidence.
Apacherian-Chihuahuan Mesquite Upland Scrub (24% low conf)
There is not enough information to determine if the plot is upland or wash or bosque, with confidence.

Improvements #1 Auto-Key Results Summary Page 40
Madrean Juniper Savanna (48% mod conf)
Keys to Southern Rocky Mountain Juniper Woodland and Savanna because of lack of Madrean juniper, but understory is characterized by Madrean/desert species, Rhus microphylla, Prosopis glandulosa, Mimosa aculeaticarpa var. biuncifera, Pleuraphis spp. etc.
Chihuahuan Stabilized Coppice Dune and Sand Flat Scrub (43% mod conf)
Substrate appears to be sand. Atriplex can dominate this system.
Sonoran Paloverde-Mixed Cacti Desert Scrub (50% mod conf, 20% low conf)
This plot is codominated Encelia farinosa and Larrea tridentata but is very diverse with 18 shrubs and cacti.
Colorado Plateau Pinyon-Juniper Shrubland (50% mod conf, 21% low conf)
Plot information is not adequate to label plot with confidences. By location and photo I assume it is a sparse PJ
Chihuahuan Succulent Desert Scrub (20% mod conf, 60% low conf)
Nolina microcarpa dominated stands are not well understood.
These and other comments point to several important aspects for consideration. First, some ecological systems concepts are better known and understood than others. Therefore, a certain degree of classification refinement is likely needed in order to improve auto-keys. This is perhaps most likely with desert scrub and related vegetation shared with northern Mexico. Second, the inclusion of some limited landform, soil, and or landscape context information could assist with some determinations within the key, or by a subsequent expert reviewer. Similarly, repeated references to photos further indicates the need for expert review of many types where moderate-low confidence of experts suggest that auto-keys might be prone to error. Third, additional floristic information is cited in some cases where their suspected limitations provide the primary source of expert uncertainty in labeling. Another class of samples were labeled by auto-keys to aggregates of multiple ecological system types. This was because LANDFIRE had mapping objectives forcused on uplands where fire regimes are prevalent. That meant that many individual wetland and sparsely-vegetated ecological system types were not treated within the auto-keys. Expert labeling of these samples, however, provides an indication of the feasibility of their inclusion in updated auto-keys. Of 329 samples, experts were able to assign all but 35 (89%) to an individual wetland, riparian, or sparsely vegetated ecological system type. A total of 62 individual ecological system types were include among those labeled to samples by experts within this GeoArea. This result indicates the potential for inclusion of these types within subsequent mapping efforts. We cannot yet comment on the issues associated including these types within future regional auto-keys, but this appears to be an issue worthy of exploration.
GeoArea 5 GeoArea 5 encompasses the northern Great Plains Steppe, Black Hills, Dakota Mixed Grass Prairie, Northern Tall Grass Prairie and Central Tall Grass Prairie ecoregions. This GeoArea includes a total of 9 map zones (20, 29, 30, 31, 38, 39, 40, 42, and 43; Error! Reference source not found.) originally clustered into grouping for purposes of designing and implementing auto-keys. The total number of plots in this Geo Area analysis was 1,456. A total of 55 natural ecological system types were assigned to

Improvements #1 Auto-Key Results Summary Page 41
a total of 1,044 plots by the auto-keys. A total of 66 system types were assigned by experts (i.e., these included individual types that had been aggregated to broader classes by LANDFIRE for either sparsely vegetated types or wetland/riparian types). An additional 20 types were assigned by the auto-key but were not assigned by experts:
Boreal Aspen-Birch Forest
Boreal White Spruce-Fir-Hardwood Forest
Central Interior Highlands Calcareous Glade and Barrens
Central Interior Highlands Dry Acidic Glade and Barrens
Inter-Mountain Basins Semi-Desert Grassland
Northern Rocky Mountain Foothill Conifer Wooded Steppe
Northwestern Great Plains Canyon
Ozark-Ouachita Dry-Mesic Oak Forest
Western Great Plains Tallgrass Prairie
Boreal Acidic Peatland Systems
Central Interior and Appalachian Floodplain Systems
Central Interior and Appalachian Shrub-Herbaceous Wetland Systems
Central Interior and Appalachian Swamp Systems
Eastern Great Plains Floodplain Systems
Rocky Mountain Alpine/Montane Sparsely Vegetated Systems
Rocky Mountain Montane Riparian Systems
Rocky Mountain Subalpine/Upper Montane Riparian Systems
Western Great Plains Depressional Wetland Systems
Western Great Plains Floodplain Systems
Western Great Plains Sparsely Vegetated Systems The first nine types are uncommon in this GeoArea because it is at the edge of their geographic range, they are uncommon throughout their entire range, or both. The last 11 types are aggregates of individual Systems used by Landfire for mapping. The expert reviewers attributed sites to individual Systems and so would not have used these units in their review process.
Comparison of Auto-key and Expert Assignments
Of the 55 natural types assigned labels by the auto-keys, 27 types (49%) had fewer than 10 samples available for this analysis (Table 4). All but five, Northwestern Great Plains Canyon, Rocky Mountain Foothill Limber Pine-Juniper Woodland, Paleozoic Plateau Bluff and Talus, Central Tallgrass Prairie, and North-Central Interior Oak Savanna, are at the edge of their geographic range in this GeoArea and are more common elsewhere. Most of these are types found more commonly in the Rocky Mountains or inter-mountain basins further west but that also occur in this GeoArea in the isolated mountain ranges and scattered drier habitats of MapZones 20 and 29 (essentially central and southeastern Montana and northeastern Wyoming). Of the five types that are concentrated within this GeoArea but still have <10 plots, four are truly rare across the landscape and the other, Paleozoic Plateau Bluff and Talus, is restricted to a relatively small area on the eastern edge of GeoArea 5 and has some of its occurrences in the adjacent GeoArea 7W. Table 16. Under-sampled types within GeoArea 5.
EVT Code EVT Name
System elcode
total Plots

Improvements #1 Auto-Key Results Summary Page 42
EVT Code EVT Name
System elcode
total Plots
2308 Crosstimbers Oak Forest and Woodland CES205.682 9
2125 Inter-Mountain Basins Big Sagebrush Steppe CES304.778 9
2066 Inter-Mountain Basins Mat Saltbush Shrubland CES304.783 9
2051 Southern Rocky Mountain Dry-Mesic Montane Mixed Conifer Forest and Woodland CES306.823 9
2049 Rocky Mountain Foothill Limber Pine-Juniper Woodland CES306.955 9
2311 North-Central Interior Dry Oak Forest and Woodland CES202.047 8
2341 Northwestern Great Plains Canyon CES303.658 8
2062 Inter-Mountain Basins Curl-leaf Mountain-mahogany Woodland and Shrubland CES304.772 8
2106 Northern Rocky Mountain Montane-Foothill Deciduous Shrubland CES306.994 7
2150 Western Great Plains Tallgrass Prairie CES303.673 6
2086 Rocky Mountain Lower Montane-Foothill Shrubland CES306.822 6
2518 North-Central Interior Wet Flatwoods CES202.700 5
2401 Central Interior Highlands Calcareous Glade and Barrens CES202.691 4
2517 Paleozoic Plateau Bluff and Talus CES202.704 4
2132 Central Mixedgrass Prairie CES303.659 4
2135 Inter-Mountain Basins Semi-Desert Grassland CES304.787 4
2117 Southern Rocky Mountain Ponderosa Pine Savanna CES306.649 4
2140 Northern Rocky Mountain Subalpine-Upper Montane Grassland CES306.806 4
2363 Central Interior Highlands Dry Acidic Glade and Barrens CES202.692 3
2421 Central Tallgrass Prairie CES205.683 3
2009 Northwestern Great Plains Aspen Forest and Parkland CES303.681 3
2081 Inter-Mountain Basins Mixed Salt Desert Scrub CES304.784 3
2057 Rocky Mountain Subalpine-Montane Limber-Bristlecone Pine Woodland CES306.819 3
2056 Rocky Mountain Subalpine Mesic-Wet Spruce-Fir Forest and Woodland CES306.830 3
2394 North-Central Interior Oak Savanna CES202.698 2
2147 Western Great Plains Foothill and Piedmont Grassland CES303.817 2
2365 Boreal White Spruce-Fir-Hardwood Forest CES103.021 1
A total of 5 types (or 9% of 55 types) had >80% agreement between expert and auto-key assignments. All of these types had >10 sample plots. Expert self-assessment of confidence for these types was predominantly ‘moderate’ to ‘high’ although plots assigned to Rocky Mountain Lodgepole Pine Forest had a nearly evenly distributed confidence rating between ‘low’ to ‘high’. This was because lodgepole pine can be a component of several other montane types, particularly in early successional stages, so the abundance of lodgepole pine was not always a clear determinant of the type. Table 17 provides a summary of adequately-sampled types where agreement between expert and auto-key ranged from just below 80% down to zero. These types total 23, or 41% of the total types assigned. Analysis of the nature of the disagreements between expert and auto-key attribution reveals some of the sources of these disagreements and suggests some methods to help reduce these in the future. The following are some specific examples of levels of disagreement and possible explanations based on interpretations from the contingency table.

Improvements #1 Auto-Key Results Summary Page 43
Northwestern Great Plains Mixedgrass Prairie – 6 sites (12%) were confused with floristically similar shrub or shrub-steppe types, Inter-Mountain Basins Big Sagebrush Shrubland or Inter-Mountain Basins Big Sagebrush Steppe. These types can grade into each other with the cover of shrubs determining which type fits best. Careful determination of shrub cover is important for consistent assignment of sites among these types. Middle Rocky Mountain Montane Douglas-fir Forest and Woodland – This type was confused with three others with Inter-Mountain Basins Big Sagebrush Steppe being the most common (13% of the time). This is likely due to different interpretations of whether there was enough tree cover to fit the sites into a forest/woodland type versus a shrub type. North-Central Interior Dry-Mesic Oak Forest and Woodland – This type was confused with two other upland forests, North-Central Interior Maple-Basswood Forest (8%) and North-Central Interior Dry Oak Forest and Woodland (2%), and two savanna/open woodland types, Eastern Great Plains Tallgrass Aspen Parkland (2%) and North-Central Interior Oak Savanna (2%). North-Central Interior Maple-Basswood Forest – Seven plots (14%) percent of the sites auto-keyed to this type were assigned to the “Can’t assign” by the expert reviewer indicating not enough data to assign the type or that the site did not fit any natural type. The auto-key may have been too aggressive in assigning sites based on limited data and may have included non-natural sites. Western Great Plains Dry Bur Oak Forest and Woodland – This type was confused with Western Great Plains Wooded Draw and Ravine most commonly. These two types often occur in similar environmental settings in the Great Plains. Dominance by bur oak is a good characteristic for this type but where there is a mix of species such as American basswood, green ash, bur oak, and elm then classification is difficult. Eastern Great Plains Tallgrass Aspen Parkland – This type was not confused with any other natural type but 24% of the sites were not assigned by the expert reviewer. The dominant tree species in this type – quaking aspen – is also a common early successional species in old fields, logged, or burned areas so the dominance of just that species is not enough to assign a site to this type. Ground layer data and aerial photos are helpful in distinguishing disturbed sites from natural sites that fit this type. Rocky Mountain Subalpine Dry-Mesic Spruce-Fir Forest and Woodland – Nearly all the disagreements between this type and others was in the assignment of sites auto-keyed to this type into the Rocky Mountain Lodgepole Pine Forest. Thirty-eight percent of the auto-keyed plots were assigned by the expert to the Rocky Mountain Lodgepole Pine Forest. Lodgepole pine can be a strong component of early successional stages of this Rocky Mountain Subalpine Dry-Mesic Spruce-Fir Forest and Woodland. In this case, sites with some subalpine fir and/or Englemann spruce were assigned to this type even if lodgepole pine was dominant but the auto-key placed those plots in the Rocky Mountain Lodgepole Pine Forest. Inter-Mountain Basins Big Sagebrush Shrubland – Every site auto-keyed to this type and expert-assigned to another was to the Inter-Mountain Basins Big Sagebrush Steppe. The primary difference between these two is the cover of shrubs. A difference in interpretation of this cover resulted in this discrepancy in this case.

Improvements #1 Auto-Key Results Summary Page 44
Northern Rocky Mountain Dry-Mesic Montane Mixed Conifer Forest – This type was confused primarily with two other conifer forests in the area. This type is typically dominated by Ponderosa pine, Douglas fir, or a mix of the two. It was confused with the more pure ponderosa pine type of the lower elevations (Northwestern Great Plains-Black Hills Ponderosa Pine Woodland and Savanna) and the more pure Douglas fir type also found nearby at low elevations (Middle Rocky Mountain Montane Douglas-fir Forest and Woodland). The interface of these types is poorly differentiated unless prairie understory is present. Inter-Mountain Basins Montane Sagebrush Steppe – This type was confused almost entirely (54%) with the Inter-Mountain Basins Big Sagebrush Steppe. Careful identification of the sub-species of Artemisia tridentata is important to differentiate these types. In some cases, the auto-key would have been keying on other floristic components (others shrubs, or the bunch grasses) suggestive of the more montane system, but the expert might have keyed based more on elevation. Northwestern Great Plains Shrubland – This type was confused with Northwestern Great Plains Mixedgrass Prairie most often (25%). Since the associated species and geographic ranges overlap extensively, this confusion is based on different interpretations of the cover of shrubs. If a site has >25% shrub cover it will fit this type best but <25% shrub cover it will likely fit the mixedgrass prairie type best. Western Great Plains Sandhill Steppe – This type was confused with four floristically related grassland types – Central Mixedgrass Prairie, Northwestern Great Plains Mixedgrass Prairie, Western Great Plains Sand Prairie, and Western Great Plains Shortgrass Prairie. These disagreements in assignments were due to differences in interpretation of the cover of shrubs. The auto-key calculated a higher cover for these sites and placed them in a shrubland type whereas the expert reviewer thought they fit a grassland type. Western Great Plains Sand Prairie – Most of the disagreements (38%) with assignments of sites auto-keyed to this type were with assignments made by the expert reviewer to the Northwestern Great Plains Mixedgrass Prairie. Some of the species common to the Western Great Plains Sand Prairie can increase under grazing of the Northwestern Great Plains Mixedgrass Prairie. The expert reviewer judged some of these sites to fit the Northewestern Great Plains Mixedgrass Prairie best even though they had a relatively high cover of junegrass, Sporobolus spp., etc. Western Great Plains Wooded Draw and Ravine – This type was confused with multiple other natural types and 6 plots (12%) were expert labeled with “Can’t assign” categories indicating not enough data to assign the type or that the site did not fit any natural type. The auto-key may have been too aggressive in assigning sites based on limited data and may have included non-natural sites. Boreal Aspen-Birch Forest – This type was not assigned by the expert reviewer to any sites. It is not supposed to occur in GeoArea 5 and should be removed with a better geographic delineation of its distribution in the auto-key. All sites auto-keyed to this type were assigned by the expert reviewer to the Eastern Great Plains Tallgrass Aspen Parkland. Table 17. Summary of types with adequate samples where agreement between auto-key and expert was below 80%.
Plots with Expert Matches

Improvements #1 Auto-Key Results Summary Page 45
EVT Code EVT Name
System Elcode
Total Plots Total %
High conf
Med conf
Low conf
2141 Northwestern Great Plains Mixedgrass Prairie
CES303.674 50 37 74% 15 13 9
2166 Middle Rocky Mountain Montane Douglas-fir Forest and Woodland
CES306.959 23 17 74% 6 9 2
2310 North-Central Interior Dry-Mesic Oak Forest and Woodland
CES202.046 50 36 72% 13 19 4
2314 North-Central Interior Maple-Basswood Forest
CES202.696 50 31 62% 22 6 3
2013 Western Great Plains Dry Bur Oak Forest and Woodland
CES303.667 39 23 59% 9 11 3
2331 Eastern Great Plains Tallgrass Aspen Parkland
CES205.688 23 13 57% 1 6 6
2055 Rocky Mountain Subalpine Dry-Mesic Spruce-Fir Forest and Woodland
CES306.828 50 28 56% 10 13 5
2080 Inter-Mountain Basins Big Sagebrush Shrubland
CES304.777 46 25 54% 14 10 1
2045 Northern Rocky Mountain Dry-Mesic Montane Mixed Conifer Forest
CES306.805 50 27 54% 15 7 5
2126 Inter-Mountain Basins Montane Sagebrush Steppe
CES304.785 50 20 40% 10 6 4
2085 Northwestern Great Plains Shrubland
CES303.662 28 10 36% 6 3 1
2094 Western Great Plains Sandhill Steppe
CES303.671 15 5 33% 1 4 0
2148 Western Great Plains Sand Prairie
CES303.670 49 16 33% 10 3 3
2153 Inter-Mountain Basins Greasewood Flat
CES304.780 28 8 29% 1 4 3
2385 Western Great Plains Wooded Draw and Ravine
CES303.680 50 12 24% 6 5 1
2054 Southern Rocky Mountain Ponderosa Pine Woodland
CES306.648 50 10 20% 4 5 1
2139 Northern Rocky Mountain Lower Montane-Foothill-Valley Grassland
CES306.040 23 4 17% 1 3 0
2167 Rocky Mountain Poor-Site Lodgepole Pine Forest
CES306.960 10 1 10% 0 1 0

Improvements #1 Auto-Key Results Summary Page 46
Plots with Expert Matches EVT Code EVT Name
System Elcode
Total Plots Total %
High conf
Med conf
Low conf
2145 Rocky Mountain Subalpine-Montane Mesic Meadow
CES306.829 13 1 8% 0 1 0
2061 Inter-Mountain Basins Aspen-Mixed Conifer Forest and Woodland
CES304.776 14 1 7% 0 1 0
2301 Boreal Aspen-Birch Forest CES103.020 19 0 0% 0 0 0
2165 Northern Rocky Mountain Foothill Conifer Wooded Steppe
CES306.958 13 0 0% 0 0 0
2304 Ozark-Ouachita Dry-Mesic Oak Forest
CES202.708 11 0 0% 0 0 0
Expert Assignments
As described in the methods section above, the expert reviewers worked directly in the expert attribution database (EADB). Since GeoArea 5 had almost 1,500 plots to review, a systematic, efficient process for reviewing and labeling plots was required. The forms provided in the EADB allowed the reviewer to sort and filter on subsets of plots to select groups of them with similar characteristics. For instance, the reviewer could select all plots found within a particular USFS Section or MapZone, then select all plots dominated by trees, then sort alphabetically by the dominant species. The reviewer could also select all treed plots, then select all plots with the same dominant tree species (such as Pinus edulis), then sort by % cover of that species, from high to low. Error! Reference source not found. shows the main form in the EADB which has these data fields. Additional fields were provided from which to select or sort plots, such as elevation, aspect, slope, and total cover by lifeform in the plot. Once the reviewer had selected a subset of plots for reviewing, the next step was to select an individual plot to review and label. If the expert was working on treed plots first, then they had a further option of selecting the set of ecological systems from which to pick a label for the plots. This was accomplished via a filter on the NLCD land cover class applied to all systems (such as forest and woodland, shrubland, herbaceous, woody wetlands, and so on). For each plot, the expert reviewed environmental and geographic setting, as well as the floristic and vegetation structural characteristics of the plot. In many cases the expert could then assign an ecological system label with no further information. However, in some cases the reviewer might consult the descriptions for a group of similar ecological systems to clarify their understanding of differences in concept, geographic distribution, floristics, or structural characteristics. For example, in the lower montane areas of central Montana, forests dominated by ponderosa pine, Douglas fir, or a combination can occur. The reviewer would need to determine if those plots represented Northwestern Great Plains-Black Hills Ponderosa Pine Woodland and Savanna, Northern Rocky Mountain Ponderosa Pine Woodland and Savanna, Middle Rocky Mountain Montane Douglas-fir Forest and Woodland, or Northern Rocky Mountain Dry-Mesic Montane Mixed Conifer Forest. In cases like this, the determination of which system type to assign to the plot might require:

Improvements #1 Auto-Key Results Summary Page 47
g) review of the image clip for the context of the plot, h) review of where the plot was located geographically (USFS Subsections provide local scale
geographic location), may help distinguish the Great Plains-Black Hills type from the Rocky Mountain types,
i) consideration of topographic setting (e.g. north-facing slopes at lower elevations could support ponderosa pine woodlands),
j) consideration of any available height data for the plot (e.g. were the ponderosa pines all tall, apparently mature trees; or were they short),
k) careful consideration of the full floristic composition of the plot and cover for each species. l) awareness of possible errors in the plot data, such as misidentification of juniper species by the
field crews, unevenness in how the cover values were estimated in the field or converted into the LFRDB (e.g. cover for trees estimated by a person standing on the ground vs. an aerial view of the plot).
Below are some examples of comments relevant to the above example:
Tree cover almost too low for a treed System but photo and Source data appear to show enough tree cover so site not a grassland.
Little P. ponderosa but this site is too low and within a Great Plains grassland landscape so it can't be Rocky Mountain Foothills Limber Pine-Juniper System.
There are several dry-mesic forest Systems with mixed conifer canopies possible in this area but this seems the best fit.
Probably enough Pseudotsuga menziesii to fit this System better than the Northern Rocky Mountain Dry-Mesic Montane Mixed Conifer System.
Northern Rocky Mountain Dry-Mesic Montane Mixed Conifer Forest can also be dominated by P. menziesii but since there is little besides that species in the canopy it seems to fit the assigned System best.
Moderately low cover of Pseudotsuga and high cover of Juniperus but still seems to fit this System fairly well. Dry site.
Given all of the above, the reviewer had to make a decision for the plot, and assign an ecological system label. In cases where the assignment was not made with high confidence, the reviewer was requested to provide comments as to the factors they used to assign a label to the plot, or what the alternative assignment could be. Report Section 2.3 below discusses some of the results pertinent to confidence of assignment.
Improving the auto-key process
Of the 66 types assigned to plots by experts, 35 had fewer than 10 samples, so are excluded from this particular analysis. From the remaining 31 types, the numbers of samples labeled to a given type ranged from 138 (Northwestern Great Plains-Black Hills Ponderosa Pine Woodland and Savanna) down to 10 (Southern Rocky Mountain Ponderosa Pine Woodland). For all (100%) of these types, experts reported moderate or high confidence in their labels for at least 20% of the type’s plots. 15 types indicated low confidence for at least 20% of the type’s plots. These statistics are listed in the Appendix. A small sampling of expert comments related to moderate or low confidence plots are included in Table 6. Table 18. A selection of expert comments related to labeling sample plots for types where their confidence was reported as moderate or low.
Type Name Expert Comment

Improvements #1 Auto-Key Results Summary Page 48
Northwestern Great Plains-Black Hills Ponderosa Pine Woodland and Savanna
Little P. ponderosa but this site is too low and within a Great Plains
Northwestern Great Plains Mixedgrass Prairie
Lots of exotic cover but the few native grasses indicate this System.
North-Central Interior Floodplain Floristics and photo look like a floodplain but very little floristic data to go by.
Inter-Mountain Basins Big Sagebrush Steppe
Borderline herbaceous cover for this System but fits here best.
Rocky Mountain Lodgepole Pine Forest
Low cover in all three strata but fits a treed System best.
North-Central Interior Dry-Mesic Oak Forest and Woodland
Quercus ellipsoidalis seems odd in this mix but, if present, pushes this to an upland System.
These and other comments point to several important aspects for consideration. First, some ecological systems concepts are better known and understood than others. Therefore, a certain degree of classification refinement is likely needed in order to improve auto-keys. In this GeoArea, this is particularly true in the transition from lower montane/foothill types to Great Plains types. As currently defined there is no clear differentiation between these types. Second, the inclusion of some limited landform, soil, and or landscape context information could assist with some determinations within the key, or by a subsequent expert reviewer. Similarly, repeated references to photos further indicates the need for expert review of many types where moderate-low confidence of experts suggest that auto-keys might be prone to error. Third, additional floristic information is cited in some cases where their suspected limitations provide the primary source of expert uncertainty in labeling. Other samples were those labeled by auto-keys to aggregates of multiple ecological system types. This was because LANDFIRE had mapping objectives focused on uplands where fire regimes are prevalent. That meant that many individual wetland and sparsely-vegetated ecological system types were not treated within the auto-keys. Expert labeling of these samples, however, provides an indication of the feasibility of their inclusion in updated auto-keys. Of 279 samples, experts were able to assign 237 (85%) to an individual ecological system type; a total of 32 individual ecological system types were assigned to these samples. This result indicates the potential for inclusion of these types within subsequent mapping efforts. We cannot yet comment on the issues associated including these types within future regional auto-keys, but this appears to be an issue worthy of exploration. Another class of samples did not contain enough information for the auto-keys to assign a system or system aggregate; these samples were labeled with broad "unclassified" types, such as "Unclassified Grassland" or "None". Of 133 samples, experts were able to assign 94 (71%) to an individual ecological system type; a total of 25 individual ecological system types were assigned to these samples.
GeoArea 6
GeoArea 6 encompasses the Great Plains Tablelands, Southeastern Great Plains, Western Great Plains, Southern Great Plains, Edwards Plateau and Western Gulf Plains (Error! Reference source not found.). This GeoArea includes a total of 6 map zones (27, 32, 33, 34, 35, and 36), originally clustered for purposes of designing and implementing auto-keys (Error! Reference source not found.). The total number of plots in this Geo Area analysis was 1,295. A total of 52 natural ecological system types were

Improvements #1 Auto-Key Results Summary Page 49
assigned to a total of 930 plots by the auto-keys. A total of 54 system types were assigned by experts (i.e., these included individual types that had been aggregated to broader classes by LANDFIRE for either sparsely vegetated types or wetland/riparian types). Other “additional” systems are characteristic of peripheral areas such as Chihuahuan Desert, which is transitional to the Southern Plains and high Rocky Mountain forest systems which may occur on isolated mountains on the western edge of the GeoArea. These systems were added to the sequence tables because of the potential inclusion of plots from these areas. An additional 22 types were assigned by the auto-key but were not assigned by experts:
Chihuahuan Loamy Plains Desert Grassland
Chihuahuan Sandy Plains Semi-Desert Grassland
Inter-Mountain Basins Aspen-Mixed Conifer Forest and Woodland
Inter-Mountain Basins Montane Sagebrush Steppe
Madrean Pinyon-Juniper Woodland
Northwestern Great Plains Canyon
Northwestern Great Plains-Black Hills Ponderosa Pine Woodland and Savanna
Ozark-Ouachita Shortleaf Pine-Oak Forest and Woodland
Rocky Mountain Foothill Limber Pine-Juniper Woodland
Rocky Mountain Lodgepole Pine Forest
Rocky Mountain Subalpine Dry-Mesic Spruce-Fir Forest and Woodland
Rocky Mountain Subalpine-Montane Limber-Bristlecone Pine Woodland
West Gulf Coastal Plain Pine-Hardwood Forest
Central Interior and Appalachian Floodplain Systems
Central Interior and Appalachian Riparian Systems
Gulf and Atlantic Coastal Plain Floodplain Systems
Gulf and Atlantic Coastal Plain Small Stream Riparian Systems
Inter-Mountain Basins Sparsely Vegetated Systems
Rocky Mountain Montane Riparian Systems
Western Great Plains Depressional Wetland Systems
Western Great Plains Floodplain Systems
Western Great Plains Sparsely Vegetated Systems Comparison of Auto-key and Expert Assignments Of the 52 natural types assigned labels by the auto-keys, 23 types (44%) had fewer than 10 samples available for this analysis (Table 4). These under-sampled types tended to include types that are found on the geographic periphery of their range within this GeoArea (e.g., Chihuahuan Loamy Plains Desert Grassland, Chihuahuan Mixed Desert and Thornscrub, Chihuahuan Sandy Plains Semi-Desert Grassland, Chihuahuan Stabilized Coppice Dune and Sand Flat Scrub, Madrean Encinal, Northwestern Great Plains-Black Hills Ponderosa Pine Woodland and Savanna), or with the inclusion of atypical environments such as a mountain range in a primarily grassland mapzone. These systems include Rocky Mountain Subalpine-Montane Limber-Bristlecone Pine Woodland, Southern Rocky Mountain Montane-Subalpine Grassland, and Inter-Mountain Basins Montane Sagebrush Steppe. Other undersampled systems are generally within this range, but are less common types, or simply have had inadequate sampling effort across this region. These include Central and South Texas Coastal Fringe Forest and Woodland, Edwards Plateau Mesic Canyon, Llano Uplift Acidic Forest-Woodland-Glade, Ozark-Ouachita Shortleaf Pine-Oak Forest and Woodland, Southeastern Great Plains Tallgrass Prairie, and West Gulf Coastal Plain Pine-Hardwood Forest.

Improvements #1 Auto-Key Results Summary Page 50
Table 19. Under-sampled types within GeoArea 6
EVT Code
EVT Name System elcode
total Plots
2503 Chihuahuan Loamy Plains Desert Grassland CES302.061 9
2051 Southern Rocky Mountain Dry-Mesic Montane Mixed Conifer Forest and Woodland
CES306.823 8
2504 Chihuahuan-Sonoran Desert Bottomland and Swale Grassland CES302.746 7
2410 Llano Uplift Acidic Forest-Woodland-Glade CES303.657 7
2064 Colorado Plateau Mixed Low Sagebrush Shrubland CES304.762 7
2371 West Gulf Coastal Plain Pine-Hardwood Forest CES203.378 5 2117 Southern Rocky Mountain Ponderosa Pine Savanna CES306.649 5
2179 Northwestern Great Plains-Black Hills Ponderosa Pine Woodland and Savanna
CES303.650 4
2341 Northwestern Great Plains Canyon CES303.658 4
2061 Inter-Mountain Basins Aspen-Mixed Conifer Forest and Woodland CES304.776 4
2338 Central and South Texas Coastal Fringe Forest and Woodland CES203.464 3 2423 Southeastern Great Plains Tallgrass Prairie CES205.685 3
2390 Tamaulipan Mixed Deciduous Thornscrub CES301.983 3
2100 Chihuahuan Mixed Desert and Thornscrub CES302.734 3
2133 Chihuahuan Sandy Plains Semi-Desert Grassland CES302.736 3 2150 Western Great Plains Tallgrass Prairie CES303.673 3
2050 Rocky Mountain Lodgepole Pine Forest CES306.820 2
2052 Southern Rocky Mountain Mesic Montane Mixed Conifer Forest and Woodland
CES306.825 2
2367 Ozark-Ouachita Shortleaf Pine-Oak Forest and Woodland CES202.313 1
2122 Chihuahuan Gypsophilous Grassland and Steppe CES302.732 1 2076 Chihuahuan Stabilized Coppice Dune and Sand Flat Scrub CES302.737 1
2524 Edwards Plateau Mesic Canyon CES303.038 1
2148 Western Great Plains Sand Prairie CES303.670 1
2153 Inter-Mountain Basins Greasewood Flat CES304.780 1 2126 Inter-Mountain Basins Montane Sagebrush Steppe CES304.785 1
2023 Madrean Encinal CES305.795 1
2057 Rocky Mountain Subalpine-Montane Limber-Bristlecone Pine Woodland
CES306.819 1
2146 Southern Rocky Mountain Montane-Subalpine Grassland CES306.824 1
2049 Rocky Mountain Foothill Limber Pine-Juniper Woodland CES306.955 1 A total of 4 types (or nearly 8% of 52 types) had >80% agreement between expert and auto-key assignments. All of these types (Western Great Plains Sandhill Steppe, Southern Rocky Mountain Juniper Woodland and Savanna, Southern Rocky Mountain Ponderosa Pine Woodland, and Western Great Plains Shortgrass Prairie) had at least 20 sample plots. Expert self-assessment of confidence for these types were predominantly ‘high’ although Southern Rocky Mountain Juniper Woodland and

Improvements #1 Auto-Key Results Summary Page 51
Savanna had nearly equal ‘high’ and ‘moderate’ attributions. This is largely because of transitional confusion between a tree savanna site and a grassland plot with scattered trees. Table 20 provides a summary of adequately-sampled types where agreement between expert and auto-key ranged from just below 80% down to zero. These types total 35, or nearly 47% of the total types assigned. Further analysis of those grouped within the 60-80% agreement range suggests subtleties within types that left the expert with greater or lesser confidence in their assignment. For example, some plots assigned by the auto-key to Edwards Plateau Dry-Mesic Slope Forest and Woodland were most frequently confused with Edwards Plateau Limestone Savanna and Woodland because differences in classification depend on dominance patterns within a group of shared species, some of which occur in the ground flora which tended to be poorly sampled in the available plot data. These types do transition into one another, so additional floristic indicators might be identified to better distinguish them. This same general pattern, one of carefully reviewing the dominant tree, shrub, or grass elements shared among related types, should be the focus of auto-key improvements for these types. Table 20. Summary of types with adequate samples where agreement between auto-key and expert was below 80%
Plots with Expert Matches
EVT Code EVT Name
System Elcode
Total Plots Total %
High conf
Med conf
Low conf
2519 East-Central Texas Plains Post Oak Savanna and Woodland
CES205.679 50 37 74% 2 21 14
2308 Crosstimbers Oak Forest and Woodland
CES205.682 50 36 72% 5 15 16
2132 Central Mixedgrass Prairie CES303.659 50 36 72% 8 25 3
2107 Rocky Mountain Gambel Oak-Mixed Montane Shrubland
CES306.818 14 10 71% 10 0 0
2383 Edwards Plateau Limestone Savanna and Woodland
CES303.660 50 34 68% 1 15 18
2095 Apacherian-Chihuahuan Mesquite Upland Scrub
CES302.733 45 29 64% 0 29 0
2081 Inter-Mountain Basins Mixed Salt Desert Scrub
CES304.784 15 9 60% 9 0 0
2523 Edwards Plateau Dry-Mesic Slope Forest and Woodland
CES303.656 50 29 58% 4 20 5
2059 Southern Rocky Mountain Pinyon-Juniper Woodland
CES306.835 50 26 52% 24 2 0
2393 Edwards Plateau Limestone Shrubland
CES303.041 12 2 17% 2 0 0
2111 Western Great Plains Mesquite Woodland and Shrubland
CES303.668 50 7 14% 2 5 0

Improvements #1 Auto-Key Results Summary Page 52
Plots with Expert Matches EVT Code EVT Name
System Elcode
Total Plots Total %
High conf
Med conf
Low conf
2086 Rocky Mountain Lower Montane-Foothill Shrubland
CES306.822 20 2 10% 2 0 0
2121 Apacherian-Chihuahuan Semi-Desert Grassland and Steppe
CES302.735 21 2 10% 0 2 0
2391 Tamaulipan Mesquite Upland Scrub
CES301.984 50 4 8% 0 0 4
2525 Edwards Plateau Riparian CES303.652 25 2 8% 0 0 2
2147 Western Great Plains Foothill and Piedmont Grassland
CES303.817 26 1 4% 1 0 0
2127 Inter-Mountain Basins Semi-Desert Shrub-Steppe
CES304.788 27 1 4% 0 0 1
2025 Madrean Pinyon-Juniper Woodland
CES305.797 50 0 0% 0 0 0
2055 Rocky Mountain Subalpine Dry-Mesic Spruce-Fir Forest and Woodland
CES306.828 17 0 0% 0 0 0
Analysis of the contingency table (Results Workbook) for these types with lesser levels of agreement reveals the many ongoing challenges with finding agreement between experts and auto-keys for complex vegetation types. Here we summarize results for selected systems in GeoArea 6: East-Central Texas Plains Post Oak Savanna and Woodland – low confidence in plot assignment was generally related to the low species diversity represented in the plot data. Crosstimbers Oak Forest and Woodland – low confidence in plot assignment was generally related to the low species diversity represented in the plot data. In addition, the species recorded or the photo indicated a disturbed condition. In one case, the species identification was questioned. Central Mixedgrass Prairie – was most often confused with Western Great Plains Shortgrass Prairie and Western Great Plains Foothill and Piedmont Grassland. There are several shared species between these systems and past grazing practices can influence composition and abundance of key species. For example, long-term heavy livestock grazing of Central Mixedgrass Prairie can reduce or eliminate indicator mid-grasses, leaving the site strongly dominated by grazing tolerant shortgrasses such as Bouteloua gracilis, which is characteristic of Western Great Plains Shortgrass Prairie. Western Great Plains Foothill and Piedmont Grassland is also characterized by mid-grasses, but these systems are typically geographically separate from each other (Central Plains versus Western Great Plains near the foothills). Clarifying geographic distribution may help with this one. Also, a better understanding of successional patterns under grazing pressure, and more complete species compositional data in the plots would help distinguish these types. Rocky Mountain Gambel Oak-Mixed Montane Shrubland – was most often confused with Western Great Plains Sandhill Steppe, so identification of oak species may be an issue.

Improvements #1 Auto-Key Results Summary Page 53
Edwards Plateau Limestone Savanna and Woodland – was most often confused with systems with which it interfingers. More complete species compositional data in the plots (more thorough data collection in the field) would help distinguish these types. Apacherian-Chihuahuan Mesquite Upland Scrub – was mostly confused with Western Great Plains Mesquite Woodland and Shrubland. Both systems are dominated by Prosopis glandulosa, and transition into one another as the Chihuahuan Desert grades into the Southern Great Plains. Refining geographic distribution of the auto-key and more complete species compositional data in the plots with Chihuahuan Desert indicator species would help distinguish these two types. An additional complexity is that mesquite, while a native species, is invasive in some over-grazed upland areas, making it difficuylt to distinguish if a plot is a degraded example of a grassland system, or represents a more “natural” mesquite upland area. Inter-Mountain Basins Mixed Salt Desert Scrub – was not consistently confused with any particular system. The Atriplex spp. that are characteristic of this systems also occur in other systems so more complete species compositional data in the plots would help distinguish these types (look for saline bottomland indicator species). Edwards Plateau Dry-Mesic Slope Forest and Woodland – was most often confused with systems with which it interfingers. More complete species compositional data in the plots (more thorough data collection in the field) would help distinguish these types. In several cases, the identification of recorded species was questioned. Southern Rocky Mountain Pinyon-Juniper Woodland – was frequently confused with the similar Southern Rocky Mountain Juniper Woodland and Savanna. Auto-key criteria and mis-labeled plots need to be reviewed to figure out how to better distinguish. The image clips were critical during expert review to determine if the plot is a juniper savanna or a more open area within a juniper woodland. This contextual information for the plot is vital and hard to replicate in the auto-key. Additionally, More complete species compositional data in the plots (more thorough data collection in the field) would help distinguish these types, as high cover of grasses is important for the savanna systems. Tamaulipan Mesquite Upland Scrub – a large number of these plots (44) were not assigned because in many cases the only species listed was Prosopis glandulosa. Since this species is often an off-site invader, it was difficult to assign these plots to a system. Western Great Plains Mesquite Woodland and Shrubland – a large number of these plots (31) were not assigned because in many cases the only species listed was Prosopis glandulosa. Since this species is often an off-site invader, and can dominate multiple systems, it was difficult to assign these plots to a system. Rocky Mountain Lower Montane-Foothill Shrubland – was most often confused with Western Great Plains Shortgrass Prairie and Western Great Plains Foothill and Piedmont Grassland. This system is often adjacent to these other systems and shareS many herbaceous species. Both of these grassland types may have some shrubs present so confusion may relate to amount of shrub cover needed to label to a shrubland system.

Improvements #1 Auto-Key Results Summary Page 54
Western Great Plains Foothill and Piedmont Grassland – was most often confused with Central Mixedgrass Prairie and Western Great Plains Shortgrass Prairie. Central Mixedgrass Prairie is also characterized by mid-grasses, but systems are typically geographically separate from each other (Central Plain versus Western Great Plains near the foothills). This system often transitions at lower elevations to Western Great Plains Shortgrass Prairie, and is differentiated by the abundance of midgrasses. There are several shared species between these systems and past grazing practices can influence specie composition and reduce the abundance of key midgrass species. Clarifying geographic distribution may help distinguish from Central Mixedgrass Prairie. More complete species compositional data in the plots (more thorough data collection in the field) would help distinguish these types. Inter-Mountain Basins Semi-Desert Shrub-Steppe – was most often confused with Western Great Plains Shortgrass Prairie. Review of sequence table to clarify that Western Great Plains Shortgrass Prairie may have also an open short shrub component composed of species of Ericameria, Eriogonum, Gutierrezia Krascheninnikovia, Lycium, or Opuntia, especially on disturbed sites. Madrean Pinyon-Juniper Woodland – was most often confused with Southern Rocky Mountain Juniper Woodland and Savanna and Southern Rocky Mountain Pinyon-Juniper Woodland. Madrean Pinyon-Juniper Woodland is uncommon in this GeoArea other than transition areas with Chihuahuan Desert. Refined geographic distribution information and more complete species compositional data in the plots (more thorough data collection in the field) would help distinguish these types. Rocky Mountain Subalpine Dry-Mesic Spruce-Fir Forest and Woodland – although these plots were codominated by Picea engelmannii, elevation was much too low. According to photos, some plots could be mesic or riparian so the spruce might be mis-identified Picea pungens, or the acronym PIEN could also be a typo for Pinus engelmannii, a Madrean species.
Expert Assignments
As described in the methods section above, the expert reviewers worked directly in the expert attribution database (EADB). Since GeoArea 6 had over 2,000 plots to review, a systematic, efficient process for reviewing and labeling plots was required. The forms provided in the EADB allowed the reviewer to sort and filter on subsets of plots to select groups of them with similar characteristics. For instance, the reviewer could select all plots found within a particular USFS Section or MapZone, then select all plots dominated by graminoides, then sort alphabetically by the dominant and codominant species. The reviewer could also select all treed plots, then select all plots with the same dominant tree species (such as Quercus stellata), then sort by % cover of that species, from high to low. Error! Reference source not found. shows the main form in the EADB which has these data fields. Additional fields were provided from which to select or sort plots, such as elevation, aspect, slope, and total cover by lifeform in the plot. Once the reviewer had selected a subset of plots for reviewing, the next step was to select an individual plot to review and label. If the expert was working on treed plots first, then they had a further option of selecting the set of ecological systems from which to pick a label for the plots. This was accomplished via a filter on the NLCD land cover class applied to all systems (such as forest and woodland, shrubland, herbaceous, woody wetlands, and so on). For each plot, the expert reviewed environmental and geographic setting, as well as the floristic and vegetation structural characteristics of the plot. In many cases the expert could then assign an ecological system label with no further information. However, in some cases the reviewer might consult the

Improvements #1 Auto-Key Results Summary Page 55
descriptions for a group of similar ecological systems to clarify their understanding of differences in concept, geographic distribution, floristics, or structural characteristics. For example, in the transition zone between the southwestern portion of this GeoArea and the Chihuahuan Desert, labeling of grassland plots to a desert grassland system or a Great Plains grassland system requires an understanding of diagnostic species, floristic composition and geographic distribution of the systems in question. Complete species list is necessary to confidently distinguish these types. In cases like this, the determination of which system type to assign to the plot might require:
m) review of the image clip for the context of the plot n) review of where the plot was located geographically (USFS Subsections provide local scale
geographic location), to distinguish Western Great Plains from Central Great Plains or Chihuahuan Desert from Edwards Plateau,
o) consideration of topographic setting (e.g. north-facing slopes at lower elevations could support ponderosa pine woodlands),
p) consideration of any available height data for the plot (e.g. were the ponderosa pines all tall, apparently mature trees; or were they short),
q) careful consideration of the full floristic composition of the plot and cover for each species. r) awareness of possible errors in the plot data, such as mis-identification of oak or juniper species
by the field crews, unevenness in how the cover values were estimated in the field or converted into the LFRDB (e.g. cover for trees estimated by a person standing on the ground vs an aerial view of the plot).
Below are some examples of comments relevant to the above:
This plot appears to be a small patch of Junipers in opening surrounded by PJ woodland. It is possible that it is a disturbed CES303.817 Western Great Plains Foothill and Piedmont Grassland or CES306.822 Rocky Mountain Lower Montane-Foothill Shrubland. The image clip is critical to determine tree savanna from open woodland
Plot species list is incomplete. Plot photo shows Artemisia filifolia in foreground and Aristida sp. indicate similarities to CES303.671 Western Great Plains Sandhill Steppe
Incomplete species list, Jumiper cover in photo is very low<5% not 10% so not savanna.
Substrate information would improve assignment confidence.
Significant cover of suffrutescent /dwarf-shrubs such as Gutierrezia sarothrae, Krascheninnikovia lanata, Yucca glauca and Artemisia frigida is included in concept of shortgrass steppe/prairie.
This diverse plot is more similar to CES302.735 Apacherian-Chihuahuan Semi-Desert Grassland and Steppe than Western Great Plains Shortgrass Prairie. The desert grasslands extends up north into the Pecos Valley and then transitions to the CES303.672 Western Great Plains Shortgrass Prairie in the plains.
Scattered PJ trees near bottom of canyon as indicated by relatively mesic Juniperus scopulorum. No other species reported so likely bare rock dominates ground surface. Could also be assigned to the Southwestern Canyons.
Landform and hydrology information would improve confidence in assignment.
If plot in far southern part of subsection MZ 27, then it could be desert scrub such as Apacherian-Chihuahuan Mesquite Upland Scrub or Western Great Plains Mesquite Woodland and Shrubland.
Plot photo shows plot is in a transition zone between CES306.834 Southern Rocky Mountain Juniper Woodland and Savanna and CES306.822 Rocky Mountain Lower Montane-Foothill Shrubland with widely scattered juniper trees (5%) in a very dense Cercocarpus montanus shrubland.

Improvements #1 Auto-Key Results Summary Page 56
Given all of the above, the reviewer had to make a decision for the plot, and assign an ecological system label. In cases where the assignment was not made with high confidence, the reviewer was requested to provide comments as to the factors they used to assign a label to the plot, or what the alternative assignment could be. Report Section 2.3 below discusses some of the results pertinent to confidence of assignment.
Improving the auto-key process
Of the 54 types assigned to plots by experts, 31 had fewer than 10 samples, so are excluded from this particular analysis. From the remaining 23 types, the numbers of samples labeled to a given type ranged from 114 (for Western Great Plains Shortgrass Prairie) down to 10 (for Inter-Mountain Basins Mixed Salt Desert Scrub). For 27 (50%) of these types, experts reported moderate confidence in their labels for at least 20% of the type’s plots and 11 indicated low confidence for at least 20% of the type’s plots. These statistics are listed in the Results Workbook. A small sampling of expert comments related to moderate or low confidence plots are included in Table 6. Table 21. A selection of expert comments related to labeling sample plots for types where their confidence was reported as moderate or low
Type Name Expert Comment Edwards Plateau Limestone Savanna and Woodland
Could also be CES303.651 Edwards Plateau Floodplain
Southeastern Great Plains Riparian Forest
Vegetation supports this assignment, but photo does not indicate a creek
Crosstimbers Oak Forest and Woodland
Seems disturbed with a depauperate species list
Southeastern Great Plains Floodplain Forest
Could also be Southeastern Great Plains Riparian Forest
Llano Uplift Acidic Forest, Woodland and Glade
Limited species information makes attribution difficult
Ozark-Ouachita Dry-Mesic Oak Forest
CES202.707 Ozark-Ouachita Dry Oak Woodland might be a better choice
Llano Estacado Caprock Escarpment and Breaks Shrubland and Steppe
Questionable species id
These and other comments point to several important aspects for consideration. First, some ecological systems concepts are better known and understood than others. Therefore, a certain degree of classification refinement is likely needed in order to improve auto-keys. This is perhaps most likely with desert scrub and related vegetation shared with northern Mexico. Second, the inclusion of some limited landform, soil, and or landscape context information could assist with some determinations within the key, or by a subsequent expert reviewer. Similarly, repeated references to photos further indicates the need for expert review of many types where moderate-low confidence of experts suggest that auto-keys might be prone to error. Third, additional floristic information is cited in some cases where their suspected limitations provide the primary source of expert uncertainty in labeling. Other samples were labeled by auto-keys to aggregates of multiple ecological system types. This was because LANDFIRE had mapping objectives focused on uplands where fire regimes are prevalent. That

Improvements #1 Auto-Key Results Summary Page 57
meant that many individual wetland and sparsely-vegetated ecological system types were not treated within the auto-keys. Expert labeling of these samples, however, provides an indication of the feasibility of their inclusion in updated auto-keys. Of 228 samples, experts were able to assign 159 (70%) to an individual ecological system type; a total of 17 individual ecological system types were assigned to these samples. The ability to assign plots to wetland and riparian systems would be expected to increase if more information on landform, soil, and or landscape context could be provided, as suggested above. The riparian systems groups are labeled to individual system with greater accuracy than the sparsely vegetated system groups in this GeoArea. Sparsely vegetated systems have low vegetation cover, variable species composition, and are often defined more based on substrate (e.g., sand dunes, rock outcrop) which is not currently used in the auto-key. This result indicates the potential for inclusion of these types within subsequent mapping efforts. We cannot yet comment on the issues associated including these types within future regional auto-keys, but this appears to be an issue worthy of exploration. Another set of samples did not contain enough information for the auto-keys to assign a system or system aggregate; these samples were labeled with broad "unclassified" types, such as "Unclassified Shrubland" or "None". Of 137 samples, experts were able to assign 70 (51%) to an individual ecological system type; a total of 20 individual ecological system types were assigned to these samples.
GeoArea 7E
GeoArea 7E encompasses the southern, central and northern Appalachian, Blue Ridge, Piedmont, High Allegheny Plateau ecoregions. This GeoArea includes a total of 9 map zones (54, 57, 59, 60, 61, 63, 64, 65, 66; Error! Reference source not found.) originally clustered for purposes of designing and implementing auto-keys. The total number of plots in this Geo Area analysis was 1,713. A total of 35 natural ecological system types were assigned to a total of 1,233 plots by the auto-keys. A total of 71 system types were assigned by experts (i.e., these included individual types that had been aggregated to broader classes by LANDFIRE for either sparsely vegetated or wetland/riparian types). An additional 17 types were assigned by the auto-key but were not assigned by experts, including 3 standard systems:
Acadian-Appalachian Subalpine Woodland and Heath-Krummholz
Central Appalachian Alkaline Glade and Woodland
Eastern Serpentine Woodland
and 14 broader groups of systems ("aggregates"):
Boreal Acidic Peatland Systems
Central Interior and Appalachian Floodplain Systems
Central Interior and Appalachian Riparian Systems
Central Interior and Appalachian Sparsely Vegetated Systems
Central Interior and Appalachian Swamp Systems
Gulf and Atlantic Coastal Plain Floodplain Systems
Gulf and Atlantic Coastal Plain Small Stream Riparian Systems
Gulf and Atlantic Coastal Plain Sparsely Vegetated Systems
Gulf and Atlantic Coastal Plain Swamp Systems
Gulf and Atlantic Coastal Plain Tidal Marsh Systems
Laurentian-Acadian Floodplain Systems

Improvements #1 Auto-Key Results Summary Page 58
Laurentian-Acadian Shrub-Herbaceous Wetland Systems
Laurentian-Acadian Sparsely Vegetated Systems
Laurentian-Acadian Swamp Systems
Comparison of Auto-key and Expert Assignments
Of the 35 natural types assigned labels by the auto-keys, 9 types (26%) had fewer than 10 samples available for this analysis (Table 4). Seven of these undersampled types are relatively uncommon and occur naturally in small patches rarely exceeding a few hundred acres in extent: Central Appalachian Alkaline Glade and Woodland [n=8]; Southern Appalachian Grass and Shrub Bald [n=6]; Northern Atlantic Coastal Plain Maritime Forest [n=6]; Northern Atlantic Coastal Plain Dune and Swale [n=4]; Eastern Serpentine Woodland [n=2]; Acadian-Appalachian Subalpine Woodland and Heath-Krummholz [n=1]; and Northeastern Interior Pine Barrens [n=1]. The remaining two types are at the edge of their range in this GeoArea: Southern Atlantic Coastal Plain Nonriverine Swamp and Wet Hardwood Forest [n=7], and Southern Atlantic Coastal Plain Dry and Dry-Mesic Oak Forest [n=5]. These under-sampled types were excluded from further analysis. Table 22. Under-sampled types within GeoArea 7E
EVT Code
EVT Name System elcode
total Plots
2400 Central Appalachian Alkaline Glade and Woodland CES202.602 8
2501 Southern Atlantic Coastal Plain Nonriverine Swamp and Wet Hardwood Forest
CES203.304 7
2414 Southern Appalachian Grass and Shrub Bald CES202.294 6
2379 Northern Atlantic Coastal Plain Maritime Forest CES203.302 6
2335 Southern Atlantic Coastal Plain Dry and Dry-Mesic Oak Forest CES203.241 5 2436 Northern Atlantic Coastal Plain Dune and Swale CES203.264 4
2375 Eastern Serpentine Woodland CES202.347 2
2389 Acadian-Appalachian Subalpine Woodland and Heath-Krummholz CES201.568 1
2354 Northeastern Interior Pine Barrens CES202.590 1 A total of 2 types having more than 20 sample plots (or nearly 6% of 35 types) had >80% agreement between expert and auto-key assignments. These types were Southeastern Interior Longleaf Pine Woodland [n=24; 88% agreement between expert and auto-key assignment] and Northern Atlantic Coastal Plain Pitch Pine Barrens [n=49; 84% agreement]. Self-assessments of confidence for these types were predominantly ‘high’ or ‘moderate’. Table 23 provides a summary of adequately-sampled types where agreement between expert and auto-key ranged from just below 80% down to zero. These types total 24, or nearly 69% of the total types assigned. Analysis of the contingency table (Results Workbook) for these types with lesser levels of agreement reveals the many ongoing challenges with finding agreement between experts and auto-keys for complex vegetation types. It appears, however, that the greatest percentage of errors occurred among floristically similar groups in areas of geographic transition. In only XXX systems were there no apparent floristic similarity between the assignments when they did not agree. Here we summarize a cross-section of results from GeoArea 7.

Improvements #1 Auto-Key Results Summary Page 59
There was 72% (36 of 50 plots) where the expert assignment and the auto-key matched for the Southern Appalachian Oak Forest. The experts had high confidence in their assignments for 82% of the plots, and indicated that they used oaks species composition and elevation to label their plots. Of the 14 mis-matches, 6 had been labeled as Southern Appalachian Cove Forest, 3 as Southern Appalachian Low Elevation Pine, and 2 as Allegheny-Cumberland Dry Oak Forest and Woodland. Agreement in the Southern Piedmont Dry Oak Forest was 69% (35 of 50 plots). The experts were highly confident in their assignment for 80% of the plots and identified species composition as a major indicator of the system. Experts labeled 4 of the 15 mismatched plots as Southern Piedmont Mesic Forest, 4 plots as Southern Appalachian Oak Forest and 2 plots as Southern Appalachian Low Elevation Pine Forest. The experts were likely to be incorporating specific species in calling mesic forest and on the ecoregional and elevation information on labeling the Southern Appalachian types. Those systems primarily characterized by dry-site oaks were confused with each other. Significant numbers of plots assigned by the auto-key to Central Appalachian Dry Oak-Pine Forest were assigned to either Allegheny-Cumberland Dry Oak Forest and Woodland (n=22]; Northeastern Interior Dry-Mesic Oak Forest [n=24]; or Central Appalachian Pine-Oak Rocky Woodland [n=21] by expert attribution. Only 5% of plots assigned by experts were not either high or medium confidence. All three forested types are characterized by widespread oak species such as white oak (Quercus alba) or chestnut oak (Quercus prinus), but have different geographic ranges. Central Appalachian Pine -Oak Rocky Woodland shares many of the same characteristic tree species but has an open canopy and a steeper environmental setting. Reviewer comments indicated that in some cases, assignment could be equally applied to two floristically related systems, and that sufficient species information for high confidence was lacking. Experts used subsection of occurrence to discriminate in geographic transition areas, and where the subsection spanned two related types, confidence in assignment was lower. Floristically related spruce-fir and northern hardwood systems of the central and southern Appalachians were also confused with each other. For example, a number of Central and Southern Appalachian Spruce-Fir Forest plots were erroneously identified as Southern Appalachian Northern Hardwood Forest or Appalachian (Hemlock)-Northern Hardwood Forest by the auto-key. A significant number of plots [n=27] auto-keyed to South-Central Interior Mesophytic Forest were assigned to Appalachian (Hemlock)-Northern Hardwood Forest by experts. This is likely because both systems share characteristic species such as sugar maple (Acer saccharum), beech (Fagus grandifolia),and hemlock (Tsuga canadensis). Expert confidence in attributions to Appalachian (Hemlock)-Northern Hardwood Forest indicates a higher degree of uncertainty. A similar pattern was noted in northern analogs of spruce-fir and northern hardwood systems: a number of plots keyed as Acadian Low-Elevation Spruce-Fir-Hardwood Forest were assigned to Acadian-Appalachian Montane Spruce-Fir Forest by experts. Discrepancies were also noted between low-elevation and montane spruce-fir systems; 9 plots assigned by auto-key to Acadian-Appalachian Montane Spruce-Fir Forest were attributed to Acadian Low-Elevation Spruce-Fir-Hardwood Forest by experts. It’s possible these disagreements have to do with the elevation rules used in the auto-keys within the GeoArea versus a more local-scale elevation break that the expert reviewer may have used (perhaps even adjusting for latitude). Discrepancies between auto-key and expert attribution were also common in coastal plain hardwood systems. The auto-key and experts agreed on the assignment of 19 plots to the Northern Atlantic Coastal Plain Hardwood Forest, but experts attributed an additional 31 plots to this type that had been

Improvements #1 Auto-Key Results Summary Page 60
auto-keyed to Southern Atlantic Coastal Plain Mesic Hardwood Forest. These two systems are described as overlapping in the coastal plain with GeoArea7E. It is likely the experts relied heavily on biogeography in addition to species composition, while the 2 sequence tables drafted for this GeoArea relied more on species composition. It’s possible that the expert assigning the plots had a different understanding of the ranges of the two types than had been initially incorporated in the sequence table. North-Central Interior Wet Flatwoods showed 27% agreement (4 of the 15 plots). This system has little floristic similarity to other systems, so errors were caused by other factors. A high proportion of the total number of plots (9 out of 15) could not be assigned due to lack of information; experts had medium confidence in most of the plots assigned, but confidence was not high in any of the assignments. Three of the plots that could not be assigned had attributed by the auto-key to an aggregated wetland system (Central Interior and Appalachian Swamp Systems, Laurentian-Acadian Floodplain Systems, and Gulf and Atlantic Coastal Plain Swamp Systems). Two of the plots that had been assigned to a single system had been assigned by experts to two different upland types. With so few plots finding patterns in the disagreement is a challenge and each of the plots should be explored to help identify potential refinements in characterizing this small patch partially isolated wetland system. Southern Ridge and Valley / Cumberland Dry Calcareous Forest showed little agreement (14%) with 30 of the 37 plots being assigned by experts to five different systems (South Central Interior Mesophytic Forest (5 plots), Appalachian (Hemlock)-Northern Hardwood Forest (1 plot), Allegheny-Cumberland Dry Oak Forest and Woodland (7 plots), Central Appalachian Dry Oak-Pine Forest (3 plots), Northeastern Interior Dry-Mesic Oak Forest (12 plots), Southern Appalachian Oak Forest (2 plots). The remaining two mismatched plots were labeled can’t assign and “other”. The experts actually only labeled 6 plots as the Southern Ridge and Valley/ Cumberland Dry Calcareous Forest and when they did they had high confidence (83% ). It is likely the sequence table was labeled plots as this system because species composition is similar across a variety of systems in the GeoArea with biographic boundaries constraining the concept. If the sequence table drafted for the entire GeoArea did not take into account ecoregional boundaries that could explain the low agreement and the assignment by experts to a diversity of systems. Table 23. Summary of types with adequate samples where agreement between auto-key and expert was below 80%
Plots with Expert Matches
EVT Code
EVT Name System elcode
Total Plots
Total % High conf
Med conf
Low conf
2315 Southern Appalachian Oak Forest
CES202.886 50 36 72% 28 5 3
2368 Southern Piedmont Dry Oak(-Pine) Forest
CES202.339 50 35 70% 29 6 0
2369 Central Appalachian Dry Oak-Pine Forest
CES202.591 50 33 66% 16 17 0
2350 Central and Southern Appalachian Spruce-Fir Forest
CES202.028 45 28 62% 27 0 1
2302 Laurentian-Acadian Northern Hardwoods Forest
CES201.564 50 31 62% 11 18 2

Improvements #1 Auto-Key Results Summary Page 61
Plots with Expert Matches EVT Code
EVT Name System elcode
Total Plots
Total % High conf
Med conf
Low conf
2374 Acadian-Appalachian Montane Spruce-Fir Forest
CES201.566 50 29 58% 19 9 1
2370 Appalachian (Hemlock)-Northern Hardwood Forest
CES202.593 51 28 55% 6 14 8
2373 Acadian Low-Elevation Spruce-Fir-Hardwood Forest
CES201.565 50 26 52% 0 26 0
2318 Southern and Central Appalachian Cove Forest
CES202.373 50 26 52% 17 9 0
2303 Northeastern Interior Dry-Mesic Oak Forest
CES202.592 48 19 40% 5 11 3
2324 Northern Atlantic Coastal Plain Hardwood Forest
CES203.475 51 19 37% 7 11 1
2309 Southern Appalachian Northern Hardwood Forest
CES202.029 27 10 37% 6 4 0
2353 Southern Appalachian Low-Elevation Pine Forest
CES202.332 50 16 32% 9 3 4
2366 Laurentian-Acadian Pine-Hemlock-Hardwood Forest
CES201.563 44 14 32% 2 12 0
2317 Allegheny-Cumberland Dry Oak Forest and Woodland
CES202.359 50 14 28% 10 4 0
2377 Central Appalachian Pine-Oak Rocky Woodland
CES202.600 50 14 28% 5 8 1
2518 North-Central Interior Wet Flatwoods
CES202.700 15 4 27% 0 4 0
2352 Southern Appalachian Montane Pine Forest and Woodland
CES202.331 50 12 24% 8 3 1
2320 Central and Southern Appalachian Montane Oak Forest
CES202.596 50 12 24% 7 4 1
2316 Southern Piedmont Mesic Forest
CES202.342 52 12 23% 9 3 0
2362 Laurentian-Acadian Northern Pine(-Oak) Forest
CES201.719 50 9 18% 1 5 3
2376 Southern Ridge and Valley/Cumberland Dry Calcareous Forest
CES202.457 37 5 14% 4 0 1
2321 South-Central Interior Mesophytic Forest
CES202.887 50 6 12% 0 6 0

Improvements #1 Auto-Key Results Summary Page 62
Plots with Expert Matches EVT Code
EVT Name System elcode
Total Plots
Total % High conf
Med conf
Low conf
2343 Southern Atlantic Coastal Plain Mesic Hardwood Forest
CES203.242 50 4 8% 1 3 0
Expert Assignments
As described in the methods section above, the expert reviewers worked directly in the expert attribution database (EADB). Since GeoArea 7E had over 2,000 plots to review, a systematic, efficient process for reviewing and labeling plots was required. The forms provided in the EADB allowed the reviewer to sort and filter on subsets of plots to select groups of them with similar characteristics. For instance, the reviewer could select all plots found within a particular USFS Section or MapZone, then select all plots dominated by trees, then sort alphabetically by the dominant species. The reviewer could also select all treed plots, then select all plots with the same dominant tree species (such as Pinus strobus), then sort by % cover of that species, from high to low. Error! Reference source not found. shows the main form in the EADB which has these data fields. Additional fields were provided from which to select or sort plots, such as elevation, aspect, slope, and total cover by lifeform in the plot. Once the reviewer had selected a subset of plots for reviewing, the next step was to select an individual plot to review and label. If the expert was working on treed plots first, then they had a further option of selecting the set of ecological systems from which to pick a label for the plots. This was accomplished via a filter on the NLCD land cover class applied to all systems (such as forest and woodland, shrubland, herbaceous, woody wetlands, and so on). For each plot, the expert reviewed environmental and geographic setting, as well as the floristic and vegetation structural characteristics of the plot. In many cases the expert could then assign an ecological system label with no further information. However, in some cases the reviewer might consult the descriptions for a group of similar ecological systems to clarify their understanding of differences in concept, geographic distribution, floristics, or structural characteristics. For example, in the northern Appalachian and sub-boreal region of the northeast, transitions from northern hardwoods to spruce-fir forests occur. In these areas, the tree canopy might be a mix of beech, sugar maple, yellow birch, red spruce, white pine, hemlock, paper birch, and balsam fir, often with little variation in tree canopy cover. In these cases, the reviewer would encounter plots of mixed composition, and need to determine whether those plots representedAcadian Low-Elevation Spruce-Fir-Hardwood Forest, Laurentian-Acadian Pine-Hemlock-Hardwood Forest, Laurentian-Acadian Northern Hardwoods Forest, Acadian Low-Elevation Spruce-Fir-Hardwood Forest, Acadian-Appalachian Subalpine Woodland and Heath-Krummholz, Northern Appalachian-Acadian Conifer-Hardwood Acidic Swamp, or Acadian-Appalachian Montane Spruce-Fir Forest. In cases like this, the determination of which system type to assign to the plot might require:
s) review of the image clip for the context of the plot, t) review of where the plot was located geographically (USFS Subsections provide local scale
geographic location), to distinguish Acadian vs. Appalachian systems u) consideration of topographic setting (e.g. highest elevations near summits support woodlands
and Krummholz; valley bottoms and topographic depressions support swamps or spruce flats ),

Improvements #1 Auto-Key Results Summary Page 63
v) consideration of any available height data for the plot (e.g. were the conifers tall, apparently mature trees; or were they short and stunted),
w) careful consideration of the full floristic composition of the plot and cover for each species. x) awareness of possible errors in the plot data, such as mis-identification of spruce species by the
field crews, unevenness in how the cover values were estimated in the field or converted into the LFRDB (e.g. cover for trees estimated by a person standing on the ground vs. an aerial view of the plot).
Below are some examples of comments relevant to the above spruce – fir and northern hardwood example:
Near absence of species composition data, however the two co-dominants, the elevation, and subsection of occurrence suggest this is a northern hardwood forest
This could also be a hemlock swamp; wetland status unknown
Difficult to determine whether this is a wetland or not. Also, elevation of 1500 feet is close to the transition between montane and lowland
somewhat sloping and has a small amount of Larix, so wetland status is questionable.
hemlock not present in plot and land use not known; could be recovering pine plantation
successional? Near altered land, Fraxinus abundant
steep slope and relatively high elevation
Subsection of occurrence, elevation and presence of Abies
Given all of the above, the reviewer had to make a decision for the plot, and assign an ecological system label. In cases where the assignment was not made with high confidence, the reviewer was requested to provide comments as to the factors they used to assign a label to the plot, or what the alternative assignment could be. Report Section 2.3 below discusses some of the results pertinent to confidence of assignment.
Improving the auto-key process
Of the 71 types assigned to plots by experts, 37 had fewer than 10 samples, so are excluded from this particular analysis. From the remaining 34 types, the numbers of samples labeled to a given type ranged from 152 (Central Appalachian Dry Oak-Pine Forest) down to 10 (Northern Atlantic Coastal Plain Dune and Swale). For 35 (95%) of these types, experts reported moderate confidence in their labels for at least 20% of the type’s plots. None indicated low confidence for at least 20% of the type’s plots. These statistics are listed in the Results Workbook. A small sampling of expert comments related to moderate or low confidence plots are included in Table 6. Table 24. A selection of expert comments related to labeling sample plots for types where their confidence was reported as moderate or low
Type Name Expert Comment
Appalachian (Hemlock)-Northern Hardwood Forest
Sounds like a transitional plot, not much to choose from.
Laurentian-Acadian Northern Hardwoods Forest
Seems early successional, disturbed area.
Southern Appalachian Oak Forest Species mix describe in this type, but oaks not dominating.
Northeastern Interior Dry-Mesic Oak Forest
Appears to be transitional to Central Appalachian Dry Oak - Pine Forest

Improvements #1 Auto-Key Results Summary Page 64
Type Name Expert Comment Southern and Central Appalachian Cove Forest
This is pretty high ~3500 feet, so is close to CES202.029
Laurentian-Acadian Pine-Hemlock-Hardwood Forest
Could also be low-elevation spruce fir forest
These and other comments point to several important aspects for consideration. First, some ecological systems concepts are better known and understood than others. Therefore, a certain degree of classification refinement is likely needed in order to improve auto-keys. Second, the inclusion of some limited landform, soil, wetland status, and/or landscape context information could greatly assist with some determinations within the key, or by a subsequent expert reviewer. For example, spruce flats and acidic swamps share the same canopy dominants with several upland systems in the Acadian / Appalachian regions, and topographic position, wetland status, or soil type could easily improve auto-key results. Aerial photos can provide some additional information where the tree canopy is at least partially open, or the photography was taken under leaf-off conditions. In the heavily forested northeast, many of the photos were taken during the growing season and appeared as a solid green mat, providing little to no additional information. Third, additional floristic information is cited in some cases where their suspected limitations provide the primary source of expert uncertainty in labeling. Other samples were labeled by auto-keys to aggregates of multiple ecological system types. This was because LANDFIRE had mapping objectives focused on uplands where fire regimes are prevalent. That meant that many individual wetland and sparsely-vegetated ecological system types were not treated within the auto-keys. Expert labeling of these samples, however, provides an indication of the feasibility of their inclusion in updated auto-keys. Of 438 samples, experts were able to assign 306 (70%) to an individual ecological system type; a total of 49 individual ecological system types were assigned to these samples. This result indicates the potential for inclusion of these types within subsequent mapping efforts. We cannot yet comment on the issues associated including these types within future regional auto-keys, but this appears to be an issue worthy of exploration. Another set of samples did not contain enough information for the auto-keys to assign a system or system aggregate; these samples were labeled with broad "unclassified" types, such as "Unclassified Grassland" or "None". Of 42 samples, experts were able to assign 18 (43%) to an individual ecological system type; a total of 12 individual ecological system types were assigned to these samples.
GeoArea 7W
GeoArea 7W encompasses 10 map zones (Error! Reference source not found.): Northern Lake Country (41), Ozark Highlands (44), Appalachia Bluegrass Hills (47), Cumberland Highlands (48), Central Till Plains (49), Central Great Lakes Uplands (50), Great Lakes Plains (51), Eastern Till Plains (52), Appalachia (53), and Allegheny Plateau (62). These map zones were originally clustered for purposes of designing and implementing auto-keys (Error! Reference source not found.). The total number of plots in this Geo Area analysis was 1,908. A total of 43 natural ecological system types were assigned to a total of 1,403 plots by the auto-keys. A total of 69 system types were assigned by experts (i.e., these included individual types that had been aggregated to broader classes by LANDFIRE for either sparsely vegetated types or wetland/riparian types).

Improvements #1 Auto-Key Results Summary Page 65
An additional 11 types were assigned by the auto-key but were not assigned by experts:
Crosstimbers Oak Forest and Woodland
Lower Mississippi River Dune Woodland and Forest
Mississippi Delta Maritime Forest
Southern Atlantic Coastal Plain Dune and Maritime Grassland
Texas Saline Coastal Prairie
Texas-Louisiana Coastal Prairie Pondshore
Caribbean Swamp Systems
Gulf and Atlantic Coastal Plain Floodplain Systems
Gulf and Atlantic Coastal Plain Small Stream Riparian Systems
Gulf and Atlantic Coastal Plain Swamp Systems
Gulf and Atlantic Coastal Plain Tidal Marsh Systems The first type is possibly in the GeoArea. The next five types do not occur in GeoArea 7W and should not be attributed in it. The final five types are aggregates of individual Systems used by Landfire for mapping. The expert reviewers attributed sites to individual Systems and so would not have used these units in their review process.
Comparison of Auto-key and Expert Assignments
Of the 43 natural types assigned labels by the auto-keys, 10 types (23%) had fewer than 10 samples available for this analysis (Table 4). Six of these types are probably truly rare in the GeoArea either because it is on the edge of their geographic range, because they are uncommon types throughout their range, or both. The East Gulf Coastal Plain Northern Loess Plain Oak-Hickory Upland, West Gulf Coastal Plain Nonriverine Wet Hardwood Flatwoods, Southeastern Interior Longleaf Pine Woodland, West Gulf Coastal Plain Pine-Hardwood Flatwoods, South-Central Interior/Upper Coastal Plain Wet Flatwoods, and North-Central Interior Oak Savanna types fit one or both of these criteria. The other four types - Great Lakes Wooded Dune and Swale, South-Central Interior/Upper Coastal Plain Flatwoods, Central Appalachian Alkaline Glade and Woodland, and Paleozoic Plateau Bluff and Talus are not abundant in the GeoArea but are probably underrepresented in the data compared to their abundance in the GeoArea. Table 25. Under-sampled types within GeoArea 7W
EVT Code
EVT Name System elcode
total Plots
2306 East Gulf Coastal Plain Northern Loess Plain Oak-Hickory Upland CES203.482 9
2466 Great Lakes Wooded Dune and Swale CES201.726 8
2326 South-Central Interior/Upper Coastal Plain Flatwoods CES203.479 8
2506 West Gulf Coastal Plain Nonriverine Wet Hardwood Flatwoods CES203.548 7
2351 Southeastern Interior Longleaf Pine Woodland CES202.319 5
2458 West Gulf Coastal Plain Pine-Hardwood Flatwoods CES203.278 5 2457 South-Central Interior/Upper Coastal Plain Wet Flatwoods CES203.480 5
2400 Central Appalachian Alkaline Glade and Woodland CES202.602 3
2517 Paleozoic Plateau Bluff and Talus CES202.704 3
2394 North-Central Interior Oak Savanna CES202.698 1

Improvements #1 Auto-Key Results Summary Page 66
A total of 4 types (9% of 43 types) had >80% agreement between expert and auto-key assignments. All of these types had at least 10 sample plots. Expert self-assessment of confidence for these types was predominantly ‘high’ although Laurentian-Acadian Alkaline Conifer-Hardwood Swamp resulted more in ‘moderate’ and ‘low’ confidence levels. This type is very common in the northern Great Lakes states and northeastern US but can be difficult to attribute confidently based only on overstory data. Two common overstory species, northern white-cedar (Thuja occidentalis) and red maple (Acer rubrum), can also dominate in upland forests so hydrology, soil, or understory data are needed to confidently assign sites to this type. Table 26 provides a summary of adequately-sampled types where agreement between expert and auto-key ranged from just below 80% down to zero. These types total 29, or 67% of the total types assigned. Analysis of the nature of the disagreements between expert and auto-key attribution reveals some of the sources of these disagreements and suggests some methods to help reduce these in the future. The following are some specific examples of levels of disagreement and possible explanations based on interpretations from the contingency table. Four common types had 66%-75% agreement. Three of these - North-Central Interior Dry-Mesic Oak Forest and Woodland, Southern Interior Low Plateau Dry-Mesic Oak Forest, and Laurentian-Acadian Northern Pine(-Oak) Forest - were most often confused with floristically similar types based on the apparent abundance of dominant species (oaks or pines). North-Central Interior Beech-Maple Forest was most often confused with a similar type that replaces it to the south – South-Central Interior Mesophytic Forest. Allegheny-Cumberland Dry Oak Forest and Woodland – Fifteen sites (30%) auto-keyed to this type were called Northeastern Interior Dry-Mesic Oak Forest by experts. These are very similar types distinguished primarily by the abundance of oaks favoring dry conditions versus dry-mesic conditions but there is significant overlap in the component species. North-Central Interior Wet Flatwoods – Thirty sites were auto-keyed to this type and experts disagreed on 13 sites. Nine of these were listed as “Can’t assign” or “Other”; designations that were used indicate not enough data to assign the type or that the site did not fit any natural System. The auto-key may have been too aggressive in assigning sites based on limited data and may have included non-natural sites. Laurentian-Acadian Northern Hardwoods Forest – This type was confused with several other upland forests though no single one was common. The most common confusion was with the “Can’t assign” or “Other” expert-assigned categories indicating not enough data to assign the type or that the site did not fit any natural System. The auto-key may have been too aggressive in assigning sites based on limited data and may have included non-natural sites. Northeastern Interior Dry-Mesic Oak Forest – This type was confused primarily with two others – South-Central Interior Mesophytic Forest (15 times or 30%) and Appalachian (Hemlock-) Northern Hardwood Forest (7 times or 14%). Confusions with these types are likely based on the relative abundance of oaks vs. other mesic trees. Ozark-Ouachita Dry Oak Woodland – Forty-four percent of the auto-keyed sites were assigned by experts to either Ozark-Ouachita Dry-Mesic Oak Forest (22%) or “Cant’ assign” (22%). The Ozark-

Improvements #1 Auto-Key Results Summary Page 67
Ouachita Dry-Mesic Forest and Ozark-Ouachita Dry Oak Woodland grade into each other and the difference can be based on slight differences in cover of oak species. South-Central Interior Mesophytic Forest – This type was confused with seven other types but most commonly with Southern Interior Low Plateau Dry-Mesic Oak Forest (25%). This is likely due to differences in the relative abundance of oak species. North-Central Interior Dry Oak Forest and Woodland – This type was commonly confused with North-Central Interior Dry-Mesic Oak Forest and Woodland (36%). These two types grade into each other and the difference can be based on slight differences in cover of different oak species. Ozark-Ouachita Dry-Mesic Oak Forest – This type was commonly (46%) confused with Ozark-Ouachita Dry Oak Woodland. These two types grade into each other and the difference can be based on slight changes in the cover of oak species. Laurentian-Acadian Pine-Hemlock-Hardwood Forest – Most of the sites (56%) auto-keyed to this type were assigned to Laurentian-Acadian Northern Hardwoods Forest. This confusion is likely based on interpretations of the relative abundance of pines and hemlock. Boreal White Spruce-Fir-Hardwood Forest – Forty percent of the sites auto-keyed to this type were assigned to either the Laurentian-Acadian Alkaline Conifer-Hardwood Swamp (20%) or “Can’t assign” (20%). The Laurentian-Acadian Alkaline Conifer-Hardwood Swamp can have a strong component of balsam fir (Abies balsamifera), red maple (Acer rubrum), and quaking aspen (Populus tremuloides) as does this type. Understory data or other information that would indicate wetlands versus uplands would help differentiate these types. North-Central Interior Maple-Basswood Forest – Thirty-eight percent of the sites auto-keyed to this type were classified as “Can’t assign” by the expert reviewer. Most of these were sites that appeared on the aerial photo as not natural types. Of the sites assigned to natural types by the expert, most (18%) were confused with North-Central Interior Dry-Mesic Forest and Woodland. These types grade into each other, particularly from North-Central Interior Dry-Mesic Forest and Woodland into North-Central Interior Maple-Basswood Forest in the absence of fire. Boreal Aspen-Birch Forest – This type was auto-keyed in areas it should not occur, areas outside the range of boreal types. Early successional sites in the northern Midwest are often dominated by quaking aspen (Populus tremuloides) or paper birch (Betula papyrifera) but sites must be in the boreal zone to fit this type. Thus, most sites auto-keyed to this type were assigned by experts to non-boreal types. A substantial number of auto-keyed sites (26%) were assigned by the expert to the “Can’t assign” category, indicating either not enough data were available or the site was not a natural type. Better delineation of the potential range of this type would improve the auto-key performance for this type. Eastern Boreal Floodplain – No sites auto-keyed to this type matched the expert attribution. This type can be difficult to distinguish from surrounding uplands based solely on overstory data. Understory or hydrology data would help to identify sites of this type. Central Interior Highlands Calcareous Glade and Barrens – All sites auto-keyed to this type were assigned by experts to upland forest and woodland types. Based solely on overstory characteristics, glades can easily be confused with dry or dry-mesic upland forests dominated by oaks. This can be seen

Improvements #1 Auto-Key Results Summary Page 68
in the fact that 67% of the sites auto-keyed to this type were assigned by experts to upland oak-dominated types. Aerial photos, understory data, and soils data could help clear up this confusion. Central Interior Highlands Dry Acidic Glade and Barrens – All 10 of the sites auto-keyed to this type were assigned by experts to the Ozark-Ouachita Shortleaf Pine-Oak Forest and Woodland. This acidic glade can be similar floristically to this type but aerial photos, soil information, and understory data would help solve this confusion. Table 26. Summary of types with adequate samples where agreement between auto-key and expert was below 80%
Plots with Expert Matches
EVT Code EVT Name
System Elcode
Total Plots Total %
High conf
Med conf
Low conf
2310 North-Central Interior Dry-Mesic Oak Forest and Woodland
CES202.046 50 37 74%
15 13 9
2305 Southern Interior Low Plateau Dry-Mesic Oak Forest
CES202.898 50 35 70%
29 5 1
2362 Laurentian-Acadian Northern Pine(-Oak) Forest
CES201.719 50 34 68%
9 9 16
2313 North-Central Interior Beech-Maple Forest
CES202.693 50 34 68%
10 12 12
2317 Allegheny-Cumberland Dry Oak Forest and Woodland
CES202.359 49 28 57%
20 7 1
2518 North-Central Interior Wet Flatwoods
CES202.700 30 17 57%
0 7 10
2302 Laurentian-Acadian Northern Hardwoods Forest
CES201.564 50 28 56%
11 6 11
2303 Northeastern Interior Dry-Mesic Oak Forest
CES202.592 50 22 44%
11 8 3
2364 Ozark-Ouachita Dry Oak Woodland
CES202.707 50 21 42%
11 7 3
2321 South-Central Interior Mesophytic Forest
CES202.887 50 20 40%
16 2 2
2311 North-Central Interior Dry Oak Forest and Woodland
CES202.047 50 18 36%
9 4 5
2304 Ozark-Ouachita Dry-Mesic Oak Forest
CES202.708 50 17 34%
13 3 1
2307 East Gulf Coastal Plain Northern Dry Upland Hardwood Forest
CES203.483 30 10 33%
10 0 0
2366 Laurentian-Acadian Pine-Hemlock-Hardwood Forest
CES201.563 50 15 30%
5 5 5

Improvements #1 Auto-Key Results Summary Page 69
Plots with Expert Matches
EVT Code EVT Name
System Elcode
Total Plots Total %
High conf
Med conf
Low conf
2365 Boreal White Spruce-Fir-Hardwood Forest
CES103.021 50 14 28%
2 1 11
2308 Crosstimbers Oak Forest and Woodland
CES205.682 15 3 20%
1 2 0
2314 North-Central Interior Maple-Basswood Forest
CES202.696 51 9 18%
2 6 1
2407 Laurentian Pine-Oak Barrens CES201.718 49 7 14%
1 3 3
2323 West Gulf Coastal Plain Mesic Hardwood Forest
CES203.280 47 6 13%
2 3 1
2301 Boreal Aspen-Birch Forest CES103.020 50 6 12%
0 0 6
2370 Appalachian (Hemlock-) Northern Hardwood Forest
CES202.593 50 6 12%
2 3 1
2334 Ozark-Ouachita Mesic Hardwood Forest
CES202.043 37 4 11%
3 1 0
2444 Eastern Boreal Floodplain CES103.588 50 0 0% 0 0 0
2315 Southern Appalachian Oak Forest
CES202.886 49 0 0% 0 0 0
2309 Southern Appalachian Northern Hardwood Forest
CES202.029 46 0 0% 0 0 0
2401 Central Interior Highlands Calcareous Glade and Barrens
CES202.691 24 0 0% 0 0 0
2344 Boreal Jack Pine-Black Spruce Forest
CES103.022 14 0 0% 0 0 0
2409 Great Lakes Alvar CES201.721 13 0 0% 0 0 0
2363 Central Interior Highlands Dry Acidic Glade and Barrens
CES202.692 10 0 0% 0 0 0
Expert Assignments
As described in the methods section above, the expert reviewers worked directly in the expert attribution database (EADB). Since GeoArea 7W had almost 2,000 plots to review, a systematic, efficient process for reviewing and labeling plots was required. The forms provided in the EADB allowed the reviewer to sort and filter on subsets of plots to select groups of them with similar characteristics. For instance, the reviewer could select all plots found within a particular USFS Section or MapZone, then select all plots dominated by trees, then sort alphabetically by the dominant species. The reviewer could also select all treed plots, then select all plots with the same dominant tree species (such as Pinus strobus), then sort by % cover of that species, from high to low. Error! Reference source not found. shows the main form in the EADB which has these data fields. Additional fields were provided from which to select or sort plots, such as elevation, aspect, slope, and total cover by lifeform in the plot.

Improvements #1 Auto-Key Results Summary Page 70
Once the reviewer had selected a subset of plots for reviewing, the next step was to select an individual plot to review and label. If the expert was working on treed plots first, then they had a further option of selecting the set of ecological systems from which to pick a label for the plots. This was accomplished via a filter on the NLCD land cover class applied to all systems (such as forest and woodland, shrubland, herbaceous, woody wetlands, and so on). For each plot, the expert reviewed environmental and geographic setting, as well as the floristic and vegetation structural characteristics of the plot. In many cases the expert could then assign an ecological system label with no further information. However, in some cases the reviewer might consult the descriptions for a group of similar ecological systems to clarify their understanding of differences in concept, geographic distribution, floristics, or structural characteristics. For example, in central, glaciated areas of this GeoArea, forests can transition from dry-mesic oak-dominated to mesic sugar maple-dominated. In these areas, the tree canopy could be a mix of white oak, red oak, and sugar maple in just about any combination. The reviewer would have to determine whether plots represented North-Central Interior Maple-Basswood Forest, North-Central Interior Beech-Maple Forest, or North-Central Interior Dry-Mesic Forest and Woodland. In cases like this, the determination of which system type to assign to the plot might require:
y) review of the image clip for the context of the plot, z) review of where the plot was located geographically (USFS Subsections provide local scale
geographic location), to distinguish North-Central Interior Beech-Maple Forest from North-Central Interior Maple-Basswood Forest.
aa) consideration of topographic setting (e.g. north-facing slopes indicate the more mesic maple-dominated types versus south-facing or steep slopes indicating the dry-mesic oak type)
bb) consideration of any available height data for the plot (e.g. a canopy of taller oaks over maples indicates the oak type, though in transition to one of the maple types),
cc) careful consideration of the full floristic composition of the plot and cover for each species. dd) awareness of possible errors in the plot data, such as mis-identification of oak species by the
field crews, unevenness in how the cover values were estimated in the field or converted into the LFRDB (e.g. cover for trees estimated by a person standing on the ground vs. an aerial view of the plot).
Below are some examples of comments relevant to the above example:
Composition is not typical (no Quercus spp.) and area looks disturbed on photo. Possibly not a natural System.
Not much Quercus spp. and this could be too dry for this System. Lots of disturbance nearby so this site could be a non-natural System, too.
Only Quercus macrocarpa is characteristic of this System. Other species not strongly characteristic but still fit moderately well.
Composition could fit this System or NCI Maple-Basswood Forest. Moderately steep SW-facing slope fits this Quercus-dominated System better.
This could also be one of the mesic maple systems; it is in the range for North Central Interior Beech Maple forest (look for Fagus in rest of polygon). Although unlikely, it is possible that it could be North Central Interior Maple Basswood Forest.
Almost enough Quercus spp. (particularly Q. muehlenbergii) to fit NCI Dry-Mesic Oak Forest and Woodland.

Improvements #1 Auto-Key Results Summary Page 71
Dominated by early successional trees but some trees characteristic of this System. Possibly too disturbed to be a natural System.
Little Quercus spp. present but Carya ovata can be part of this System. Site is likely quite disturbed and may not be a natural System.
Quercus ellipsoidalis tends to indicate a drier setting than this System but probably not enough Q. ellipsoidalis to make this not fit.
Mix of Acer saccharum and Quercus alba almost allow this to fit NCI Beech-Maple.
Area is near the border of the NCI Dry-Mesic Oak Forest and Woodland and Southern Interior Low Plateau Dry-Mesic Oak Forest but this Section should be just NCI Dry-Mesic Oak Forest and Woodland. Also, quite a bit of Acer saccharum for this System
Given all of the above, the reviewer had to make a decision for the plot, and assign an ecological system label. In cases where the assignment was not made with high confidence, the reviewer was requested to provide comments as to the factors they used to assign a label to the plot, or what the alternative assignment could be. Report Section 2.3 below discusses some of the results pertinent to confidence of assignment.
Improving the auto-key process
Of the 69 types assigned to plots by experts, 32 had fewer than 10 samples, so are excluded from this particular analysis. From the remaining 37 types, the numbers of samples labeled to a given type ranged from 143 (for Laurentian-Acadian Alkaline Conifer-Hardwood Swamp) down to 10 (for West Gulf Coastal Plain Small Stream and River Forest). For 34 (91%) of these types, experts reported at least moderate confidence in their labels for at least 20% of the type’s plots. 14 had low confidence for at least 20% of the type’s plots. These statistics are listed in the Results Workbook. A small sampling of expert comments related to moderate or low confidence plots are included in Table 6. Table 27. A selection of expert comments related to labeling sample plots for types where their confidence was reported as moderate or low
Type Name Expert Comment
Laurentian-Acadian Alkaline Conifer-Hardwood Swamp
This may be a seep or other wet area within larger Laurentian Acadian Northern Hardwood matrix
Laurentian-Acadian Northern Hardwoods Forest
Dominated by aspen-birch but not boreal, rather it is early successional.
Ozark-Ouachita Dry Oak Woodland Canopy coverage is high for this system
Boreal-Laurentian Conifer Acidic Swamp
This is a little out of range but seems best choice
North-Central Interior Wet Flatwoods
The composition matches this System but could also indicate a floodplain.
Boreal White Spruce-Fir-Hardwood Forest
This borders what appears to be wet area and could lean more towards Laurentian - Acadian Alkaline Hardwood Conifer Swamp
These and other comments point to several important aspects for consideration. First, some ecological systems concepts are better known and understood than others. Therefore, a certain degree of classification refinement is likely needed in order to improve auto-keys. For example, elucidating a brighter line between characteristics of the various dry-mesic and dry oak forests would help solve much

Improvements #1 Auto-Key Results Summary Page 72
of the confusion between those types. Second, the inclusion of some limited landform, soil, and/or landscape context information could assist with some determinations within the key, or by a subsequent expert reviewer. In this GeoArea there were many sites that were auto-keyed to a natural type but which the expert reviewer assigned to a non-natural type, often based on the aerial photograph. Small woodlots in an agricultural field, old fields with scattered tree regeneration, or fencerows might have overstory composition that fits a natural type but they are clearly ruderal or cultural based on their origin, size, and surroundings. Similarly, repeated references to photos further indicates the need for expert review of many types where moderate-low confidence of experts suggest that auto-keys might be prone to error. Third, additional floristic information is cited in some cases where their suspected limitations provide the primary source of expert uncertainty in labeling. Other samples were labeled by auto-keys to aggregates of multiple ecological system types. This was because LANDFIRE had mapping objectives focused on uplands where fire regimes are prevalent. That meant that many individual wetland and sparsely-vegetated ecological system types were not treated within the auto-keys. Expert labeling of these samples, however, provides an indication of the feasibility of their inclusion in updated auto-keys. Of 286 samples, experts were able to assign 261 (68%) to an individual ecological system type; a total of 36 individual ecological system types were assigned to these samples. This result indicates the potential for inclusion of these types within subsequent mapping efforts. We cannot yet comment on the issues associated including these types within future regional auto-keys, but this appears to be an issue worthy of exploration. Another set of samples did not contain enough information for the auto-keys to assign a system or system aggregate; these samples were labeled with broad "unclassified" types, such as "Unclassified Shrubland" or "None". Of 119 samples, experts were able to assign 40 (34%) to an individual ecological system type; a total of 18 individual ecological system types were assigned to these samples.
GeoArea 8 GeoArea 8 encompasses the entire state of Alaska (Map zones 67-78, Error! Reference source not found.). This GeoArea includes a total of 12 map zones originally clustered into 4 groups for purposes of designing and implementing auto-keys. The total number of plots in this Geo Area analysis was 1,454. A total of 73 natural ecological system types were assigned to a total of 1,454 plots by the auto-keys. A total of 93 systems were assigned by experts (i.e., these included individual types that had been aggregated to broader classes by LANDFIRE for either sparsely vegetated types or wetland/riparian types). An additional 12 types were assigned by the auto-key but were not assigned by experts. Those types included:
Alaska Arctic Floodplain
Alaska Arctic Large River Floodplain
Alaska Sub-boreal Avalanche Slope Shrubland
Alaskan Pacific Maritime Alpine Floodplain
Alaskan Pacific Maritime Coastal Meadow and Slough-Levee
Alaskan Pacific Maritime Mountain Hemlock Peatland
Aleutian Shrub-Sedge Peatland
Western North American Boreal Alpine Dwarf-Shrub Summit
Western North American Boreal Alpine Floodplain

Improvements #1 Auto-Key Results Summary Page 73
Western North American Boreal Lowland Large River Floodplain Forest and Shrubland
Western North American Boreal Montane Floodplain Forest and Shrubland
Western North American Boreal Shrub and Herbaceous Floodplain Wetland
Comparison of Auto-key and Expert Assignments
Of the 73 natural types assigned labels by the auto-keys, none were considered under-sampled (represented by <10 plots). A total of 10 types (or ~7% of 73 types) had >80% agreement between expert and auto-key assignments. All of these types had at least 20 sample plots. Expert self-assessment of confidence for these types were predominantly ‘high’ although Western North American Boreal Tussock Tundra had 5 plots which were considered to have ‘moderate’ confidence. Table 28. Under-sampled types within GeoArea 8
There are no under-sampled types within GeoArea 8.
Table 29 provides a summary of adequately-sampled types where agreement between expert and auto-key ranged from just below 80% down to zero. These types total 63, or nearly 86% of the total types assigned. Further analysis of those grouped within the 60-80% agreement range suggests subtleties within types that left the expert with greater or lesser confidence in their assignment. For example, some plots assigned by autokey were attributed to the Western North American Boreal White Spruce Forest were mistaken for Western North American Boreal White Spruce-Hardwood Forest. Another example was confusion between the Alaskan Pacific Maritime Periglacial Woodland and Shrubland and the other maritime forest systems, especially the Alaskan Pacific Maritime Sitka Spruce Forest and the Alaskan Pacific Maritime Floodplain Forest and Shrubland. All three of these have sitka spruce as a major component, but are distinguished by floodplain settings or by early successional status in areas of recent glacial melt. Clarification of floristics (between the floodplain type and the other 2), or how to distinguish primary successional areas for the periglacial type would help to improve the sequence table as well as expert understanding of the types. Many types do transition into one another, so additional floristic indicators might be identified to better distinguish them. This same general pattern, one of carefully reviewing the dominant tree, shrub, or grass elements shared among related types, should be the focus of auto-key improvements for these types. Table 29. Summary of types with adequate samples where agreement between auto-key and expert was below 80%
Plots with Expert Matches
EVT Code
EVT Name System elcode
Total Plots
Total % High conf
Med conf
Low conf
2178 North Pacific Hypermaritime Western Red-cedar-Western Hemlock Forest
CES204.842
20 15 75%
14 0 1
2611 Western North American Sub-boreal Mesic Bluejoint Meadow
CES105.114
20 14 70%
11 2 1

Improvements #1 Auto-Key Results Summary Page 74
Plots with Expert Matches EVT Code
EVT Name System elcode
Total Plots
Total % High conf
Med conf
Low conf
2648 Alaskan Pacific Maritime Mountain Hemlock Forest
CES204.142
20 14 70%
14 0 0
2644 Alaskan Pacific Maritime Sitka Spruce Forest
CES204.151
20 14 70%
11 1 2
2698 Alaska Arctic Wet Sedge Meadow
CES102.185
20 13 65%
5 5 3
2638 Alaska Arctic Mesic Alder Shrubland
CES104.168
20 13 65%
10 3 0
2604 Western North American Boreal Mesic Black Spruce Forest
CES105.107
20 13 65%
9 4 0
2650 Alaskan Pacific Maritime Periglacial Woodland and Shrubland
CES204.311
20 13 65%
13 0 0
2600 Western North American Boreal White Spruce Forest
CES105.104
20 12 60%
9 2 1
2679 Alaska Sub-boreal White Spruce-Hardwood Forest
CES105.136
20 12 60%
9 3 0
2689 Alaska Arctic Non-Acidic Dryas Dwarf-Shrubland
CES104.174
20 11 55%
10 0 1
2635 Western North American Boreal Alpine Ericaceous Dwarf-Shrubland
CES105.133
20 11 55%
9 1 1
2677 Alaska Sub-boreal White-Lutz Spruce Forest and Woodland
CES105.102
20 10 50%
9 1 0
2639 Alaska Arctic Mesic-Wet Willow Shrubland
CES104.169
16 8 50%
5 3 0
2610 Western North American Boreal Mesic Scrub Birch-Willow Shrubland
CES105.113
20 9 45%
6 0 3
2682 Alaska Arctic Scrub Birch-Ericaceous Shrubland
CES104.170
20 8 40%
7 0 1
2603 Western North American Boreal White Spruce-Hardwood Forest
CES105.106
20 8 40%
8 0 0
2040 North Pacific Mesic Western Hemlock-Yellow-cedar Forest
CES204.843
20 8 40%
8 0 0
2693 Alaska Arctic Shrub-Tussock Tundra
CES102.180
20 7 35%
6 1 0
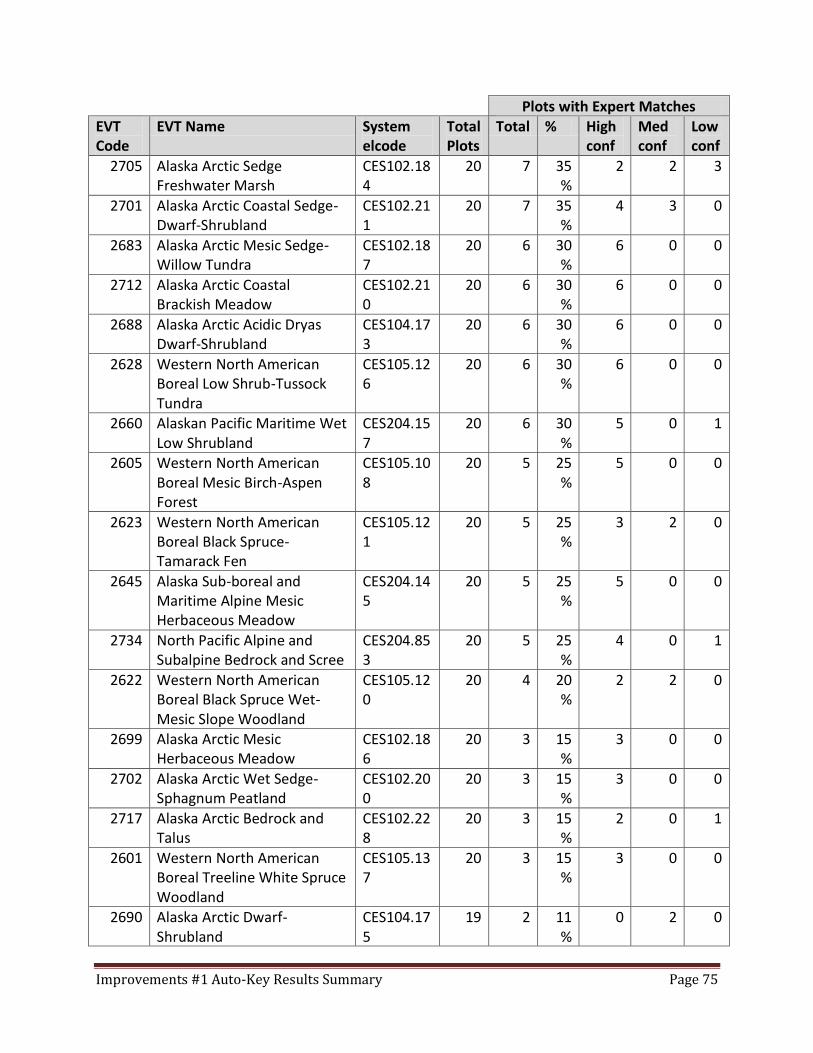
Improvements #1 Auto-Key Results Summary Page 75
Plots with Expert Matches EVT Code
EVT Name System elcode
Total Plots
Total % High conf
Med conf
Low conf
2705 Alaska Arctic Sedge Freshwater Marsh
CES102.184
20 7 35%
2 2 3
2701 Alaska Arctic Coastal Sedge-Dwarf-Shrubland
CES102.211
20 7 35%
4 3 0
2683 Alaska Arctic Mesic Sedge-Willow Tundra
CES102.187
20 6 30%
6 0 0
2712 Alaska Arctic Coastal Brackish Meadow
CES102.210
20 6 30%
6 0 0
2688 Alaska Arctic Acidic Dryas Dwarf-Shrubland
CES104.173
20 6 30%
6 0 0
2628 Western North American Boreal Low Shrub-Tussock Tundra
CES105.126
20 6 30%
6 0 0
2660 Alaskan Pacific Maritime Wet Low Shrubland
CES204.157
20 6 30%
5 0 1
2605 Western North American Boreal Mesic Birch-Aspen Forest
CES105.108
20 5 25%
5 0 0
2623 Western North American Boreal Black Spruce-Tamarack Fen
CES105.121
20 5 25%
3 2 0
2645 Alaska Sub-boreal and Maritime Alpine Mesic Herbaceous Meadow
CES204.145
20 5 25%
5 0 0
2734 North Pacific Alpine and Subalpine Bedrock and Scree
CES204.853
20 5 25%
4 0 1
2622 Western North American Boreal Black Spruce Wet-Mesic Slope Woodland
CES105.120
20 4 20%
2 2 0
2699 Alaska Arctic Mesic Herbaceous Meadow
CES102.186
20 3 15%
3 0 0
2702 Alaska Arctic Wet Sedge-Sphagnum Peatland
CES102.200
20 3 15%
3 0 0
2717 Alaska Arctic Bedrock and Talus
CES102.228
20 3 15%
2 0 1
2601 Western North American Boreal Treeline White Spruce Woodland
CES105.137
20 3 15%
3 0 0
2690 Alaska Arctic Dwarf-Shrubland
CES104.175
19 2 11%
0 2 0

Improvements #1 Auto-Key Results Summary Page 76
Plots with Expert Matches EVT Code
EVT Name System elcode
Total Plots
Total % High conf
Med conf
Low conf
2700 Alaska Arctic Polygonal Ground Mesic Shrub Tundra
CES102.206
20 2 10%
2 0 0
2651 Aleutian Mesic Herbaceous Meadow
CES105.232
20 2 10%
2 0 0
2643 Alaskan Pacific Maritime Alpine Dwarf-Shrubland
CES204.310
20 2 10%
2 0 0
2621 Western North American Boreal Black Spruce Dwarf-Tree Peatland
CES105.139
21 2 10%
0 1 1
2684 Alaska Arctic Mesic Sedge-Dryas Tundra
CES102.199
20 1 5% 1 0 0
2703 Alaska Arctic Dwarf-Shrub-Sphagnum Peatland
CES102.201
20 1 5% 0 1 0
2707 Alaska Arctic Polygonal Ground Tussock Tundra
CES102.204
20 1 5% 1 0 0
2691 Alaska Arctic Acidic Dwarf-Shrub Lichen Tundra
CES104.177
20 1 5% 1 0 0
2606 Western North American Boreal Dry Aspen-Steppe Bluff
CES105.109
20 1 5% 0 0 1
2618 Western North American Boreal Herbaceous Fen
CES105.119
20 1 5% 1 0 0
2655 Alaskan Pacific Maritime Floodplain Forest and Shrubland
CES204.154
20 1 5% 1 0 0
2680 Alaskan Pacific Maritime Avalanche Slope Shrubland
CES204.162
20 1 5% 1 0 0
2681 Alaskan Pacific Maritime Poorly Drained Conifer Woodland
CES204.315
20 1 5% 1 0 0
2608 Alaska Sub-Boreal Avalanche Slope Shrubland
CES105.111
21 0 0% 0 0 0
2714 Alaska Arctic Large River Floodplain
CES102.213
20 0 0% 0 0 0
2715 Alaska Arctic Floodplain CES102.227
20 0 0% 0 0 0
2615 Western North American Boreal Lowland Large River Floodplain Forest and Shrubland
CES105.117
20 0 0% 0 0 0

Improvements #1 Auto-Key Results Summary Page 77
Plots with Expert Matches EVT Code
EVT Name System elcode
Total Plots
Total % High conf
Med conf
Low conf
2617 Western North American Boreal Shrub and Herbaceous Floodplain Wetland
CES105.118
20 0 0% 0 0 0
2626 Western North American Boreal Wet Meadow
CES105.124
20 0 0% 0 0 0
2631 Western North American Boreal Alpine Dwarf-Shrub Summit
CES105.129
20 0 0% 0 0 0
2620 Western North American Boreal Low Shrub Peatland
CES105.140
20 0 0% 0 0 0
2614 Western North American Boreal Montane Floodplain Forest and Shrubland
CES105.141
20 0 0% 0 0 0
2647 Aleutian Shrub-Sedge Peatland
CES105.238
20 0 0% 0 0 0
2659 Alaskan Pacific Maritime Mountain Hemlock Peatland
CES204.156
20 0 0% 0 0 0
2665 Alaskan Pacific Maritime Coastal Meadow and Slough-Levee
CES204.159
20 0 0% 0 0 0
2676 Alaskan Pacific Maritime Alpine Floodplain
CES204.161
20 0 0% 0 0 0
2637 Western North American Boreal Alpine Floodplain
CES105.135
17 0 0% 0 0 0
Analysis of the contingency table (Results Workbook) for these types with lesser levels of agreement reveals the many ongoing challenges with finding agreement between experts and auto-keys for complex vegetation types. The results for the Alaska GeoArea in particular show how difficult it is to distinguish plots when the overall floristic diversity is low (such as in arctic Alaska grading into the boreal region), and the difference between the ecological systems is based on often subtle differences in concept and floristics that are not well represented in the plot data. For example the suite of ericaceous and dwarf-shrub species that characterize shrubland communities in Alaska is limited. High elevation shrublands in the boreal regions will have much the same floristics as in the arctic, but are split into different ecological systems. Boreal spruce and hardwood forests and woodlands have the same predominant tree species (black and white spruce, paper birch, aspen, and balsam poplar), and are important species in some dozen ecological systems, grading from sub-arctic spruce & lichen woodlands to black spruce peatlands. If adequate compositional data are not available in the plots, and the indicators of “wetlands” or “peatlands” or “floodplains” are not clearly understood, then neither the auto-key nor expert will be able to label the plots with confidence.

Improvements #1 Auto-Key Results Summary Page 78
The contingency table shows this confusion and here we summarize a cross-section of results from GeoArea 8. Western North American Boreal White Spruce Forest is confused with Western North American Boreal White Spruce-Hardwood Forest, Alaska Sub-boreal White-Lutz Spruce Forest and Woodland, Western North American Boreal Treeline White Spruce Woodland, Western North American Boreal Mesic Black Spruce Forest, Western North American Boreal Lowland Large River Floodplain Forest and Shrubland, and Western North American Boreal Montane Floodplain Forest and Shrubland. All of these have somewhat subtle differences in the structural characteristics, such as the percent of hardwood versus ocnfier in the canopy or relative proportions of white spruce versus black or lutz spruce. They also share a suite of similar shrub and forb species, even the systems found in floodplains will have much the same set of low or dwarf-shrubs and perennial forbs as the adjacent upland systems. Western North American Boreal Mesic Black Spruce Forest is confused with Western North American Boreal Black Spruce Wet-Mesic Slope Woodland, Western North American Boreal Black Spruce Dwarf-Tree Peatland, Western North American Boreal Black Spruce-Tamarack Fen. All of these systems are dominated by black spruce but are separated by a relative moisture gradient as well as a gradient of peat development. If plots are lacking information on the non-vascular components (which are used as indicators for the fen or peat systems), or similarly lacking the shrub or sedge indicators of peatlands versus fens, then keying them can be especially difficult. Western North American Boreal Mesic Scrub Birch-Willow Shrubland is confused with many other shrubland types, but especially Western North American Boreal Low Shrub-Tussock Tundra, Western North American Boreal Alpine Floodplain, Alaskan Pacific Maritime Alpine Floodplain, and Western North American Boreal Low Shrub Peatland. Scrub birch (Betula nana or B. glandulosa) occurs across all of Alaska, and ranges from dry uplands, the understory of spruce woodlands, to wetlands and fens (herbaceus indicators are critical to distinguishing across these types). But this example highlights the issue that floodplains in Alaska often do not have clear floristic indicators, as are usually found in drier areas of the western U.S. Alaskan Pacific Maritime Sitka Spruce Forest is confused with Alaskan Pacific Maritime Periglacial Woodland and Shrubland and Alaskan Pacific Maritime Mountain Hemlock Forest. And the Alaskan Pacific Maritime Poorly Drained Conifer Woodland was confused with North Pacific Mesic Western Hemlock-Yellow-cedar Forest, which in turn was confused with the Alaskan Pacific Maritime Western Hemlock Forest. In coastal maritime Alaska, with very high amounts of precipitation, the shrub and herb composition within the forest and woodland ecological systems is not highly variable. Distinguishing between poorly drained conifer woodlands (swamps), forested uplands, and floodplains is difficult without information as to micro-topographic characteristics of the plot. Western North American Boreal Alpine Mesic Herbaceous Meadow – This system is characterized by herbaceous species which are found in both meadow and marsh systems. Many of these plots were difficult to assign as a result of a lack of environmental data to determine the level of hydrologic inundation. Alaska Arctic Non-Acidic Dwarf-Shrub Lichen Tundra – Since this system is defined by high lichen cover, but as non-vascular cover was often not recorded the expert would have to default to other shrub systems such as Alaska Arctic Scrub Birch-Ericaceous Shrubland.

Improvements #1 Auto-Key Results Summary Page 79
Alaskan Pacific Maritime Avalanche Slope Shrubland – This system was often labeled by experts as North Pacific Alpine and Subalpine Bedrock and Scree resulting from similar environmental and floristic characteristics. Western North American Boreal Herbaceous Fen – This system is characterized by peat soils, but was difficult for experts to attribute due to lack of environmental data. It was not possible to determine if soils were peat. Therefore it was difficult to determine if these plots represented fen or meadow systems due to similar floristics; if the fen indicators listed in the description were not present or recorded on the plot it would not be possible to know if the plot represented a fen or wet meadow. Western North American Boreal Spruce-Lichen Woodland – Non-vascular cover was not always recorded in plots making it difficult to attribute to this system.
Expert Assignments
As described in the methods section above, the expert reviewers worked directly in the expert attribution database (EADB). Since GeoArea 8 had over 1,400 plots to review, a systematic, efficient process for reviewing and labeling plots was required. The forms provided in the EADB allowed the reviewer to sort and filter on subsets of plots to select groups of them with similar characteristics. For instance, the reviewer could select all plots found within a particular MapZone, then select all plots dominated by trees, then sort alphabetically by the dominant species. The reviewer could also select all treed plots, then select all plots with the same dominant tree species (such as Picea mariana), then sort by % cover of that species, from high to low. Error! Reference source not found. shows the main form in the EADB which has these data fields. Additional fields were provided from which to select or sort plots, such as elevation, aspect, slope, and total cover by lifeform in the plot. Once the reviewer had selected a subset of plots for reviewing, the next step was to select an individual plot to review and label. If the expert was working on treed plots first, then they had a further option of selecting the set of ecological systems from which to pick a label for the plots. This was accomplished via a filter on the NLCD land cover class applied to all systems (such as forest and woodland, shrubland, herbaceous, woody wetlands, and so on). For each plot, the expert reviewed environmental and geographic setting, as well as the floristic and vegetation structural characteristics of the plot. In many cases the expert could then assign an ecological system label with no further information. However, in some cases the reviewer might consult the descriptions for a group of similar ecological systems to clarify their understanding of differences in concept, geographic distribution, floristics, or structural characteristics. For example, within the group of 5 ecological systems where black spruce is the major tree component as described above differences between them are based on a gradient of moisture and peat development; indicators of such conditions either floristic ot biophysical settings, is necessary to accurately key the types. Since photos or image clips for many plots were either lacking or of poor quality, these were not available to assist the expert in the review and attribution. In addition a complete species list is necessary to confidently distinguish these types, especially in the non-vascular composition of the plot which is rarely collected. In cases like this, the determination of which system type to assign to the plot might require:

Improvements #1 Auto-Key Results Summary Page 80
ee) review of the image clip for the context of the plot (recall, very few Alaska plots had useable image clips),
ff) review of where the plot was located geographically (noting that for the GeoArea 8 plots, local geographic information such as USFS Subsection was not available, only very coarse-scale units such as the Map Zones, TNC or Nowacki ecoregions), to distinguish Arctic vs. Boreal for example,
gg) consideration of topographic setting (e.g. north-facing slopes could logically represent the Western North American Boreal Black Spruce Wet-Mesic Slope Woodland),
hh) consideration of any [rarely] available height data for the plot (e.g. were the black spruce trees all tall, apparently mature trees; or were they dwarfed),
ii) careful consideration of the full floristic composition of the plot and cover for each species. jj) awareness of possible errors in the plot data, such as mis-identification of species by the field
crews, unevenness in how the cover values were estimated in the field or converted into the LFRDB (e.g. cover for trees estimated by a person standing on the ground vs an aerial view of the plot).
Given all of the above, the reviewer had to make a decision for the plot, and assign an ecological system label. In cases where the assignment was not made with high confidence, the reviewer was requested to provide comments as to the factors they used to assign a label to the plot, or what the alternative assignment could be. Report Section 2.3 below discusses some of the results pertinent to confidence of assignment.
Improving the auto-key process
Of the 93 types assigned to plots by experts, 45 had fewer than 10 samples, so are excluded from this particular analysis. From the remaining 48 types, the numbers of samples labeled to a given type ranged from 58 (for Western North American Boreal Mesic Scrub Birch-Willow Shrubland) down to 10 (for Western North American Boreal Low Shrub Peatland). For all of these types, experts reported high confidence in their labels for at least 50% of the type’s plots. 4 types indicated low confidence for at least 20% of the type’s plots. These statistics are listed in the Results Workbook. A small sampling of expert comments related to moderate or low confidence plots are included in Table 6.
Table 30. A selection of expert comments related to labeling sample plots for types where their confidence was reported as moderate or low
Type Name Expert Comment Western North American Boreal Mesic Scrub Birch-Willow Shrubland
Betula glandulosa is not a dominant species in this system.
Western North American Sub-boreal Mesic Bluejoint Meadow
Unidentified sedge is problematic in assigning this system.
Alaska Arctic Polygonal Ground Shrub-Tussock Tundra
The presence of Carex utriculata suggests this is not an upland system, but tussock cover is very low.
Alaska Arctic Acidic Dryas Dwarf-Shrubland
Tussock sedges suggest this might be ecotonal
Alaskan Pacific Maritime Sitka Spruce Beach Ridge
Incomplete floristic data.
These and other comments point to several important aspects for consideration. First, some ecological systems concepts are better known and understood than others. Therefore, a certain degree of
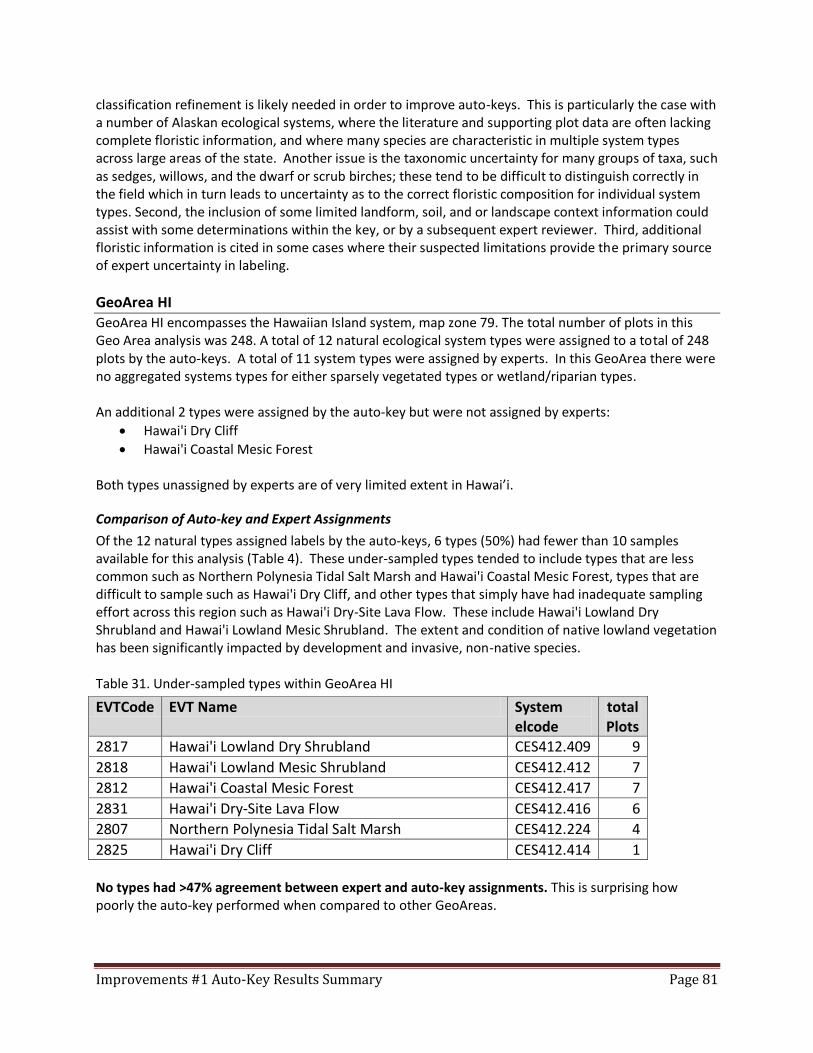
Improvements #1 Auto-Key Results Summary Page 81
classification refinement is likely needed in order to improve auto-keys. This is particularly the case with a number of Alaskan ecological systems, where the literature and supporting plot data are often lacking complete floristic information, and where many species are characteristic in multiple system types across large areas of the state. Another issue is the taxonomic uncertainty for many groups of taxa, such as sedges, willows, and the dwarf or scrub birches; these tend to be difficult to distinguish correctly in the field which in turn leads to uncertainty as to the correct floristic composition for individual system types. Second, the inclusion of some limited landform, soil, and or landscape context information could assist with some determinations within the key, or by a subsequent expert reviewer. Third, additional floristic information is cited in some cases where their suspected limitations provide the primary source of expert uncertainty in labeling.
GeoArea HI GeoArea HI encompasses the Hawaiian Island system, map zone 79. The total number of plots in this Geo Area analysis was 248. A total of 12 natural ecological system types were assigned to a total of 248 plots by the auto-keys. A total of 11 system types were assigned by experts. In this GeoArea there were no aggregated systems types for either sparsely vegetated types or wetland/riparian types. An additional 2 types were assigned by the auto-key but were not assigned by experts:
Hawai'i Dry Cliff
Hawai'i Coastal Mesic Forest Both types unassigned by experts are of very limited extent in Hawai’i.
Comparison of Auto-key and Expert Assignments
Of the 12 natural types assigned labels by the auto-keys, 6 types (50%) had fewer than 10 samples available for this analysis (Table 4). These under-sampled types tended to include types that are less common such as Northern Polynesia Tidal Salt Marsh and Hawai'i Coastal Mesic Forest, types that are difficult to sample such as Hawai'i Dry Cliff, and other types that simply have had inadequate sampling effort across this region such as Hawai'i Dry-Site Lava Flow. These include Hawai'i Lowland Dry Shrubland and Hawai'i Lowland Mesic Shrubland. The extent and condition of native lowland vegetation has been significantly impacted by development and invasive, non-native species. Table 31. Under-sampled types within GeoArea HI
EVTCode EVT Name System elcode
total Plots
2817 Hawai'i Lowland Dry Shrubland CES412.409 9
2818 Hawai'i Lowland Mesic Shrubland CES412.412 7
2812 Hawai'i Coastal Mesic Forest CES412.417 7
2831 Hawai'i Dry-Site Lava Flow CES412.416 6
2807 Northern Polynesia Tidal Salt Marsh CES412.224 4
2825 Hawai'i Dry Cliff CES412.414 1 No types had >47% agreement between expert and auto-key assignments. This is surprising how poorly the auto-key performed when compared to other GeoAreas.

Improvements #1 Auto-Key Results Summary Page 82
Table 32 provides a summary of adequately-sampled types where agreement between expert and auto-key ranged from just below 50% down to 6%. These six types represent 50% of the total types assigned. Further analysis of those grouped within the 50-6% agreement range suggests subtleties within types that left the expert with greater or lesser confidence in their assignment. This confusion is a result of many factors, some having to do with the fact that much of the dominant species in Hawai'i occur in multiple systems, so differentiation is based on indicator species and environmental factors such as moisture zone and elevation. For example, the widespread often dominant tree, Metrosideros polymorpha occurs from near sea level to subalpine elevations and on dry to wet sites. Using indicator species is problematic when floristic composition is poorly known, species lists in the samples are incomplete, or with indicator species that are uncommon enough that they are not consistently present in every plot. Another big issue, especially in lowland tropical vegetation (<1000 m elevation), is introduced species which complicate the use of auto-keys to label plots but dilute the relative cover of key native species. Table 32. Summary of types with adequate samples where agreement between auto-key and expert was below 50%
Plots with Expert Matches EVT Code
EVT Name System elcode
total Plots
total % High conf
Med conf
Low conf
2826 Hawai'i Dry Coastal Strand CES412.418 17 8 47% 4 3 1
2816 Hawai'i Montane-Subalpine Mesic Forest
CES412.406 78 31 40% 0 31 0
2813 Hawai'i Lowland Dry Forest CES412.408 18 6 33% 2 3 1
2814 Hawai'i Lowland Mesic Forest CES412.411 34 5 15% 0 4 1
2808 Hawai'i Lowland Rainforest CES412.226 36 3 8% 1 1 1 2810 Hawai'i Montane Rainforest CES412.215 31 2 6% 0 2 0
Analysis of the contingency table (Results Workbook) for these types with lesser levels of agreement reveals the many ongoing challenges with finding agreement between experts and auto-keys for complex vegetation types. Here we summarize the results from GeoArea HI Hawai'i Montane-Subalpine Mesic Forest – was most often confused with Hawai'i Lowland Mesic Forest (32), followed by Hawai'i Montane Rainforest (6), Hawai'i Lowland Dry Forest (4), and Hawai'i Lowland Rainforest (4). This confusion is the result of the elevation break used in the auto-key. The lowland mesic forest was allowed to include plots with <1100 m, when the expert generally used a 1000 m break unless there were ecological justification for increasing it. The confusion between lowland dry forest and lowland rainforest were likely the result of borderline issues with the moisture zone breaks. Hawai'i Lowland Rainforest – was most often confused with Hawai'i Montane-Subalpine Mesic Forest (16), followed by Hawai'i Montane Rainforest (9), and Hawai'i Lowland Mesic Forest (7). This indicates issues with the elevation zones and moisture zones where the auto-key labels the plots <1100 m first, but the expert thinks these borderline plots are montane. The moisture zones are also an issue which may hinge on Moisture Zone 5 being transitional between wet forest and mesic forest systems. Hawai'i Lowland Mesic Forest – was most often confused with Hawai'i Lowland Dry Forest (14), followed by Hawai'i Montane-Subalpine Mesic Forest (9) and Hawai'i Montane Rainforest (5). Again,

Improvements #1 Auto-Key Results Summary Page 83
this indicates an issue with the elevation zones and moisture zones where the auto-key labels the plots <1100 m first, but the expert thinks these borderline plots are montane. The moisture zones are also an issue which may hinge on Moisture Zone 5 being transitional between wet forest and mesic forest systems. Hawai'i Montane Rainforest– was most often confused with Hawai'i Montane-Subalpine Mesic Forest (14), followed by Hawai'i Lowland Dry Forest (5), Hawai'i Lowland Rainforest (2), and other non auto-key systems (8). The biggest issue is the level 5 moisture zone (seasonally mesic) and its confusion with the montane rainforest system. Moisture Zone 5 may be transitional between wet forest and mesic forest systems, rather than solely mesic. Hawai'i Lowland Dry Forest– was confused with Hawai'i Lowland Mesic Forest (3), followed by Hawai'i Lowland Rainforest (2), Hawai'i Montane-Subalpine Mesic Forest (1), and other, non auto-key systems (6). The moisture zones in the auto-key need to be reviewed. Hawai'i Dry Coastal Strand – was most often confused Northern Polynesia Tidal Salt Marsh (4). Both systems occur along coast. The indicator species may need to be restricted more or the order in the auto-key swapped so that the more restrictive brackish water species of the tidal marsh get labeled first.
Expert Assignments
As described in the methods section above, the expert reviewers worked directly in the expert attribution database (EADB). Since GeoArea HI had over 200 plots to review, a systematic, efficient process for reviewing and labeling plots was required. The forms provided in the EADB allowed the reviewer to sort and filter on subsets of plots to select groups of them with similar characteristics. For instance, the reviewer could select all plots found within a particular USFS Section or MapZone, then select all plots dominated by trees, then sort alphabetically by the dominant species. The reviewer could also select all treed plots, then select all plots with the same dominant tree species (such as Metrosideros polymorpha), then sort by codominant species, from high to low. Error! Reference source not found. shows the main form in the EADB which has these data fields. The filter is also useful to narrow selections. Additional fields were provided from which to select or sort plots, such as % cover of species, elevation, aspect, slope, and total cover by lifeform in the plot. Once the reviewer had selected a subset of plots for reviewing, the next step was to select an individual plot to review and label. If the expert was working on treed plots first, then they had a further option of selecting the set of ecological systems from which to pick a label for the plots. This was accomplished via a filter on the NLCD land cover class applied to all systems (such as forest and woodland, shrubland, herbaceous, woody wetlands, and so on). For each plot, the expert reviewed environmental and geographic setting, as well as the floristic and vegetation structural characteristics of the plot. In many cases the expert could then assign an ecological system label with no further information. However, in some cases the reviewer might consult the descriptions for a group of similar ecological systems to clarify their understanding of differences in concept, geographic distribution, floristics, or structural characteristics. For example, in Hawai'i there are several species such as Metrosideros polymorpha which occur widely and dominate the canopy of several ecological systems. In cases like this, the determination of which system type to assign to the plot might require:

Improvements #1 Auto-Key Results Summary Page 84
kk) review of the image clip or photo for the context of the plot, ll) review of where the plot was located geographically (wet windward side of island or dryer
leeward side of island. In Hawai'i the USFS Subsections and do not vary so not useful. mm) consideration of topographic setting (e.g. alpine, subalpine, montane, lowland and
coastal zones all support different vegetation), nn) consideration of any available height data for the plot (e.g. were trees normal size or dwarfed
from being exposure to extreme weather on a ridge in the cloud forest) oo) careful consideration of the full floristic composition of the plot and cover for each species. This
is especially important in Hawai'i where several species such as Metrosideros polymorpha occur widely and dominate the canopy of several ecological systems. Introduced species are a huge problem in lowland Hawai'i, so complete species composition is necessary to determine if the plot represents a disturbed natural system or has converted to a ruderal system dominated by introduced species.
pp) awareness of possible errors in the plot data, such as mis-identification of species by the field crews, unevenness in how the cover values were estimated in the field or converted into the LFRDB (e.g. cover for trees estimated by a person standing on the ground vs an aerial view of the plot).
Below are some examples of comments relevant to the above Metrosideros polymorpha example:
Metrosideros polymorpha is dominant tree in several forest and woodland systems has low diagnostic value in determining which forest system.
Generally, Metrosideros polymorpha dominated or codominated forests occurring above 1000 m are considered montane, and if occur in moisture zones 1-3 are thought to be dry forest, or if occur in moisture zones 4 or 5 are assumed to be mesic forest, and if occur in moisture zones 6 or 7 are wet forest (rainforest).
Generally, Metrosideros polymorpha dominated or codominated forests occurring below 1000 m are considered lowland, and if occur in moisture zones 1-3 are thought to be dry forest, or if occur in moisture zones 4 or 5 are assumed to be mesic forest, and if occur in moisture zones 6 or 7 are wet forest (rainforest).
Presence of indicator species works better in some systems than others as we are still refining them as we learn more.
Introduced invasive species are converting native systems to ruderal systems so absolute and relative cover of species such as Morella faya and Psidium spp. are critical in determining system label.
Given all of the above, the reviewer had to make a decision for the plot, and assign an ecological system label. In cases where the assignment was not made with high confidence, the reviewer was requested to provide comments as to the factors they used to assign a label to the plot, or what the alternative assignment could be. Report Section 2.3 below discusses some of the results pertinent to confidence of assignment.
Improving the auto-key process
Of the 11 types assigned to plots by experts, 3 had fewer than 10 samples, so are excluded from this particular analysis. From the remaining 8 types, the numbers of samples labeled to a given type ranged from 71 (Hawai'i Montane-Subalpine Mesic Forest) down to 11 (Hawai'i Lowland Rainforest). For all of these types, experts reported moderate confidence in their labels for at least 20% of the type’s plots. Several (3) indicated low confidence for at least 20% of the type’s plots. These statistics are listed in the

Improvements #1 Auto-Key Results Summary Page 85
Results Workbook. A small sampling of expert comments related to moderate or low confidence plots are included in Table 6. Table 33. A selection of expert comments related to labeling sample plots for types where their confidence was reported as moderate or low
Type Name Expert Comment
Hawai'i Lowland Mesic Forest Plot cannot be determined by available floristic data and elevation alone
Hawai'i Lowland Dry Forest Plot occurs in the relatively recent 1868 lava flow so is dryer than the Price et al. 2007 Moisture Zone
Hawai'i Dry-Site Lava Flow Plot is in moisture zone 5 so can’t assign to CES412.416 Hawai'i Dry-Site Lava Flow.
These and other comments point to several important aspects for consideration. First, some ecological systems concepts are better known and understood than others. Therefore, a certain degree of classification refinement is likely needed in order to improve auto-keys. Second, the inclusion of some limited landform, soil, and or landscape context information could assist with some determinations within the key, or by a subsequent expert reviewer. Similarly, repeated references to photos further indicates the need for expert review of many types where moderate-low confidence of experts suggest that auto-keys might be prone to error. Third, additional floristic information is cited in some cases where their suspected limitations provide the primary source of expert uncertainty in labeling.