geochemical interpretation of bicarbonate thermal …...with this determined, to estimate the...
TRANSCRIPT

Proceedings World Geothermal Congress 2020
Reykjavik, Iceland, April 26 – May 2, 2020
1
Geochemical Interpretation of Bicarbonate Thermal Springs for the Comprehension of a
Geothermal System: A Case Study at Cerro Machin Volcano, Colombia
Esteban Gómez Díaz
Iceland School of Energy, Reykjavik University, Menntavegur 1, 101 Reykjavík, Iceland.
Keywords: Geothermal Colombia, Cerro Machin volcano, Hydrogeochemistry, Geothermometry.
ABSTRACT
Cerro Machin volcano is an active volcano located on the eastern flank of the Cordillera Central of Colombia with thermal springs
dominated by two types of bicarbonate waters; Na-HCO3 and Ca-HCO3 waters. The chemical components and δ18O and δ2H isotopes
analyses were used to characterize the waters and their relationship with the geothermal system. Na-HCO3 springs are less affected
by the dilutions/mixing processes and they were suitable for some geothermometers, whereas the Ca-HCO3 springs are more strongly
affected by this subsurface process, and not suitable for geothermometry. The equilibration temperatures determined by
geothermometry is between 158°C to 246°C. Application of the chloride enthalpy model suggests a hot parent water of about 282°C.
The stable isotope compositions of the geothermal waters indicate a meteoric origin, and the waters became enriched in CO2 by
steam-heating and gas adsorption. The geothermal system is a convection-dominated geothermal play associated to recent volcanism
and, with an intermediate reservoir temperature around 200 - 230°C and, a possible deep high enthalpy reservoir around 280°C.
1. INTRODUCTION
Colombia lacks geothermal energy production, despite being in a geographical area where there is great potential by interaction of
tectonic plates and associated volcanic activity. One of the potential areas for geothermal exploration is the Cerro Machin Volcano
(CMV), which belongs to the Tectonic Province of the San Diego Volcano - Cerro Machín (Martínez et al., 2014). This volcano has
hydrothermal manifestations such as hot springs and fumaroles which are amenable for fluid sampling and geochemical analyses
(e.g., Fournier and Potter, 1982; Fournier and Truesdell, 1973; Giggenbach, 1988). The survey of thermal waters may carry significant
information related to the hydrogeology of the field, characterization, origin of the waters and reservoir temperatures, allowing a first
approach for understanding the resource potential of the system.
The aim of this paper is to provide a geochemical characterization of the thermal springs at CMV, in order to understand its genesis
and the interaction with the system, to make an interpretation and understanding of the geothermal area. It should be noted that
database used in this survey are open source published by Colombian Geological Survey (SGC acronym in Spanish).
1.1 Geological settings
The CMV is an active tuff ring complex where a crater of approximately 2 km in diameter was formed in the evolution of the volcanic
system and it is associated with three distinct domes (Cepeda et al., 1995). The basement sequence is made of Permo-Triassic and
Jurassic metamorphic rocks called Cajamarca Complex that is part of the core of the Cordillera Central of Colombia and that was
subject to regional metamorphism producing chlorite-albite epidote, chlorite-albite-actinolite, and quartz-sericite-graphite mineral
assemblages, plus quartzite and biotite quartzite schists (Núñez et al., 1979; Villagómez et al., 2011; Blanco-Quintero et al., 2014).
The volcano occurs at the intersection between the Cajamarca fault with a dip of N20E (Mosquera, 1978) and the Machín fault with
a dip of N24W with a dextral component and normal movement (Cepeda et al., 1995) in association with a "pull apart" structure
generated by lateral displacement faults (Rueda, 2005).
The volcanic eruptions generated plinian deposits (e.g. Cortés, 2001a and 2001b; Méndez, 2001; Rueda, 2005; Murcia et al., 2008)
and the last eruption occurred about 900 years BP, which involved an emplacement of pyroclastic flow deposits and an intra-crater
dacitic dome (Thouret et al., 1995; Rueda, 2005; Murcia et al., 2010, Laeger, 2013). Recent studies by Piedrahita et al., (2018) suggest
the crater of the volcano formed from successive eruptive phases as a result of magmatic and phreatomagmatic type events.

Gómez Díaz
2
Figure 1. Localization of the study zone and geological map of Cerro Machin Volcano. The dots represent the thermal springs.
2. METHODOLOGY
2.1 Hydrochemical database
The hydrochemical dataset used in this survey was taken from SGC database through National Inventory of Hydrothermal
Manifestation (2019). The database studied were sample collected on 2011 and their chemical components are illustrated on Table 1.
These waters were analyzed by Water and Gas laboratory and the Stable Isotope Laboratory from SGC. The analytical techniques
used were standard methods such as volumetric analysis, ion chromatography, UV spectrometry, atomic absorption and inductively
coupled plasma techniques and Off-Axis ICOS (Integrated Cavity Output Spectroscopy) high resolution absorption laser
spectroscopy for isotopes.
In order to verify the reliability of the chemical analyses collected by SGC, it was calculated the ionic balance (Equation 1) for each
sample to identify the ionic imbalances and analytical errors at the time of sample selection, where if the results of the Charge Balance
Error (CBE) exceed +/- 10%, they are not suitable for further geothermal studies (Nicholson, 1993).
𝐶𝐵𝐸% =∑𝐶𝑎𝑡𝑖𝑜𝑛𝑠− ∑𝐴𝑛𝑖𝑜𝑛𝑠
∑𝐶𝑎𝑡𝑖𝑜𝑛𝑠+∑𝐴𝑛𝑖𝑜𝑛𝑠× 100 (1)
where the Cations used were Na+, K+, Ca2+, Mg2+ and Li+ and the Anions used were HCO3-, F-, SO4
2- and Cl-.
Table 1. Major chemical constituents and CBE, δ18O and δD isotopes of thermal waters from CMV. The species of solution
expressed in mg/l.
2.2 Analysis and interpretation of the thermal Waters and assumption of reservoir temperature.
With the CBE calculated, the thermal waters were characterized and classified using Piper diagram plot along with the analysis of
relationship of the main components. Stable isotopes (δ18O and δ2H) were used to support the analysis of the origin of the waters.
These data provide a clearer image of subsurface processes and, thus identify the best tools for interpretation of potential reservoir
temperature.
Samples Puente
Tierra
Cascada
I
Cascada
II
Piscina
I
Piscina
II
Estatua
I
Estatua
II
Rio
Toche I
Rio
Toche II
ID Pt Cs I Cs II Ps I Ps II Es I Es II Tc I Tc II
pH 7,32 6,75 6,98 6,94 6,99 6,97 7,3 6,38 6,27
Temp C° 54 81,5 84,5 82 74 90 74 42 29 Ca2+ 82 22 22 14 20 32 28 485 467
Mg2+ 31,1 16,07 9,98 11,1 13 16,7 12,7 60,9 42,1
Na+ 300 378 385 292 322 388 386 87,5 47,1 K+ 32,1 34,2 36 27,72 28 39,2 42,3 8,1 6,2
Li+ 3,2 3,2 3,4 2,28 2,22 3,4 3,4 1,2 0,6
SiO2(aq) 253,86 197,79 198,21 445,71 276 394,99 323,57 172,93 133,99 HCO3
- 915 695 658,8 610 549 793 756,4 2025,2 1512,8
SO42- 171,2 201,9 179,7 155,5 203,6 172,8 193,01 5,18 38,1
Cl- 144,4 216,8 227,1 127,31 184 204,75 205,3 93,19 45,94 F- 0,19 0,1 0,09 0,08 0,17 - 0,12 0,15 0,14
Fe2+ 0,05037 - - 0,1649 - - - 9,69 14,74
δ18O -7,33 -11,14 -7,6 -6,93 - -7,46 - -6,93 -10,07 δD -60,31 -72,08 -59,14 -57,88 - -58,9 - -57,88 -69,01
CBE% -4% -4% -2% -5% -4% -2% -3% -3% 5%

Gómez Díaz
3
Before estimating the temperature with geothermometry techniques, the Na-K-Mg diagram was graphed (Giggenbach, 1988), with
the purpose of identifying physic-chemical balance between the fluid and the host rock and, thus a first glance of the temperature of
the reservoir was observed. With this determined, to estimate the reservoir temperature using “classical” solute geothermometers and
to clarify more about subsurface process such as underground temperatures, salinities, and boiling and mixing relation, the chloride-
enthalpy model by Fournier (1979a) was used.
3. RESUTLS AND DISCUSSION
3.1 Hydrochemical characteristics
The pH values of thermal water samples in CMV were slightly acid to neutral, ranging from 6,27 to 7,32. The main cations in the
geothermal waters are Na+, which ranges from 46,59 mg/l to 402,5 mg/l, and Ca2+, which ranges from 14,43 mg/l to 484 mg/l. The
main anion is HCO3- with concentrations from 562 mg/l and 2021 mg/l. The δ18O values of thermal waters are between -14,93 % and
−6,93‰, whereas the δD values range from −72,08% to−57,88%. The CBE for all the samples is below of ±5% indicating reliable
analytical results.
The spring water compositions are characterized in Figure 2, and they fall into two groups, made of sodium bicarbonate waters (I)
defined by Estatua I & II, Piscina I & II, Cascada I & II and Puente Tierra and the calcium bicarbonate waters (II) defined by Toche
I & II. The sodium bicarbonate waters have slightly acidic to neutral pH with relatively high temperature (57°C to 90°C) and high
concentrations of Cl-, Li+, SO42- and SiO2 and lower concentrations of Ca2+ and Mg2+ compared to the calcium bicarbonate group.
The relative cation concentrations are Na+ > K+> Ca2+> Mg2+ >Li+, except for Puente Tierra in which the second main cation is Ca2+.
The relative anion concentrations are HCO3- > Cl-> SO42– >F- for Cascada I & II and Estatua I & II and HCO3- > SO42– > Cl- >F- for
Puente Tierra and Piscina I & II. However, the difference between SO42– and Cl- is not significant.
The waters from the second group are slightly acidic (6,27 and 6,38) and they have lower temperatures (42°C and 29°C°), with low
concentration of Cl-, Li+, SO42- and SiO2 but high concentrations of Ca2+and Mg2+, and Fe2+. The relative ion concentration levels for
cations is Ca2+> Na+ > Mg2+ > K+> Fe2+ > Li+ and the anions is HCO3- > SO4
2– > Cl-.
Figure 2. Piper Diagram for the thermal springs from CMV.
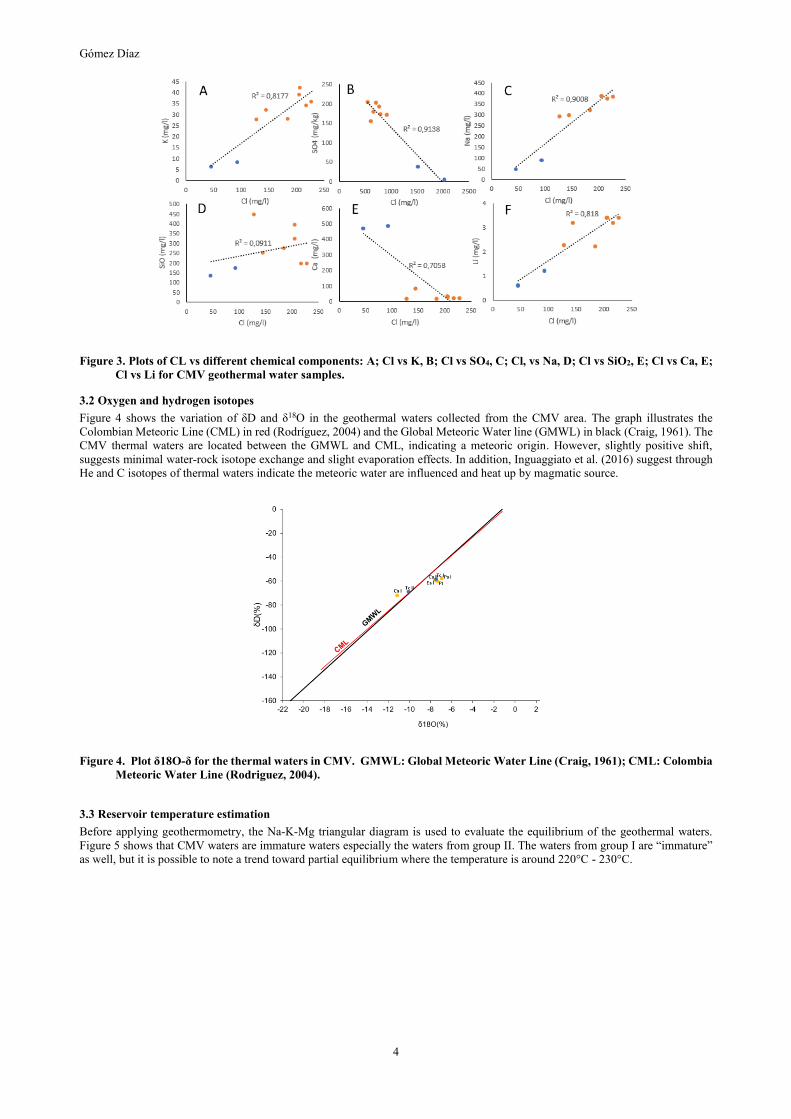
Figure 3 shows positive linear relationships of Cl/Li, Cl/Na and Cl/K, Cl/Ca, which may indicate that the thermal springs in CMV
could come from the same deep reservoir and mixing evidence with groundwaters. Apparently, the dilution process has influenced
the Cl, Na and SiO2 values in Puente Tierra and Piscina I & II waters, whereas the Cascada I & II and Estatua I & II waters appear
less affected. The CL/SiO2 ratio does not show a clear trend, because probably the SiO2 was affected by precipitation or degassing
process.
In contrast, Toche I and II are the most influenced by the mixing as indicated by the increase in Mg2+, Ca2+ and HCO3-, and their distal
position with respect to the volcanically active area. Toche I and II waters are thus probably more strongly affected by water-rock
interaction and condensation of CO2. Generally, the high content of HCO3- is related to the condensation of steam and absorption of
gas into subsurface groundwaters (Nicholson, 1993). However, other process could increase the solution as well, such as reactions
with the host rock.
Gómez Díaz
4
Figure 3. Plots of CL vs different chemical components: A; Cl vs K, B; Cl vs SO4, C; Cl, vs Na, D; Cl vs SiO2, E; Cl vs Ca, E;
Cl vs Li for CMV geothermal water samples.
3.2 Oxygen and hydrogen isotopes
Figure 4 shows the variation of δD and δ18O in the geothermal waters collected from the CMV area. The graph illustrates the
Colombian Meteoric Line (CML) in red (Rodríguez, 2004) and the Global Meteoric Water line (GMWL) in black (Craig, 1961). The
CMV thermal waters are located between the GMWL and CML, indicating a meteoric origin. However, slightly positive shift,
suggests minimal water-rock isotope exchange and slight evaporation effects. In addition, Inguaggiato et al. (2016) suggest through
He and C isotopes of thermal waters indicate the meteoric water are influenced and heat up by magmatic source.
Figure 4. Plot δ18O-δ for the thermal waters in CMV. GMWL: Global Meteoric Water Line (Craig, 1961); CML: Colombia
Meteoric Water Line (Rodriguez, 2004).
3.3 Reservoir temperature estimation
Before applying geothermometry, the Na-K-Mg triangular diagram is used to evaluate the equilibrium of the geothermal waters.
Figure 5 shows that CMV waters are immature waters especially the waters from group II. The waters from group I are “immature”
as well, but it is possible to note a trend toward partial equilibrium where the temperature is around 220°C - 230°C.

Gómez Díaz
5
Figure 5. The Na-K-Mg1/2 proposed by Giggenbach (1988) for all the geothermal water samples for VCM. The samples plotted
show a tend to 220°C- 230°C.
Based on the trends in the Na-K-Mg diagram, solute geothermometers can be applied only for the group I waters and, taking into
account some cautions. For example, the equilibration temperatures based on the K/Mg geothermometer should be discarded because
the waters are in disequilibrium by a possible mixing with shallows waters. Whereas, the Na/K geothermometer could be regarded
due to it is less affected by dilution process. However, this geothermometer can overestimate the reservoir temperature because it
appears to be in disequilibrium with the albite and k-feldspar and, the opposite case, the Na-K-Ca geothermometer can underestimate
the temperature.
On the other hand, the silica geothermometer could be the most reliable in this condition, where the solubility of amorphous silica at
100°C is approximately 350 ppm. This corresponds to a quartz equilibrium temperature of approximately 220°C (D’Amore, &
Arnórsson, 2000), where the survey area possesses some spring waters with highest values. Nonethess, if the cation geothermometer
show a substantially higher temperature, the calculated quartz equilibrium temperature should be regarded as being low, because of
presume precipitation of silica from solution to form amorphous silica (D’Amore, & Arnórsson, 2000).
Table 2 shows the equilibration temperatures for thermal waters in the group I, giving values that range between 158°C to 246°C.
Although there is discrepancy between the values estimated in some geothermometers as it was expected. However, the
geothermometers of Estatua I & II and Piscina I make a good approach between them, especially quartz and Na-K by Giggenbach
(1988). The disagreement of the different geothermometers is because at the moment the waters are ascended, they are cooled in the
upflow by different process such as conduction, gas loss, mixing with shallow waters or all of the above and, when this happens, the
chemical equilibriums is altered generating a change composition in the fluid and ratios might be controlled by other minerals, such
as the case of Puente Tierra, Cascada I and Cascada II.
Table 2. Reservoir temperature in Celsius (°C) estimated by solute geothermometers in CMV thermal springs. The silica
geothermometry are base on Fournier and Potter (1982) and Na-K-Ca by Fournier & Truesdell (1973).
Despite showing similarities in some geothermometers, the high chalcedony values indicate that it should not be considered, because
it is appropriate temperature under 180°C, as result the silica appears to be controlled by quartz at 180 - 240°C. The Na-K-Ca shows
lower temperatures in the sample likely they were affected by CO2-partial pressure, besides some authors (e.g. Fouillac & Michard,
1977; Pope et al., 1987; Giggenbach, 1988) found that Na-K-Ca is not exactly accurate for Na-HCO3 solutions. Na-k geothermometers
are also suspects. Although the results by Fournier (1979b) and Giggenbach (1988) are relatively close to quartz geothermometers
for samples that appear less affected by subsurface process.
Another good indicator to believe that the temperature is >200°C is the big deposit of sinter in Estatua I & II reported by SGC, where
it could be related to temperatures in excess of about 200°C. In addition, the waters relatively rich-CO2 are usually linked with
reservoir temperature above 200°C (Arnósson, 2000), as seen in this case. These rich-CO2 waters become acids due to dissociation
Samples Chalcedony
(Fournier
Quartz
conductive
Quartz
adiabatic
Na-K-Ca
Na/K
Fournier 1979
Na/K
Arnorsson 1983
Na/K
Giggenbach 1988
Puente
tierra 178 198 182 182 223 202 238
Cascada I 158 180 168 189 208 185 224
Cascada II 158 180 168 191 211 188 227
Piscina I 232 246 218 191 212 190 228
Piscina II 186 204 187 185 205 181 221
Estatua I 220 234 210 192 218 196 233
Estatua II 200 217 197 198 225 205 240

Gómez Díaz
6
of carbonic acid, therefore, they are quite reactive and, as result, there is changes in the major cations, altering the equilibrium with
the rock. However, the mixing boiled geothermal water with cold does not produce acid and chemically reactive mixed water because
such hot water has lost most of its dissolved carbon dioxide (Andersson, 2000).
Considering the above and in accordance with the analysis of the components, isotopes and the Na-K-Mg plot, shallow waters are
likely affected by dilution. To test this, a chloride-enthalpy plot (Fournier, 1979a) is constructed. This model allows assume the
temperature of the hot component and distinguish the effects of boiling and mixing, since both steam and cold waters have low
chloride contents but very different enthalpy values. Due to the absence of boron analyses, the few other analytes are likely to show
a clear strong positive relationship of Cl & δ18O (Figure 6a).
The enthalpy-chloride mixing model for the CMV waters is shown in Figure 6b. The circles represent the issuing enthalpy of the hot
springs and their corresponding chloride concentration. Triangles are the calculated enthalpy of the hot springs using quartz
geothermometry, where line A correspond waters that constitute a mixture of the parent hot water and cold water, whereas the
line B represent the water that has boiled the most before mixing with cold water.
Puente Tierra is the only one lie in mixing line with the apparent parental fluid, whereas Cascada II has boiled before the mixing,
forming the highest Cl water. Piscina I plots outside of the triangle, it is due to an excess of enthalpy by effect of steam-heat but,
Piscina I could be regarded in the model with more rigorous data. Most of the spring waters plot inside of the triangle, indicating a
variable condition of boiling and mixing where Es I & II are slightly affected for both processes, being more reliable for the
geothermometers as previously hinted. The model indicates the reservoir should have a temperature at least as high as 225°C and
possibly higher than 282°C, and the chloride content in the hot component is about 125mg/l (Point C). If one takes a very optimistic
position and assumes Ps I a valid point, the hot component could be even higher, around 290-300°C.
Figure 6. A; CL & δ18O and B; Chloride-enthalpy model for the CMV geothermal waters. The steam point is plotted at a
constant value of 1276kj/kg (Henley et al., 1984). Dots are emerging enthalpy of the thermal springs, triangle are the
calculated enthalpy of the thermal springs using quartz geothermometers and the square is the cold water obtained
by Inguaggiato et al., 2016. The enthalpy of the hot component is 1000kj/kg, which is 232°C.
3.4 Understanding the system Based on the surface geology, thermal water compositions, interpreted equilibration temperatures, and the mineral associations, a
model of hydrothermal fluid flow is proposed. The Na-HCO3 and Ca-HCO3 waters appear to have the same source. The springs from
the group II which are probably steam-heated water the margin of the system and affected by mixing and water-rock interaction
compared to waters in group I. The group I are more representative of the upflow, mainly Estatua I & II and Piscina I & II springs.
Puente Tierra is an exception, and it could be related with other discharge area associated with a hydrologically less favored upflow
and influenced by dilution process.
The reservoir likely occupies a fracture zone within Cajamarca Complex where the deep fault system provides the flow for a meteoric
recharge. The meteoric waters descend to the point where magmatic heat makes them buoyant, rising to the surface as a typical neutral
pH chloride water. Part of the chloride water turn in steam and, this steam and gases that exsolve through boiling rise to higher level
and interact with shallow groundwaters to produce hot CO2-rich fluid via condensation of steam and the absorption of CO2.
Nevertheless, the same chloride water is diluted to varying degrees by boiled fluid mentioned, originating the Na-HCO3 water rich in
CO2. The minimum resource temperature is around 200 - 235°C, and at deeper level high enthalpy fluid (≈280°C) could exists.
The high amount of CO2 dissolved in the geothermal water, due to it is directly proportional to the amount of calcite that can be
dissolved. Calcite in the reservoir will dissolve in the geothermal liquid until a chemical equilibrium is reached, representing the
potential scale mineral deposition. These weak carbonic acid waters are very aggressive to standard geothermal grouts and stainless-
steel casings. Hence, the recognition of CO2-rich steam-heated waters early in the assessment of a system has a bearing on future
development (Hedenquist, 1990). In addition, it is also recommendable calculate the silica scaling potential, because an increase in
pH resulting from portioning od CO2 into the steam phase can produce amorphous silica saturation when the fluid it is extracted.

Gómez Díaz
7
4. CONCLUSION
Based on the information given by hydrochemical characteristics at Cerro Machin Volcano area, this study concluded that the
geothermal waters are mainly Na-HCO3 and Ca-HCO3 types. Although both group of waters are influenced for subsurfaces process,
the Na-HCO3 waters may reflect a hot deep resource, being more related with the upflow, whereas the Ca-HCO3 waters are more
influenced by water-rock interaction and diluting/mixing process in the lateral flow. Both waters plot near the Mg apex in the Na-K-
Mg plot, indicating they are out of equilibrium with common hydrothermal minerals.
The reservoir temperature calculated by cation geothermometers suggested a yield between 180-240°C, whereas the quartz
geothermometers suggested a yield 218-234°C in the samples less affected for dilution, being more reliable. The mixing model
identified subsurface process and assumed a parental hot component around 282°C, deducting a reservoir temperature around 235°C.
Finally, the hydrochemistry of the thermal waters suggested that a “deep” reservoir supplies steam and CO2 gas that has separated
from sodium-chloride water at depth. Shallow groundwaters in aquifers absorb the CO2, which build up over time, and remain hot
due to continued steam condensation. Nevertheless, some of the sodium-chloride water is dilute with the boiled water. Since this
survey is based on legacy data acquired by the Colombia Geological Survey, new analyses are recommended, in order to comparing
and, identify new useful chemical components is suggested, such as B and Sr and more isotopic studies for further verifying the
conclusions reached in this study.
ACKNOWLEDGEMENTS
Thanks to the Geothermal Exploration Group from SGC for sharing the data through the National Inventory of Hydrothermal
Manifestation, thus encouraging the geothermal exploration in Colombia and Reykjavik University for supporting in the participation
in this event. The author is also grateful to the anonymous reviewer for the invaluable comments which helped to improve the content
of this conference paper.
REFERENCES
Arnórsson, S. Chemical equilibria in Icelandic geothermal systems—Implications for chemical geothermometry investigations:
Geothermics, 12(2-3), 119-128, (1983).
Arnórsson, S. Mixing process in upflow zones and mixing models Chapter 11, in Arnórsson,S. (Ed.): Isotopic and chemical
techniques in geothermal exploration, development, and use. International Atomic Energy Agency, Vienna, (2000).
Blanco-Quintero, I.F., García-Casco, A., Toro, L.M., Moreno, M., Ruiz, E.C., Vinasco, C.J., Cardona, A., Lázaro, C., & Morata, D.
Late Jurassic terrane collision in the northwestern margin of Gondwana (Cajamarca complex, eastern flank of the Central
Cordillera, Colombia). International Geology Review, 56, 1852-1872, (2014).
Cepeda, H., Murcia, L.A., Monsalve, M.L., Méndez, R.A., & Núñez, A. Volcán Cerro Machín, Departamento del Tolima, Colombia:
Pasado, Presente y Futuro. Internal Report, INGEOMINAS, Popayán, (1995).
Cortés, G.P. Estudio Geológico de los depósitos de lahar asociados a la actividad eruptiva del Volcán Cerro Machín. Internal Report,
Ingeominas, Manizales, p. 96, (2001a).
Cortés, G.P. Lahares Asociados a la actividad eruptiva del Volcán Cerro Machín. VIII Congreso Colombiano de Geología, Manizales,
12, (2001b).
Craig., H. The isotopic geochemistry of water and carbon in geothermal areas. In: Tongiorgi, E. (Ed.), Nuclear Geology of Geothermal
Areas. Spoleto, Italy, 17–53, (1963).
D’Amore, F. & Arnórsson, S. Geothermometry Chapter 10. In Arnórsson, S. (Ed.): Isotopic and Chemical Techniques in Geothermal
Exploration, Development and Use. IAEA, Vienna, 152-199, (2000).
Fournier, R.O. Geochemical and hydrologic considerations and the use of enthalpy-chloride diagrams in the prediction of
underground conditions in hot-spring systems. J. Volcanol. Geotherm. Res., 5, 1–16, (1979a).
Fournier, R.O. A revised equation for the Na/K geothermometer: Geothermal Resources Council, Transactions, 3, 221-224, (1979b).
Fouillac, C., & Michard, G. Sodium, potassium, calcium relationships in hot springs of Massif Central. Proc. 2nd Intl. Symp. On
Water-Rock Interaction, Strasbourg 3, 109 – 116, (1977).
Fournier, R.O., & Potter, R.W. A revised and expanded silica (quartz) geothermometer. Geotherm. Resour. Counc. Bullet., 11 (10),
3–12, (1982).
Fournier, R.O. and Truesdell, A.H. An Empirical Na-K-Ca Geothermometer for Natural Waters. Geochimica et Cosmochimica Acta,
37, 1255-1275, (1973).
Giggenbach., WF. Geothermal solute equilibria. Derivation of Na-K-Mg-Ca geoindicators. Geochimica et Cosmochimica Acta,
52(12): 2749-2765, (1988).
Hedenquist, J.W. The thermal and geochemical structure of the Broadlands - Ohaaki Geothermal System. Geothermics, 19, 151-165,
(1990).
Henley, R.W., Truesdell. A.H. and Barton, P.B., Jr, Fluid-mineral equilibria in hydrothermal systems: Rev. Econ. Geol., 1, 267,
(1984).
Inguaggiato, S., Londoño, J.M., Chacon, Z., Liotta., M, Gil, E., & Alzate, D. The hydrothermal system of Cerro Machín volcano
(Colombia): New magmatic signals observed during 2011–2013. Chemical Geology, 469, 60–68, (2016).

Gómez Díaz
8
Laeger, K., Halama, R., Hansteen, T., Savov, I.P., Murcia, H.F., Cortés, G.P., & Garbe-Schönberg, D. Crystallization conditions and
petrogenesis of the lava dome from the ∼900 years BP eruption of Cerro Machín Volcano, Colombia. Journal of South American
Earth Sciences, 48, 193-208, (2013).
Martínez, T., Valencia, R., Ceballos, H., Narváez, M., Pulgarín, A., Correa, T., Navarro, A., Murcia, A., Zuluaga, M., Rueda, G., &
Pardo, V. Geología y estratigrafía del Complejo Volcánico Nevado del Ruiz. Internal Report. Servicio Geológico Colombiano,
Bogotá – Manizales – Popayán, p. 853, (2014).
Méndez, R.A. Informe sobre la geología y estratigrafía de flujos piroclásticos asociados al Volcán Cerro Machín., Interal Report.
Ingeominas, Manizales, p. 36, (2001).
Mosquera, D. Geología del cuadrángulo K-8. Manizales. Internal Report. INGEOMINAS, Bogotá, Colombia, (1978).
Murcia, H.F., Hurtado, B.O., Cortés, G.P., Macías, J.L., & Cepeda, H. The ~2500 yr B.P. Chicoral non-cohesive debris flow from
Cerro Machín Volcano, Colombia. J. Volcanol. Geotherm. Res., 171, 201-214, (2008).
Murcia, H.F., Sheridan, M.F., Macias, J.L., & Cortés, G.P. TITAN2D simulations of pyroclastic flow at Cerro Machín Volcano,
Colombia: Hazard implications. J. S. Am. Earth Sci., 29, 161-170, (2010).
Nicholson, K. Geothermal Fluids: Chemistry and Exploration Techniques. Berlin, Springer-Verlag, (1993).
Núñez, T.A., González, H., & Linares, E. Nuevas edades K/Ar de los esquistos verdes del Grupo Cajamarca. Publicaciones especiales
de Geología. Universidad Nacional de Medellín, 23, 18, (1979).
Piedrahita, D.A., Aguilar-Casallas, C., Arango-Palacio, E., Murcia, H., & Gómez-Arango, J. Estratigrafía del cráter y morfología del
volcán Cerro Machín, Colombia. Boletín de Geología, 40(3), 29-48, (2018).
Pope, L., Hajash, A. & Popp R. K. An experimental investigation of quartz, Na-K, Na-K-Ca geothermometers and the effects of fluid
composition. J. VolcanolG. eoth. Res. 31, 15 1- 16, (1987).
Rodríguez, C. Línea meteórica isotópica de Colombia. Meteorol. Colomb., 8, 43-51, (2004).
Rueda, H. Erupciones Plinianas del Holoceno en el Volcán Cerro Machín, Colombia. Estratigrafía, petrografía y dinámica eruptiva.
MSc. Thesis, Universidad Nacional Autónoma de México, México D.F, (2005).
SGC. Base de datos de Inventario Nacional de Manifestaciones Hidrotermales de Colombia. Grupo Exploración de Recursos
Geotérmicos, (2019). http://hidrotermales.sgc.gov.co/invtermales/
Villagómez, D., Spikings, R., Magna, T., Kammer, A., Winkler, W., & Beltrán, A. Geochronology, geochemistry and tectonic
evolution of the Western and Central Cordilleras of Colombia. Lithos, 125(3-4), 875-896, (2011).