geochemical monitoring survey results …...small fault kgs #2-32 north pf kgs #2-32 ~70 ft of ~23%...
TRANSCRIPT

GEOCHEMICAL MONITORING SURVEY RESULTS FROM CO2 EOR AT
WELLINGTON FIELD IN SOUTH KANSAS
Yevhen Holubnyak, Lynn Watney, Christa Jackson Brent Campbell, and John Victorine

Participants

Outline • Project introduction • Web-based interactive database • Geochemical monitoring survey • Some results and data analysis

Wellington Field, South KS
Regional Assessmentof deep saline
Arbuckle aquifer
2009 1940

Plan for CO2 EOR Pilot • Find, characterize, and prepare oil field • Find CO2 source
– Initially, ethanol plant multiple sources • Develop strategy for resource recovery through reservoir modeling
– Several revisions • Obtain a permit and drill a new injection well • Organize surface infrastructure and deliver CO2
– Truck delivery • Inject ~26,000 ~20,000 tones of CO2 at 100-150 tones/day • Monitor and manage CO2 plume • Vent produced CO2

Wellington Field small scale CO2-EOR Jason Bruns above (Caanon Well Services) and Dana Wreath upper right (VP Berexco, LLC) with KGS staff
• 30% oil cut • Compared to ~1-2% field average
Added stock tank
Gas separator for CO2

Operations: CO2 Delivery and Surface Facilities

0.001
0.010
0.100
1.000
10.000
100.000
1,000.000
10,000.000
100,000.000
Jan-16 Mar-16 Apr-16 Jun-16 Aug-16 Oct-16 Dec-16 Feb-17 Apr-17
CO2 Purchased Daily (MCF)
CO2 Produced Daily (MCF)
Cumulative CO2 Produced (MCF)
Incremental Oil Daily (bbls)
Cumulative Incremental Oil (bbls)
Cum. Ratio Produced/Purchased CO2
Daily Ratio Produced/Purchased CO2
CO2 Injection Begins 1-09-16
Oil Recovery Starts 2-26-16
CO2 Production 2-29-16
Pause in CO2
Injection
CO2 Injection
Ends
~18% of CO2 injected has been produced
5,000+ BO CO2 Injected and Recovered & Oil Produced Through 7/31/16

Reservoir Characterization • Very old Neutron logs with or without
resistivity logs for all wells • 16 wells with complete suites of resistivity and
porosity logs • New wells drilled by KGS have a full set of
modern logs • Core is available from KGS #1-32
– Porosity/permeability – Geochemistry – Geomechanical data
• 3D Seismic • Formation fluids analysis

Small fault
KGS #2-32
North
PF
KGS #2-32 ~70 ft of ~23% Sor
~12 mi2
(30 km2)
20 ft (6 m)
Perf
orat
ons
J. Rush • Petrel map of permeability distribution in the Mississippian dolomite • CO2 injection well is red vertical line • Lower permeability noted east and south of the injection well, Berexco Wellington KGS #2-32 • Residual oil saturation in cored injection well averages 23%
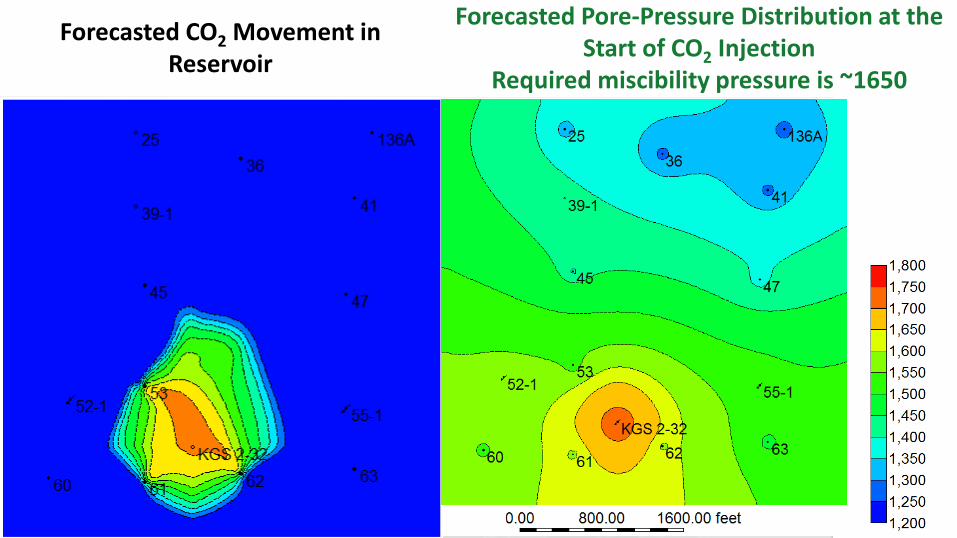
Forecasted CO2 Movement in Reservoir
Forecasted Pore-Pressure Distribution at the Start of CO2 Injection
Required miscibility pressure is ~1650

Fluid Monitoring • Two geochemical data sets
– Baker&Hughes – KU/KGS
• Water chemistry – Alkalinity/pH/TDS – on site – Cations/anions - Lab – Microbial - Lab
• Production history – Oil/water/pressure – CO2 account

Web Applications Built to Display and Analyze Data “in Real-Time” by the Team During Monitoring time lapse maps, cross plots, analytical tools, csv download

4/27/2016 3/23/2016
6/23/2016 End of CO2
injection
Small fault
7/19/2016 High Alkalinity CO2
Supercritical CO2
Time Lapse Alkalinity -- During and Post CO2 Injection

20 Jan 2016 1 Apr 2016
7 Sep 2016 7 Feb 2017 Field Test Data • PH • Temperature [deg C] • Conductivity [mho/m]
Mapping Animation Web Applet – Nearest Monitoring Wells

Data Normalization
• Define “Good” Data Set • Brine data falling between +/- 2% of the Anions/Cations Ratio Separate Brine Data to: • Above 2% of the Good Data Set • Below 2% of the Good Data Set • Construct an Eigenvector for the Good Data Set • Assuming that the data has a measurement “Error” to the Good Data Set. • Correct the Above and Below Data Sets by using the Eigenvector of the Good Data Set to “correct” the Brine Data to the define “Good” Data Set.
Data Set I
Data Set II +/- 2%

+/- 2%
Reprocessed Data

T5 = June 17, 2016 KGS 2-32 Injection well Significant CO2 production Detection of CO2 No detection of CO2
Data cross-verification

Summary
1. CO2 breakthrough could be monitored with alkalinity and pH; however, lowered alkalinity and pH did not always mean that well would ever produce CO2
2. Fractures and faults in carbonate reservoir greatly influence flow but not always as expected and fracture volume plays critical role
3. “Real” real-time monitoring with geochemistry is unlikely; however it is relatively cheap and effective verification tool
4. Sample processing conditions and procedures influence results 5. Cation/anion and microbial data is still in processing and new
findings are coming

Acknowledgements & Disclaimer
Acknowledgements The work supported by the U.S. Department of Energy (DOE) National Energy Technology Laboratory (NETL) under Grant DE-FE0002056 and DE-FE0006821, W.L. Watney and Yevhen Holubnyak, Joint PIs. Project is managed and administered by the Kansas Geological Survey/KUCR at the University of Kansas and funded by DOE/NETL and cost-sharing partners. Disclaimer This report was prepared as an account of work sponsored by an agency of the United States Government. Neither the United States Government nor any agency thereof, nor any of their employees, makes any warranty, express or implied, or assumes any legal liability or responsibility for the accuracy, completeness, or usefulness of any information, apparatus, product, or process disclosed, or represents that its use would not infringe privately owned rights. Reference herein to any specific commercial product, process, or service by trade name, trademark, manufacturer, or otherwise does not necessarily constitute or imply its endorsement, recommendation, or favoring by the United States Government or any agency thereof. The views and opinions of authors expressed herein do not necessarily state or reflect those of the United States Government or any agency thereof.

Questions?