geochemical survey case study of arus and bogoria ... · geochemical survey case study of arus and...
TRANSCRIPT

Presented at Short Course II on Surface Exploration for Geothermal Resources,
organized by UNU-GTP and KenGen, at Lake Naivasha, Kenya, 2-17 November, 2007.
GEOTHERMAL TRAINING PROGRAMME Kenya Electricity Generating Co., Ltd.
GEOCHEMICAL SURVEY CASE STUDY
OF ARUS AND BOGORIA GEOTHERMAL PROSPECTS
C. Karingithi & J. Wambugu
Kenya Electricity Generating Company Ltd. (KenGen)
P.O. Box 785, Naivasha
KENYA
ABSTRACT
Arus and Bogoria prospects encompass several features of geological significance
that are considered indicators of possible geothermal potential. These include
surface manifestations, such as, intense fumarolic activity (Arus), vigorous steam
jets and hot springs (L. Bogoria, Loboi, and Maji Moto areas), anomalous hot
ground water boreholes (Mugurin and Emining area) and some carbon dioxide
emitting holes in the Esageri area. The springs and boreholes have been sampled
and their chemical composition determined and evaluated. The steam jets of Lake
Bogoria discharge mixed fluid of different proportions of lake water, deep
geothermal fluid, and shallow ground water. High flows of discharging fluids were
recorded around Lake Bogoria and Maji Moto springs. Reservoir temperature
estimates using Quartz geothermometer range from 124 – 175oC for Lake Bogoria
springs, while the Na/K geothermometer gave temperature values ranging from
119 - 325oC for the same springs. The Arus hot springs give estimated
temperatures ranging from 115 – 161°C using the quartz geothermometer.
However, the high temperature estimates calculated using the Na/K ratio
geothermometer could not be reflective of the actual reservoir temperatures and
could have been influenced by other factors like mixing of reservoir fluids and
shallow ground waters or lack of fluid-mineral equilibrium. Gas geothermometry
indicated temperatures of 248oC for the Arus steam jets using the hydrogen
sulphide gas.
High radon –220 counts above 3000 counts per minute (cpm) were measured in the
western and south western areas of the prospects (Arus steam jets, Molo Sirwe and
north of Mugurin) while high values of radon-222 counts were measured between
the Arus steam jets and Molo Sirwe. These areas are considered to have high
permeability. The areas around the Lelen swamp, Maji Moto, the southern part of
Lake Bogoria, and the area north of Arus have anomalously high ground
temperatures in excess of 38°C. High carbon dioxide concentration in the soil gas
was observed around Arus, Molo Sirwe, Noiwet, and the area south of Lomollo.
The results indicate a possible geothermal resource exists in Arus and Bogoria
prospects. The resource is possibly characterized by medium to high temperatures.
The proposed first exploration well is sited near the Arus steam jets. A second
exploration well is proposed near Maji Moto area. These exploratory wells will be
used to assess the potential of the prospect areas in terms of available geothermal
reservoir.
Karingithi and Wambugu 2 Geochemical survey Arus and Bogoria
1. NTRODUCTION
1.1 Location of Study area
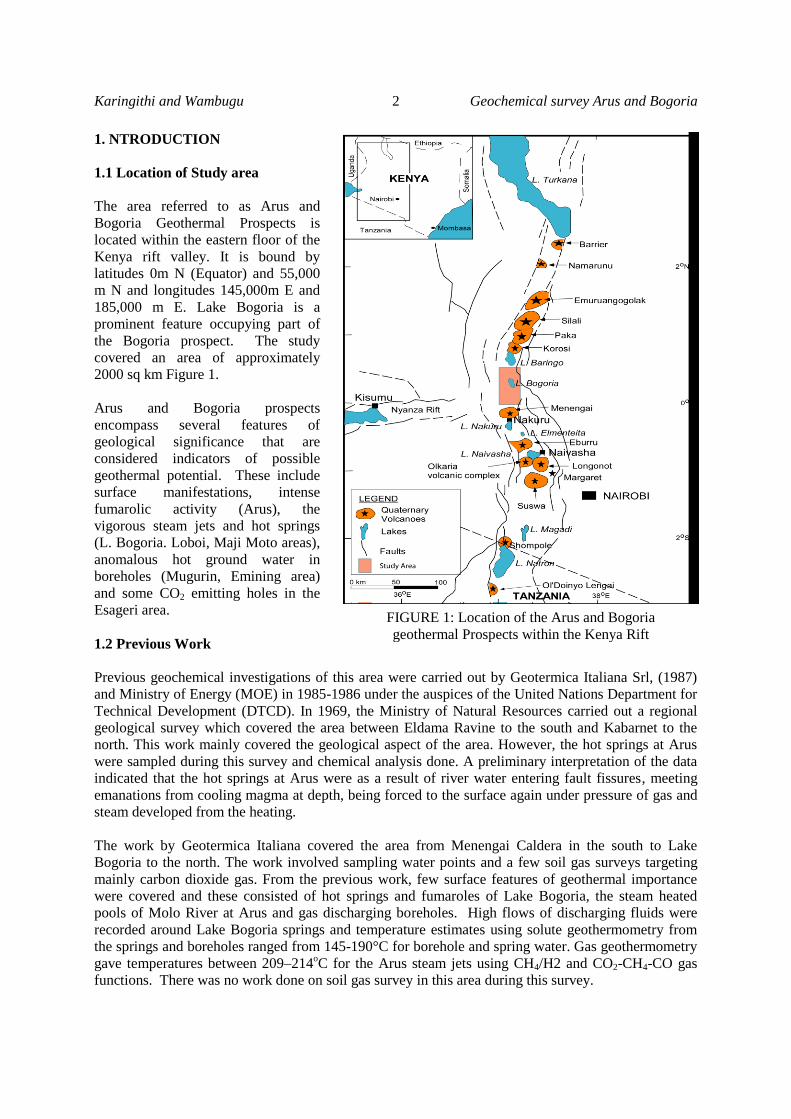
The area referred to as Arus and
Bogoria Geothermal Prospects is
located within the eastern floor of the
Kenya rift valley. It is bound by
latitudes 0m N (Equator) and 55,000
m N and longitudes 145,000m E and
185,000 m E. Lake Bogoria is a
prominent feature occupying part of
the Bogoria prospect. The study
covered an area of approximately
2000 sq km Figure 1.
Arus and Bogoria prospects
encompass several features of
geological significance that are
considered indicators of possible
geothermal potential. These include
surface manifestations, intense
fumarolic activity (Arus), the
vigorous steam jets and hot springs
(L. Bogoria. Loboi, Maji Moto areas),
anomalous hot ground water in
boreholes (Mugurin, Emining area)
and some CO2 emitting holes in the
Esageri area.
1.2 Previous Work
Previous geochemical investigations of this area were carried out by Geotermica Italiana Srl, (1987)
and Ministry of Energy (MOE) in 1985-1986 under the auspices of the United Nations Department for
Technical Development (DTCD). In 1969, the Ministry of Natural Resources carried out a regional
geological survey which covered the area between Eldama Ravine to the south and Kabarnet to the
north. This work mainly covered the geological aspect of the area. However, the hot springs at Arus
were sampled during this survey and chemical analysis done. A preliminary interpretation of the data
indicated that the hot springs at Arus were as a result of river water entering fault fissures, meeting
emanations from cooling magma at depth, being forced to the surface again under pressure of gas and
steam developed from the heating.
The work by Geotermica Italiana covered the area from Menengai Caldera in the south to Lake
Bogoria to the north. The work involved sampling water points and a few soil gas surveys targeting
mainly carbon dioxide gas. From the previous work, few surface features of geothermal importance
were covered and these consisted of hot springs and fumaroles of Lake Bogoria, the steam heated
pools of Molo River at Arus and gas discharging boreholes. High flows of discharging fluids were
recorded around Lake Bogoria springs and temperature estimates using solute geothermometry from
the springs and boreholes ranged from 145-190°C for borehole and spring water. Gas geothermometry
gave temperatures between 209–214oC for the Arus steam jets using CH4/H2 and CO2-CH4-CO gas
functions. There was no work done on soil gas survey in this area during this survey.
FIGURE 1: Location of the Arus and Bogoria
geothermal Prospects within the Kenya Rift
Geochemical survey Arus and Bogoria 3 Karingithi and Wambugu
1.3 Objectives
The objective of the current geochemical work is to gather enough geochemical data to be able to
determine the following:
Availability of a geothermal resource in this area
Extent of the resource
Chemical characteristics of the geothermal fluids present and their suitability for electric
power production or any other non-electrical uses.
Prevailing reservoir fluid temperatures
Whether the area deserves further exploration by deep drilling, and if so propose exploratory
drill sites.
2. METHODOLOGY
The geochemical surface exploration was programmed to take one hundred and eighty working days,
it was estimated to be adequate to sample all the fumaroles, springs, boreholes, expedite radon and soil
gas surveys in the study area. The work was divided into three phases;
Phase 1: Sampling of all boreholes and springs within the Arus and Bogoria prospects,
Phase 2: Fumarole gas sampling, steam condensates and soil gas and radon –222/220, sampling at all steaming
and altered grounds. The located fumaroles and boreholes in the prospects were mapped. All alteration
grounds were visited to establish whether anomalous temperatures or gaseous issuance existed during
this phase.
Phase 3: Soil gas surveys on both prospects, for measurements of radon-222/220 radioactivity and carbon
dioxide were conducted on the two prospects. Ground temperatures were also measured at a depth of
0.7m.
2.1 Springs and Boreholes Sampling and Analysis
Both cold and hot water samples were collected from the springs in the area for chemical analysis. The
area has two types of boreholes, capped or shut-in boreholes and flowing boreholes. Each type of
borehole required a different method of sampling. The flowing boreholes were fitted with either an
electrical or manual pump and could dispense water sample at the surface once the pump is switched
on. The sampling jug was cleaned with de-ionized water and rinsed with the sample at least three
times before a sample was taken. The sample taken was divided into several portions after filtration
where found necessary. Spring and lake sampling involved using a well rinsed jug to scoop the water
sample and divide the sample as described below after filtration.
The first portion was for immediate analysis for hydrogen sulphide (H2S), carbon dioxide (CO2), pH,
Conductivity, and total dissolved solids (TDS). A measured amount of 5% zinc acetate solution was
added to another portion of the sample for the fixation of sulphides. 1ml of concentrated nitric acid
was added to a third portion of the sample for the analysis of metal ions. A portion of the sample
earmarked for silica analysis was diluted ten times to avoid polymerisation of monomeric silica. The
last untreated portion of the sample was reserved for the analysis of Chloride (Cl) and Fluoride (F)
ions. Hydrogen sulphide gas (H2S) was analysed at the sampling site, while carbon dioxide (CO2),
Karingithi and Wambugu 4 Geochemical survey Arus and Bogoria
conductivity, total dissolved solids and pH were done at the end of each sampling day at the field
laboratory. Silica (SiO2), sulphates (SO4), Cl, F and the metals ions were analysed at the main
laboratory at Olkaria Geothermal Project Offices.
Both H2S and CO2 were analysed by titration methods using 0.01 M mercuric acetate and 0.01 M
hydrochloric acid respectively. The conductivity and TDS were measured using the conductivity and
TDS meters respectively while the pH was measured using a pH meter. Chloride and fluoride were
determined using the Mohr titration method and selective ion electrode method respectively.
2.2 Fumarole Steam Sampling and Radon-222/220 Radioactivity Measurements
A large funnel was used to cover the mouth of the fumarole and after ensuring thorough sealing, to
avoid air contamination, a flexible tube was fixed to the narrow outlet end of the funnel. The fumarole
gases were sampled by directing the steam into two evacuated gas sampling flask containing 50 ml of
40% sodium hydroxide solution and with continuous cooling using cold water pouring on the outside
of the flask. Carbon dioxide and hydrogen sulphide gases are absorbed by the sodium hydroxide
solution and hence create space for the residue gases such as, hydrogen, nitrogen, methane, argon etc.
One flask is used for the analysis of carbon dioxide and hydrogen sulphide. While the other flask is
earmarked for the analysis of hydrogen, Oxygen, nitrogen and methane at the Olkaria geothermal
laboratory using the gas chromatograph.
After the gas samples were collected, the flexible tube was connected to a cooling coil, submerged in
cooling water. The coil was then connected to a flask attached to a hand pump or a field pump.
Through pumping, the condensate from the steam issuing from the fumarole was collected. The
collected condensate was divided into five portions as described in 3.1 above and immediate analysis
done. Dry fumarole steam was passed into the radon detector and three radon counts from the LED
display of the detector were recorded in one minute intervals. After the radon – 222/220 radioactivity
measurement, the flexible tube was connected to the Orsat apparatus, for the determination of CO2 in
the soil gas.
2.3 Radon –222/220 and CO2 in Soil Gas Survey
Random soil gas stations were established to optimise the available time allowed. The spacing
between the sampling stations varied from 1km to 5km. The survey carried out involved measuring
CO2, Radon-222 & Radon – 220, and ground temperature measured at 0.7 m. A spike with an outer
steel jacket was used to penetrate the ground to desired depth as described above. The outer jacket
was left inside the hole to allow for the sampling after the spike was removed. A stopper attached to a
flexible tube was fixed on to the mouth of the outer jacket and by using a hand operated vacuum
pump, soil gas was driven into the radon detector. Three radon counts readout from the LED display
were recorded in one minute intervals. During this operation, the soil gas sample containing radon is
forced into the decay chamber of the emanometer (radon detector) consisting of a cylindrical copper
can, whose walls are coated with zinc sulphide where the radon decays into other radioactive nuclides
by emitting alpha particles. The alpha emissions are detected by a photomultiplier attached to the
detector and a rate meter displays the signals. Three background counts were recorded at one minute
intervals prior to introduction of the sample into the emanometer. Both the Rn-222 and Rn -220 are
detected by the emanometer but since they have different half lives, it is possible to differentiate
between the two. After the radon measurements, the flexible tubing was connected to the Orsat
apparatus, for the determination of %CO2 in the soil gas. Finally, a temperature probe was inserted
into the hole made by the spike and after sealing the open-hole, the temperature was noted and
recorded from a digital thermocouple thermometer.
Geochemical survey Arus and Bogoria 5 Karingithi and Wambugu
3. RESULTS
3.1 Chemical Composition of Borehole and Spring Water Samples
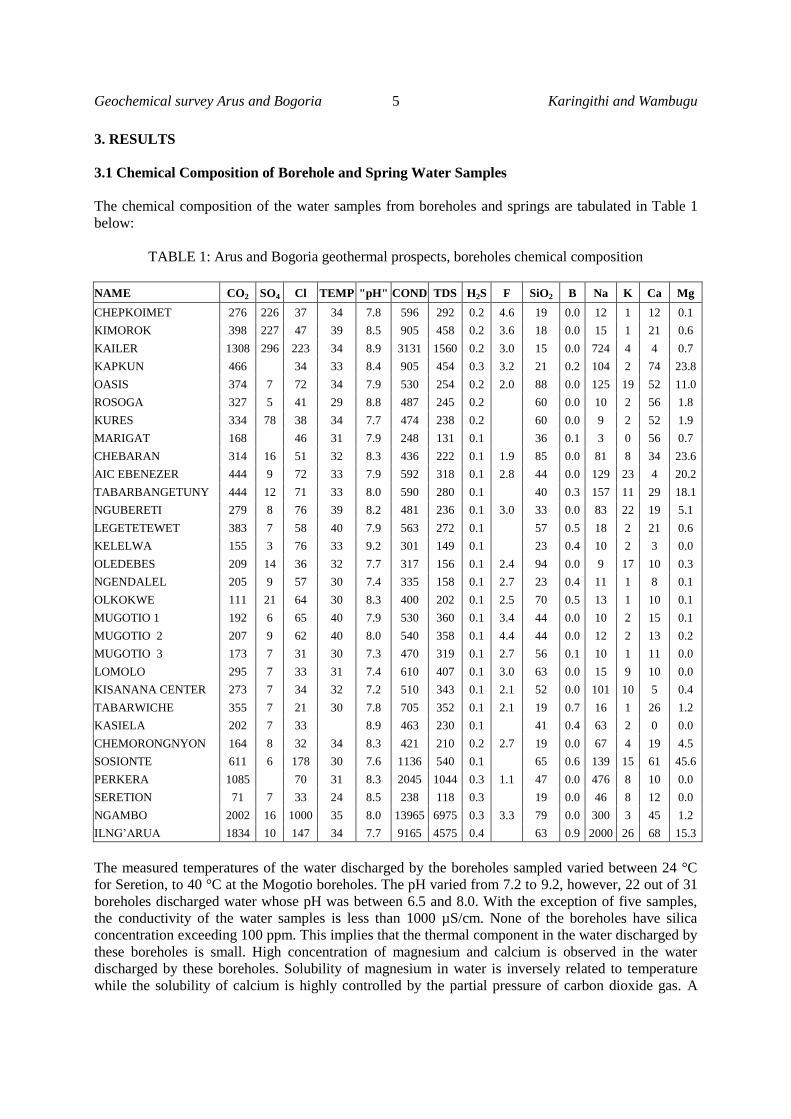
The chemical composition of the water samples from boreholes and springs are tabulated in Table 1
below:
TABLE 1: Arus and Bogoria geothermal prospects, boreholes chemical composition
NAME CO2 SO4 Cl TEMP "pH" COND TDS H2S F SiO2 B Na K Ca Mg
CHEPKOIMET 276 226 37 34 7.8 596 292 0.2 4.6 19 0.0 12 1 12 0.1
KIMOROK 398 227 47 39 8.5 905 458 0.2 3.6 18 0.0 15 1 21 0.6
KAILER 1308 296 223 34 8.9 3131 1560 0.2 3.0 15 0.0 724 4 4 0.7
KAPKUN 466 34 33 8.4 905 454 0.3 3.2 21 0.2 104 2 74 23.8
OASIS 374 7 72 34 7.9 530 254 0.2 2.0 88 0.0 125 19 52 11.0
ROSOGA 327 5 41 29 8.8 487 245 0.2 60 0.0 10 2 56 1.8
KURES 334 78 38 34 7.7 474 238 0.2 60 0.0 9 2 52 1.9
MARIGAT 168 46 31 7.9 248 131 0.1 36 0.1 3 0 56 0.7
CHEBARAN 314 16 51 32 8.3 436 222 0.1 1.9 85 0.0 81 8 34 23.6
AIC EBENEZER 444 9 72 33 7.9 592 318 0.1 2.8 44 0.0 129 23 4 20.2
TABARBANGETUNY 444 12 71 33 8.0 590 280 0.1 40 0.3 157 11 29 18.1
NGUBERETI 279 8 76 39 8.2 481 236 0.1 3.0 33 0.0 83 22 19 5.1
LEGETETEWET 383 7 58 40 7.9 563 272 0.1 57 0.5 18 2 21 0.6
KELELWA 155 3 76 33 9.2 301 149 0.1 23 0.4 10 2 3 0.0
OLEDEBES 209 14 36 32 7.7 317 156 0.1 2.4 94 0.0 9 17 10 0.3
NGENDALEL 205 9 57 30 7.4 335 158 0.1 2.7 23 0.4 11 1 8 0.1
OLKOKWE 111 21 64 30 8.3 400 202 0.1 2.5 70 0.5 13 1 10 0.1
MUGOTIO 1 192 6 65 40 7.9 530 360 0.1 3.4 44 0.0 10 2 15 0.1
MUGOTIO 2 207 9 62 40 8.0 540 358 0.1 4.4 44 0.0 12 2 13 0.2
MUGOTIO 3 173 7 31 30 7.3 470 319 0.1 2.7 56 0.1 10 1 11 0.0
LOMOLO 295 7 33 31 7.4 610 407 0.1 3.0 63 0.0 15 9 10 0.0
KISANANA CENTER 273 7 34 32 7.2 510 343 0.1 2.1 52 0.0 101 10 5 0.4
TABARWICHE 355 7 21 30 7.8 705 352 0.1 2.1 19 0.7 16 1 26 1.2
KASIELA 202 7 33 8.9 463 230 0.1 41 0.4 63 2 0 0.0
CHEMORONGNYON 164 8 32 34 8.3 421 210 0.2 2.7 19 0.0 67 4 19 4.5
SOSIONTE 611 6 178 30 7.6 1136 540 0.1 65 0.6 139 15 61 45.6
PERKERA 1085 70 31 8.3 2045 1044 0.3 1.1 47 0.0 476 8 10 0.0
SERETION 71 7 33 24 8.5 238 118 0.3 19 0.0 46 8 12 0.0
NGAMBO 2002 16 1000 35 8.0 13965 6975 0.3 3.3 79 0.0 300 3 45 1.2
ILNG’ARUA 1834 10 147 34 7.7 9165 4575 0.4 63 0.9 2000 26 68 15.3
The measured temperatures of the water discharged by the boreholes sampled varied between 24 °C
for Seretion, to 40 °C at the Mogotio boreholes. The pH varied from 7.2 to 9.2, however, 22 out of 31
boreholes discharged water whose pH was between 6.5 and 8.0. With the exception of five samples,
the conductivity of the water samples is less than 1000 µS/cm. None of the boreholes have silica
concentration exceeding 100 ppm. This implies that the thermal component in the water discharged by
these boreholes is small. High concentration of magnesium and calcium is observed in the water
discharged by these boreholes. Solubility of magnesium in water is inversely related to temperature
while the solubility of calcium is highly controlled by the partial pressure of carbon dioxide gas. A
Karingithi and Wambugu 6 Geochemical survey Arus and Bogoria
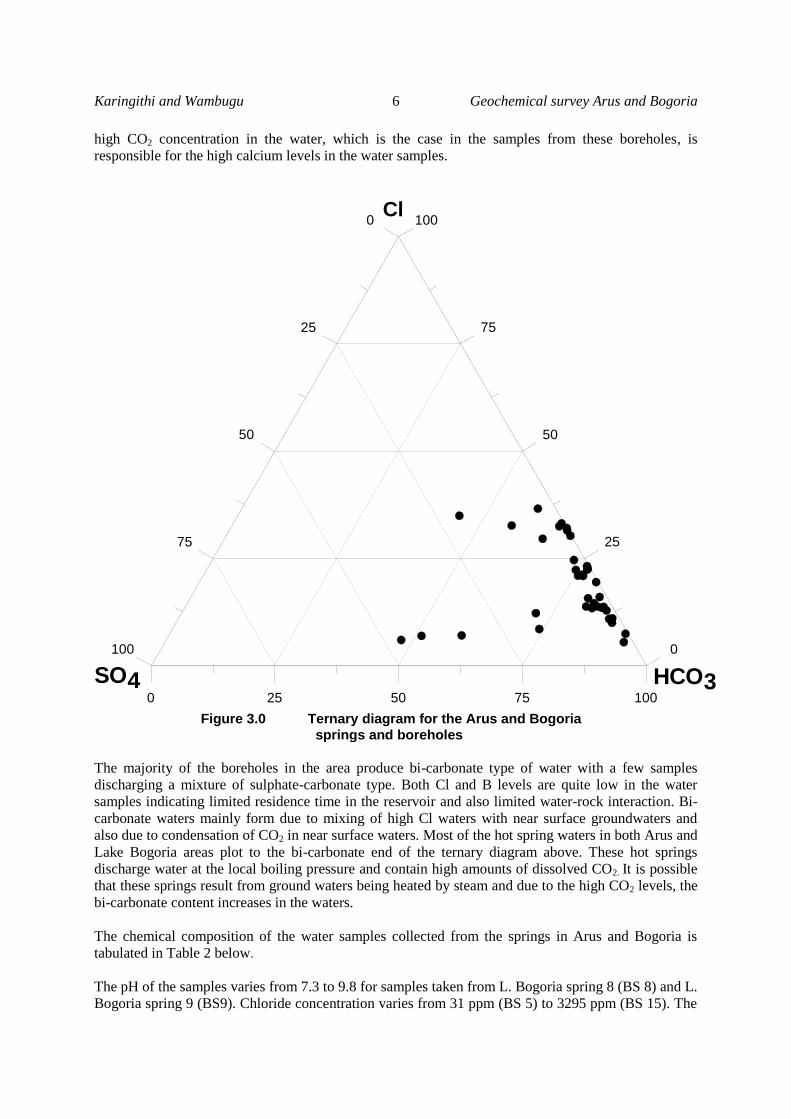
high CO2 concentration in the water, which is the case in the samples from these boreholes, is
responsible for the high calcium levels in the water samples.
0 25 50 75 100
HCO3
100
75
50
25
0
Cl
100
75
50
25
0
SO4
Figure 3.0 Ternary diagram for the Arus and Bogoria
springs and boreholes
The majority of the boreholes in the area produce bi-carbonate type of water with a few samples
discharging a mixture of sulphate-carbonate type. Both Cl and B levels are quite low in the water
samples indicating limited residence time in the reservoir and also limited water-rock interaction. Bi-
carbonate waters mainly form due to mixing of high Cl waters with near surface groundwaters and
also due to condensation of CO2 in near surface waters. Most of the hot spring waters in both Arus and
Lake Bogoria areas plot to the bi-carbonate end of the ternary diagram above. These hot springs
discharge water at the local boiling pressure and contain high amounts of dissolved CO2. It is possible
that these springs result from ground waters being heated by steam and due to the high CO2 levels, the
bi-carbonate content increases in the waters.
The chemical composition of the water samples collected from the springs in Arus and Bogoria is
tabulated in Table 2 below.
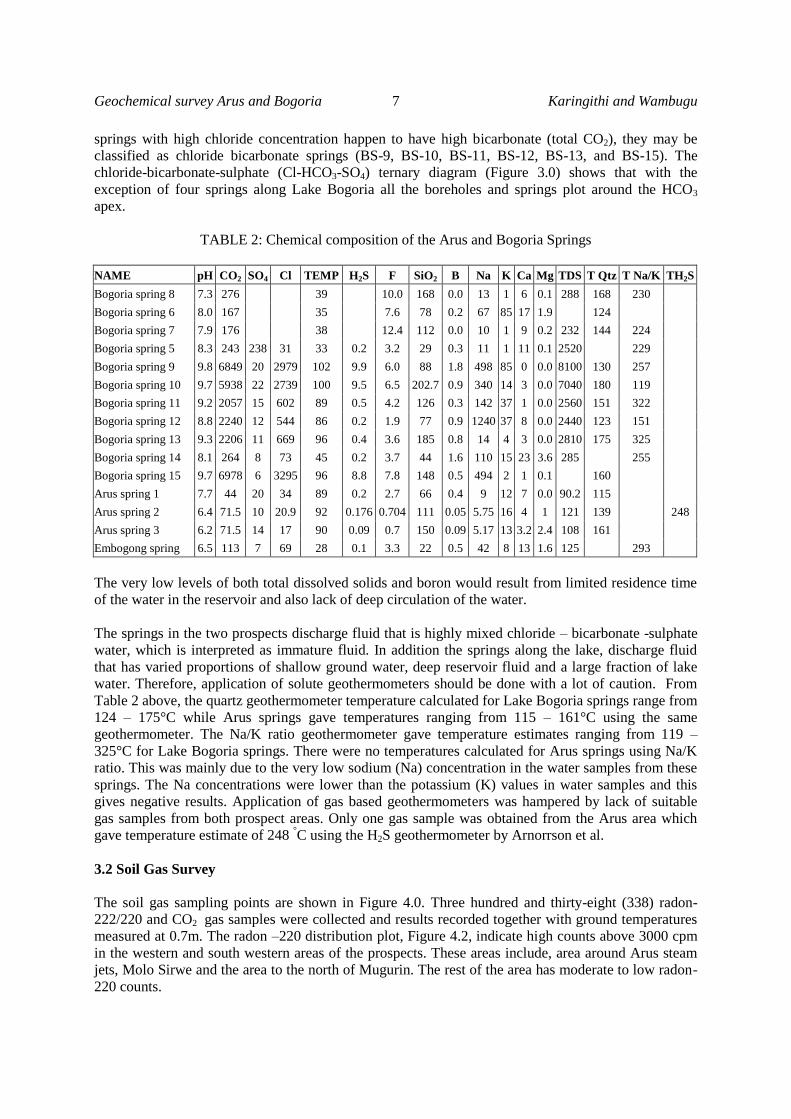
The pH of the samples varies from 7.3 to 9.8 for samples taken from L. Bogoria spring 8 (BS 8) and L.
Bogoria spring 9 (BS9). Chloride concentration varies from 31 ppm (BS 5) to 3295 ppm (BS 15). The
Geochemical survey Arus and Bogoria 7 Karingithi and Wambugu
springs with high chloride concentration happen to have high bicarbonate (total CO2), they may be
classified as chloride bicarbonate springs (BS-9, BS-10, BS-11, BS-12, BS-13, and BS-15). The
chloride-bicarbonate-sulphate (Cl-HCO3-SO4) ternary diagram (Figure 3.0) shows that with the
exception of four springs along Lake Bogoria all the boreholes and springs plot around the HCO3
apex.
TABLE 2: Chemical composition of the Arus and Bogoria Springs
NAME pH CO2 SO4 Cl TEMP H2S F SiO2 B Na K Ca Mg TDS T Qtz T Na/K TH2S
Bogoria spring 8 7.3 276 39 10.0 168 0.0 13 1 6 0.1 288 168 230
Bogoria spring 6 8.0 167 35 7.6 78 0.2 67 85 17 1.9 124
Bogoria spring 7 7.9 176 38 12.4 112 0.0 10 1 9 0.2 232 144 224
Bogoria spring 5 8.3 243 238 31 33 0.2 3.2 29 0.3 11 1 11 0.1 2520 229
Bogoria spring 9 9.8 6849 20 2979 102 9.9 6.0 88 1.8 498 85 0 0.0 8100 130 257
Bogoria spring 10 9.7 5938 22 2739 100 9.5 6.5 202.7 0.9 340 14 3 0.0 7040 180 119
Bogoria spring 11 9.2 2057 15 602 89 0.5 4.2 126 0.3 142 37 1 0.0 2560 151 322
Bogoria spring 12 8.8 2240 12 544 86 0.2 1.9 77 0.9 1240 37 8 0.0 2440 123 151
Bogoria spring 13 9.3 2206 11 669 96 0.4 3.6 185 0.8 14 4 3 0.0 2810 175 325
Bogoria spring 14 8.1 264 8 73 45 0.2 3.7 44 1.6 110 15 23 3.6 285 255
Bogoria spring 15 9.7 6978 6 3295 96 8.8 7.8 148 0.5 494 2 1 0.1 160
Arus spring 1 7.7 44 20 34 89 0.2 2.7 66 0.4 9 12 7 0.0 90.2 115
Arus spring 2 6.4 71.5 10 20.9 92 0.176 0.704 111 0.05 5.75 16 4 1 121 139 248
Arus spring 3 6.2 71.5 14 17 90 0.09 0.7 150 0.09 5.17 13 3.2 2.4 108 161
Embogong spring 6.5 113 7 69 28 0.1 3.3 22 0.5 42 8 13 1.6 125 293
The very low levels of both total dissolved solids and boron would result from limited residence time
of the water in the reservoir and also lack of deep circulation of the water.
The springs in the two prospects discharge fluid that is highly mixed chloride – bicarbonate -sulphate
water, which is interpreted as immature fluid. In addition the springs along the lake, discharge fluid
that has varied proportions of shallow ground water, deep reservoir fluid and a large fraction of lake
water. Therefore, application of solute geothermometers should be done with a lot of caution. From
Table 2 above, the quartz geothermometer temperature calculated for Lake Bogoria springs range from
124 – 175°C while Arus springs gave temperatures ranging from 115 – 161°C using the same
geothermometer. The Na/K ratio geothermometer gave temperature estimates ranging from 119 –
325°C for Lake Bogoria springs. There were no temperatures calculated for Arus springs using Na/K
ratio. This was mainly due to the very low sodium (Na) concentration in the water samples from these
springs. The Na concentrations were lower than the potassium (K) values in water samples and this
gives negative results. Application of gas based geothermometers was hampered by lack of suitable
gas samples from both prospect areas. Only one gas sample was obtained from the Arus area which
gave temperature estimate of 248 °C using the H2S geothermometer by Arnorrson et al.
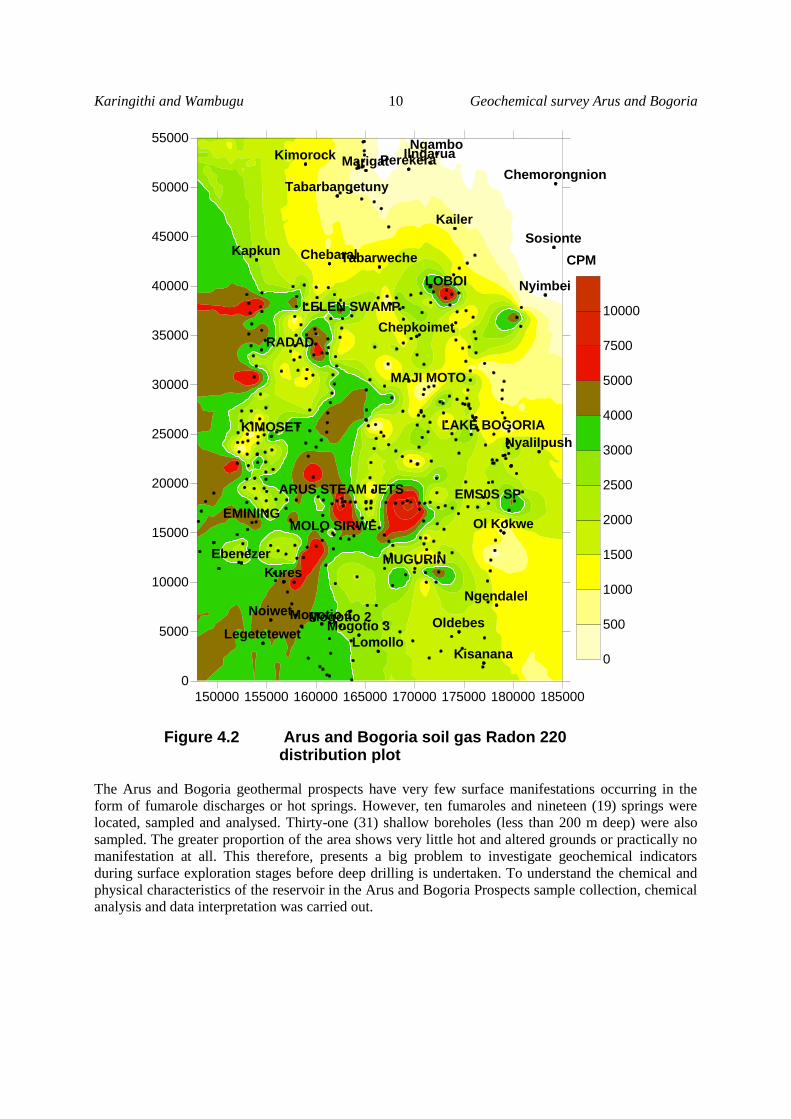
3.2 Soil Gas Survey
The soil gas sampling points are shown in Figure 4.0. Three hundred and thirty-eight (338) radon-
222/220 and CO2 gas samples were collected and results recorded together with ground temperatures
measured at 0.7m. The radon –220 distribution plot, Figure 4.2, indicate high counts above 3000 cpm
in the western and south western areas of the prospects. These areas include, area around Arus steam
jets, Molo Sirwe and the area to the north of Mugurin. The rest of the area has moderate to low radon-
220 counts.

Karingithi and Wambugu 8 Geochemical survey Arus and Bogoria
The radon-222 distribution plot, Figure 4.3, indicate high counts in the area between the Arus steam
jets and Molo Sirwe. The rest of the prospect’s area has low counts of less than 500 cpm. The ground
temperature distribution plot, Figure 4.4, reveals high ground temperatures in the following areas, the
area north of Arus steam jets, Lelen swamp, Maji Moto, and the southern part of Lake Bogoria and
also the area around Loboi and Nyimbei.
The soil gas carbon dioxide distribution plot is shown in Figure 4.5. The areas with high CO2 gas
concentration are between Arus and Molo Sirwe, Noiwet, and the area south of Lomollo. The rest of
the area in both prospects has low CO2 in the soil gas. The radon- 222 and CO2 gas ratio distribution
plot is shown in Figure 4.6. The anomalous area is around Molo Sirwe. The rest of the prospect area
has no clear pattern.
150000 155000 160000 165000 170000 175000 180000 185000
0
5000
10000
15000
20000
25000
30000
35000
40000
45000
50000
55000
LOBOI
MAJI MOTO
LAKE BOGORIA
EMS0S SP
MUGURIN
ARUS STEAM JETS
MOLO SIRWEEMINING
KIMOSET
RADAD
LELEN SWAMP
Kapkun
Kimorock
Chepkoimet
Kailer
Kures
Marigat
Chebaral
Ebenezer
Tabarbangetuny
Noiwet
LegetetewetOldebes
Ngendalel
Nyalilpush
Ol Kokwe
Mogotio 1Mogotio 2Mogotio 3
LomolloKisanana
Tabarweche
Chemorongnion
Sosionte
Nyimbei
IlngaruaNgambo
Perekera
950
1050
1150
1250
1350
1450
1550
1650
1750
1850
Figure 4.0 Arus and Bogoria all sampling points plot
masl
Geochemical survey Arus and Bogoria 9 Karingithi and Wambugu
150000 155000 160000 165000 170000 175000 180000 185000
0
5000
10000
15000
20000
25000
30000
35000
40000
45000
50000
55000
LOBOI
MAJI MOTO
LAKE BOGORIA
EMS0S SP
MUGURIN
ARUS STEAM JETS
MOLO SIRWEEMINING
KIMOSET
RADAD
LELEN SWAMP
Kapkun
Kimorock
Chepkoimet
Kailer
Kures
Marigat
Chebaral
Ebenezer
Tabarbangetuny
Noiwet
LegetetewetOldebes
Ngendalel
Nyalilpush
Ol Kokwe
Mogotio 1Mogotio 2Mogotio 3
LomolloKisanana
Tabarweche
Chemorongnion
Sosionte
Nyimbei
IlngaruaNgambo
Perekera
950
1050
1150
1250
1350
1450
1550
1650
1750
1850
masl
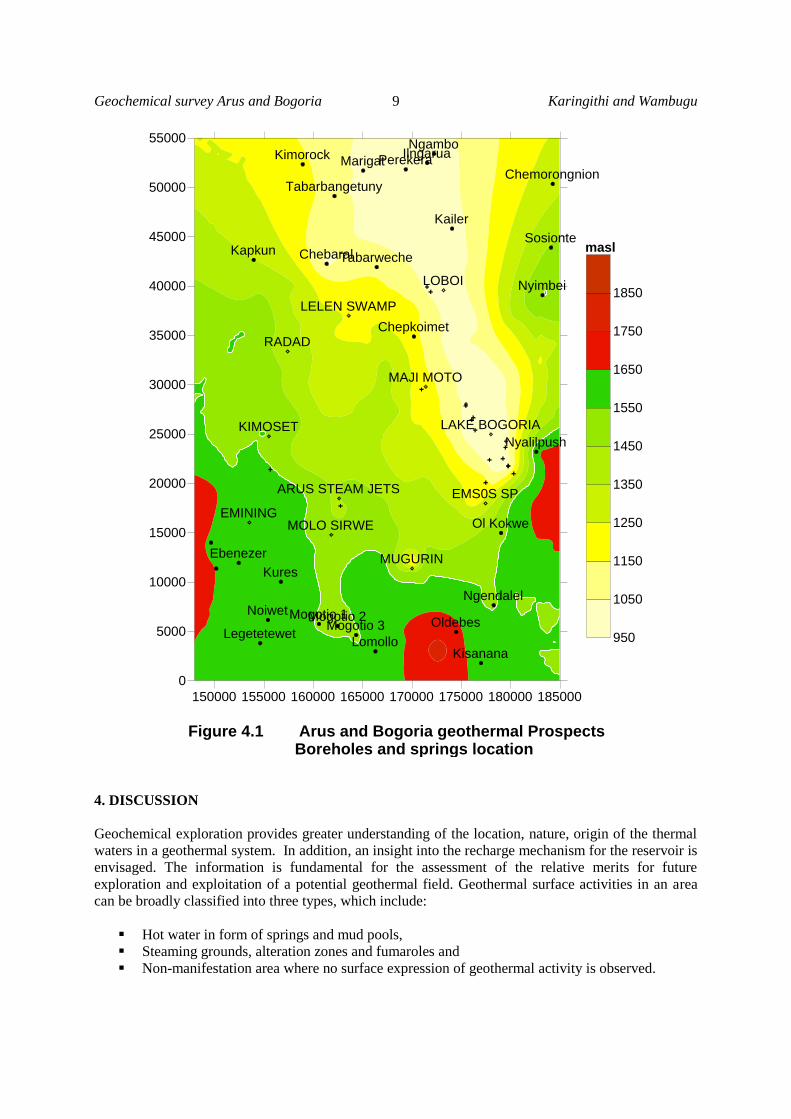
Figure 4.1 Arus and Bogoria geothermal Prospects Boreholes and springs location
4. DISCUSSION
Geochemical exploration provides greater understanding of the location, nature, origin of the thermal
waters in a geothermal system. In addition, an insight into the recharge mechanism for the reservoir is
envisaged. The information is fundamental for the assessment of the relative merits for future
exploration and exploitation of a potential geothermal field. Geothermal surface activities in an area
can be broadly classified into three types, which include:
Hot water in form of springs and mud pools,
Steaming grounds, alteration zones and fumaroles and
Non-manifestation area where no surface expression of geothermal activity is observed.
Karingithi and Wambugu 10 Geochemical survey Arus and Bogoria
150000 155000 160000 165000 170000 175000 180000 185000
0
5000
10000
15000
20000
25000
30000
35000
40000
45000
50000
55000
Kapkun
Kimorock
Chepkoimet
Kailer
Kures
Marigat
Chebaral
Ebenezer
Tabarbangetuny
Noiwet
LegetetewetOldebes
Ngendalel
Nyalilpush
Ol Kokwe
Mogotio 1Mogotio 2Mogotio 3
LomolloKisanana
Tabarweche
Chemorongnion
Sosionte
Nyimbei
IlngaruaNgambo
Perekera
LOBOI
MAJI MOTO
LAKE BOGORIA
EMS0S SP
MUGURIN
ARUS STEAM JETS
MOLO SIRWEEMINING
KIMOSET
RADAD
LELEN SWAMP
0
500
1000
1500
2000
2500
3000
4000
5000
7500
10000
CPM
Figure 4.2 Arus and Bogoria soil gas Radon 220 distribution plot
The Arus and Bogoria geothermal prospects have very few surface manifestations occurring in the
form of fumarole discharges or hot springs. However, ten fumaroles and nineteen (19) springs were
located, sampled and analysed. Thirty-one (31) shallow boreholes (less than 200 m deep) were also
sampled. The greater proportion of the area shows very little hot and altered grounds or practically no
manifestation at all. This therefore, presents a big problem to investigate geochemical indicators
during surface exploration stages before deep drilling is undertaken. To understand the chemical and
physical characteristics of the reservoir in the Arus and Bogoria Prospects sample collection, chemical
analysis and data interpretation was carried out.
Geochemical survey Arus and Bogoria 11 Karingithi and Wambugu
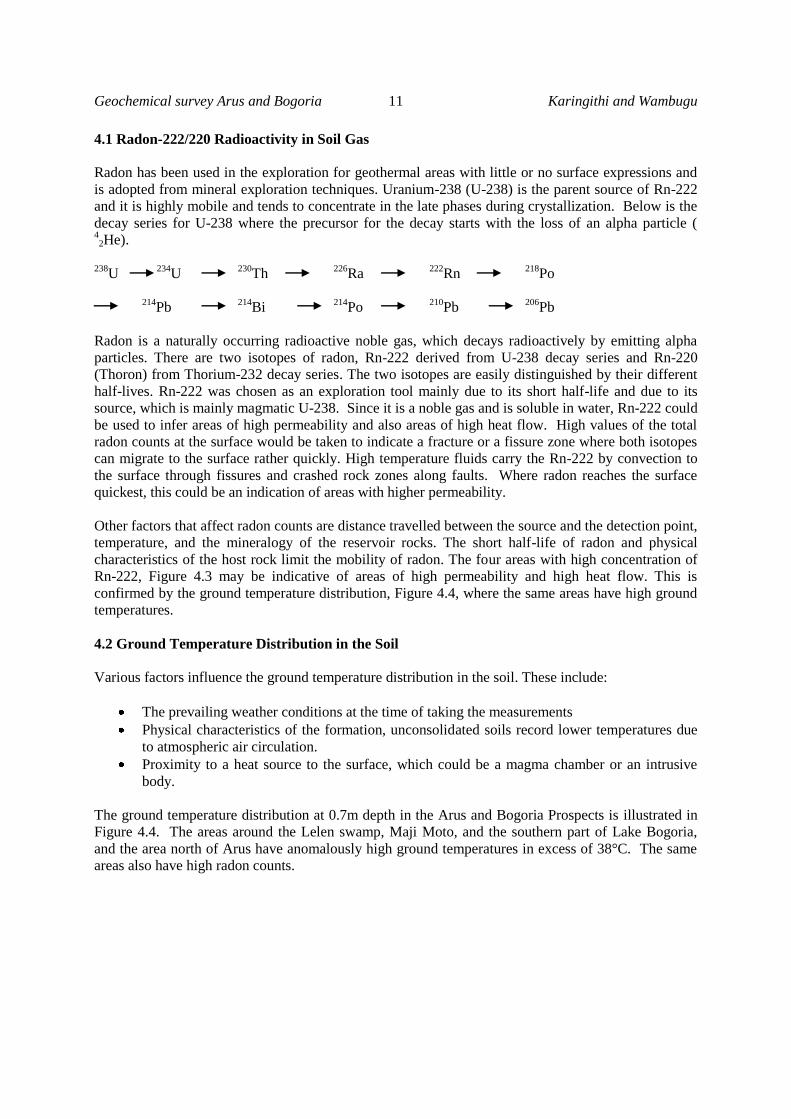
4.1 Radon-222/220 Radioactivity in Soil Gas
Radon has been used in the exploration for geothermal areas with little or no surface expressions and
is adopted from mineral exploration techniques. Uranium-238 (U-238) is the parent source of Rn-222
and it is highly mobile and tends to concentrate in the late phases during crystallization. Below is the
decay series for U-238 where the precursor for the decay starts with the loss of an alpha particle ( 4
2He).
238
U 234
U 230
Th 226
Ra 222
Rn 218
Po
214
Pb 214
Bi 214
Po 210
Pb 206
Pb
Radon is a naturally occurring radioactive noble gas, which decays radioactively by emitting alpha
particles. There are two isotopes of radon, Rn-222 derived from U-238 decay series and Rn-220
(Thoron) from Thorium-232 decay series. The two isotopes are easily distinguished by their different
half-lives. Rn-222 was chosen as an exploration tool mainly due to its short half-life and due to its
source, which is mainly magmatic U-238. Since it is a noble gas and is soluble in water, Rn-222 could
be used to infer areas of high permeability and also areas of high heat flow. High values of the total
radon counts at the surface would be taken to indicate a fracture or a fissure zone where both isotopes
can migrate to the surface rather quickly. High temperature fluids carry the Rn-222 by convection to
the surface through fissures and crashed rock zones along faults. Where radon reaches the surface
quickest, this could be an indication of areas with higher permeability.
Other factors that affect radon counts are distance travelled between the source and the detection point,
temperature, and the mineralogy of the reservoir rocks. The short half-life of radon and physical
characteristics of the host rock limit the mobility of radon. The four areas with high concentration of
Rn-222, Figure 4.3 may be indicative of areas of high permeability and high heat flow. This is
confirmed by the ground temperature distribution, Figure 4.4, where the same areas have high ground
temperatures.
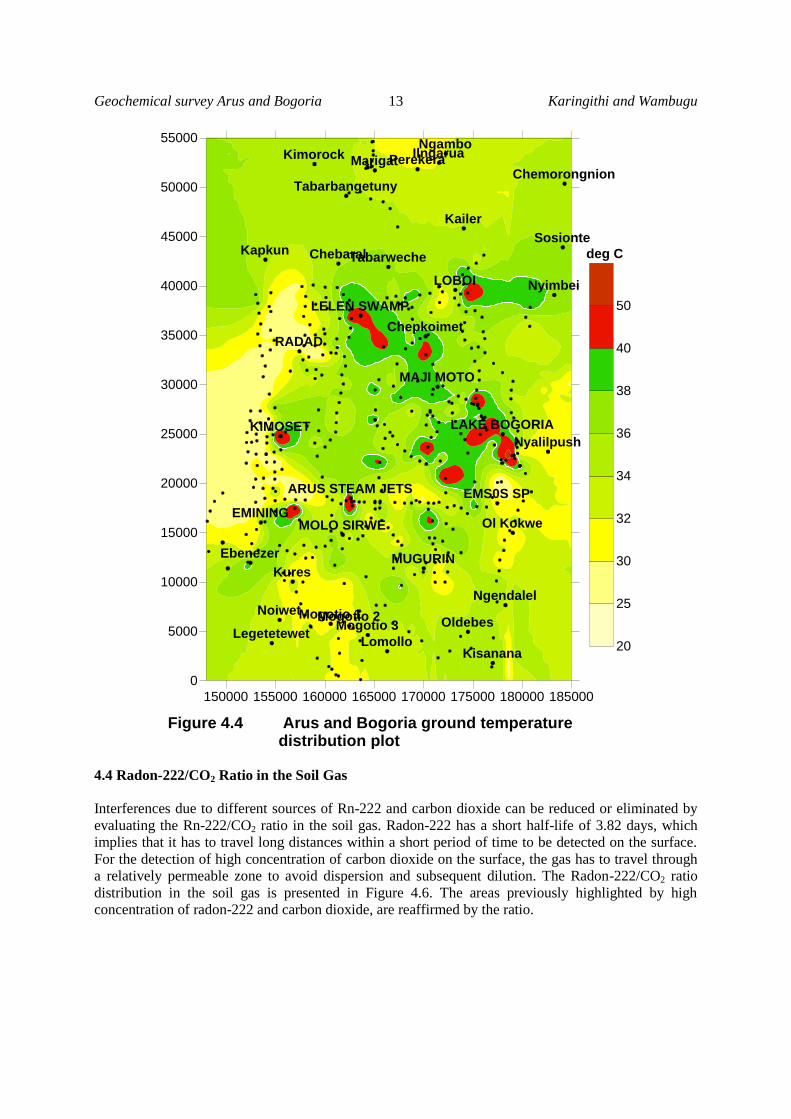
4.2 Ground Temperature Distribution in the Soil
Various factors influence the ground temperature distribution in the soil. These include:
The prevailing weather conditions at the time of taking the measurements
Physical characteristics of the formation, unconsolidated soils record lower temperatures due
to atmospheric air circulation.
Proximity to a heat source to the surface, which could be a magma chamber or an intrusive
body.
The ground temperature distribution at 0.7m depth in the Arus and Bogoria Prospects is illustrated in
Figure 4.4. The areas around the Lelen swamp, Maji Moto, and the southern part of Lake Bogoria,
and the area north of Arus have anomalously high ground temperatures in excess of 38°C. The same
areas also have high radon counts.

Karingithi and Wambugu 12 Geochemical survey Arus and Bogoria
150000 155000 160000 165000 170000 175000 180000 185000
0
5000
10000
15000
20000
25000
30000
35000
40000
45000
50000
55000
Kapkun
Kimorock
Chepkoimet
Kailer
Kures
Marigat
Chebaral
Ebenezer
Tabarbangetuny
Noiwet
LegetetewetOldebes
Ngendalel
Nyalilpush
Ol Kokwe
Mogotio 1Mogotio 2Mogotio 3
LomolloKisanana
Tabarweche
Chemorongnion
Sosionte
Nyimbei
IlngaruaNgambo
Perekera
LOBOI
MAJI MOTO
LAKE BOGORIA
EMS0S SP
MUGURIN
ARUS STEAM JETS
MOLO SIRWEEMINING
KIMOSET
RADAD
LELEN SWAMP
0
50
100
200
400
600
800
1000
2500
3000
CPM
Figure 4.3 Arus and Bogoria soil gas Radon - 222 distribution plot
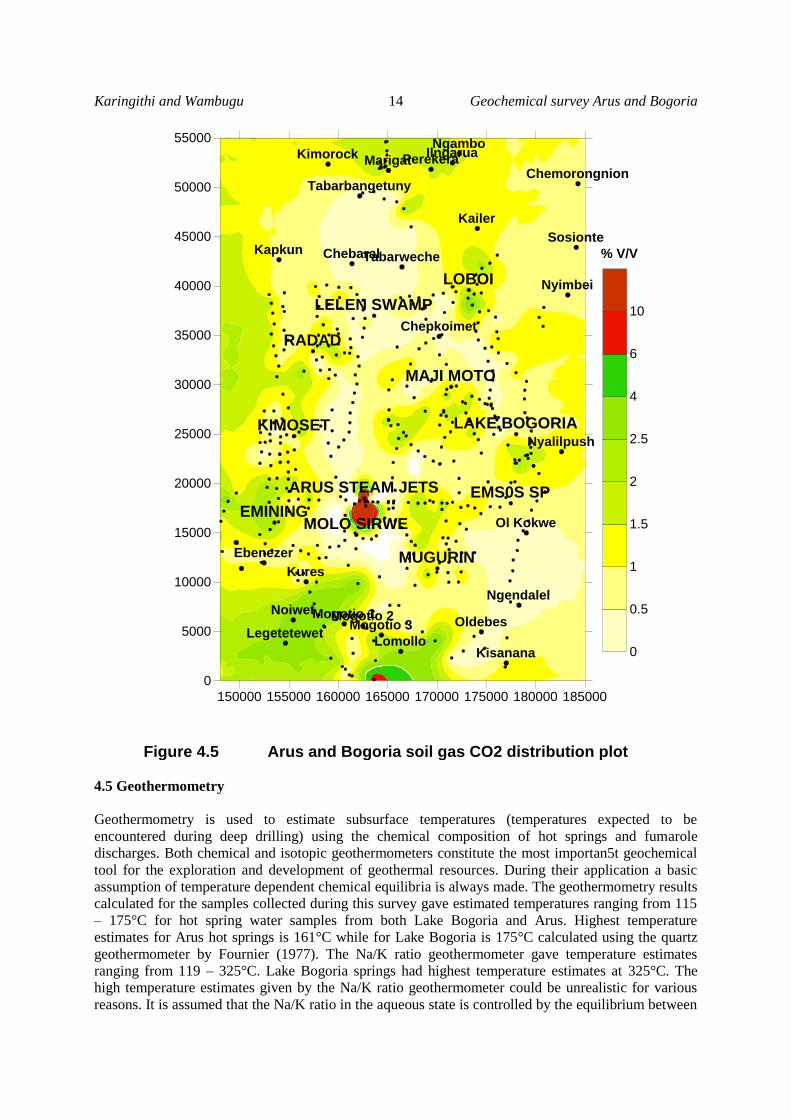
4.3 Carbon Dioxide Distribution in the Soil Gas
In an area like Arus and Bogoria geothermal prospects with few surface expressions, carbon dioxide in
the soil gas is useful in the search for buried fumarolic activity, or to confirm presence of potential
geothermal areas where other evidence is lacking. The porosity of the formation and other biogenic
sources also determine the concentration of carbon dioxide measured in the soil gas. High carbon
dioxide concentration in the soil gas, Figure 4.5, was observed around Arus, Molo Sirwe, Noiwet, and
the area south of Lomollo. These areas coincide with deep-seated faults or fractures where the source
may be from a magmatic body (Lagat, per. Com.). The presence of a thick alluvial cover over most of
the area may interfere with the movement of carbon dioxide to the surface and hence cause erroneous
interpretation.
Geochemical survey Arus and Bogoria 13 Karingithi and Wambugu
150000 155000 160000 165000 170000 175000 180000 185000
0
5000
10000
15000
20000
25000
30000
35000
40000
45000
50000
55000
Kapkun
Kimorock
Chepkoimet
Kailer
Kures
Marigat
Chebaral
Ebenezer
Tabarbangetuny
Noiwet
LegetetewetOldebes
Ngendalel
Nyalilpush
Ol Kokwe
Mogotio 1Mogotio 2Mogotio 3
LomolloKisanana
Tabarweche
Chemorongnion
Sosionte
Nyimbei
IlngaruaNgambo
Perekera
LOBOI
MAJI MOTO
LAKE BOGORIA
EMS0S SP
MUGURIN
ARUS STEAM JETS
MOLO SIRWEEMINING
KIMOSET
RADAD
LELEN SWAMP
20
25
30
32
34
36
38
40
50
deg C
Figure 4.4 Arus and Bogoria ground temperature distribution plot
4.4 Radon-222/CO2 Ratio in the Soil Gas
Interferences due to different sources of Rn-222 and carbon dioxide can be reduced or eliminated by
evaluating the Rn-222/CO2 ratio in the soil gas. Radon-222 has a short half-life of 3.82 days, which
implies that it has to travel long distances within a short period of time to be detected on the surface.
For the detection of high concentration of carbon dioxide on the surface, the gas has to travel through
a relatively permeable zone to avoid dispersion and subsequent dilution. The Radon-222/CO2 ratio
distribution in the soil gas is presented in Figure 4.6. The areas previously highlighted by high
concentration of radon-222 and carbon dioxide, are reaffirmed by the ratio.
Karingithi and Wambugu 14 Geochemical survey Arus and Bogoria
150000 155000 160000 165000 170000 175000 180000 185000
0
5000
10000
15000
20000
25000
30000
35000
40000
45000
50000
55000
Kapkun
Kimorock
Chepkoimet
Kailer
Kures
Marigat
Chebaral
Ebenezer
Tabarbangetuny
Noiwet
LegetetewetOldebes
Ngendalel
Nyalilpush
Ol Kokwe
Mogotio 1Mogotio 2Mogotio 3
LomolloKisanana
Tabarweche
Chemorongnion
Sosionte
Nyimbei
IlngaruaNgambo
Perekera
LOBOI
MAJI MOTO
LAKE BOGORIA
EMS0S SP
MUGURIN
ARUS STEAM JETS
MOLO SIRWEEMINING
KIMOSET
RADAD
LELEN SWAMP
0
0.5
1
1.5
2
2.5
4
6
10
Figure 4.5 Arus and Bogoria soil gas CO2 distribution plot
% V/V
4.5 Geothermometry
Geothermometry is used to estimate subsurface temperatures (temperatures expected to be
encountered during deep drilling) using the chemical composition of hot springs and fumarole
discharges. Both chemical and isotopic geothermometers constitute the most importan5t geochemical
tool for the exploration and development of geothermal resources. During their application a basic
assumption of temperature dependent chemical equilibria is always made. The geothermometry results
calculated for the samples collected during this survey gave estimated temperatures ranging from 115
– 175°C for hot spring water samples from both Lake Bogoria and Arus. Highest temperature
estimates for Arus hot springs is 161°C while for Lake Bogoria is 175°C calculated using the quartz
geothermometer by Fournier (1977). The Na/K ratio geothermometer gave temperature estimates
ranging from 119 – 325°C. Lake Bogoria springs had highest temperature estimates at 325°C. The
high temperature estimates given by the Na/K ratio geothermometer could be unrealistic for various
reasons. It is assumed that the Na/K ratio in the aqueous state is controlled by the equilibrium between

Geochemical survey Arus and Bogoria 15 Karingithi and Wambugu
the geothermal water and the alkali feldspar minerals. If other mineral phases are involved in the
control of this ratio, then the assumption of temperature dependency and equilibrium becomes
misplaced and this could give unrealistic values. Arnorsson et al, noted that Na/K ratio
geothermometer re-equilibrates rather slowly in environments of high salinity like Lake Bogoria and
this could also contribute to unrealistic temperature estimates calculated using this ration.
150000 155000 160000 165000 170000 175000 180000 185000
0
5000
10000
15000
20000
25000
30000
35000
40000
45000
50000
55000
Kapkun
Kimorock
Chepkoimet
Kailer
Kures
Marigat
Chebaral
Ebenezer
Tabarbangetuny
Noiwet
LegetetewetOldebes
Ngendalel
Nyalilpush
Ol Kokwe
Mogotio 1Mogotio 2Mogotio 3
LomolloKisanana
Tabarweche
Chemorongnion
Sosionte
Nyimbei
IlngaruaNgambo
Perekera
LOBOI
MAJI MOTO
LAKE BOGORIA
EMS0S SP
MUGURIN
ARUS STEAM JETS
MOLO SIRWEEMINING
KIMOSET
RADAD
LELEN SWAMP
0
100
200
400
600
800
1200
1600
3000
Figure 4.6 Arus and Bogoria Radon 222-CO2 ratio distribution plot
5. CONCLUSIONS
The reservoir temperatures estimated by use of silica based geothermometry for Lake Bogoria
springs is about 180°C. The Na/K ratio geothermometer gave temperature estimates which
were not consistent and are assumed not very reliable. The Arus hot springs gave calculated
source temperature estimates of about 161°C.
Karingithi and Wambugu 16 Geochemical survey Arus and Bogoria
The high radon counts and CO2 measured close to the Arus steam jets and north of Mugurin
indicates areas of enhanced permeability. These areas require to be explored further by deep
drilling.
A geothermal resource characterised by medium to high temperatures (161-180°C) exists in
Arus and Bogoria prospects.
6. RECOMMENDATIONS
It is recommended that an exploration well be sited near the Arus steam jets. This well will be
used to probe the relatively high temperatures estimated in this area.
A second exploration well should be sited to the north of Mugurin. This area is characterised
by high radon counts, high ground temperatures and high CO2.
7. FURTHER GEOCHEMICAL WORK
Further Geochemical work is recommended to supplement the radon survey in the soil gas. In
addition to radon radioactivity, it is recommended that measurement of mercury vapour be
conducted in the area since it is known to be a good tracer for geothermal steam.
Detailed work on sampling, chemical analysis and data interpretation of the hot discharges
around Maji Moto, Lake Bogoria and Arus areas is necessary to establish possibilities of low
temperature uses of the available geothermal fluids in these areas. Chemical determination of
Aluminium and Iron species in these water samples will assist in evaluating the fluid –
mineral equilibrium processes.
ACKNOWLEDGEMENT
The authors acknowledge the contributions made by Geochemistry sub-section staff, through sample
and soil gas data collection, analysis and data computerization. Without the tireless efforts this report
would not have been prepared. The authors, also extends their gratitude to all colleagues who edited
the manuscript and made invaluable input and to authors of the previous editions to which much has
been referred to in this edition.
REFERENCE
Arnorsson, S., Stefansson, A. (1998): Assessment of feldspar solubility in water in the range 0-350oC.
Fournier, R.O. (1977): Chemical geothermometers and mixing models for geothermal systems,
Geothermics 5, 41-50.
Geotermica Italiana Srl., 1987: Geothermal reconnaissance survey in the Menengai- Bogoria area of
the Kenya Rift Valley. UN (DTCD)/ GOK
Griffith P. S., 1977: The geology of the area around Lake Hannington and the Perkerra River Rift
Valley Province, Kenya. PhD Thesis, University of London.
Geochemical survey Arus and Bogoria 17 Karingithi and Wambugu
Jones, W.B., 1985: Discussion on geological evolution of trachytic caldera and volcanology of
Menengai volcano, Rift Valley, Kenya. Journ. Geop\l. Soc. Lon, vol 142, 711pp.
International Atomic Energy Agency, Vienna, 2000: Isotopic and Chemical Techniques in Geothermal
Exploration, Development and Use.
Jones, W.B. and Lippard, S.J., 1979: New age determination and Geology of Kenya rift-Kavirondo
rift junction, west Kenya. Journ of Geol. Soc. Lon vol 136, 63pp, 693-704pp.
James E. Gingrich, 1983: Radon as a Geochemical Exploration Tool. Paper Presented at the 10th
International Geochemical Exploration Symposium.
J. Walsh, 1969: Geology of the Eldama Ravine-Kabarnet Area. A report of the Ministry of Natural
Resources Geological Survey of Kenya.
Kenya Rift International Seismic Project Working Group 1995, (KRISP 1995): Lithospheric
investigation of the Southern Kenya Rift
Kenya Electricity Generating Company Ltd, 2004: Menengai Prospect: Investigations for its
geothermal potential. A Geothermal Resource Assessment Project Report.