geocoastal: cshore modeling tools for assessing … · gib jones, p.e., cfm june 1, 2016...
TRANSCRIPT

Gib Jones, P.E., CFM
June 1, 2016
GeoCoastal: CSHORE Modeling Tools
for Assessing Shoreline Response to
Coastal Hazards

• 1D cross-shore transect model
• Models near-shore processes simultaneously
• Sediment transport / erosion
• Wave setup
• Wave transformation and breaking
• Wave runup & overtopping
CSHORE Processes
2 |

CSHORE
• USACE developed
model in Fortran
• No user interface –
text file input/output
• Needs good
bathymetry
• Time series input
from forecasted
storm data
• Models impacts to:
• Erosion
• Waves
• Runup
• Overtopping rate
5 |

Dewberry’s GeoCoastal tools increases
productivity, level of detail, and quality in coastal
hazard and risk assessments.

• Automates Coastal Modeling
• Seamless Work Flow
• Facilitates inputs and analyzing outputs
• Consistent Modeling Result
• Easy-to-Use ArcGIS Interface
Benefits of incorporating CSHORE into
GeoCoastal Tools
5 |

CSHORE Model – Runup Validation
All values are in feet Max Runup 2% 10% Significant Mean
TAW 14.21 11.04 10.05 7.92 4.95
RUNUP2.0 8.33 6.47 5.89 4.64 2.90
CSHORE 5.62 4.36 3.97 3.13 1.96
Measurements 6.65 5.17 4.71 3.71 2.32
Difference (TAW – Measured) 7.56 5.87 5.35 4.21 2.63
Difference (RUNUP2.0 – Measured) 1.68 1.30 1.18 0.93 0.58
Difference (CSHORE – Measured) -1.04 -0.81 -0.73 -0.58 -0.36
6 |
Duck, NC

• Great Lakes – First implementation of CSHORE by FEMA
for flood studies
• New FEMA Coastal Guidelines Prepared
• Accurate nearshore bathymetry is important
• Nearshore bathymetry collected by USACE Detroit District in Lake
Erie
CSHORE in the Great Lakes
7 |

Great Lake Coastal Studies
8 |
436 Transects in Lake Erie
156 Transects in Lake Ontario

• Parameter Development• Seamless Topo/Bathy
• Boundary Conditions
• Sediment Size
GeoCoastal – CSHORE Inputs
9 |

Regional 2D Modeling Input
10 |
Time-series and maximum data extraction
• Regional 2D model doesn’t provide level of detail needed in
nearshore – need CSHORE for this

Great Lakes CSHORE Modeling
11 |
• All nearshore processes
modeled simultaneously
• Erosion
• Wave setup
• Wave transformation/heights
• Runup
• Performed both response-
based and event-based
modeling

• Wave Runup and Erosion
• 155 storms for each Transect
• UnSteady State – Hydrograph inputs for storm surge and waves
Response-Based Modeling
12 |
Figure D.3.5-5. Wave Runup Sketch
Barrier Slope Breaker Depth
Limit of Wave
Runup
Storm Still
Water Level
Source: FEMA, 2003
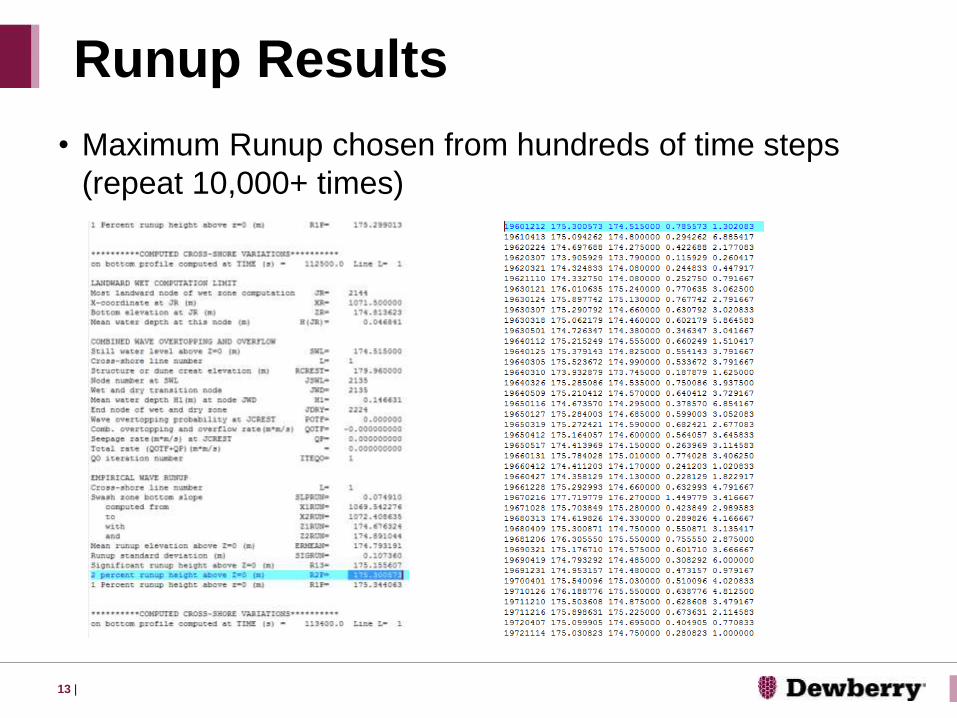
• Maximum Runup chosen from hundreds of time steps
(repeat 10,000+ times)
Runup Results
13 |

• Utilizes Matlab stats package to analyze Runup and JPM
for waves• Response-based Runup GPD (Generalized Pareto Distribution)
• JPM (Joint-Probability Method) for water level/wave analysis
• Combined probability of water levels and waves at the shoreline
Statistical Analysis
14 |

• Event-based (1% annual chance) modeling • Five scenarios/events modeled using WHAFIS
• Utilizes Previously-developed GeoCoastal capabilities
• Inputs come from CSHORE:• Wave conditions at shoreline (unsteady state hydrographs)
• Eroded profile
Event-based Modeling
15 |

GeoCoastal Tools
16 |
• Can be run step-by-step
or straight through
• Progress Screen• Monitor progress• View which files are being used• Identify where progress stops

• Study generates huge amounts of data
• More than 3600 files and 160 graphs (>60GB) per
Transect
• 6 databases and more than 200,000 files (>4TB) per
County
• All parameters, processes and results organized
in databases
GeoCoastal File Management
17 |

• Ability to answer critical EM-related questions:
• How much erosion will occur?
• When will overtopping occur?
• Potential breaching areas?
• When will roads be impassable?
• When do homeowners need to be out?
• Potential EM/planning products
• Severity of beach erosion areas
• Potential overtopping and breaching areas
• Wave damage potential areas
• Scenarios with probabilities
CSHORE for Forecasting
18 |
Forecasting & Analytics

• GeoCoastal - CSHORE Benefits
• Increases efficiency
• Shortens modeling duration
• Easily change parameters, run scenarios
• Stores input, output in organized fashion
• Helps minimize human error
• Customizable for other models and processes
• Applications beyond FEMA flood studies
In Summary
19 |

For more information Contact:
Jeff Gangai: [email protected] (703-849-0251)
Gib Jones: [email protected] (703-849-0130)
GeoCoastal - CSHORE
20 |