geocongress 2012 © asce 2012 1879 papers/seismic... · anchored on the shake table contains the...
TRANSCRIPT
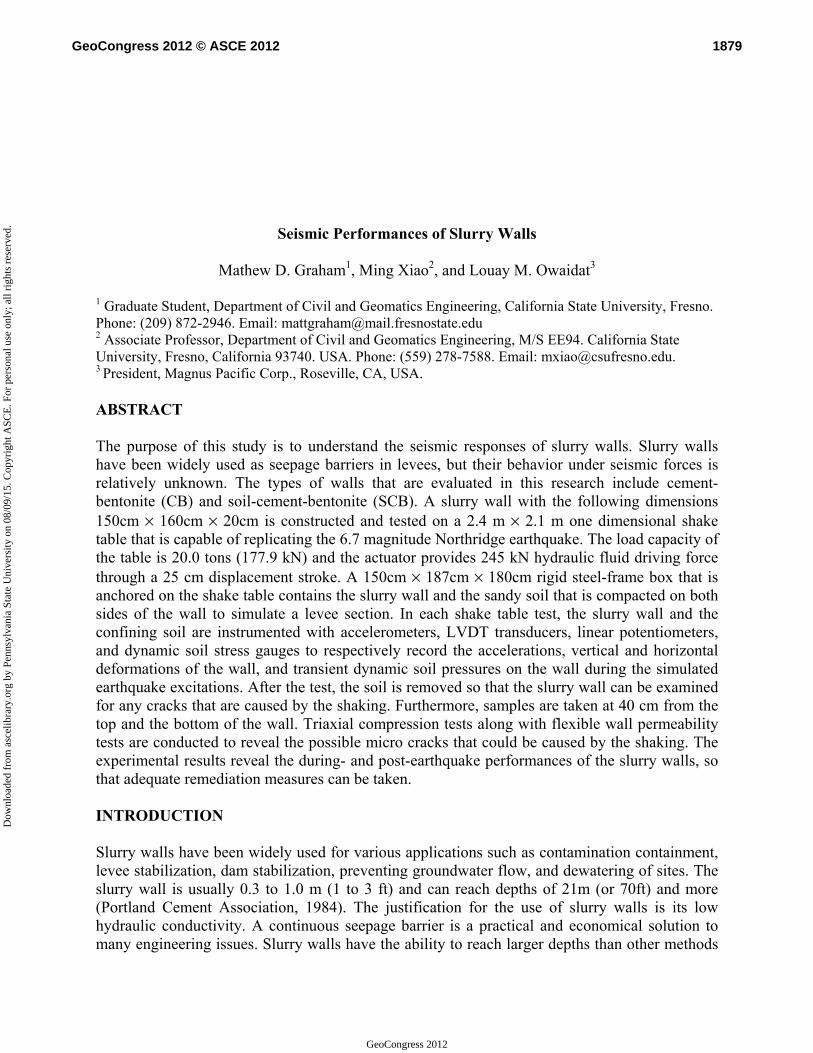
Seismic Performances of Slurry Walls
Mathew D. Graham1, Ming Xiao2, and Louay M. Owaidat3 1 Graduate Student, Department of Civil and Geomatics Engineering, California State University, Fresno. Phone: (209) 872-2946. Email: [email protected] 2 Associate Professor, Department of Civil and Geomatics Engineering, M/S EE94. California State University, Fresno, California 93740. USA. Phone: (559) 278-7588. Email: [email protected]. 3 President, Magnus Pacific Corp., Roseville, CA, USA. ABSTRACT The purpose of this study is to understand the seismic responses of slurry walls. Slurry walls have been widely used as seepage barriers in levees, but their behavior under seismic forces is relatively unknown. The types of walls that are evaluated in this research include cement-bentonite (CB) and soil-cement-bentonite (SCB). A slurry wall with the following dimensions 150cm × 160cm × 20cm is constructed and tested on a 2.4 m × 2.1 m one dimensional shake table that is capable of replicating the 6.7 magnitude Northridge earthquake. The load capacity of the table is 20.0 tons (177.9 kN) and the actuator provides 245 kN hydraulic fluid driving force through a 25 cm displacement stroke. A 150cm × 187cm × 180cm rigid steel-frame box that is anchored on the shake table contains the slurry wall and the sandy soil that is compacted on both sides of the wall to simulate a levee section. In each shake table test, the slurry wall and the confining soil are instrumented with accelerometers, LVDT transducers, linear potentiometers, and dynamic soil stress gauges to respectively record the accelerations, vertical and horizontal deformations of the wall, and transient dynamic soil pressures on the wall during the simulated earthquake excitations. After the test, the soil is removed so that the slurry wall can be examined for any cracks that are caused by the shaking. Furthermore, samples are taken at 40 cm from the top and the bottom of the wall. Triaxial compression tests along with flexible wall permeability tests are conducted to reveal the possible micro cracks that could be caused by the shaking. The experimental results reveal the during- and post-earthquake performances of the slurry walls, so that adequate remediation measures can be taken. INTRODUCTION Slurry walls have been widely used for various applications such as contamination containment, levee stabilization, dam stabilization, preventing groundwater flow, and dewatering of sites. The slurry wall is usually 0.3 to 1.0 m (1 to 3 ft) and can reach depths of 21m (or 70ft) and more (Portland Cement Association, 1984). The justification for the use of slurry walls is its low hydraulic conductivity. A continuous seepage barrier is a practical and economical solution to many engineering issues. Slurry walls have the ability to reach larger depths than other methods
1879GeoCongress 2012 © ASCE 2012
GeoCongress 2012
Dow
nloa
ded
from
asc
elib
rary
.org
by
Penn
sylv
ania
Sta
te U
nive
rsity
on
08/0
9/15
. Cop
yrig
ht A
SCE
. For
per
sona
l use
onl
y; a
ll ri
ghts
res
erve
d.

and do not require maintenance after construction (Portland Cement Association, 1984). Slurry walls also have the capability of improving deficient dam infrastructure at a smaller cost than traditional means (Day et al., 2001). Slurry walls are usually nonstructural and do not have the capacity to support bending moments or shear stress (Ryan, 1985). The slurry walls are installed underground because they are fragile by themselves and require the support of adjacent soil (Ryan, 1977). Although the slurry walls are proven effective in static conditions, their seismic behavior is relatively unknown. In areas that are susceptible to seismic activity, the slurry wall inside a levee could be damaged: micro and macro cracks can develop, large lateral deformations can occur, and permeability may significantly increase. The damaged slurry wall may no longer serve as a seepage barrier to existing piping channels, which may subsequently cause levee failure. Within the Sacramento-San Joaquin Delta in California, many levees were built more than 100 years ago with inadequate materials such as porous sand and peat. They were also constructed with insufficient techniques that would not be approved by today’s standards. The land that is confined by the levee system has subsided over the years and is prone to flooding (Wahl, 2008). The levees protect many acres of farmland but more importantly the drinking water for the southern California. The Delta supplies more than 22 million people with drinking water (Brandenburg et al., 2011). A failure of the levees can draw in salt water from the San Francisco Bay and contaminate the water that is stored for the population. Many of the levees have been retrofitted with the slurry walls to prevent failure due to piping but it is important to further understand how they will perform in a seismic region. EXPERIMENTAL METHODOLOGY 1. Materials and Characterization There are many variations of the slurry walls that are used in practice today, but for the purpose of this research the Cement Bentonite (CB) and Soil Cement Bentonite (SCB) walls are evaluated. The following are the percentages of materials by weight used in each of the mixtures.
Water 84.3% Water 31.3%Bentonite 4.2% Bentonite 5.0%Dry Cement 0.8% Dry Cement 1.8%Slag 10.5% Soil 61.9%Defloc Agent 0.3%
CB SCB
• The bentonite that is used in the mixes has a brand name of Highest Quality Wyoming
Bentonite Premium Gel and is manufactured by the American Colloid Company (Hoffman Estates, IL).
• The dry cement used is Type I-II, which meets the ASTM standards for Portland cement; it is manufactured by Basalite (Tracy, CA).
• The ground granulated blast furnace slag is a waste product from steelmaking and is distributed by Lehigh Cement (Concord, CA).
• The deflocculating agent used is POLYMAX, which is a concentrated aqueous solution of acrylate copolymer. The function of this agent is to prevent the flocculation of clay
1880GeoCongress 2012 © ASCE 2012
GeoCongress 2012
Dow
nloa
ded
from
asc
elib
rary
.org
by
Penn
sylv
ania
Sta
te U
nive
rsity
on
08/0
9/15
. Cop
yrig
ht A
SCE
. For
per
sona
l use
onl
y; a
ll ri
ghts
res
erve
d.

particles and to reduce the viscosity. This is a product of Slurry Engineering Inc. (Sacramento, CA).
• The soil used for the testing is a poorly graded sand with a maximum dry density of 1813.3 kg/m3 (or 113.2 lb/ft3) obtained from Material Sales Unlimited (Buena Park, CA).
2. Experimental Setup A slurry wall with the following dimensions 150cm (long) × 160cm (tall) × 20cm (thick) is constructed and tested on a 2.4 m × 2.1 m one dimensional shake table that is capable of replicating the 6.7 magnitude Northridge earthquake in 1994. The earthquake simulation repeats the displacement-time history three times for a total duration of a 36-second seismic test. The load capacity of the shake table is 20.0 tons (177.9 kN) and the actuator provides 55 kips of hydraulic fluid driving force through a 25 cm displacement stroke. A 150cm × 187cm × 180cm rigid steel box that is anchored on the shake table contains the slurry wall and the soil that is compacted on both sides of the wall. This method is chosen to simulate a section of slurry and levee. Fig 1 shows the shake table and the box.
Figure 1. Seismic table and box A formwork is initially installed in the box, as shown in Fig 2. It is used to contain the slurry until it hardens. To prepare for the slurry mixture, the bentonite is mixed with the water and allowed to set overnight in seven covered 55-gallon containers (Fig 3). After the bentonite is allowed to hydrate properly, the appropriate materials are added to the containers to create the slurry. Mixing is completed using drills with mixing attachments and is checked afterwards by hand. The slurry is then transported by buckets to the top of the seismic box and poured into the formwork. After the wall is at the desired height, it is covered with damp towels and plastic to assure that shrinkage cracking of the wall does not take place during the hardening process. The wall is checked daily and the towels are hydrated as necessary. After two weeks, the instrumentations are installed and the sand is filled and compacted on both sides of the hardened slurry wall. The formwork is so designed that it can be removed from the bottom to the top allowing the wall to be braced during the installation of the instrumentation and compaction of soil on both sides of the wall. The instrumentations are
1881GeoCongress 2012 © ASCE 2012
GeoCongress 2012
Dow
nloa
ded
from
asc
elib
rary
.org
by
Penn
sylv
ania
Sta
te U
nive
rsity
on
08/0
9/15
. Cop
yrig
ht A
SCE
. For
per
sona
l use
onl
y; a
ll ri
ghts
res
erve
d.

installed concurrently on each side of the wall so that pressures on the wall are equal at all time. The soil is compacted inside of the box to 85% of its max dry density in six equal layers using a steel tamper. Before the soil is placed, it is premixed to have a moisture content of 3.5% - 4%. In each shake table test, the slurry wall and the confining soil are instrumented with accelerometers, LVDT transducers, linear potentiometers (denoted as LXP in Fig 4), and dynamic soil stress gauges (denoted as Geokon in Fig 4) to respectively record the accelerations at different sections of the wall and sand, dynamic vertical settlements of the wall and the soil, dynamic lateral displacements of the wall, and transient dynamic soil pressures on the wall during the simulated earthquake excitations. Each potentiometer is connected via a steel rod welded to a steel plate that is embedded in the sand and connected to the wall. Small screws are used to attach the plate to the wall. Placement of all the instrumentations is shown in Fig 4.
Figure 2. Formwork for slurry wall Figure 3. Slurry preparation and mixing
Figure 4. Instrumentation Layout
1882GeoCongress 2012 © ASCE 2012
GeoCongress 2012
Dow
nloa
ded
from
asc
elib
rary
.org
by
Penn
sylv
ania
Sta
te U
nive
rsity
on
08/0
9/15
. Cop
yrig
ht A
SCE
. For
per
sona
l use
onl
y; a
ll ri
ghts
res
erve
d.
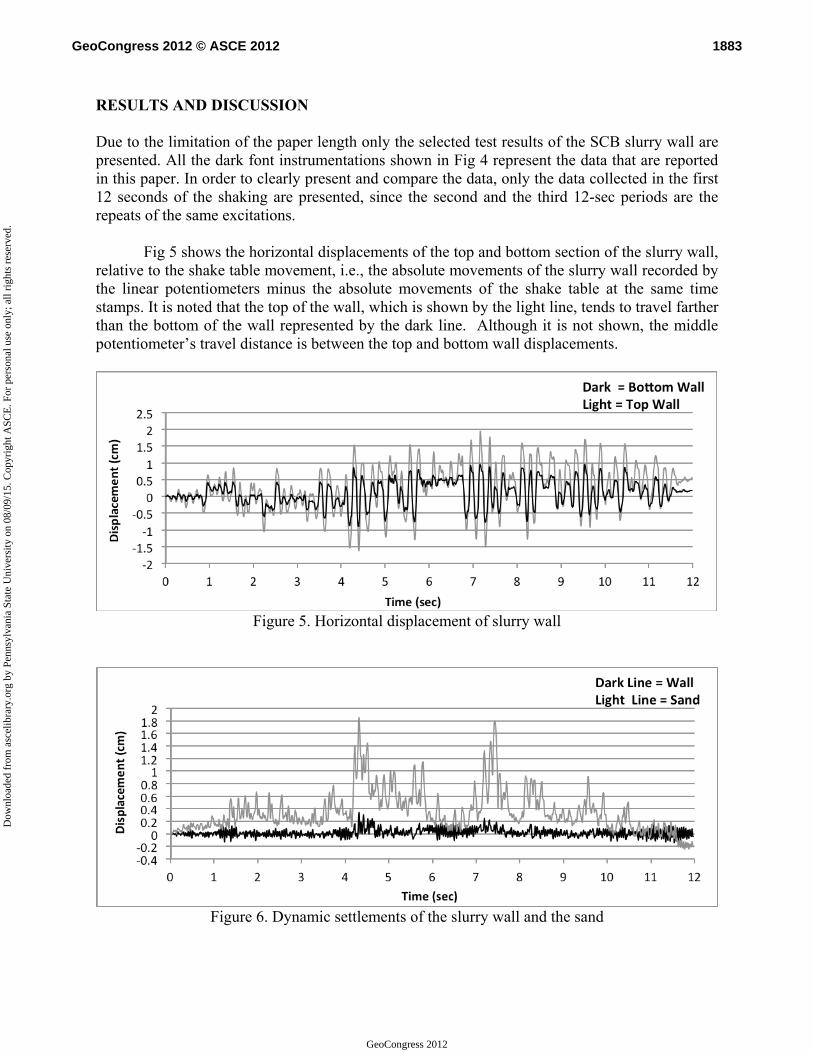
RESULTS AND DISCUSSION Due to the limitation of the paper length only the selected test results of the SCB slurry wall are presented. All the dark font instrumentations shown in Fig 4 represent the data that are reported in this paper. In order to clearly present and compare the data, only the data collected in the first 12 seconds of the shaking are presented, since the second and the third 12-sec periods are the repeats of the same excitations.
Fig 5 shows the horizontal displacements of the top and bottom section of the slurry wall, relative to the shake table movement, i.e., the absolute movements of the slurry wall recorded by the linear potentiometers minus the absolute movements of the shake table at the same time stamps. It is noted that the top of the wall, which is shown by the light line, tends to travel farther than the bottom of the wall represented by the dark line. Although it is not shown, the middle potentiometer’s travel distance is between the top and bottom wall displacements.
Figure 5. Horizontal displacement of slurry wall
Figure 6. Dynamic settlements of the slurry wall and the sand
1883GeoCongress 2012 © ASCE 2012
GeoCongress 2012
Dow
nloa
ded
from
asc
elib
rary
.org
by
Penn
sylv
ania
Sta
te U
nive
rsity
on
08/0
9/15
. Cop
yrig
ht A
SCE
. For
per
sona
l use
onl
y; a
ll ri
ghts
res
erve
d.

The top of the wall and the sand are monitored using linear variable differential transducers (LVDT). The results in Fig 6 indicate that the wall did not settle more that 0.2 cm (or 0.12% of the wall height) throughout the shaking. The sand had an initial significant upward heaving followed by settlement at the conclusion of the test. This is the first segment of the 36-second test and the complete graph shows a descending trend that corresponds to soil settlement.
Fig 7 shows the accelerations responses of the box, the slurry wall, and the sand. The acceleration data are in the unit of g. The Northridge earthquake ground acceleration is one of the highest ever instrumentally recorded in an urban area in the North America, measuring 1.7g. The accelerations produced by the shake table are high, as shown in Fig 7(a). There are a few outliers of the acceleration data that are outside of the range of ±2g, and they are likely caused by the forceful cycling movement of the actuator and are not believed to represent the realistic ground motion. The accelerations of the top section of the wall is consistently higher than those of the bottom section, indicating p-Δ effect of the structure; both accelerations of the top and the bottom sections follow the same frequency and only differ in magnitude. The same trend can be observed for the sand as well.
(a) The box
(b) The top and bottom sections of the SCB slurry wall
1884GeoCongress 2012 © ASCE 2012
GeoCongress 2012
Dow
nloa
ded
from
asc
elib
rary
.org
by
Penn
sylv
ania
Sta
te U
nive
rsity
on
08/0
9/15
. Cop
yrig
ht A
SCE
. For
per
sona
l use
onl
y; a
ll ri
ghts
res
erve
d.
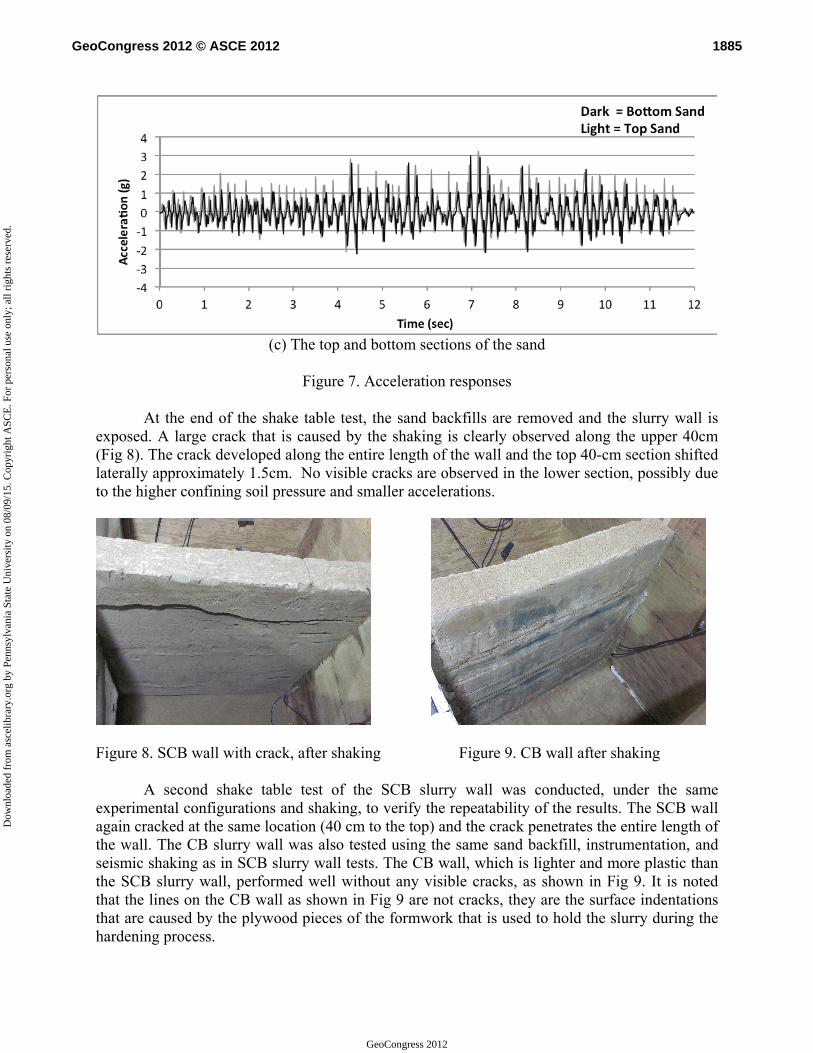
(c) The top and bottom sections of the sand
Figure 7. Acceleration responses
At the end of the shake table test, the sand backfills are removed and the slurry wall is
exposed. A large crack that is caused by the shaking is clearly observed along the upper 40cm (Fig 8). The crack developed along the entire length of the wall and the top 40-cm section shifted laterally approximately 1.5cm. No visible cracks are observed in the lower section, possibly due to the higher confining soil pressure and smaller accelerations.
Figure 8. SCB wall with crack, after shaking Figure 9. CB wall after shaking
A second shake table test of the SCB slurry wall was conducted, under the same experimental configurations and shaking, to verify the repeatability of the results. The SCB wall again cracked at the same location (40 cm to the top) and the crack penetrates the entire length of the wall. The CB slurry wall was also tested using the same sand backfill, instrumentation, and seismic shaking as in SCB slurry wall tests. The CB wall, which is lighter and more plastic than the SCB slurry wall, performed well without any visible cracks, as shown in Fig 9. It is noted that the lines on the CB wall as shown in Fig 9 are not cracks, they are the surface indentations that are caused by the plywood pieces of the formwork that is used to hold the slurry during the hardening process.
1885GeoCongress 2012 © ASCE 2012
GeoCongress 2012
Dow
nloa
ded
from
asc
elib
rary
.org
by
Penn
sylv
ania
Sta
te U
nive
rsity
on
08/0
9/15
. Cop
yrig
ht A
SCE
. For
per
sona
l use
onl
y; a
ll ri
ghts
res
erve
d.

CONCLUSIONS This paper presents a preliminary experimental research on the seismic responses of two typical slurry walls, soil-cement-bentonite (SCB) and cement-bentonite (CB), under the same simulated earthquake excitations. The research is conducted using reduced-scale shake table tests. The simulated Northridge earthquake shaking caused a major crack at the upper portion of the SCB slurry wall, indicating a great potential of seismic damage of this type of slurry wall in the field. The CB slurry wall behaves well without any visible cracks under the same shaking. The research is in progress to conduct triaxial compression tests and flexible wall permeability tests on the slurry wall specimens before and after the shaking to determine if any microcracks and inner strucural demages may be caused by the shaking. Remediation measures of the SCB slurry wall to sustain the same shaking without cracking are also explored.
In this laboratory shake table testing, some test conditions do not necessarily represent the true field conditions. Most slurry walls are in the range of 30.5 cm (1 ft) to 91.4 cm (3 ft) wide, but in this research a wall width of 20 cm (0.66 ft) is used. The project is scaled down due to the limitations of the rigid box. A slurry wall is a continuous structure; while in this research, the wall is limited to a 160 cm (5.2 ft) depth and a 150 cm (4.9 ft) length. In the field condition, a slurry wall has the potential to reach depths that exceed 24.4 m (80 ft) and length can be over a mile long. When an earthquake takes place, the ground has the potential to move in three dimensions. The shake table used in the research only allows movement in one dimension. Despite the limitations in the scaling and boundary conditions, this research may provide valuable experimental data that can help develop numerical model to address seismic responses of slurry walls in the field scale. ACKNOLEDGEMENTS This research is funded by Magnus Pacific Corporation (Roseville, CA). The authors appreciate the support of Steve Scherer, research technician in the Department of Civil and Geomatics Engineering at CSU Fresno, he helped design and build the soil box and set up the data acquisition system. We also thank Chris Harris, President of Slurry Engineering Inc. (Sacramento, CA) for his help with the slurry materials and mixture. Benjamin Adams, former graduate student in civil engineering and David Hartman, undergraduate student in civil engineering at California State University, Fresno helped the construction and demolition of the labor-intensive experiments. All their help is greatly appreciated. REFERENCES Brandenburg, S., Stewart, J., and Moss, R. (2011). “NEESR II: Evaluation of Seismic Levee
Deformation Potential by Destructive Cyclic Field Testing.” NEESR II. N.p., 8-3-2011. Web. 12 May 2011. <www.nees.ucla.edu/neesrii>.
Day, S., Ryan, C., and Fisk, G. (2001). “Innovative Slurry Trench Methods for the Rehabilitation of Small Dams.” Annual Meeting of the Association of State Dam Safety Officials. 2001: 12.
Geo-Solutions. (2011). “Slurry Cut-Off Walls Stops the Flow of Groundwater.” Ground Improvement Soil Stabilization and Slurry Wall Technology. Geo-Solutions, n.d. Web. 20 May 2011. <www.geo-solutions.com/construction-technologies/slurry-walls.php >
1886GeoCongress 2012 © ASCE 2012
GeoCongress 2012
Dow
nloa
ded
from
asc
elib
rary
.org
by
Penn
sylv
ania
Sta
te U
nive
rsity
on
08/0
9/15
. Cop
yrig
ht A
SCE
. For
per
sona
l use
onl
y; a
ll ri
ghts
res
erve
d.

Portland Cement Association. (1984). “Cement-Bentonite Slurry Trench Cutoff Walls.” Concrete Information. 1984: 11.
Ryan, C. (1977). “Slurry Cut-Off Walls Design Parameters and Final Properties An Interim Report.” Technical Course Slurry Wall Construction, Design, Techniques, and Procedures. Engineered Construction International, Inc: Miami, Florida, 1977. 29. Print.
Ryan, C. (1985). “Slurry Cutoff Walls: Applications in the Control of Hazardous Waste,” Hydralic Barriers in Soil and Rock, ASTM STP 874, A. I. Johnson, R. K. Frobel, N. J. Cavalli, C. B. Pettersson, Eds., American Society for Testing and Materials. Philadelphia, 1985, p 9-23.
Wahl, D. (2008). “Seismic Reliability in the Sacramento Delta.” calmap.gisc.berkeley.edu. UC Berkeley, 01 03 2008. Web. 5 March 2011.
<http://calmap.gisc.berkeley.edu/resin_public_docs/SacramentoDeltaFlooding/SeismicRelWahl.pdf>.
1887GeoCongress 2012 © ASCE 2012
GeoCongress 2012
Dow
nloa
ded
from
asc
elib
rary
.org
by
Penn
sylv
ania
Sta
te U
nive
rsity
on
08/0
9/15
. Cop
yrig
ht A
SCE
. For
per
sona
l use
onl
y; a
ll ri
ghts
res
erve
d.