geodetic operations in finland 2008 2011 · pgr). the third levelling of finland was completed in...
TRANSCRIPT

Geodetic Operations in Finland
2008 – 2011
Edited by
Markku Poutanen, Pasi Häkli, Jorma Jokela, Hannu Koivula, Jaakko Mäkinen and Heli Suurmäki
Finnish Geodetic Institute
http://www.fgi.fi
Kirkkonummi 2011

2
ISSN 0430-5108 ISBN (paperback): 978-951-711-284-0 ISBN (PDF): 978-951-711-285-7

3
Contents: I. Reference Frames........................................................................................................................ 5
1.1 The national realization of the ETRS89: EUREF-FIN ...................................................................................... 5 1.2 The national realization of the EVRS: N2000 ................................................................................................... 5 1.3 Implementation of EUREF-FIN and N2000...................................................................................................... 6 1.4 The permanent GPS network FinnRef
® ............................................................................................................. 7
1.5 Metsähovi fundamental station .......................................................................................................................... 7 1.6 Local tie between VLBI and GPS at Metsähovi ................................................................................................ 9 1.7 Transformation from ITRS realizations to national ETRS89 realization ........................................................ 10 1.8 Web application for coordinate transformations ............................................................................................. 11 1.9 A historical documentary film about triangulation measurements .................................................................. 11
II. Gravity Field ............................................................................................................................. 12 2.1 Satellite gravimetry ......................................................................................................................................... 12 2.2 Geoid models ................................................................................................................................................... 13 2.3 Absolute gravimetry ........................................................................................................................................ 13 2.4 Superconducting gravimetry ........................................................................................................................... 14 2.5 The First Order Gravity Network .................................................................................................................... 15 2.6 Relative gravimetry ......................................................................................................................................... 16
III. Geodynamics............................................................................................................................. 18 3.1 Glacial Isostatic Adjustment ............................................................................................................................ 18 3.2 Local deformation studies ............................................................................................................................... 18 3.3 Long interferometric water-tube tiltmeter ....................................................................................................... 20 3.4 Antarctic science ............................................................................................................................................. 20 3.5 Crustal loading in vertical GPS time series ..................................................................................................... 21
IV. Positioning and other applications ............................................................................................ 22 4.1 GPS quality ..................................................................................................................................................... 22 4.2 Quality of Virtual Reference Station (VRS) observations ............................................................................... 23 4.3 EGNOS and its RIMS station in Finland ......................................................................................................... 23
V. Metrology and standardization ................................................................................................. 25 5.1 Standard baselines and calibration baselines ................................................................................................... 25 5.2 Calibration of levelling instrumentation .......................................................................................................... 26 5.3 Acceleration of free fall ................................................................................................................................... 26 5.4 GPS metrology ................................................................................................................................................ 27
VI. Publications, Finnish Geodetic Institute ................................................................................... 29
VII. Geodetic Activities of the National Land Survey of Finland ................................................... 35
VIII. Gravity Operations of the Geological Survey of Finland ....................................................... 36 IX. Geodetic activities at the Department of Surveying, Geodesy Research Group, School of
Engineering, Aalto University .................................................................................................. 39

4

5
I. Reference Frames
Pasi Häkli, Hannu Koivula, Kirco Arsov, Ulla Kallio, Jaakko Mäkinen, Jyri Näränen, Markku Poutanen,
Arttu Raja-Halli, Veikko Saaranen, Nataliya Zubko
Finnish Geodetic Institute
1.1 The national realization of the
ETRS89: EUREF-FIN
The Finnish Geodetic Institute (FGI) and National Land
Survey of Finland (NLS) are responsible for creating and
maintaining national reference frames in Finland.
EUREF-FIN is the national realization of the ETRS89.
The first order network (E1), including 12 FinnRef® sta-
tions and 100 other benchmarks, was measured 1996–97.
It defines the EUREF-FIN reference frame. This network
was densified with 350 points by the FGI in 1998–99.
This network is classified as the EUREF-FIN network of
order Ib (E1b). The National Land Survey of Finland and
the Finnish Maritime Administration have densified
these networks with a second order network (E2) that
was completed in 2008. It consists of approximately
2500 points (Figure I-1).
1.2 The national realization of the EVRS:
N2000
In order to maintain an accurate nationwide height sys-
tem, precise levellings must be repeated regularly due to
the Fennoscandian land uplift (postglacial rebound,
PGR). The Third Levelling of Finland was completed in
2006. The new national height system N2000 was intro-
duced in 2007. It replaces the previous system N60.
The N2000 was realized in Nordic and European co-
operation in the framework of the Baltic Levelling Ring
(BLR2000). The work with the BLR2000 was coordi-
nated by the Nordic Geodetic Commission (NKG) and
supported by the IAG Reference Frame Sub-
Commission for Europe (EUREF) and the countries
around the Baltic. The datum of the N2000 derives from
the NAP (Normaal Amsterdams Peil) through the ad-
justment of the BLR2000. As in the BLR2000, the land
uplift model NKG2005LU was used to reduce all the ob-
servations to the epoch 2000.0. The N2000 complies
with the definitions (2007) of the European Vertical Ref-
erence System (EVRS). The NKG2005LU and the epoch
2000.0 were subsequently adopted by EUREF for the
North European part of the most recent pan-European
realization of the EVRS, the EVRF2007. Consequently,
the differences between the N2000 and the EVRF2007
are small, less than one centimetre.
Metric heights in the N2000 are up to 0.4 m larger
than the metric heights in the N60 (Fig. I-2). This is pri-
marily caused by the land uplift: the reference epochs are
2000.0 and 1960.0, respectively. The difference in the
datums (NAP vs. mean sea level in Helsinki), the differ-
ence in tidal systems (zero-free vs. mean-tide) and the
difference in the conversion from geopotential numbers
to metric heights (normal heights vs. orthometric) also
contribute to the difference between the N2000 and the
N60 heights, in this order of importance.
The monument of the Third Levelling of Finland was
erected above the fundamental benchmark PP2000 at the
Metsähovi Geodetic Observatory in 2007 (Figure I-3).
Figure I-1. EUREF densifications in Finland. FinnRef®
permanent GPS stations (large red circles) and the densi-
fication of 1996–97 (black triangles) constitute the First
order EUREF network in Finland and define EUREF-
FIN, the national realization of ETRS89. Small red tri-
angles show the order Ib network measured in 1998–99.
Black dots denote the Second order densification.

6
Figure I-2. Difference (in centimetres) between metric
heights expressed in the N2000 system and metric
heights expressed in the N60 system, for stable bench
marks in the precise levelling network.
Figure I-3. The monument of the Third Levelling of
Finland. The fundamental benchmark is in bedrock un-
der the monument, not visible. (Photo: Markku Pouta-
nen)
1.3 Implementation of EUREF-FIN and
N2000
In Finland, there is no binding legislation on geodetic
systems: in principle, government institutions and mu-
nicipalities are free to choose the reference frame that
they deem to be the most suitable for their use. This has
led to a situation where e.g. municipalities have either
stayed at one of the old national reference frames or cre-
ated their own local reference frame that is loosely con-
nected to one of the nationwide reference frames. This
has led to the need to constantly transform between vari-
ous old frames and the contemporary frames in which
the measurements are made.
In order to harmonize the frames used, the FGI with
the National Land Survey have prepared a set of recom-
mendations for public administration that promote the
use of the EUREF-FIN and the N2000. Now also the
INSPIRE directive of the European Commission requires
local authorities to make their geospatial data available
in these systems.
EUREF-FIN was introduced a decade ago. Several
governmental authorities have already changed to
EUREF-FIN, and as an example national topographic
maps have been printed in ETRS-TM35FIN (UTM pro-
jection of EUREF-FIN) for a couple of years now. How-
ever, within local authorities the change has been slower:
only recently cities and municipalities started to change
over to EUREF-FIN but this is now progressing. The
main driving forces seem to be the INSPIRE directive,
the increasing data exchange and also the fact that the
old reference frames do not fulfil the present require-
ments anymore.
The N2000 height system was introduced in 2007.
The adoption of N2000 is in progress. Government insti-
tutions started to apply the N2000 in their work in 2008.
Only a few municipalities have changed their system so
far. However, it seems that several more will do it al-
ready in the near future. One of the incentives is that the
PGR complicates the relation of old municipal height
systems to the national system. If the epoch difference is
large enough, this relation cannot always be described by
an offset: even tilt parameters may be needed.
The first step in the implementation of the N2000
was to produce an accurate transformation from the N60
height system to the N2000, covering the country in de-
tail including areas where the heights were derived from
lower-order levelling lines. This transformation was real-
ized 2008–2009 by the NLS. It is based on a triangula-
tion network formed by a selection of first and second
order levelling benchmarks (Fig. I-4). Such a triangle-
wise transformation is capable of correcting local distor-
tions caused by e.g. incomplete accounting for the PGR
in earlier lower-order levelling.

7
Figure I-4. Transformation from the previous nation-
wide height system N60 to N2000 is based on a triangu-
lated selection of first and second order levelling bench-
marks.
1.4 The permanent GPS network FinnRef®
The Finnish permanent GPS network FinnRef® consists
of 13 stations. The network is maintained by the FGI and
it is the basis of the national ETRS89 realization. It is
also the link to the international reference frames
through one IGS station (Metsähovi) and four EPN sta-
tions (Metsähovi, Vaasa, Joensuu, Sodankylä). All data
from FinnRef® stations is transferred via broadband
Internet connections (ADSL) hourly or in real time. Four
FinnRef®
EPN stations provide real time data stream to
EUREF-IP service.
Time series of FinnRef® network have essential role
in geodynamical studies, e.g. for determination of Gla-
cial Isostatic Adjustment (GIA). Since changes in in-
strumentation, especially change of antennas or radomes
have been shown to cause jumps in time series, FinnRef®
stations have been kept unchanged since the beginning.
The stations are also monitored independently from
GNSS with precision tacheometry and precise levelling.
The stability of the antenna platforms is controlled by
tacheometer measurements that are repeated every 2–3
years. Recently we have also started to use precise level-
ling for controlling the height of the GPS antenna with
respect to reference benchmarks.
Figure I-5. Control measurement of the mast of the
permanent GPS station. The stations are monitored inde-
pendently from GNSS with precision tacheometry and
precise levelling. (Photo: Olli Wilkman)
Using a digital precise levelling instrument we put
the rod upside down under the antenna, and in normal
position on the benchmark (Fig. I-5). This way the col-
limation error of the level and the zero-point error of the
rod do not cancel out in the result, their influnce is dou-
bled. Therefore we have determined the zero-point error
of the rods in our rod comparator, and the collimation er-
ror is always controlled before measurements. We are
able to use levelling at six stations. No significant
movements of the monuments have been found in these
regularly repeated measurements.
1.5 Metsähovi fundamental station
The Metsähovi Geodetic Observatory was founded in
1978 and it has through the years become an essential
part of the activities of the FGI. The instrumentation
covers the satellite laser ranging (SLR), geodetic VLBI,
GPS and GLONASS receivers, DORIS beacon, super-
conducting gravimeter and seismometer. In addition the
national gravity reference station and the fundamental
benchmark of N2000 height system are located in
Metsähovi. Due to its versatile set of instruments, it can
be called a Fundamental Station in the global geodetic
network.
8
As a co-operation project with the Metsähovi Radio
Research Station of the Aalto University (formerly Hel-
sinki University of Technology), geodetic VLBI obser-
vations started in 2005 were continued during the period
2008–2011. Metsähovi participated in 6–8 geo-VLBI
campaigns annually, as a part of the IVS (International
VLBI Service) network (IVS-T2) and the European geo-
dynamics project (EUROPE campaigns). These cam-
paigns are carried out for terrestrial reference frame
definition. During years 2008–2011 a total of 28 geo-
detic VLBI sessions were made. Metsähovi participated
also in a world-wide VLBI campaign in November 2009
as a special event of the International Year of Astron-
omy.
The observation data have been transferred to the
Bonn correlation centre. The IVS Data Centres, located
in Germany, France and USA store the correlated data.
The old Metsähovi Satellite Laser Ranging (SLR)
system was discontinued in 2006. A decision was made
to purchase a modern kilohertz laser and a contract was
signed with the High Q Laser Production GmbH of Aus-
tria. The laser ordered is a diode-pumped Nd:VAN solid
state laser with a pulse rate up to 2 kHz and the pulse en-
ergy > 0.5 mJ. The laser is of the same type that e.g. the
Graz and Herstmonceux stations are currently using.
At the same time, a major renovation of the 1 m Cas-
segrain-Mangin telescope was needed. It includes the re-
placement of the drive and control system as well as
separation of outgoing and incoming signals. A new en-
coder has been installed to the azimuth ring and, together
with new motors, testing will start in summer 2011. The
new optical solution for separating outgoing and incom-
ing beam has been developed together with the Univer-
sity of Latvia in Riga and installing of the new system
will start in summer 2011.
Parallel to that, work on new 2 kHz operational soft-
ware is ongoing. It is tailored to our new equipment and
is currently capable of dealing with 2 kHz observations
frequency. Improvement in the filtering of residuals,
automation in the range gate setting, time bias estimation
and management as well as smart session planning is
implemented. Laser control as well as telescope commu-
nication and steering are under development.
The Metsähovi GPS station (METS) continued as a
part of the Finnish permanent GPS network FinnRef®.
Data were submitted to the computations of the Euro-
pean Permanent GNSS Network (EPN) as well as to the
IGS and JPL networks. Also, data from Javad/Legacy
GPS/ GLONASS receiver (METZ) were submitted to
the GLONASS data centre of the IAG.
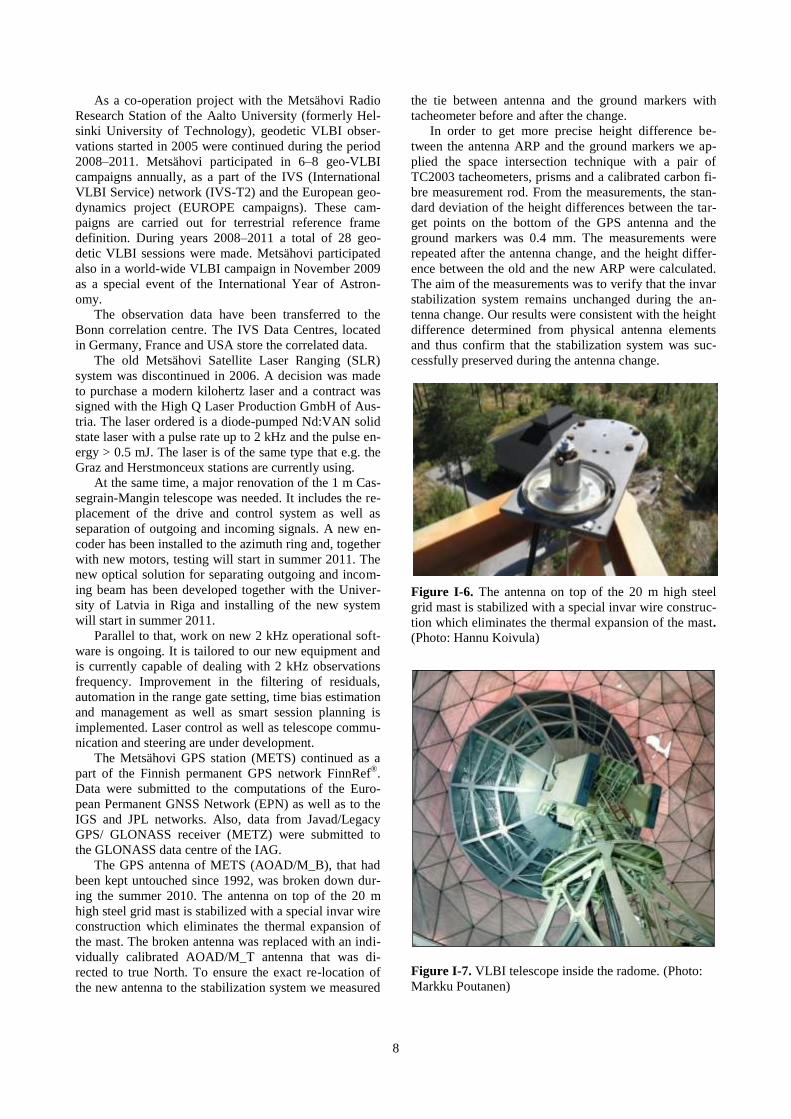
The GPS antenna of METS (AOAD/M_B), that had
been kept untouched since 1992, was broken down dur-
ing the summer 2010. The antenna on top of the 20 m
high steel grid mast is stabilized with a special invar wire
construction which eliminates the thermal expansion of
the mast. The broken antenna was replaced with an indi-
vidually calibrated AOAD/M_T antenna that was di-
rected to true North. To ensure the exact re-location of
the new antenna to the stabilization system we measured
the tie between antenna and the ground markers with
tacheometer before and after the change.
In order to get more precise height difference be-
tween the antenna ARP and the ground markers we ap-
plied the space intersection technique with a pair of
TC2003 tacheometers, prisms and a calibrated carbon fi-
bre measurement rod. From the measurements, the stan-
dard deviation of the height differences between the tar-
get points on the bottom of the GPS antenna and the
ground markers was 0.4 mm. The measurements were
repeated after the antenna change, and the height differ-
ence between the old and the new ARP were calculated.
The aim of the measurements was to verify that the invar
stabilization system remains unchanged during the an-
tenna change. Our results were consistent with the height
difference determined from physical antenna elements
and thus confirm that the stabilization system was suc-
cessfully preserved during the antenna change.
Figure I-6. The antenna on top of the 20 m high steel
grid mast is stabilized with a special invar wire construc-
tion which eliminates the thermal expansion of the mast.
(Photo: Hannu Koivula)
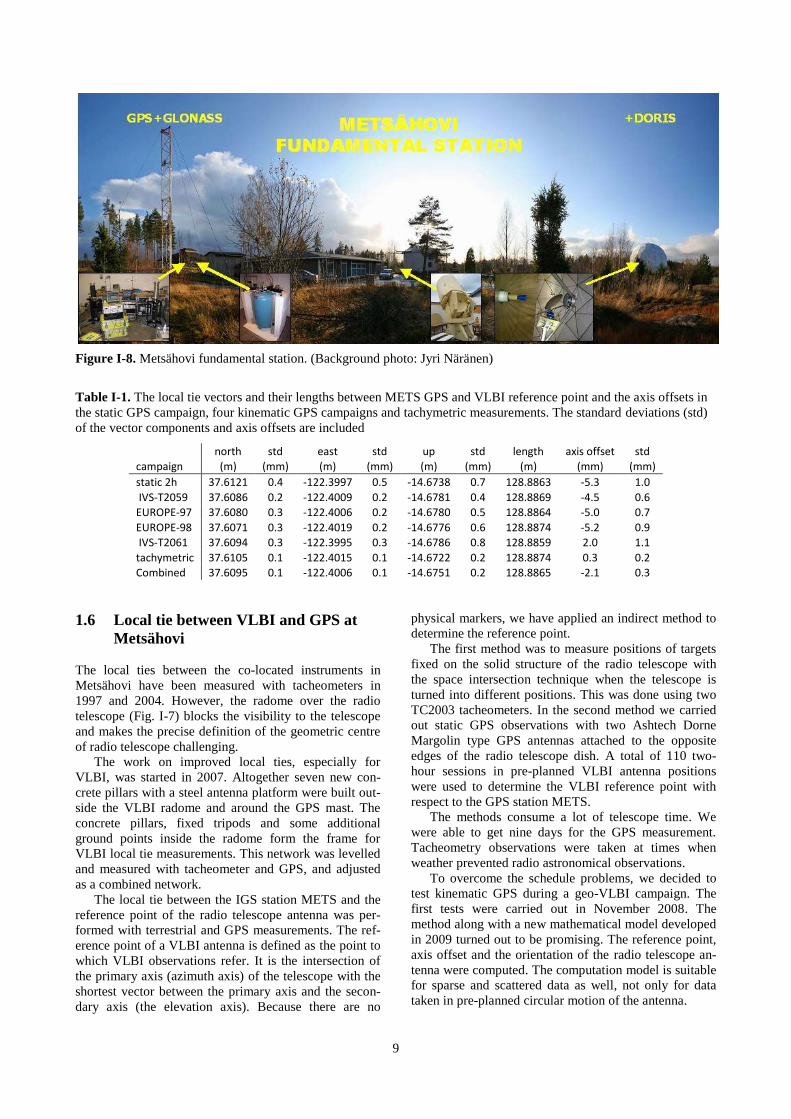
Figure I-7. VLBI telescope inside the radome. (Photo:
Markku Poutanen)
9
Figure I-8. Metsähovi fundamental station. (Background photo: Jyri Näränen)
Table I-1. The local tie vectors and their lengths between METS GPS and VLBI reference point and the axis offsets in
the static GPS campaign, four kinematic GPS campaigns and tachymetric measurements. The standard deviations (std)
of the vector components and axis offsets are included
north std east std up std length axis offset std
campaign (m) (mm) (m) (mm) (m) (mm) (m) (mm) (mm)
static 2h 37.6121 0.4 -122.3997 0.5 -14.6738 0.7 128.8863 -5.3 1.0
IVS-T2059 37.6086 0.2 -122.4009 0.2 -14.6781 0.4 128.8869 -4.5 0.6
EUROPE-97 37.6080 0.3 -122.4006 0.2 -14.6780 0.5 128.8864 -5.0 0.7
EUROPE-98 37.6071 0.3 -122.4019 0.2 -14.6776 0.6 128.8874 -5.2 0.9
IVS-T2061 37.6094 0.3 -122.3995 0.3 -14.6786 0.8 128.8859 2.0 1.1
tachymetric 37.6105 0.1 -122.4015 0.1 -14.6722 0.2 128.8874 0.3 0.2
Combined 37.6095 0.1 -122.4006 0.1 -14.6751 0.2 128.8865 -2.1 0.3
1.6 Local tie between VLBI and GPS at
Metsähovi
The local ties between the co-located instruments in
Metsähovi have been measured with tacheometers in
1997 and 2004. However, the radome over the radio
telescope (Fig. I-7) blocks the visibility to the telescope
and makes the precise definition of the geometric centre
of radio telescope challenging.
The work on improved local ties, especially for
VLBI, was started in 2007. Altogether seven new con-
crete pillars with a steel antenna platform were built out-
side the VLBI radome and around the GPS mast. The
concrete pillars, fixed tripods and some additional
ground points inside the radome form the frame for
VLBI local tie measurements. This network was levelled
and measured with tacheometer and GPS, and adjusted
as a combined network.
The local tie between the IGS station METS and the
reference point of the radio telescope antenna was per-
formed with terrestrial and GPS measurements. The ref-
erence point of a VLBI antenna is defined as the point to
which VLBI observations refer. It is the intersection of
the primary axis (azimuth axis) of the telescope with the
shortest vector between the primary axis and the secon-
dary axis (the elevation axis). Because there are no
physical markers, we have applied an indirect method to
determine the reference point.
The first method was to measure positions of targets
fixed on the solid structure of the radio telescope with
the space intersection technique when the telescope is
turned into different positions. This was done using two
TC2003 tacheometers. In the second method we carried
out static GPS observations with two Ashtech Dorne
Margolin type GPS antennas attached to the opposite
edges of the radio telescope dish. A total of 110 two-
hour sessions in pre-planned VLBI antenna positions
were used to determine the VLBI reference point with
respect to the GPS station METS.
The methods consume a lot of telescope time. We
were able to get nine days for the GPS measurement.
Tacheometry observations were taken at times when
weather prevented radio astronomical observations.
To overcome the schedule problems, we decided to
test kinematic GPS during a geo-VLBI campaign. The
first tests were carried out in November 2008. The
method along with a new mathematical model developed
in 2009 turned out to be promising. The reference point,
axis offset and the orientation of the radio telescope an-
tenna were computed. The computation model is suitable
for sparse and scattered data as well, not only for data
taken in pre-planned circular motion of the antenna.

10
Comparisons show that the precision achieved with
the kinematic GPS method was better than with the static
GPS (see Table I-1). This is due to the fact that the static
GPS measurements, even over the nine day observation
period, give considerably less points than a kinematic
GPS solution during a 24-hour geo-VLBI session. The
quality of the coordinates of one position of the antenna
from static observations was slightly better but not
enough to compensate for fewer points. An additional
advantage of the kinematic method is that the normal use
of the telescope is not interrupted and the tie can be
measured simultaneously during a VLBI session.
Our tests show that it is possible to achieve a milli-
metre level accuracy in local-tie vector determination
with the kinematic GPS method. We have used the ki-
nematic GPS method during 14 geo-VLBI campaigns in
2008–2010 and continue using it during the geo-VLBI
campaigns.
1.7 Transformation from ITRS realiza-
tions to national ETRS89 realization
The EUREF created the European Terrestrial Reference
System 89 (ETRS89) and fixed it to the Eurasian plate in
order to avoid time evolution of the coordinates due to
plate motions. However, the Fennoscandian area in
Northern Europe is affected by the postglacial rebound
causing intraplate deformations with respect to the stable
part of the Eurasian tectonic plate.
The Nordic national ETRS89 realizations were cre-
ated in the 1990s and they have been adopted as the ba-
sis for geospatial data. As the most accurate GNSS proc-
essing is done in ITRS realizations, accurate transforma-
tions to the national ETRS89 realizations are needed.
With the official transformation provided by EUREF, re-
siduals reach 10 cm because the transformation cannot
describe the effect of PGR.
Only recently has it been possible to construct the
first model that also accurately takes into account the
horizontal component. The model, created as a Nordic
co-operation in the Nordic Geodetic Commission (NKG)
and based on more than 10-year continuous time series
of GPS observations, greatly improves transformation
accuracy compared to the results obtained from global
models. Implementing the model for maintenance of the
reference frame and for practical surveying, however,
still requires further consideration. Already today the de-
formation of the National EUREF-FIN reference frame
is detectable in the most accurate nationwide measure-
ments, but with the new velocity model the validity of
the reference frame can be prolonged for many decades.
We evaluated the NKG approach and compared it to
the current recommendation given by EUREF with the
100-point first order EUREF-FIN network in Finland.
The results show, that by using a high-quality intraplate
velocity model, the transformation residuals are reduced
to the cm-level (see Fig. I-9 and I-10).
Figure I-9. Accuracy of the official transformation pro-
vided by EUREF (horizontal residuals shown with vec-
tors and vertical residuals with colour map).
Figure I-10. Accuracy of NKG transformation when in-
traplate deformations have been taken into account with
NKG_RF03vel model (horizontal residuals shown with
vectors and vertical residuals with colour map).

11
Figure I-11. Interface of the new web-based transformation service.
1.8 Web application for coordinate trans-
formations
The new coordinate transformation service was launched
in 2008. The service developed at the FGI enables clients
to perform coordinate transformations between the Fin-
nish national coordinate reference systems through a
Web application (Fig. I-11).
The Coordinate Transformation Service includes all
Finnish nationwide coordinate reference systems (i.e.,
the datums kkj and EUREF-FIN with the coordinate sys-
tems usually applied with them) including the height sys-
tems N60 and N2000. In addition to the nationally used
coordinate reference systems, the service supports the
ETRS-LAEA and ETRS-LCC coordinate reference sys-
tems to fulfil the transformation requirements arising as
a consequence of the INSPIRE Directive.
The Coordinate Transformation Service permits to
transform single coordinates or coordinate lists stored in
ASCII files. The usage of ASCII files allows additional
features, like the use of angles in diverse units, points
having identifiers and storing the coordinate values in
varying orders.
The downloadable material includes the FIN2000
and FIN2005N00 geoid models calculated by the FGI,
the triangle-wise affine transformation between the kkj
and EUREF-FIN and the triangle-wise height transfor-
mation between the N60 and N2000 height systems de-
fined by the National Land Survey of Finland (NLS).
The service is also an information forum for datums,
coordinate reference systems and transformations, with
literature references, links and on-line publications. See
http://coordtrans.fgi.fi/.
1.9 A historical documentary film about
triangulation measurements
A historical documentary film concerning the triangula-
tion measurements was prepared in 2007. The film illus-
trates the meaning and the methods of the measurements
in a popularized way. The film was partly supported by a
grant of the Finnish Cultural Foundation.
Figure I-12. Front cover of the history documentary film
about triangulation measurements.

12
II. Gravity Field
Jaakko Mäkinen, Mirjam Bilker-Koivula, Jyri Näränen, Arttu Raja-Halli,
Hannu Ruotsalainen, Heikki Virtanen, Jenni Virtanen
Finnish Geodetic Institute
2.1 Satellite gravimetry
The GRACE satellite has rapidly become a major tool in
studying Earth dynamics by observing the associated
changes in the gravity field of the Earth. Studies at the
FGI have concentrated on two subjects: (i) the compari-
son of hydrological models in Finland with the variation
in water mass deduced from variation in gravity as ob-
served by GRACE, and (ii) the use of the variation in the
water mass in the Baltic Sea to validate GRACE results.
The two subjects are connected: the ―leakage‖ of the
continental water mass to the GRACE solution over the
Baltic Sea must be taken into account, and vice versa.
In the hydrological study, monthly global gravity
field models (in spherical harmonics) from GRACE
were used to estimate the variation in the total water
storage in the watershed area of Finland. The time series
were compared to the time series of total water from the
hydrological models GLDAS (Global Land Data Assimi-
lation System), CPC (Climate Prediction Center) soil
moisture, and WSFS (Watershed Simulation and Fore-
casting System). The WSFS of the Finnish Environment
Institute (SYKE) is in operative use for prediction in a
number of practical applications, and it is continuously
controlled by hydrological observations.
A good agreement was found between the datasets
and we conclude that GRACE estimates can reproduce
the time series of total water in Finland (Fig. II-1).
For the Baltic Sea, the monthly water mass was esti-
mated using tide gauge data. Steric corrections proved
unimportant. Monthly global GRACE models in spheri-
cal harmonics, a local solution by the Ohio State Univer-
sity, and a local mascon model from GSFC (Goddard
Space Flight Center) were used in the comparison. The
GRACE models were able to recover 50...70% of the
monthly variance of the Baltic fill level 0.162 m
2 (or
622Gt
2 in mass). Additional comparisons were made
with altimetry, with the oceanographic model Wetehinen
of the Finnish Meteorological Institute (Figure II-2) and
with the OMCT background ocean model used in
GRACE processing.
GRACE studies have in part been funded by the
Academy of Finland (decision numbers 117094 and
116426).
Figure II-1. Water storage in Finland estimated from the
WSFS hydrological model and the CSR (Center of Space
Research) GRACE model (RL04), with two different
smoothing radiuses.
Figure II-2. Baltic fill level from monthly GRACE solu-
tions (RL04) by CSR (black) and GeoForschungsZen-
trum (red), from tide gauges (solid blue), and from the
model Wetehinen (dashed blue). The tide gauge and
model results have been multiplied by 0.25 to make them
consistent with the downscaling implicit in the GRACE
solutions (400 km filter).

13
2.2 Geoid models
The gravity database of the FGI was screened in prepara-
tion for the calculation of a new gravimetric geoid model
for Finland.
A local quasi-geoid model for Southwest Finland was
calculated in co-operation with Prof. A. Ardalan of the
University of Tehran. The overdetermined geodetic
boundary value approach to telluroid and quasi-geoid
computations, developed by Prof. Ardalan was used.
This project is partially funded by the Academy of
Finland (decision numbers 117132 and 212001).
The new national geoid model FIN2005N00 was
published in the series of the FGI and implemented in
the FGI Coordinate Transformation Service. The model
can be used to transform EUREF-FIN ellipsoidal heights
to normal heights in the N2000 system (Fig. II-3).
2.3 Absolute gravimetry
FGI has been engaged in absolute gravimetry since
1987, when the JILAg-5 was received from the Joint In-
stitute of Laboratory Astrophysics (Colorado). The cur-
rent absolute gravimeter FG5 no. 221 has been opera-
tional since 2003.
Figure II-3. The FIN2005N00 geoid model.
Regular absolute gravity (AG) measurements at the
Metsähovi research station with the FG5 have been con-
tinued, typically once or twice per month. Altogether
there are more than 80 occupations since 1988.
The Nordic Absolute Gravity Project was launched in
2003. It aims at maintaining time series of absolute grav-
ity measurements at about 20 Nordic sites. The time se-
ries are compared with estimates of regional gravity
change (due to the Fennoscandian PGR) obtained from
the GRACE gravity satellite, with predictions from geo-
physical models of the PGR, and with vertical velocities
determined by continuous GNSS and other methods. As
a by-product, a highly accurate gravity reference net-
work with estimates of gravity change rates is being pro-
duced. The project is coordinated by the Working Group
for Geodynamics of the Nordic Geodetic Commission
(NKG), as a part of the Nordic Geodetic Observing Sys-
tem (NGOS) of the NKG. In 2007–2010 FGI performed
AG observations at 9 Finnish sites in addition to
Metsähovi , altogether 20 station occupations (Fig. II-4).
Figure II-4. Absolute-gravity measurements in Vaasa,
Finland. The observed gravity rate agrees with the ob-
served PGR vertical rate from GNSS at this site (about
10 mm/yr, depending on the frame adopted).
Fig II-5. Absolute-gravity sites occupied by the FGI in
2007–2010.

14
Fig II-6. Absolute-gravity sites occupied by the FGI in
Iceland in 2007 in cooperation with the National Land
Survey of Iceland (LMI). The background map shows
the vertical rates in the frame IGb00, estimated by Vals-
son (2009) using the ISNET93 and ISNET2004 GPS-
campaigns and continuous GPS stations.
Outside Finland the FGI has 2007–2010 measured
absolute gravity points in Russia, Iceland, Poland,
Lithuania, Latvia, and Estonia (Fig. II-5, Fig. II-6).
These measurements were made in mutual co-operation
projects. They serve both geodynamical studies and
gravity standardization.
FGI is the National Standards Laboratory for accel-
eration of the free fall and the FG5 no. 221 is the na-
tional measurement standard. Metrological aspects are
discussed in Chapter V.
2.4 Superconducting gravimetry
The superconducting (or cryogenic) gravimeter (SG) is
based on the levitation of a superconducting sphere in a
stable magnetic field created by current in superconduct-
ing coils. Depending on frequency, it is capable of de-
tecting gravity variations as small as 10-11
ms-2
. For a
single event, the detection threshold is higher, conserva-
tively about 10-9
ms-2
. Due to its high sensitivity and low
drift rate, the SG is suitable for the study of geodynami-
cal phenomena through their gravity signatures.
The SG of the Finnish Geodetic Institute, GWR T020
has operated continuously at the Metsähovi fundamental
station since August 1994, altogether over 16 years. The
instrument is the oldest working SG installation in the
world, without renovation. We have been able to con-
tinue its lifetime thanks to the support by Austrian col-
leagues who have kindly provided us with spare parts
from the closed SG station in Vienna.
The SG at Metsähovi is a part of the Global Geody-
namics Project (GGP) network. The GGP worldwide
network consists of 31 stations (status 2010). The scien-
tific goals of the GGP include seismic, geodetic and
geophysical studies that range in frequency content from
seismic normal modes, tides, core modes and wobble
modes of the Earth to other long period variations in
Earth’s gravity field such as tectonic deformation. The
gravity data are sent to GGP data centre (http://ggp.gfz-
potsdam.de) within six month after acquiring. In special
cases, e.g. after a big earthquakes, data has been deliv-
ered immediately.
Recent studies at Metsähovi have largely concen-
trated on hydrology. After corrections for known time-
variable gravity effects, such as tides, atmosphere and
the Baltic Sea are made, the remaining gravity residual
(80 nm–2
peak-to-peak 1994–2010) is mostly due to (sea-
sonal) variation in terrestrial water storage.
The hydrological effects in gravity can be crudely
thought of as consisting of a local, a regional and a con-
tinental/global component. For the local component only
the Newtonian attraction matters, while for the regional
and continental/global contribution the deformation of
the Earth is important too.
For modelling the regional and global contribution to
gravity at Metsähovi, we have used the previously men-
tioned regional model WSFS and the global models CPC
and GLDAS in various combinations. The time series of
gravity computed from these models differ in scale but
show approximately the same kind of phase pattern
where the seasonal variation dominates.
Now, nearly any indicator of local water storage, say,
groundwater level reproduces almost the same pattern.
Therefore, it is not possible to distinguish between the
local contribution and the regional/continental contribu-
tion in the SG record using statistical arguments only. If
we want to use the SG for discriminating between differ-
ent regional/continental hydrological models, or for vali-
dating GRACE observations, the attraction of local water
storage must be physically modelled independently of
the SG record. Recently we have been building up the
observational base for this.
From the beginning (1994) the station has been
equipped with two borehole wells in the crystalline bed-
rock. The building stands on bedrock and sediment lay-
ers were removed to 5...10 m distance from the walls as
well. The remaining sediments are thin (0.2 to 4 meters
within 100 m) but geologically quite complex. In 2006
two arrays of Time Domain Reflectometer (TDR) sen-
sors of soil moisture were installed by the Finnish Envi-
ronment Institute at 30 m from the SG.
In 2008–2009 several new instruments were installed
within 100-150 m distance from the SG. The Technical
University of Helsinki (now the Aalto University) added
ten more TDR arrays. They consist of 5 sensors each at
different depths. Soil resistivity is measured in a 20×
20 m2 grid of 21×21 = 441 probes. For observing
groundwater level in the sediments, 11 access tubes were
lowered down to the bedrock surface in 2009 (Fig II-7).
For radiometric measurements of soil moisture con-
tent and soil density we established 5 dry access tubes:
they provide in-depth profiling, and a calibration control
for the TDR sensors. Soil samples have been taken from
all sites and in a grid between them. In addition, weather
information is recorded: precipitation, wind, and humid-
ity. We measure regularly the thickness and the water
equivalent of the snow cover around the station.

15
Figure II-7. Installation of the groundwater access tubes
in 2009. Note the very short perforated section at this
site, designed for the thin layer of ground moraine below
silt and clay. (Photo: Jaakko Mäkinen)
Some first results from the new sensors are presented
in the 4 plots in Fig. II-8. In the top plot the black curve
shows the gravity residual of the SG T020, the red curve
shows the gravity influence of variation in global conti-
nental water storage using the model GLDAS, the blue
curve shows the total water storage (TW) in Finland
from the WSFS, and the green curve shows the ground-
water level in the local borehole well (BH) in bedrock.
The TW and the BH have been transformed to gravity
units using a least-squares fit to the gravity residual.
The TW and BH in the plot thus represent attempts to
use the time series of a single hydrological index to ac-
count for the multiple-scale (local/regional/continental/
global) hydrological influences on gravity. We found
that GLDAS, TW, and BH explain 57%, 63%, and 38%,
respectively, of the variance (17.8 nms–2
)2 of the gravity
residual. The corresponding rms ―residual of residual
gravity‖ is 11.7, 10.9, and 14.0 nms–2
, respectively.
The second plot from top shows water levels in two
groundwater tubes in soil. The T6 (black curve) is 100 m
from the SG. The height is relative to the SG sensor. The
T11 (red) is 200 m from the SG in the opposite direction
from T6. The plotted water height relative to the SG sen-
sor has been shifted by +4.5 m. Both tubes are in ground
moraine below nearly-impermeable silt and clay layers.
Note the much more rapid reactions of T6 and T11 to
rainfall events (bottom plot) and to snowmelt (April
2010), compared with BH. Note also the minor differ-
ences between the tubes, possibly due to the different
distance to recharge areas. Tube T6 was dry from July to
September 2010 and tube T11 was frozen in winter
2009–2010.
The second plot from bottom shows the volumetric
soil moisture content from two TDR sensors. SM1
(black) and SM2 (red) are 30 m from the SG. SM1
measures the soil moisture between 0.1 to 0.3 m depth
and SM2 between 0.3 and 0.5 m depth. The nominal
calibration used here exaggerates the soil moisture con-
tent during saturation events.
The bottom plot shows the daily precipitation at
Metsähovi, in millimetres. Snowfall counts as water but
is not well captured by the sensor.
Comparison of precipitation with soil moisture and
groundwater observations demonstrates that in the sum-
mer a large pulse of rain is needed, preferably in a pre-
wetted ground, to make any impression on the soil mois-
ture, let alone on groundwater. This is because the strong
summer evapotranspiration removes the water before it
percolates into the deeper layers. The hydrological work
with the SG was partly funded by the Academy of
Finland (decision number 117094).
2.5 The First Order Gravity Network
The First Order Gravity Network (FOGN) of Finland
was first measured by A. Kiviniemi in 1962 with the
relative gravimeter Worden Master No 227. The network
consisted of 41 stations. To quote Kiviniemi: ‖For easy
access, the first order stations are placed as near as pos-
sible of traffic junctions. In order to ensure the perma-
nence of the stations, they were attached to monumental
buildings, in most cases churches. When no suitable
buildings were available, the stations were placed on
levelling benchmarks‖. Nearly all stations are outdoors
and accessible at any hour without prior arrangements.
The internal accuracy was estimated to be
0.03...0.06 mGal (one-sigma). The current gravity values
for the stations derive from a local adjustment of the
IGSN71 in 1971 where an additional traverse measured
with the LaCoste (LCR) gravimeter G-55 in 1966 was
incorporated. The resulting FOGN values have epoch
1963.0 and they are in the mean tidal system of the
IGSN71. They have provided a consistent reference for
gravity surveys in Finland. The survey results then all
share this epoch and tidal system, independently of the
year when the survey was actually performed. The re-
sults can thus be easily transformed to, say, 2000.0 and
zero-tide for e.g. geoid computation.
The network was re-surveyed in 1988 with two LCR-
gravimeters. The campaign confirmed the accuracy of
gravity differences to be better than 0.035 mGal (one-
sigma). Checks also show that the FOGN values agree
with contemporary absolute-gravity measurements to
0.03 mGal rms after the system differences, i.e. the ep-
och and the treatment of the permanent tide are ac-
counted for.
The renovation of the FOGN started in 2009. The old
sites are retained and a few additional sites measured to
fill gaps especially in Lapland. The outdoor absolute
gravimeter A10-020 of IGiK (Institute of Geodesy and
Cartography, Warsaw, Poland) is used, operated by M.
Sekowski of IGiK.

16
Figure II-8. Comparisons between the gravity residual from the SG GWR T020 at Metsähovi, and various hydrological
and meteorological time series 2009–2010. All explanations and comments are in the text.
The work with the A10-020 was performed 2009–
2010 (Fig. II-9, II-10). Altogether 51 field stations at 47
sites were occupied, all in two independent setups in op-
posite azimuths. From the difference of the setups the
repeatability of their mean is better than 4 μGal. Maxi-
mally two stations could be observed in one day. As a
control, 9 Finnish absolute gravity stations were occu-
pied with the A10-020 altogether 25 times. From pre-
liminary computations, the offset of the A10-020 relative
to the FG5-221 absolute gravimeter of the FGI was neg-
ligible and the rms difference was 3 μGal. The length
and frequency standards of the A10-020 were calibrated
before and after the surveys at MIKES (Finnish Centre
for Metrology and Accreditation).
The work at a station is not complete with just the
A10 measurement done. A separate support expedition
measures the vertical gradient of gravity, performs rela-
tive-gravity ties when the FOGN and A10 stations are
not identical, does levelling to a bench mark, determines
coordinates using RTK-GPS and tacheometer, and
documents the station in photos and sketches. Around
one day per absolute station is needed for these support-
ing measurements, slightly more or slightly less depend-
ing on the amount of relative gravimetry needed and on
the levelling distance to the nearest bench mark. The
supporting measurements will be completed in 2011.
Most FOGN stations are on massive stairs. The stairs
cause a markedly non-constant vertical gradient of grav-
ity. The users that visit the FOGN sites have relative
gravimeters with different sensor heights and mount
them on tripods of their own choice. Therefore the gradi-
ent measurements are performed using three levels, and
the final gravity value will be published as a (non-linear)
function g = g(z) of elevation z above station.
The gravity values of the 35000 stations in the Na-
tional Gravity Net of the FGI will be recomputed with
reference to the new FOGN values.
2.6 Relative gravimetry
No regional gravity surveys were performed by the FGI
during the review period. Extensive high-precision rela-
tive work (i.e., vertical gradients and ties to excentres)
was done to support absolute gravity measurements and
the measurement of the First Order Gravity Network (cf.
Section 2.5). The work on the Masala–Vihti calibration
line is described in Section 5.3.

17
Figure II-9. The A10-020 at the station Turku Var-
tiovuori. Note the transportable benches and weights to
mount the tent on stairs. (Photo: Jaakko Mäkinen)
Figure II-10. Sites occupied with the A10-020 in 2009–
2010. Triangles pointing up show old FOGN sites, trian-
gles pointing down show new FOGN sites, and open cir-
cles show laboratory-type sites for comparison with
FG5-221 measurements.
.

18
III. Geodynamics
Jaakko Mäkinen, Markku Poutanen, Ulla Kallio, Hannu Koivula, Maaria Nordman,
Sonja Nyberg, Hannu Ruotsalainen
Finnish Geodetic Institute
3.1 Glacial Isostatic Adjustment
The Finnish Geodetic Institute has been studying post-
glacial rebound since the 1930s when the first reliable
map of contemporary PGR rates inland was derived by
FGI for Southern Finland from the difference between
the Second and the First levelling of Finland. This and
several later land uplift maps by FGI have been used for
many geodetic and geophysical purposes.
The land uplift map that is presently used for stan-
dardization purposes in geodesy in the Nordic countries
(cf. Chapter 1) is the NKG2005LU (Fig. III-2).
A project DynaQlim (Upper Mantle Dynamics and
Quaternary Climate in Cratonic Areas) continued under
the International Lithosphere Program (ILP). As a multi-
disciplinary, large international program, its aim is to
improve our understanding on the relations between up-
per mantle dynamics, mantle composition, its physical
properties, temperature and rheology. It is also meant to
study Glacial Isostatic Adjustment (GIA) and ice thick-
ness models, Quaternary climate variations and Weich-
selian glaciations during the late Quaternary. FGI is the
coordinator of the project. An international workshop
was arranged in Finland in 2009.
FGI scientists participate in the COST Action
ES0701: Improved Constraints on Models of Glacial
Isostatic Adjustment. Absolute-gravity results in Fenno-
scandia and the Antarctic were compiled and analyzed.
GPS data in Finland and the Antarctic was provided to
the global recomputation within the Action.
Figure III-1. Participants of joint DynaQlim-GGOS
meeting in Espoo, Finland, in 2009. (Photo: Markku
Poutanen)
Figure III-2. Postglacial rebound in Finland (in mm/yr)
according to the Nordic land uplift model NKG2005LU,
here plotted in the version NKG2005LU_ABS, i.e. rela-
tive to the centre of mass of the Earth in ITRF2000. Tri-
angles are the permanent GNSS stations.
3.2 Local deformation studies
The Finnish Geodetic Institute has studied crustal de-
formations in co-operation with the Posiva Oy. The stud-
ies started in 1994, when a network of ten pillars for
GPS observations was established at Olkiluoto. The net-
work was expanded in 2003 and in 2005. The Finnish
Geodetic Institute, the Geological Survey of Finland,
Posiva Oy and the Cities of Pori and Rauma started

19
GeoSatakunta project in 2002 in order to increase under-
standing of the unique bedrock of the area.
In 2008–2011 we have continued the repeated GPS
measurements in four local deformation monitoring net-
works: in the Olkiluoto network twice a year and in the
Kivetty and Romuvaara networks every two years. The
GeoSatakunta network was last measured in 2008 and
the next measurement is planned in 2011.
In Olkiluoto we have also measured a 511 m long
baseline between the pillars GPS7 and GPS8 with the
precise electronic distance measurement (EDM) instru-
ment Kern ME5000 Mekometer in connection with the
GPS measurements. According to nine years of data, the
GPS gives, on the average, 1.3 mm longer distances than
the metrologically traceable EDM. The reason for the
difference is thought to be unmodelled or mismodelled
offsets in GPS observations (e.g. ionosphere or tropo-
sphere effects or antenna phase centre related reasons).
The trends in the EDM and GPS distance time series are
similar.
All data of the 28 GPS campaigns in Olkiluoto since
1994 were reprocessed with a new processing strategy
using antenna calibration corrections (see Chapter 5.4).
The results were analysed by computing the change rates
of the baselines and estimating horizontal velocities for
the pillars using the barycentre of the velocities as a ref-
erence. In the inner part of the Olkiluoto network 80 per-
cent of the change rates were smaller than 0.10 mm/a.
Roughly one fourth of the change rates could be consid-
ered statistically significant (change rate larger than 3σ,
with the maximum change rate 0.21 ± 0.03 mm/a).
The maximum change rates of the vector lengths
from the 18 campaigns of Kivetty and Romuvaara net-
works were less than 0.2 mm/a. In Kivetty, one third of
the change rates could be considered statistically signifi-
cant but in Romuvaara none were significant.
The control reserve markers of the GPS pillars in
Olkiluoto were measured every three years, last in 2010.
After four control marker measurement campaigns we
can now estimate the reproducibility of our angle and
distance measurements. The standard deviations of hori-
zontal angles, height differences and distances were
0.0028 gon, 0.0007 m and 0.0005 m, respectively. No
movements of pillars have been found within the observ-
ing accuracy.
The Olkiluoto GPS network was levelled every two
years, last in 2009. Some micronetworks at the construc-
tion sites in Olkiluoto are levelled every year and the
connection to the national precise levelling network at
Lapijoki every four years, last in 2007.
The GeoSatakunta GPS network was established in
2003 to obtain information on possible crustal deforma-
tions in the Satakunta region. The network consists of 13
concrete pillars for episodic GPS campaigns and the
Olkiluoto permanent GPS station. The vector lengths
range from five to 65 km.
We processed the GPS data of three annual cam-
paigns each year 2003–2008 using Bernese 5.0 GPS
software. Typically, the length of a vector varied from
campaign to campaign less than 2.0 mm (peak-to-peak)
without any evident trend. Estimated velocities were
small (< 0.2 mm/a) and in most cases statistically not
significant because of the relatively short time series.
More campaigns are needed, especially to determine the
deformation in the southern part of the network where
time series are shorter. However, it is not necessary to
carry out measurements as frequently as three times per
year.
Figure III-3. Horizontal velocities in the Olkiluoto network.

20
Figure III-4. The GeoSatakunta GPS network. (Base
map © National Land Survey, license 51/MML/09)
3.3 Long interferometric water-tube tilt-
meter
The interferometric water-tube tiltmeter (WT) of the FGI
was described in ―Geodetic Operations in Finland 2004–
2007‖. In the autumn 2007 a WT with a 50.4m tube was
installed in north-south orientation (NSWT) in a tunnel
of the Tytyri limestone mine (60°16’N, 24°05’E) near
the town Lohja in southern Finland. Great care was taken
to install the whole tube horizontally, not just the two
end vessels. The mine is active but the NSWT is in an
inactive part 160 m below ground level. The recording
computers are at 200–260 m distance from the tube to
avoid thermal influences. The northern end of the NSWT
is shown in Fig. III-5.
First results from the new NSWT are very promising.
From 187 days of data, the main tidal waves could be
solved with the same precision as from the earlier north-
south tube with 1172 days of data.
From the NSWT recordings the toroidal free oscilla-
tions after the Chilean M = 8.8 earthquake (February 27,
2010) were analysed. Similar toroidal oscillations were
seen after the Sendai earthquake (March 11, 2011) in Ja-
pan. Observed toroidal oscillations agreed well with the
free oscillation model values given by Masters and
Widmer (1995).
Loading by the Baltic Sea gives a strong N-S tilt sig-
nal at the NSWT located 30 km north from the coastline
of the Gulf of Finland (Baltic Sea). In Fig. III-6 the ob-
served tilt is compared with the tilt computed using tide
gauge data on the Baltic level, and the NLOADF pro-
gram package by Agnew (1997).
Figure III-5. The Fizeau-Kukkamäki liquid level inter-
ferometer in the north end of the NSWT. (Photo: Hannu
Ruotsalainen)
Figure III-6. Non-tidal tilt due to the Baltic Sea load
computed from tide gauge observations (upper curve,
green), and visible in the de-tided tilt record of the
NSWT (lower curve, red).
3.4 Antarctic science
The FGI has participated in Antarctic research since
1989, performing the field work under the auspices of
the Finnish Antarctic Research Program FINNARP. Cur-
rently the FGI maintains a time series of absolute gravity
and GNSS measurements in Dronning Maud Land. The
absolute-gravity sites at the stations Aboa (Finland),
Sanae IV (Republic of South Africa) and Novolaza-
revskaya (Russia) were last occupied in the season
2005/6.
The continuous GPS station at Aboa (73°03' S,
13°24' W) is operating since January 2003. Aboa is a
summer station only. The GPS data is recovered annu-
ally by the FINNARP summer expeditions and the rest
of the time the receiver is operating unattended, without
communicating with the outside world. With the excep-
tion of a gap in data in 2006 due to software failure the
operation has been successful. At Sanae IV we have re-
lied on the IGS station VESL and at Novolazarevskaya
on GNSS epoch campaigns by SCAR and by ourselves.

21
The purpose is to detect the gravity change and de-
formation of the solid Earth due to PGR and to changes
in present-day ice mass balance of the Antarctic. The
time series of vertical position at Sanae IV and Aboa are
shown in Fig. III-7. There is an apparent regional uplift
during the period shown that is not accounted for by the
PGR models. It is thought to be due either to variation in
contemporary ice mass, or to reference frame problems
in the GNSS data.
3.5 Crustal loading in vertical GPS time
series
The effect of the atmospheric pressure loading, the effect
of the non-tidal Baltic Sea loading and the effect of con-
tinental water loading was studied at seven GPS stations
in Fennoscandia using monthly averages. Three sites
close to the Baltic were selected for closer scrutiny. Re-
moving the total computed loading from the GPS time
series reduced the standard deviation, and for short series
also influenced the trend determined.
Three different models (WGHM, CPC, LaDWorld)
were used to compute the hydrological load but the GPS
series did not show clear preference for any of them.
While the Baltic signal was considerable (Fig III-8), it
did not decrease the standard deviation of the GPS time
series correspondingly. This is not presently understood.
At the three stations analyzed, removing the seasonal
variation decreased the standard deviation of the
monthly GPS solutions by maximally 40%. The seasonal
variation in GPS tended to underestimate the seasonal
variation in modelled load.
The work was partly funded by the Academy of
Finland (decision number 117094).
Figure III-7. Top: daily time series of vertical position
from GPS in ITRF2005 at Sanae IV (VESL) from
ftp://sideshow.jpl.nasa.gov/pub/mbh/point/ (2010-10-
27). Bottom: daily time series of vertical position from
GPS at Aboa relative to VESL, our processing with Ber-
nese software. Both plots show the trend computed with
formal standard error (1-sigma), and the trend expected
from two PGR models, the IJ05 by Ivins and James
(2005) and the ICE-5G(VM2) by Peltier (2004). Com-
ments in text.
Figure III-8. Vertical deformation caused by the Baltic
high water in March 2006, as calculated from tide gauge
data (monthly means), in mm. The solid circles show the
GPS stations studied.

22
IV. Positioning and other applications
Pasi Häkli, Hannu Koivula, Tomi Tenhunen, Heidi Kuusniemi, Ruizhi Chen
Finnish Geodetic Institute
4.1 GPS quality
In the past decade new real-time GPS measurement
methods have become more and more common. How-
ever, traditional static GPS surveying is still the most ac-
curate and reliable GPS method and should be utilized to
e.g. measuring of benchmarks. Even if the static GPS
measurements have been used for precise surveying over
two decades, consistent information about relation be-
tween accuracy, baseline length and observing time has
been difficult to acquire and the information has varied
depending on a source. The outcome of this study gives
relation between these factors.
The study was conducted using commercial GPS
software with default processing parameters, covering
observing sessions between 10 minutes and 24 hours and
baselines between 0.6 km and 1,069 km. Over 10,000
baselines were processed using broadcast and precise
ephemerides. The set of data used in the study is a ran-
dom sample chosen from several GPS campaigns. This
way it was to give a realistic picture of accuracy by av-
eraging e.g. the influence of atmosphere and satellite ge-
ometry. The accuracy is presented for individual base-
lines i.e. adjustments were not applied. A series of fitting
schemes were tested over the data and the one with the
best fit was chosen.
The final result is given as an easily readable graph
presenting the relation between the accuracy, baseline
length and observing time (Figure IV-1). Using the
graph one may optimize the observing times and thus in-
crease productivity of static GPS surveying.
Figure IV-1. Static GPS results for individual baseline solutions with broadcast and precise ephemerides. Dependency
of baseline length, observing time and accuracy (rms) is given with regression lines 1-5 cm. For geodetic measurements
one should use accuracy better than 2 cm, and choosing it depending on quality and reliability requirements.

23
4.2 Quality of Virtual Reference Station
(VRS) observations
Networking GNSS reference stations enable real-time
bias estimation to improve e.g. real-time kinematic
measurements. One approach is Virtual Reference Sta-
tion (VRS) in which VRS observations (virtual data) are
generated from the network to virtual position within the
network coverage. Several studies have shown that bias
estimation expands the area of operation and increases
reliability and accuracy in real-time positioning. How-
ever, a major disadvantage of VRS concept is that virtual
data does not include any information of its accuracy and
the quality has to be verified on statistical basis. The FGI
studied temporal and spatial quality of virtual data by
quantifying quality with accuracy of zero-baselines be-
tween virtual and real data at same position.
Temporally, long-term quality was evaluated with
10-month-long time series of virtual data. Time series
show that virtual data has good repeatability. Daily re-
peatability is 2 mm for horizontal components and 5 mm
for up component, being quite equal for all stations.
However, some biases remain to the results, especially in
up component (Figure IV-2). Average of up component
from time series varies from -37 mm to +21 mm and
seems to be spatially correlated (one station in South-
East Finland differs from the pattern and is probably due
to some problems in adjustment of VRS network coordi-
nates).
Figure IV-2. Spatial accuracy of VRS observations, up
component (mm).
In order to estimate the reason for the spatial bias, we
investigated the coordinates of the reference stations (of
the VRS network). In addition to current network com-
putation procedure (processing the coordinates directly
in EUREF-FIN reference frame), the coordinates of the
reference stations were processed also in ITRF2000 and
transformed to EUREF-FIN by taking into account in-
traplate deformations caused by PGR with NKG method.
Accuracy (rms) of this transformation is better than
1 cm. Resulting coordinates were compared to the ones
computed in EUREF-FIN.
The comparison implies that the bias seen in virtual
data relates to reference station coordinates. Nordic ref-
erence frames deform in time due to postglacial rebound
that makes accurate determination of station positions
challenging in the Nordic countries. EUREF-FIN has de-
formed already approx. 10 cm at the west coast of
Finland by the PGR since its reference epoch 1997.0 to
the epoch of the study (2006.5). At the SE part of coun-
try the deformation is less than three cm. When a GPS
solution (network) is adjusted by fixing the coordinates
in such frame, the solution becomes distorted and influ-
ence of PGR is seen (indirectly) in virtual data through
the imprecise reference station coordinates.
4.3 EGNOS and its RIMS station in
Finland
Background
The use of positioning satellites is nowadays critical to,
for example, air, maritime and automotive traffic. An es-
sential part of a Satellite Based Augmentation System
(SBAS), which provides a differential positioning ser-
vice through geostationary satellites, is the ground net-
work of reference stations, which can relay information
about the operating status of the positioning satellites
and provide the range measurement corrections neces-
sary for calculating a more accurate location than in
standalone mode of operation. In Europe, a satellite-
based augmentation system called EGNOS (European
Geostationary Navigation Overlay Service) is used for
providing augmentation to GPS (Global Positioning Sys-
tem) and GLONASS (Global'naya Navigatsionnaya
Sputnikova Sistema) by reporting on the reliability and
accuracy of the signals. The differential corrections pro-
vided by the EGNOS system can improve the satellite
positioning accuracy to a couple of meters.
EGNOS
EGNOS is a European SBAS consisting of three GEO
(Geostationary Earth Orbit) satellites and a network of
Ranging and Integrity Monitoring Stations (RIMS), Mis-
sion Control Centers (MCC), and Navigation Land Earth
Stations (NLES) for ground control. The EGNOS system
provides the end users with additional ranging data from
GEO satellites, differential corrections, and integrity in-
formation.

24
The Ranging and Integrity Monitoring Station of
EGNOS in Finland
Since 2003, the FGI has maintained, in cooperation with
the European Space Agency (ESA) and the European
Satellite Services Provider (ESSP), the only EGNOS
RIMS station in Finland. Because the station is located
in a marginal area for the EGNOS service coverage (60
km south of Lappeenranta), it is one of the most impor-
tant stations in the whole system. In Finland, if there was
no RIMS station in Virolahti the accuracy of the EGNOS
service would be significantly lower. In addition, FGI
maintains a permanent GPS network in Finland. This
FinnRef® network is part of the NGOS (Nordic Geodetic
Observation System) network. Figure IV-3 presents the
FinnRef® network and the location of the RIMS station
in Virolahti, in the South-East of Finland. Figure IV-4
presents one of the antennas on the site of the RIMS sta-
tion in Virolahti. The station tracks the GPS and EGNOS
GEO satellites and sends the observations in real-time to
the EGNOS MCC via a dedicated telecommunication
link.
Figure IV-3. The FinnRef® network of permanent GPS
stations (red circles) and the EGNOS RIMS station
(green open circle) in GoogleEarthTM
.
Figure IV-4. Antenna site at the EGNOS RIMS station
in Virolahti. (Photo: Tomi Tenhunen)
EGNOS performance in Finland
The current EGNOS performance in Finland is not as
good as that in the central Europe. The major reason for
the unsatisfactory performance is due to the fact that
Finland is located in the North-East boundary of the
EGNOS service area. In addition, the EGNOS satellites
are very low in elevation in Finland and therefore they
are difficult to being tracked and their differential correc-
tions to being obtained.
In order to access the EGNOS service, the end user
needs the line of sight to at least one GEO satellite. This
is not a problem at all for aviation and maritime applica-
tions even in the regions at high latitudes because an
open sky is always available for such applications. How-
ever, an open sky is not always available for land appli-
cations because of the obstacles in the vicinity of the end
users (e.g. in city canyons). The situation becomes worse
for the regions at high latitudes because the elevation
angles to the GEO satellites are rather low.
There are no pseudorange corrections for GPS satel-
lites rising from the East or North-East with low eleva-
tion angles because each satellite needs to be viewed by
three RIMS stations from the ground in order to calcu-
late the pseudorange corrections that EGNOS can pass
on. Thus, as there are no RIMS stations on the East side
of Finland, the visibility to the nearby RIMS stations for
the satellites rising from East is poor, and there are lim-
ited pseudorange corrections available. Therefore, it is
not possible to use the current EGNOS service in
Finland for safety-of-life applications.

25
V. Metrology and standardization
Jorma Jokela, Jaakko Mäkinen, Pasi Häkli, Hannu Koivula and Paavo Rouhiainen
Finnish Geodetic Institute
The Finnish Geodetic Institute is a National Standards
Laboratory for two quantities, acceleration of free fall
and length. The metrological research and measurements
include measurements at the Nummela Standard Base-
line, maintenance and development of the Väisälä inter-
ference comparator and the associated quartz gauge sys-
tem, levelling rod and levelling system calibration, the
national gravity network, absolute and relative gravity
measurements, and continuous recording of temporal
gravity variations with a superconducting gravimeter.
The calibration services include instruments and systems
used in height determination, geodetic baselines and
electronic distance measurement (EDM) instruments.
The FGI is a member in the CIPM Mutual Recogni-
tion Arrangement (MRA) of national measurement stan-
dards and of calibration and measurement certificates is-
sued by national metrology institutes. Requirements of
the ISO/IEC 17025 ja ISO 9001 standards are imple-
mented in the quality management system of the Na-
tional Standards Laboratories, described in the quality
manual. The quality manual was renewed in 2009 and
2011. In 2009, the FGI participated in the EURAMET
TC-Q re-evaluation of the quality management system.
5.1 Standard baselines and calibration
baselines
The Nummela Standard Baseline of the FGI was meas-
ured again with the Väisälä interference comparator in
autumn 2007. The description of the latest measurements
in 2005 and 2007 was published in 2010. The result of
the 864 metres total length of the baseline deviates only
+0.11 mm from the previous measurement in 1996, and
+0.08 mm from the first measurement in 1947. The
variation in the 15 measurements during 60 years has
remained smaller than 0.6 mm. With the ±0.07 mm stan-
dard uncertainty the baseline still is the state-of-the-art
world-class measurement standard in geodetic length
metrology.
The EDM equipment was renewed by purchasing a
new Leica TC2003 tacheometer equipment. The annual
calibrations of the own instruments at the Nummela
Standard Baseline include the two newest Leica TC2003
tacheometers and five prism sets of the FGI, and one
Kern ME5000 Mekometer with a prism reflector, prop-
erty of the Institute of Surveying Sciences in the Aalto
University. The projection measurements between the
underground benchmarks of the baseline and the calibra-
tion facilities on the observation pillars are performed at
least twice during every field work season, which at the
most lasts from May to November.
In 2008–2011 the FGI participated in the European
Metrology Research Programme (EMRP) Joint Research
Project ―Absolute long distance measurement in air‖.
This project of nine European metrology institutes was
partly funded by the European Community’s Seventh
Framework Programme, ERA-NET Plus. The contribu-
tion of the FGI in this project was to utilize the Num-
mela Standard Baseline in testing and validation of new
absolute distance measurement (ADM) methods, based
on synthetic multi-wavelength interferometry.
The deliveries of the EMRP project included a scale
transfer measurement from the Nummela Standard Base-
line to the 1 080 m geodetic baseline of the Austrian me-
trology institute (BEV) in Innsbruck, in autumn 2008. A
small indoor test field was concurrently measured for the
University of Innsbruck. In autumn 2010 scientists from
three European metrology institutes, CNAM (France),
PTB (Germany) and MIKES (Finland) tested their newly
developed equipment prototypes for ADM and refraction
measurements at the Nummela Standard Baseline. The
results are encouraging, in spite of the challenging field
conditions.
The FGI measured the Vääna Calibration Baseline of
the Estonian Land Board, Maa-amet, in autumn 2008.
Maa-amet has thoroughly reconditioned the baseline
since the previous measurements in 2000. The modern
baseline now consists of 13 high-quality observation pil-
lars for distances from 2 metres to 1 344 metres and a set
of benchmarks in the ground.
Activities continued in autumn 2008 also at the Ky-
viškės Calibration Baseline of the Vilnius Gediminas
Technical University (VGTU) in Lithuania. The FGI
used the stable baseline and test field there to examine
the scale of GPS measurements. The previous high-
precision EDM results from 1997, 2001 and 2007 were
used for comparison, complemented with new measure-
ments simultaneously with the GPS measurements.
The measurements in Austria, Estonia and Lithuania
were made with the same traceable scale transfer tech-
nique. The Kern ME5000 Mekometer, calibrated before
and after at the Nummela Standard Baseline, was used as
a transfer standard. The scale was transferred also to
China, as two expeditions visited the Nummela Standard
Baseline in summer 2009, from the Chinese Academy of
Surveying and Mapping and from the Zhengzhou Sur-
veying and Mapping Institute.

26
Figure V-1. A part of the new ADM equipment of the
PTB on the zero pillar of the Nummela Standard Base-
line. (Photo: Jorma Jokela)
Figure V-2. The halfway of the Nummela Standard
Baseline. (Photo: Martin Rub)
Figure V-3. The geodetic baseline of the BEV in Inns-
bruck, Austria. (Photo: Jorma Jokela)
Table V-1. Number of calibrations made with the FGI
rod and system calibration comparator.
Year Invar rods Digital
levels
2007 40 32
2008 35 24
2009 27 16
2010 35 24
Figure V-4. The Vääna calibration baseline of the Esto-
nian Maa-amet. (Photo: Jorma Jokela)
Figure V-5. The Kyviškės calibration baseline in
Lithuania is ideal for also GPS metrology. (Photo: Jorma
Jokela)
5.2 Calibration of levelling instrumenta-
tion
The FGI has constructed a horizontal-vertical rod-
comparator/system calibration apparatus. In addition to
the calibration of conventional and digital levelling rods,
the system calibration of digital levels is performed in a
fully automated fashion. In addition to calibrations for
Finnish users, levels and rods were calibrated for China,
Estonia, Iceland, Latvia, Lithuania and Sweden. Co-
operation with the Chinese Academy of Surveying and
Mapping (CASM) was started. Planning and construc-
tion of a modernized comparator is in progress.
5.3 Acceleration of free fall
The FGI is the National Standards Laboratory for the ac-
celeration of free fall. The FGI maintains the national
measurement standard (the FG5-221 absolute gravime-
ter), the national gravity reference station at the
Metsähovi Geodetic Observatory, the Masala–Vihti cali-
bration line for relative gravimeters, and the First Order
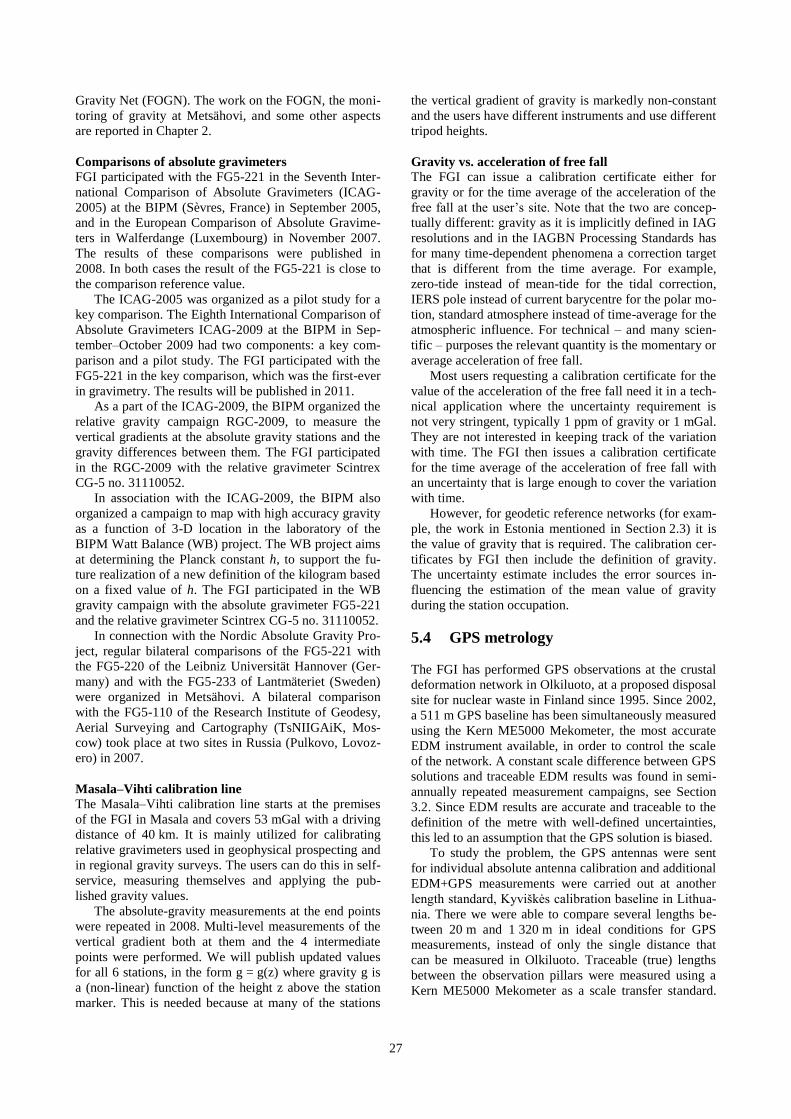
27
Gravity Net (FOGN). The work on the FOGN, the moni-
toring of gravity at Metsähovi, and some other aspects
are reported in Chapter 2.
Comparisons of absolute gravimeters
FGI participated with the FG5-221 in the Seventh Inter-
national Comparison of Absolute Gravimeters (ICAG-
2005) at the BIPM (Sèvres, France) in September 2005,
and in the European Comparison of Absolute Gravime-
ters in Walferdange (Luxembourg) in November 2007.
The results of these comparisons were published in
2008. In both cases the result of the FG5-221 is close to
the comparison reference value.
The ICAG-2005 was organized as a pilot study for a
key comparison. The Eighth International Comparison of
Absolute Gravimeters ICAG-2009 at the BIPM in Sep-
tember–October 2009 had two components: a key com-
parison and a pilot study. The FGI participated with the
FG5-221 in the key comparison, which was the first-ever
in gravimetry. The results will be published in 2011.
As a part of the ICAG-2009, the BIPM organized the
relative gravity campaign RGC-2009, to measure the
vertical gradients at the absolute gravity stations and the
gravity differences between them. The FGI participated
in the RGC-2009 with the relative gravimeter Scintrex
CG-5 no. 31110052.
In association with the ICAG-2009, the BIPM also
organized a campaign to map with high accuracy gravity
as a function of 3-D location in the laboratory of the
BIPM Watt Balance (WB) project. The WB project aims
at determining the Planck constant h, to support the fu-
ture realization of a new definition of the kilogram based
on a fixed value of h. The FGI participated in the WB
gravity campaign with the absolute gravimeter FG5-221
and the relative gravimeter Scintrex CG-5 no. 31110052.
In connection with the Nordic Absolute Gravity Pro-
ject, regular bilateral comparisons of the FG5-221 with
the FG5-220 of the Leibniz Universität Hannover (Ger-
many) and with the FG5-233 of Lantmäteriet (Sweden)
were organized in Metsähovi. A bilateral comparison
with the FG5-110 of the Research Institute of Geodesy,
Aerial Surveying and Cartography (TsNIIGAiK, Mos-
cow) took place at two sites in Russia (Pulkovo, Lovoz-
ero) in 2007.
Masala–Vihti calibration line
The Masala–Vihti calibration line starts at the premises
of the FGI in Masala and covers 53 mGal with a driving
distance of 40 km. It is mainly utilized for calibrating
relative gravimeters used in geophysical prospecting and
in regional gravity surveys. The users can do this in self-
service, measuring themselves and applying the pub-
lished gravity values.
The absolute-gravity measurements at the end points
were repeated in 2008. Multi-level measurements of the
vertical gradient both at them and the 4 intermediate
points were performed. We will publish updated values
for all 6 stations, in the form g = g(z) where gravity g is
a (non-linear) function of the height z above the station
marker. This is needed because at many of the stations
the vertical gradient of gravity is markedly non-constant
and the users have different instruments and use different
tripod heights.
Gravity vs. acceleration of free fall
The FGI can issue a calibration certificate either for
gravity or for the time average of the acceleration of the
free fall at the user’s site. Note that the two are concep-
tually different: gravity as it is implicitly defined in IAG
resolutions and in the IAGBN Processing Standards has
for many time-dependent phenomena a correction target
that is different from the time average. For example,
zero-tide instead of mean-tide for the tidal correction,
IERS pole instead of current barycentre for the polar mo-
tion, standard atmosphere instead of time-average for the
atmospheric influence. For technical – and many scien-
tific – purposes the relevant quantity is the momentary or
average acceleration of free fall.
Most users requesting a calibration certificate for the
value of the acceleration of the free fall need it in a tech-
nical application where the uncertainty requirement is
not very stringent, typically 1 ppm of gravity or 1 mGal.
They are not interested in keeping track of the variation
with time. The FGI then issues a calibration certificate
for the time average of the acceleration of free fall with
an uncertainty that is large enough to cover the variation
with time.
However, for geodetic reference networks (for exam-
ple, the work in Estonia mentioned in Section 2.3) it is
the value of gravity that is required. The calibration cer-
tificates by FGI then include the definition of gravity.
The uncertainty estimate includes the error sources in-
fluencing the estimation of the mean value of gravity
during the station occupation.
5.4 GPS metrology
The FGI has performed GPS observations at the crustal
deformation network in Olkiluoto, at a proposed disposal
site for nuclear waste in Finland since 1995. Since 2002,
a 511 m GPS baseline has been simultaneously measured
using the Kern ME5000 Mekometer, the most accurate
EDM instrument available, in order to control the scale
of the network. A constant scale difference between GPS
solutions and traceable EDM results was found in semi-
annually repeated measurement campaigns, see Section
3.2. Since EDM results are accurate and traceable to the
definition of the metre with well-defined uncertainties,
this led to an assumption that the GPS solution is biased.
To study the problem, the GPS antennas were sent
for individual absolute antenna calibration and additional
EDM+GPS measurements were carried out at another
length standard, Kyviškės calibration baseline in Lithua-
nia. There we were able to compare several lengths be-
tween 20 m and 1 320 m in ideal conditions for GPS
measurements, instead of only the single distance that
can be measured in Olkiluoto. Traceable (true) lengths
between the observation pillars were measured using a
Kern ME5000 Mekometer as a scale transfer standard.

28
The ME5000 was calibrated at the Nummela Standard
Baseline, a national standard of length in Finland.
The GPS data were processed in 24-hour sessions us-
ing individual and type-calibrated antenna tables, a local
and global ionosphere model, three different cut-off ele-
vation angles and several linear combinations and the re-
sults were compared with the EDM results. Analysis
shows that the ambiguity resolution strategy and antenna
calibration model play a significant role in GPS meas-
urements compared to the cut-off elevation angle and
ionosphere model.
The best metrological agreement was obtained with
the L1 solution using an ionosphere model and individu-
ally calibrated antennas. The accuracy (rms) and maxi-
mum difference from true (EDM) values were 0.3 mm
and 0.7 mm, respectively (Fig. V-6). However, a dis-
tance-dependency of 0.5 ppm, which was not seen in lin-
ear combinations, was evident for L1 and L1&L2 solu-
tions. On the other hand, linear combinations with type-
calibrated tables caused variations of up to 4 mm from
the true value, even if high-quality choke ring antennas
were used. With individually calibrated antennas, all so-
lutions were within ±1 mm of the true value.
The study shows that individually calibrated antennas
improve the accuracy of GPS solutions in metrological
sense and that the best repeatability does not mean the
best accuracy.
Figure V-6. The rms values of the different processing strategies using the global ionosphere model. The EDM results
have been used as true values when rms values were determined. When type calibrated antennas (black and grey bar)
were used, L1&L2 gives the best results. Linear combinations (Narrow-Lane and QIF) gave significantly worse accu-
racy but the best repeatability (not shown in the figure). When individual calibration values (white bar) were used, the
rms values of all results decreased significantly but clear difference between non-combined results (L1, L1&L2) and
linear combinations is still visible. In this case L1 gave the best result as a combination of accuracy, repeatability and
distance-dependency (not visible in the figure). The ionosphere model or satellite cut-off elevation angle did not have a
significant influence on the results.

29
VI. Publications, Finnish Geodetic Institute
2007
Ahola J., Koivula, H., Mäkinen, J., Poutanen, M., Ruot-
salainen, H. (2007): Geodynamics. In Poutanen, M.,
Koivula, H. (eds.) Geodetic Operations in Finland
2004–2007, pp. 14–19.
Ahola, J., Koivula, H., Poutanen, M., Jokela, J. (2007):
GPS operations at Olkiluoto, Kivetty and Romuvaara
in 2006. Posiva Working Report 2007-56, 178 p.
Anonymous (2007): Length. In Finnish National Stan-
dards Laboratories Annual Report 2006, pp. 17–25.
MIKES.
Anonymous (2007): Thermometry and mass. In Finnish
National Standards Laboratories Biennial Report
2006, pp. 8–16. MIKES.
Bilker-Koivula, M., Mäkinen, J., Ruotsalainen, H., Vir-
tanen, H., Virtanen, J. (2007): Gravity Field. In Pou-
tanen, M., Koivula, H. (eds.) Geodetic Operations in
Finland 2004–2007, pp. 10–13.
Bilker-Koivula, M., Virtanen, J., Virtanen, H., Mäkinen,
J., Tervo, M. (2007): Analysis of GRACE monthly
gravity field models using water storage time series.
In Kaila, K., Korja, T. (eds.) XXIII Geofysiikan
Päivät, May 23–24, 2007, Geofysiikan Seura, Oulu,
Finland, pp. 17–22.
Cai J., Koivula, H., Grafarend E. W., Poutanen, M.
(2007): The statistical analysis of the eigenspace
components of the strain rate tensor derived from
FinnRef GPS measurements (1997–2004) in Fenno-
scandia. In Xu, P., Liu, J., Dermanis, A. (eds.) VI
Hotine-Marussi Symposium of Theoretical and Com-
putational Geodesy: Challenge and Role of Modern
Geodesy, Wuhan, China, May 29 – June 2, 2006,
IAG Symposia 132, 79–87.
Chen, R., Hyttinen, A., Häkli, P., Koivula, H., Poutanen,
M., Tervo, M. (2007): Positioning and other applica-
tions. In Poutanen, M., Koivula, H. (eds.) Geodetic
Operations in Finland 2004–2007, pp. 20–23.
Dayioglu, S., Ruotsalainen, H. (2007): Metsähovin lähi-
ympäristön painovoimakartoitus ja sen käytöstä ma-
akerrospaksuuksien arviointiin. In Kaila, K., Korja,
T. (eds.) XXIII Geofysiikan Päivät, May 23–24,
2007, Geofysiikan Seura, Oulu, Finland, pp. 23–28.
Hokkanen, T., Korhonen, K., Virtanen, H., Laine, E.-L.
(2007): Effects of the fracture water of bedrock on
superconducting gravimeter data. Near Surface Geo-
physics, 5:145–151.
Hokkanen, T., Virtanen, H., Pirttivaara, M. (2007): On
the hydrogeological noise in superconducting gra-
vimeter data. Near Surface Geophysics, 5:137–143.
Häkli, P. (2007): A case study on Virtual Reference Sta-
tion Concept in Finland. Survey Review,
39 (304):145–155.
Häkli, P. (2007): Test para estudiar la precisión y las
posibilidades del Método de Estaciones Virtuales de
Referencia (VRS) en Finlandia. Topografía y carto-
grafía: Revista del Ilustre Colegio Oficial de In-
genieros Técnicos en Topografía, 24:141, 34–47.
JHS163 (2007): Suomen korkeusjärjestelmä N2000.
Työryhmä: Poutanen, M., Saaranen, V., Lehmus-
koski, P., Mäkinen, J., Rouhiainen, P., Takalo, M.,
Musto, M., Ollikainen, M., Ruotsalainen, R., Tätilä,
P. http://docs.jhs-suositukset.fi/jhs-
suositukset/JHS163/ JHS163.html
Jokela, J., Mäkinen, J., Rouhiainen, P., Ahola, J., Bilker-
Koivula, M., Häkli, P. (2007): Metrology and stan-
dardization. In Poutanen, M., Koivula, H. (eds.)
Geodetic Operations in Finland 2004–2007, pp. 24–
26.
Koivula, H., Hyttinen, A., Häkli, P., Jokela, J., Lehmus-
koski, P., Ollikainen, M., Poutanen, M., Rouhiainen,
P., Saaranen, V., Takalo, M. (2007): Reference
Frames. In Poutanen, M., Koivula, H. (eds.) Geodetic
Operations in Finland 2004–2007, pp. 4–9.
Mäkinen, J., Amalvict, M., Shibuya, K., Fukuda, Y.
(2007): Absolute gravimetry in Antarctica: Status
and prospects. J. Geodynamics, 43, 339–357.
Nordman, M., Eresmaa, R., Poutanen, M., Järvinen, H.,
Koivula, H., Luntama, J.-P. (2007): Using numerical
weather prediction model derived tropospheric slant
delays in GPS processing: a case study. Geophysica,
43:1-2, 49–57.
Poutanen M. and DynaQlim-työryhmä (2007): Dy-
naQlim – Upper Mantle Dynamics and Quaternary
Climate in Cratonic Areas. In Kaila, K., Korja, T.
(eds.) XXIII Geofysiikan Päivät, May 23–24, 2007,
Geofysiikan Seura, Oulu, Finland, pp. 129–132.
Poutanen, M. (2007): Geodesian uudet aatteet.
Maankäyttö 3/2007, 13–16.
Poutanen, M. (2007): Polaaritutkimuksen kansallinen
komitea, kansainvälinen polaarivuosi ja Suomen
Etelämanner-tutkimus. In Kaila, K., Korja, T. (eds.)
XXIII Geofysiikan Päivät, May 23–24, 2007,
Geofysiikan Seura, Oulu, Finland, pp. 125–127.

30
Poutanen, M. (2007): Suomen uusi korkeusjärjestelmä
N2000. Positio 2/2007, 14–16.
Poutanen, M., Häkli, P. (2007): National Report of
Finland. Conference Proceedings. EUREF 2007
Symposium, London, England, June 6–9, 2007, 9 p.
Poutanen M., Koivula, H. (eds.) (2007): Geodetic Op-
erations in Finland 2003–2007. Finnish Geodetic In-
stitute, Kirkkonummi, 37 p.
Poutanen M., Knudsen, P., Lilje, M., Nørbech, T., Plag,
H.-P., Scherneck H.-G. (2007): The Nordic Geodetic
Observing System (NGOS). In Rizos, C., Tregoning,
P. (eds.) Dynamic Planet – Monitoring and Under-
standing a Dynamic Planet with Geodetic and
Oceanographic Tools, Conference of the Interna-
tional Association of Geodesy, August 22–26, 2005,
Cairns, Australia, IAG Symposia 130, 749–756.
Poutanen, M., Suurmäki, H. (eds., 2007): FinCO-
SPAR2007, Suomen avaruustutkijoiden XI kansal-
linen Cospar-kokous – Ohjelma ja abstraktit, 50 p.
Tervo, M., Eresmaa, R., Poutanen, M., Järvinen, H.,
Koivula, H. (2007): Vinoviiveiden käyttö GPS-
laskennassa. In Kaila, K., Korja, T. (eds.) XXIII
Geofysiikan Päivät, May 23–24, 2007, Geofysiikan
Seura, Oulu, Finland, pp. 155–158.
Tervo, M., Poutanen, M., Koivula, H. (2007): Tide
Gauge Monitoring Using GPS. In Rizos, C., Tregon-
ing, P. (eds.) Dynamic Planet – Monitoring and Un-
derstanding a Dynamic Planet with Geodetic and
Oceanographic Tools, Conference of the Interna-
tional Association of Geodesy, August 22–26, 2005,
Cairns, Australia, IAG Symposia 130, 75–79.
Timmen, L., Gitlein, O., Müller, J., Denker, H., Mäki-
nen, J., Bilker, M., Wilmes, H., Falk, R., Reinhold,
A., Hoppe, W., Pettersen, B. R., Omang, O. C. D.,
Svendsen, J. G. G., Øvstedal, O., Scherneck, H.-G.,
Engen, B., Engfeldt, A., Strykowski, G., Forsberg, R.
(2007): Observing Fennoscandian geoid change for
GRACE validation. Proceedings of the Joint
CHAMP/GRACE Science Meeting, Geo-
ForschungsZentrum, Potsdam, July 6–8, 2004, 10 p.
Virtanen, H. (2007): Huipputarkkaa painovoiman mit-
tausta. Maankäyttö 4/2007, 18–20.
Virtanen, H., Bilker-Koivula, M., Tervo, M., Virtanen,
J., Mäkinen, J. (2007): Suprajohtava gravimetri ja
hydrologia. In Kaila, K., Korja, T. (eds.) XXIII
Geofysiikan Päivät, May 23–24, 2007, Geofysiikan
Seura, Oulu, Finland, pp. 187–191.
Virtanen, J., Mäkinen, J., Bilker-Koivula, M., Virtanen,
H. (2007): Itämeren korkeuden vaihtelun vaikutus
GRACE-aikasarjaan. In Kaila, K., Korja, T. (eds.)
XXIII Geofysiikan Päivät, May 23–24, 2007,
Geofysiikan Seura, Oulu, Finland, pp. 193–198.
Vitushkin, L., Z. Jiang, M. Becker, O. Francis, A. Ger-
mak, M. Amalvict, R. Bayer, M. Bilker-Koivula, G.
D’Agostino, S. Desogus, J.E. Faller, R. Falk, J.
Hinderer, C. Gagnon, T. Jakob, E. Kalish, J. Kos-
telecky, C. Lee, J. Liard, Yu. Lokshyn, B. Luck, J.
Mäkinen, S. Mizushima, N. Le Moigne, V. Nalivaev,
C. Origlia, V. Palinkas, E. R.Pujol, P. Richard, L.
Robertsson, D. Ruess, D. Schmerge, Yu. Stus, S.
Svitlov, S. Thies, C. Ullrich, M. Van Camp, A. Vi-
tushkin, H. Wilmes (2007): The Seventh Interna-
tional Comparison of Absolute Gravimeters ICAG-
2005 at the BIPM. Organization and preliminary re-
sults. Proceedings of the First International Sympo-
sium of the International Gravity Field Service
„Gravity Field of the Earth“. Istanbul, Turkey, Au-
gust 28–September 1st, 2006. General Command of
Mapping, Harita Dergisi, Special Issue 18, 382–387.
2008
Ahola, J., Koivula, H., Jokela, J. (2008): GPS Operations
at Olkiluoto, Kivetty and Romuvaara in 2007. Posiva
Working Report 2008-35, 189 p.
Bilker-Koivula, M. (2008): Miten GPS-korkeudet
eroavat vaaituista? Positio 2/2008, 11–13.
Bilker-Koivula, M. (2008): Suomen nykyiset geoidimal-
lit – tausta ja tarkkuus. Teoksessa: Henriksson, R.,
Mäkelä, J. (toim.) Historiaa kunnioittaen, tulevai-
suuteen suunnaten, Maanmittaustieteiden Päivät
2008, November 27–28, 2008, TKK, Espoo, Finland,
pp. 35–38.
Bilker-Koivula, M., Mäkinen, J., Timmen, L., Gitlein,
O., Klopping, F., Falk, R. (2008): Repeated Absolute
Gravity Measurements in Finland. In: Peshekhonov
(ed.) International Symposium Terrestrial Gravim-
etry: Static and Mobile Measurements – Proceed-
ings, August 20–23, 2007, State Research Center of
Russia Elektropribor, St. Petersburg, Russia, pp.
147–151.
Būga, A., Jokela, J., Putrimas, R. (2008): Traceability,
stability and use of the Kyviškės Calibration Baseline
– the first 10 years. In: Cygas, D., Froehner, K.D.
(eds.), The 7th International Conference Environ-
mental Engineering, Vilnius, Lithuania, May 22–23,
2008, Selected Papers 3, pp. 1274–1280.
Engsager, K., Mäkinen, J., Lilje, M., Ågren, J., Eriksson,
P.-O., Olsson, P.-A., Saaranen, V., Schmidt, K.,
Svensson, R., Takalo, M., Vestøl, O. (2008): The
Baltic Levelling Ring. In: Agria Torres, J., Hornik,
H. (eds.) Report on the Symposium of the IAG Sub-
commission 1.3a Europe (EUREF) held in Riga, June
14–17, 2006. Mitteilungen des Bundesamtes für Kar-
tographie und Geodäsie, Band 40, EUREF Publica-
tion 16, 62–64.
Gitlein O., Timmen, L., Müller, J., Denker, H., Mäkinen,
J., Bilker-Koivula, M., Pettersen, B. R., Lysaker,
D. I., Gjevestad, J. G. O., Breili, K., Wilmes, H.,
Falk, R., Reinhold, A., Hoppe, W., Scherneck, H.-G.,
Engen, B., Omang, O. C. D., Engfeldt, A., Lilje, M.,
Ågren, J., Lidberg, M., Strykowski, G., Forsberg, R.
(2008): Observing Absolute Gravity Acceleration in
31
the Fennoscandian Land Uplift Area. In: Peshek-
honov (ed.) International Symposium Terrestrial
Gravimetry: Static and Mobile Measurements – Pro-
ceedings, August 20–23, 2007, State Research Center
of Russia Elektropribor, St. Petersburg, Russia, pp.
175–180.
Häkli, P., Koivula, H. (2008): Quality of Geodetic GPS.
Proceedings of the 15th
General Meeting of the Nor-
dic Geodetic Commission, National Space Institute
Technical Report 1/2008, 94–101.
Häkli, P., Koivula, H., Puupponen, J. (2008): Assess-
ment of practical 3D geodetic accuracy for static
GPS surveying. Integrating Generations, FIG Work-
ing Week 2008 Proceedings, June 14–19, 2008,
Stockholm, Sweden, 14 p.
Häkli, P., Koivula, H., Puupponen, J. (2008): Staattisen
GPS-mittauksen geodeettisesta 3D-tarkkuudesta.
Maanmittaus, 83:2, 5–17.
Häkli, P., Poutanen, M. (2008): National Report of Fin-
land. Conference Proceedings. EUREF 2008 Sympo-
sium, Brussels, Belgium, June 18–20, 2008, 8 p.
Ihde J., Mäkinen J., Sacher M. (2008): Conventions for
the Definition and Realization of a European Vertical
Reference System (EVRS)—EVRS Conventions
2007. http://www.bkg.bund.de/geodIS/EVRS/
SharedDocs/Downloads/Publications/EVRF Conven-
tions2007,templateId=raw,property=publicationFile.
pdf/EVRFConventions2007.pdf, 10 p.
Ihde, J., Sacher, M., Mäkinen, J. (2008): European Ver-
tical Reference System 2007 – a Combination of
UELN and ECGN. In: Agria Torres, J., Hornik, H.
(eds.) Report on the Symposium of the IAG Sub-
commission 1.3a Europe (EUREF) held in Riga, June
14–17, 2006. Mitteilungen des Bundesamtes für Kar-
tographie und Geodäsie, Band 40, EUREF Publica-
tion 16, 48–54.
Jokela, J. (2008): Geodetic baselines in length metrol-
ogy. 1st Workshop on Absolute Long Distance Meas-
urement in Air. Centro Español de Metrologia, Ma-
drid, Spain, May 20, 2008. http://www.longdistance
project.eu/workshops
Jokela, J., Häkli, P., Ahola, J., Uusitalo, J. (2008): The
Nummela Standard Baseline – a world-class length
standard. Proceedings of the 15th
General Meeting of
the Nordic Geodetic Commission, National Space In-
stitute Technical Report 1/2008, 102–104.
Lehmuskoski, P. (2008): Precise Levelling Campaigns at
Olkiluoto in 2006–2007. Posiva Working Report
2008-19, 30 p. + CD.
Lehmuskoski P., Saaranen, V., Takalo, M., Rouhiainen,
P. (2008): Suomen Kolmannen tarkkavaaituksen ki-
intopisteluettelo. Bench Mark List of the Third Lev-
elling of Finland. Publ. Finn. Geod. Inst. 139, 220 p.
Lilje, M., Poutanen, M., Knudsen, P., Scherneck, H.-G.,
Skei, I., Thorsen, S. O. (2008): NGOS, the Nordic
Geodetic Observing System. Integrating Generations,
FIG Working Week 2008 Proceedings, June 14–19,
2008, Stockholm, Sweden, 16 p.
Neumeyer, J., Barthelmes, F., Kroner, C., Petrovic, S.,
Schmidt, R., Virtanen, H., Wilmes, H. (2008):
Analysis of gravity field variations derived from su-
perconducting gravimeter recordings, the GRACE
satellite and hydrological models at selected Euro-
pean sites. Earth Planets Space 60, 505–518.
Norbech, T., Engsager, K., Jivall, L., Knudsen, P., Koi-
vula, H., Lidberg, M., Madsen, B., Ollikainen, M.,
Weber, M. (2008): Transformation from a Common
Nordic Reference Frame to ETRS89 in Denmark,
Finland, Norway and Sweden – status report. Pro-
ceedings of the 15th
General Meeting of the Nordic
Geodetic Commission, National Space Institute
Technical Report 1/2008, 68–75.
Ollikainen, M. (2008): The EUVN_DA GPS campaign
in Finland in 2005. Proceedings of the 15th
General
Meeting of the Nordic Geodetic Commission, Na-
tional Space Institute Technical Report 1/2008, 140–
146.
Ollikainen, M., Ahola, J. (2008): Ten years GPS obser-
vations to detect local crustal movements. Proceed-
ings of the 15th
General Meeting of the Nordic Geo-
detic Commission, National Space Institute Techni-
cal Report 1/2008, 197–203.
Ollikainen, M., Jokela, J., Poutanen, M., Chen, R., Ta-
kalo, M. (2008): National Report of Finland. In:
Agria Torres, J., Hornik, H. (eds.) Report on the
Symposium of the IAG Sub-commission 1.3a Europe
(EUREF) held in Riga, June 14–17, 2006. Mitteilun-
gen des Bundesamtes für Kartographie und Geodäsie,
EUREF Publication 16, 226–232.
Poutanen, M., Ahokas, E., Chen, Y., Oksanen, J., Portin,
M., Ruuhela, S., Suurmäki, H. (eds., 2008): Geodeet-
tinen laitos – Geodetiska Institutet – Finnish Geo-
detic Institute 1918–2008. Publ. Finn. Geod. Inst.
141, 173 p.
Poutanen, M., Knudsen, P., Lilje, M., Norbech, T.,
Scherneck, H.-G. (2008): NGOS, The Nordic Geo-
detic Observing System. Proceedings of the 15th
General Meeting of the Nordic Geodetic Commis-
sion, National Space Institute Technical Report
1/2008, 167–173.
Puupponen, J., Häkli, P., Koivula, H. (2008): Influence
of global ionosphere model in static GPS surveying
using commercial GPS processing software. Integrat-
ing Generations, FIG Working Week 2008 Proceed-
ings, June 14–19, 2008, Stockholm, Sweden, 8 p.
Rouhiainen, P., Takalo, M. (2008): Some calibration re-
sults of digital levelling systems. Integrating Genera-
tions, FIG Working Week 2008 Proceedings, June
14–19, 2008, Stockholm, Sweden, 6 p.

32
Ruotsalainen, H. (2008): A new interferometrically re-
cording water level tilt meter. Proceedings of the 15th
General Meeting of the Nordic Geodetic Commis-
sion, National Space Institute Technical Report
1/2008, 205–206.
Saaranen, V., Lehmuskoski, P., Rouhiainen, P., Takalo,
M., Mäkinen, J. (2008): The New Finnish Height
System N2000. In: Agria Torres, J., Hornik, H. (eds.)
Report on the Symposium of the IAG Sub-commission
1.3a Europe (EUREF) held in Riga, June 14–17,
2006. Mitteilungen des Bundesamtes für Karto-
graphie und Geodäsie, EUREF Publication 16, 74–
79.
Saarenmaa, H., Kahanpää, J., Lampinen, R., Lahti, T.,
Heikkinen, M., Kovanen, J., Häkli, P., Puupponen, J.
(2008): Luonnontieteellisten havaintojen sijainnin
ilmoittaminen EUREF- FIN-koordinaatistossa. Luon-
non Tutkija 112:5, 144–150.
Takalo, M. (2008): Working Group for the Height De-
termination – Activity report for the period 2002–
2006. Proceedings of the 15th
General Meeting of the
Nordic Geodetic Commission, National Space Insti-
tute Technical Report 1/2008, 79–82.
Takalo, M., Rouhiainen, P., Lehmuskoski, P., Saaranen,
V. (2008): On digital levelling technique applied in
water crossing. Proceedings of the 15th
General
Meeting of the Nordic Geodetic Commission, Na-
tional Space Institute Technical Report 1/2008, 151–
154.
Wallerand, J.-P., Abou-Zeid, A., Badr, T., Balling, P.,
Jokela, J., Kugler, R., Matus, M., Merimaa, M., Pou-
tanen, M., Prieto, P., van den Berg, S., Zucco, M.
(2008): Towards new absolute long distance meas-
urement systems in air. NCSL International 2008
Workshop & Symposium Metrology’s Impact on
Business, Orlando, Florida, USA, August 3–7, 2008.
2009
Agria Torres, J., Altamimi, Z., Boucher, C., Brockmann,
E., Bruyninx, C., Caporali, A., Gurtner, W., Habrich,
H., Hornik, H., Ihde, J., Kenyeres, A., Mäkinen, J.,
van der Marel, H., Seeger, H., Simek, J., Stangl G.,
Weber, G. (2009): Status of the European Reference
Frame (EUREF). In: Sideris, M. G. (ed.) Observing
our Changing Earth. Proceedings of the 2007 IAG
General Assembly, Perugia, Italy, July 2–13, 2007.
IAG Symposia 133, 47–56.
Anonymous (2009): Length. In Finnish National Stan-
dards Laboratories Biennial Report 2007–2008, pp.
18–26. MIKES.
Anonymous (2009): Thermometry and Mass. In Finnish
National Standards Laboratories Biennial Report
2007–2008, pp. 9–17. MIKES.
Arsov, K., Raja-Halli, A., Näränen, J., Poutanen, M.
(2009): Toward 2 KHz New SLR System in
Metsähovi. ILRS Workshop on SLR tracking of GNSS
Constellations: 50 Years of Satellite Geodesy &
Geodynamics, Metsovo, Greece.
Bilker-Koivula, M., Mäkinen, J., Ruotsalainen, H.,
Timmen, L., Gitlein, O., Klopping, F., Falk, R.
(2009): Absoluuttipainovoima-aikasarjat Suomessa.
In Tietäväinen, H., Jokinen, J. (eds.) XXIV Geofysii-
kan Päivät, May 13–14, 2009, Geofysiikan Seura,
Helsinki, Finland, p. 19.
Bilker-Koivula, M., Ollikainen, M. (2009): Suomen ge-
oidimallit ja niiden käyttäminen korkeuden muun-
noksissa. Geodeettisen laitoksen tiedote 29, 48 p.
Bruyninx, C., Altamimi, Z., Boucher, C., Brockmann,
E., Caporali, A., Gurtner, W., Habrich, H., Hornik,
H., Ihde, J., Kenyeres, A., Mäkinen, J., Stangl, G.,
van der Marel, H., Simek, J., Söhne, W., Torres,
J. A., Weber, G. (2009): The European Reference
Frame: Maintenance and Products. In: Drewes, H.
(ed.) Geodetic Reference Frames, Munich, Germany,
October 9–14, 2006. IAG Symposia 134, 131–136.
Gross, R., Poutanen, M. (2009): Geodetic Observations
of Glacial Isostatic Adjustment. EOS, 90(41):365.
Häkli, P., Puupponen, J., Koivula, H., Poutanen, M.
(2009): Suomen geodeettiset koordinaatistot ja niiden
väliset muunnokset. Geodeettisen laitoksen tiedote
30. 121 p.
Jokela, J., Häkli, P., Ahola, J., Būga, A., Putrimas, R.
(2009): On traceability of long distances. Proceed-
ings of the XIX IMEKO World Congress Fundamen-
tal and Applied Metrology, September 6–11, 2009,
Lisbon, Portugal, pp. 1882–1887.
Jokela, J., Häkli, P., Uusitalo, J., Piironen, J., Poutanen,
M. (2009): Control Measurements between the Geo-
detic Observation Sites at Metsähovi. In: Drewes, H.
(ed.) Geodetic Reference Frames, Munich, Germany,
October 9–14, 2006. IAG Symposia 134, 101–106.
Kallio, U., Ahola, J., Koivula, H., Jokela, J., Poutanen,
M. (2009): GPS Operations at Olkiluoto, Kivetty and
Romuvaara in 2008. Posiva Working Report 2009-
75, 215 p.
Lahti, M. (ed.), Ahola, J., Jokela, J., Kallio, U., Kemp-
painen, K., Koivula, H., Lakio, A., Poutanen M.,
Saari, J. (2009): Results of Monitoring at Olkiluoto
in 2008, Rock Mechanics. Posiva Working Report
2009-47. 74 p. Olkiluoto.
Mäkinen J., Ihde, J. (2009): The Permanent Tide In
Height Systems. In: Sideris, M. G. (ed.) Observing
our Changing Earth. Proceedings of the 2007 IAG
General Assembly, Perugia, Italy, July 2–13, 2007.
IAG Symposia 133, 81–87.
Nordman, M., Eresmaa, R., Boehm, J., Poutanen, M.,
Koivula, H., Järvinen, H. (2009): Effect of tropo-
sphere slant delays on regional double difference

33
GPS processing. Earth Planets Space, 61:7, 845–
852.
Nordman, M., Mäkinen, J., Virtanen, H., Johansson, J.,
Bilker-Koivula, M., Virtanen, J. (2009): Crustal load-
ing in vertical GPS time series in Fennoscandia.
Journal of Geodynamics 48, 144–150.
Näränen, J. (2009): Multiwavelength Studies of Regolith
Effects in Planetary Remote Sensing. PhD Thesis,
University of Helsinki.
Poutanen, M., Jokela, J., Häkli, P., Koivula H., Kallio,
U. (2009): Bringing a traceable scale to high-
precision geodetic measurements. 2nd
Workshop on
Absolute Long Distance Measurement in Air. Dutch
Metrology Institute VSL, Delft, The Netherlands,
October 2, 2009. http://www.longdistanceproject
.eu/workshops
Raiskila, S., Leväniemi, H., Ruotsalainen, H., Pesonen,
L. J. (2009): Geophysical investigations of the Keu-
russelkä impact structure in central Finland. XXIV
Geofysiikan Päivät, May 13–14, 2009, Geofysiikan
Seura, Helsinki, Finland, p. 50.
Ruotsalainen, H. E. (2009): A modernized interferomet-
rical water tube tiltmeter operating in Tytyri mine,
Lohja, Finland. XXIV Geofysiikan Päivät, May 13–
14, 2009, Geofysiikan Seura, Helsinki, Finland, p.
52.
Ruotsalainen, H. E. (2009): Free core resonance signals
in the recordings of interferometrical tilt meters in
Lohja and superconducting gravimeters. XXIV
Geofysiikan Päivät, May 13–14, 2009, Geofysiikan
Seura, Helsinki, Finland, p. 53.
Saaranen, V., Lehmuskoski, P., Rouhiainen, P., Takalo,
M., Mäkinen J., Poutanen, M. (2009): The New Fin-
nish Height Reference N2000. In: Drewes, H. (ed.)
Geodetic Reference Frames, Munich, Germany, Oc-
tober 9–14, 2006. IAG Symposia 134, 297–302.
Sacher, M., Ihde, J., Liebsch, G., Mäkinen, J. (2009):
EVRF2007 as the realization of the European Verti-
cal Reference System. Boll. Geod. Sci. Aff.
LXVIII:1, 35–50.
Wallerand, J-P., Abou-Zeid, A., Badr, T., Balling, P.,
Jokela, J., Kugler, R., Meiners-Hagen, K., Merimaa,
M., Poutanen, M., Prieto, E., Skorpil, H., van den
Berg, S., Zucco, M. (2009): Absolute long distance
measurement in air. Proceedings of the 14th
Interna-
tional Congress of Metrology, Paris, France, June
22–25, 2009.
2010
Ardalan, A. A., Karimi, R., Bilker-Koivula, M. (2010):
An overdetermined geodetic boundary value problem
approach to telluroid and quasi-geoid computations.
Journal of Geodesy 84:1, 97–104.
Ardalan, A. A., Karimi, R., Poutanen, M. (2010): A bias-
free geodetic boundary value problem approach to
height datum unification. Journal of Geodesy 84:2,
123–134.
Bilker-Koivula, M. (2010): Development of the Finnish
height conversion surface FIN2005N00, Nordic
Journal of Surveying and Real Estate Research 7:1,
76–88.
Francis, O., van Dam, T., Germak, A., Amalvict, M.,
Bayer, R., Bilker-Koivula, M., Calvo, M.,
D’Agostino, G.-C., Dell’Acqua, T., Engfeldt, A.,
Faccia, R., Falk, R., Gitlein, O., Fernandez,
Gjevestad, J., Hinderer, J., Jones, D., Kostelecky, J.,
Le Moigne, N., Luck, B., Mäkinen, J., Mclaughlin,
D., Olszak, T., Olsson, P., Pachuta, A., Palinkas, V.,
Pettersen, B., Pujol, R., Prutkin, I., Quagliotti, D.,
Reudink, R., Rothleitner, C., Ruess, D., Shen, C.,
Smith, V., Svitlov, S., Timmen, L., Ulrich, C., Van
Camp, M., Walo, J., Wang, L., Wilmes, H., Xing, L.
(2010): Results of the European Comparison of Ab-
solute Gravimeters in Walferdange (Luxembourg) of
November 2007. In: Mertikas, S. P. (ed.) Gravity,
Geoid and Earth Observation, IAG Symposia 135,
31–36.
Jokela, J., Häkli, P. (2010): Interference measurements
of the Nummela Standard Baseline in 2005 and 2007.
Publ. Finn. Geod. Inst. 144, 85 p.
Jokela, J., Häkli, P., Kugler, R., Skorpil, H., Matus, M.,
Poutanen, M. (2010): Calibration of the BEV Geo-
detic Baseline. Proceedings of the XXIV FIG Interna-
tional Congress ”Facing the Challenges – Building
the Capacity”, Sydney, Australia, April 11–16, 2010.
15 p.
Kallio, U., Nyberg, S., Koivula, H., Jokela, J., Poutanen,
M., Ahola, J. (2010): GPS operations at Olkiluoto in
2009. Posiva Working Report 2010-39, 35 p.
Kallio, U., Poutanen, M. (2010): Simulation of local tie
accuracy on VLBI antennas. In Behrend, D., Baver,
K. (eds.): VLBI2010: From Vision to Reality, 6th
IVS
General Meeting, February 7–13, 2010, Hobart,
Australia, pp. 360–364.
Lehmuskoski, P. (2010): Precise Levelling Campaigns at
Olkiluoto in 2008 and 2009. Posiva Working Report
2010-30, 252 p.
Nordman, M. (2010): Improving GPS time series for
geodynamic studies. PhD thesis. Publ. Finn. Geod.
Inst. 143, 116 p.
Nyberg, S., Poutanen, M., Kallio, U., Ahola, J. (2010):
Monitoring Crustal Deformation in Satakunta Re-
gion, Geophysica, 46:1–2, 69–78.
Nyberg, S., Poutanen, M., Kallio, U. (2010): Monitoring
crustal deformation in Satakunta using GPS meas-
urements. In Heikkinen, P., Arhe, K., Korja, T.,
Lahtinen, R., Pesonen, L. J., Rämö, T. (eds.) Litho-
sphere 2010, 6th
Symposium on the Structure, Com-

34
position and Evolution of the Lithosphere in Finland,
Institute of Seismology, University of Helsinki, pp.
89–92.
Pettersen, B. R., Bilker-Koivula, M., Breili, K., Engfeldt,
A., Falk, R., Gitlein, O., Gjevestad, J. G. O., Hoppe,
W., Lysaker, D.I., Mäkinen, J., Omang, O. C. D.,
Reinhold, A., Timmen, L. (2010): An accuracy as-
sessment of absolute gravimetric observations in
Fennoscandia. Nordic Journal of Surveying and Real
Estate Research 7:1, 7–14.
Poutanen M. (2010): ILP Regional Coordination Com-
mittee DynaQlim: Upper Mantle Dynamics and Qua-
ternary Climate in Cratonic Areas. In Heikkinen, P.,
Arhe, K., Korja, T., Lahtinen, R., Pesonen, L. J.,
Rämö, T. (eds.) Lithosphere 2010, 6th
Symposium on
the Structure, Composition and Evolution of the
Lithosphere in Finland, Institute of Seismology,
University of Helsinki, pp. 109–112.
Poutanen M., Dransch, D., Gregersen, S., Haubrock, S.,
Ivins, E. R., Klemann, V., Kozlovskaya, E., Kukk-
onen, I., Lund, B., Lunkka, J.-P., Milne, G., Müller,
J., Pascal, C., Pettersen, B.-R., Scherneck, H.-G.,
Steffen, H., Vermeersen, B., Wolf, D. (2010): Dy-
naQlim – Upper Mantle Dynamics and Quaternary
Climate in Cratonic Areas. In Cloetingh, S., Negen-
dank, J. (eds.) New Frontiers in Integrated Solid
Earth Sciences, pp. 349–372. Springer.
Poutanen, M., Ivins, E. R. (2010): Introduction to the
special issue of DynaQlim (Upper Mantle Dynamics
and Quaternary Climate in Cratonic Areas). J. Geo-
dynamics 50:1, 1.
Poutanen, M., Ivins, E. R. (2010): Upper Mantle Dynam-
ics and Quaternary Climate in Cratonic Areas (Dy-
naQlim) – Understanding the Glacial Isostatic Ad-
justment. J. Geodynamics 50:1, 2–7.
Poutanen, M., Nyberg, S., Ahola, J. (2010): GPS meas-
urements in Satakunta area, Posiva Working Report
2010-61, 64 p.
Uunila, M., Zubko N, (2010): Experiencing the First
VieVS user workshop. IVS Newsletter 28, 7.
Virtanen, J., Mäkinen, J., Bilker-Koivula, M., Virtanen,
H., Nordman, M., Kangas, A., Johansson, M., Shum,
C. K., Lee, H., Wang, L., Thomas, M. (2010): Baltic
sea mass variations from GRACE: comparison with
in situ and modelled sea level heights. In: Mertikas,
S. P. (ed.) Gravity, Geoid and Earth Observation,
IAG Symposia 135, 571–578.
Vitushkin, L., Jiang, Z., Robertsson, L., Becker, M.,
Francis, O., Germak, A., D’Agostino, G., Palinkas,
V., Amalvict, M., Bayer, R., Bilker-Koivula, M.,
Desogus, S., Faller, J., Falk, R., Hinderer, J., Gagnon,
C., Jakob, T., Kalish, E., Kostelecky, J., Lee, C. W.,
Liard, J., Lokshyn, Y., Luck, B., Mäkinen, J., Mizu-
shima, S., Le Moigne, N., Nalivaev, V., Origlia, C.,
Pujol, E. R., Richard, P., Ruess, D., Schmerge, D.,
Stus, Y., Svitlov, S., Thies, S., Ullrich, C., Van
Camp, M., Vitushkin, A., Wilmes, H. (2010): Results
of the Seventh International Comparison of Absolute
Gravimeters ICAG-2005 at the Bureau International
des Poids et Mesures, Sèvres. In: Mertikas, S. P. (ed.)
Gravity, Geoid and Earth Observation, IAG Sympo-
sia 135, 47–54.

35
VII. Geodetic Activities of the National Land Survey of Finland
Marko Ollikainen
National Land Survey of Finland
The NLS consists of 12 District Survey Offices, five na-
tional operational units and the central administration. At
the beginning of 2010 two District Surveys Offices were
joined. The NLS has staff about 2000, of whom over
80% are employed in the District Survey Offices. The
NLS is a governmental agency subordinate to the Minis-
try of Agriculture and Forestry.
District Survey Offices provide expert assis-tance in
matters pertaining to land, real estate and maps. They
carry out land surveys and help to prepare deeds of sale
and provide assistance in applications for registration of
title of proper-ty. They also supply cadastral informa-
tion. The Offices gather and update data on the maps
covering their areas for the topographic data-base.
NLS’s national operational units are responsible for
development and research in their own areas, coordina-
tion of activities and nationwide services. The units are
located in Helsinki as well as the central administration.
The NLS benchmark register contains informa-tion
about control points and benchmarks. Most of these
horizontal control points and levelling benchmarks are
measured by the NLS. Some benchmarks measured by
other agencies are also included.
Within the NLS, control surveys are carried out by
South Finland District Survey Office. It is also responsi-
ble for maintaining the system of horizontal control
points and benchmarks. The unit also provides expert
and measurement ser-vices related to geodetic measure-
ments and coordinate and height systems. The densifica-
tion of the National networks was continued. The densi-
fication of the EUREF-FIN 2nd order network has been
completed.
Promotion of the new reference frame has been done.
NLS took EUREF-FIN coordinate system into use in
2010. NLS uses mainly plane coordinate systems
ETRS89-GKn and ETRS89-TM35FIN in its activities.
The densification of the levelling network and re-
levellings of some old levelling lines were continued.
Preparations for using the new height system of Finland
(N2000) were contin-ued. Adjustments of National Land
Survey’s 2nd order levelling lines into the new height
system have been finished. Adjustments of 3rd order
levelling lines are still on-going. Transformation be-
tween N2000 and N60 (former height system) has been
determined. Project to promote the new height system in
NLS’s activities and products has been started.

36
VIII. Gravity Operations of the Geological Survey of Finland
Seppo Elo
Geological Survey of Finland
Geological Survey of Finland (GTK) continued applying
gravity measurements to bedrock research, to explora-
tion of metallic ores and industrial mineral deposits, and
to environmental studies. In 2009 GTK contracted Bell
Geospace Ltd. to carry out trial AirFTG (Airborne Full
Tensor Gravity) surveys for two areas in southwestern
and eastern Finland. In standard regional gravity surveys
the average station interval was approximately 500 m.
Local gravity profiles were measured with a station
spacing of 20 m. Local gravity surveys were conducted
on regular grids of 20 m x 100 m. In addition to our own
measurements, the data of the Finnish Geodetic Institute
and the Fennoscandian 2.5 km x 2.5 km Bouguer anom-
aly grid were utilized. GTK contributed to and benefited
from a substantial demand in Finland for commercial
gravity work. Almost 60 % of the local measurements
and more than 10% of the regional surveys were com-
mercial or had external funding.
In the three-year period 2008-2010, the number of
gravity stations measured by GTK was as follows:
1. Regional gravity measurements:
11 473 stations
2. Airborne gravity gradiometry:
1412 line-km
3. Local measurements:
95 859 stations
At the end of 2010, the regional gravity database of
the Geological Survey of Finland contained 274 500
gravity stations, which cover an area of 77 000 sq. km.
An example of a regional gravity map is shown in Fig. 1.
GTK operates currently five Scintrex CG-5 gravime-
ters and one Worden gravimeter. In measuring the
heights and coordinates of the regional gravity stations,
GTK replaced GPS measurements based on a movable
base station by a system utilizing the permanent Finnish
network of GPS stations to provide VRS (Virtual Refer-
ence Station) positioning. In local surveys, heights of the
gravity stations are currently measured by means of VRS
GPS techniques or more commonly by means of chain
levels (hydrostatic leveling).
A quality system for gravity measurements has been
in use since 2002. Among other things, the calibration
and behavior of the gravimeters are checked on the Ma-
sala-Vihti calibration line maintained by the Finnish
Geodetic Institute.
Conversion of the old regional gravity data base to a
new format was started. During the conversion the data
is checked by new quality control algorithms and new
terrain corrections are calculated for each gravity station
using the 25 m x 25 m digital terrain model of the Na-
tional Land Survey. The new data base contains coordi-
nates in the old KKJ and the new EUREF-FIN systems
and gravity anomalies calculated according to the old
and new systems.
In bedrock research, targets included major fault and
shear zones, stratigraphic cross-sections, greenstone
belts, metamorphic zoning, mafic and granitic intrusions,
sedimentary basins and meteorite impact craters. Impor-
tant targets in exploration included ore-bearing mafic in-
trusions and bedrock structures in gold-prospecting ar-
eas. Mapping of mineralized geologic structures using
geophysical potential field datasets has become an im-
portant part of exploration projects. All the known oro-
genic gold and IOCG deposits in the CLGB show inti-
mate spatial correlation to shear zones of varying scale.
Processed gravity worms (basically horizontal gradient
of Bouguer anomaly) display striking spatial correlation
with the known orogenic gold and IOCG deposits. In
some cases the gold hosting shear zones are outlined by
gravity worms either completely or partly whereas the
presence of some major shear zones is indicated by trun-
cation of worms at the location of the shear zone (Lahti
et al. 2010). Gravity measurements provided important
additional information to seismic reflection soundings
such as obtained in HIRE project (e.g. Kukkonen et al.
2010). Moreover, results of a joint GPS, gravity and
electromagnetic study of permafrost and continental ice
in the Antarctica were published (Ruotoistenmäki and
Lehtimäki, 2008).
The gravity method maintained its position in esti-
mating overburden thickness mostly in conjunction with
assessing and protecting groundwater resources and
mapping contaminated soils (Elo, Pirttijärvi 2010; Valjus
2009). Altogether 1096 line-km of gravity profiles were
measured and interpreted in 42 target areas resulting in
34 reports. The GPS-gravity measurements at a waste
treatment center to obtain estimates for the subsidence
rate and density changes of landfills have been repeated
every year since 1999 for the Helsinki Region Environ-
mental Services Authority (formerly the Helsinki Metro-
politan Area Council).

37
Figure VIII-1. A new regional Bouguer anomaly map of the northern part of the Kittilä greenstone belt ©Geological
Survey of Finland.
As a major project, GTK ordered trial AirFTG (Air-
borne Full Tensor Gravity) surveys for two areas (Pori
and Hammaslahti) in southwestern and eastern Finland.
The purpose of the trial surveys was to assess the com-
petitiveness of airborne gravity surveys in terms of
prices, delivery times, resolution, accuracy and interpret-
ability in comparison to regional ground gravity meas-
urements with average station intervals of 400 meters to
1000 meters. Specifically, in Hammaslahti the aim was a
multidisciplinary study of the geological structure, geo-
logical evolution, ore potential and thickness of eskers,
and in Pori, the purpose was to estimate the thickness of
sediments, to continue the previous interpretation of the
bedrock structures into the marine environment and to
provide a link between geophysical studies on land and
marine seismic soundings. For the Pori area, altogether
198.15 km of lines were flown with a line separation of
1500 m and a tie line separation of 7500 m. For the
Hammaslahti area, altogether 1370.50 km of lines were
flown with a line separation of 1000 m for the whole
area and of 500 m for two sub-areas, and with tie line
separations of 5000 m and 2500 m.
Combining of airborne gravity gradient data with
ground gravity data was studied in co-operation with the
University of Oulu (Kallo, 2010; Pirttijärvi et al. 2009)
using the data mentioned above. Combined with the ir-
regularly sampled ground data, the more densely spaced
airborne data will enhance the spatial information of the
gravity field at the survey site. Airborne surveys can
quickly cover large areas and do not have to deal with
problems, such as swamps, rivers and lakes that hinder
ground observations. By combining the airborne data
with ground data, a derived Bouguer anomaly map can
be made. Two primary methods were used to combine
the data. The first method utilized Fourier transform and
frequency domain filtering of the vertical Tzz compo-
nent of the gravity tensor. The vertical component was
first integrated and the resulting pseudo field was con-
tinued downward to ground level. Then several methods
were tested to perform the actual data levelling. The
main sources of error are the interpolation of the sparse
ground data or residuals into regular grids and the
downward continuation of the integrated Tz field by
constant amount without taking the flight altitude and
ground topography into consideration. The second
method utilized equivalent two-layer models. An equiva-
lent two-layer density model was first created by invert-
ing together the irregularly sampled ground data and the
interpolated airborne tensor data. Then the derived
Bouguer data on a regular grid was computed by means
of the equivalent layer model. Unlike in the filtering
methods, original topography and flight altitude data
were taken into account. The use of other tensor compo-
nents was also possible. The best results were obtained
by taking into account the diagonal elements of the grav-
ity tensor. The biggest source of error is the interpolation

38
of the topographic data to compute the derived Bouguer
data. Because gradient data cannot portray the long
wavelength variations of the gravity field, ground meas-
urements are needed both inside and outside of the sur-
vey site to define the regional trend of the gravity field.
In the GeoSatakunta project (Elo and Pirttijärvi
2010), the Geological Survey of Finland has measured 2
832 new gravity stations in Satakunta and produced a set
of gravity maps based on 5 234 observations of the Fin-
nish Geodetic Institute, 30 279 observations of the Geo-
logical Survey of Finland and an airborne gravity survey
of 198 line-km. New methods to process and model the
overburden thickness and the effect of density variations
on regional stress in the bedrock were developed. The
thickness and contacts of overburden, sandstone, ra-
pakivi granites and diabase sills were modeled.
Sääksjärvi meteorite crater, intrusions, and bedrock
blocks delineated by shear and fracture zones are also
visible on the gravity anomaly maps. Interpreted from
the gravity anomaly of about -30 mGal, the rapakivi
granites extend to a depth of at least 8 km. They extend
beneath the sandstone formation from Kokemäki to the
coast of Pori and from the southwestern side of the sand-
stone to its northeastern side. Over the course of years,
the deep structure of the rapakivi granites has been mod-
eled in various ways. The fact is that no completely
unique solution is possible, as different assumptions lead
to different models. The common features of the various
models should be emphasized. Based on gravity model-
ing, the average thickness of the sandstone formation is 1
300 ± 300 m in the Pori region and decreases towards the
southeast. The outcropping or nearly outcropping dia-
base sills cover about 850 km2 of the map area and their
total thickness is in places at least 400 m. The Sääksjärvi
meteorite crater is 4 800 m in diameter and over 200 m
deep. The crater is surrounded by fractured bedrock with
a density clearly lower than that of the intact host rock.
As compared to the theoretical crater models, only the
lowermost part of the Sääksjärvi crater remains. Along
the northern contact of the sandstone formation there is a
bedrock valley filled with overburden, the thickness of
which is commonly 50 to 100 m. The maximum effect of
lateral density variations on the horizontal stress in the
uppermost crust in Satakunta is estimated to be 8.5 MPa
(maximum stress minus minimum stress). This is a sub-
stantial part of the estimated total regional stress in the
bedrock. The standard difference of the geoid observed
by the city of Pori and the geoid derived from the re-
gional gravity measurements is ±3.8 cm. The computa-
tional geoid can be utilized as such or used as a control
for other geoid determinations.
Publications:
Elo, S. 2009. Vuotuisen lämpötilan vaihtelun aiheuttama
avoimen kallionpinnan jaksoittainen vertikaaliliike (Cy-
clic vertical movement of exposed bedrock surface due
annual temperature variation). In: XXIV Geofysiikan
päivät Helsingissä 13.-14.5.2009. Helsinki: Geofysiikan
seura, p. 21.
http://www.geofysiikanseura.fi/pdf/GFP2009_kirja.pdf
Elo, S., 2009. "Airborne Gravity in Exploration, ex-
tended abstract". Fennoscandian Exploration and Mining
– FEM 2009, Pre-conference Short Course: Geophysics
for Exploration Geologists, 30th of November, 2009,
Rovaniemi, 17 pages.
Elo, S. and Pirttijärvi, M. 2010. Satakunnan painovoi-
matutkimukset [Electronic resource]. Summary: Gravity
investigations in Satakunta. In: Geotietoa Satakunnasta:
GeoPori-, GeoSatakunta- ja InnoGeo-projektien loppu-
raportti. Geologian tutkimuskeskus. Tutkimusraportti
183. Espoo Geologian tutkimuskeskus, 65-104.
http://arkisto.gtk.fi/tr/tr183/tr183_pages_65_ 104.pdf
Kallo, M. 2010. Aerogravimetristen tensoriaineistojen
yhdistäminen maanpinnan painovoimahavaintoihin.
Summary: Combining of airborne gravity gradient data
with ground gravity data. Pro gradu –tutkielma. Oulun
yliopisto, Fysiikan laitos, Geofysiikka. 93 sivua + 5
liitettä.
Kukkonen, I., Paananen, M., Elo, S., Paulamäki, S., La-
itinen, J., Heikkinen, P., Heinonen, S. & HIRE Working
Group, 2010. HIRE Seismic Reflection Survey in the
Olkiluoto Area, Working Report 2010-67, Posiva, 62 p.
Lahti, I., Nykänen, V., Niiranen, T. 2010. Gravity worms
in the prospecting of epigenetic gold deposits: example
from the northern Fennoscandian Shield [Electronic re-
source]. In: EGU General Assembly 2010, Vienna, Aus-
tria, 2-7 May 2010. Geophysical Research Abstracts 12,
1 p. http://meetingorganizer.copernicus.org/EGU2010/
EGU2010-9005.pdf
Pirttijärvi, M., Kallo, M. and Elo, S. 2009. Painovoima-
ja painovoiman gradienttiaineistojen 3D yhteistulkin-
nasta. In: Sovelletun geofysiikan XVII neuvottelupäivät,
3.- 4. 11. 2009, Espoo. Abstraktikokoelma. Vuorimie-
syhdistys. Sarja B 91. Espoo: Vuorimiesyhdistys, 95-96.
Ruotoistenmäki, T. 2008. Geophysical maps and petro-
physical data of Mozambique. In: GTK Consortium geo-
logical surveys in Mozambique 2002-2007, Geological
Survey of Finland, Special Paper 48. Espoo: Geological
Survey of Finland, 65-80.
http://arkisto.gtk.fi/sp/sp48/sp48_pages065_080.pdf
Ruotoistenmäki, T. and Lehtimäki, J. 2009. Geophysical
and geodetic studies of bedrock, permafrost and conti-
nental ice in Queen Maud Land, Antarctica. In: Proceed-
ings of the Finnish National IPY Conference. Geo-
physica 45 (1-2), 63-76.
Valjus, T. 2009. Geofysiikkaa taajamakohteissa. In:
Sovelletun geofysiikan XVII neuvottelupäivät, 3.-
4.11.2009, Espoo: abstraktikokoelma. Vuorimie-
syhdistys. Sarja B 91. Espoo: Vuorimiesyhdistys, 111-
114.

39
IX. Geodetic activities at the Department of Surveying, Geodesy Research Group, School
of Engineering, Aalto University
Martin Vermeer
Aalto University
The Geodesy Research Group is currently an informal
part of the Geomatics Research Group within the De-
partment of Surveying, School of Engineering, Aalto
University, http://maa.tkk.fi/en/gip/ (Formerly Helsinki
University of Technology).
At Aalto University, research, teaching, and serving
society are integrated. The Department of Surveying
(http://maa.tkk.fi/en/) offers both a Bachelor's and a
Master's level degree programme in Geomatics. Majors
in the latter are Geodesy, Geoinformatics, and Photo-
grammetry and Remote Sensing. There is a special Mas-
ter's programme aimed at foreign students offering
Geoinformation Technology. Also post-graduate studies
are on offer.
Publications:
Vermeer Martin (2008). Temperature and water vapour
profiling by carrier phase GNSS observables on board a
radiosonde. Geophysica 44, 1-2, pp. 15-29.
http://www.geophysica.fi/pdf/geophysica_2008_44_1-
2_015_vermeer.pdf
Vermeer Martin and Rahmstorf, S. (2009). Global sea
level linked to global temperature. Proceedings Nat.
Acad. Sci.
http://www.pnas.org/content/early/2009/12/04/09077651
06.full.pdf.
Kollo Karin and Vermeer, M. (2010). Lithospheric
Thickness Recovery from Horizontal and Vertical Land
Uplift Rates. Journal of Geodynamics 50(1):32-37
http://dx.doi.org/10.1016/j.jog.2009.11.006.
Kemp, Andrew C., Benjamin P. Horton, Jeffrey P. Don-
nelly, Michael E. Mann, Martin Vermeer and Stefan
Rahmstorf (2011). Climate related sea-level variations
over the past two millennia. Proceedings Nat. Acad. Sci.,
in press.