geog183: cartographic design and geovisualization …kclarke/geography183/lecture03.pdf · geog183:...
TRANSCRIPT
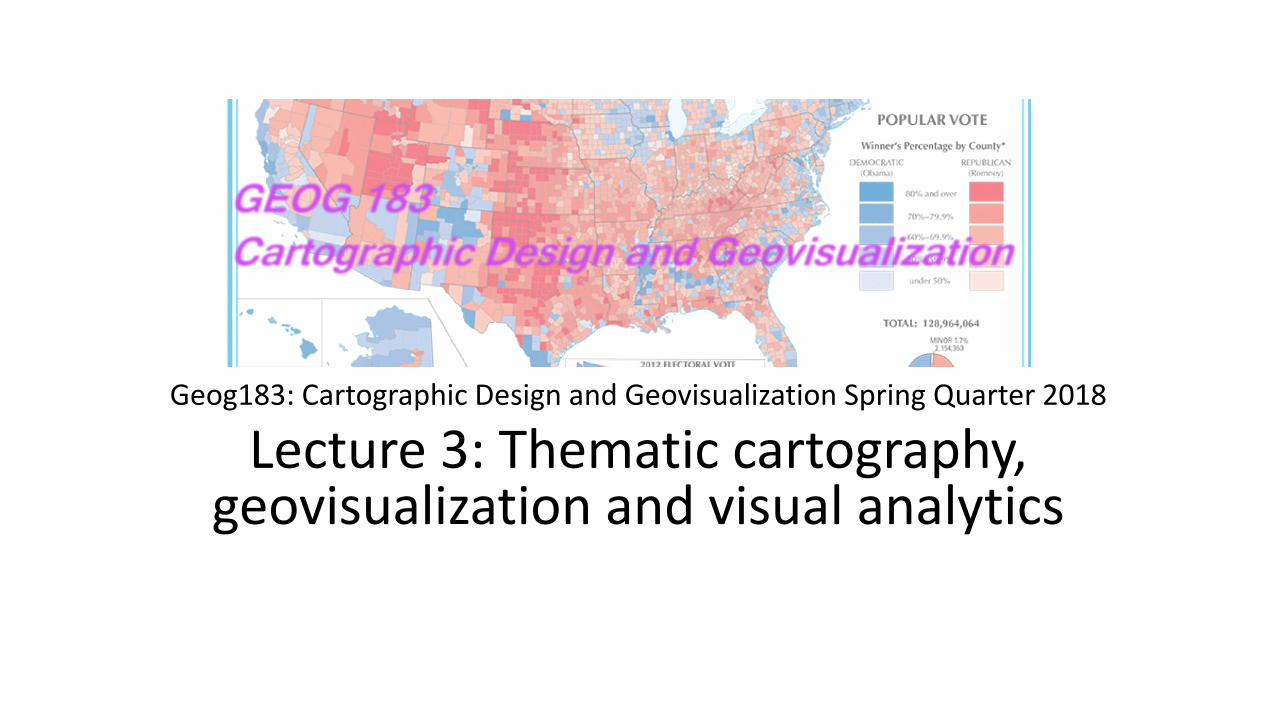
Geog183: Cartographic Design and Geovisualization Spring Quarter 2018
Lecture 3: Thematic cartography, geovisualization and visual analytics
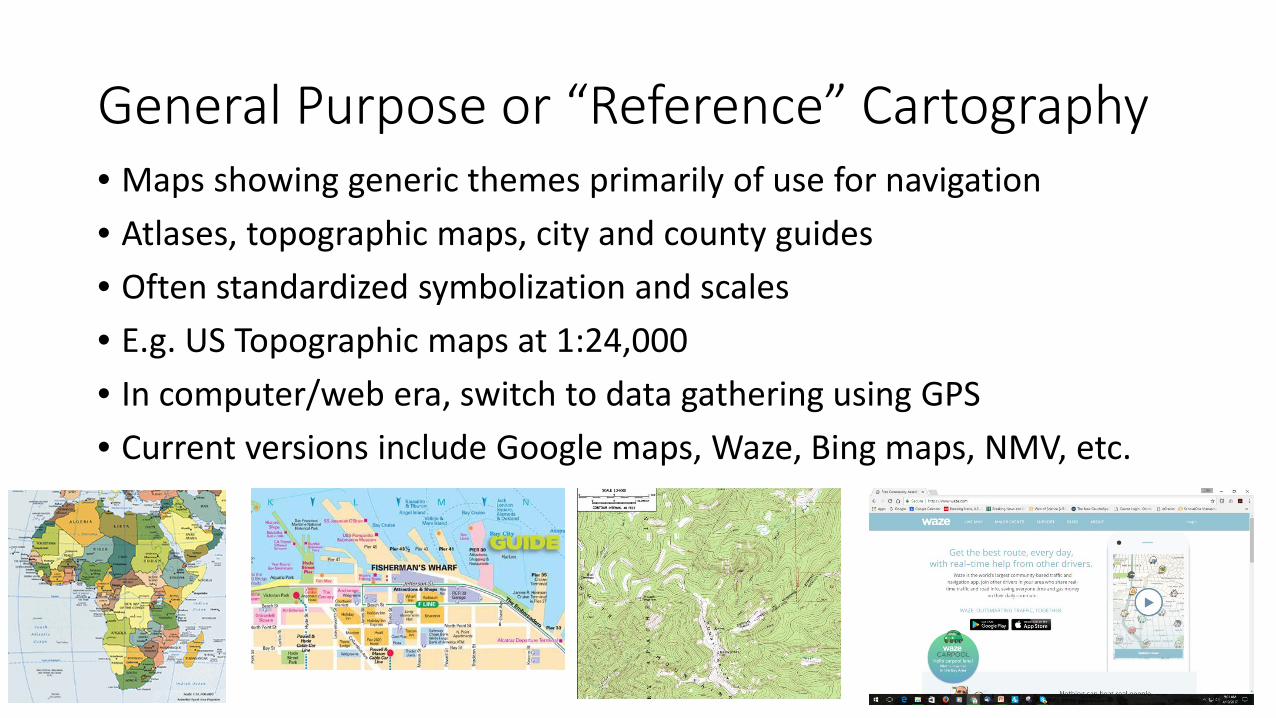
General Purpose or “Reference” Cartography • Maps showing generic themes primarily of use for navigation • Atlases, topographic maps, city and county guides • Often standardized symbolization and scales • E.g. US Topographic maps at 1:24,000 • In computer/web era, switch to data gathering using GPS • Current versions include Google maps, Waze, Bing maps, NMV, etc.
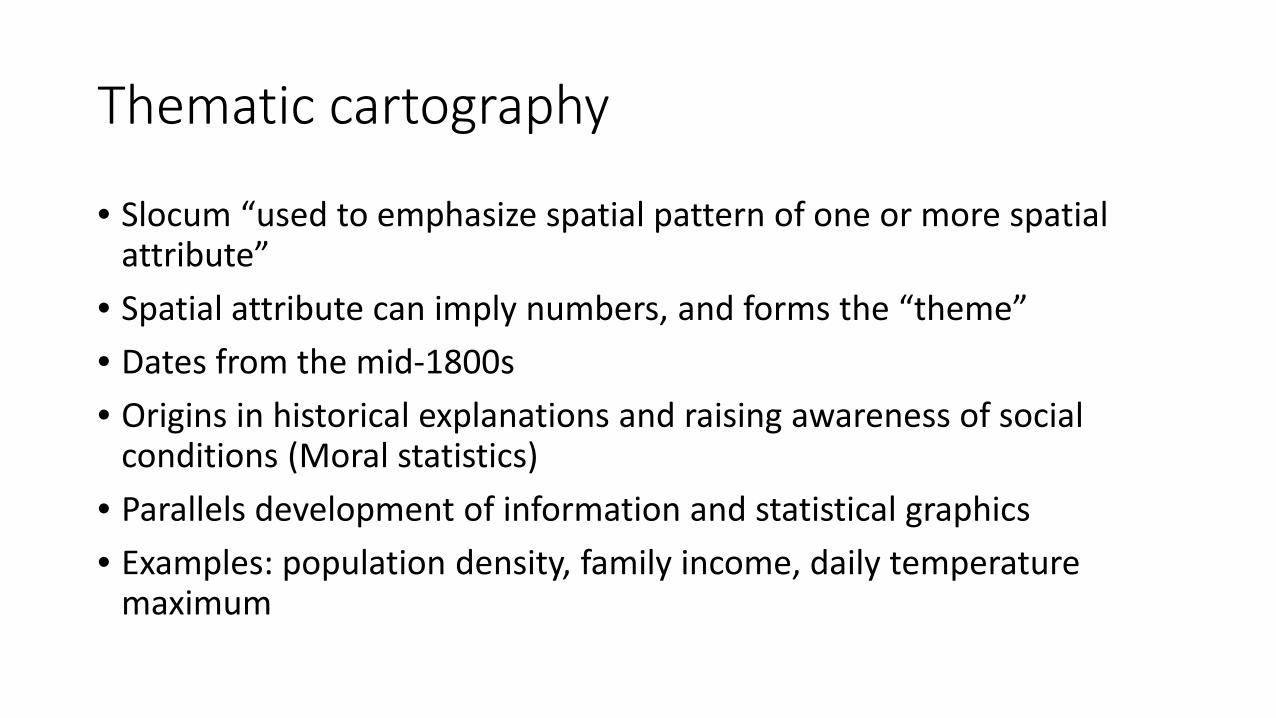
Thematic cartography
• Slocum “used to emphasize spatial pattern of one or more spatial attribute”
• Spatial attribute can imply numbers, and forms the “theme” • Dates from the mid-1800s • Origins in historical explanations and raising awareness of social
conditions (Moral statistics) • Parallels development of information and statistical graphics • Examples: population density, family income, daily temperature
maximum
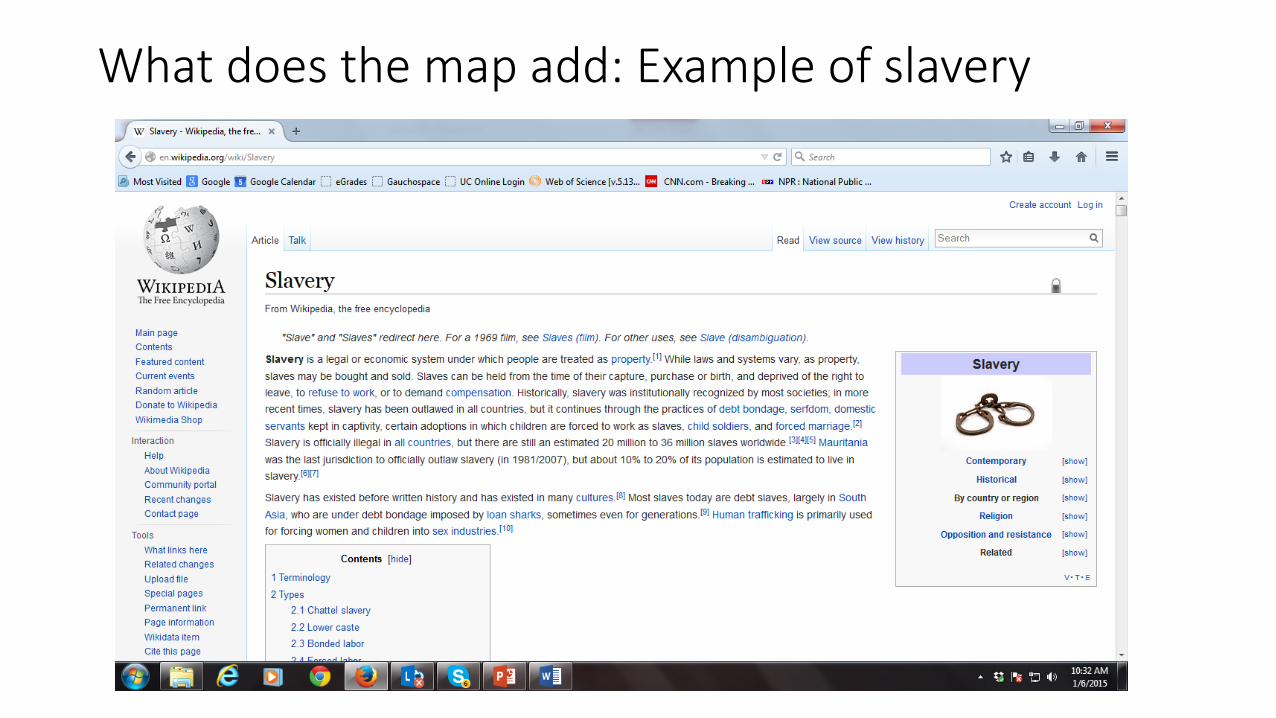
What does the map add: Example of slavery
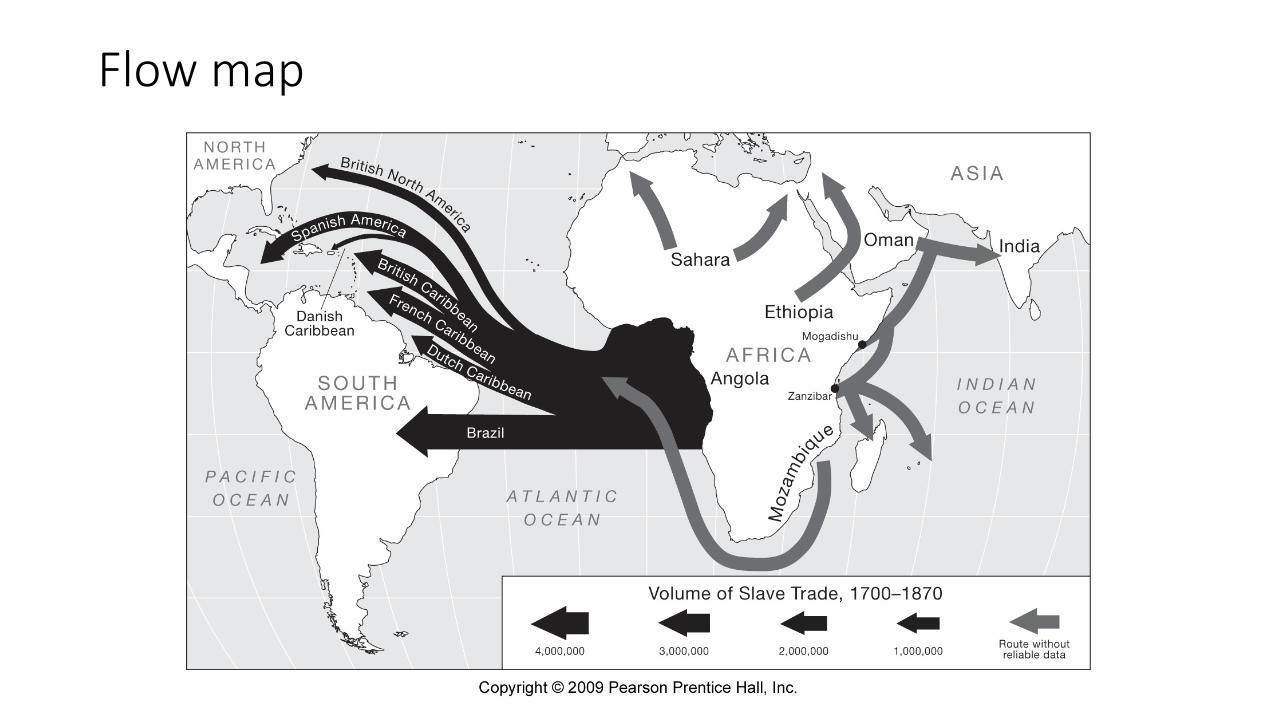
Flow map
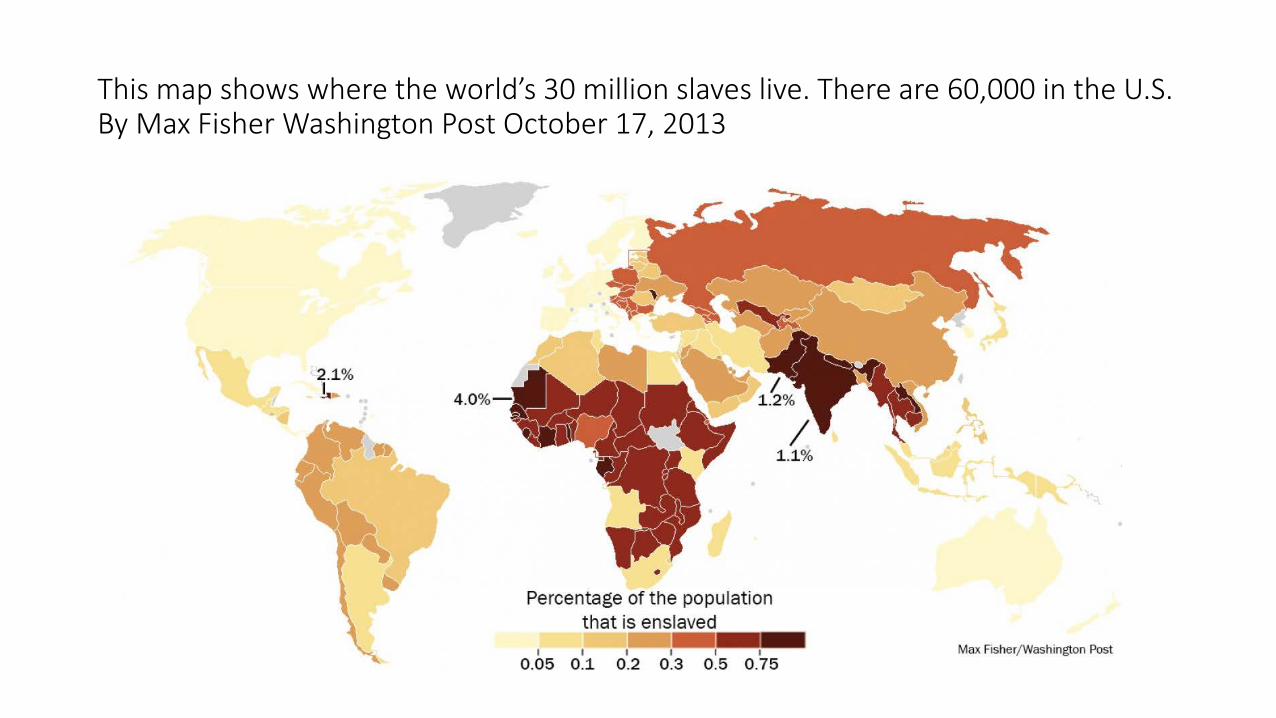
This map shows where the world’s 30 million slaves live. There are 60,000 in the U.S. By Max Fisher Washington Post October 17, 2013
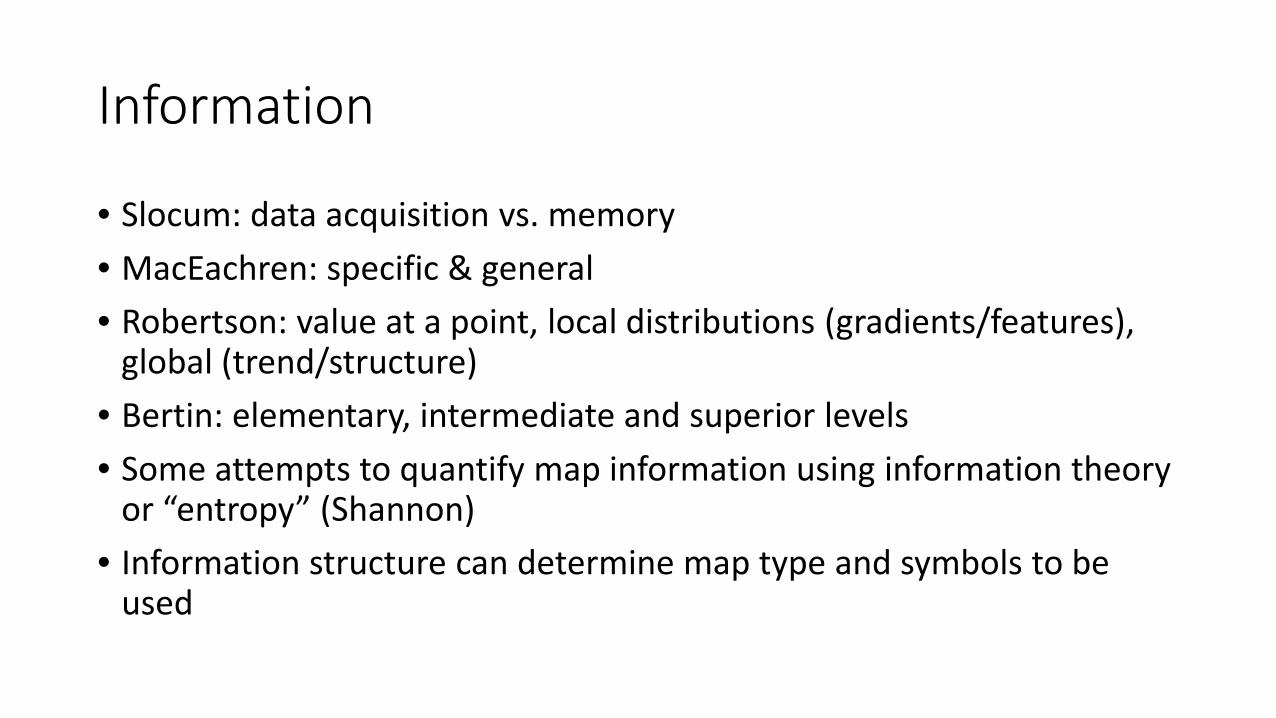
Information
• Slocum: data acquisition vs. memory • MacEachren: specific & general • Robertson: value at a point, local distributions (gradients/features),
global (trend/structure) • Bertin: elementary, intermediate and superior levels • Some attempts to quantify map information using information theory
or “entropy” (Shannon) • Information structure can determine map type and symbols to be
used
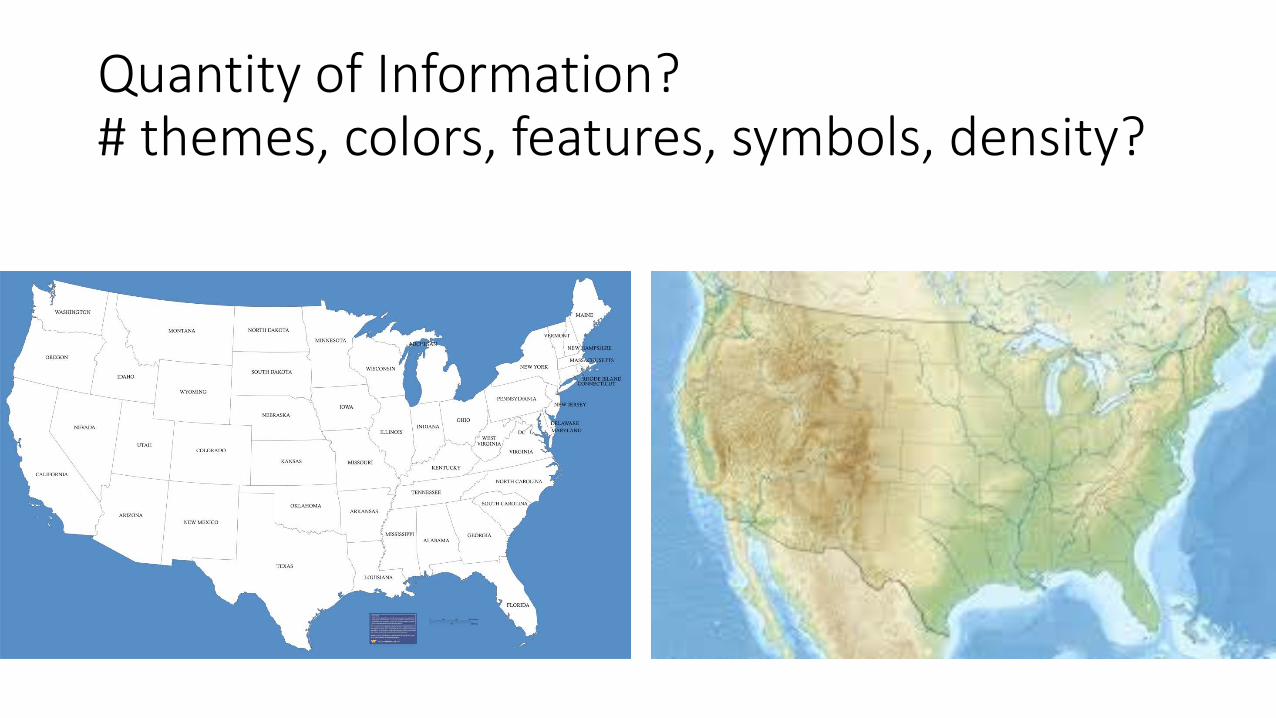
Quantity of Information? # themes, colors, features, symbols, density?

The Mapping Process
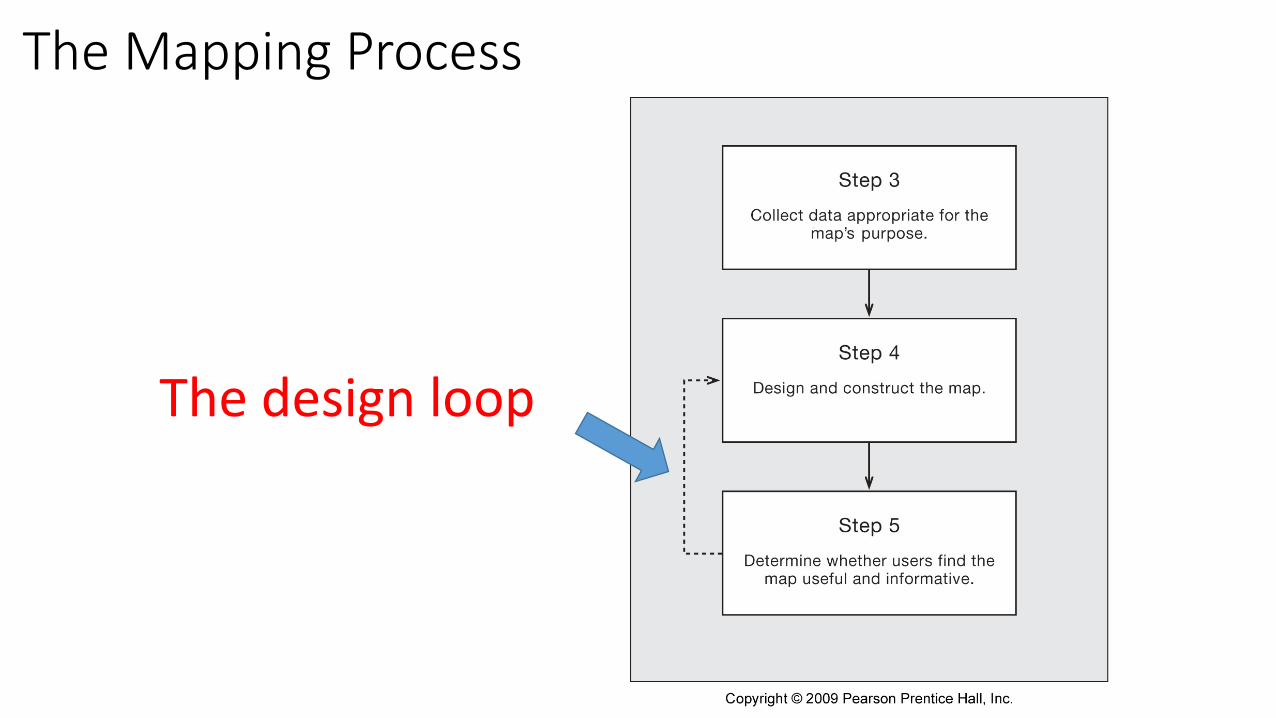
The Mapping Process
The design loop
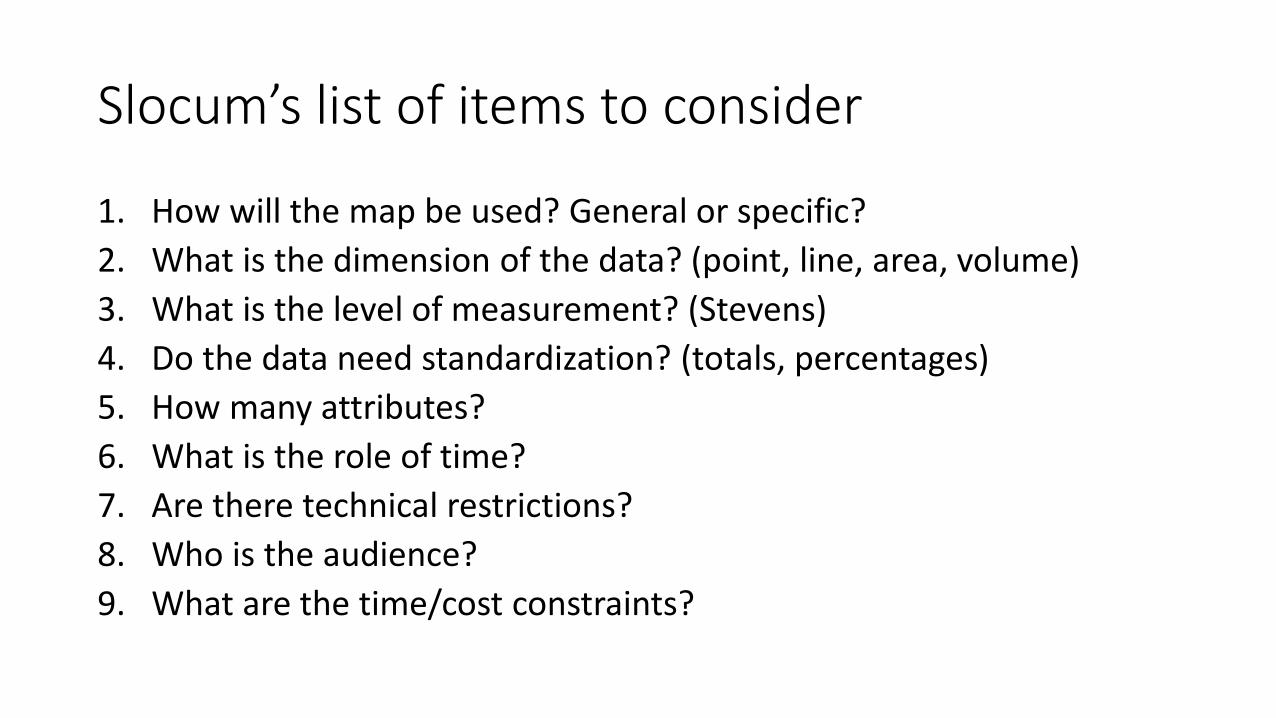
Slocum’s list of items to consider
1. How will the map be used? General or specific? 2. What is the dimension of the data? (point, line, area, volume) 3. What is the level of measurement? (Stevens) 4. Do the data need standardization? (totals, percentages) 5. How many attributes? 6. What is the role of time? 7. Are there technical restrictions? 8. Who is the audience? 9. What are the time/cost constraints?
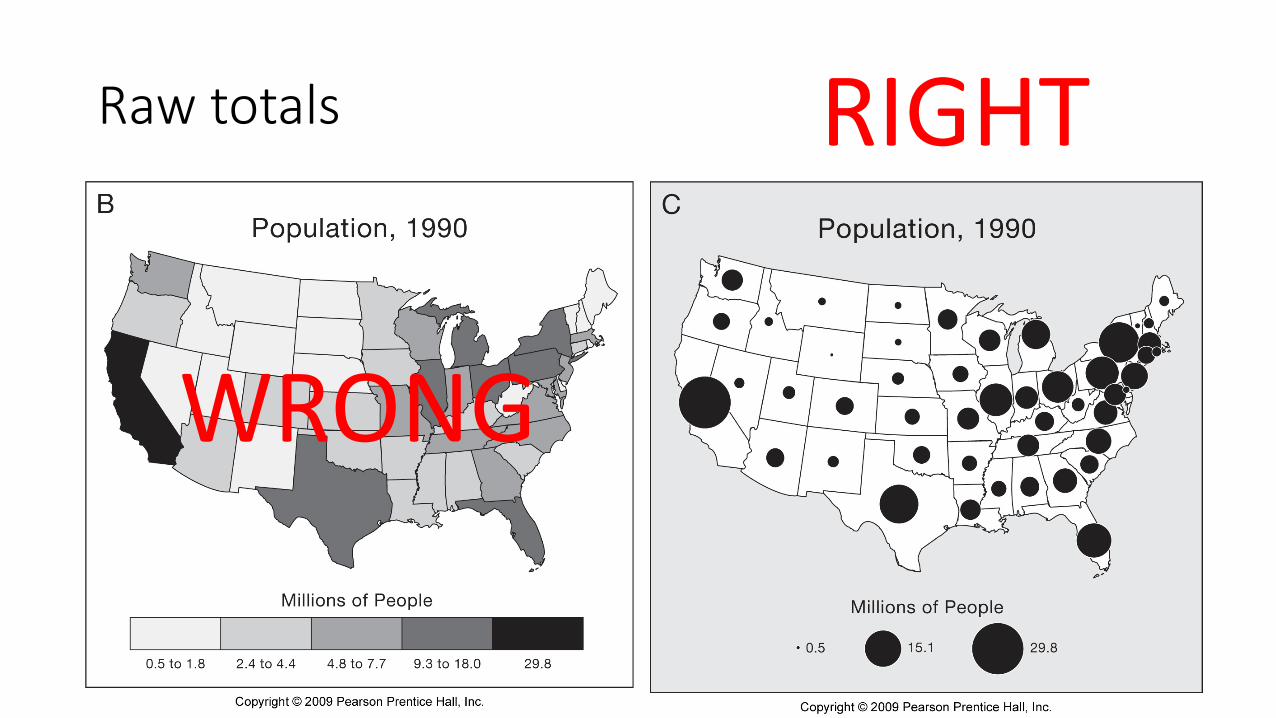
Raw totals
WRONG
RIGHT
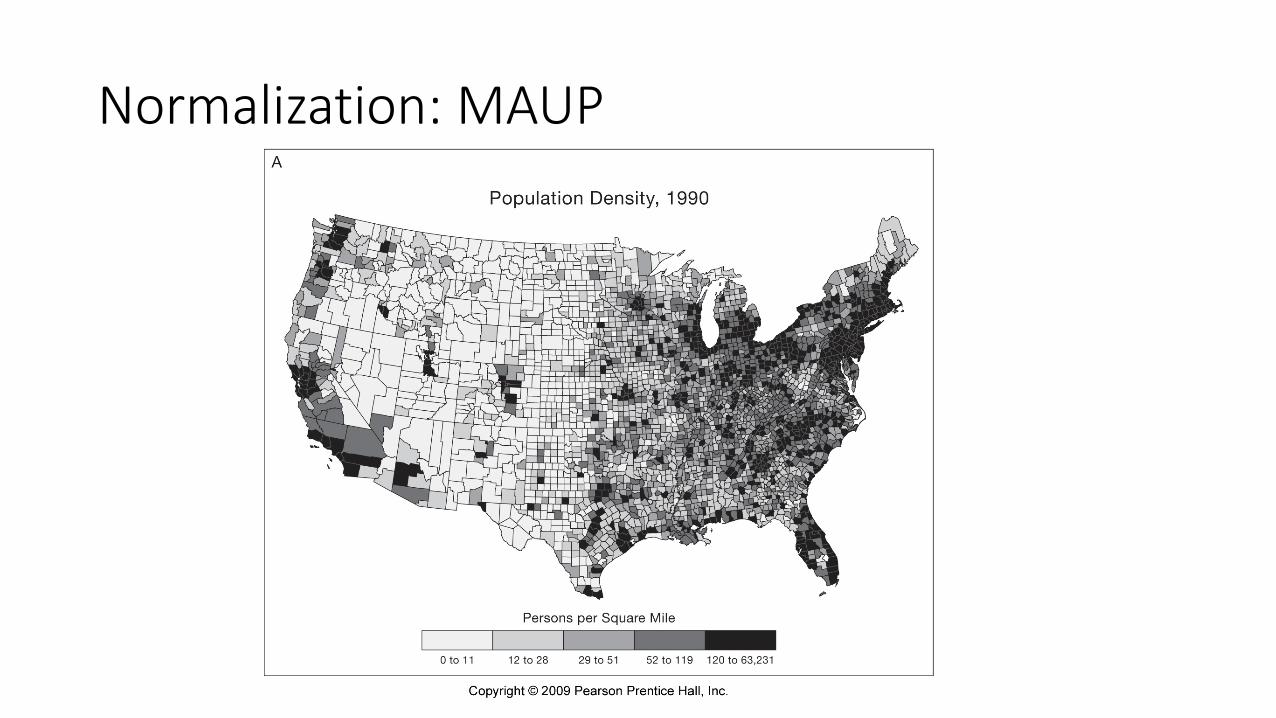
Normalization: MAUP
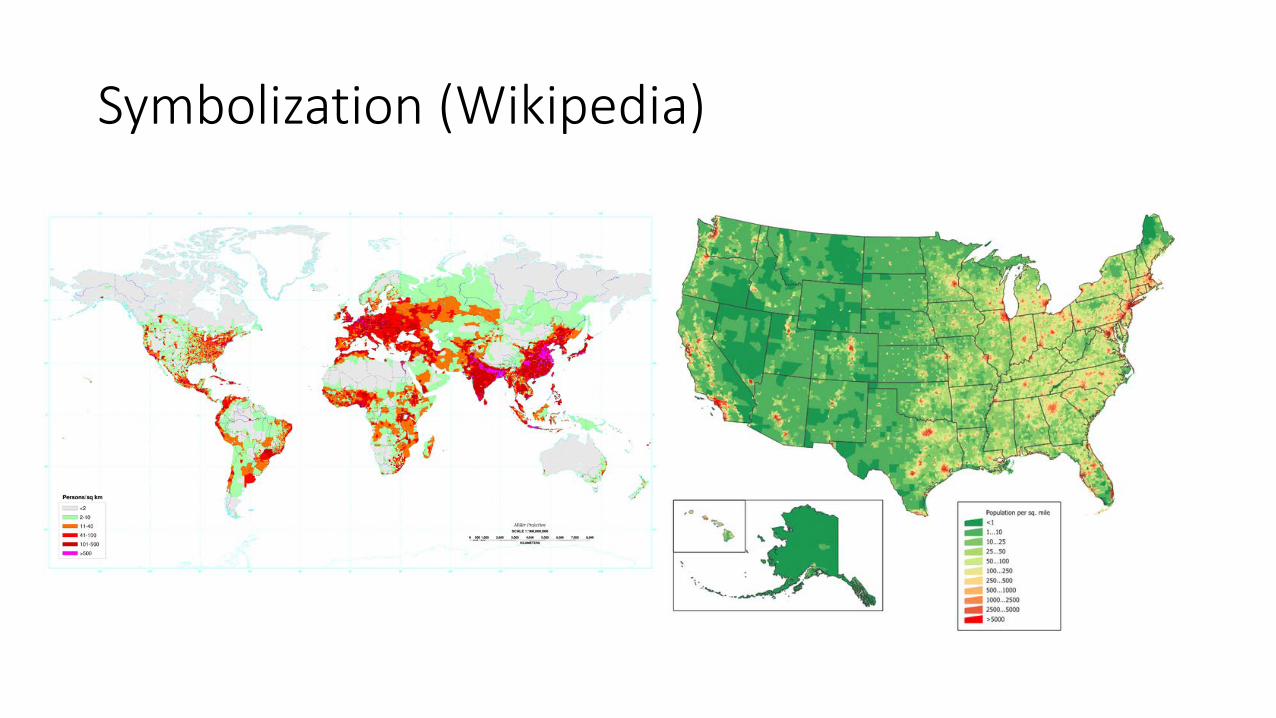
Symbolization (Wikipedia)
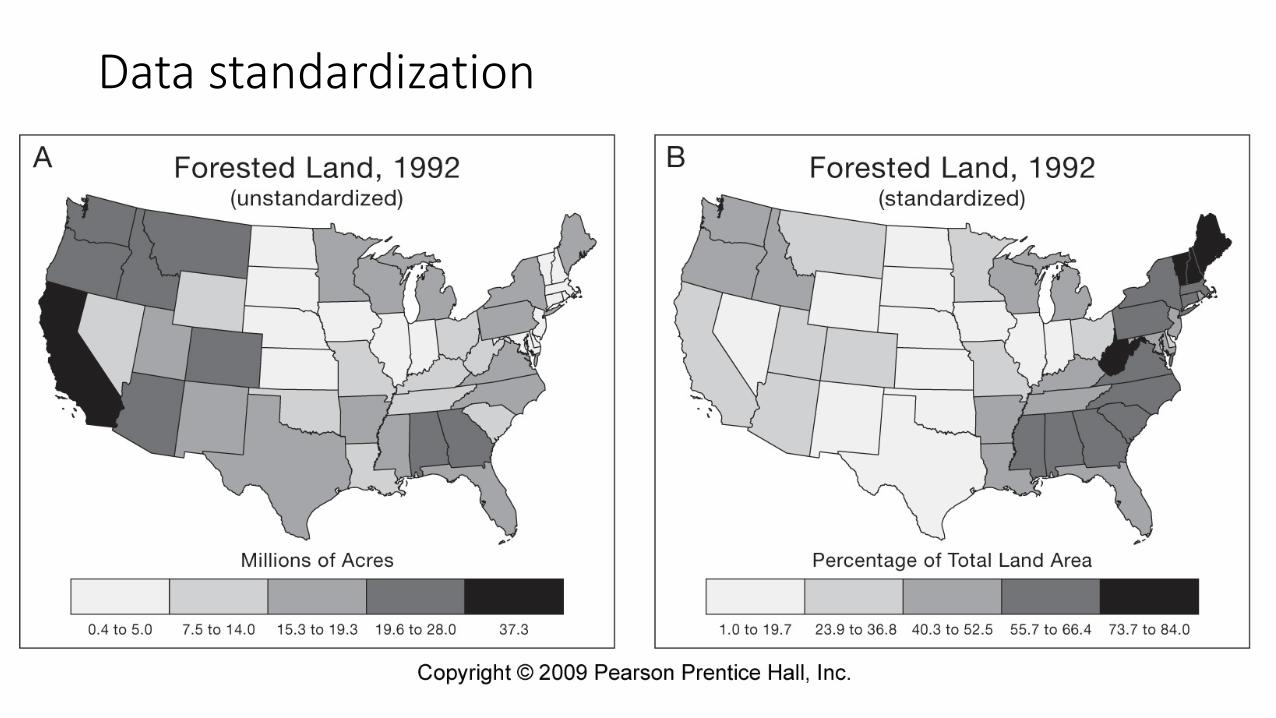
Data standardization
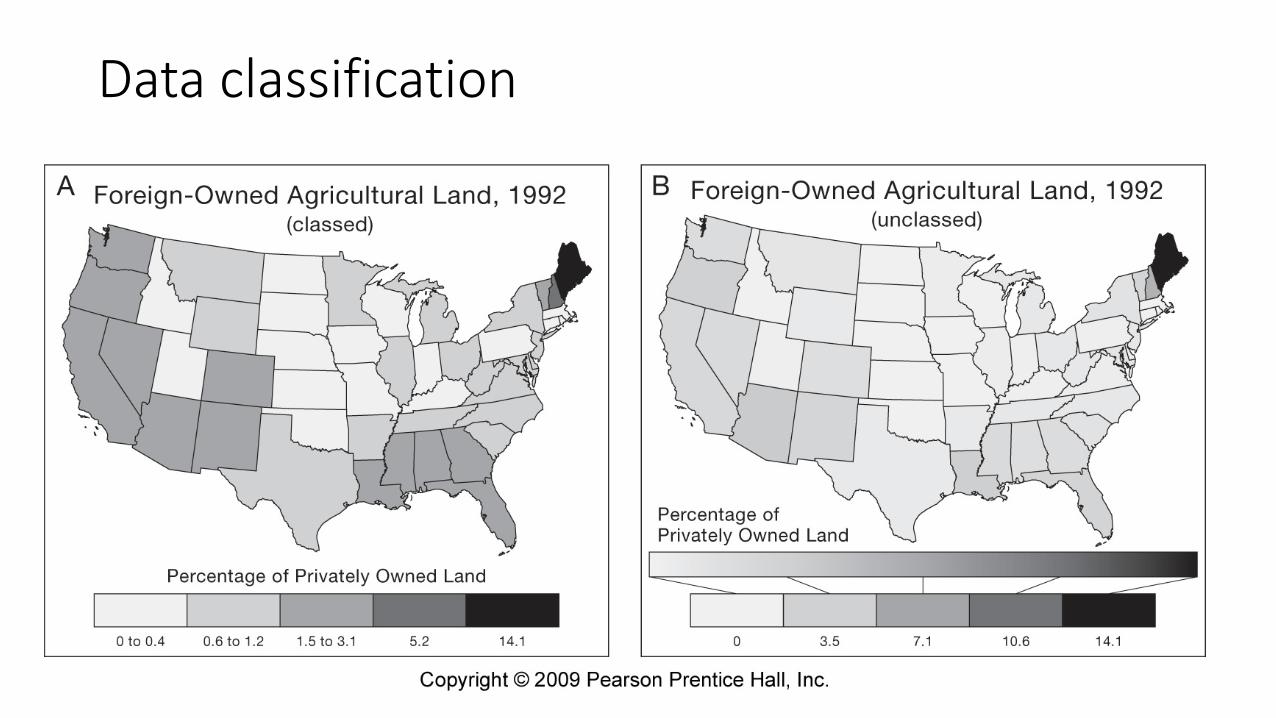
Data classification
Technology and cartography
• Expert systems for design decisions • Innovation in methods • Animation: time • Rise of data exploration • Big data • Multimedia and hypermedia • Electronic Atlas, data clearinghouse, online mapping tools • Virtual environments, virtual and augmented reality • Spatialization
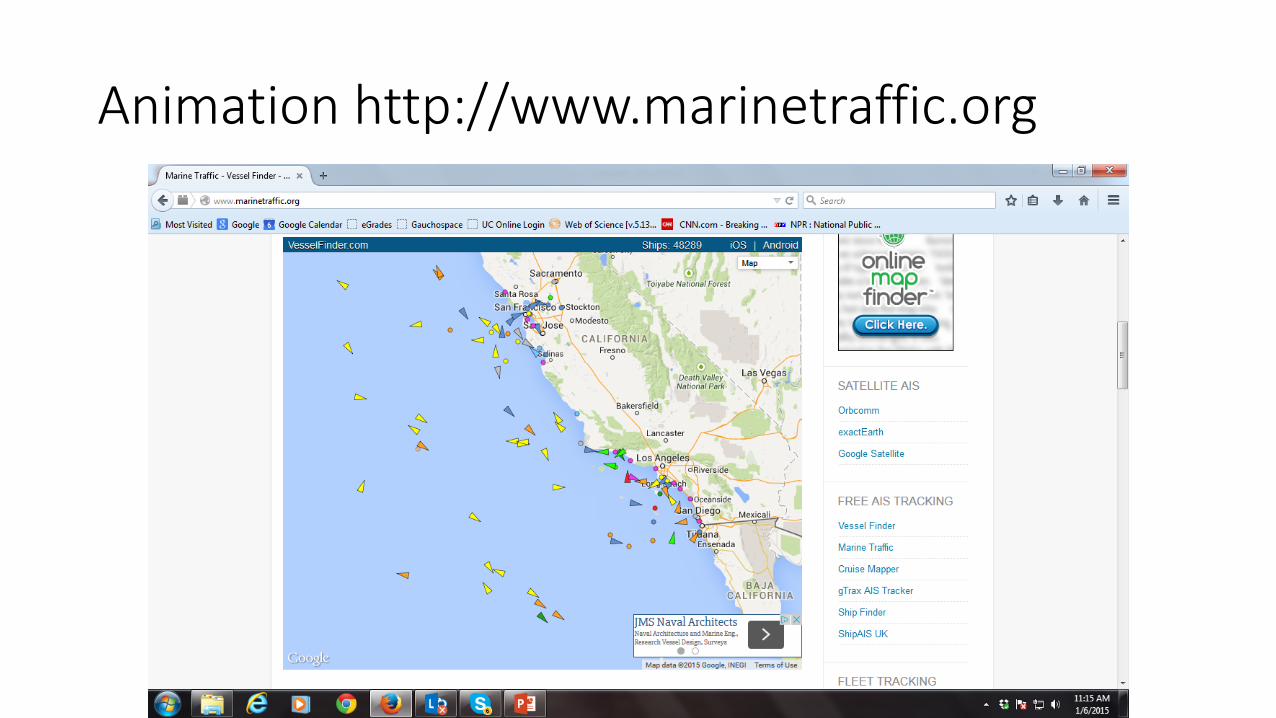
Animation http://www.marinetraffic.org
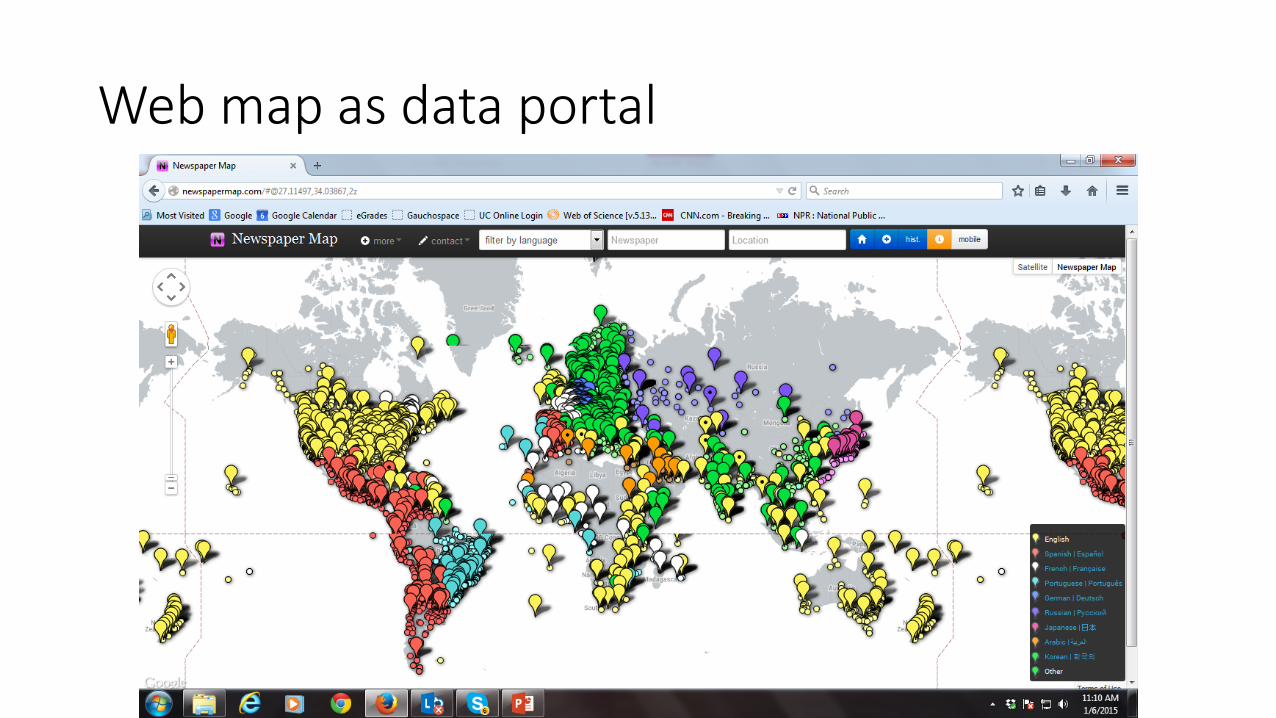
Web map as data portal
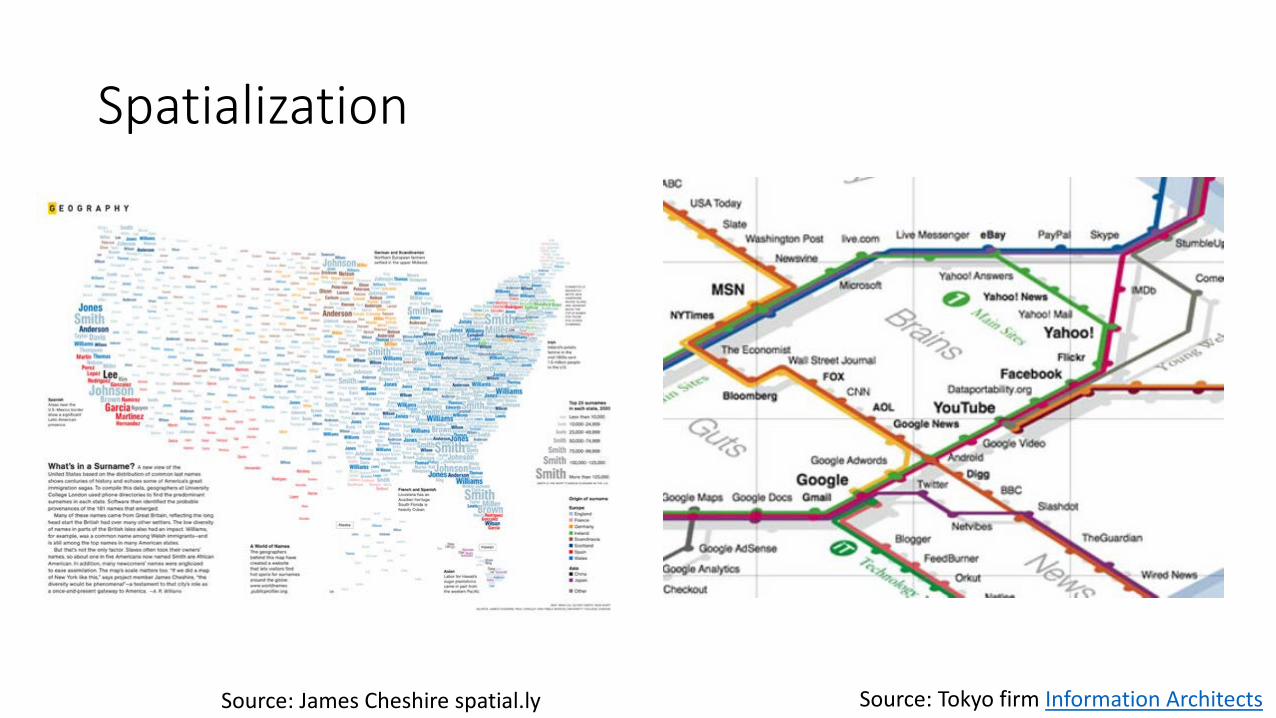
Spatialization
Source: Tokyo firm Information Architects Source: James Cheshire spatial.ly
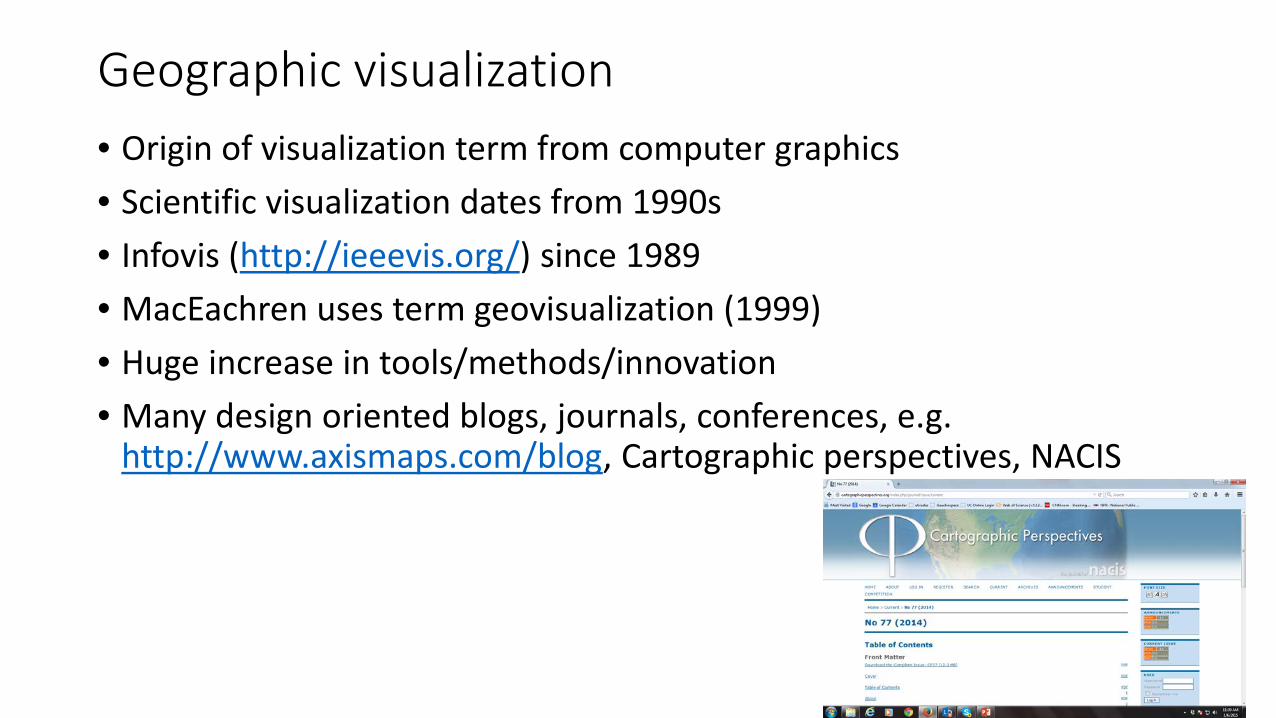
Geographic visualization • Origin of visualization term from computer graphics • Scientific visualization dates from 1990s • Infovis (http://ieeevis.org/) since 1989 • MacEachren uses term geovisualization (1999) • Huge increase in tools/methods/innovation • Many design oriented blogs, journals, conferences, e.g.
http://www.axismaps.com/blog, Cartographic perspectives, NACIS
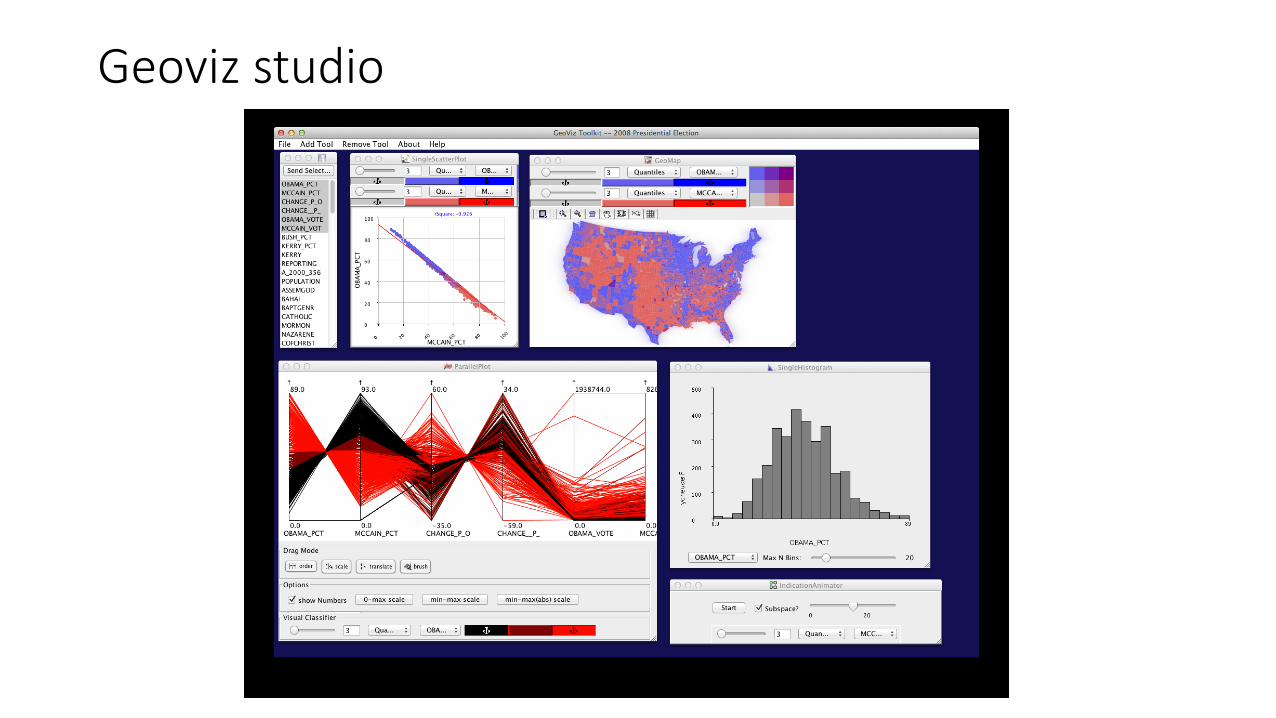
Geoviz studio
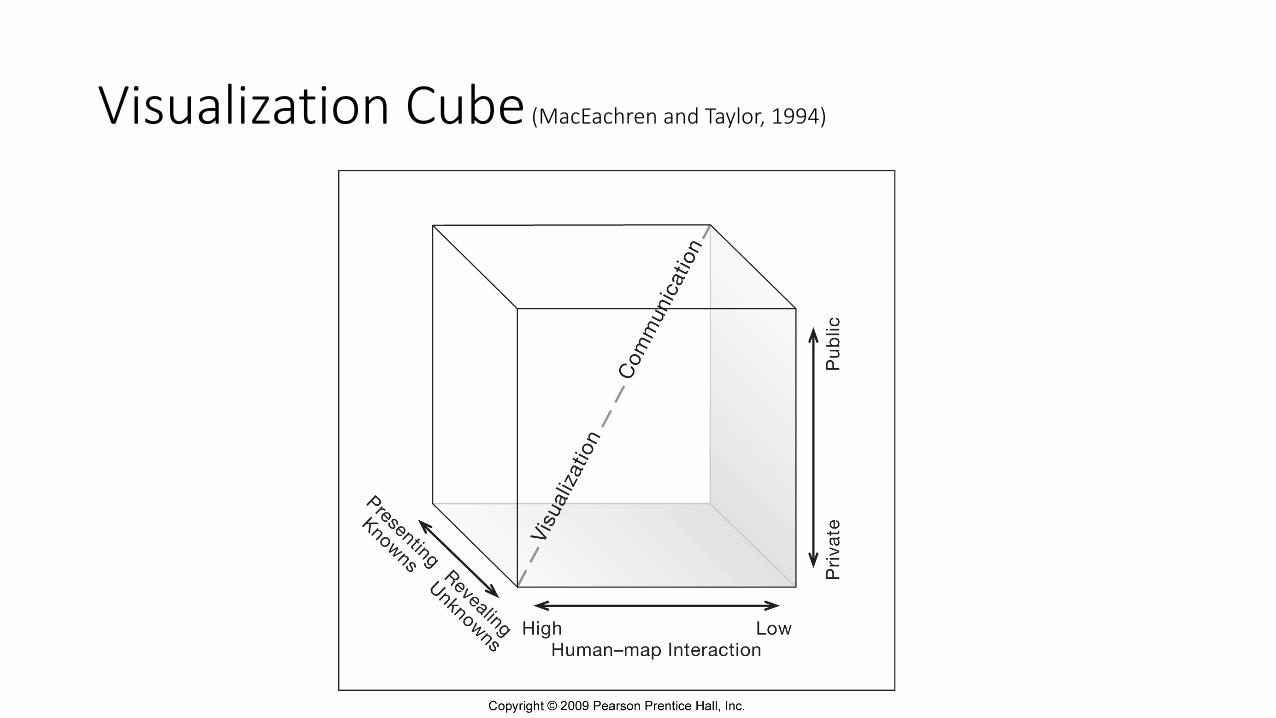
Visualization Cube (MacEachren and Taylor, 1994)
New methods
• Huge surge in innovative software • New methods, interaction, social media etc. • Able to handle very large data sets and real time • Map and web become synonymous, e.g. Googlemaps • Fusion of measurement methods, sensors, imagery into mapping • Positioning revolution leads to LBS • Emergence of the mash-up • Rise of open source, scripting, distributed processing
• http://vita.itn.liu.se/gav/gav/1.174303/GAV-Demo.png • http://www.natural-environment.com/images/blog/space_junk_2.jpg • http://kottkegae.appspot.com/images/taxi-flow-nyc.jpg • http://ajperez.net/Images/InfoViz_small2.gif • http://2.bp.blogspot.com/_InzW19CnouI/SaMDNpGClZI/AAAAAAAAAA8/3DGaPvuW7-Q/s1600-h/GriffeyWordle.png • http://www.perceptualedge.com/blog/wp-content/uploads/2009/01/horizon-graph-large.jpg
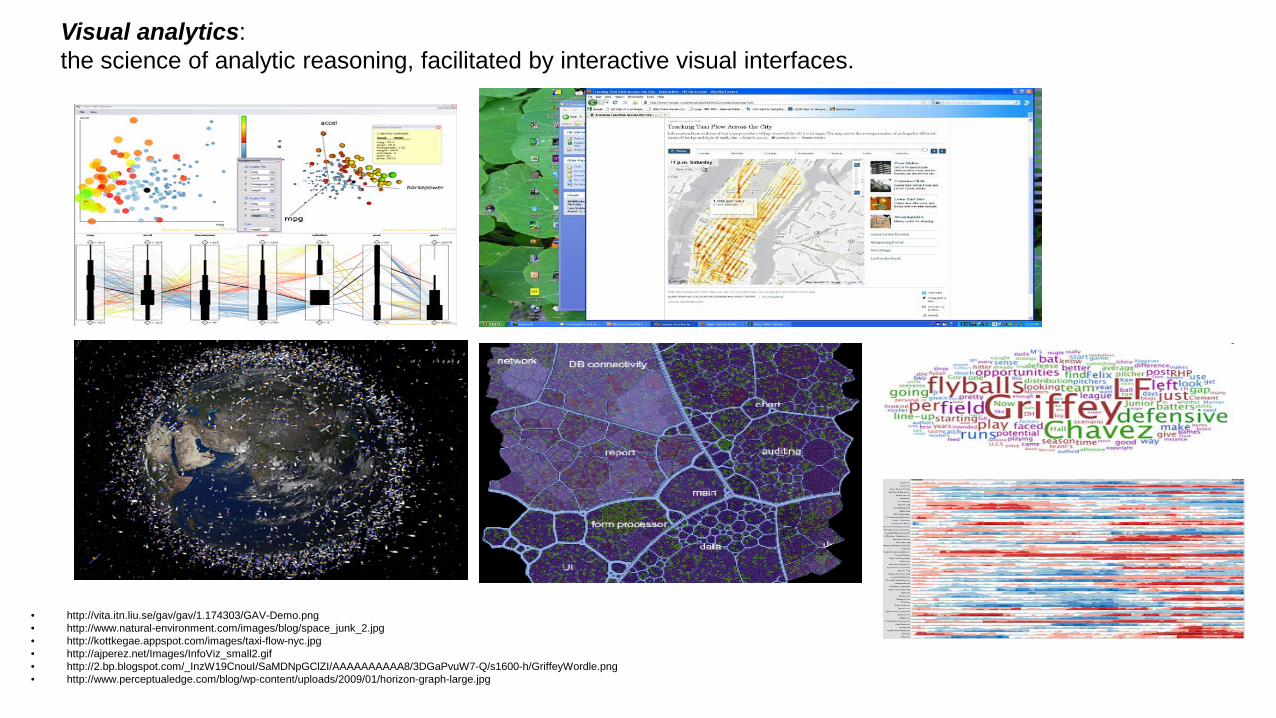
Visual analytics: the science of analytic reasoning, facilitated by interactive visual interfaces.
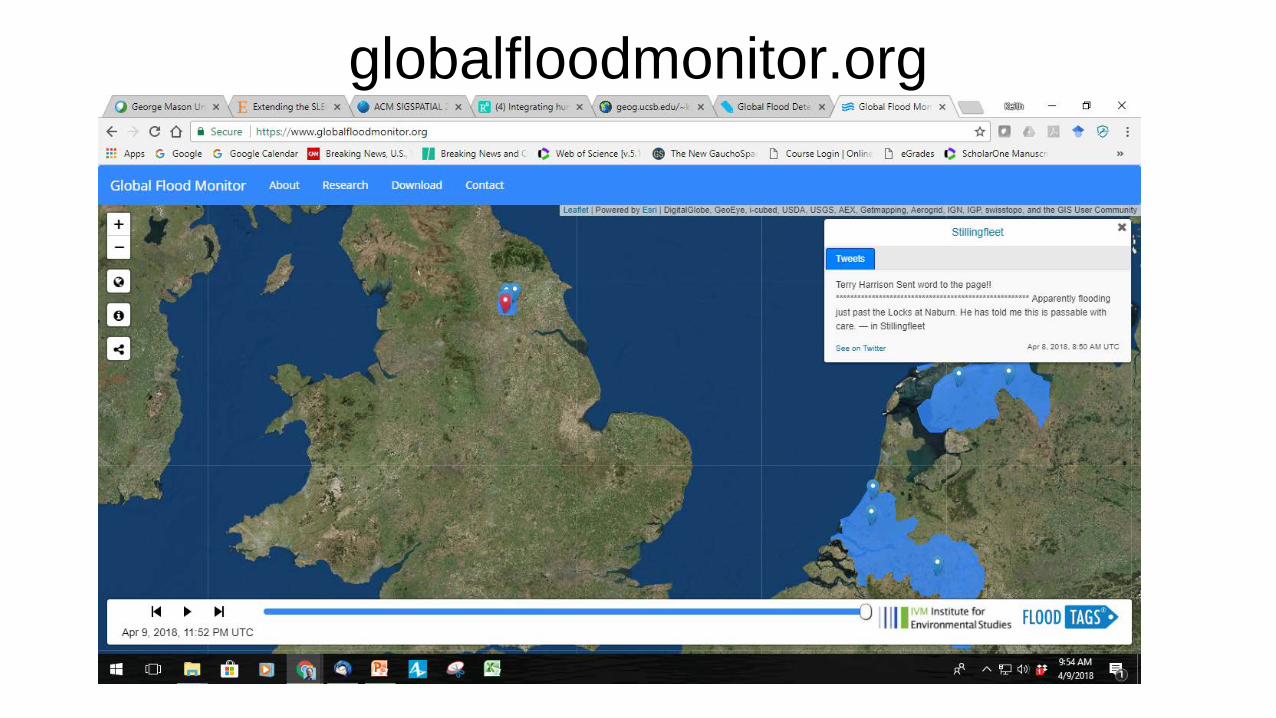
globalfloodmonitor.org
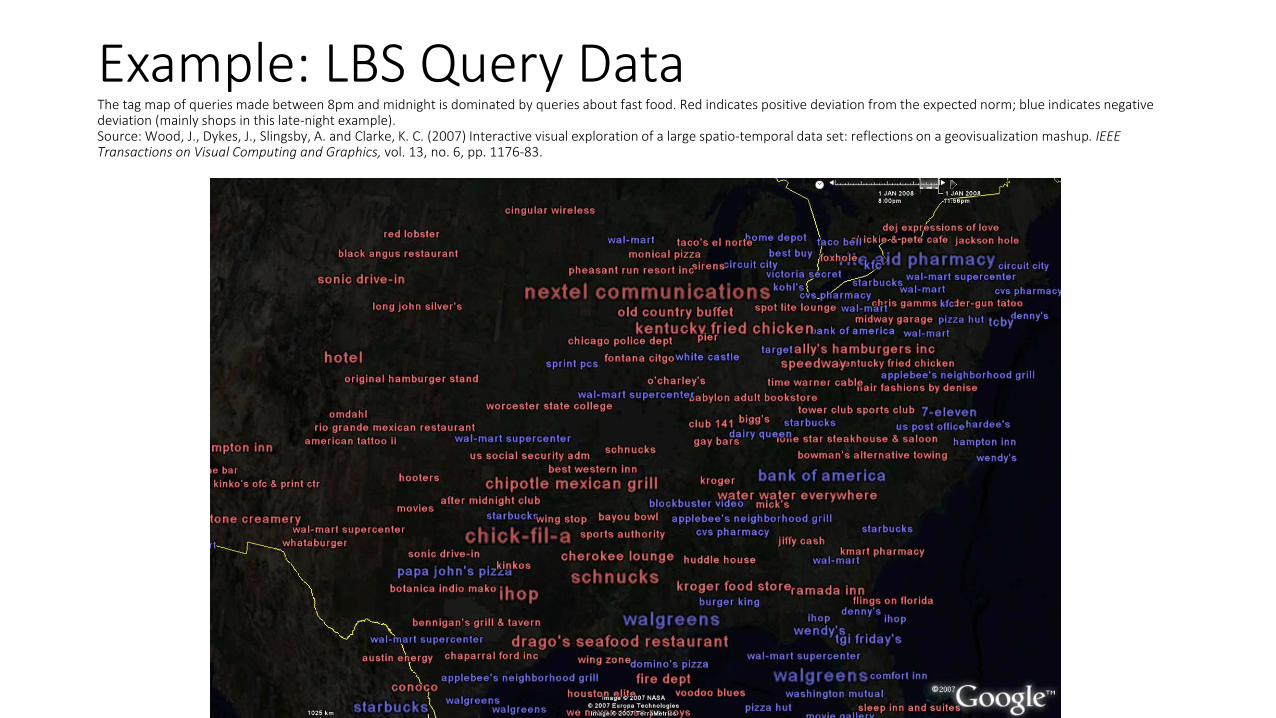
Example: LBS Query Data The tag map of queries made between 8pm and midnight is dominated by queries about fast food. Red indicates positive deviation from the expected norm; blue indicates negative deviation (mainly shops in this late-night example). Source: Wood, J., Dykes, J., Slingsby, A. and Clarke, K. C. (2007) Interactive visual exploration of a large spatio-temporal data set: reflections on a geovisualization mashup. IEEE Transactions on Visual Computing and Graphics, vol. 13, no. 6, pp. 1176-83.
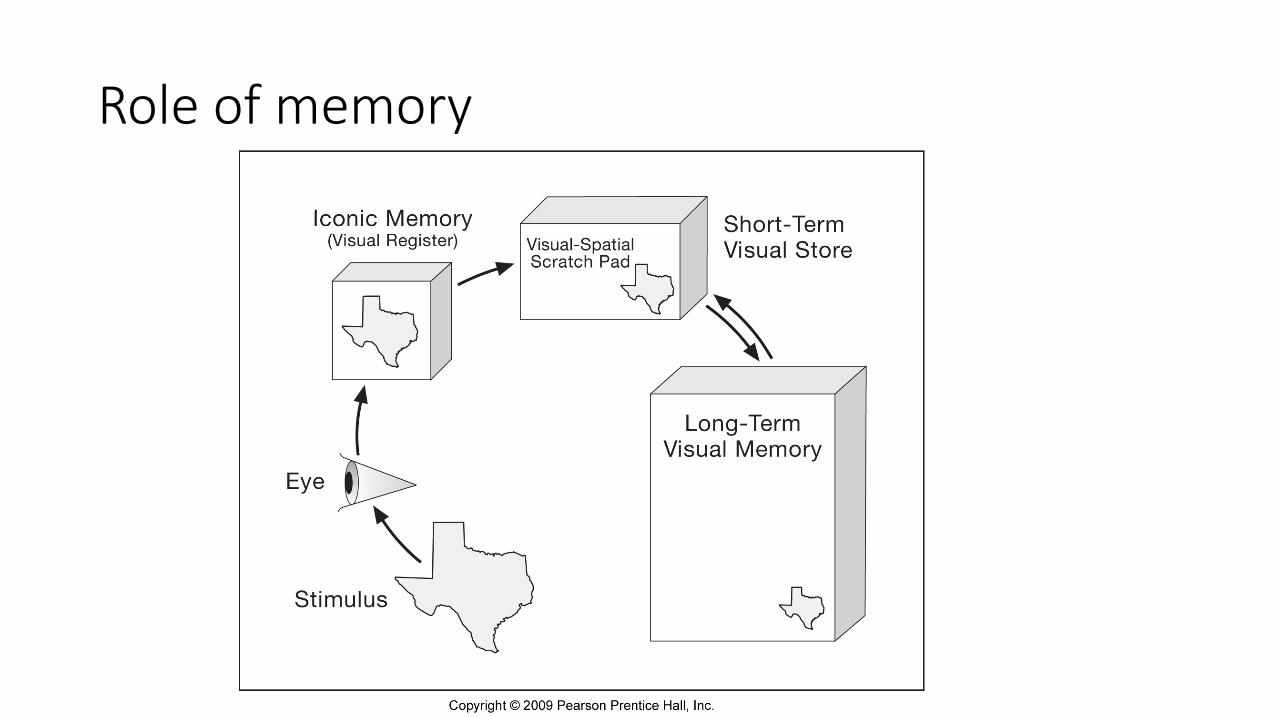
Role of memory
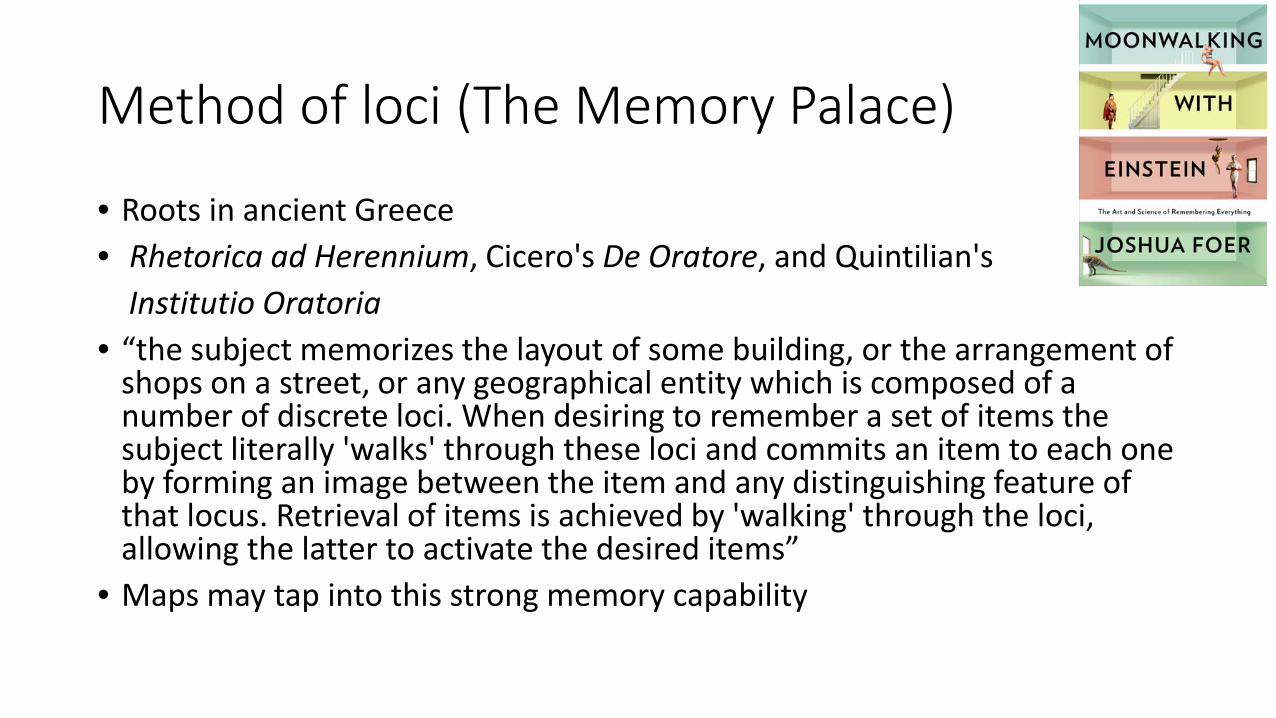
Method of loci (The Memory Palace)
• Roots in ancient Greece • Rhetorica ad Herennium, Cicero's De Oratore, and Quintilian's Institutio Oratoria • “the subject memorizes the layout of some building, or the arrangement of
shops on a street, or any geographical entity which is composed of a number of discrete loci. When desiring to remember a set of items the subject literally 'walks' through these loci and commits an item to each one by forming an image between the item and any distinguishing feature of that locus. Retrieval of items is achieved by 'walking' through the loci, allowing the latter to activate the desired items”
• Maps may tap into this strong memory capability
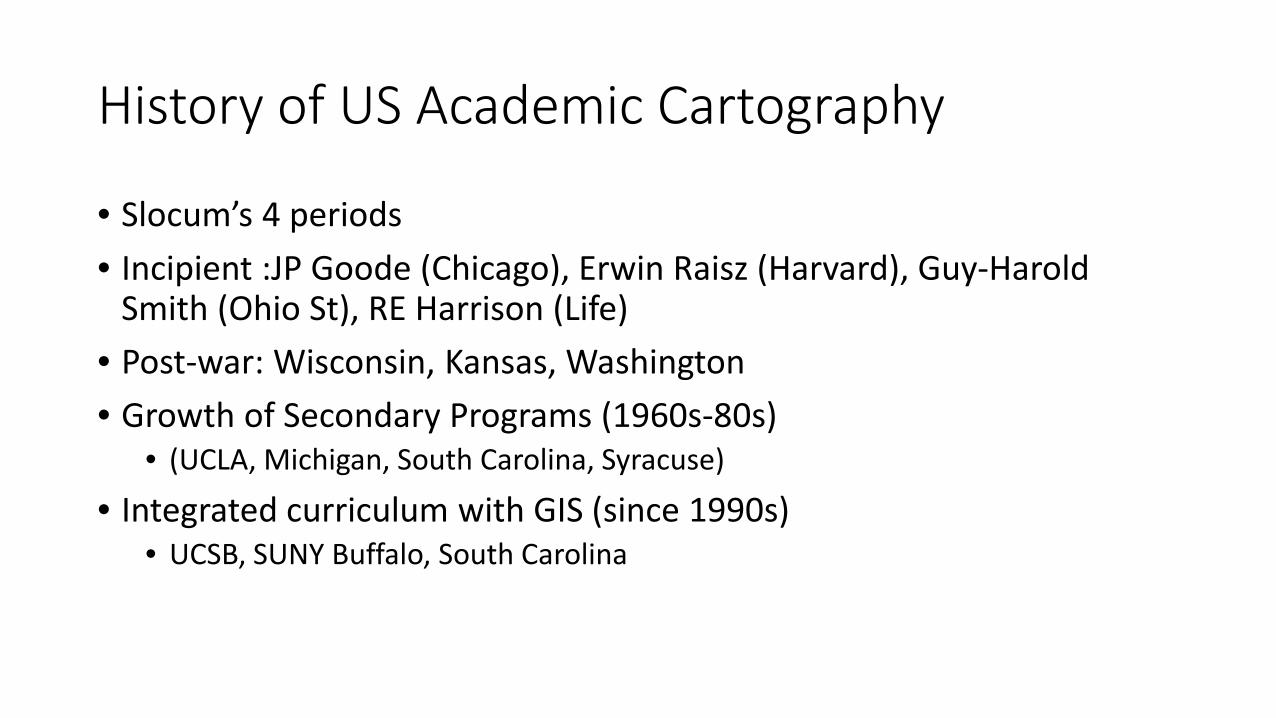
History of US Academic Cartography
• Slocum’s 4 periods • Incipient :JP Goode (Chicago), Erwin Raisz (Harvard), Guy-Harold
Smith (Ohio St), RE Harrison (Life) • Post-war: Wisconsin, Kansas, Washington • Growth of Secondary Programs (1960s-80s)
• (UCLA, Michigan, South Carolina, Syracuse)
• Integrated curriculum with GIS (since 1990s) • UCSB, SUNY Buffalo, South Carolina
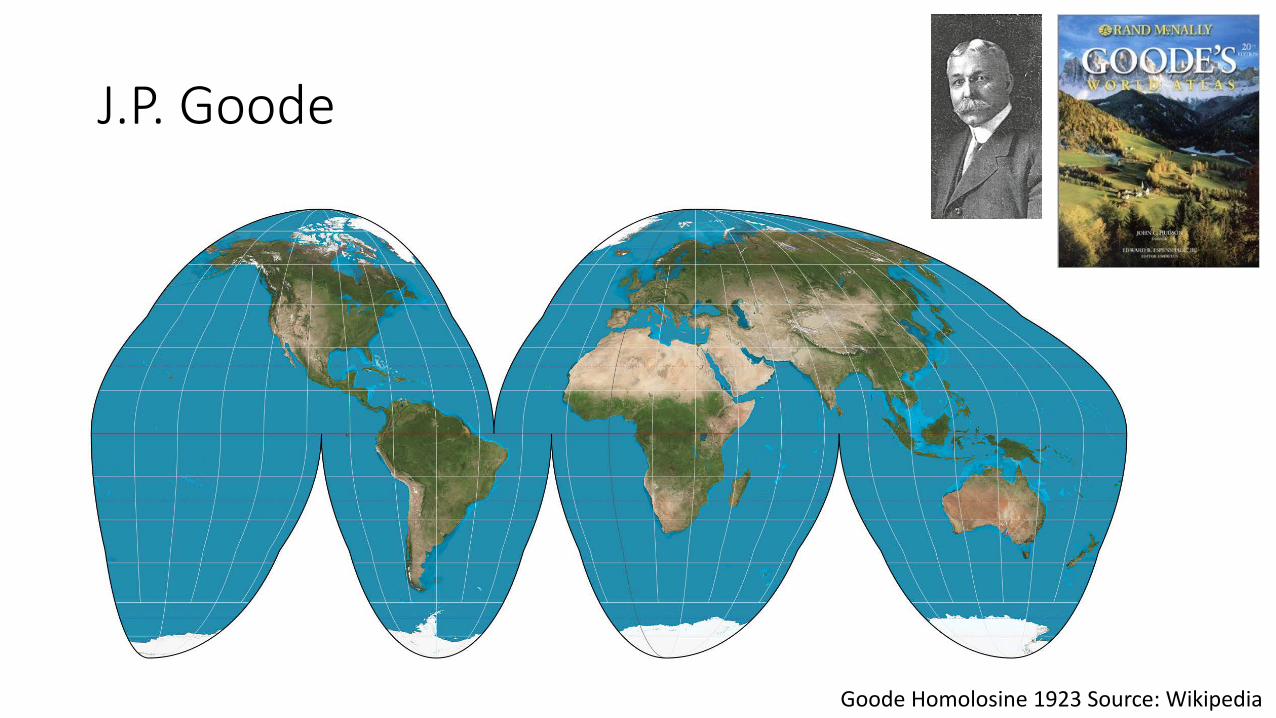
J.P. Goode
Goode Homolosine 1923 Source: Wikipedia
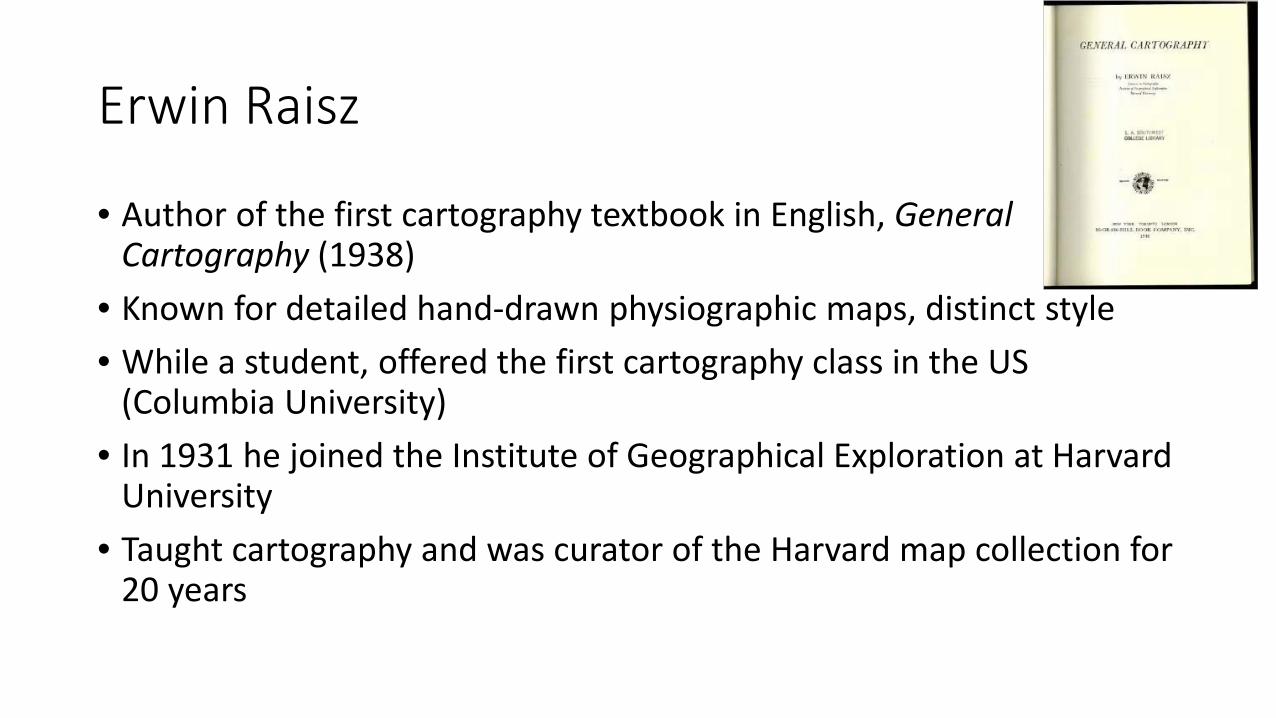
Erwin Raisz
• Author of the first cartography textbook in English, General Cartography (1938)
• Known for detailed hand-drawn physiographic maps, distinct style • While a student, offered the first cartography class in the US
(Columbia University) • In 1931 he joined the Institute of Geographical Exploration at Harvard
University • Taught cartography and was curator of the Harvard map collection for
20 years
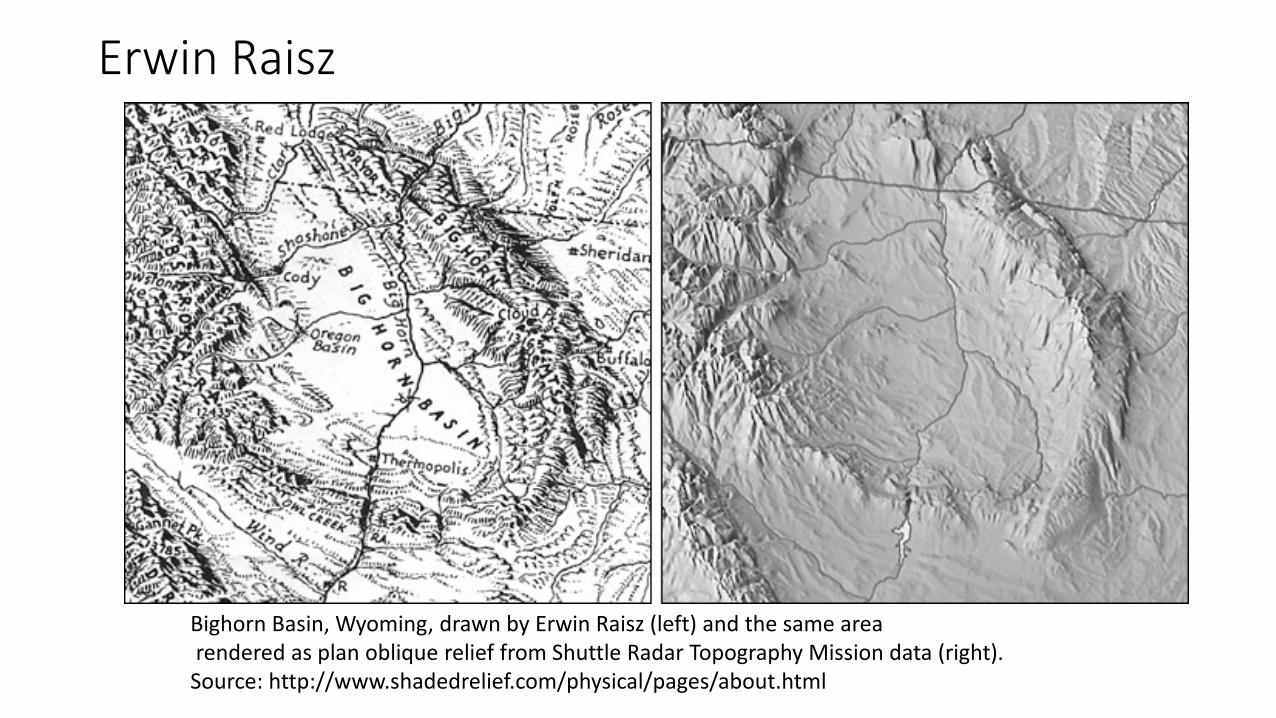
Erwin Raisz
Bighorn Basin, Wyoming, drawn by Erwin Raisz (left) and the same area rendered as plan oblique relief from Shuttle Radar Topography Mission data (right). Source: http://www.shadedrelief.com/physical/pages/about.html
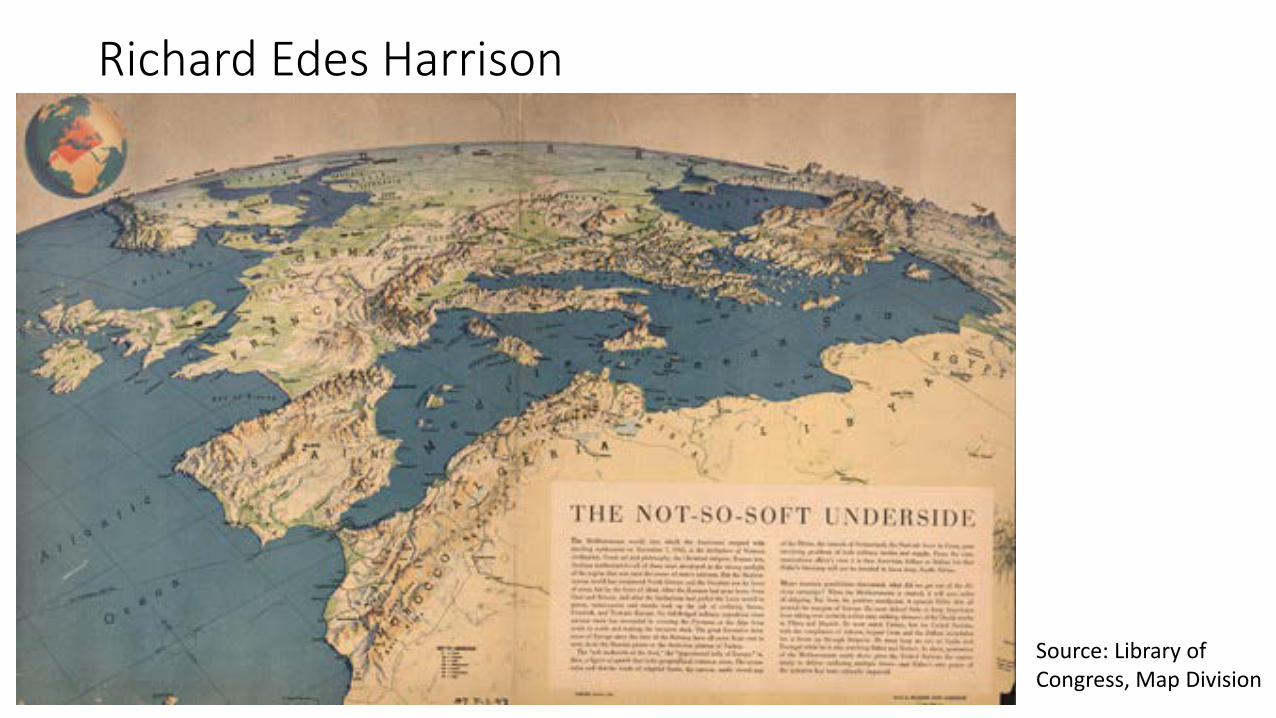
Richard Edes Harrison
Source: Library of Congress, Map Division
Slocum’s Observations on period 4
• Integration of cartography and GIS • Completion of the digital transition • Less emphasis on coding, more on the user interface • More attention to dynamics, animation and multimedia • Emergence of Analytical Cartography • Close relationship between academic mentors and new programs
Summary
• Thematic cartography vs. reference • Geographic information is important to mapping • Data organization and classification is vital • The mapping process has steps and feedback • Change in technology has changed cartography • Vision and memory are closely linked • Overview of the development of academic cartography • Early American cartographers shared creative approaches