geog415 lecture 1: hydrologic cycle
TRANSCRIPT

1-1
GEOG415 Lecture 1: Hydrologic cycle
Hydrologic cycle is ultimately driven by solar radiation, which evaporates water from the ocean and lift it up in the atmosphere.
Dunne & Leopold, 1978, Fig. 1-1
Hydrology is the study of physical processes.
Atmospheric processes: cloud condensation, precipitation
Surface processes: snow accumulation, overland flow, river flow, lake storage
Subsurface processes: infiltration, soil-water storage, groundwater flow
Interfacial processes: evaporation, transpiration, sediment-water exchange

1-2
Water is also an agent for many other processes (weathering, transport of chemicals, erosion, deposition).
Water is the most important natural resource.
Distribution of water in the global hydrologic cycleOceans : 97.2 % Rivers and lakes : 0.01 %Ice caps and glaciers : 2.1 % Soil water : 0.005 %Groundwater : 0.61 % Atmosphere : 0.001%
Understanding the hydrologic cycle is essential for:- sustainable agriculture (foods for the growing population)- environmental protection and management- water resources development and management- prevention and control of natural disasters- mitigation of the negative impacts of climatic change
The hydrologic cycle appears to be controlled by climatic conditions (rain, snow, wind, etc.), but there are strong feed-back mechanisms between hydrological and meteorological processes. Poor representation of hydrological processes has been one of the stumbling blocks for global-climate modeling.

1-3
Case study: Amboseli National Park, Kenya
Water table: the boundary between “moist” and “saturated” soil.
The water table fluctuates with climate. The high water table brought high-salinity water to the root zone, which resulted in “physiological drought” caused by osmosis. The osmotic force drives the flow of water across cell walls from low-salinity regions to high-salinity regions. When soil salinity is too high, plant roots cannot extract water from the soil against the strong osmotic force.
Dunne and Leopold, 1978, Fig. 1-3
The hydrologic cycle often has a long response time. Careless alteration of a part of the hydrologic cycle may cause a fatal damage to other parts, which may lasts for years.

1-4
Property of water
Water molecules have strong polarity.
A large amount of latent heat is required for phase transfer.
334 J g-1
@ 0ºC
2464 J g-1
@ 15ºC2835 J g-1
@ 0ºC
Christopherson, 2000, Fig. 7-4
Specific heat of liquid water = 4.18 J ºC-1 g-1
Unit conversion: 1 calorie = 4.186 J

1-5
Humidity
Air becomes “saturated” when the vapor-holding capacity of air is reached. → 100 % relative humidity.
Relative humidity = amount of vapor / holding capacity
For the same amount of water vapor, relative humidity decreases with temperature. → dry in-room air in winter.
Christopherson, 2000, Fig. 7-7
Specific humidity = mass of water vapor / total mass of air.
Specific humidity of this air parcel remains constant.

1-6
Vapor pressure
The amount of water vapor in air is expressed as pressure.
Why?
Saturation vapor pressure is a well-defined function of air temperature. Warmer air has a higher holding capacity, hence a higher saturation vapor pressure.
Cooling an air parcel eventually results in saturation at certain temperature. This temperature is called dew point.
Temperature (ºC)
Satu
ratio
n va
por p
ress
ure
(mb)
Dunne and Leopold, 1978, Fig. 4-8

1-7
Lapse rate
The temperature of the atmosphere declines with altitude. The rate of decline varies depending on conditions, but on average it is 6.4 ºC per 1000 m (normal lapse rate). The actual rate of temperature change is called the environmental lapse rate.
Adiabatic processes
An adiabatic process refers to expansion or contraction of air parcels without exchanging heat with the surrounding.
Adiabatic expansion results in cooling. Why?
Atmospheric pressure decreases as altitude increases. Therefore, an air parcel expands as it ascends. The rate of adiabatic cooling is expressed as the rate of temperature change per altitude.
The cooling rate of unsaturated air is called the dry adiabatic rate (10 ºC km-1). Once the air becomes saturated, further cooling results in condensation of water, which releases latent heat of fusion. The cooling rate of saturated air is called the moist adiabatic rate (6 ºC km-1).
Stability
When pressure is constant (i.e. same altitude), the density of air decreases as temperature increases (PV = nRT). An air parcel having a higher-than-ambient temperature rises by buoyancy.

1-8
Stable condition
The environmental lapse rate is smaller than the adiabatic lapse rates. The temperature of a rising parcel becomes lower than the ambient air → denser than ambient air, no more rising.
Christopherson, 2000, Fig. 7-19

1-9
Unstable condition
The environmental lapse rate is greater than the adiabatic lapse rates. The temperature of a rising parcel becomes higher than the ambient air → lighter than ambient air, keeps rising.
Christopherson, 2000, Fig. 7-19

1-10
Cloud formation
Droplets of liquid water form in saturated air if condensation nuclei (dusts, aerosols, etc.) are present. Droplets grow in size by collision-coalescence until they are large enough to start falling by gravity → raindrops.
Christopherson, 2000, Fig. 7-21
Raindrop formation requires significant cooling of air parcels, which in turn requires unstable condition or lifting mechanisms that force the air parcel to ascend.

1-11
Convergent lifting
Christopherson, 2000, Fig. 8-5a
Convectional lifting (local heating)
Fig. 8-5b
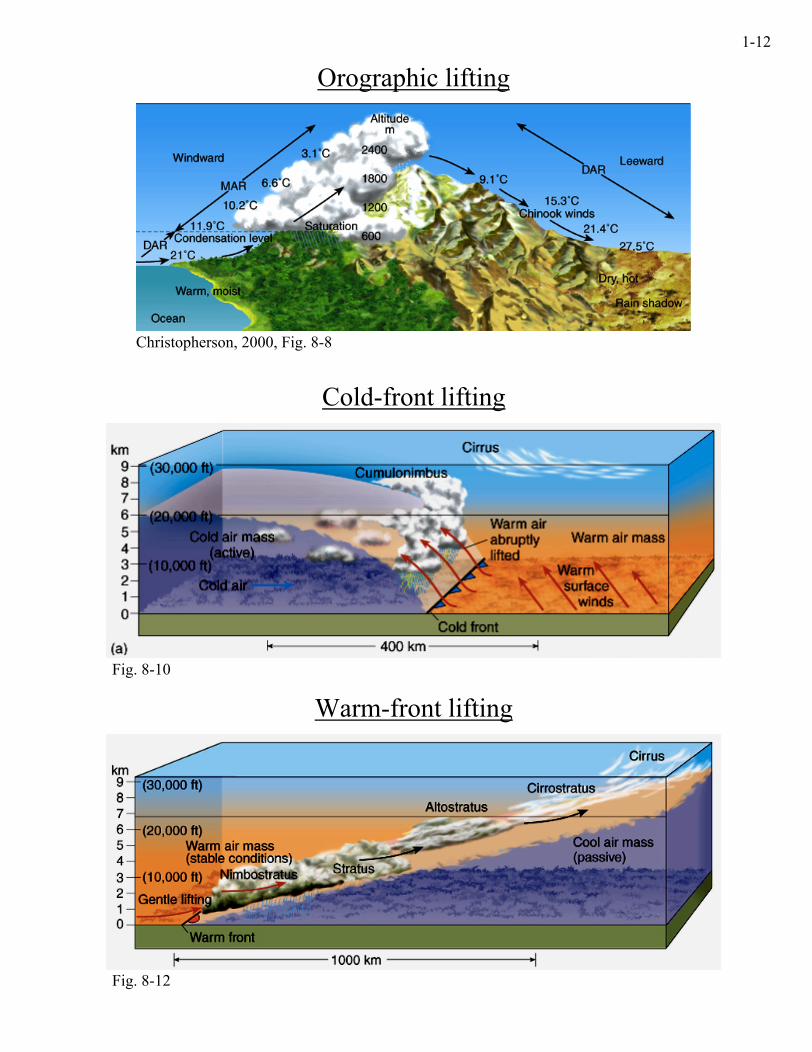
1-12
Orographic lifting
Christopherson, 2000, Fig. 8-8
Cold-front lifting
Fig. 8-10
Warm-front lifting
Fig. 8-12