geogebra na 2011 - university of windsorweb4.uwindsor.ca/users/d/dragana/main.nsf... · search for...
TRANSCRIPT
June 17-18, 2011 [GEOGEBGEOGEBRRAA-N-NAA 2011] 2011
Conference Proceedings Page 1
GEOGEBRA‐NA 2011Proceedings of the Second North American GeoGebra Conference:
Where Mathematics, Education and Technology Meet
2011
Editors: Dragana Martinovic, University of Windsor Zekeriya Karadag, Tufts University Doug McDougall, University of Toronto
June 17-18, 2011 [GGEEOOGGEEBBRRAA--NNAA 22001111]
Conference Proceedings Page ii
Proceedings of the Second North American GeoGebra Conference: Where Mathematics, Education and
Technology Meet
University of Toronto, Toronto, ON
June 17-18, 2011
Editors Dragana Martinovic, University of Windsor
Zekeriya Karadag, Tufts University Doug McDougall, University of Toronto

June 17-18, 2011 [GEOGEBRA-NA 2011]
Conference Proceedings Page iii
Cite as:
Martinovic, D., Karadag, Z., & McDougall, D. (Eds.)(2011). Proceedings of the Second North American GeoGebra Conference, GeoGebra-NA 2011, June 17-18, 2011, Toronto, ON: University of Toronto.
ISBN 978-0-920233-65-8 (CD)
[GEOGEBRA-NA 2011] June 17-18, 2011
Conference Proceedings Page iv
History of GeoGebra-NA
One of the results stemming from the First International GeoGebra conference held on July 14-15, 2009, in Linz, Austria was in organizational activities around planning regional conferences in Spain, Turkey, Argentina, South America, and Norway.
In an attempt to engage the communities of mathematicians, mathematics educators, and software developers in discussions around the potential of technology for learning and teaching of mathematics, the First North-American GeoGebra conference (GeoGebra-NA2010), held on July 28-29, 2010 in Ithaca, NY, laid the foundations for a series of conferences in North America and consequently to this conference in Canada. The idea is to hold annual conferences interchangeably in the US, Canada and Mexico.
Goals of GeoGebra-NA
The GeoGebra-NA 2011 focuses on applications of computer technology in mathematics education from K-16+. In particular, this conference provides a forum for exploring research, development and application processes in relation to:
• Teaching Mathematics with Technology • Dynamic mathematics in action-educational research and experience
• Applying multiple representations with GeoGebra
• Promoting conceptual understanding through explorations.
• Learning Mathematics with Technology • Maximizing effectiveness of the software interface
• Classic, home schooling and informal education
• Bridging digital divide in access and learning opportunities.
• Implementation of Advanced Technologies in Mathematics Education • Developing big mathematics ideas through technology use
• Using collaborative spaces to teach and learn mathematics
• Making intra and interdisciplinary connections through technology use.

June 17-18, 2011 [GEOGEBRA-NA 2011]
Conference Proceedings Page v
SCIENTIFIC COMMITTEE
• Asli Ozgun-Koca, Wayne University, MI, USA
• Bill Lombard, Foothill High School, CA, USA
• Christopher Robertson, NSW Department of Education and Training, Australia
• Erhan Haciomeroglu, University of Central Florida, FL, USA
• Gabriel Stylianides, University of Oxford, Oxford, UK
• Humberto Botolossi, Fluminense Federal University, Rio de Janeiro, Brazil
• Juan Pablo Serrano Echeverría, Ministry of Public Education, Costa Rica
• Kevin Merges, Rutgers, The State University of New Jersey, NJ, USA
• Liliana Saidon, Centro de Investigación y Capacitación Babbage, Argentina
• Margo Kondratieva, Memorial University, NL, Canada
• Margot Berger, University of Witwatersrand, South Africa
• Mikko Rahikka, Helsingin yhteislyseo, Finland
• Milan Sherman, University of Pittsburgh, PA, USA
• Rushan Ziatdinov, Seoul National University, South Korea & Tupolev Kazan State Technical University, Russia
• Tolga Kabaca, Pamukkale University, Denizli, Turkey
• Vesna Kilibarda, Indiana University Northwest, Indiana, USA
• Lingguo Bu, Southern Ilinois University, IL, USA
• Michael Gage, University of Rochester, NY, USA
• Steve Phelps, University of Cincinnati, OH, USA
• Jan Kaspar, Charles University, Prague, Czech Republic
• Priscilla Brown Lopez, University of Belize, Central America
• Muharrem Aktumen, Ahi Evran University, Turkey
• Yi-Yin (Winnie) Ko, Tufts University, MA, USA
• Alfredo Bautista, Tufts University, MA, USA

[GEOGEBRA-NA 2011] June 17-18, 2011
Conference Proceedings Page vi
CONFERENCE CHAIRS
• Dragana Martinovic, University of Windsor, ON, Canada
• Zekeriya Karadag, Tufts University, MA, USA
• Doug McDougall, OISE, University of Toronto, ON, Canada
ADVISORY COMMITTEE
• Daniel Jarvis, Nipissing University, North Bay, ON
• Esperanza Valdés Medina, Universidad Nacional Autonoma De Mexico, Mexico
• Geoff Roulet, Queen’s University, Kingston, ON
• Oana Radu, Memorial University of Newfoundland, NL
• Philippe R. Richard, Université de Montréal, QC
• Viktor Freiman, Université de Moncton, NB
• Liliana Saidon, Centro de Investigación y Capacitación Babbage, Argentina
ORGANIZING COMMITTEE
• Douglas McDougall, OISE, University of Toronto, ON
• Nenad Radakovic, PhD student, University of Toronto, ON
• John Salalila, MEd student University of Windsor, ON
• Calvin Armstrong, PhD student, OISE, University of Toronto, ON
• Limin Jao, PhD student, OISE, University of Toronto, ON
• Sean Beaudette, MEd student, Queen’s University, Kingston, ON
• Kyle McClure, MEd student, Nipissing University, North Bay, ON

June 17-18, 2011 [GEOGEBRA-NA 2011]
Conference Proceedings Page vii
Welcome from the Chairs:
Welcome to the Second North-American GeoGebra conference and the first GeoGebra conference held in Canada. We are excited with the prospect of this conference to build, support and sustain a community of mathematicians, mathematics educators, classroom teachers, graduate students and software developers who can benefit from the potential of computer applications in mathematics education.
The GeoGebra-NA 2011 organizers received over 30 papers from 10 countries and 5 proposals for the working groups. From this list, the reviewers selected 10 papers that found place in these proceedings.
We wish you all a pleasant stay in Toronto, many opportunities for intellectual exchange with the colleagues and much success in your professions.
We are also pleased to announce that GeoGebra-NA 2012 will be held in Mexico and hope that we will all meet there again!
Dragana, Doug, and Zekeriya

[GEOGEBRA-NA 2011] June 17-18, 2011
Conference Proceedings Page viii
Table of Contents:
Plenary Sessions…………………………………………………………………………………..1
Plenary Speakers (Short Bios)…………………………………………………………………..1
Learning collaboratively to meet Net Generation's needs: What can we learn from
GeoGebra community?
Viktor Freiman……………………………………………………………………………..2
GeoGebra and the Global Village--Theatre: Realizing the 21st Century Potential of
Dynamic Mathematics for/by All
Daniel Jarvis……………………………………………………………………………….5
Presentations…………………………………………………………………………………..…8
Using GeoGebra for Understanding and Supporting Students’ Learning of
Probability
Einav Aizikovitsh-Udi & Nenad Radakovic…………………………………………………..9
Significant Teaching and Learning Moments Using Interactive Whiteboards in
Mathematics
Catherine D. Bruce, Rich McPherson & Farhad M. Sabeti……………………..….…..15
Mathematical Problem Solving in Dynamic Learning Environments: The Case of
GeoGebra
Linggou Bu, Erhan Selcuk Haciomeroglu & Frackson Mumba………………………20
Geogebra as a Pedagogical Tool: A Preliminary Taxonomy
Lingguo Bu, Frackson Mumba & Yazan Alghazo…………………………………………32
A Collaborative Pen-Based PC Workspace for Teaching and Learning Mathematics
Carol Carruthers………………………………………………………………………………….41

June 17-18, 2011 [GEOGEBRA-NA 2011]
Conference Proceedings Page ix
Geometrical Proofs, Basic Geometric Configurations and Dynamic Geometry
Software
Margo Kondratieva……………………………………………………………………………...46
Finding the Area of a Circle: Affordances and Design Issues with Different IGS
Programs
Kate Mackrell……………………………………………………………………………………..55
Toward a Collection of GeoGebra Calculus Applets
Marc Renault……………………………………………………………………………………..68
GeoGebra and Online Collaborative Mathematics
Geoffrey Roulet…………………………………………………………………………………..71
Classical Geometry with GeoGebra
Petra Surynková…………………………………………………………………………………..77

June 17-18, 2011 [GGEEOOGGEEBBRRAA--NNAA 22001111]
Conference Proceedings Page 1
PLENARY SESSIONS
Plenary Speakers (Short Bios)
Dr. Viktor Freiman is an Associate Professor at the Faculty of Educational Sciences, Université de Moncton. He teaches undergraduate courses in Mathematics Education and graduate courses in learning and technology, innovative trends in education and education of gifted. His doctorate study was about teaching methods in computer science courses. His recent research interests are related to problem-based interdisiciplinary learning, mathematical giftedness and enrichment using technology. He is co-founder of the learning multidisciplinary community CAMI (www.umoncton.ca/cami) that offers problems and questions in mathematics, science, social studies, reading and chess. He is the author of articles, chapters and books and co-organiser of conferences and
working groups on these issues in Canada and abroad. He is the president of the Association of the pedagogical advancement of technology in the Atlantic Canada APTICA (Avancement Pédagogique de TIC en Atlantique, www.aptica.ca).
Dr. Daniel Jarvis is an Associate Professor and Chair of the Master of Education Program at the Schulich School of Education, Nipissing University, North Bay, Ontario. With a background in mathematics and visual arts, Dan is particularly intrigued with the coalescence of these two disciplines via modern technology. His research interests include curricular integration, instructional technology, and educational leadership. Dan was invited to attend the first meeting of the International GeoGebra Institute in Cambridge, UK in 2008, and has been involved with IGI and the establishment of the GeoGebra Institute of Canada (GIC-IGC).
Return to the Table of Contents
[GEOGEBRA-NA 2011] June 17-18, 2011
Conference Proceedings Page 2
LEARNING COLLABORATIVELY TO MEET NET GENERATION'S NEEDS: WHAT CAN WE LEARN FROM GEOGEBRA COMMUNITY? OUTLINE OF THE KEYNOTE LECTURE
Viktor Freiman
Université de Moncton
Walking through the universe of the World Wide Web, one can be amazed with the multiple-digit
number of educational resources that may enhance teaching and learning to which anyone can
get an access anytime and anywhere, once equipped with an appropriate technology, like for
example, an individual laptop (Lowther, Ross, & Morrison, 2003). Namely, a Google-enhanced
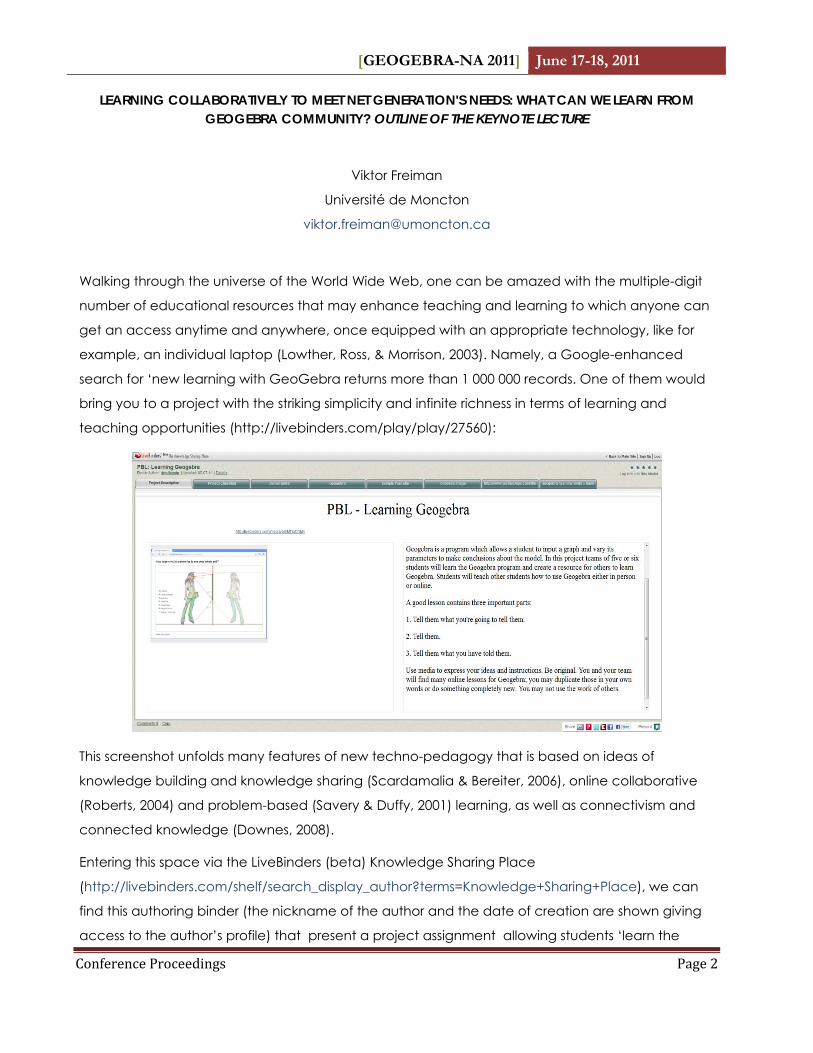
search for ‘new learning with GeoGebra returns more than 1 000 000 records. One of them would
bring you to a project with the striking simplicity and infinite richness in terms of learning and
teaching opportunities (http://livebinders.com/play/play/27560):
This screenshot unfolds many features of new techno-pedagogy that is based on ideas of
knowledge building and knowledge sharing (Scardamalia & Bereiter, 2006), online collaborative
(Roberts, 2004) and problem-based (Savery & Duffy, 2001) learning, as well as connectivism and
connected knowledge (Downes, 2008).
Entering this space via the LiveBinders (beta) Knowledge Sharing Place
(http://livebinders.com/shelf/search_display_author?terms=Knowledge+Sharing+Place), we can
find this authoring binder (the nickname of the author and the date of creation are shown giving
access to the author’s profile) that present a project assignment allowing students ‘learn the

June 17-18, 2011 [GEOGEBRA-NA 2011]
Conference Proceedings Page 3
GeoGebra program and create resources for others to learn GeoGebra’ (students teach other
students), as shown on the above Figure. The menu on the top of the screen contains, among
others, the entry to the GeoGebra community website, a You Tube sample of the activity, and
news about new software’s developments. There is also a number of tools allowing members of
this virtual learning community (Pallof & Pratt, 2005) to create their own profile, to log in, to rate the
webpage, to share it, to twit, or to put it on the Facebook, as well as other related networks.
By focusing on mathematics knowledge building and knowledge sharing while working
collaboratively as learning community, which is one of the striking characteristics of the Net
Generation’s (Oblinger & Oblinger, 2005) innovative 21st century pedagogy (P21, 2011).
Based on innovative frameworks that define learning for tomorrow’s citizens, we shall reflect on
following questions:
• What is this new way of learning?
• How to grasp and increase its potential for more differentiated and enriched learning?
• How can we deal with variety, complexity and messiness of new knowledge constructed in collaborative ways?
• What are indicators of success in such environments and how it can affect teaching and assessment practices?
These questions will outline our reflective thoughts about lessons GeoGebra learning community
teaches us and how these lessons may enrich mathematics which is taught and learned.
References:
Downes, S. 2008. Places to go: Connectivism & Connective Knowledge. Innovate 5 (1). http://www.innovateonline.info/index.php?view=article&id=668 (accessed September 29, 2008).
Lowther, D. L., Ross, S. M., & Morrison, G. R. (2003). When each one has one: The influences on teaching strategies and student achievement of using laptops in the classroom. Educational Technology Research and Development, 51(03), 23-44.
Oblinger, D., & Oblinger, J. (2005). Educating the net generation [Electronic version]. Retrieved May 31, 2011 from http://net.educause.edu/ir/library/pdf/pub7101.pdf.
Pallof, R. and Pratt, K. (2005). Collaborating online: learning together in community. San Francisco: Jossey Bass.
Roberts, T. (2004). Online collaborative learning: Theory and practice. Hershey, PA: Information Science Publications.
Savery, J. R., & Duffy, T. M. (2001). Problem based learning: An instructional model and its constructivist framework. CRLT Technical Report No. 16-01, Indiana University: Center for Research on Learning and Technology. Retrieved May 20, 2008, from http://cee.indiana.edu/publications/journals/TR16-01.pdf
[GEOGEBRA-NA 2011] June 17-18, 2011
Conference Proceedings Page 4
Scardamalia, M., & Bereiter, C. (2006). Knowledge building: Theory, pedagogy, and technology. In R.K. Sawyer (Ed.), Cambridge Handbook of the Learning Sciences (pp. 97-118). New York, NY: Cambridge University Press.
Return to the Table of Contents
June 17-18, 2011 [GEOGEBRA-NA 2011]
Conference Proceedings Page 5
GEOGEBRA AND THE GLOBAL VILLAGE-THEATRE:
REALIZING THE 21ST CENTURY POTENTIAL OF DYNAMIC MATHEMATICS FOR/BY ALL
Dr. Daniel Jarvis
Schulich School of Education, Nipissing University
Abstract
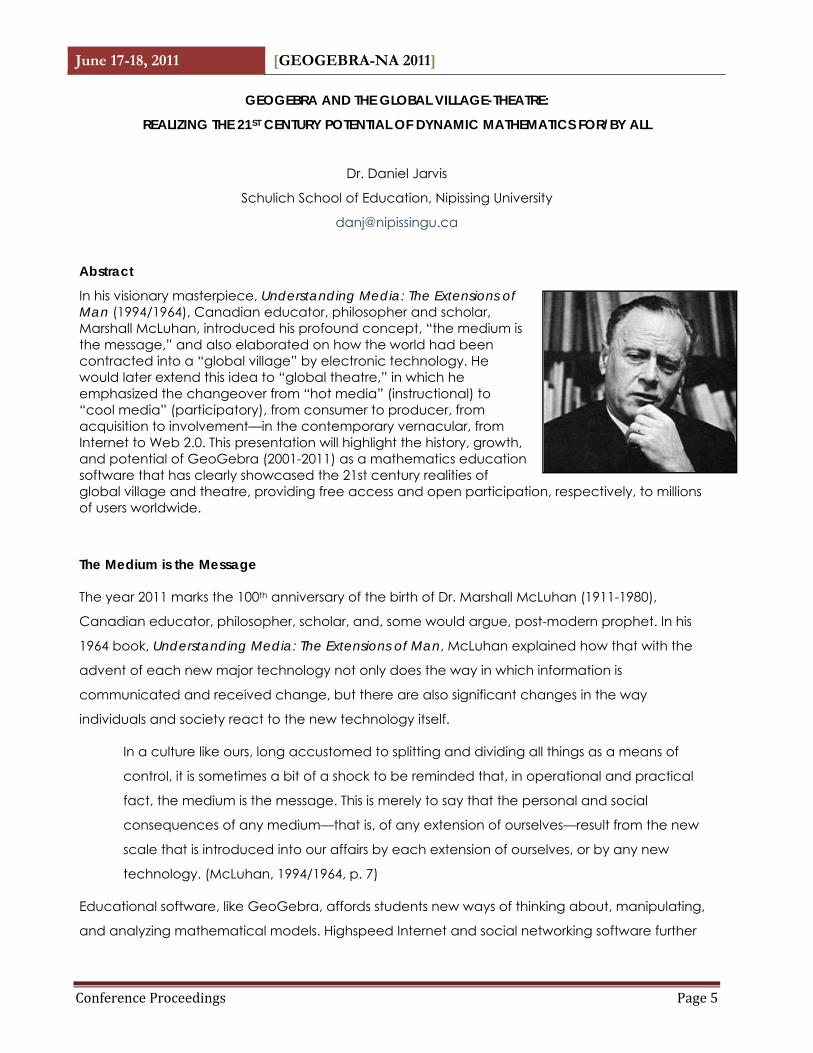
In his visionary masterpiece, Understanding Media: The Extensions of Man (1994/1964), Canadian educator, philosopher and scholar, Marshall McLuhan, introduced his profound concept, “the medium is the message,” and also elaborated on how the world had been contracted into a “global village” by electronic technology. He would later extend this idea to “global theatre,” in which he emphasized the changeover from “hot media” (instructional) to “cool media” (participatory), from consumer to producer, from acquisition to involvement—in the contemporary vernacular, from Internet to Web 2.0. This presentation will highlight the history, growth, and potential of GeoGebra (2001-2011) as a mathematics education software that has clearly showcased the 21st century realities of global village and theatre, providing free access and open participation, respectively, to millions of users worldwide.
The Medium is the Message
The year 2011 marks the 100th anniversary of the birth of Dr. Marshall McLuhan (1911-1980),
Canadian educator, philosopher, scholar, and, some would argue, post-modern prophet. In his
1964 book, Understanding Media: The Extensions of Man, McLuhan explained how that with the
advent of each new major technology not only does the way in which information is
communicated and received change, but there are also significant changes in the way
individuals and society react to the new technology itself.
In a culture like ours, long accustomed to splitting and dividing all things as a means of
control, it is sometimes a bit of a shock to be reminded that, in operational and practical
fact, the medium is the message. This is merely to say that the personal and social
consequences of any medium—that is, of any extension of ourselves—result from the new
scale that is introduced into our affairs by each extension of ourselves, or by any new
technology. (McLuhan, 1994/1964, p. 7)
Educational software, like GeoGebra, affords students new ways of thinking about, manipulating,
and analyzing mathematical models. Highspeed Internet and social networking software further

[GEOGEBRA-NA 2011] June 17-18, 2011
Conference Proceedings Page 6
provide new and easily available/affordable ways of sharing these learning episodes with others in
community.
The Global Village
McLuhan also described the dramatic reversal, or social “implosion” of the 1960s era as one in
which pervasive electronic media had, in essence, shrunk the known world, thereby increasing the
connectivity of individuals, and hence their perceived social accountability towards others. He
boldly proclaimed (p. 5),
In the electric age, when our central nervous system is technologically extended to involve
us in the whole of mankind and to incorporate the whole of mankind in us, we necessarily
participate, in depth, in the consequences of our every action. . . . After three thousand
years of specialist explosion and of increasing specialism and alienation in the
technological extensions of our bodies, our world has become compressional by dramatic
reversal. As electrically contracted, the globe is no more than a village. (p. 5)
Although the GeoGebra user community was growing astonishingly fast, the core team realised in
2007 that teachers who were beginning to implement the software, as well as researchers who
were starting to document its usage, needed specific forms of support and direction. In addition,
they wanted to offer a forum for the community to extend collaboration and communication. To
be able to offer such assistance, they established the International GeoGebra Institute (IGI). The
aims of this non-profit organisation were to assist all members of the international GeoGebra
community based on their own local context and needs. During the past several years, IGI and
the GeoGebra community have been gaining substantial momentum, and GeoGebra is rapidly
gaining popularity in the teaching and learning of mathematics around the world. Currently, the
software is translated into 52 languages, used in 190 countries/regions, and downloaded by
approximately 300,000 users each month. McLuhan’s global village has been evidenced in this
context.
On Multiple Representations
Modelling mathematical phenomena with different tools represents a powerful way for students to
visualize, and hence better understand the big ideas of mathematics (Hohenwarter & Jones,
2007). When various digital models converge and are actually connected by means of an
underlying code, we can imagine that the effects are even more remarkable for many students
(and teachers). McLuhan (1994/1964, p. 13) highlighted Picasso’s Cubism (which shattered an
object into broken pieces of multiple perspectives, and then reassembled them by way of visual

June 17-18, 2011 [GEOGEBRA-NA 2011]
Conference Proceedings Page 7
collage to provide for the viewing experience what Pablo argued was a more “real” way of
seeing) as a powerful metaphor for detailed life observations.
The message of the movie medium is that of transition from lineal connections to configurations. . .
. Instead of the specialized illusion of the third dimension on canvas, cubism sets up interplay of
planes and contradiction or dramatic conflict of patterns, lights, textures that “drives home the
message” by involvement. This is held by many to be an exercise in painting, not in illusion. In other
words, cubism, by giving the inside and outside, the top, bottom, back, and front and the rest, in
two dimensions, drops the illusion of perspective in favor of instant sensory awareness of the whole.
Cubism, by seizing on instant total awareness, suddenly announced that the medium is the
message.
GeoGebra offers “next step” interactive, multi-representational software (Todd, Lyublinskaya, &
Ryzhik, 2010), which capitalizes on the complexity of the electronic age, and on the mathematical
minds at work.
On Innovation & Collaboration
Some have argued that an open-source, freely-accessible software could not sustain itself at
length without the type of guaranteed remuneration/support offered to employees of large
software corporations (for a related discussion, see Jarvis, Hohenwarter, & Lavicza, 2011). McLuhan
explained how, ironically perhaps, innovation actually “threatens the equilibrium of existing
organization,” how internal mechanisms are actually created to deal with this perceived internal
threat, and how innovations often come from outside:
In big industry new ideas are invited to rear their heads so that they can be clobbered at once.
The idea department of a big firm is a sort of lab for isolating dangerous viruses. When one is
found, it is assigned to a group for neutralizing and immunizing treatment. . . . Therefore, no new
idea ever starts from within a big operation. It must assail the organization from outside, through
some small but competing organization. (p. 251)
During the past several decades, it has been demonstrated that a large number of enthusiasts
can alter conventional thinking and models of development and innovation. The success of open-
source projects like Linux, Firefox, Moodle, and Wikipedia has shown that collaboration and sharing
can produce, perhaps quite surprisingly at first, valuable resources in a variety of areas of life.
While working on the open-source project GeoGebra, Hohenwarter and his core team have
witnessed the emergence of an enthusiastic, international community. New advances such as the
development of GeoGebra CAS (Computer Algebra Systems), GeoGebra Spreadsheet,
GeoGebra Mobile (for smartphones), GeoGebra 3-D, GeoGebra XO (one-laptop-per-child
[GEOGEBRA-NA 2011] June 17-18, 2011
Conference Proceedings Page 8
initiative), and GeoGebraTube (for better tagging/searching of shared resources), and the release
of GeoGebra 4 (August, 2011), are in large part attributable to the contributions of various
volunteer individuals or teams found within this growing nexus of engaged participation.
McLuhan envisioned a world of electronic connectivity, instantaneous information sharing, freely-
available resources, self-tailored education, and a finely-tuned (although not necessarily
harmonious) collective consciousness. The medium of the Internet has subsequently become a
powerful message with Google, Wikipedia, Facebook, Twitter, email, smartphones, and touch
tablets literally changing the way we work, play, spend, and socialize. GeoGebra, as a
mathematics education software phenomenon, will undoubtedly continue to constitute some
significant part of our shared global village-theatre in the 21st century world.
References
Hohenwarter, M., & Jones, K. (2007). Ways of linking geometry and algebra: The case of GeoGebra. Proceedings of the British Society for Research into Learning Mathematics. 27(3):126-131, University of Northampton, UK.
Jarvis, D. H., Hohenwarter, M., & Lavicza, Z. (2011). GeoGebra, democratic access, and sustainability: Realizing the 21st-century potential of dynamic mathematics for all. In L. Bu & R. C. Schoen (Eds.), Model-centered learning in mathematics: Pathways to understanding using GeoGebra. Boston, MA: Sense Publishers.
McLuhan, M. (1994). Understanding media: The extensions of man. Cambridge, MA: MIT Press. (Original work published 1964)
Todd, P., Lyublinskaya, I., & Ryzhik, V. (2010). Symbolic geometry software and proofs. International Journal of Computers for Mathematical Learning, 15(2), 151-159.
Return to the Table of Contents
June 17-18, 2011 [GEOGEBRA-NA 2011]
Conference Proceedings Page 9
PRESENTATIONS

[GEOGEBRA-NA 2011] June 17-18, 2011
Conference Proceedings Page 10
USING GEOGEBRA FOR UNDERSTANDING AND SUPPORTING STUDENTS’ LEARNING OF PROBABILITY
Einav Aizikovitsh-Udi, Harvard University
Nenad Radakovic, OISE/University of Toronto
Introduction
In this paper we explore the use of GeoGebra as a visual dynamic tool for supporting high school
students’ understanding of probability, more specifically, understanding of conditional probability
and Bayes’ theorem. The research presented is part of a broader research project on improving
high school students’ risk literacy. Decisions that involve the understanding of risk are made in all
aspects of life including health (e.g. whether to continue with the course of medication), finances
(paying for extra insurance) and politics (preemptive strikes versus political dialogue). These
decisions are not only common, but they are also critical for individual and societal health and
well being. Some studies have shown that people are routinely exposed to medical risk information
(e.g. prevalence rates of diseases) and that their understanding of this information can have
serious implications on their health (Rothman et al., 2008). Despite its importance, most people are
unable to adequately interpret and communicate risk (Reyna et al., 2009).
Theoretical Framework
Risk literacy
Although there is a recognized urgent need for risk literacy education, there is a lack of
agreement on its definition. This is because the concept or risk literacy exists within the intersection
of many related literacies—mathematical, health, statistical, probability, scientific, and financial. In
this study, we will situate risk literacy within the fields of statistical and probability literacy as both
fields focus on uncertainty and chance which are important elements of risk literacy. Most current
approaches to literacy recognize it to be more than a minimal subset of content knowledge in a
particular field. Further, the definition of literacy has been expanded to include “desired beliefs,
habits of mind, or attitudes, as well as a general awareness and a critical perspective” (Gal, 2004,
p. 48). Consistent with Gal’s (2004, 2005) research on statistical and probability literacy, we will
define risk literacy to consist of knowledge (literacy skills, understanding of math, probability and
statistics, specific content knowledge, etc) and dispositional elements (beliefs and attitudes and
critical stance). In this paper, we are concerned with knowledge elements, more specifically,
conditional probability and Bayes’ theorem.

June 17-18, 2011 [GEOGEBRA-NA 2011]
Conference Proceedings Page 11
Understanding conditional probability
Kahneman, Slovic & Tversky (1982) claimed that intuitive errors proceed from using certain heuristic
principles that often lead to erroneous probability judgments. For instance, according to the
principle of representativeness, people assess the probability of an event according to the extent
to which this event’s description reflects the way they perceive the set of its most likely
consequences, or alternatively, the process that produces the event. As the consequence of the
representativeness heuristic, people tend to neglect the base rates which are, according to
Bayes’ theorem, relevant to the calculation of probabilities. In addition, Koehler (1996) describe
and provide empirical evidence for inverse fallacy in which the conditional probability of the
event A given the event B is taken to be equivalent to the conditional probability of the event B
given the event A.
Dynamic visualizations
An enormous corpus of literature has been accumulated on technology use in mathematics
education and visual learning of mathematics, and many researchers discussed the topics in the
various national and international meetings such as PME, PMENA, and ICMI (Arcavi, 1999; Duval,
1999; Hitt, 1999; Hoyles, 2008; Kaput & Hegedus, 2000; McDougall, 1999; Moreno-Armella, 1999;
Presmeg, 1999;Santos-Trigo, 1999; Thompson, 1999).In the last couple of years there has been a
focus on dynamic learning environments such as GeoGebra which allow us to create
mathematical objects and explore them visually and dynamically.
Moreno-Armella, Hegedus, and Kaput (2008) describe learning environment in which students can
visualize, construct and manipulate mathematical concepts. The dynamic learning environments
can enable students to act mathematically, to seek relationship between object that would not
be as intuitive with a static paper and pen representations.
Research Objective and Questions
The goal of our research is to substantiate the claim that dynamic learning environment enables
student to grasp abstract mathematical concept by manipulating mathematical objects
constructed within these systems. More specifically, we investigate the role of dynamic
visualization of Bayes’ theorem in students’ understanding of the theorem. Moreover, we are
interested whether the introduction of visualization has an effect on student’s committing the base
rate and the inverse fallacy.
Methods
The design experiment is an iterative process consisting of assessment and instructional
intervention (Cobb et al., 2003). Through iterative steps, the assessment and the intervention inform

[GEOGEBRA-NA 2011] June 17-18, 2011
Conference Proceedings Page 12
each other. The goal of the process is to improve the instruction as well as to gain insight into
students’ learning processes (Cobb et al., 2003). The design research took place in a grade 11
classroom during the probability and statistics unit. There were 23 participants. As a part of the
initial assessment, students were presented with the breast cancer problem. Only two students out
of 20 who participated in the initial assessment were able to give the correct answer to the
question. After the initial assessment students, were presented with the GeoGebra applet
representing area-proportionate Venn diagrams whose size can be manipulated using the slider
feature of Geogebra. Students’ interaction with the software was audio recorded together with
the class discussion facilitated by the researchers. Finally, the post-intervention test presenting a
problem analogous to the breast cancer problem but in a different context was presented.
Figure 1: GeoGebra applet for visualizing Bayes’ theorem
Results and Conclusion
Evidence from the interviews suggests that area-proportional Venn diagrams enabled students to
conceptually understand the Bayes’ formula. Using the dynamic feature of the applet, the
students were able to understand the connection between the base rates and conditional
probability. The results of the post-test shows that 75% of students were able to solve the question
equivalent to the breast cancer problem. This serves as evidence that dynamic visualizations do
create means for the deeper analysis of mathematical concepts. Finally, the study illustrates a role

June 17-18, 2011 [GEOGEBRA-NA 2011]
Conference Proceedings Page 13
that a dynamic learning environment such as GeoGebra could play in fostering students’ risk
literacy.
References
Arcavi, A. (1999). The role of visual representations in the learning of mathematics. In F. Hitt & M. Santos (Eds.), Proceedings of the Twenty First Annual Meeting of the North American Chapter of the International Group for the Psychology of Mathematics Education, 55-80.
Cobb, P., Confrey, J., diSessa, A., Lehrer, R., & Schauble, L. (2003). Design experiments in educational research. Educational Researcher, 32(1), 9-13, 35-37.
Cobb, P.,& Gravemeijer, K. (2008). Experimenting to Support and Understand Learning Process. In Kelly, A. E., Lesh, R. A., & Baek, J. Y. (Eds.). Handbook of design research methods in education. (pp. 68-95). New York: Routledge.
Duval, R. (1999). Representation, vision and visualization: Cognitive functions in mathematical thinking: Basic issues for learning. In F. Hitt & M. Santos (Eds.), Proceedings of the Twenty First Annual Meeting of the North American Chapter of the International Group for the Psychology of Mathematics Education, 3-26.
Eddy, D.M. (1982). Probabilistic Reasoning in Clinical Medicine: Problems and Opportunities. In D. Kahneman, P. Slovic and A. Tversky (eds.), Judgment Under Uncertainty: Heuristics and Biases. Cambridge University Press.
Gal, I. (2004). Statistical Literacy. Meanings, Components, Responsibilities. In Ben-Zvi, D., & Garfield, J. (2004). The Challenge of Developing Statistical Literacy, Reasoning and Thinking. Kluwer Academic Publishers, Dordrecht, pp. 47-78.
Gal, I. (2005). Towards “probability literacy” for all citizens: building blocks and instructional dilemmas. In Jones, G. A. (Ed.), Exploring probability in school: Challenges for teaching and learning (pp. 39-63). New York: Springer.
Hitt, F. (1999). Representations and mathematics visualization. In F. Hitt & M. Santos (Eds.), Proceedings of the Twenty First Annual Meeting of the North American Chapter of the International Group for the Psychology of Mathematics Education, 137-138.
Hoyles, C. (2008). Transforming the mathematical practices of learners and teachers through digital technology. 11th International Congress on Mathematical Education. Monterrey, Nuevo Leon, Mexico.
Kahneman, D., Slovic, P., & Tversky, A. (Eds.). (1982). Judgment under uncertainty: Heuristics and biases. New York: Cambridge University Press.
Kaput, J. J. & Hegedus, S. J. (2000). An introduction to the profound potential of connected algebra activities: Issues of representation, engagement and pedagogy. Proceedings of the 28th International Conference of the International Group for the Psychology of Mathematics Education, 3, 129-136.
Koehler, J. J. (1996). The base rate fallacy reconsidered: Descriptive, normative and methodological challenges. Behavioral & Brain Sciences, 19, 1-53.
McDougall, D. (1999). Geometry and technology. In F. Hitt & M. Santos (Eds.), Proceedings of the Twenty First Annual Meeting of the North American Chapter of the International Group for the Psychology of Mathematics Education, 135-136.
Moreno-Armella, L. (1999). On representations and situated tools. In F. Hitt & M. Santos (Eds.), Proceedings of the Twenty First Annual Meeting of the North American Chapter of the International Group for the Psychology of Mathematics Education, 99-104.

[GEOGEBRA-NA 2011] June 17-18, 2011
Conference Proceedings Page 14
Presmerg, N. C. (1999). On Visualization and Generalization in Mathematics. In F. Hitt & M. Santos (Eds.), Proceedings of the Twenty First Annual Meeting of the North American Chapter of the International Group for the Psychology of Mathematics Education, 1.
Reyna, V. F., Nelson, W., Han, P., & Dieckmann, N. F. (2009). How numeracy influences risk comprehension and medical decision making. Psychological Bulletin.
Rothman, R. L., Montori, V. M., Cherrington, A., & Pigone, M. P. (2008). Perspective: The role of numeracy in healthcare. Journal of Health Communication, 13, 583–595.
Santos-Trigo, M. S. (1999). The use of technology as a means to explore mathematics: Qualities in proposed problems. In F. Hitt & M. Santos (Eds.), Proceedings of the Twenty First Annual Meeting of the North American Chapter of the International Group for the Psychology of Mathematics Education, 139-146.
Thompson, P. (1999). Representation and evolution: A discussion of Duval’s and Kaput’s papers. In F. Hitt & M. Santos (Eds.), Proceedings of the 21st Annual Meeting of the North American Chapter of the International Group for the Psychology of Mathematics Ed.
Return to the Table of Contents
June 17-18, 2011 [GEOGEBRA-NA 2011]
Conference Proceedings Page 15
SIGNIFICANT TEACHING AND LEARNING MOMENTS USING INTERACTIVE WHITEBOARDS IN
MATHEMATICS
Dr. Catherine D. Bruce, Rich McPherson & Farhad M. Sabeti
Conference Theme: Computer technologies for learning/doing mathematics
Key Words: Mathematics, Interactive Whiteboards, Teacher and Student Learning, Gestures
Context
How are interactive whiteboards (IWB) helping students learn mathematics? Students report being
engaged, but are they gaining deeper understanding of concepts explored? Our research goal
was to define and analyze significant teaching and learning moments using the IWB (moments
that had a clearly positive impact on student understanding because of IWB use) in two
classrooms. 25 classroom video episodes were systematically analyzed using an analysis matrix.
We conclude that deep student understanding was achieved where: 1. Students illustrated their
thinking using tools available on the IWB; 2. Students took risks in pairs activities, investigated
multiple solutions, and efficiently completed tasks using IWB technology; 3. Student use of gestures
enabled consolidation of ideas.
Results are based on two case studies conducted with two Grade 6 classrooms and their teachers.
Both teachers were chosen based on their distinct levels of experience and knowledge of
interactive whiteboard technology: one teacher having 12 years of teaching experience with no
interactive whiteboard experience, and one teacher with 3 years of teaching experience and
relatively high knowledge of interactive whiteboard use in mathematics.
Literature Review
Benefits of IWB use identified through early studies included: a) ease of use for whole class
teaching (Stephens, 2000) including dynamic visual demonstrations (Kennewell & Beauchamp,
2003); b) classroom management through IWB-generated engagement; and c) the integrated
use of a range of multimedia resources (Ekhami, 2002). After almost a decade of research, student
engagement has received the greatest research interest as students interact with a technological
tool that is considered to be relevant to their understanding.
Interestingly, the use of gestures is a critical component of IWB use. Singer and Goldin-Meadow
(2005) reported that gestures carry a unique learning potential; they found that students were

[GEOGEBRA-NA 2011] June 17-18, 2011
Conference Proceedings Page 16
able benefit from teachers’ use of gesture when the strategy conveyed through gesture differed
from the strategy conveyed through speech. Broaders, Cook, Mitchell, and Goldin-Meadow
(2007) found that students encouraged to use gestures were more likely to be cognitively
receptive to future mathematics learning than those not encouraged to use gestures. Given that
much of the input on an IWB directly employs one’s hands and fingers, the potentially unique role
of gestures within the interactive environment of IWB technologies is worth examining.
A key concern noted in recent research by Slay, Sieborger and Williams (2008) is that teachers are
not given sufficient supports to integrate this new technology with inquiry-based mathematics
pedagogy. During the familiarization phase, the IWB is used as a static device and little evolution
of teaching practice is taking place. Inevitably, while teachers learn to use the IWB as an
instructional tool, the lesson focus returns to the teacher (Holmes, 2009) including interruptions to
the flow of lessons and/or student thinking while teachers and students troubleshoot.
Nonetheless, there is a common thread in the research literature indicating that IWB use has the
potential to reinforce lesson participation and peer interactivity within classrooms, but more
importantly, that effective IWB use begins with the teacher and their Technological Pedagogical
Content Knowledge (TPCK) (Holmes, 2009). Our goal in this study was to explore the research
question: What does effective use of the IWB look like in the mathematics classroom?
Methods
Video data and field notes in two classrooms, as well as interviews with students and teachers
were collected over nine months. After initial reviewing of all data sets, the data were grouped
into 3 broad categories: Positive learning episodes with the IWB (239 episodes), negative learning
episodes with the IWB (78 episodes) and neutral moments (8 episodes). Researchers then
developed criteria for analyzing video, of what constituted a significant teaching and learning
moment with the IWB. The criteria for selection were: clarity of visual and audio of episodes and
instances where IWB use was most active.
Episodes that met the above criteria were then coded. All codes were counted and subsequently
clustered into two natural groups: (i) Illustrations of thinking using IWB tools and (ii) justifications and
communication of mathematics ideas using the IWB (see Table 1).

June 17-18, 2011 [GEOGEBRA-NA 2011]
Conference Proceedings Page 17
Table 1. Significant teaching and learning moments from the 3 primary data sources
CODE COUNTS of Significant Teaching
and Learning Moments
Field Notes Interview Video
Illustration of Thinking Using Tools 208 272 4:11:47
Use of Tools (UT) 107 165 1:47:59
Justifications of Solutions using Tools (JST) 41 57 1:18:49
Consolidation of Ideas using Tools (CIT) 60 50 1:04:59
Benefits of Pairs Work (& Whole Grp) 128 167 2:01:03
Multiple Solutions at IWB(MSP) 41 62 54:19
Risk-taking at IWB (RTP) 29 26 27:10
Efficiency of IWB (EP) 58 79 39:34
Total Counts 336 439 6:12:50
A third cluster of analysis was exclusive to video data: the use of gestures with the IWB that
mediated understanding. For this analysis, four short episodes from the full video data set were
selected to explore and illustrate the role of gestures within IWB-mediated mathematics learning.
Findings and Discussion
The most robust finding in our study was that the Interactive Whiteboard supported teacher and
student communication of their mathematics thinking when they used the tools available.
Students working at the IWB would often use the statements such as “let me show you”. The use of
IWB tools, such as dragging an angle measuring tool from the IWB gallery onto the screen for large
screen use, enabled efficient and visually explicit explanations. In particular these tools enabled
student justifications of ideas, and consolidation of mathematics concepts. When given the
opportunity to use the tools, students were observed being consistently engaged, asking
deep/productive questions that challenged their peers, and generating rich discussion that
moved the learning forward.
Analysis also showed that the most effective instances of IWB use occurred when students were
encouraged to work together in pairs and in some whole group scenarios. Pairs of students
working at the IWB were observed as focused, taking risks, and often challenging their partners’
thinking when looking for solutions; in contrast with students at their desks in these same lessons
who took less risks and engaged in less mathematical debate during discussions. Whole group
learning at the IWB was similarly powerful in that it provided the teacher with an opportunity to use
the dual-screen tool to showcase two student IWB work samples simultaneously for discussion and
[GEOGEBRA-NA 2011] June 17-18, 2011
Conference Proceedings Page 18
debate. The data illustrate that during these episodes, students became responsible for
generating discussion in a community of learners. Student interview data confirmed that the ability
to see a variety of IWB generated solutions at once was powerful for deepening student
understanding. “It showed their work and everyone else could come up and share their work and
you could compare the two and it could help you learn multiple ways of seeing something”
(Student, June 20, 39-41).
Gestures were used by students and their teachers in a variety of contexts to communicate a
broad scope of information. All but one of the gestures observed were employed by both the
teacher and the students and there were several instances where the use of gestures by one
member of the classroom prompted further use of gestures by others. For example, in representing
360°, the teacher used her index finger to trace out a complete circle in front of her students. In
this and other cases, the teacher and her students also employed the IWB to complement their
use of gesture.
While the design of this study was not intended to reveal causal relationships, the data suggests
the ability of gesture to support and facilitate learning in the presence of an IWB. Throughout the
episodes, students employed gestures to communicate and further their mathematical reasoning
in several ways. In the first episode, gesture was used to communicate the properties of solids by
representing faces and their relationships. In the second episode, tools on the IWB and their
associated gestures for rotation helped a pair of students classify solids according to their bases.
Also in this episode, a student used a gesture to communicate the shape of a figure on the IWB
prior to describing its shape in words. This phenomenon recurred in the third episode when a
student used a gesture, in the absence of words, to communicate a line graph. In the final
episode, the teacher employed gestures as a vehicle to relate multiple representations of an
angle drawn on the IWB. These examples illustrate that gesture can be an actively used and an
effective tool to support an IWB-mediated learning environment.
Nonetheless, a number of limitations emerged. For example, students became frustrated with the
layering of objects within the IWB software. The students in one episode particularly struggled with
this issue when they moved shapes into their constructed Venn diagram, only to find that object
no longer ‘selectable’ due to the order of objects in layers. Although this limitation resurfaced
repeatedly, most students were able to circumvent this by using the ‘lock’ feature to secure the
position and layering of one or more objects on the screen. A number of other limitations and
negative examples will be further discussed in the full paper and at the conference. The research
presentation will feature videos clips of observed lessons, student and teacher interviews, along
with summaries of results. Participants will be asked to evaluate one or two significant teaching

June 17-18, 2011 [GEOGEBRA-NA 2011]
Conference Proceedings Page 19
and learning moments with analysis tools in order to generate discussion about the strengths and
perils of IWB use in mathematics.
References
Broaders, S.C., Cook, S.W., Mitchell, Z. and Goldin-Meadow, S. (2007). Making Children Gesture Brings Out Implicit Knowledge and Leads to Learning. Journal of Experimental Psychology, 136(4), 539–550.
Ekhami, L. (2002). The power of interactive whiteboards. School Library Media Activities Monthly, 18(8), 35-38.
Holmes, K., (2009). Planning to teach with digital tools: Introducing the interactive whiteboard to pre-service secondary mathematics teachers. Australasian Journal of Educational Technology, 25(3), 351-365.
Kennewell, S. and Beauchamp, G. (2003). The influence of a technology-rich classroom environment on elementary teachers' pedagogy and children's learning, in Young Children and Learning Technologies, (eds. J Wright, A McDougall,J Murnane and J Lowe). Sydney: Australian Computer Society, 65-70.
Singer, M.A. and Goldin-Meadow, S. (2005). Children Learn When Their Teacher’s Gestures and Speech Differ. Psychological Science, 16(2), 85-89.
Slay, H., Sieborger, I., & Hodgkinson-Williams, C. (2008). Interactive whiteboards: Real beauty or just “lipstick”? Computers and Education, Volume 51, Issue 3, 1321-1341.
Stephens, C. D. (2000) Forget the sailboard—let’s go whiteboarding!, Dental Update, 27(5), 236–240.
Return to the Table of Contents

[GEOGEBRA-NA 2011] June 17-18, 2011
Conference Proceedings Page 20
MATHEMATICAL PROBLEM SOLVING IN DYNAMIC LEARNING ENVIRONMENTS:
THE CASE OF GEOGEBRA
Linggou Bu1, Erhan Selcuk Haciomeroglu2, Frackson Mumba3
1,3,Southern Illinois University, Carbondale, Illinois, USA. 2University of Central Florida, Florida, USA
[email protected], [email protected], [email protected]
Abstract
Emerging dynamic mathematics software supports mathematics learning environments that are rich in multiple representations, modeling and simulation tools, computational utilities, and pedagogical innovations. These resources provide new opportunities for and challenges to mathematical problem solving. Grounded in existing literature on mathematical problem solving, this article presents heuristic strategies that are specifically applicable when students engage in meaningful mathematical problem solving using the open-source software GeoGebra or similar technologies. These strategies, illustrated with specific problems, include exploring and planning, understanding dependency, working backwards, guessing and checking, and managing complexity.
Introduction
Mathematical problem solving is a complex process. In solving a problem, students need to
coordinate a variety of resources, heuristics, and self-regulation skills (Polya, 1945/2004;
Schoenfeld, 1985). Meanwhile, their problem solving efforts are constrained and supported by the
specific context, their belief system, and their mathematical world view (Schoenfeld, 1985, 2008).
Emerging interactive mathematics learning technologies provide dynamic multiple
representations, computational utilities, and modeling mechanisms that can be pedagogically
beneficial in facilitating students’ problem solving efforts. Among such technologies is the open-
source learning environment GeoGebra (www.geogebra.org), which integrates algebra,
geometry, and calculus packages in a connected system of mathematical content and
pedagogical tools (Hohenwarter & Hohenwarter, 2009). In such technology-based dynamic
environments, traditional problem solving strategies are generally informative but are not
adequate in supporting student-initiated problem exploration and construction. The dynamic
nature of problem representation and learner control provides both new opportunities for and
new challenges to meaningful problem solving and the effective teaching of problem solving. For
instance, in a dynamic environment, students can explore ready-made mathematical models to
identify invariant relations in a problem situation; furthermore, they can create their own

June 17-18, 2011 [GEOGEBRA-NA 2011]
Conference Proceedings Page 21
mathematical models to address a problem situation or modify and extend existing ones as a way
to learn about the underlying mathematical structure.
Informed by existing literature on problem solving and, especially, a model-centered perspective
on problem solving (Lesh & Doerr, 2003), we discuss through examples a few heuristics, or rules of
thumb, that are of primary importance for solving problems using GeoGebra—exploring and
planning, understanding dependency, working backwards, guessing and checking, and
managing complexity. These strategies may be generally helpful in the case of similar
mathematics learning technologies.
Heuristic Strategies
Exploring and Planning
In a dynamic mathematics learning environment, it is possible and pedagogically necessary to
have students explore the mathematical ideas. Such explorations can help students understand a
problem and/or its components, get acquainted with the resources at hand, and further establish
a plan of action. Such a plan will not only help students construct a tentative solution, but also will
serve as a point of reflection (Polya, 1945). Among the major affordances of dynamic
mathematics are representational flexibility and interactivity, which provide potential insight into
the problem situation with instant feedback to students through on-screen invariant patterns and
graphic and/or algebraic updates. Frequently, students tend to expect, unrealistically, such a plan
to arise from the dynamic technology environment, although such planning should be an essential
part of their problem solving efforts and thus must be a result of their mathematical reasoning in
relation to the problem. Therefore, as the first heuristic strategy, we recommend that students
develop an explicit action plan, albeit inadequate initially, before they start to solve a given
problem. There is much more involved in the process of planning a solution, which we discuss in
the following sections.
For example, as students attempt to show that the area of a triangle can be uniquely determined
by its base and its altitude, we could start by asking them to construct and play with an arbitrary
triangle, identifying a base and the corresponding altitude. We found that many students were
not aware of the meaning of arbitrary in a mathematical context, although it is an important
aspect of dynamic mathematical constructions. This interactive exploration of triangles will help
students recall facts, clarify related concepts, appreciate the underlying mathematical relations,
and set the stage for higher levels of reasoning. In making a plan to solve the problem, we suggest
that students first start with a fixed base; second, find a way to fix the altitude (such as placing the
third vertex on a line parallel to the base); third, make a triangle and measure its area; fourth,
change the specific shape of the triangle without changing the base or the altitude by shifting the
[GEOGEBRA-NA 2011] June 17-18, 2011
Conference Proceedings Page 22
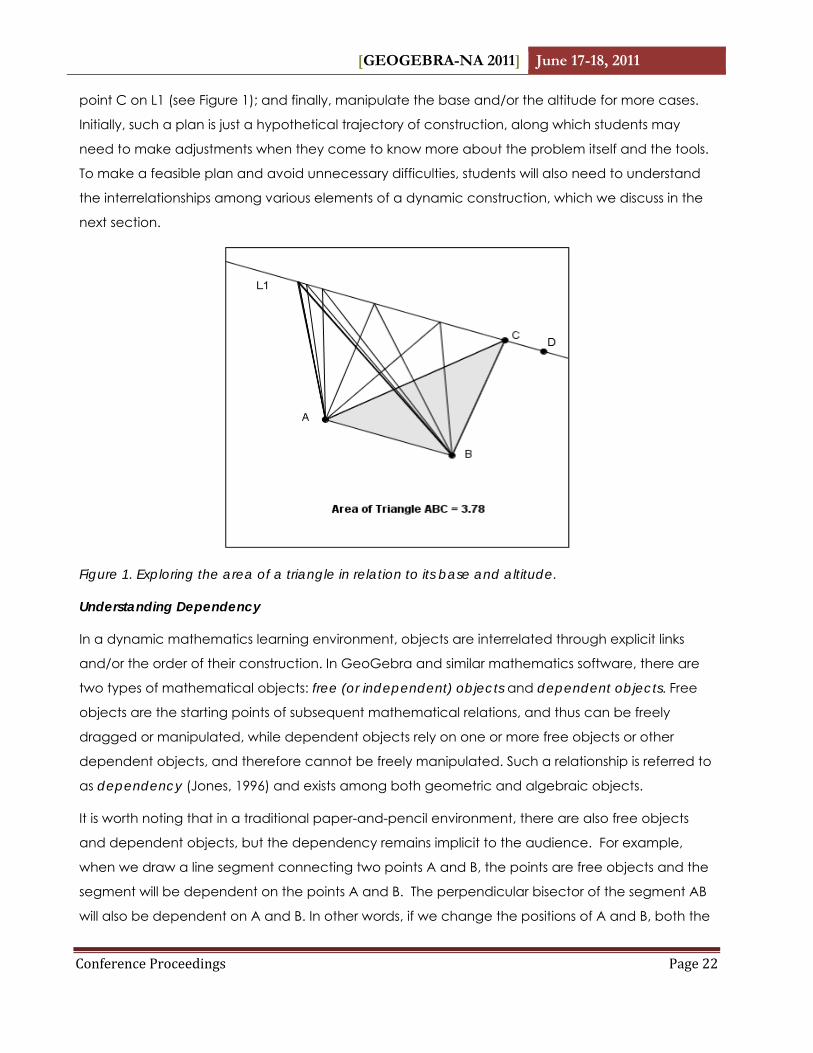
point C on L1 (see Figure 1); and finally, manipulate the base and/or the altitude for more cases.
Initially, such a plan is just a hypothetical trajectory of construction, along which students may
need to make adjustments when they come to know more about the problem itself and the tools.
To make a feasible plan and avoid unnecessary difficulties, students will also need to understand
the interrelationships among various elements of a dynamic construction, which we discuss in the
next section.
Figure 1. Exploring the area of a triangle in relation to its base and altitude.
Understanding Dependency
In a dynamic mathematics learning environment, objects are interrelated through explicit links
and/or the order of their construction. In GeoGebra and similar mathematics software, there are
two types of mathematical objects: free (or independent) objects and dependent objects. Free
objects are the starting points of subsequent mathematical relations, and thus can be freely
dragged or manipulated, while dependent objects rely on one or more free objects or other
dependent objects, and therefore cannot be freely manipulated. Such a relationship is referred to
as dependency (Jones, 1996) and exists among both geometric and algebraic objects.
It is worth noting that in a traditional paper-and-pencil environment, there are also free objects
and dependent objects, but the dependency remains implicit to the audience. For example,
when we draw a line segment connecting two points A and B, the points are free objects and the
segment will be dependent on the points A and B. The perpendicular bisector of the segment AB
will also be dependent on A and B. In other words, if we change the positions of A and B, both the

June 17-18, 2011 [GEOGEBRA-NA 2011]
Conference Proceedings Page 23
segment AB and its perpendicular bisector will change accordingly. However, such relations are
not so significant pedagogically in a traditional setting or on paper. By contrast, in a dynamic
environment, the idea of dependency is crucially important for students to manipulate initial
conditions of a problem and draw general conclusions. In general, any mathematical
construction, including its multiple representations, is a web of dynamic relations, which, on the
one hand, are the foundation for open-ended exploration, and on the other, new mathematical
relations to be mastered by students. Students must come to understand the dependencies in a
problem solving situation in order to devise an effective plan of action. To solve a problem,
therefore, one must understand its dependencies, which, once again, are a critical part that calls
for mathematical reasoning on the part of the problem solver.
Referring to the triangle area problem (Figure 1), there are three free objects: Points A, B, and D.
Points A and B determines the base; point D sets the altitude. The line L1 goes through point D and
is parallel to segment AB, and is thus dependent on points A, B, and D. Point C is dependent on
line L1, and thus can move freely on L1. There are other solutions to the triangle problem. For
example, one does not have to use a parallel line to constrain the altitude. Nonetheless, similar
dependencies exist and are crucial to building a dynamic construction to model and then solve a
problem.
As a second example, we look at the following problem: Mary looks at herself in a plane mirror
and she wonders why her feet in the mirror seem to be at the same distance to the mirror as her
real feet. A direct modeling method could be used to solve Mary’s problem, given the fact that if
she sees her feet in the mirror, there has to be some light going from her feet to the mirror and then
bouncing back to her eyes. As shown in Figure 2, the construction could start with points A and B,
which define the mirror line L1. Point C represents the position of the eye. Realistically, the eye is
rather a ball than a mathematical point. Thus, we can draw a circle of a certain radius to
represent the eye. Since the person should stand in parallel to the mirror, we could draw a line L2
through point C that is parallel to line L1. L2 represents Mary and point D represents the position of
her feet. Note that points A, B, C, and D are all free objects, which set up the mirror and the
distance between the mirror and the person.

[GEOGEBRA-NA 2011] June 17-18, 2011
Conference Proceedings Page 24
Figure 2. How light travels from the object to the eyes.
A light ray from the feet (point D) reaches the mirror and is reflected at some point on line L1. For
that purpose, we pick a point F on line L1. Thus, point F is dependent and can be freely moved on
the line L1. Subsequently we draw a segment DF for a light ray that goes from point D to the mirror
at point F. Segment FD’ is the reflected light ray corresponding to DF. To the eye, the image of the
feet (point D) should be on the extension of D’F. Therefore, we draw a line connecting D’ and F as
shown by the dotted line (Figure 2).
With the dependencies resolved, we can solve Mary’s problem. If there was only one ray of light
that leaves the feet and is bounced to the eye, then the eye could not uniquely locate the image
of the feet. However, in reality, there are always multiple rays of light that are reflected to the eye.
By dragging point F on line L1 and tracing the dotted line as shown in Figure 2, we could uniquely
locate the image of the feet by a process called triangulation. A mathematical proof of the
distances can be established by citing congruent triangles. There are, of course, other ways to
identify and establish the dependencies, which will affect the subsequent explorations and
conclusions.
Establishing dependencies in a GeoGebra construction is virtually synonymous to problem solving
and calls for extensive problem analysis, including trials and errors. It is in the process of establishing
dependencies that a student comes to understand the problem better and further develop a
plan of action, which may further help him/her establish the dependencies. Such a process of
problem solving is iterative in nature. The tools available in GeoGebra facilitate that process and
offer an environment full of interactivity and prompt feedback.

June 17-18, 2011 [GEOGEBRA-NA 2011]
Conference Proceedings Page 25
Working Backwards
In working backwards, we assume that we know the solution to a given problem and then work
back step by step to build the relationships between the solution and the given conditions, or, in
other words, to establish the dependencies among the various components of a solution. It is one
of the most powerful heuristics in problem solving, especially in geometric constructions (Polya,
1945/2004). One classic problem is to construct a parabola from its definition—a collection of
points that are equidistant from a given point (the focus) and a given line (the directrix). The
definition is easy to understand, but does not tell us how to construct such a curve. To develop a
plan, we could assume that we have a solution already and work backwards. As shown in Figure
3, if point P is a point on the parabola, then it is equally distant to the directrix L1 and the focus F.
To find such distances, we connect points P and F and draw a line L2 through P that is
perpendicular to L1. Line L2 and line L1 intersect at point D. That, however, does not uniquely
determine point P. Further analysis reveals that point P is on the perpendicular bisector of segment
DF. Therefore, we make segment DF and its bisector.
The analysis above produces a series of dependent elements and leads to a plan of action for
constructing a parabola from its definition. We now work backwards: Starting from the directrix L1,
we pick a point D on it, and then draw a line L2 that is perpendicular to L1 at point D. We further
connect points D and F and construct the perpendicular bisector L3 of segment DF. The
intersection of line L2 and line L3 is the corresponding point P on the parabola. Since point D is
movable on line L1, we could drag point D along L1 to trace the whole parabola.
Figure 3. Developing a plan for constructing a parabola by working backwards.

[GEOGEBRA-NA 2011] June 17-18, 2011
Conference Proceedings Page 26
In working backwards, students could identify the intrinsic relationships or dependencies that
constitute a parabola and further work out an action plan. In carrying out their plan, they can
confirm, modify, or reject their emerging conceptions, where the dynamic environment provides
instant feedback and tools for exploration and reflection.
Guessing and Checking
A mathematical problem is relative in nature. What is a problem to some students may be only an
exercise or a direct recall of previous schemes of action to others. When solving a genuine
problem, most students tend to work out an intuitive guess based on their prior knowledge and the
surface structure of the problem (Willingham, 2009). Although such a guess may indeed be the
correct answer, it is, more frequently, an indicator of their prior knowledge or even their
misconception of a certain domain of mathematics (Ryan & Willams, 2007). In either case, such
guesses, which are somehow plausible to problem solvers, must be addressed pedagogically in
order to engage students in seeking a meaningful perspective on the problem. Polya contends
that “if the learning of mathematics reflects to any degree the invention of mathematics, it must
have a place for guessing, for plausible inference” (1954, p. v). In a dynamic environment like
GeoGebra, guessing and checking is an important strategy to explore the problem, clarify the
conditions, understand the problem, and ultimately conceptualise some actions or processes that
are appropriate for solving the problem.
As an example, consider the following scaling problem. If we start with a plane figure such as a
triangle or rectangle and then double, triple, or quadruple the length of each side, how does its
area change, respectively? Many students tend to have a persistent intuitive reaction to the
problem, guessing that the area will double, triple, or quadruple accordingly. In a dynamic
environment, such guesses can be easily checked using the dilation tool, followed by other in-
depth explorations. In Figure 4, for example, Triangle ABC is dilated by a linear factor (scaleFactor),
which controls the amount of linear scaling. Point P is the ordered pair (linear factor, area factor).
As can be seen, the area is quadratically related to the linear measures. Further, students could
also take a guess at the effect of a negative scaling factor such as −2 on the resulting figure and
its area.

June 17-18, 2011 [GEOGEBRA-NA 2011]
Conference Proceedings Page 27
Figure 4. How does the area of plane figure change as it is dilated?
Because of the open-ended nature of dynamic environments, guessing and checking plays a
pedagogically meaningful role in sustaining students’ active mathematical thinking. As students
take guesses at the problem solution and check the validity of such guesses, they will continue to
learn about the problem itself and their own mathematical conceptions, identify the essential
dependencies and develop a plan of action. Just as Polya (1981) points out, “[a]s the work of the
problem solver progresses, the face of the problem continually changes” (v2, p. 89). Furthermore,
students could learn to pose new problems on the basis of their explorations to themselves or their
peers in order to participate in internal conversations or social interactions.
Managing Complexity
Mathematical problem solving is a complex process, as discussed previously. On the one hand,
the problem itself may be intrinsically complex, involving multiple components and their
interrelations, which increases the cognitive load for students; on the other hand, the problem
solver may have limited or incomplete knowledge about the problem or the resources in the
dynamic environment and thus may face special cognitive challenges arising from the
mathematical and technological aspects of the dynamic environment (Yoon, Thomas, & Dreyfus,
2009). In solving a problem using GeoGebra, it is important to manage both aspects of learning
complexity and engage students in integrated and whole-task learning (Foshay, Silber, & Stelnicki,
2003; Milrad, Spector, & Davidsen, 2003).
To activate or enrich students’ prior knowledge of the problem, we could allow them to use
existing tools or provide them with ready-made dynamic worksheets for part-tasks or subproblems.
For example, if the concept of slope is used in a comprehensive problem, students could use the

[GEOGEBRA-NA 2011] June 17-18, 2011
Conference Proceedings Page 28
slope tool to find the slope of a function at a certain point. Similarly, if the Pythagorean Theorem is
to be used in another problem, students could be provided with a ready-made worksheet to
review the properties of a right triangle.
During the process of problem solving, the computer screen may get crowded with various
intermediate objects. Such objects, if not essential to the subsequent steps, could be hidden
behind the visible objects. For example, when we extend a segment in both directions, the original
segment could be hidden to allow the learner to focus on the resulting line. If necessary, hidden
objects can be made visible by referring to their algebraic representations in the system.
In helping students manage complexity, the teacher could provide half-completed worksheets as
scaffolding for them to complete the whole task. Alternatively, user-defined button tools could be
created to simplify or facilitate future operations. For example, if we want to trisect each side of a
triangle for another instructional goal, we need to know how to trisect a segment and then repeat
the same procedure three times, which could make the process unnecessarily tedious and visually
confusing. In fact, we would trisect any segment, and then use the input and output of that
procedure to define a TrisectSegment tool and then use the tool to trisect any segment (see Figure
5).
Finally, the complexity of a problem could be managed by using multiple representations in a
dynamic way that allows automatic synchronization. For example, as students explore quadratic
functions of the form, , we could present the functions in three different
representations: an algebraic function, a geometric graph, or a tabular mapping. Further, these
three representations could be dynamically linked; when one is changed, the other forms will be
updated automatically without direct user input.
cbxaxxf ++= 2)(

June 17-18, 2011 [GEOGEBRA-NA 2011]
Conference Proceedings Page 29
Figure 5. Managing complexity using a user-defined tool: the case of trisecting segments.
Conclusion
Mathematical problem solving is a challenging process, involving careful coordination of
resources and heuristic strategies. In solving a genuine problem, students would be necessarily
going through three stages: exploring and understanding the problem, verbalizing and formalizing
the problem using multiple representations and mathematical models, and ultimately assimilating
this experience into their whole mental outlook on mathematics (Polya, 1981). In a pedagogical
sense, as students construct increasingly abstract models of the problem situations, they are also
building their identity as persistent and skilful problem solvers (Goldin, 2007).
In this article, we discussed a few heuristic strategies that are helpful in solving problem in a
dynamic environment like GeoGebra: exploring and planning, understanding dependency,
working backwards, guessing and checking, and managing complexity. Although all of these
strategies are applicable in traditional instruction, they take on more generative roles in a dynamic
resource-rich environment, especially understanding dependency and managing complexity.
Dynamic mathematics learning environments like GeoGebra afford a variety of technological
tools and dynamic multiple representations that can potentially facilitate students’ problem
exploration, computation, construction, modeling, and reflection. It is worth noting that the
heuristic strategies we discussed here are general guidelines for solving problems using new
mathematics learning technologies, the specific actions needed to solve a problem tend to come
from an integrated perspective on both the mathematical content and technological tools (Doerr
& Pratt, 2008). As we learn more about students’ mathematical behaviour in such dynamic
environments, these strategies should be refined and enriched with empirical evidence. Our

[GEOGEBRA-NA 2011] June 17-18, 2011
Conference Proceedings Page 30
teaching experiments with pre-service student teachers have been successful, and we invite
classroom teachers at all levels to try these pedagogical tools in their teaching practice and build
students’ mathematical competence by providing them with active mathematical experiences
and especially mathematical modeling activities (Lesh & Doerr, 2003).
References
Doerr, H. M., & Pratt, D. (2008). The learning of mathematics and mathematical modeling. In M. K. Heid & G. W. Blume (Eds.), Research on technology and the teaching and learning of mathematics: Research Syntheses (Vol. 1, pp. 259-285). Charlotte, NC: Information Age Publishing.
Foshay, W. R., Silber, K. H., & Stelnicki, M. B. (2003). Writing training materials that work: How to train anyone to do anything. San Francisco, CA: Jossey-Bass/Pfeiffer.
Goldin, G. A. (2007). Aspects of affect and mathematical modeling processes. In R. A. Lesh, E. Hamilton & J. J. Kaput (Eds.), Foundations for the future in mathematics education (pp. 281-299). Mahwah, NJ: Lawrence Erlbaum Associates.
Hohenwarter, J., & Hohenwarter, M. (2009). Introducing dynamic mathematics software to secondary school teachers: The case of GeoGebra. Journal of Computers in Mathematics and Science Teaching, 28, 135-146.
Jones, K. (1996). Coming to know about 'dependecny' within a dynamic geometry environment. In L. Puig & A. Gutiérrez (Eds.), Proceedings of the 20th Conference of the International Group for the Psychology of Mathematics Education: Vol. 3. (pp. 145-152): University of Valencia.
Lesh, R., & Doerr, H. M. (2003). Foundations of a models and modeling perspective on mathematics teaching, learning, and problem solving. In R. Lesh & H. M. Doerr (Eds.), Beyond constructivism: Models and modeling perspectives on mathematics problem solving, learning, and teaching (pp. 3-33). Mahwah, NJ: Lawrence Erlbaum Associates.
Milrad, M., Spector, J. M., & Davidsen, P. I. (2003). Model facilitated learning. In S. Naidu (Ed.), Learning and teaching with technology: Principles and practices (pp. 13-27). London: Kogan Page.
Polya, G. (1945/2004). How to solve it: A new aspect of mathematical method (2nd ed.). Princeton, NJ: Princeton University Press.
Polya, G. (1954). Induction and analogy in mathematics: Volume I of mathematics and plausible reasoning. Princeton, NJ: Princeton University Press.
Polya, G. (1981). Mathematical discovery: On understanding, learning, and teaching problem solving (Combined ed.). New York: John Wiley & Sons.
Ryan, J., & Willams, J. (2007). Children's mathematics 4-15: Learning from errors and misconceptions. New York: Open University Press.
Schoenfeld, A. H. (1985). Mathematical problem solving. Orlando, FL: Academic Press.
Schoenfeld, A. H. (2008). Mathematics for understanding. In L. Darling-Hammond, B. Barron, P. D. Pearson, A. H. Schoenfeld, E. K. Stage, T. D. Zimmerman, G. N. Cervetti & J. L. Tilson (Eds.), Powerful learning: What we know about teaching for understanding (pp. 113-150). San Francisco, CA: Jossey-Bass.

June 17-18, 2011 [GEOGEBRA-NA 2011]
Conference Proceedings Page 31
Willingham, D. T. (2009). Why don't students like school? A cognitive scientist answers questions about how the mind works and what it means for your classroom. San Francisco, CA: Jossey-Bass.
Yoon, C., Thomas, M. O. J., & Dreyfus, T. (2009). Gestures and virtual space. In M. Tzekaki, M. Kaldrimidou & H. Sakonidis (Eds.), Proceedings of the 33rd Conference of the International Group for the Psychology of Mathematics Education: Vol. 5. (pp. 409-416). Thessaloniki, Greece: PME.
Return to the Table of Contents

[GEOGEBRA-NA 2011] June 17-18, 2011
Conference Proceedings Page 32
GEOGEBRA AS A PEDAGOGICAL TOOL: A PRELIMINARY TAXONOMY
Lingguo Bu1, Frackson Mumba2, Yazan Alghazo3 1,2,3Southern Illinois University, Carbondale, Illinois, USA. [email protected], [email protected], [email protected]
Abstract
GeoGebra provides a resourceful toolkit for mathematics educators to reflect on their teaching practice and further develop new ways to connect, extend, and enrich their instructional activities. Under the theoretical framework of model-centered learning, we reflect on our field experience with GeoGebra-integrated mathematics teacher development and propose a preliminary taxonomy for the pedagogical uses of GeoGebra in mathematics teacher education. We use a specific modeling problem as an example.
Keywords: Pedagogical reflection, instructional design, teacher education
Introduction
GeoGebra (www.geogebra.org) provides an accessible mathematics learning environment that
integrates multiple mathematical representations, computational utilities, and documentation
tools. Within GeoGebra, not only are the various representations automatically linked, they can
also be dynamically manipulated to illustrate or simulate the dynamic nature of mathematical
ideas. In alignment with our growing knowledge about mathematical understanding and its
complexity in terms of multiple representations and dynamic mental models (Carpenter & Lehrer,
1999; Goldin, 2003; Hiebert & Carpenter, 1992; Moreno-Armella, Hegedus, & Kaput, 2008; Seel,
2003), GeoGebra stands as an equitably accessible digital environment that appeals to
mathematics educators and students at all levels as they strive to promote mathematical sense-
making and deep understanding. Furthermore, from a tool use perspective (Vygotsky, 1978), while
GeoGebra is, in most cases, used initially by mathematics educators as a technical tool to support
teaching and learning, it gradually evolves, first, into an psychological tool or an instrument that
facilitates a teacher’ instructional plans and strategies, and, further, into a pedagogical tool that
facilitates a teacher’ classroom practice in many aspects of mathematics teaching. In this paper,
we reflect on our own experience with the integration of GeoGebra in both preservice
mathematics teacher education and inservice professional development programs across a
period of three years. We assume the role of teacher educators, upholding the position that
teacher educators themselves are reflective learners in both preservice and inservice programs.
We believe that the emerging GeoGebra user community is indeed a group mathematics

June 17-18, 2011 [GEOGEBRA-NA 2011]
Conference Proceedings Page 33
teachers and students who are not only actively inventing and experimenting new ways of
mathematics teaching, but are themselves learning or relearning about the mathematics. As
Freire argues convincingly:
There is, in fact, no teaching without learning. One requires the other. . . . Whoever teaches learns in the acting of teaching, and whoever learns teaches in the act of learning. (Freire, 1998, p. 31)
As a focus, we discuss the pedagogical roles of GeoGebra in our preservice and professional
development field work. The term pedagogy refers to the ways of teaching under a certain
theoretical framework for teaching and learning. In what follows, we present an overview of a
model-centered framework for teaching mathematics using GeoGebra, followed by an illustrative
example and a tentative taxonomy of the pedagogical roles of GeoGebra.
Theoretical Framework
To foster mathematics teachers’ growth in teaching mathematics with new digital technologies,
we situated our instructional design and its enactment in the theoretical framework of multiple
representations (Goldin, 2003) and Model-Facilitated Learning (MFL) (Milrad, Spector, & Davidsen,
2003)). The theory of multiple representations has served as the foundation for the reform-based
conception of mathematical understanding (Hiebert & Carpenter, 1992). A mathematical
representation refers to both the cognitive process and the external product of mathematical
reasoning, taking on such forms as graphs, algebraic expressions, and various informal diagrams or
tables. From the learning perspective, the use of multiple representations contributes to the
resolution of intrinsic ambiguities within the representation system (Goldin, 2003), leading to the
ultimate reification of a mathematical concept as a mathematical object (Sfard, 1991, 1994) .
Furthermore, recent conceptions of mathematical understanding have placed much emphasis on
a learner’s ability to use and navigate through multiple representations, which, theoretically
speaking, indicates a learner’s knowledge of the mathematical processes and the corresponding
conceptual structure in the form of dynamic conceptual and mental models (Doerr & Lesh, 2003;
Gravemeijer, 2008; Seel, 2003).
However, effective instructional design in mathematics requires more than multiple
representations. In developing instructional sequences, we were further informed by the MFL
framework (Milrad et al., 2003), which seeks to promote meaningful learning and deep
understanding by fostering learners’ development of a holistic view of a complex problem
situation. The MFL framework consists of modeling tools, multiple representations, and system
dynamics methods that allow learners to build models and/or interact with existing models as part
of their effort to understand the structure and the dynamics of a problem situation. MFL
recommends that learning be situated in a sequence of activities of graduated complexity,
[GEOGEBRA-NA 2011] June 17-18, 2011
Conference Proceedings Page 34
progressing from concrete manipulations to abstract representations while learners are engaged
in increasingly complex problem solving. Through the use of multiple representational tools, MFL
further maintains the transparency of the underlying models that drives the behavior of a system
simulation.
A Mathematical Example
Worthwhile mathematical tasks aligned with elementary (K-8) mathematical standards are at the
core of our GeoGebra-integrated courses and programs. In selecting or designing learning tasks,
we seek open-ended realistic problems that are familiar to our teacher participants and yet
provide unexpected solutions or cognitive conflicts. Many problems are directly from or reviewed
by professional mathematicians. Our overarching goal is to challenge the traditional views of
mathematics held by the majority of our participants and help them develop insights into
mathematical problem solving by engaging them in non-trivial mathematical problem solving and
modeling. In most cases, we expect our teacher participants to develop profound
understandings of elementary mathematical ideas. In accordance with the Dynamic Principle in
teacher development, we believe that “the knowledge that teachers need should move from
understanding relationships that are static to those which are dynamic” (Doerr & Lesh, 2003, p.
135). Mathematical examples include problems such as: a) Given the diagonal of a rectangle,
how could you rebuild a (or the) rectangle? b) If the class measures 20 circular shapes of various
sizes, how could you make sense of the relationships between the circumference and the
diameter? c) A circle is given with no indication of the center, how can you locate its center? All
the problems call for mathematical concept play (e.g., Davis, 2008). In the rectangle problem, for
instance, our preservice teachers came with an unconventional definition of a rectangle: a
quadrilateral whose two diagonals bisect each other and are congruent. One preservice
teacher, in fact, imagined rotating the given diagonal around its midpoint to obtain a rectangle,
thus relating a rectangle to a circle. Such ideas can be readily implemented with GeoGebra with
minimal instructor guidance. There are, indeed, infinitely many such rectangles. As a focus point,
we invite our readers to think about following problem and how GeoGebra may change or
enhance their instructional strategies and practice when the problem is used with a group of
elementary (K-8) mathematics teachers.
As shown in Figure 1, some treasure was buried on the beach at a location determined by a palm
tree and a boulder. To find it, start from the palm tree (P), walk toward the sea for some distance
to some point W. Mark W. Then, go back to the palm tree, at a right angle to PW (clockwise), walk
the same distance toward land and mark a point X. Then, go to the boulder (B), at a right angle

June 17-18, 2011 [GEOGEBRA-NA 2011]
Conference Proceedings Page 35
to BW (counter-clockwise), walk a distance of BW to the land, mark a point Y. Find the mid-point T
between X and Y, which is location of the treasure!
Figure 1. A treasure hunting problem.
Instructional Reflections on the Pedagogical Roles of GeoGebra
Being experienced users of GeoGebra, the instructors are familiar with the potentials of GeoGebra
for teaching the Treasure Problem in the classroom. First, we note that the primary goal of this task
is for our participants to experience genuine mathematical problem solving and what it means to
teach mathematical problem solving. Second, the problem can be solved in a paper-and-pencil
approach, which, of course, has its limitations in addressing what-if and what-if-not questions
(Brown & Walter, 2005). In our practice, we found that it is indeed helpful to have participants try
to solve the problem on paper as a way to understand or even question the problem and to
identify key ideas involved in the problem.
When GeoGebra is brought into the teaching process, however, a variety of pedagogical
possibilities arise. First, from students’ perspective, students can be engaged in mathematical
modeling, problem exploration, and open-ended questioning. They can diagnose their working
model(s) for the problem and make adjustments. They can also claim ownership on their
mathematical construction, including, in most cases, the good mistakes that are naturally part of
learning mathematics.
Second, from a task perspective, the problem takes on new dimensions when GeoGebra is used in
instruction. The problem itself becomes an example from a large, and, in fact, infinite collection or
problem space of similar problems. At many stages of problem solving, there exist alternative
pathways. For instance, to make a 90-degree turn and walk the same distance could be
accomplished by a) the 90-degree rotation of a segment, or b) the construction of a 90-degree
angle followed by a segment of given length, or c) using perpendicular lines and circles (see
Figure 2). The whole problem could be used to invent another problem: If I were to place the
treasure for others to hunt, how can I find its proper location?

[GEOGEBRA-NA 2011] June 17-18, 2011
Conference Proceedings Page 36
Third, from a teacher educator’s perspective, the instructor can design partially completed
worksheets to scaffold and accommodate the diverse needs of students and allow various entry
points to the problem. GeoGebra is also a tool of assessment, allowing the teacher to look into
student teachers’ processes of thinking. More importantly, the instructor can create his or her own
instructional materials in support of his/her own reflection and participation in the local and global
community of mathematics educators. For an example, in the treasure problem, the two right
angles or one of them could be completed for certain students who may have difficulty
coordinating the complex relations in the problem.
Fourth, GeoGebra enhances the learning environment with its multiple representations,
computational utilities, documenting tools, and web-friendly features that extend the scope of
teaching and learning beyond the walls of the classroom. In the treasure problem, both students
and instructors can share their dynamic constructions online through the Blackboard system or
elsewhere. Such dynamic solutions can be further demonstrated, exported, or modified in support
of other learning objectives. Figure 3 shows the underlying mathematical structure of the treasure
problem and where the treasure should be buried to set up the problem. The dynamic
construction can further be used to make conjectures about the problem, the properties of
midpoint T, and congruent triangles (Figure 3). A formal proof may be the next step if so desired.
Based on the above analysis and similar cases in our use of GeoGebra in teacher preparation and
professional development programs, we classify the pedagogical roles of GeoGebra under the
theory of model-centered learning and instruction (Table 1) as a way to make sense of the
instructional uses of GeoGebra and to generate new ideas for teaching mathematics teachers to
use technology.

June 17-18, 2011 [GEOGEBRA-NA 2011]
Conference Proceedings Page 37
Figure 2. A GeoGebra model for the treasure hunting problem.
Figure 3. Where should the treasure be buried if one were to set up the problem? The GeoGebra
model shows that when W moves, the square and point T do not move at all.

[GEOGEBRA-NA 2011] June 17-18, 2011
Conference Proceedings Page 38
Table 1. A Taxonomy of the Pedagogical Roles of GeoGebra in Mathematics Teacher Education
Dimension Pedagogical Roles of GeoGebra
Students
Engaging students in exploring, asking what-if and what-if-not questions Supporting students' decision-making making confirmations, conjectures, drawing conclusions, tweaking problems, or inventing new problems Diagnosing students' working models for math ideas revealing their thinking identifying weak points in knowledge pointing directions for improvement Promoting ownership of mathematics learning/construction/reflection
Tasks
Extending the problem/example space changing initial conditions finding singular or special cases Enabling alternative pathways to problem solving model-based solutions informal arguments, formal proofs
Educators
Supporting reflections on the part of the teacher and teacher educators action, reflection, autonomy, networking (Llinares & Krainer, 2006) Scaffolding to accommodate diverse needs and entry points Networking with the local and international community using existing resources active contribution Relearning about mathematics and present-day students and (student) teachers Promoting ownership of instructional sequences, lessons, and artifacts Assessing students' understanding of mathematics model-based assessment focusing on the processes of problem solving
Environment
Providing multiple representations and simulations Providing computational utilities Providing documenting and organizing utilities graphs, images dynamic worksheets intermediate learning objects interactive whiteboard Reaching beyond the space and time of the class teacher reflection student reflection artifacts for documentation & research

June 17-18, 2011 [GEOGEBRA-NA 2011]
Conference Proceedings Page 39
Conclusion
GeoGebra provides a rich set of resources for teacher educators to enhance and reflection on
their practice in both preservice and inservice mathematics teacher development. In proposing a
tentative taxonomy of the roles of GeoGebra as a pedagogical tool, we are informed by the
basic principles of model-centered learning and instruction, aiming to critically reflect on our own
teaching experience and our use of new dynamic learning technologies in teacher education. As
Shulman (2002) put it, in making the difference, we have tried to make sense of our own
experience. Indeed, as teacher educators who learned much of the mathematics decades ago,
we were relearning or even diagnosing our own understanding of the mathematics we think we
have confidence in teaching. GeoGebra stands as a tool for thought and reflection for
mathematics teachers educators in terms of student learning, teacher learning, and our own
learning as the world changes and brings us new tools, new opportunities, and new challenges. In
closing, we quote Shulman’s view about design and invite all mathematics educators and
technology enthusiast to reflect on GeoGebra-based mathematical modeling and instructional
design: “Design is a matter of exercising understanding, as well as applying skills, under a variety of
constraints and contingencies” (p. 41).
References
Brown, S. I., & Walter, M. I. (2005). The art of problem posing (3rd ed.). Mahwah, NJ: Lawrence Erlbaum Associates.
Carpenter, T., & Lehrer, R. (1999). Teaching and learning mathematics with understanding. In E. Fennema & T. Romberg (Eds.), Mathematics classrooms that promote understanding (pp. 19-32). Mahwah, NJ: Lawrence Erlbaum Associates.
Davis, B. (2008). Is 1 a prime number? Developing teacher knowledge through concept study. Mathematics Teaching in the Middle School, 14(2), 86-91.
Doerr, H. M., & Lesh, R. (2003). A modeling perspective on teacher development. In R. Lesh & H. M. Doerr (Eds.), Beyond constructivism: Models and modeling perspectives on mathematics problem solving, learning, and teaching (pp. 125-139). Mahwah, NJ: Lawrence Erlbaum Associates.
Goldin, G. (2003). Representation in school mathematics: A unifying research perspective. In J. Kilpatrick, W. G. Martin & D. Schifter (Eds.), A research companion to principles and standards for school mathematics (pp. 275-285). Reston, VA: National Council of Teachers of Mathematics.
Gravemeijer, K. (2008). Learning mathematics: The problem of learning abstract knowledge. In J. M. Spector, M. D. Merrill, J. van Merriënboer & M. P. Driscoll (Eds.), Handbook of research on educational communications and technology (3rd ed., pp. 545-549). New York: Lawrence Erlbaum Associates.
Hiebert, J., & Carpenter, T. P. (1992). Learning and teaching with understanding. In D. A. Grouws (Ed.), Handbook of research on mathematics teaching and learning (pp. 65-97). New York: Macmillan.
[GEOGEBRA-NA 2011] June 17-18, 2011
Conference Proceedings Page 40
Llinares, S., & Krainer, K. (2006). Mathematics (student) teachers and teacher educators as learners. In A. Gutiérrez & P. Boero (Eds.), Handbook of research on the psychology of mathematics education (pp. 429-459). Rotterdam: Sense Publishers.
Milrad, M., Spector, J. M., & Davidsen, P. I. (2003). Model facilitated learning. In S. Naidu (Ed.), Learning and teaching with technology: Principles and practices (pp. 13-27). London: Kogan Page.
Moreno-Armella, L., Hegedus, S. J., & Kaput, J. J. (2008). From static to dynamic mathematics: Historical and representational perspectives. Educational Studies in Mathematics, 68, 99-111.
Seel, N. M. (2003). Model-centered learning and instruction. Technology, Instruction, Cognition and Learning, 1, 59-85.
Sfard, A. (1991). On the dual nature of mathematical conceptions: Reflections on processes and objects as different sides of the same coin. Educational Studies in Mathematics, 22, 1-36.
Sfard, A. (1994). Reification as the birth of metaphor. For the Learning of Mathematics, 14(1), 44-55.
Shulman, L. S. (2002). Making differences: A table of learning. Change, 34(6), 36-44.
Vygotsky, L. S. (1978). Mind in society: The development of higher psychological processes. Cambridge, MA: Harvard University Press.
Return to the Table of Contents

June 17-18, 2011 [GEOGEBRA-NA 2011]
Conference Proceedings Page 41
A COLLABORATIVE PEN-BASED PC WORKSPACE FOR TEACHING AND LEARNING MATHEMATICS
Carol Carruthers
Seneca College - Toronto, ON, Canada
Note: This paper on innovative practice and developmental activities touches on many of the
conference themes with the exception of computer technologies for learning/doing
mathematics.
Keywords: pen-based tablet pc’s, interactive software, collaborative workspace, synchronous
mathematical investigation, development of curriculum materials, teaching through exploration
Students entering post-secondary mathematics courses may be considered ‘marginalized’ for
multiple reasons: previous credentials do not meet entry standards, cultural/language barriers
prevent deep understanding, length of absence from formal education, lack of self-confidence or
early abandonment due to rigour of subject matter. Without a strong framework to build from,
students who are weak in mathematics may be at a significant disadvantage if career interests lie
in applied science or engineering technology fields. Instead of mathematics becoming a
gatekeeper subject, many higher education institutions have developed fundamental courses to
provide a pathway for students to strengthen their understanding and confidence while
enhancing communication, critical thinking and problem solving skills.
Many instructors teach mathematics in the same way they were taught. Traditional methodology
has classroom time spent writing problems on the board, students copying into notebooks, limited
interaction/class discussion, followed by textbook homework. Foundational teams seek to provide
an innovative approach to the teaching and learning of mathematics – a methodology that more
closely resonates with the way students of today prefer to learn. At the college studied, the aim is
to increase the integration of technology into all aspects of teaching mathematics and to
develop a student-centered community learning model.
As this common foundational mathematics course is taught across schools ranging from applied
science to electrical engineering technology, a compilation of notes that can be made available
to students through a learning management system (LMS) was required. These e-notes represent a
summation of the wealth of knowledge available from the multiple disciplines and experiences of
both new and seasoned teachers. This material provided the scaffolding which individual
instructors tailored to suit the technical requirements of their discipline while at the same time
ensuring all students received a common level of mathematics understanding. Prior to the class,

[GEOGEBRA-NA 2011] June 17-18, 2011
Conference Proceedings Page 42
the notes were posted to the LMS, which students downloaded and brought with them. Instead of
the traditional lecture style of content transfer, more in-class time was devoted to discussion and
determination of comprehension. Although a valuable first step, this asynchronous transfer of
information only provided a more efficient mechanism of delivering content. While this
methodology required students to be more responsible for pre-class preparation, the additional
budget strain of printing notes became prohibitive for some students. Further, it fell short of the
goals of the teaching team to increase student engagement, enhance student learning and
ability to apply concepts, and to demonstrate an innovative teaching process throughout the
college/math/technology/outreach community.
In the fall of 2008, the team received a Hewlett-Packard Higher Education Technology for
Teaching Grant. The grant provided 21 pen-based tablet pc’s, sufficient to develop a pilot
research study to investigate use in the classroom. The advantage of having this technology for
teaching and learning mathematics was immediately realized. The pen (stylus) allows teachers
and students to write math formulations in a familiar way, in contrast to the keyboard restrictions
that are encountered when typing on a conventional laptop/desktop device. Aside from some
initial awkwardness of learning to write on a screen, students adapted quickly, and soon realized
the annotation advantages, including erasing, that an electronic pen provides.
The team determined that connection between teacher and student tablets was required and
DyKnow software licenses were purchased by the college. DyKnow software is compatible with
either Word document or Power Point presentations. Teachers load their personalized teaching
documents into the DyKnow Writer and students log into an open session. With the capability of
releasing one or multiple slides (panels) at a time, teachers give students the ability to work at their
own pace. Students save their session to a college server which they can access via the internet
at any time. For those students without internet connection in the home, notes can be accessed
from college libraries or computer laboratories.
The use of the tablet pc and collaborative software has resulted in an innovation in teaching
methodology. Lectures now take the structure of: 1) interactive focus activity, 2) concept
development, 3) collaborative practice, 4) application and 5) reflection of learning. As some lag
time occurs while students log in, the instructor often begins with an interactive focus activity. By
projecting onto the screen and using the link feature of the collaborative software, students are
directed to an internet learning object/applet/video and are encouraged to investigate
individually, in pairs or in groups, then discuss findings. With the internet at their fingertips, they will
often go to a search engine to seek meaning of unfamiliar terms. The embedded link on the
panel becomes a part of the class notes which students, using their personal computer, can open

June 17-18, 2011 [GEOGEBRA-NA 2011]
Conference Proceedings Page 43
at a later time for more detailed analysis or review as necessary. Once all students are logged in,
the instructor can un-tether themselves from the projector and freely move about the room with
their workspace on their arm – as can students in a mobile/wireless environment. Open-ended
questioning and class collaboration enhances the learning experience derived from the focus
activity. By capturing this concept development on screen, all students have this learning
experience recorded as part of their notes. Without having to be concerned about copying notes
correctly, students can focus on the teacher’s process used for solving, add notes that arise from
discussion and annotate with pen colours and highlighter to provide focus on key learning.
Multiple features of the DyKnow software are employed to ensure that practice is collaborative
and learning outcomes are met in unique and interesting ways. Students are placed into online
groups so answers that are difficult to achieve independently can be developed through
cooperation. The group can submit this panel to the teacher who then adds it to the class notes,
where it can be viewed on individual tablet screens. In addition, the teacher can ‘share control’
of the session. While sitting at their own tablet, single/groups/all students can be selected to
demonstrate their approach to problem solving by being given control of the class screen.
Students comment that this functionality allows them the opportunity of becoming the temporary
teacher, requiring them to take greater responsibility for their own work. They quickly understand
why an answer that uses poor form/illegible writing or skips steps is not desirable to others viewing
their work. Students comment that an answer with correct process increases their pride in their
work, builds their confidence and makes them more likely to continue their efforts outside of the
classroom. To enhance the learning benefits of this feature, teachers provide panels with tables
that have questions duplicated in two columns. Students are instructed to work independently on
one side to attempt personal solutions. After an appropriate time, share control is granted to the
entire class and students ink in solutions to the question of their choice. Once access is closed, the
class works together to discuss and modify solutions. As all responses are anonymous, students gain
this understanding without embarrassment. Of most importance, students compare their personal
work to others and begin to understand the necessity of self-correcting habitual errors. The ability
to ‘send panels’ to the instructor allows for a backchannel conversation to occur with students
that prefer to have their teacher review their solutions on a regular basis. The panels are viewed at
a quiet moment in class to provide immediate feedback, or saved to return directly to individual
students outside of class time. The send panels feature is also used to share application questions
with fellow classmates. Students are asked to make-up questions that are of interest to their own
experiences, solve them, and send them to the instructor. These new panels are collected and
appended to class notes, providing multiple examples of solved problems for students to review.
By using embedded links to applets/learning objects/videos/Web Quests, teachers provide an

[GEOGEBRA-NA 2011] June 17-18, 2011
Conference Proceedings Page 44
application experience which results in a clear understanding of how the learned math skill will be
used in future discipline-specific situations. Reflection of learning outcomes is evaluated
throughout the lecture by using multiple DyKnow tools. For example, the teacher can ‘request
status’ of students which asks them to indicate their level of understanding by sending a red,
yellow or green stoplight. Polling students quickly determines comprehension and if required,
additional panels are inserted to supplement the discussion. These methodologies are used to
either elicit conversation or develop reflective practice. Further, students are asked to submit
reflection panels as part of an online journal which teachers review and return. This online,
collaborative workspace is then saved to the college server, and becomes a part of the students’
virtual binder.
The combination of the tablet pc’s and collaborative software provides a workspace for students
to engage in two-way synchronous communication. This learner-centered environment results in
student perception of enhanced engagement, supported by increased attendance and
retention in the course. Survey data and student focus group comments: “…it isn’t like any other
class when you sit there and just listening to a teacher speak on and on…your’re actually
interacting with others.”, and “…tablet…gave you an opportunity to participate…without the
embarrassment of public speaking” or “my participation…have grown significantly because of the
confidence it brings when im comfortable of where I am.” Help teachers to understand the
benefits of the development of a personal learning community and its impact on student
confidence and understanding of the subject material. Student performance increased
measurably and comments: “Makes me perform better since it is a new and interesting way to
approach classes, I tend to pay attention more and thus doing better in work and tests”, “…I
actually did my work and it was done right and organized…” and “…It made learning…much
easier, more enjoyable and improved my performance…” allow teachers to conclude that this
active learning environment results in improved student understanding and encouragement of
necessary critical thinking skills. “The tablets were useful because I can see what the teacher is
writing, students can share answers anonymously, we can correct each other’s work”.
With a greater emphasis placed on class development of notes, students are required to take
responsibility for their learning and thus determine for themselves where weaknesses and error
occur. Faculty must be amenable for adaptation in teaching philosophy and a shift in thinking
because students determine the pace of classroom delivery and are given the opportunity to
contribute to the teaching role.
Further advances at the college studied include the opening of two additional tablet classrooms.
One laboratory seats 40 students and addresses the technological implications of larger class sizes

June 17-18, 2011 [GEOGEBRA-NA 2011]
Conference Proceedings Page 45
that are reflective of a more standard class enrollment. The second is located at another campus
where students are pursuing careers in different fields of technology. Its purpose is to determine if
deployment of this teaching methodology can be expanded to other disciplines, in particular
where gender may have an influence.
Return to the Table of Contents

[GEOGEBRA-NA 2011] June 17-18, 2011
Conference Proceedings Page 46
GEOMETRICAL PROOFS, BASIC GEOMETRIC CONFIGURATIONS AND DYNAMIC GEOMETRY SOFTWARE
Margo Kondratieva
Memorial University, Canada
Abstract
Knowing geometrical facts and understanding their proofs are of equal importance for learning geometry. One way to target both goals is to study basic geometric configurations (BGCs). BGC is a geometrical figure that depicts a statement along with auxiliary elements pertinent to its proof. Benefits of using BGCs in teaching geometry can be enhanced by employment of applets produced with a dynamic geometry software. We discuss innovative practices that apply this idea to teaching proofs at the university level. A sample classroom scenario illustrating our approach is presented. Results of a survey of 13 students who had taken the course highlight a potential of this practice and suggest directions for further research.
Key words/ themes: promoting conceptual understanding of mathematics through explorations,
visual proof, computer technologies for learning/doing mathematics.
Motivation and overview of our innovative practices
This paper concerns innovative practices and development activities in teaching Euclidean
Geometry at the undergraduate university level. As a consequence of the current grade school
mathematics curriculum, students enter this course with a limited amount of geometrical
knowledge often restricted to a list of formulas and facts for certain geometrical figures such as
the triangle and circle. Several students have some familiarity with formal deduction (e.g. two
column proofs), but they often lack understanding of the meaning of this process. Thus the
university course aims to give students a richer background and experiences in geometry as well
as allowing students to understand the essence of proving practice. Learning to proof is vital for
learning mathematics (Rav 1999; Balacheff 2010). First, proof as a means of validation, reinforces a
precise and highly logical way of thinking based on axioms, definitions, and statements, which link
and describe the properties of mathematical objects. Second, proofs include mathematical
methods, concepts, and strategies also applicable in problem solving situations (Hanna &
Barbeau 2010). Despite their central role in mathematics proofs often receive insufficient
appreciation and epistemological understanding from students, who rely on empirical evidence
rather than on formal deductions of mathematical theorems (Coe & Ruthven 1994). “Pupils fail to
appreciate the critical distinction between empirical and deductive arguments and in general
show a preference for the use of empirical argument over deductive reasoning.” “Proof is not

June 17-18, 2011 [GEOGEBRA-NA 2011]
Conference Proceedings Page 47
‘used’ as a part of problem-solving and is widely regarded as an irrelevant, ‘added-on’ activity”
(Hoyles & Jones 1998, p. 121).
This state of affairs identifies the needs for “mathematical activities that could facilitate the
learning of mathematical proof” (Balacheff 2010, p. 133) and “problem situations calling for an
interaction between visual methods and geometrical methods” (Laborde 1998, p.114). One
possible approach “is centered around the idea that inventing hypotheses and testing their
consequences is more productive … than forming elaborate chain of deductions” (Jahnke 2007,
p.79). The process of making conjectures and inventing hypotheses requires mathematical
intuition, which develops through students’ experiences not only in formal logical manipulations
but also in experimental explorations of objects and ideas (De Villiers 1990). At the same time,
“current curricular trends, promulgating proving processes based on experimentation and
conjectures, will lead to an effective learning of proof, with proof attaining its full meaning in the
learners’ understanding only if these processes are set within a genuine process of building ‘small
theories’… From these axioms/hypotheses would be elaborated hypothetico-deductive networks,
which would then be confronted with the initial experimentations and conjectures” (Tanguay &
Grenier 2010, p.41). A productive way of incorporating experimentation and proving needs to be
found so that “proofs do not replace measurements but make them more intelligent” (Janhke
2007, p.83). This is possible due to several roles (besides validation statements) that proofs may
play in mathematical thinking (Hanna 2000; De Villiers 1990). First, at the informal deduction stage,
proof as explanation of empirical observations is most appropriate. Next, students “should build a
small network of theorems based on empirical evidence” and become accustomed to
“hypothetico-deductive method which is fundamental for scientific thinking” (Jahnke 2007, p.83).
At this stage, the proof functions as a “systematization (the organization of various results into a
deductive system)” and “construction of an empirical theory”, preparing students for rigorous
proofs aiming at establishing truth by deduction or “incorporation of well-known facts into a new
framework” (Hanna 2000, p. 8).
My approach to teaching Euclidean Geometry emphasizes the use of basic geometric
configurations (BGCs) - fundamental geometric facts expressed in drawing (Kondratieva 2011).
Such drawings contain auxiliary elements and labels (equal angles, equal segments,
perpendicular and parallel lines) that allow remembering the statements along with the ideas of
their proofs. BGCs are the stepping stones to proving or solving geometric problems. But figures
support visual thinking only if a learner grasps the mathematical structure they represent (Arnheim
1969). This calls for the following teacher’s actions : (1) Asking students to explain what relations
they observe in a figure and what they think about the role of the auxiliary lines drawn on the
original figure. (2) Constantly showing connections to already learned geometrical facts and

[GEOGEBRA-NA 2011] June 17-18, 2011
Conference Proceedings Page 48
focusing students’ attention on the key ideas used in a particular solution. (3) Demonstrating
several proofs or solutions of the same problem in order to show connections between geometry,
trigonometry and algebra. (4) Directing students’ attention to the implications, converse and
equivalence of statements. (5) Helping students summarize their findings in the form of a
mathematical statement. (6) Surprising students with an unexpected conclusion or asking them to
correct errors in a flawed reasoning (Kondratieva 2009, 2011).
Taking into account that “computers can offer a new context for designing innovative activities to
address the main problem of linkage between empirical experiments and deductive reasoning”
(Osta 1998, p 111), I introduce my students to dynamic drawings (applets) produced in GeoGebra
(GG). Several types of tasks helping to connect visual evidence and geometrical facts can be
considered: (i) moving from a verbal description on a geometrical figure to a drawing; (ii)
explaining the behavior of drawings in geometrical terms (interpreting or predicting); and (iii)
reproducing a drawing or transforming a drawing (Laborde 1998, p. 115). The students employ my
GG applets and create their own drawings that help them to understand and interpret BGCs.
Many BGCs allow “dynamical visual proofs, which are based on 'drawing in movement' that can
be properly performed in a dynamical environment” (Gravina 2008).
The novelty of this approach consists of combining the methodology of the BGC approach with
the advantages offered by the geometry software, in order to balance empirical and deductive
practices. First, students read and analyze sample proofs and identify BGCs and key ideas
pertinent to the proofs. At the same time students construct interactive applets in GG with the
requirement to make the constraints described in the statement indestructible by dragging. This
forces them to use geometrical properties of the object they draw. Students are asked to show
auxiliary lines and measurements pertinent to the idea of the proofs. Students are encouraged to
invent alternative proofs to the statements they analyze and interpret with help of GG. Students
are given examples of all these activities in class. They discuss BGCs with their teacher using both
static and dynamic drawings. As the semester evolves, the students are provided with fewer hints
for problems and are asked to continue building GG applets and experiment with them in order to
find their own solutions. In this way students gradually adopt the Euclidean (synthetic) geometry
tradition of proofs and learn to recognize and apply BGCs. The students learn to observe and
explain individual empirical facts, then build, and check their “small theories” based on many
dynamic and static drawings.

June 17-18, 2011 [GEOGEBRA-NA 2011]
Conference Proceedings Page 49
The six point circle theorem in the classroom
In this section we illustrate our approach with a concrete example of a study of the six point circle
theorem. This theorem states that: “For a triangle ABC with midpoints on the sides L, M, and N and
the feet of the altitudes D, E, and F, all lie on a circle.”
Below we give a sample dialog between a teacher and a small class of undergraduate students
equipped with dynamic geometry software (DGS).
Teacher: Good morning, class! Do you know how many circles one can draw given 3 arbitrary
points?
Anna: I think only one. Yes, you can always draw a circle through 3 points, but only one.
Teacher: Everybody agree?
Nick: I agree. But the points must not be collinear; otherwise you can’t draw a circle.
Anna: Oh, I forgot this exception. But other than that…
Teacher: Can you explain why?
John: One can construct the center of such a circle and thus find the circle. We did it last time. It’s
the intersection of perpendicular bisectors of the sides of the triangle with vertices at given 3
points. This is a basic geometric configuration we constructed at home in Geogebra (see Figure 1).
Matthew: I also noticed that Geogebra has a build-in function “Circle through Three Points” that
allows drawing a circle by 3 points.
Teacher: Very good. I hope everyone made the applet and recalls this fact now. Today we are
going to experiment with other construction. Please draw a triangle ABC. Find the midpoints of the
sides and call them L, M, N. Draw a circle through L, M and N. Draw an altitude CF with foot F on
AB. Drag vertices of the triangle. What do you notice?

[GEOGEBRA-NA 2011] June 17-18, 2011
Conference Proceedings Page 50
Figure 1: Basic geometric configuration showing that circum-center O lies at the intersection of
perpendicular bisectors of the sides of a triangle.
Students follow teacher’s instruction and use various build-in functions such as “Midpoint or
Center”, “Perpendicular Line”, “Circle through Three Points” to create their applets. Students are
required to obey all given constrains and then experiment with their drawings and report their
observations.
Kelly: I think point F always lies on the circle defined by the midpoints L, M, and N.
Teacher: It looks like that, indeed. Now we have to either explain this fact or find a situation where
this is no longer true.
The students play with their applets for some time. Often, students quickly see the fact and get
more and more convinced by viewing results of dragging points. At the same time they may have
difficulties to find an explanation of the observed geometrical behavior. When Teacher notices
that no reasonable explanation emerges from this activity, she decides to give students a hint in
the form of her own applet, prepared for this lesson. This applet embraces a BGC because it
represents a statement and an idea of its proof. The goal of the teacher is to guide the students
letting them to see this idea and articulate it in their own words.
Teacher: Please take a look at my drawing (Figure 2). What do you observe?
Mathew: I see a quadrilateral with vertices at the points of interest. Should we try to show that this
quadrilateral is always cyclic?
Teacher: Perhaps. What can you say specifically about this quadrilateral?

June 17-18, 2011 [GEOGEBRA-NA 2011]
Conference Proceedings Page 51
Nick: It is a trapezoid. The line MN, connecting midpoints of the two sides of the triangle, is parallel
to the third side of this triangle.
Teacher: Yes, good. What do we need to prove now about this trapezoid if we had to show that it
is cyclic?
Kelly: To be cyclic it needs to be isosceles. But is it?
Teacher: Let’s look at the figure and find out.
Figure 2: The six point circle theorem: case of acute triangle.
John: Since segment LN is a midline in triangle ABC, its length is a half of length of the side AC.
Now what about MF? On your hint-figure it looks like MF is a radius of the circle with diameter AC. If
this is the case, then we are done.
Nick: Right. Point F is the foot of the altitude CF, so CFA is 90 degrees angle and thus the
hypotenuse CA is a diameter of the circum-circle. This is a BGC we recently learned. (See Figure
3.)

[GEOGEBRA-NA 2011] June 17-18, 2011
Conference Proceedings Page 52
Figure 3: Basic geometric configuration showing that hypotenuse of a right triangle is a diameter of
the circum-circle.
Teacher: Very good. Let us summarize. What is the key idea of the proof? What are BGCs required
in completion of this proof? Please write down your proof and make sure that your statements do
not contradict the observations made with the applet. What difference do you observe in the
proof for the cases of acute and obtuse triangles?
Students drag points on the applet to make the triangle obtuse and observe that all elements of
the proof remain the same (Figure 4).
Figure 4: The six point circle theorem: case of obtuse triangle.
Teacher: As a matter of fact, we just proved so called the six point circle theorem. Why does it
refer to six points?

June 17-18, 2011 [GEOGEBRA-NA 2011]
Conference Proceedings Page 53
Anna: We proved that three side midpoints and foot of an altitude lie on a circle. But we can
repeat this for other altitudes in the triangle and will get the foot of each of them on this circle
defined by the midpoints. I can show you this on my applet.
Teacher: Very good. Next time we will study the nine point theorem, which is an extension of
today’s discussion, so please save the applet you made today for the next class.
Conclusions
The conversation given in the previous section exemplifies our innovative practices in teaching
geometry. Its main component is a guided discussion of properties and details presented in a
prefabricated dynamic figure. All negotiations and experimentations with the applet aim at
helping students to form a visual mental image of a geometrical statement along with an
argument supporting this statement.
A survey of 13 students taking the Euclidean Geometry course in the Fall of 2010, reveals the
following results (in parentheses the number of positive responses is shown) : “I am learning a lot of
new things about geometry in this course” (13); “I am developing my understanding of and ability
to proof to a higher degree” (12); “The use of GeoGebra helps me to make a connection of
symbolic and visual representation” (12) and “to interpret and understand theorems in geometry”
(11); “GG is aesthetically pleasant” (11), “insightful” (12), “helping to activate my knowledge”(11);
“GG encourages me to make and test conjectures”(11), “facilitates exactness of my
mathematical thinking”(11); “GG allows me to try a larger range of possibilities compare to pen
and paper approach”(13).
The survey results confirm a potential usefulness of the proposed approach and concur with the
observation that experimentation and conjecturing in dynamic geometry environment must be
done in conjunction with other activities (e.g. analysis of BGCs and deductive proofs) that help
students to build their networks of theoretical knowledge. Further research is required in order to
highlight details and nuances of synchronization of the heuristic and logical components of
students’ work within the innovative practice described in this paper.
References
Arnheim, R. (1969). Visual Thinking. Berkley: University of California Press.
Balacheff, N. (2010). Bridging knowing and proving in mathematics: A didactical perspective. In G. Hanna, H.N. Janke, & H. Pulte (Eds.) Explanation and proof in mathematics: philosophical and educational perspectives (115-135). Springer.
Coe, R., Ruthven, K. (1994). Proof practices and constructs of advanced mathematics students. British Educational Research Journal, 2(1): 41–53.
De Villiers, M. (1990). The Role and Function of Proofs in Mathematics. Pythagoras. 24, 17-23.

[GEOGEBRA-NA 2011] June 17-18, 2011
Conference Proceedings Page 54
Gravina, M. (2008). Drawing in movement and insights for the proof process. Int. Jour. of Continuing Engineering Education and Life Long Learning,18:5-6, 564-574.
Hanna, G. (2000). Proof, explanation and exploration: an overview. Educational studies in mathematics, 44: 5-23.
Hanna, G., Barbeau, E. (2010). Proofs as bearers of mathematical knowledge. In G. Hanna, H.N. Janke, & H. Pulte (Eds.) Explanation and proof in mathematics: philosophical and educational perspectives (85-100). Springer.
Hoyles, C. & Jones, K. (1998). Proofs in dynamic geometry contexts. In C. Mammana & V. Villani (Eds). Perspectives on the teaching of geometry for the 21st century (121-128). Netherlands: Kluwer Academic Publishers.
Jahnke H.N. (2007). Proofs and Hypotheses. ZDM Mathematics Education, 39:79-86
Kondratieva, M. (2009). Geometrical sophisms and understanding of mathematical proofs. In Fou-Lai Lin, Feng-Jui Hsieh, Gila Hanna, Michael de Villiers (Eds) Proceedings of the ICMI Study 19: Proof and Proving in Mathematics Education (vol. 2, 3-8). Taipei: National Taiwan Normal University press.
Kondratieva, M. (2011). Basic Geometric Configurations and Teaching Euclidean Geometry. Learning and Teaching Mathematics, 10, 8 pages (accepted).
Laborde, C. (1998). Visual phenomena in the teaching/learning of geometry in a computer-based environment. In C. Mammana & V. Villani (Eds). Perspectives on the teaching of geometry for the 21st century (113-121). Netherlands: Kluwer Academic Publishers.
Osta, I. (1998). Computer technology and the teaching of geometry. In C. Mammana & V. Villani (Eds). Perspectives on the teaching of geometry for the 21st century (109-158). Netherlands: Kluwer Academic Publishers.
Rav, Y. (1999). Why do we prove theorems? Philosophia Mathematica 7(3): 5-41.
Tanguay, D., Grenier, D. (2010). Experimentation and proof in a solid geometry teaching situation. For the Learning of Mathematics, 30:3, 36-42.
Return to the Table of Contents

June 17-18, 2011 [GEOGEBRA-NA 2011]
Conference Proceedings Page 55
FINDING THE AREA OF A CIRCLE: AFFORDANCES AND DESIGN ISSUES WITH DIFFERENT IGS PROGRAMS
Kate Mackrell
Institute of Education, University of London, U.K.
Abstract
In order to consider the potential impact of differences in program affordance and design on student learning, an exploratory inspection involving a series of tasks related to finding a connection between the radius and area of a circle was performed using Cabri II Plus, Cinderella, GeoGebra and Geometer’s Sketchpad. These tasks involved different aspects of number, algebra, geometry, and handling data. It was found that although all programs had sufficient affordance for the tasks, there were significant differences in the way such affordances were implemented and a number of particularly problematic features of GeoGebra were identified, together with their potential impact on student learning.
Introduction
Laborde (2007), in a summary of the research on the use of interactive geometry software (IGS) in
the classroom, comments on the increasing awareness that learning outcomes depend not only
upon tasks and pedagogical context, but also on software design. Jackiw (Butler, Jackiw,
Laborde, Lagrange & Yerushalmy, 2009) has called for more specific attention to be given to the
detail of design decisions in IGS and has identified a number of important design decisions. Further
design decisions have been described by Laborde & Laborde, 2008 and Richter-Gebert &
Kortenkamp, 2010. However, there is currently little discussion of design decisions and issues in
GeoGebra.
Mackrell (2011a) created a categorization of the operations possible in an IGS in which to situate
design decisions and, using Cabri II Plus v1.4.3 (2008), Cabri 3D v2.1.2 (2007), Geometer’s
Sketchpad (GSP) v5.01 (2009) Cinderella v2.1 (2010) and GeoGebra v3.2.46 (2010) explored
aspects of three fundamental operations: construction, object (including dragging and
redefining) and changing the view (spatially or semantically), showing that there is a great
diversity in both the design decisions that need to be made and in the decisions made by
individual designers. Mackrell (2011b) considered the impact of particular design decisions on the
potential for the integration of number, algebra and geometry and concluded that particular
design decisions were likely to either facilitate or impede the development of student
understanding in these areas, and called for further research on student responses to conclusively
evaluate the impact of such design decisions.

[GEOGEBRA-NA 2011] June 17-18, 2011
Conference Proceedings Page 56
Although none of the programs explored were without problems, GeoGebra was found to have
made a number of particularly problematic design decisions. This paper focuses on these
decisions, comparing them to those made in other IGS programs, and discusses their potential
consequences.
Method
IGS programs are highly sophisticated, with a vast range of affordances. Accordingly it was
decided to take a “snapshot” of the capabilities of each program by performing an integrated
series of tasks with a particular curriculum goal that involved a range of program affordances. The
tasks had the aim of finding and verifying a formula giving the area of a circle in terms of its radius.
The topic, finding the area of a circle, is universal, and each task involved processes that would
also apply to other mathematical explorations. The pedagogical approach (involving exploring
and gathering information about a mathematical situation, making and testing conjectures, then
generalizing and proving results) has been promoted extensively in the UK since the 1980’s.
Results
Task 1: Create a circle, and a segment to represent its radius
In each program, a circle was created given a centre point and a point on its circumference.
This tool was the simplest tool in common to all the programs.
The design decisions involved at this stage are which tools to make available and the way in
which these tools are to be used. In considering the available circle tools in each program, it is
useful to distinguish between two types of tool functionality. A tool has atomic functionality if it
transforms input in a way which cannot be achieved by any other tool or sequence of tools. For
example, the tool which creates a circle by center and radius point has atomic functionality. A
tool has molecular functionality if its output can be produced from the given input by an
operation or series of operations using tools with atomic functionality. For example, the tool which
creates a circle given a centre point and a segment for radius length has molecular functionality,
as it may be replaced by first using the atomic tool which measures the length of a segment and
then by using the atomic tool which constructs a circle given a centre and numerical radius
(Mackrell, 2011a). The functionality of a program as a whole depends upon its atomic tools,
particularly when new custom tools may be created to give tools with the required molecular
functionality. The three atomic functionalities represented among the five programs include the
two mentioned in the examples above and also the ability to create a circle given its centre point
and selecting an initial value for its radius by clicking on the screen. This circle has the advantage
that dragging the centre point moves the circle, and dragging on the circumference changes the

June 17-18, 2011 [GEOGEBRA-NA 2011]
Conference Proceedings Page 57
radius, giving a very simple representation of a circle to explore, dependent on no other objects.
Only Cinderella and Cabri II Plus have this functionality: of the five tools to create a circle in
GeoGebra, only two are atomic.
However, there are also a number of reasons for making molecular tools available: the complexity
of performing an operation with only atomic tools, the encapsulation of fundamental relationships
and constructions, the introduction of appropriate mathematical language and to enhance the
perceived affordance of a program. There are also problems, however, in that introducing further
tools adds complication to the interface. and hence it is important to be able to control the
number of tools available. All of the programs allow custom tools to be created, but only Cabri II
Plus and GeoGebra allow the suppression of tools.
In using a tool, a fundamental design decision is whether the user needs to choose the tool
(action) first, or the objects to which the tool is applied first. The first method is called A/O (for
action-object) and is used in almost all operations with all but GSP. The second method is O/A,
used for a large number of GSP operations. The importance of A/O is that it enables a large
number of other features, such as points-on-the-fly, in which points may be created in the course
of using a tool. Cinderella does not allow consistently allow points on the fly, but the other
programs allow these in all A/O operations. A/O also enables a description to be given once a
tool is chosen and as objects are selected. An advantage to the tool help in Cabri is that this can
be turned off when no longer necessary. Tooltips and highlighting of selectable objects are also
enabled. GeoGebra’s tooltips consist of identifying all objects rather than just objects relevant to
the construction, however. Highlighting in GeoGebra is also less noticeable than in the other
programs: GSP is particularly clear in its O/A operations.
A/O and O/A/O selection also enable graphic previews, in which, as soon as enough objects are
selected, a preview is given of the object that will result. An example is the construction of a
polygon, in which all programs give a preview of the polygon as vertices are selected. However,
Cinderella and GSP give a graphic preview of points to be created on objects, but GeoGebra
and Cabri II Plus do not. GeoGebra and Cinderella also do not give a graphic preview for a conic
through five points.
Task 2: Measure the area and radius of the circle
Screenshots of the figures constructed are shown below.
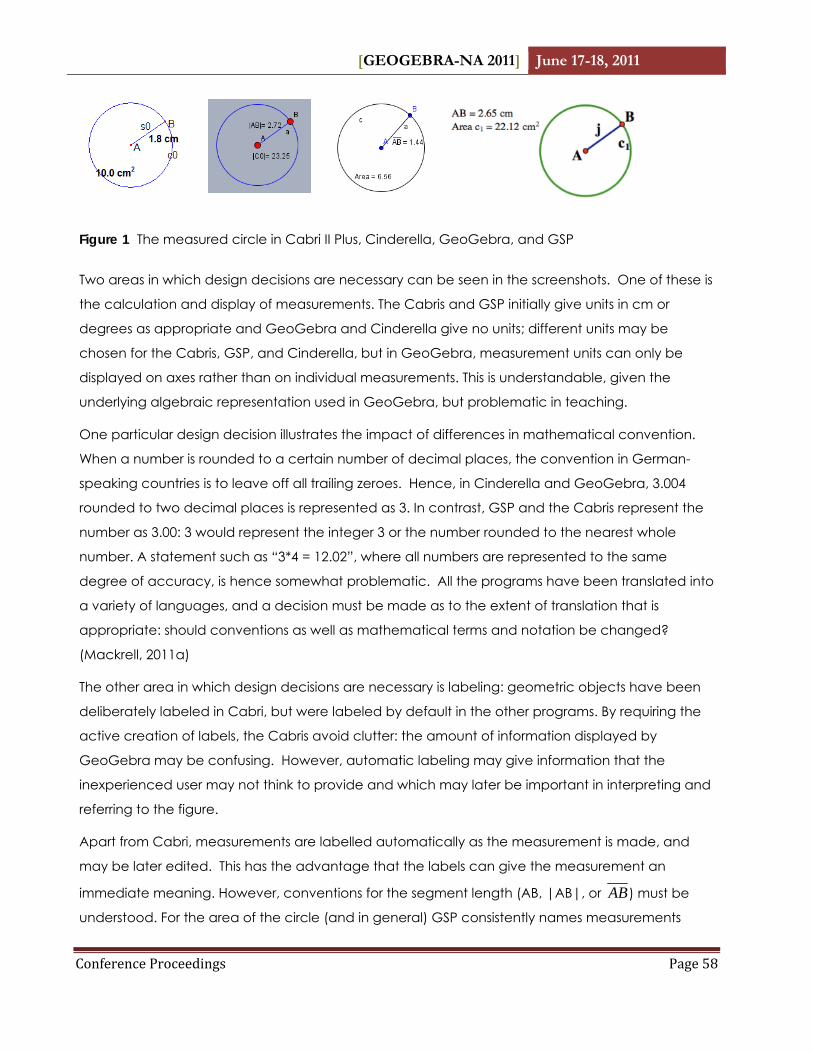
[GEOGEBRA-NA 2011] June 17-18, 2011
Conference Proceedings Page 58
Figure 1 The measured circle in Cabri II Plus, Cinderella, GeoGebra, and GSP
Two areas in which design decisions are necessary can be seen in the screenshots. One of these is
the calculation and display of measurements. The Cabris and GSP initially give units in cm or
degrees as appropriate and GeoGebra and Cinderella give no units; different units may be
chosen for the Cabris, GSP, and Cinderella, but in GeoGebra, measurement units can only be
displayed on axes rather than on individual measurements. This is understandable, given the
underlying algebraic representation used in GeoGebra, but problematic in teaching.
One particular design decision illustrates the impact of differences in mathematical convention.
When a number is rounded to a certain number of decimal places, the convention in German-
speaking countries is to leave off all trailing zeroes. Hence, in Cinderella and GeoGebra, 3.004
rounded to two decimal places is represented as 3. In contrast, GSP and the Cabris represent the
number as 3.00: 3 would represent the integer 3 or the number rounded to the nearest whole
number. A statement such as “3*4 = 12.02”, where all numbers are represented to the same
degree of accuracy, is hence somewhat problematic. All the programs have been translated into
a variety of languages, and a decision must be made as to the extent of translation that is
appropriate: should conventions as well as mathematical terms and notation be changed?
(Mackrell, 2011a)
The other area in which design decisions are necessary is labeling: geometric objects have been
deliberately labeled in Cabri, but were labeled by default in the other programs. By requiring the
active creation of labels, the Cabris avoid clutter: the amount of information displayed by
GeoGebra may be confusing. However, automatic labeling may give information that the
inexperienced user may not think to provide and which may later be important in interpreting and
referring to the figure.
Apart from Cabri, measurements are labelled automatically as the measurement is made, and
may be later edited. This has the advantage that the labels can give the measurement an
immediate meaning. However, conventions for the segment length (AB, |AB|, or AB) must be
understood. For the area of the circle (and in general) GSP consistently names measurements

June 17-18, 2011 [GEOGEBRA-NA 2011]
Conference Proceedings Page 59
clearly, giving the object measured and also the type of measurement. GeoGebra does not
name the circle, and Cinderella’s notation |C0| for the area of the circle is problematic in English-
speaking mathematics.
A final comment to do with creating the model is that in all other programs, replicating the
construction of an object such as a segment does not result in a new object being created: in
GeoGebra any number of segments can be created between the same points and each is listed
as a separate object in the algebra window and when the cursor passes over the segment on the
page. This is confusing and problematic in that a fundamental axiom of Euclidean geometry is
that there is only one straight line that passes through two points. In the other programs, objects
are only considered to be distinct if they have distinct defining objects, although they may
coincide if their defining objects temporarily coincide.
Task 3: Change the radius of the circle, observe the effect on its area and make a conjecture
about the relationship between the two
Unless the axes are hidden, GeoGebra shows the coordinates of the radius point as it is dragged:
the other programs enable a focus on the way in which the area changes as the radius is
changed without distraction. The measurements move with the figure in Cabri and Cinderella and
can be attached to the figure in GSP. In GeoGebra, the segment length is attached, but not the
circle area, making it more difficult to see any connection between the two.
It is clear that as the radius increases, so does the area: a conjecture is hence that the area is
some multiple of the radius.
Task 4: Test the conjecture by calculating area/radius
This method of testing the conjecture will be used to illustrate a powerful connection between
calculation and algebraic understanding: the arithmetic operation of dividing one number by
another may be generalized to the algebraic operation of dividing one variable by another.
The ability to act as a mediator between numerical and algebraic operations depends upon a
number of software design features. The first of these is whether the tool that performs calculations
is specifically seen to be a calculator tool. This is the case in the Cabris and GSP, but not the case
with Cinderella, which uses a function-defining tool, and GeoGebra, which uses the input bar.
These two programs provide an empty entry box: all operations must be entered by typing, and
the user is required to know symbols for multiplying, “*”, dividing, “/”, and exponentiation, “^”,
which differ from those used on paper or with a calculator.
The most important consideration, however, is the way in which numbers are entered. In GSP,
Cabri, and Cinderella, clicking on the number on the screen enters it in the calculator. The user

[GEOGEBRA-NA 2011] June 17-18, 2011
Conference Proceedings Page 60
does not need to recognize that the number represents a variable. In GSP in particular, the name
of the measurement is entered in the calculator when the number is clicked and the detail of the
calculation with measurement names displayed on the geometry page when the calculation is
complete, thus mediating between the idea of dividing two specific numbers and dividing area
by radius in general.
In contrast, the GeoGebra input bar only accepts text and hence required that the names of the
variables associated with each number be typed in. This demands the awareness first that the
measurements are named variables and secondly that one variable might be divided by another,
but no means is available to build this awareness. The algebra window, with a large amount of
distracting information such as the equation of the circle, needs to be open to find the names of
the variables and the text input requirement creates issues with syntax, made more difficult by the
confusion described below regarding the segment name, which behaves as a variable in the
calculation. It was also necessary to be aware of further syntax in order to display the result on the
geometry page, rather than lose it in a new unidentified variable in the algebra window.
Opening the algebra window and showing the construction protocol highlight a fundamental
mathematical error in GeoGebra. The letter a is treated as a variable and assigned a value of 1.44
in the algebra window. However, it is clear from the construction protocol that a is the name of a
geometric object, i.e. the segment joining points A and B.
Figure 2 Geogebra Algebra Window and Construction Protocol
Using a name as a variable is a common error in the early stages of algebraic understanding
(Küchemann, 1981), but also one that may persist into university and adversely affect
performance in undergraduate mathematics courses (Gray, Loud & Sokolowski, 2005). This error is
hence likely to create difficulties for students.
This is a deliberate design decision, however: “the algebraic representation of a segment is its
length” (Hohenwarter, personal communication, 9th September, 2010). Another issue is that the
length is simply one of many measurements that could be made of the segment and is not
sufficient to define it. The actual algebraic representation of a segment is of the form

June 17-18, 2011 [GEOGEBRA-NA 2011]
Conference Proceedings Page 61
{(x, y) | y = mx + c, p ≤ x ≤ q}
y = mx + c
, where the line defined by the endpoints of the segment has
equation and p and q are the x coordinates of the endpoints of the segment. Similar
problems are that the name of the polygon is equated to its area, and points are equated to their
coordinates, which simply give the temporary location of a point rather than its defining
characteristics (for example the point may be defined as the intersection of two lines).
The other programs do not make such mistakes: Cinderella does not attempt to give algebraic
definitions of objects that do not have a clear equation. In Cabri and GSP, the equation or
coordinates of appropriate objects relative to particular axes can be found using a measurement
tool and are not considered intrinsic to the object.
Further information concerning the figure descriptions of the programs is given in Mackrell (2010a):
sailent points here are that the GeoGebra algebra window is the only one to list objects
alphabetically, useful for locating an object with a known name, but problematic in not giving
objects in the order of construction. A newly created object, assigned a name automatically,
may be particularly difficult to locate, particularly as the construction protocol in which objects
are listed in order of construction, does not allow the highlighting of corresponding objects in the
geometry window (possible in all but GSP).
The figure descriptions also highlight a further design decision concerning the modes of possible
interaction with objects. Unlike Cabri and GSP, Cinderella and GeoGebra distinguish names,
which appear in the figure descriptions, from labels, which appear on the page. For example, the
area of the circle in Cinderella has the name “A0” but the label “|C0|”, and in GeoGebra has
the name “areac” and the label “Area”. This is because the names of objects may be used as
input, and hence an object has a name for selection and a label or caption, which may or may
not be identical to the name, for identification and description. In GeoGebra, the names of
objects must be used in the input box, and objects may have an additional label and caption. In
the Cabris and GSP, objects are selected only by clicking on the screen and hence any labels
given serve only to identify and describe objects. The conceptual difference between a name
and a label may not be easy to grasp.
In contrast, GSP and the GeoGebra algebra window are the only figure descriptions to make the
useful distinction between dependent and independent objects, and the GeoGebra algebra
window is the only figure descriptions to enable objects to be selected to either be modified or
used in future construction . 1
1 Cabri 3D, not otherwise described here, also has this capability

[GEOGEBRA-NA 2011] June 17-18, 2011
Conference Proceedings Page 62
Having performed the calculation, it is clear that the result changes as the radius changes: the
conjecture concerning a linear relationship was incorrect.
Task 5: Make a table of data and plot the data
All of the programs allow tables to be made in which measurement values may be recorded. In
Cabri II Plus and GSP, creating the table is simple: choose the table tool and click to select the
measurements or calculations to be tabulated. If measurements have names, then these names
are used as column headings: if not, headings are not given. Geogebra again requires a specific
awareness of the measurements as algebraically represented variables and has a more
complicated and rather unintuitive data collection technique. Using text input, a point must first
be defined (and is hence plotted) with coordinates given by the variables for radius and area. The
coordinates of the point may then be recorded in a spreadsheet. This is problematic if data values
are not paired. An advantage, however, is that further calculations can be performed on the
data within the spreadsheet view.
GSP allows the data from the table to be easily graphed within the geometry page. Axes are
constructed with an appropriate scale and all data is displayed. Cabri II Plus allows the data to
be copied and pasted into a spreadsheet, from whence it can be graphed and further analyzed,
but it does not allow this to take place on the page itself. Geogebra is again unintuitive: the data
must be turned into a list, which automatically plots it, but the scale is not adjusted to ensure that
all data is displayed.
In Cinderella, the inbuilt programming language Cindyscript must be used to both gather data
and represent such data graphically.
Task 6: Use the measurements to create a graph of area against radius
In this task, a new representation of the mathematical situation was created to give further insight
on the relationship between the two relevant variables. One of the most powerful features of IGS
programs is the ability to visually represent the way in which measurements are related: a graph of
area against radius could be constructed directly from the existing measurements without
needing to either collect and plot data or to define an algebraic relationship.
It is possible in all programs to show inbuilt coordinate axes and then directly plot the point
representing (radius, area). GSP is the simplest; the point can be plotted directly by selecting the
appropriate tool and clicking on the values on the page. Cabri II Plus requires a geometric
construction, for which a custom tool may be created. In GeoGebra, the required point was
already plotted (through text input) in order to collect data. Cinderella requires knowledge of a
specific syntax to set the coordinates of a pre-existing point.
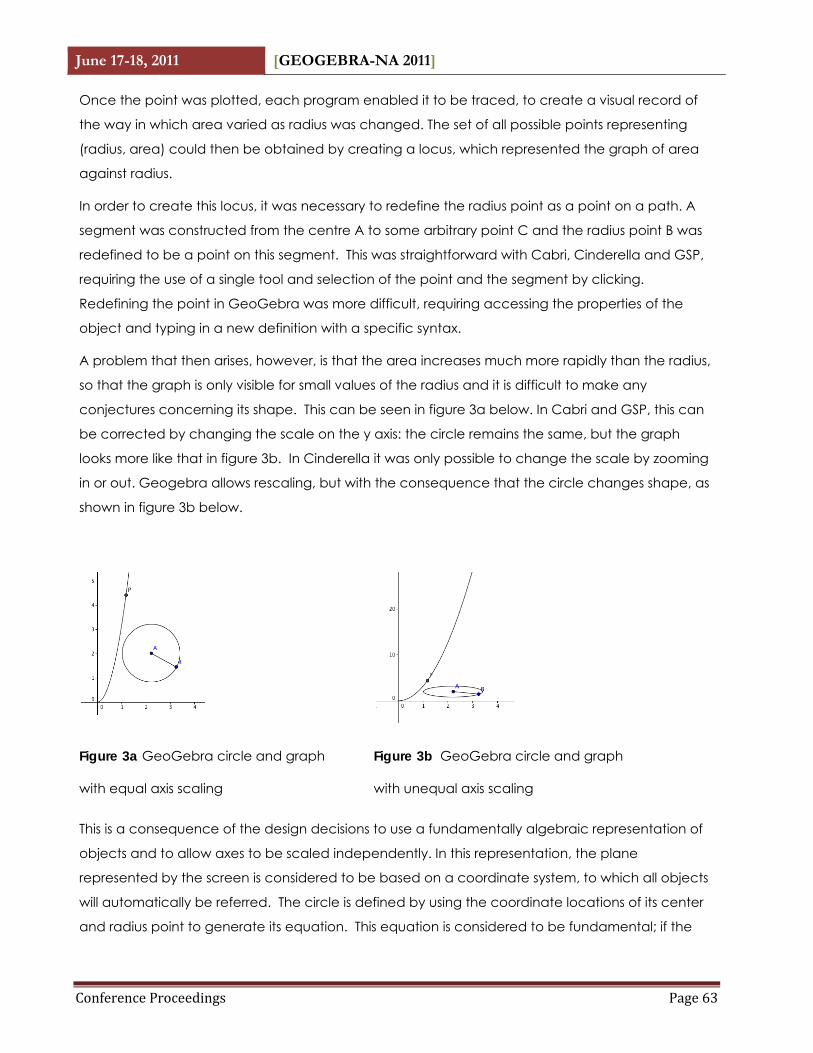
June 17-18, 2011 [GEOGEBRA-NA 2011]
Conference Proceedings Page 63
Once the point was plotted, each program enabled it to be traced, to create a visual record of
the way in which area varied as radius was changed. The set of all possible points representing
(radius, area) could then be obtained by creating a locus, which represented the graph of area
against radius.
In order to create this locus, it was necessary to redefine the radius point as a point on a path. A
segment was constructed from the centre A to some arbitrary point C and the radius point B was
redefined to be a point on this segment. This was straightforward with Cabri, Cinderella and GSP,
requiring the use of a single tool and selection of the point and the segment by clicking.
Redefining the point in GeoGebra was more difficult, requiring accessing the properties of the
object and typing in a new definition with a specific syntax.
A problem that then arises, however, is that the area increases much more rapidly than the radius,
so that the graph is only visible for small values of the radius and it is difficult to make any
conjectures concerning its shape. This can be seen in figure 3a below. In Cabri and GSP, this can
be corrected by changing the scale on the y axis: the circle remains the same, but the graph
looks more like that in figure 3b. In Cinderella it was only possible to change the scale by zooming
in or out. Geogebra allows rescaling, but with the consequence that the circle changes shape, as
shown in figure 3b below.
Figure 3a GeoGebra circle and graph Figure 3b GeoGebra circle and graph
with equal axis scaling with unequal axis scaling
This is a consequence of the design decisions to use a fundamentally algebraic representation of
objects and to allow axes to be scaled independently. In this representation, the plane
represented by the screen is considered to be based on a coordinate system, to which all objects
will automatically be referred. The circle is defined by using the coordinate locations of its center
and radius point to generate its equation. This equation is considered to be fundamental; if the

[GEOGEBRA-NA 2011] June 17-18, 2011
Conference Proceedings Page 64
axes change, then the equation is preserved but the appearance or location of the circle will
change. This is the position taken by GeoGebra and Cinderella.
An alternative possibility is to create a visual simulation of a Euclidean plane on the screen. On this
plane, distance is defined by a rigid ruler and location is not a fundamental property of objects. A
coordinate system may be introduced but is not intrinsically linked to geometrically created
objects: the system is simply another object on the plane, which may be used to give
geometrically defined objects a relative location and algebraic representation when appropriate.
It can also be used to define objects algebraically. The behaviour of an object is dependent on
the way in which it is defined: as axes change a geometrically defined circle does not change in
visual location or appearance, although its algebraic representation relative to the axes will
change, but an algebraically defined object will change in visual location or appearance, but not
in algebraic representation. This is the position taken by Cabri and GSP.
Both fundamental representations give equivalent visual models of a Euclidean plane – provided
that the axes used to define objects always have the same relative scale, which is the case in
Cinderella. In contrast, in GeoGebra the axes can easily be independently scaled, with the
consequence that the visual model breaks down. Instead, distances appear to depend on
direction and angles appear to depend on orientation, which more advanced learners may find
interesting to explore, but which may be highly problematic for learners still dependent on visual
representation such as 12 or 13 year olds learning about the area of a circle. It is also problematic
when modeling real-world objects or for example using the unit circle to define trigonometric
ratios.
Task 7: Find the equation for this curve
Using the Cabri coordinates and equation tool, it was possible to find the equation of the locus
directly. This was not possible with any of the other programs: GeoGebra did not even list the locus
as an object in the algebra window.
All programs will fit to the locus a graph defined by means of an algebraic equation. Cabri II Plus
requires an expression to be defined and applied to an axis, whereas GSP, GeoGebra and
Cinderella require the definition and plotting of a function. The shape of the graph suggests that it
might be fitted by a quadratic function and hence the graph of, for example, y=3x2 could be
plotted. The number 3 could be modified either by changing the definition of the function or
expression, or by introducing a parameter p to replace the 3. GeoGebra has a particularly simple
means of introducing a parameter by means of a slider object: sliders in the other programs must

June 17-18, 2011 [GEOGEBRA-NA 2011]
Conference Proceedings Page 65
be constructed geometrically. Manipulating this parameter will give the curve of best fit as
approximately y = 3.1 x2.
Task 8: Test the formula found
One way to test this formula would be to edit the calculation of area/radius to area/radius2, which
might suggest that 3.1 is only accurate to one decimal place. It was also possible to create a
function or expression 3.1*r^2, substitute the radius for r and compare the result with the measured
area. Cabri used the simpler language of evaluating an expression, and the other programs used
the language of functions, with text input needed for GeoGebra.
Task 9: Justify the formula found
This task, crucial pedagogically, is beyond the scope of this paper. However, files can be
constructed which, while not proving conclusively the formula found for the area of a circle, may
help students to understand why this formula works. Screenshots from one such GeoGebra file are
shown below (Dording, 2009). Such a file could also be constructed in the other IGS programs.
Figure 4 Visual demonstration of the connection between the radius and area of a circle
Conclusion
All of the programs had the necessary affordances to perform the tasks above, but there are large
variations in the way in which the affordances have been implemented. Cabri did not label
objects automatically and needed to use a spreadsheet to plot and analyze data, and a custom
tool to plot a point given its coordinates, but uniquely had a tool to find the equation of a locus.
Both Cabri and GSP were simple to use, with GSP identifying measurements and using
measurement names in calculations in a way that would mediate the idea of calculations
involving variables. Cinderella had a number of issues, including conventions for measurement
names, rounding, some syntax and the inability to scale axes. On the other hand, Cinderella has
an exceptionally powerful inbuild programming language.

[GEOGEBRA-NA 2011] June 17-18, 2011
Conference Proceedings Page 66
GeoGebra had some useful features, such as the distinction between dependent and
independent objects in the algebra window, the ability to select objects for geometric
construction by clicking on their names in the algebra window, the ability to perform calculations
with table data and the ability to easily define a slider. However, there were also a large number
of problems. A major issue is the prevalence of text input, which requires the use of named
variables, is open to syntax errors, and requires the algebra window to be open in order to locate
variables, displaying a large amount of information irrelevant to the task. A serious mathematical
mistake is made in using a geometric label as a variable. A second mistake is that an arbitrary
number of identical objects can be created from the same initial objects. The inability to define
an object without reference to coordinate axes means that the shape of the object is dependent
on the relative scales of the axes. Minor issues include cluttered labeling, potential confusion
between names and labels, the label for the circle area not referenced or attached to the circle,
a lack of units in measurement, problematic rounding, calculation not requiring a calculation tool,
coordinates of dragged points being displayed if axes are visible, difficulty in placing the result of a
calculation in the geometry window, the inability of the algebra window to show objects in order
of construction, needing to plot a point to collect data, data only being collected in pairs,
unintuitive data plotting, complicated redefinition, and loci not being listed in the algebra
window.
Unlike Cinderella, GeoGebra claims to be “from elementary school to university level”. This, and its
increasing popularity among teachers, make the issues noted here of some concern. Greater
attention needs to be paid to design decisions and issues.
References
Butler, D., Jackiw, N., Laborde, J., Lagrange, J., & Yerushalmy, M. (2009). Design for transformative practices. In C. Hoyles & J.-B. Lagrange, (Eds.), Mathematics education and technology – Rethinking the terrain. [The 17th ICMI study] (pp. 425-438). New York: Springer.
Dording, C. (2009). Aire d’un disque. found 31 March, 2011 at http://i2geo.net/xwiki/bin/view/Coll_cdording/Airedundisque
Gray, S., Loud, B., & Sokolowsi, C. (2005). Undergraduates’ errors in using and interpreting variables: A comparative study. In G. Lloyd, M. Wilson, J. Wilkins, & S. Behm (Eds.), Proceedings of the 27th annual meeting of the North American Chapter of the International Group for the Psychology of Mathematics Education. Eugene, OR: All Academic.
Hohenwarter, M. et al. (2001, 2010). GeoGebra [computer software]. Linz, Austria: GeoGebra Inc.
Jackiw N, (2009). The Geometer’s Sketchpad (Version 5) [computer software]. Berkeley, CA: Key Curriculum Press.
Küchemann, D. (1981). Algebra. In K. Hart (Ed.), Children’s understanding of mathematics: 11-16, (pp. 102-119). London: John Murray.

June 17-18, 2011 [GEOGEBRA-NA 2011]
Conference Proceedings Page 67
Laborde, C. (2007). The role and uses of technologies in mathematics classrooms: Between challenge and modus vivendi, Canadian Journal of Science, Mathematics and Technology Education, 7(1), 68 - 92.
Laborde, C. & Laborde, J.-M. (2008). The development of a dynamical geometry environment: Cabri-géomètre. In G. Blume & M. Heid (Eds.) Research on technology in the learning and teaching of mathematics, volume 2: Cases and perspectives, (pp 31-52). Greenwich, CT: Information Age.
Laborde, J.-M. et al. (2003). Cabri II Plus [computer software]. Grenoble: Cabrilog.
Mackrell, K. (2011a) Design decisions in interactive geometry software. ZDM, 43(3)
Mackrell, K. (2011b) Integrating number, algebra, and geometry with interactive geometry software. In Proceedings of CERME 7
Richter-Gebert, J.,& Kortenkamp, U. (2007) Cinderella 2 [computer software]. Heidelberg: Springer.
Richter-Gebert, J. & Kortenkamp, U. (2010). The power of scripting: DGS meets programming. Acta Didactica Napocensia, 3(2), 59-66.
Return to the Table of Contents
[GEOGEBRA-NA 2011] June 17-18, 2011
Conference Proceedings Page 68
TOWARD A COLLECTION OF GEOGEBRA CALCULUS APPLETS
Marc Renault
Shippensburg University, US
Note: Paper on Innovative Practices and Development Activities
Abstract
During the fall of 2010, I had the opportunity to devote a sizeable amount of time creating a collection of online applets for use in a typical college Calculus I class. In this paper I describe my experiences using GeoGebra to construct these applets. I describe the need for such a collection, my design considerations, some of the obstacles I encountered, and my own assessment of the project. Furthermore, I class-tested these applets in spring 2011, and I report on the success of their class use. Before reading any further, the reader is strongly encouraged to explore these applets. The collection is available at http://webspace.ship.edu/msrenault/GeoGebraCalculus/GeoGebraCalculusApplets.html Keywords: Calculus, applets, learning through exploration, student activities, in-class
demonstrations, JavaScript
Need
Is there really a need for more Calculus applets on the Web? Surely by now the Internet must be
practically overflowing with quality Calculus demonstrations and activities, right? This is what I
thought at the beginning of 2010, but Googling “Calculus Applets” quickly disabused me of that
notion. There are many Calculus applets available, but (1) there are few sizeable collections
suitable for an entire Calculus course, (2) many applets use older Java technology which looks
dated and clunky, and (3) many applets are just not well made, following a “more features make
a better applet” approach, and finally (4) many applets do not have solid pedagogical
accompanying text.
To be fair, the collection at http://www.calculusapplets.com by Thomas S. Downey is quite good,
and its existence gave me reason to think that there was no need for me to create my own
collection. However, I ultimately decided to proceed because GeoGebra offers an aesthetic and
usability that I find more appealing.
Goals of the Project
I wanted a collection of Calculus applets that solved some of the shortcomings I observed. I
desired the following characteristics:
• the collection should be organized and complete, closely following standard curricula
June 17-18, 2011 [GEOGEBRA-NA 2011]
Conference Proceedings Page 69
• applets must have aesthetic appeal
• each applet should have a defined, focused goal, and not get lost in “feature overload”
• applets should have appropriate accompanying text and explorations
• applets should be easy to use – in fact, one should intuit their use without having to read
through explanations
• applets should be suitable for student exploration outside of class
• applets should be suitable for instructor in-class demonstrations.
• the applets should run in any web browser without requiring any extra software
• the applets should be easy for me to create and modify
I decided to use GeoGebra because it creates aesthetically-pleasing applets and it is easy to use.
Moreover, the fact that it is free software means that students who are interested can continue to
explore it further on their own.
Results of the Project
By the end of fall 2010, I had created 44 applets together with explanatory text and
accompanying exploration activities. Most are in the Calculus topic of differentiation; the
integration treatment could still benefit from further development.
The design of each applet page follows an applet-explanation-exploration format; I thought it was
important to put the applet at the top of the page to grab the user’s attention right away. This
also facilitates its use for in-class demonstrations.
While the applets are written using GeoGebra, I often incorporated JavaScript in the HTML page
to increase the functionality of the applet. There are many times that nice effects were achieved
by using JavaScript to make several applets “communicate” with each other on the same page.
Difficulties
There were several unexpected difficulties I encountered in this project. The first is the fact that it is
not easy at all to create mathematical text in an HTML page. In order to incorporate applets and
JavaScript into the HTML page, I decided that I would edit the HTML code directly instead of using
a WYSIWYG editor – this compounded the difficulty of incorporating mathematical text. In fact,
the first few weeks of my project were dedicated to finding a way to make this work well. After
considering (and having difficulties with) JSMath, ASCIIMath, and MathJax, I ultimately ended up
writing a JavaScript file that converted TeX-like HTML code into formatted HTML code using CSS. It
may not be the most elegant solution, but it gave me good control over how the mathematical
notation appeared.

[GEOGEBRA-NA 2011] June 17-18, 2011
Conference Proceedings Page 70
A second difficulty is that buttons, script, text-boxes, and drop-down menus are not built into
GeoGebra itself (yet). I would have preferred putting buttons on the applet stage itself, but I
settled for putting them just next to the applet instead, and using JavaScript to handle the button
clicks.
Although not technically a “difficulty” I had a sudden dearth of inspiration when I started trying to
think up applets to accompany more computational topics such as the product rule and chain
rule. GeoGebra’s graphical strengths did not apply here. One could make graphical applets to
accompany the rules, but I doubt that such graphical demonstrations would add significantly to a
student’s understanding or ability of the rules.
Classroom testing
I incorporated these applets into my teaching of Calculus I during spring semester 2011.
Final Reflections
I am very pleased with where the project currently stands, but I am also open to suggestions for
further improvement. Perhaps this is one of the greatest strengths of the Web: pages may be
improved at any time. GeoGebra was well-suited to the task, and the results were beautiful
applets and beautiful mathematics.
References
calculusapplets.com http://www.calculusapplets.com
MathJax http://www.mathjax.org/
jsMath http://www.math.union.edu/~dpvc/jsMath/
ASCIIMathML http://www1.chapman.edu/~jipsen/mathml/asciimath.html
Return to the Table of Contents

June 17-18, 2011 [GEOGEBRA-NA 2011]
Conference Proceedings Page 71
GEOGEBRA AND ONLINE COLLABORATIVE MATHEMATICS
Geoffrey Roulet
Faculty of Education, Queen’s University, Kingston, Canada
Note: Working group session
“Mathematics is … not physical, not mental, but social”. It is “a social-cultural-historical entity”
(Hersh, 1997, pp.248-9). Although mathematical progress does at times involve periods of intense
individual work, an examination of the discipline’s history shows that growth has come from each
contributor building on the work of their predecessors and contemporaries. This is illustrated most
vividly by the 350 years of efforts to construct a proof to Fermat’s Last Theorem (Singh, 1997),
during which multiple mathematicians combined ideas from previous generations to progress
towards a solution. The larger social nature of this puzzle can be seen in the fact that news of
Wiles’ solution appeared on the front page of the June 24, 1993 edition of The New York Times
(Kolata, 1993) and was featured in many other newspapers around the world. Mathematics is a
shared human enterprise and today for many, particularly students in schools and universities,
information sharing means interaction via the Internet.
GeoGebra, written in Java, has natural links to the Internet or web. In fact those without the
software installed on their computers can run the program as an application within a web-browser
window by going to the URL http://www.geogebra.org/webstart/geogebra.html. In addition,
GeoGebra, via the menu sequence File > Export > Dynamic Worksheet as Webpage (html)…,
allows users to generate html files that hold Java applets for modified versions of GeoGebra.
Teachers, by reducing the range of user options and providing tools constructed within
GeoGebra, have used this option to produce interactive student learning activities. Two examples
of such resources can be found at http://www.uff.br/cdme/jct/jct-html/jct-en.html and
http://queensgeogebra.pbworks.com/f/Score_a_Basket.html.
But, the GeoGebra instruction “Dynamic Worksheet as Webpage” may be somewhat of a
misnomer or possibly lead us off along a restricted path. Yes, this function can be used by
instructors to generate effective online worksheets for students, but possibly more importantly any
GeoGebra user can employ the tool to produce a webpage that displays the results of their work.
Once this file is mounted on a website the GeoGebra work is available for viewing and additional
manipulation by others interested in the original mathematical problem or exploration. At Madeira

[GEOGEBRA-NA 2011] June 17-18, 2011
Conference Proceedings Page 72
High School in Cincinnati, Ohio, students in the Honours Geometry course share their solutions to
problems with classmates and all web users by posting GeoGebra applets to a wiki
(http://madeiramath2.wikispaces.com/) established and maintained by their teacher Steve
Phelps. Such online GeoGebra sharing by students can be expanded into full collaboration by
mechanisms that support responding to and building upon previously posted work.
Research in GeoGebra supported online asynchronous collaboration has been studied by Stahl
(Stahl, Ou, Cakir, Weimar & Goggins, 2010) in the Virtual Math Teams project associated with the
Problems of the Week resource (http://mathforum.org/problems_puzzles_landing.html) at the
Math Forum. In this environment students interact via text chat while working on a problem. In this
they are supported by a shared whiteboard for displaying their work, and a multi-user version of
GeoGebra. Manipulations on the whiteboard and within GeoGebra are seen by all group
members online and can be graphically linked to comments within the chat. Online collaborative
work using the Virtual Math Teams tools has been found to “be an exciting, engaging, motivating
and rewarding experience” (p. 130) for students as they solve problems that can be addressed
over a limited timeframe. For larger sustained investigations online asynchronous tools may be
required.
Mathematical Collaboration with Wikis and GeoGebra
Roulet (2010) has experimented with combining a wiki structure (MediaWiki, www.mediawiki.org)
with GeoGebra to create an environment in which students can work in asynchronous mode to
collaboratively explore mathematics problems. The planned combination of MediaWiki and
GeoGebra would provide a space where a teacher could initiate a group problem solving activity
by creating a new wiki page describing a problem and embedding a GeoGebra applet as a
starting point. Students could then contribute to a solution by adding linked pages that contain a
revised GeoGebra window and in text provide commentary on the changes they made. A
student, while studying the contributions of his or her collaborators, could at any point grab a
GeoGebra instance that they viewed as productive, create a new linked wiki page, paste in the
GeoGebra file and then use this as a starting point for further investigation, along with providing a
text message describing their actions and thinking. Since this contribution could be inserted at any
point in the conversation there would be the potential for branching and multiple investigation
paths (see Figure 1).

June 17-18, 2011 [GEOGEBRA-NA 2011]
Conference Proceedings Page 73
Figure 1: Wiki structure combined with GeoGebra.
Efforts in this project have so far led to linking of GeoGebra applets to MediaWiki pages, but the
production of the Java code and the links has not been automated. Users must export their
GeoGebra work as a Dynamic Worksheet, upload the html file, and then add the required linking.
Since both MediaWiki and GeoGebra are open source software providing access to the
underlying code it should be possible to add functionality automating these processes, but this is
proving to be a more complex task than originally imagined.
While working on the MediaWiki based resource we have also implemented a prototype of the
planned environment using a PBworks (http://pbworks.com/) wiki, a tool familiar to many teachers
and students. As in MediaWiki a collaborative exploration results in a network of linked pages each
setting out solution suggestions and holding an illustrating GeoGebra sample (see Figure 1). To
explore an online version of the network displayed in Figure 1 go to:
http://collabmath.pbworks.com/w/page/33624093/model-of-simple-online-collaboration.

[GEOGEBRA-NA 2011] June 17-18, 2011
Conference Proceedings Page 74
Here in PBworks users must again locally save a Dynamic Worksheet containing their GeoGebra
applet, upload this to the wiki, and insert an appropriate link from a page containing their
explanation. In PBworks this is all relatively straight forward and likely something familiar to many
high school and university students. Although the individual steps should not be a problem it
remains to be seen if the time they consume is an impediment to student use and free flowing
collaboration.
Adding Video for Student Explanations
Increasingly sharing across the web is taking place via video. At the end of 2010 Canadian high
school and college/university age Internet users were on average spending close to 20 h per
month while viewing in excess of 200 online videos (comScore, 2011). Thus students might find it
more “natural” to present their thinking and GeoGebra manipulations in video format rather than
text on a wiki page. Jing (TechSmith, 2010) and the related website, www.screencast.com makes
this easy to accomplish and at no cost. With Jing installed on their computer a student can record
a video of a GeoGebra window as they work on a problem solution and in audio provide the
thinking behind their actions. The resulting video, stored in the student’s private folder at
www.screencast.com can be embedded into a wiki page along with the link to an applet holding
GeoGebra in the state it was left at the end of the video. Go to:
http://collabmath.pbworks.com/w/page/40790294/model-of-simple-online-collaboration-with-
video to view the wiki pages of a problem solving activity parallel to that shown in Figure 1, but with
the students presenting their thinking within Jing videos.
Beyond the Technology
In 2004 Nason and Woodruff, in discussing the problems faced in computer supported
collaborative learning in mathematics, argued that most school mathematics problems do not
engage students in extended conversations and online collaborative learning environments do not
support the simple exchange of mathematical ideas in symbol or image forms. The experiments to
date, related above, show that the technical problem identified by Nason and Woodruff has
essentially been addressed. Tools exist to support online GeoGebra collaborative explorations and
problem solving. Combining wikis, GeoGebra, and video is relatively easy. But a technical solution
is not sufficient.
Research (Roulet 2011) examining student collaboration within Math-Towers (www.math-
towers.ca), a website designed for students in Grades 6 to 10, shows that providing tools for
mathematical investigations and user sharing does not guarantee successful collaboration.
Students need to arrive at the website with prior classroom experience with open-ended problem

June 17-18, 2011 [GEOGEBRA-NA 2011]
Conference Proceedings Page 75
solving and the view that progress comes from all participants contributing suggestions that may
not be fully formed or obvious routes to a solution. Teacher coaching to encourage the posting of
initial ideas is often required. In addition, as noted by Nason and Woodruff (2004) there is a need
for problems that are accessible by the student and at the same time sufficiently complex and
interesting to sustain student motivation over a period of several days. Thus those wishing to
develop online environments to support asynchronous collaborative mathematics exploration
need to address technical, social, pedagogical, and curricular issues.
Questions to be Explored
Below is a non-exhaustive list of issues and question that might be explored by a working group
wishing to provide students with a GeoGebra based online environment for collaborative
mathematics investigations.
A. Technical
1. Medium of communication for student explanations – text, voice, video
2. Presently available tools that could be combined – GeoGebra, wikis, video and audio support
3. Level of automation required – Can we expect students to handle saving, uploading, and linking?
B. Social
1. Group composition and size
2. Social norms required – commitment to the group, respect for the contributions of others
C. Pedagogical
1. Prior student experience required – technical and problem solving
2. Teacher support and intervention possibly required
3. Balance between teacher coaching and student freedom to explore
D. Curricular
1. Appropriate grade levels and topics
2. Problems and investigation roots that can sustain student interest
References
comScore. (2011, March 8). Canada digital year in review: 2010. Retrieved April 29, 2011 from http://www.comscore.com/Press_Events/Presentations_Whitepapers/2011/2010_Canada_Digital_Year_in_Review
Hersh, R. (1997). What is mathematics, really?. New York: Oxford University Press.
Kolata, G. (1993, June 24). At last, shout of 'Eureka!' in age-old math mystery. The New York Times, pp. A1, D22.

[GEOGEBRA-NA 2011] June 17-18, 2011
Conference Proceedings Page 76
MediaWiki [computer software]. Version 1.15.3. Available at: www.mediawiki.org
Nason, R., & Woodruff, E. (2004). Online collaborative learning in mathematics: Some necessary innovations. In T. S. Roberts (Ed.), Online collaborative learning: Theory and practice (pp. 103-131). Hershey, PA: Information Science Pub.
Roulet, G. (2010). GeoGebra as a component of online collaborative mathematics investigations: Present work toward realizing a dream. In D. Novak, D. Martinovic, and Z. Karadag (Eds.), Proceedings of the First North American GeoGebra Conference (Ithaca, July 27-28) (pp. 166-171). [CD ROM]
Roulet, G. (2011). Supporting online collaborative mathematical exploration: Studying the development of collective knowledge within Math-Towers. International Journal of E-Adoption (IJEA), 3(2), 27-36.
Singh, S. (1997). Fermat’s enigma: The epic quest to solve the world’s greatest mathematical problem. London: Penguin.
Stahl, G., Ou, J. X., Cakir, M., Weimar, S., & Goggins, S. (2010). Multi-user support for virtual GeoGebra teams. In D. Novak, D. Martinovic, and Z. Karadag (Eds.), Proceedings of the First North American GeoGebra Conference (Ithaca, July 27-28) (pp. 123-130). [CD ROM]
TechSmith. (2010). Jing: Version 2.4.10231 [computer software]. Available at: http://www.techsmith.com/jing/
Return to the Table of Contents

June 17-18, 2011 [GEOGEBRA-NA 2011]
Conference Proceedings Page 77
CLASSICAL GEOMETRY WITH GEOGEBRA
Petra Surynková
Charles University in Prague
Faculty of Mathematics and Physics, Czech Republic
Abstract
This contribution addresses the application of dynamic system GeoGebra in teaching and learning geometry. Our aim is to increase the interest of students in studying classical geometry at secondary schools and colleges. One possible approach of improvement in studying geometry is the integration of computer software in the teaching process. This way seems to be interesting, attractive and motivational for students. Indeed the usage of computers in education is very modern. We will use GeoGebra for visualization, for the proving geometric problems in the plane or for the demonstration practical uses of geometry. The usage of software will be shown on some concrete examples. We will demonstrate the advantages of dynamic geometry system on examples from the field of kinematic geometry. We will compare GeoGebra with other systems for geometric modeling with respect to accessible functions. We will mention how to use geometric systems for image creation or illustrations of geometric problems. The outputs can be used in publications and also for home schooling and e-learning.
Key words: kinematic geometry, classical geometry, motion
1 Introduction and motivation
Geometry, the study of properties and relations of geometric figures, is an important and essential
branch of mathematics. Geometry is important for everyone, not only for technicians, designers,
architects, builders or civil engineers. We all need good visual imagination in our everyday life as
well. The two and three dimensional shapes which surround us are originated in geometry. The
world we live in is influenced by geometry. If we know how to understand and apply the
relationship between shapes and sizes we can use it more efficiently. Some people think in images
and shapes so they need the understanding of geometry to be able to do that.
Without the use of geometry the great works of artists, painters and builders would only have
stayed in ideas and dreams.
According to (Hilbert, 1999) the study of geometry develops logical reasoning and deductive
thinking which helps us expand both mentally and mathematically. If we learn to use geometry
we also learn to think logically. It’s very important in everyday life – many difficult problems can be
erased and the simple solutions can be found. Students can often solve problems from other fields
more easily if they represent the problems geometrically.

[GEOGEBRA-NA 2011] June 17-18, 2011
Conference Proceedings Page 78
Geometry is useful for learning other branches of mathematics and it can also be used in a wide
range of scientific and technical disciplines. Some scientific branches require direct knowledge of
geometry.
Geometry can be conceived as an independent discipline with many branches – Euclidean
geometry, differential geometry, algebraic geometry, topology, no-Euclidian geometry and so on.
The main field of our interest is the study of classical geometry and descriptive geometry –
geometric constructions, projections, geometry of curves and surfaces. Mainly it is geometry which
allows the representation of three dimensional objects in two dimensions. Classical geometry is
geometry of the Euclidean plane and space.
The remainder of this paper is organized as follows: the section 2 is devoted to current problems of
the unpopularity and the difficulty of studying geometry. The main subject of the section 3 is how
to increase the interest of students in studying classical geometry. In the section 4 we will describe
kinematic geometry and in the section 5 we will introduce some definitions and examples of
special motions. We will also demonstrate the advantages of the dynamic geometry system
GeoGebra on concrete examples from the field of kinematic geometry.
2 The study of geometry
The study of geometry can be very difficult. This branch of mathematics isn’t popular among
students. Drawings (the results of geometric projections) are sometimes very difficult to understand.
For that reason geometric problems must be provided with clear examples. Intuitive
understanding plays a major role in geometry. With the aid of visual imagination we can illuminate
the problems of geometry. It is possible in many cases to show the geometric outline of the
methods of investigation and proof without entering needlessly into details. The problem can be
more understandable without strict definitions and actual calculations. Such intuition has a great
value not only for research workers, but also for anyone who wishes to study and appreciate the
results of research in geometry. Of course if we understand the main principles of a problem then
we can use exact definitions.
The currently predominant view among students and the general public is that classical geometry
is not important and useful. Drawings of classical geometry can be replaced by the outputs of
modern computer software. Of course, computers can help us solve geometric problems and
increase the efficiency of our work but we still have to know the basic principles and rules in
geometry.
Is it possible to learn geometry? Yes, but it would be easier for students if they had encountered
classical geometry, constructions and geometric proofs earlier. Sometimes students of technical

June 17-18, 2011 [GEOGEBRA-NA 2011]
Conference Proceedings Page 79
specializations experience geometry only at college. That is too late. We work mainly with
undergraduate students, so what can be done to make college geometry more comprehensible?
How to increase the interest of students in studying classical geometry at secondary schools and
colleges? This is the main subject of this article.
3 How to increase the interest in studying geometry; use of computers in the teaching process
Our aim is to increase the interest of students in studying classical geometry at secondary schools
and colleges. One possible approach of improvement in studying geometry is the integration of
computer software in the teaching process. This way seems to be interesting, attractive and
motivational for students. Indeed the usage of computers in education is very current. Computers
influence our everyday life including geometry. We have to follow the general trend.
Nowadays, computer-aided design is commonly used in the process of design, design
documentation, construction and manufacturing processes. There exist a wide range of software
and environments which provide the user input tools for modeling, drawing, documentation and
design process. These software and environments can be used to design curves and geometric
objects in the plane and curves, surfaces and solids in the space. According to the applications
more than just shapes can be involved. In modern modeling software we can also work with
rotations and other transformations; we can change the view of a designed object. Some
software provides dynamic modeling. Technical and engineering drawings must contain material
information and the methods of construction. Computer-aided design is used in numerous fields:
industry, engineering, science and many others. The particular use varies according to the
profession of the user and the type of software.
These modern methods which are widespread in various branches can be useful in the teaching
process, too. We can prepare students for their future employment. We still place emphasis on the
understanding of the principles used in geometry.
I have my own experience of teaching classical geometry, descriptive geometry and
computational geometry at universities – Charles University in Prague – Faculty of Mathematics
and Physics and Czech Technical University in Prague – Faculty of Architecture. College
mathematics and geometry is very difficult for many students. It is necessary to motivate and to
arouse their interest in geometry. As was mentioned above, it is necessary to improve the teaching
of geometry at elementary schools and at secondary schools.
In my lessons I use computer software for visualization, for the proving of geometric problems in the
plane and in the space or for the demonstration of the application of geometry in practice. I work
for example with Rhinoceros - NURBS modeling for Windows (Rhino), Cabri II Plus, Cabri 3D and of

[GEOGEBRA-NA 2011] June 17-18, 2011
Conference Proceedings Page 80
course with GeoGebra. Use by teachers and students is always free of charge, it is the great
advantage of GeoGebra. Consequently it can be used by students for home schooling and e-
learning. Nowadays we have extensive database of geometric tasks, images and 3D models – the
outputs of these software.
I use GeoGebra for creation of stepwise guides through geometric construction which can help
my students understand the problem in intuitive and natural way. Moreover I show special
constructions applied in descriptive geometry and due to included functions and tools students
can discover proofs more easily. In this contribution we will demonstrate the advantages of
dynamic geometry system on examples from the field of kinematic geometry. Good geometric
imagination and perception is very important for understanding constructions in geometry. It is not
possible to learn the constructions by heart, we have to understand geometric problems. Let us
start with the theoretical part of kinematic geometry. It is necessary for further understanding
because we will explain important terms. Then we will introduce definitions and examples of curves
which are created by special motion of geometric objects.
4 Kinematic geometry
Kinematic geometry in the plane is a branch of geometry which deals with the geometric
properties of objects which are created by motion of moving plane. Geometric motions – that is
without regard to the cause of the motion, velocity and acceleration. Theoretical kinematics is a
large subject and it is not possible to treat it completely in this article. We will restrict to essential
basics.
We consider unbounded infinite plane which contains geometric elements (points and curves).
We mainly treat such elements as points, straight lines, circles and line segments and study the
geometric properties which arise as the move in the plane. Especially we are dealing with aspects
of transformation geometry. We consider those transformations in the Euclidean plane such that all
distances remain fixed during the motion.
The treatment in this article is geometrical thus only geometric interpretations are given.
4.1 The determinations of geometric motion
Let Σ be the moving plane which slide over the fixed plane Π. The moving plane Σ contains curves
and points which are at each instant of the motion identical. In the fixed plane there are
generated the roulettes and the envelopes. Any point of the moving plane Σ describes a curve, its
path (often called roulette), in the fixed plane Π. Any curve of the moving plane Σ describes a
curve, its envelope, in the fixed plane Π. The path is the locus of a point in the moving plane.
Geometrical envelope of a family of curves in the moving plane is a curve which at each of its

June 17-18, 2011 [GEOGEBRA-NA 2011]
Conference Proceedings Page 81
points is tangent to a curve of the family. Let Σ , Σ , Σ , … denote the sequence of positions of the
moving plane Σ. The positions in the moving plane of points , , , … will be , , , … when Σ is at
Σ and , , , … when Σ is at Σ . It is analogical for curves. Figure 1 shows an example of the
motion of the moving plane.
Figure 6. An illustration of the moving plane containing points , , (with line segments) which slide over the fixed plane . Points , , describe curves , , - the paths. , are given, is obtained by moving. Indices denote positions of the moving plane. All distances remain fixed. Let us discuss the determination of the motion in the plane. There are several possibilities how to
define the motion:
a) The motion is completely determined by paths and of two points and (end points of
segment line). These points are in the moving plane, the paths are in the fixed plane. The
following equations are satisfied: | | | | | … See figure 2. |
b) The motion is completely determined by envelopes and of two curves and . These
curves are in the moving plane, the envelopes are in the fixed plane. The following equations
are satisfied: | | | | | | … See fig 3. ure
c) The motion is completely determined by envelope of curve and path of point . The
following equations are satisfied: | | | | | | … See figure 4.
In special cases the envelope of a family of curves in the moving plane degenerates into point.
These situations are shown in figures 5 and 6.
The proofs of these theorems can be found in (Bottema & Roth, 1979) and (Lockwood, 1967).

[GEOGEBRA-NA 2011] June 17-18, 2011
Conference Proceedings Page 82
Figure 7. The motion is given by paths and of two point and .
Figure 8. The motion is given by envelopes and of two curves and .

June 17-18, 2011 [GEOGEBRA-NA 2011]
Conference Proceedings Page 83
Figure 9. The motion is given by envelope of curve and path of point .
Figure 10. The motion is given by envelopes and of two curves and which degenerate into points.
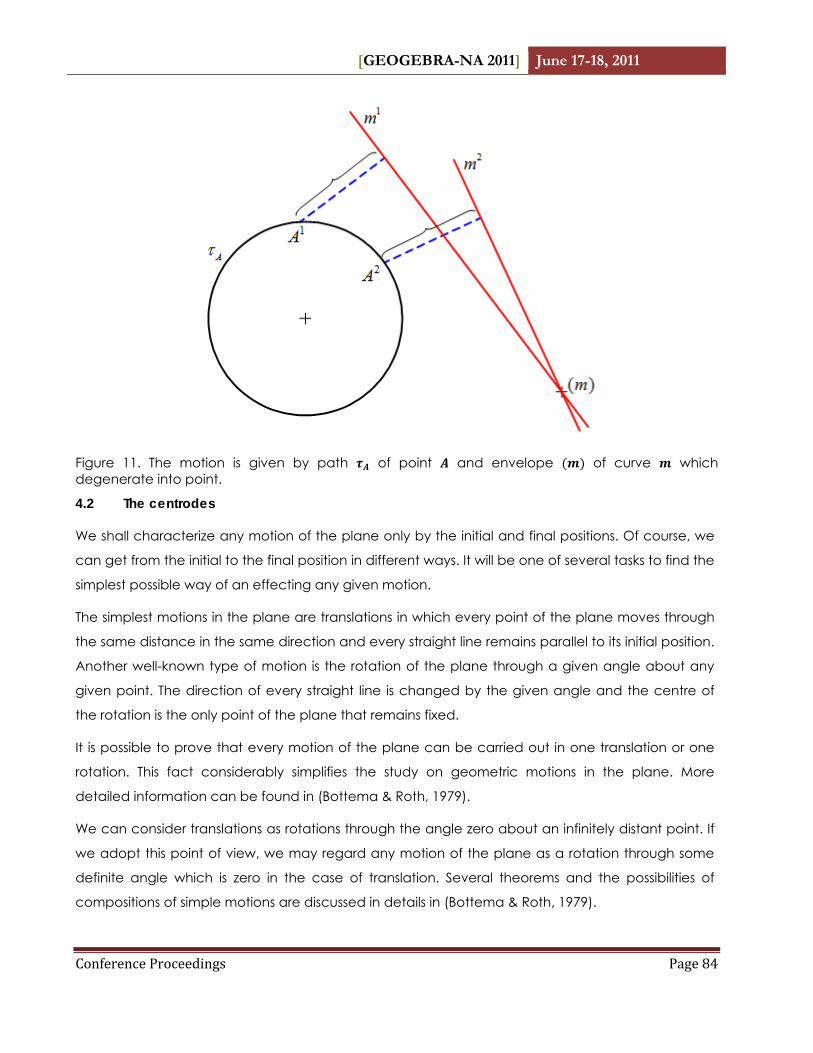
[GEOGEBRA-NA 2011] June 17-18, 2011
Conference Proceedings Page 84
Figure 11. The motion is given by path of point and envelope of curve which degenerate into point.
4.2 The centrodes
We shall characterize any motion of the plane only by the initial and final positions. Of course, we
can get from the initial to the final position in different ways. It will be one of several tasks to find the
simplest possible way of an effecting any given motion.
The simplest motions in the plane are translations in which every point of the plane moves through
the same distance in the same direction and every straight line remains parallel to its initial position.
Another well-known type of motion is the rotation of the plane through a given angle about any
given point. The direction of every straight line is changed by the given angle and the centre of
the rotation is the only point of the plane that remains fixed.
It is possible to prove that every motion of the plane can be carried out in one translation or one
rotation. This fact considerably simplifies the study on geometric motions in the plane. More
detailed information can be found in (Bottema & Roth, 1979).
We can consider translations as rotations through the angle zero about an infinitely distant point. If
we adopt this point of view, we may regard any motion of the plane as a rotation through some
definite angle which is zero in the case of translation. Several theorems and the possibilities of
compositions of simple motions are discussed in details in (Bottema & Roth, 1979).
June 17-18, 2011 [GEOGEBRA-NA 2011]
Conference Proceedings Page 85
Now the motion in the plane is given. We assume that Σ and Σ are two positions of the moving
plane Σ. The change of position Σ Σ is associated with a centre of rotation S . If we consider a
limiting position of Σ and Σ (the difference between Σ and Σ becomes smaller and smaller) the
point S is called the instantaneous centre of the motion which is related to instant i.
Definition 1. The locus of the instantaneous centres at every moment of the motion is a curve in the
fixed plane. This curve is called the fixed centrode of the motion. ■
But in the same motion we may also regard the plane Σ which we had considered movable as
fixed and the plane Π which we had considered fixed as moveable. That is we may interchange
the roles of the two planes. This motion is called the inverse motion. The original motion is called the
direct motion. One motion determines the other one and the inverse of the inverse motion is the
direct motion.
Definition 2. The locus of the instantaneous centres at every moment of the inverse motion to a
given motion is a curve in the moving plane. This curve is called the moving centrode of the direct
motion. ■
A more detailed study shows that the motion is completely determined by the form of the two
centrodes. At each instant of the motion the two curves are tangent to one another at the
instantaneous centre and there is no slipping. The motion is obtained by rolling (without slipping)
the moving centrode in the moving plane on the fixed centrode in the fixed plane. If we
interchange the roles of the centrodes we get the inverse motion. From the fact that the centrodes
roll on each other without slipping it follows that the arc bounded by any two points on the fixed
centrode has the same length as the arc bounded by the corresponding points on the moving
centrode. There is one more possibility how to define the motion:
d) The motion is completely determined by the fixed centrode and the moving centrode . The
following equations are satisfied: . See figure 7.
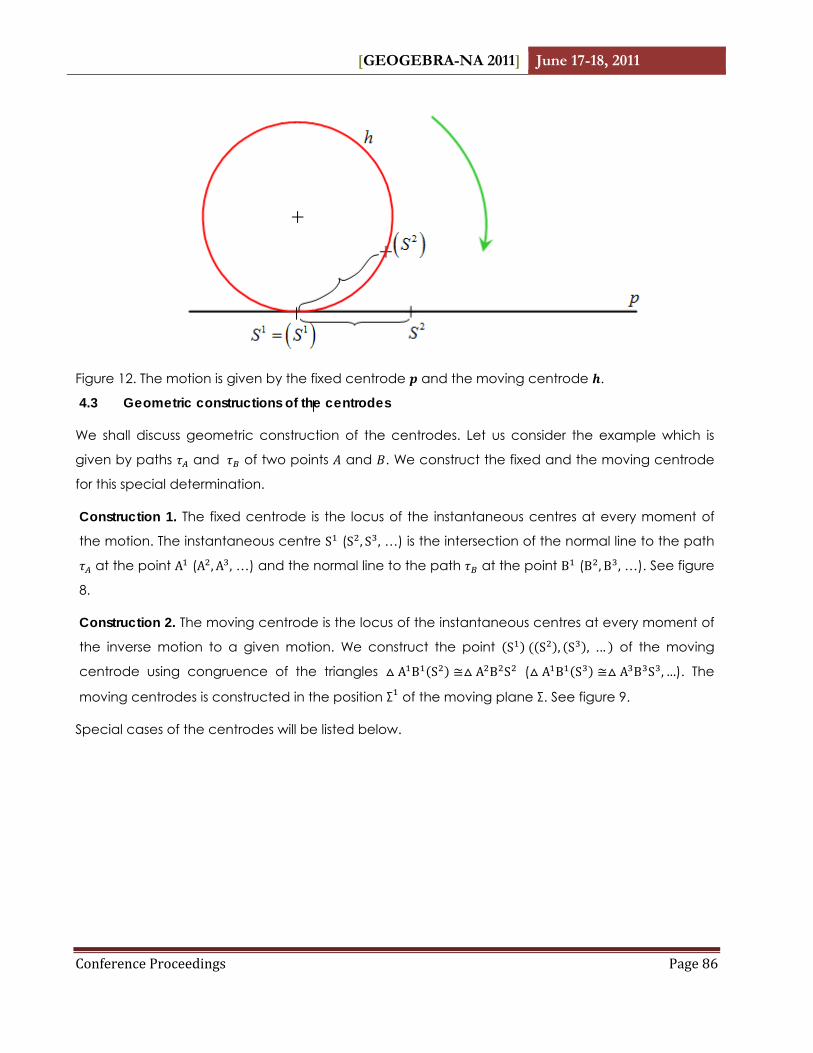
[GEOGEBRA-NA 2011] June 17-18, 2011
Conference Proceedings Page 86
Figure 12. The motion is given by the fixed centrode and the moving centrode .
4.3 Geometric constructions of the centrodes
We shall discuss geometric construction of the centrodes. Let us consider the example which is
given by paths and of two points and . We construct the fixed and the moving centrode
for this special determination.
Construction 1. The fixed centrode is the locus of the instantaneous centres at every moment of
the motion. The instantaneous centre S (S , S , …) is the intersection of the normal line to the path
at the point A (A , A , …) and the normal line to the path at the point B (B , B , …). See figure
8.
Construction 2. The moving centrode is the locus of the instantaneous centres at every moment of
the inverse motion to a given motion. We construct the point S S , S , ... of the moving
centrode using congruence of the triangles A B S A B S ( A B S A B S ,…). The
moving centrodes is constructed in the position Σ of the moving plane Σ. See figure 9.
Special cases of the centrodes will be listed below.
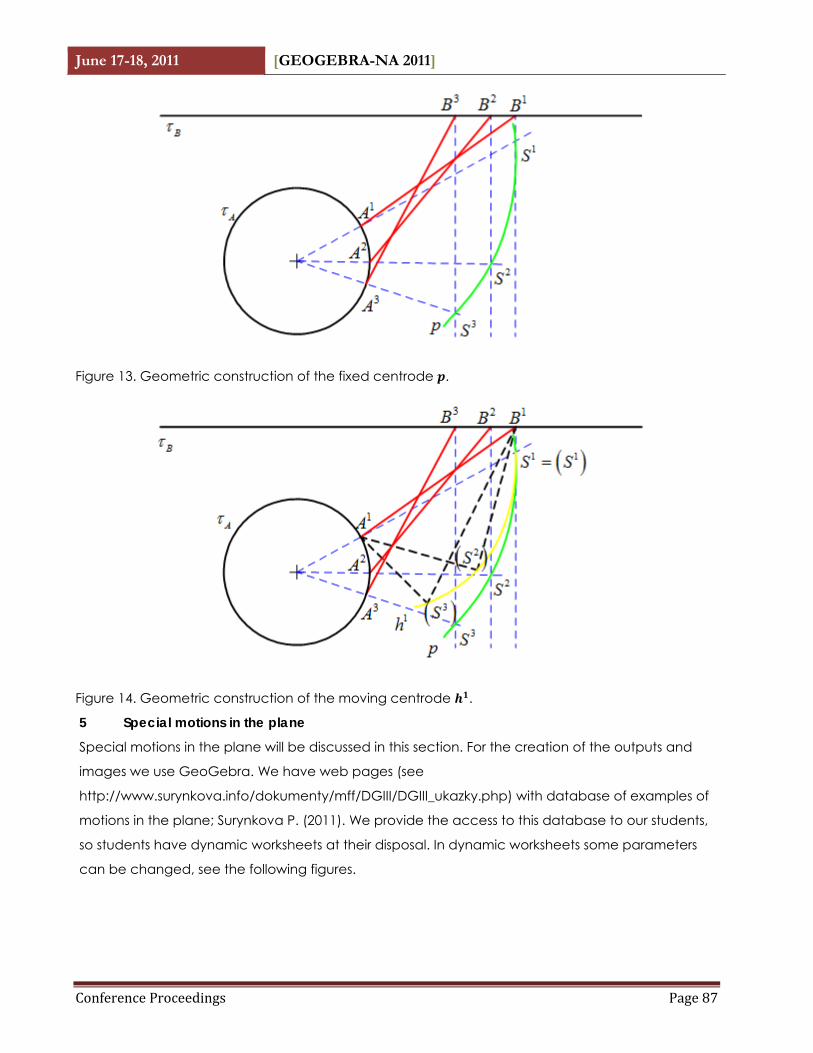
June 17-18, 2011 [GEOGEBRA-NA 2011]
Conference Proceedings Page 87
Figure 13. Geometric construction of the fixed centrode .
Figure 14. Geometric construction of the moving centrode .
5 Special motions in the plane
Special motions in the plane will be discussed in this section. For the creation of the outputs and
images we use GeoGebra. We have web pages (see
http://www.surynkova.info/dokumenty/mff/DGIII/DGIII_ukazky.php) with database of examples of
motions in the plane; Surynkova P. (2011). We provide the access to this database to our students,
so students have dynamic worksheets at their disposal. In dynamic worksheets some parameters
can be changed, see the following figures.

[GEOGEBRA-NA 2011] June 17-18, 2011
Conference Proceedings Page 88
5.1 Cyclical motion
As was mentioned above a plane motion may be defined by its centrodes. The simplest example
is the case where both centrodes are circles or one centrode is circle and the second is straight
line. These motions are called cyclical motions.
The motions are classified according to the type and relative positions of the centrodes.
We first consider the example where a circle is rolled on a straight line. That is the moving centrode
is the circle and the fixed centrode is the straight line. The paths of points which are obtained by
rolling the circle on the straight line are called cycloids, curtate cycloids or prolate cycloids,
generally cycloid. The motion is called cycloidal. The cycloid is the path of a point on the
circumference of the rolling circle, the prolate cycloid is the path of a point outside the rolling
circle and the curtate cycloid is the path of a point inside the rolling circle; see figure 10.
Figure 15. Cycloidal motion and examples of cycloids. Cycloid (blue), prolate cycloid (red),
curtate cycloid (green).
History and applications of cycloids is very important. More details can be found in (Rutter, 2000)
and (Lockwood, 1967).
We can interchange the roles of the two centrodes. That is a straight line is rolled on a circle. The
moving centrode is the straight line and the fixed centrode is the circle. The paths of points which
are obtained by rolling the straight line on a circle are called the involute of the circle. The motion
is called involute. The classification of paths is similar to the cycloidal motion. The paths of points

June 17-18, 2011 [GEOGEBRA-NA 2011]
Conference Proceedings Page 89
which are obtained by rolling the straight line on the circle are called involutes, curtate involutes or
prolate involutes; see figure 11.
Figure 16. Involute motion and examples of involutes. Involute (blue), prolate involute (red),
curtate involute (green).
We now consider the example where a circle is rolled on a second circle. There are three cases.
The paths of points which are obtained by rolling the circle on the outside of the fixed circle are
called epicycloids. The motion is called epicycloidal. The epicycloid is the path of a point on the
circumference of the rolling circle, the prolate epicycloid is the path of a point outside the rolling
circle and the curtate epicycloid is the path of a point inside the rolling circle; see figure 12.
The paths of points which are obtained by rolling the circle in the fixed circle are called
hypocycloids. The radii of the two circles cannot be equal. The motion is called hypocycloidal. The
hypocycloid is the path of a point on the circumference of the rolling circle, the prolate
hypocycloid is the path of a point outside the rolling circle and the curtate hypocycloid is the path
of a point inside the rolling circle; see figure 13.
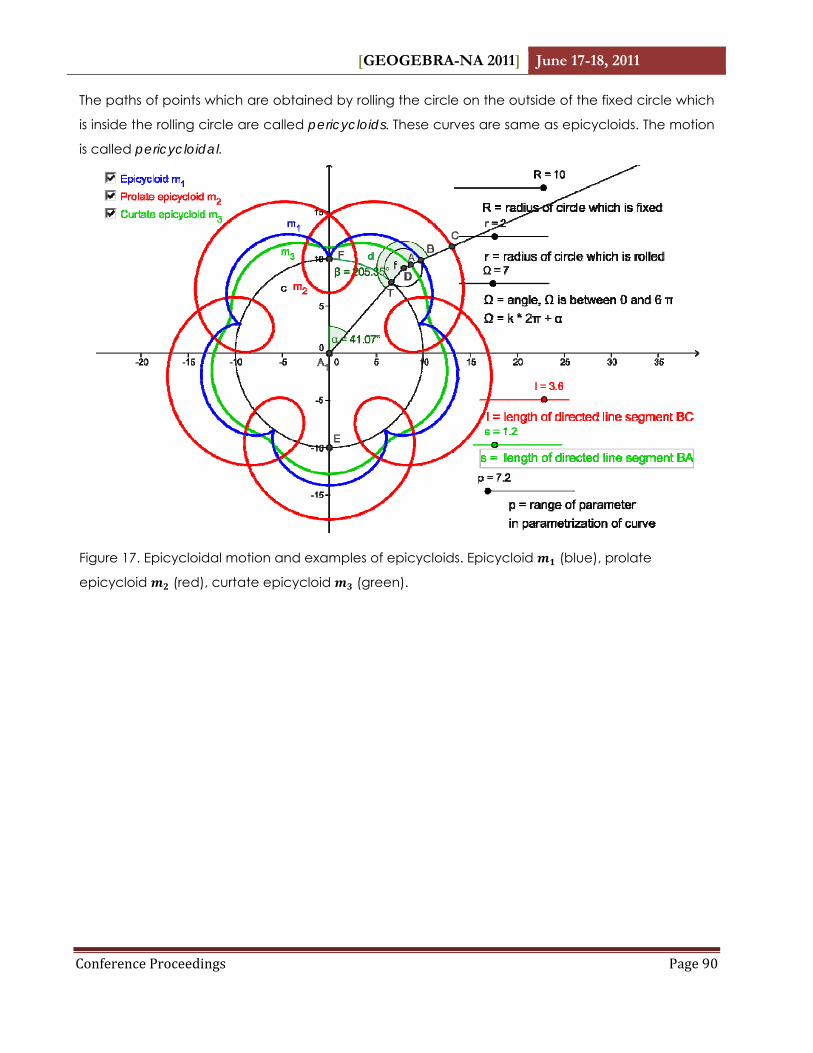
[GEOGEBRA-NA 2011] June 17-18, 2011
Conference Proceedings Page 90
The paths of points which are obtained by rolling the circle on the outside of the fixed circle which
is inside the rolling circle are called pericycloids. These curves are same as epicycloids. The motion
is called pericycloidal.
Figure 17. Epicycloidal motion and examples of epicycloids. Epicycloid (blue), prolate
epicycloid (red), curtate epicycloid (green).

June 17-18, 2011 [GEOGEBRA-NA 2011]
Conference Proceedings Page 91
Figure 18. Hypocycloidal motion and examples of hypocycloids. Hypocycloid (blue), prolate
hypocycloid (red), curtate hypocycloid (green).
5.2 Elliptic and cardioid motion
Figure 19. Elliptic motion.

[GEOGEBRA-NA 2011] June 17-18, 2011
Conference Proceedings Page 92
Figure 20. Cardioid motion.
The elliptic motion is given by paths and of two points and (end points of segment line)
where and are straight lines. It can be proved that this motion can be defined by rolling the
circle in the fixed circle. Radius of the fixed circle is double radius of the moving circle. That is the
elliptic motion is special case of hypocycloidal motion. The paths of points which are obtained by
this motion are ellipses, segment line or circle; see figure 14.
The cardioids motion is the inverse motion to the elliptic motion. The paths of points which are
obtained by this motion are limaçon of Pascal or circle. In special case limaçon of Pascal is
cardioid. It can be proved that this motion can be defined by rolling the circle on the outside of
the fixed circle which is inside the rolling circle. That is the cardioid motion is special case of
pericycloidal motion; see figure 15.
5.3 Conchoid motion
A conchoid is a curve derived from a fixed point , another curve, and a length . For every line
through that intersects the given curve at the two points on the line which are of d distance
from A are on the conchoid. We can get the branches of this curve by the conchoid motion which
is given by path of point and envelope of straight line which degenerate into point.
Envelope is the fixed point . See figure 16, there are some examples of various paths.

June 17-18, 2011 [GEOGEBRA-NA 2011]
Conference Proceedings Page 93
Figure 21. Conchoid motion where τA is a straight line.
In some publications other terms for the paths and the special motions can be found. We work with
the simplest notations.
There exists a wide range of various special motions in the plane. We discussed the most important
and the best known. We can also study the properties of curves; we refer the reader to (Abbena et
al., 2006) and (Pottman et al., 2007).
6 Conclusion
We discussed possible approaches how to increase the interest of students in studying classical
geometry at secondary schools and colleges. The integration of computer software, mainly
GeoGebra, in the teaching process we demonstrated on the examples from the field of kinematic
geometry. We also use GeoGebra for creation of stepwise guides through geometric construction
which can help students understand the problem in intuitive and natural way. Moreover we show
special constructions applied in descriptive geometry and due to included functions and tools
students can discover proofs more easily. Of course, students also create some examples and tasks
themselves.
We have web pages with database of geometric tasks in the plane and in the space. We provide
the access to this database to our students (undergraduate).

[GEOGEBRA-NA 2011] June 17-18, 2011
Conference Proceedings Page 94
In future work we will focus on further methods which can improve the teaching process. We plan
to extend our gallery of geometric tasks.
References
Abbena E., Gray A., Salamon S. (2006). Modern differential geometry of curves and surfaces with MATHEMATICA. Taylor & Francis Group, Boca Raton, USA.
Bottema O., Roth B. (1979). Theoretical kinematics. Dover Publications, New York, USA.
Hilbert D. (1999). Geometry and the imagination. American Mathematical Society, USA.
Lockwood E. H. (1967). A book of curves. Cambridge University Press, United Kingdom.
Pottman H., Asperl A., Hofer M., Kilian A. (2007). Architectural geometry. Bentley Institute Press, USA.
Rutter J. W. (2000). Geometry of curves. Chapman and Hall mathematics series, USA.
Surynkova P. (2011). Examples of kinematic motions. Retrieved January 1, 2011, from http://www.surynkova.info.
Return to the Table of Contents
June 17-18, 2011 [GEOGEBRA-NA 2011]
Conference Proceedings Page 95
Martinovic, D., Karadag, Z., & McDougall, D. (Eds.)(2011). Proceedings of the Second North American GeoGebra Conference, GeoGebra-NA 2011, June 17-18, 2011, Toronto, ON: University of Toronto.
ISBN 978-0-920233-65-8 (CD)