geografía de china
TRANSCRIPT

Susan M. PojerSusan M. PojerHorace Greeley HS Chappaqua, NYHorace Greeley HS Chappaqua, NY
Susan M. PojerSusan M. PojerHorace Greeley HS Chappaqua, NYHorace Greeley HS Chappaqua, NY

Satellite View of ChinaSatellite View of China
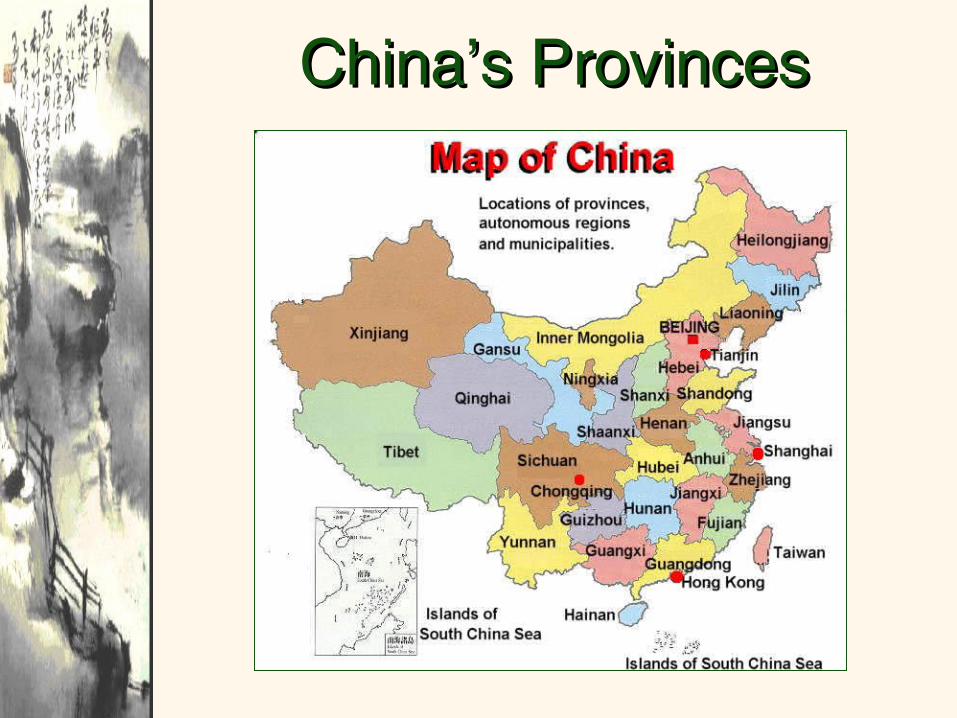
China’s ProvincesChina’s Provinces

China—Asia’s China—Asia’s SuperpowerSuperpower
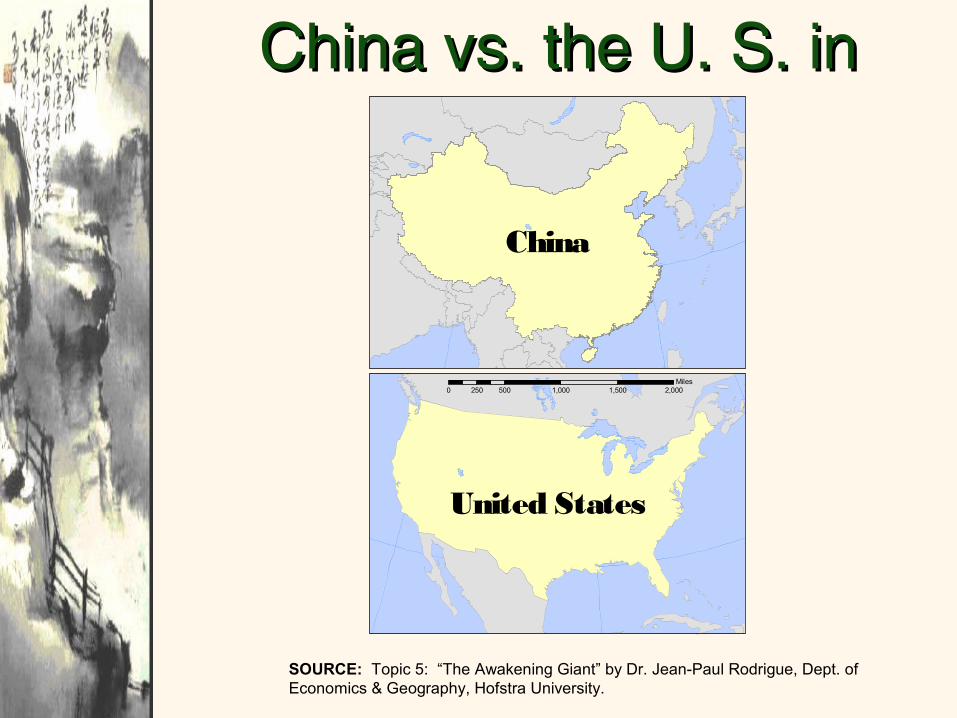
China vs. the U. S. in China vs. the U. S. in SizeSize
0 500 1,000 1,500 2,000250Miles
China
United States
SOURCE: Topic 5: “The Awakening Giant” by Dr. Jean-Paul Rodrigue, Dept. of Economics & Geography, Hofstra University.

Comparing China & the Comparing China & the U. S.U. S.ChinaChina United StatesUnited States
SizeSize 3.7 million 3.7 million square milessquare miles
3.6 million 3.6 million square milessquare miles
Main physical Main physical barrierbarrier
HimalayasHimalayas RockiesRockies
Main RiverMain River Yangtze / East Yangtze / East - West- West
Mississippi / Mississippi / North – SouthNorth – South
PopulationPopulation East CoastEast Coast East CoastEast CoastConnectivity Connectivity problemsproblems
North - SouthNorth - South East - WestEast - West

Countries & RegionsCountries & Regions
Tibet
Mongolia
Southeast Asia
Indian Subcontinent
Russia
N. Korea
S> Korea
Taiwan
Philippines

CitiesCities
BEIJING
Harbin
Nanjing
Guangzhou
Xi’anShanghai
Taipei
Lhasa
HongKongMacao

Completed Political MapCompleted Political Map
BEIJING
Harbin
Nanjing
Guangzhou
Xi’anShanghai
Taipei
Lhasa
HongKongMacao
Tibet
Mongolia
Southeast Asia
Indian Subcontinent
N. Korea
S> Korea
Taiwan
Philippines

China’s TopographyChina’s Topography

Percentages of Different Percentages of Different LandformsLandforms

Pacific “Rim of Fire”Pacific “Rim of Fire”

Bodies of WaterBodies of Water
Huang-He RiverYellow Sea
Yangtze River
Pacific Ocean
Amur River
Xi River
SouthChinaSea
Sea of
Japan

The Polluted Yellow The Polluted Yellow River!River!

The Yangtze RiverThe Yangtze River

Mountains & PeaksMountains & Peaks
Tian Shan
Altai Mts. Greater Khingan
Kunlun Shan
Himalayan Mts.

The Great Wall of ChinaThe Great Wall of China
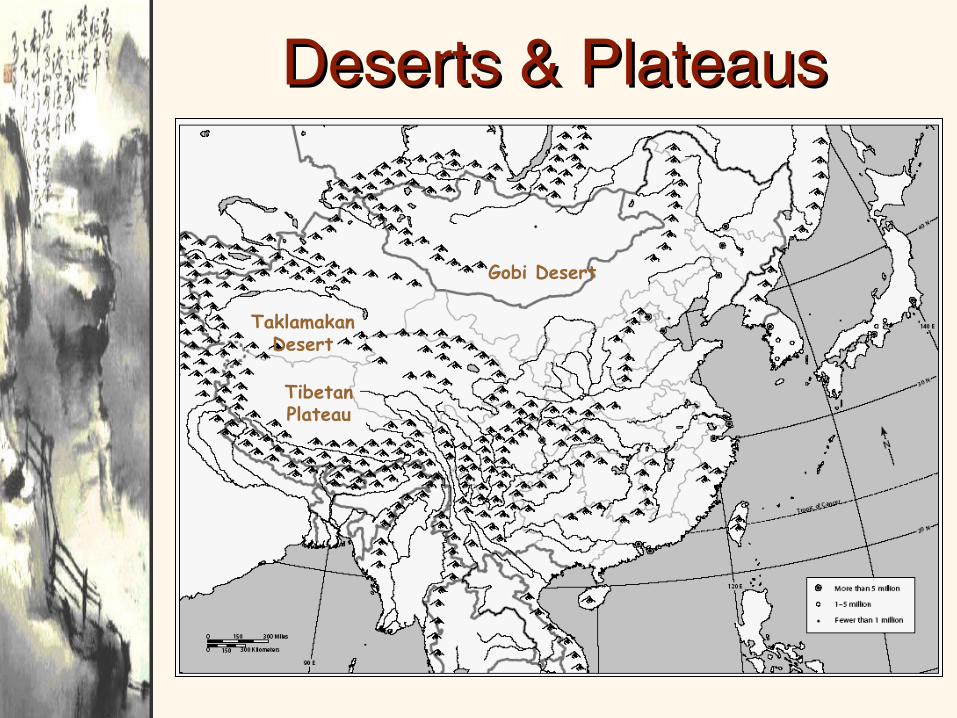
Deserts & PlateausDeserts & Plateaus
Tibetan Plateau
Taklamakan Desert
Gobi Desert
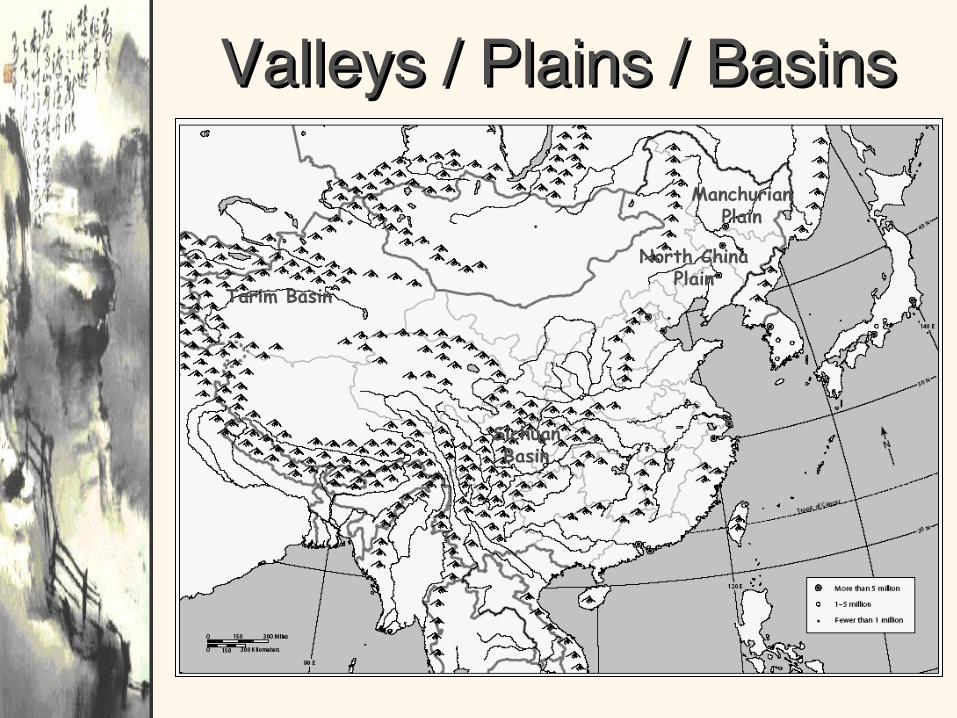
Valleys / Plains / BasinsValleys / Plains / Basins
Manchurian Plain
North China Plain
Tarim Basin
Sichuan Basin

North China PlainNorth China Plain

Agricultural Regions in Agricultural Regions in ChinaChina
Shabdong PeninsulaGrand Canal
Great Wall
CHUNG CHUNG KUOKUO

Completed Topographic Completed Topographic MapMap
Huang-He River Yellow Sea
Yangtze River
Pacific Ocean
Amur River
Xi River
SouthChinaSea
Sea of
Japan
Tian Shan
Altai Mts. Greater Khingan
Kunlun Shan
Himalayan Mts.
Tibetan Plateau
Taklamakan Desert
Gobi Desert
Manchurian Plain
North China Plain
Tarim Basin
Sichuan Basin
Shabdong PeninsulaGrand Canal
Great Wall
CHUNG CHUNG KUOKUO

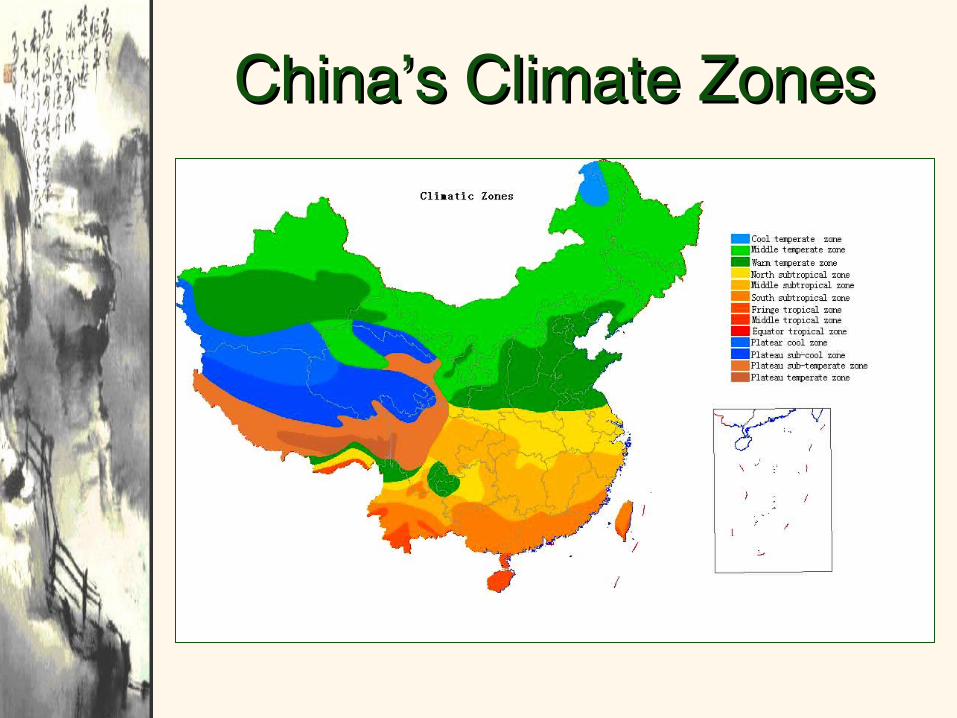
China’s Climate ZonesChina’s Climate Zones

Monsoon Precipitation Monsoon Precipitation PatternsPatterns

Winter MonsoonsWinter Monsoons

Summer MonsoonsSummer Monsoons

Precipitation in ChinaPrecipitation in China

Summer RainfallSummer Rainfall

Agricultural Regions in Agricultural Regions in ChinaChina

Arable LandArable Land

““Brown” China vs. “Green” Brown” China vs. “Green” ChinaChina
Rice Dominant
Wheat Dom
inant
Pasture and Oasis
Double-crop rice
SOURCE: Topic 5: “The Awakening Giant” by Dr. Jean-Paul Rodrigue, Dept. of Economics & Geography, Hofstra University.

South ChinaSouth China


Major Chinese Major Chinese IndustriesIndustries

Fuels, Power, Minerals, & Fuels, Power, Minerals, & Metals in ChinaMetals in China


China as % of World China as % of World PopulationPopulation

Top 10 Populated Top 10 Populated NationsNations
0 500 1000 1500
China
India
US
Indonesia
Brazil
Russia
Pakistan
Bangladesh
Japan
Nigeria
0 500 1000 1500
India
China
US
Pakistan
Indonesia
Nigeria
Bangladesh
Brazil
Congo
Ethiopia
2001 2050

The Population of ChinaThe Population of China
105 755 10831210
1381 156216501753
1812185118871911
19491953
1970
1981
1995
2000
2050
2
0
200
400
600
800
1000
1200
1400
1600
0 500 1000 1500 2000
thousands

Population ProjectionsPopulation Projections
500
700
900
1100
1300
1500
1945 1955 1965 1975 1985 1995 2005 2015 2025 2035 2045
thousands

Population DensityPopulation Density

Male/Female Birth Male/Female Birth PopulationPopulation

Life Expectancy at Birth by Life Expectancy at Birth by SexSex

Infant Mortality RateInfant Mortality Rate

Main Chinese Main Chinese NationalitiesNationalities

Ethno-Linguistic Groups Ethno-Linguistic Groups in Chinain China

Total Population with No Total Population with No EducationEducation


Monthly Value of Imports Monthly Value of Imports & Exports& Exports
20042004

Total Carbon EmissionsTotal Carbon Emissions[in millions of tons][in millions of tons]
0 10,000 20,000 30,000 40,000 50,000 60,000 70,000 80,000 90,000
United States
Russia
Germany
China
United Kingdom
Japan
France
Ukraine
Canada
Poland
India
Italy