geography internal assessment · this is because in accordance with the multiplier-effect and...
TRANSCRIPT

0
Geography Internal Assessment
Option E - Leisure, Sports and Tourism
What Socio-Economic Impacts Does Tourism Bring To
Rural Communities in The Mae Ai Region Of Thailand?
Figure 1- Wat Thaton temple in the Mae Ai district
glt506
Word count- 2457 words
Introduction- 216 words
Methodology- 308 words
Quality and Treatment of data- 1468 words
Conclusion- 132 words
Evaluation- 333 words
Chang (2016)
ALL RIGHTS BELONG TO OWNERTAKEN FROM WWW.INTERNALASSESSMENTS.WORDPRESS.COM
1
Table of Contents Table of Figures .................................................................................................................................... 2
Table of tables ...................................................................................................................................... 3
Introduction ............................................................................................................................................ 4
Fieldwork question: ............................................................................................................. 4
Geographical context: ......................................................................................................... 4
Socio-economic context (Thaton and BanKhai): ............................................................ 6
Syllabus link: ......................................................................................................................... 6
Hypothesis and theory: ....................................................................................................... 6
Myrdal’s Multiplier Effect ..................................................................................................... 7
Multiplier effect ..................................................................................................................... 8
Methodology .......................................................................................................................................... 9
Risk assessment: ................................................................................................................. 9
Justification of apparatus .................................................................................................... 9
Secondary data rationale ............................................................................................................ 9
Selecting sites ..................................................................................................................................... 10
Determining tourism impacts on land usages ............................................................... 11
Determining tourism impacts based on pedestrian and vehicle count ...................... 12
Determining tourism impacts based on local businesses ........................................... 13
Determining tourism impacts on individual perceptions .............................................. 14
Determining tourism impacts on living standards ......................................................... 15
Measuring quality of life .................................................................................................... 16
Price comparison ............................................................................................................... 17
Quality and treatment of data ........................................................................................................... 18
Trends in land usages in both villages ........................................................................... 18
Chi Square test .................................................................................................................. 19
Chi Squared Test ............................................................................................................................... 20
Trends between tourist density and vehicle count ....................................................... 22
Determining trends in perception of local businesses ................................................. 23
Determining trends in perception of individuals ............................................................ 25
Trends in Quality of life ..................................................................................................... 27
Trends in standard of living .............................................................................................. 30
ALL RIGHTS BELONG TO OWNERTAKEN FROM WWW.INTERNALASSESSMENTS.WORDPRESS.COM
2
Price comparison between the villages .......................................................................... 32
Conclusion ........................................................................................................................................... 33
Evaluation ............................................................................................................................................ 34
Alternative Investigations ................................................................................................. 35
Bibliography ........................................................................................................................................ 36
Table of Figures
Figure 1- Wat Thaton temple in the Mae Ai district ................................................................ 0
Figure 2- A Peter's projection of the world map ..................................................................... 4
Figure 3- Regional map of the Thailand showing Mae Ai ...................................................... 4
Figure 4- Regional map of the village Thaton a tourist hotspot in Mae Ai showing its main
roads ..................................................................................................................................... 5
Figure 5- Regional map of BanKhai, a region with minimal tourism activity (similar situation
to Thaton 20 years ago) ........................................................................................................ 5
Figure 6 - Myrdal’s Multiplier effect ........................................................................................ 7
Figure 7- Butler Model representing the relationship between tourism and an area over time 8
Figure 8- Street map of Thaton showing sites sampled ....................................................... 10
Figure 9- Street map of BanKhai showing sites sampled .................................................... 10
Figure 10- Photograph to show a potential site whereby a land usage survey can be
conducted ........................................................................................................................... 11
Figure 11- Gathering pedestrian and vehicle counts ........................................................... 12
Figure 12- Photograph of local businesswomen filling out a questionnaire .......................... 13
Figure 13- Photograph of local individual filling in questionnaire ......................................... 14
Figure 14- Clarke-fisher model ............................................................................................ 19
Figure 15- Questionnaire answers from individual perception questionnaire ....................... 25
Figure 16- Quality of life survey scores in Thaton from 20 people ....................................... 27
Figure 17- Quality of life survey scores in BanKhai from 20 people ..................................... 27
Figure 18- Tourist map of Thaton ........................................................................................ 28
Figure 20- Photograph of a BanKhai house ........................................................................ 29
Figure 19- Field sketch of a Thaton building ........................................................................ 29
Figure 21- Thaton housing living quality mean rankings ...................................................... 30
Figure 22- Ban Khai housing living quality mean ranking .................................................... 30
Figure 23- Evidence of graffiti (vandalism) at Thaton. ......................................................... 31
ALL RIGHTS BELONG TO OWNERTAKEN FROM WWW.INTERNALASSESSMENTS.WORDPRESS.COM
3
Table of tables Table 1- Local questionnaire about tourism ......................................................................... 13 Table 2- Translated questionnaire (Thai)............................................................................. 13 Table 3- Table containing questions regarding local perception of tourism.......................... 14 Table 4- Raw data table regarding housing living conditions ............................................... 15 Table 5- Measuring quality of life with various factors ......................................................... 16 Table 6- Price comparisons of goods between two locations .............................................. 17 Table 8- Key for figure 7 ...................................................................................................... 19 Table 9- Data and formula required to obtain Chi Square values ........................................ 20 Table 10- Chi Square degrees of freedom table .................................................................. 21 Table 11- Questionnaire and results of tourism impacts on local businesses ...................... 23 Table 12- Prices of goods Thaton ....................................................................................... 32 Table 13- Prices of goods Ban Khai .................................................................................... 32 Table 14- Table of evaluations ............................................................................................ 34
ALL RIGHTS BELONG TO OWNERTAKEN FROM WWW.INTERNALASSESSMENTS.WORDPRESS.COM

4
Introduction
Fieldwork question: What socio-economic changes does tourism bring to rural
communities in the Mae Ai region of Thailand?
Geographical context:
Situation:
(Lonely planet, 2014)
Mae Ai is located in the Chiang Mai
province
Mae Ai borders Myanmar/
Burma and Chiang Mai
province
This region
was part of
the
“Golden
Triangle”
region
(Hydrosheds , 2010)
Thaton is
situated at 20º
03'40"N99º21'
43" E.
BanKhai is situated at
20º00'03"N99º21'13"E.
Mae Ai district includes both
Thaton and Ban Khai
Thaton and Ban Khai were
sampled villages in this
investigation
Figure 2- A Peter's projection of the world map
Figure 3- Regional map of the Thailand showing Mae Ai
Thaton is a
rural tourism
hotspot for
Buddhist
pilgrimages
BanKhai
has minimal
tourism
activity
ALL RIGHTS BELONG TO OWNERTAKEN FROM WWW.INTERNALASSESSMENTS.WORDPRESS.COM
5
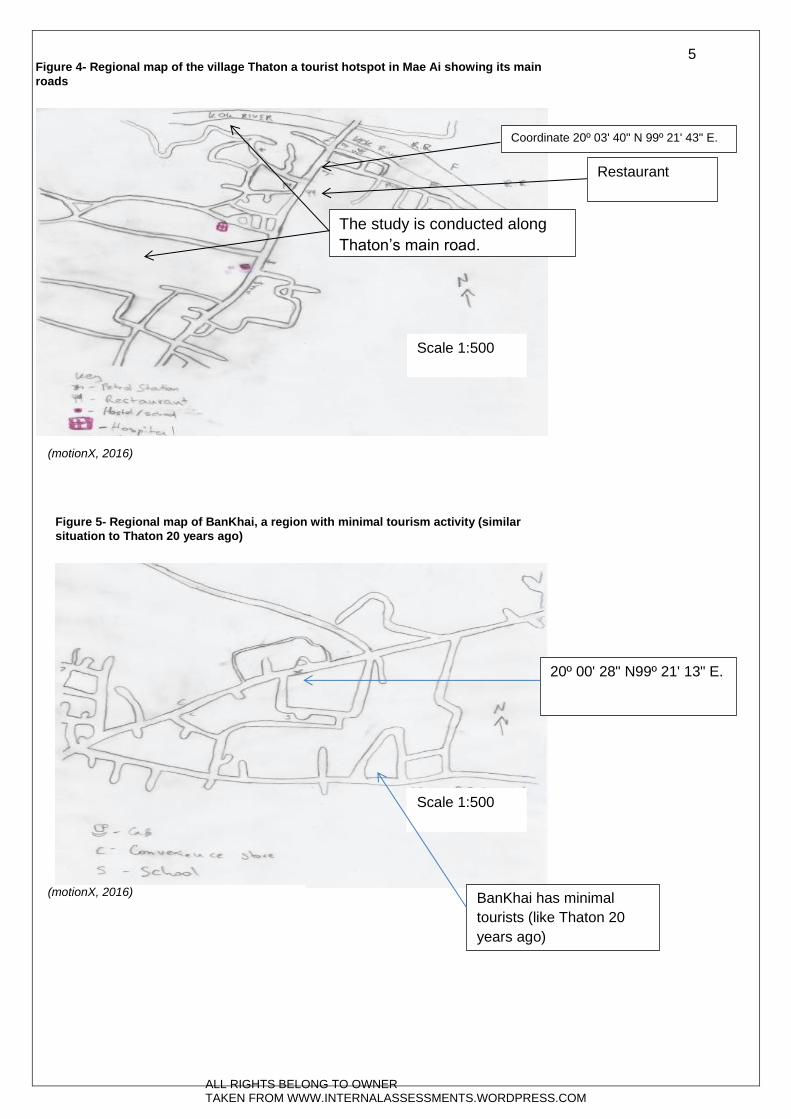
(motionX, 2016)
Coordinate 20º 03' 40" N 99º 21' 43" E.
The study is conducted along
Thaton’s main road.
(motionX, 2016)
Scale 1:500
Scale 1:500
20º 00' 28" N99º 21' 13" E.
BanKhai has minimal
tourists (like Thaton 20
years ago)
Restaurant
Figure 4- Regional map of the village Thaton a tourist hotspot in Mae Ai showing its main
roads
Figure 5- Regional map of BanKhai, a region with minimal tourism activity (similar
situation to Thaton 20 years ago)
ALL RIGHTS BELONG TO OWNERTAKEN FROM WWW.INTERNALASSESSMENTS.WORDPRESS.COM

6
Socio-economic context (Thaton and BanKhai): Thaton is a domestic tourism hotspot. Thaton is a honeypot site for Buddhists
completing a pilgrimage due to its many temples e.g. Wat Thaton (Massington,
2016).Thaton is a nodal point of the Chiang Mai/ Chiang Rai route along the Maekok
River. It is located in the Mae Ai region of Chiang Mai.
BanKhai resembles the less developed Thaton of 20 years ago (prior to the increase
in tourism) and is another village in Mae Ai. Unlike Thaton (which is tourism), its
main income source is agriculture. Tourism is minimal and oftentimes people live in
larger families, and development is gradually commencing in the region (Massington,
2016).
Therefore, this investigation seeks to compare the socio-economic impacts of
tourism on the region of Mae Ai by comparing a tourism hotspot with an area with
minimal tourism.
Syllabus link: The fieldwork links to Option E- Leisure Sports and Tourism and
specifically to the point: Examine the economic, social and environmental impacts of
tourism on a local scale (IBO, 2009).
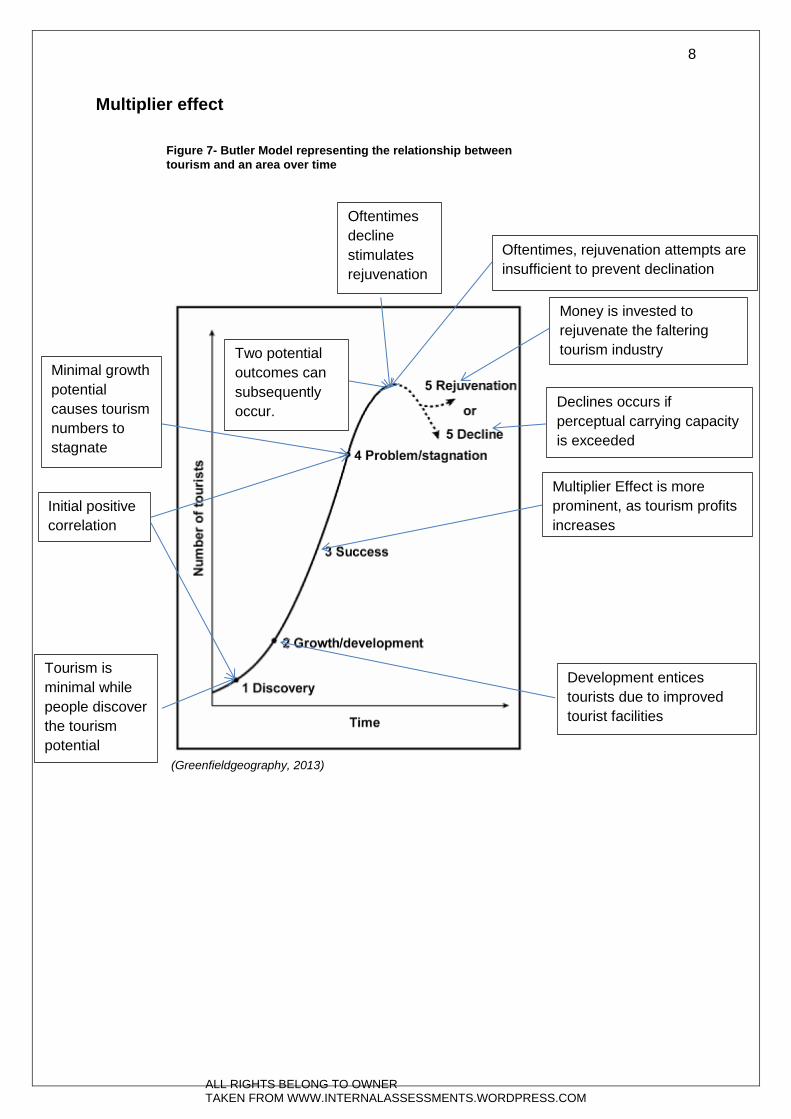
Hypothesis and theory: Tourism brings Mae Ai mostly positive socio-economic
impacts. This is because in accordance with the Multiplier-effect and Butler’s model
(reference figures 6&7) tourism spending will stimulate development which will
improve living standards and the multitude tourist interactions will have positive
social benefits.
ALL RIGHTS BELONG TO OWNERTAKEN FROM WWW.INTERNALASSESSMENTS.WORDPRESS.COM

7
Myrdal’s Multiplier Effect Figure 6 - Myrdal’s Multiplier effect
(Greenfieldgeography, 2016)
Each change has a profound
multiplier effect on society.
Tourism positive and negative
multiplier effects can be produced.
Higher
paid
jobs
are
often
created
.
Links
with
the
Butler
model
Services become co-dependent on
each other and tourism.
ALL RIGHTS BELONG TO OWNERTAKEN FROM WWW.INTERNALASSESSMENTS.WORDPRESS.COM
8
Multiplier effect
(Greenfieldgeography, 2013)
Initial positive
correlation
Development entices
tourists due to improved
tourist facilities
Multiplier Effect is more
prominent, as tourism profits
increases
Tourism is
minimal while
people discover
the tourism
potential
Minimal growth
potential
causes tourism
numbers to
stagnate
Two potential
outcomes can
subsequently
occur.
Money is invested to
rejuvenate the faltering
tourism industry
Declines occurs if
perceptual carrying capacity
is exceeded
Oftentimes
decline
stimulates
rejuvenation
Oftentimes, rejuvenation attempts are
insufficient to prevent declination
Figure 7- Butler Model representing the relationship between
tourism and an area over time
ALL RIGHTS BELONG TO OWNERTAKEN FROM WWW.INTERNALASSESSMENTS.WORDPRESS.COM

9
Methodology
Risk assessment:
1. Wear sunblock to prevent strokes and sunburns
2. Drink 7L of water /day to prevent dehydration in tropical climates
3. Apply mosquito repellent to prevent malaria contraction
Justification of apparatus
1. Stopwatch - to ensure vehicle and pedestrian counts do not exceed 2 minutes.
2. Random number table - to prevent selection bias at sampling locations for all
random samples
Secondary data rationale
Due to Mae Ai’s relative obscurity, a lot of data was gathered from two British
Geographers who had resided in the region for a substantial duration (although IB
geography Fieldwork book often further substantiated their data). Additionally,
geographical journals and textbooks such as Geographical Enquires by Nagle &
Spencer were read in order to gain a better understanding of tourism concepts and
how these concepts may be applicable to Mae Ai.
ALL RIGHTS BELONG TO OWNERTAKEN FROM WWW.INTERNALASSESSMENTS.WORDPRESS.COM
10
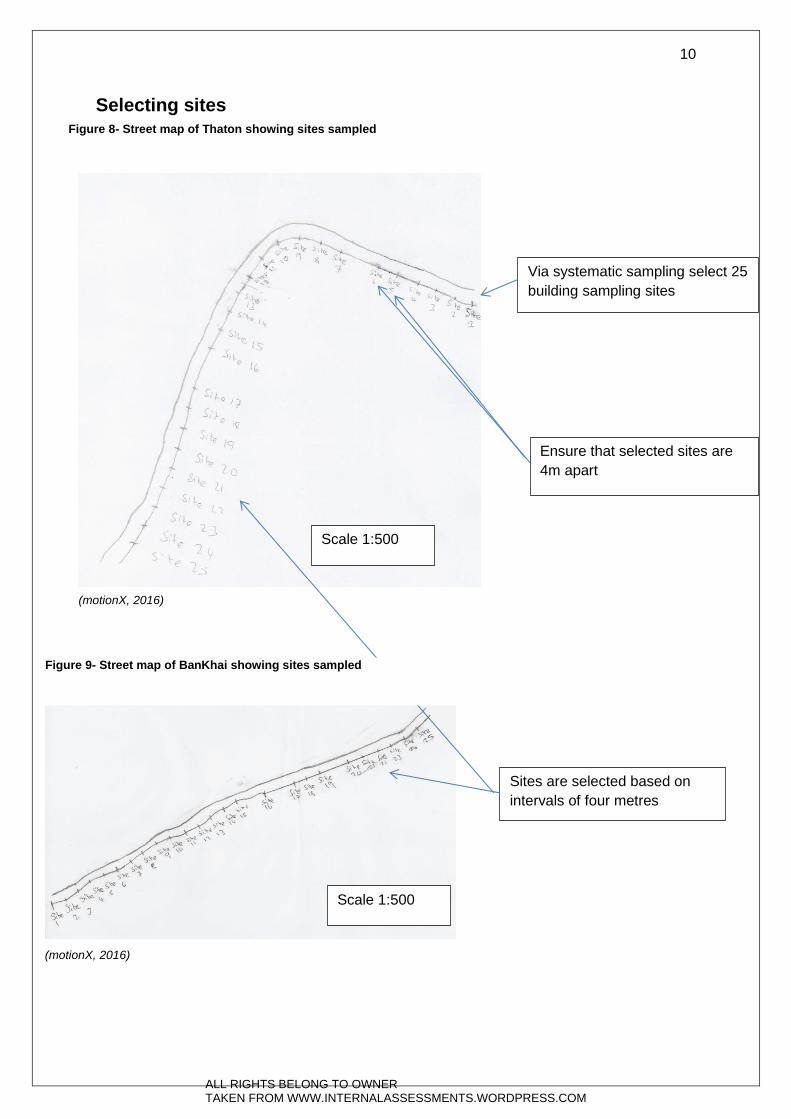
Selecting sites
Table 2- Represents the categorised buildings in Ban Kai at 25 locations.
Via systematic sampling select 25
building sampling sites
Ensure that selected sites are
4m apart
(motionX, 2016)
Scale 1:500
Scale 1:500
Sites are selected based on
intervals of four metres
Figure 8- Street map of Thaton showing sites sampled
Figure 9- Street map of BanKhai showing sites sampled
(motionX, 2016)
ALL RIGHTS BELONG TO OWNERTAKEN FROM WWW.INTERNALASSESSMENTS.WORDPRESS.COM
11
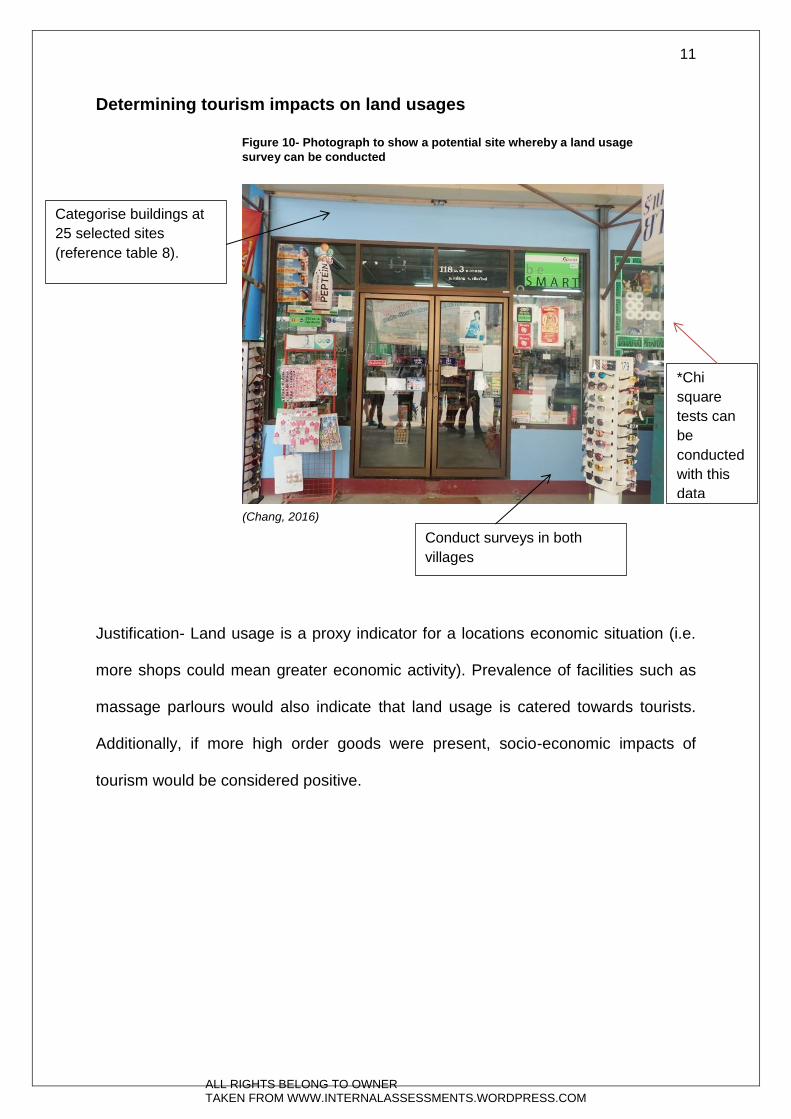
Determining tourism impacts on land usages
Justification- Land usage is a proxy indicator for a locations economic situation (i.e.
more shops could mean greater economic activity). Prevalence of facilities such as
massage parlours would also indicate that land usage is catered towards tourists.
Additionally, if more high order goods were present, socio-economic impacts of
tourism would be considered positive.
Categorise buildings at
25 selected sites
(reference table 8).
*Chi
square
tests can
be
conducted
with this
data
Conduct surveys in both
villages
(Chang, 2016)
Figure 10- Photograph to show a potential site whereby a land usage
survey can be conducted
ALL RIGHTS BELONG TO OWNERTAKEN FROM WWW.INTERNALASSESSMENTS.WORDPRESS.COM
12
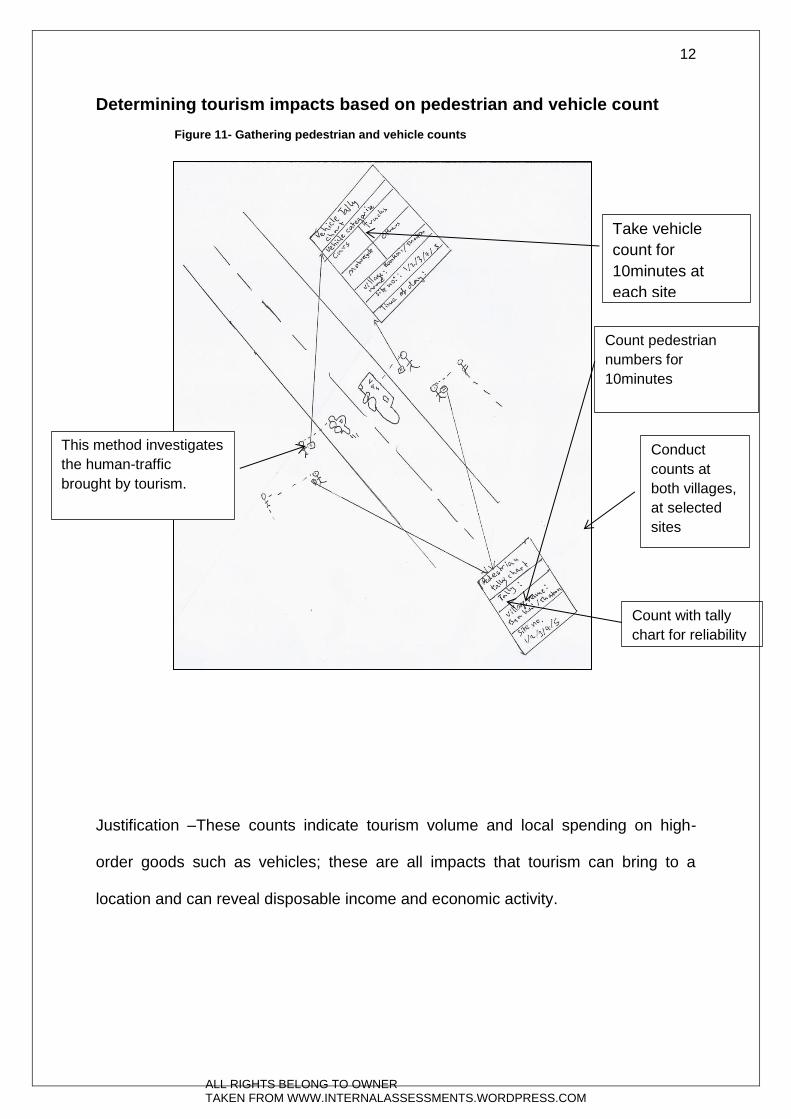
Determining tourism impacts based on pedestrian and vehicle count
Justification –These counts indicate tourism volume and local spending on high-
order goods such as vehicles; these are all impacts that tourism can bring to a
location and can reveal disposable income and economic activity.
Count pedestrian
numbers for
10minutes
Conduct
counts at
both villages,
at selected
sites
This method investigates
the human-traffic
brought by tourism.
Take vehicle
count for
10minutes at
each site
Count with tally
chart for reliability
Figure 11- Gathering pedestrian and vehicle counts
ALL RIGHTS BELONG TO OWNERTAKEN FROM WWW.INTERNALASSESSMENTS.WORDPRESS.COM
13
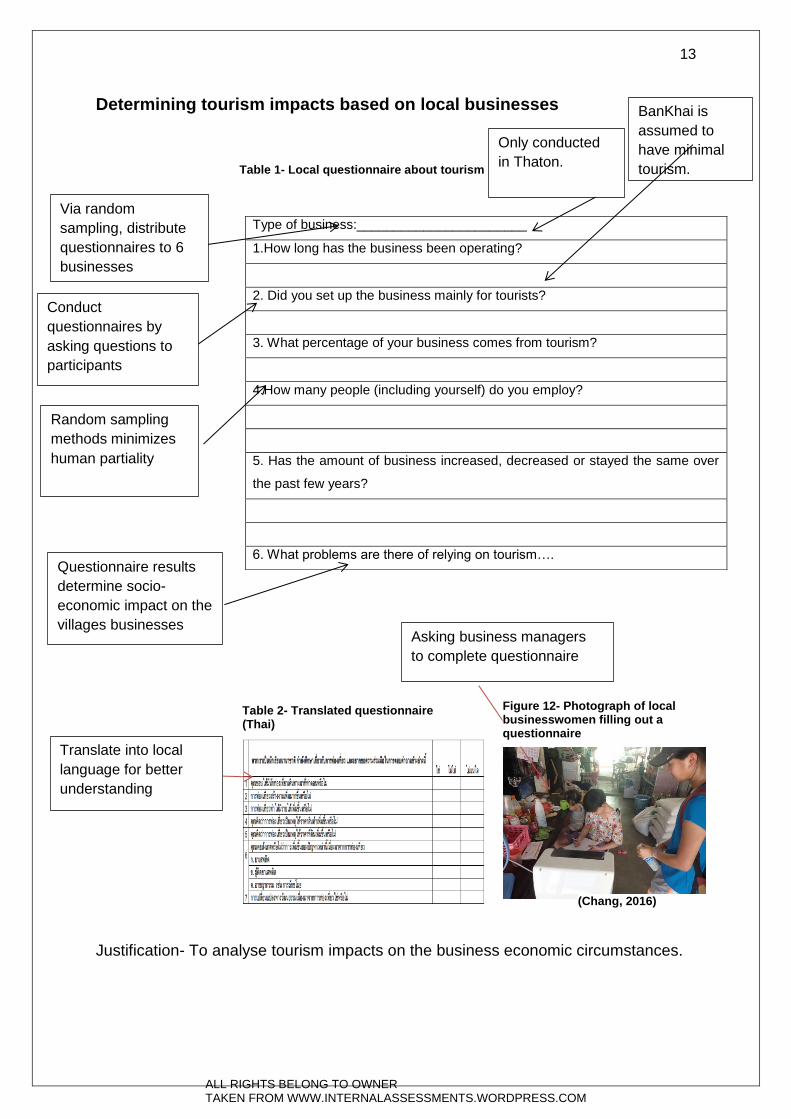
Determining tourism impacts based on local businesses
Table 1- Local questionnaire about tourism
Justification- To analyse tourism impacts on the business economic circumstances.
Type of business:_______________________
1.How long has the business been operating?
2. Did you set up the business mainly for tourists?
3. What percentage of your business comes from tourism?
4.How many people (including yourself) do you employ?
5. Has the amount of business increased, decreased or stayed the same over
the past few years?
6. What problems are there of relying on tourism….
Via random
sampling, distribute
questionnaires to 6
businesses
Conduct
questionnaires by
asking questions to
participants
Questionnaire results
determine socio-
economic impact on the
villages businesses
Random sampling
methods minimizes
human partiality
Translate into local
language for better
understanding
Asking business managers
to complete questionnaire
(Chang, 2016)
Table 2- Translated questionnaire (Thai)
Figure 12- Photograph of local businesswomen filling out a questionnaire
Only conducted
in Thaton.
BanKhai is
assumed to
have minimal
tourism.
ALL RIGHTS BELONG TO OWNERTAKEN FROM WWW.INTERNALASSESSMENTS.WORDPRESS.COM
14
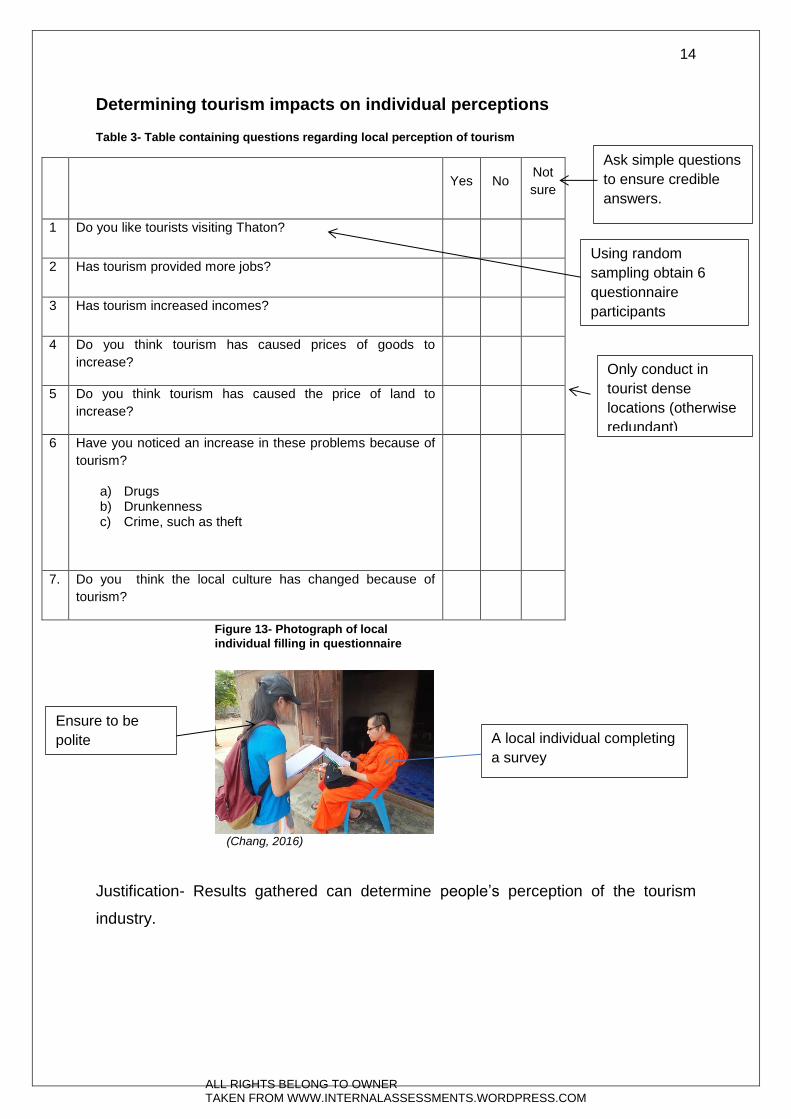
Determining tourism impacts on individual perceptions
Table 3- Table containing questions regarding local perception of tourism
Yes No
Not
sure
1 Do you like tourists visiting Thaton?
2 Has tourism provided more jobs?
3 Has tourism increased incomes?
4 Do you think tourism has caused prices of goods to
increase?
5 Do you think tourism has caused the price of land to
increase?
6 Have you noticed an increase in these problems because of
tourism?
a) Drugs b) Drunkenness c) Crime, such as theft
7. Do you think the local culture has changed because of
tourism?
Justification- Results gathered can determine people’s perception of the tourism
industry.
Using random
sampling obtain 6
questionnaire
participants
Ask simple questions
to ensure credible
answers.
A local individual completing
a survey
Ensure to be
polite
(Chang, 2016)
Only conduct in
tourist dense
locations (otherwise
redundant)
Figure 13- Photograph of local
individual filling in questionnaire
ALL RIGHTS BELONG TO OWNERTAKEN FROM WWW.INTERNALASSESSMENTS.WORDPRESS.COM
15
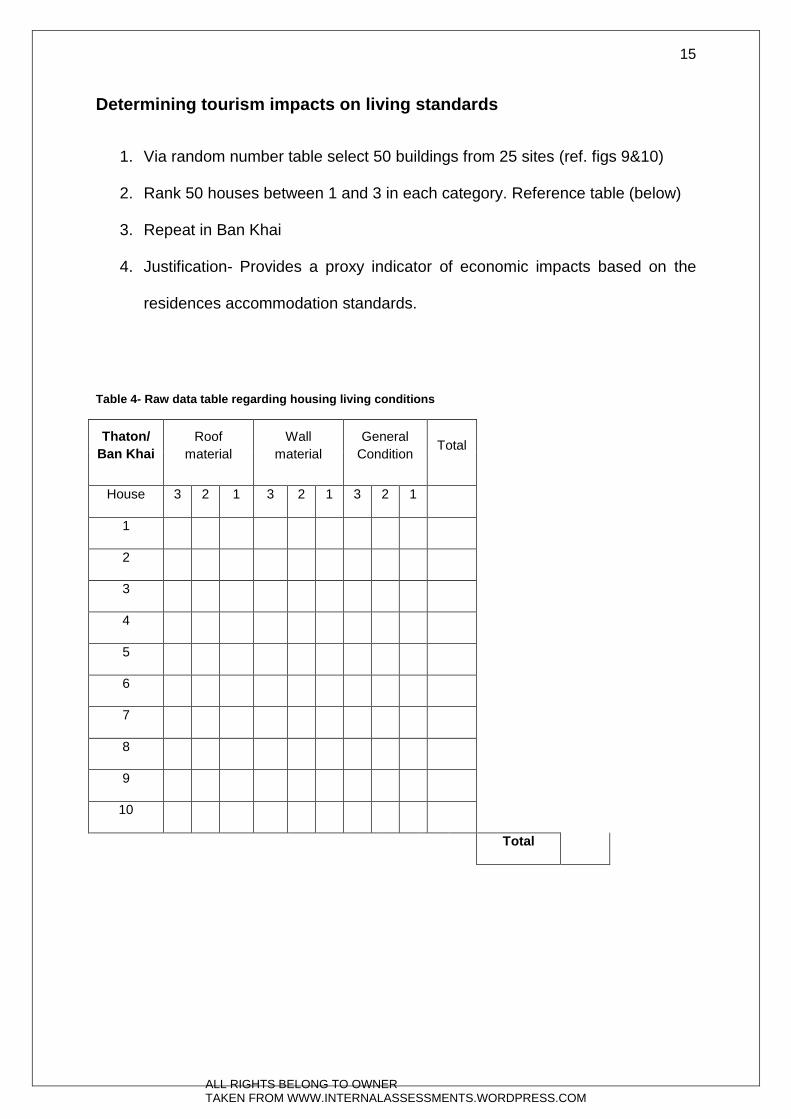
Determining tourism impacts on living standards
1. Via random number table select 50 buildings from 25 sites (ref. figs 9&10)
2. Rank 50 houses between 1 and 3 in each category. Reference table (below)
3. Repeat in Ban Khai
4. Justification- Provides a proxy indicator of economic impacts based on the
residences accommodation standards.
Table 4- Raw data table regarding housing living conditions
Thaton/
Ban Khai
Roof
material
Wall
material
General
Condition Total
House 3 2 1 3 2 1 3 2 1
1
2
3
4
5
6
7
8
9
10
Total
ALL RIGHTS BELONG TO OWNERTAKEN FROM WWW.INTERNALASSESSMENTS.WORDPRESS.COM

16
Measuring quality of life
Justification- To determine if quality of life improves with increased tourist quantities.
Survey sites
referenced in
figures 4 and
5
0 to 3 is in
improving order
How to quantify
something based upon
description Specific detail of
each category
As participant
numbers
increases,
human
biasness
decreases
Table 5- Measuring quality of life with various factors
Have 6 groups of 10
complete this
Total up average
scores
ALL RIGHTS BELONG TO OWNERTAKEN FROM WWW.INTERNALASSESSMENTS.WORDPRESS.COM
17
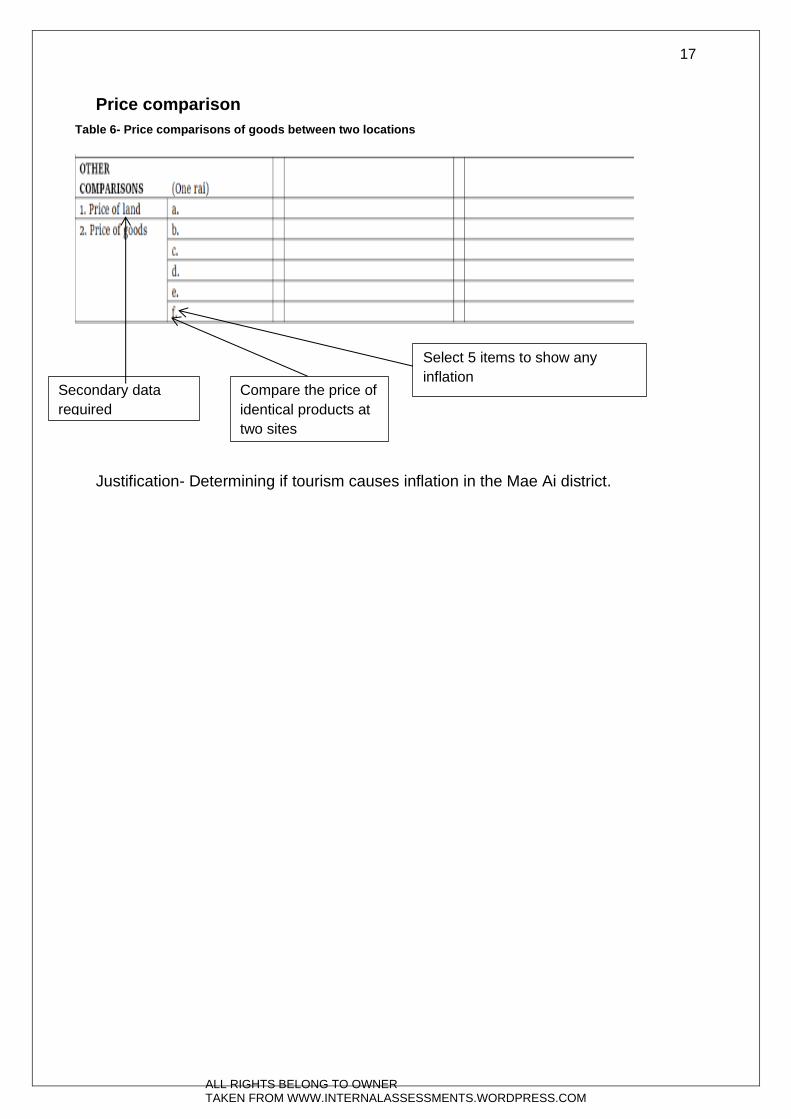
Price comparison
Justification- Determining if tourism causes inflation in the Mae Ai district.
Secondary data
required
Select 5 items to show any
inflation
Table 6- Price comparisons of goods between two locations
Compare the price of
identical products at
two sites
ALL RIGHTS BELONG TO OWNERTAKEN FROM WWW.INTERNALASSESSMENTS.WORDPRESS.COM
18
Quality and treatment of data
Trends in land usages in both villages:
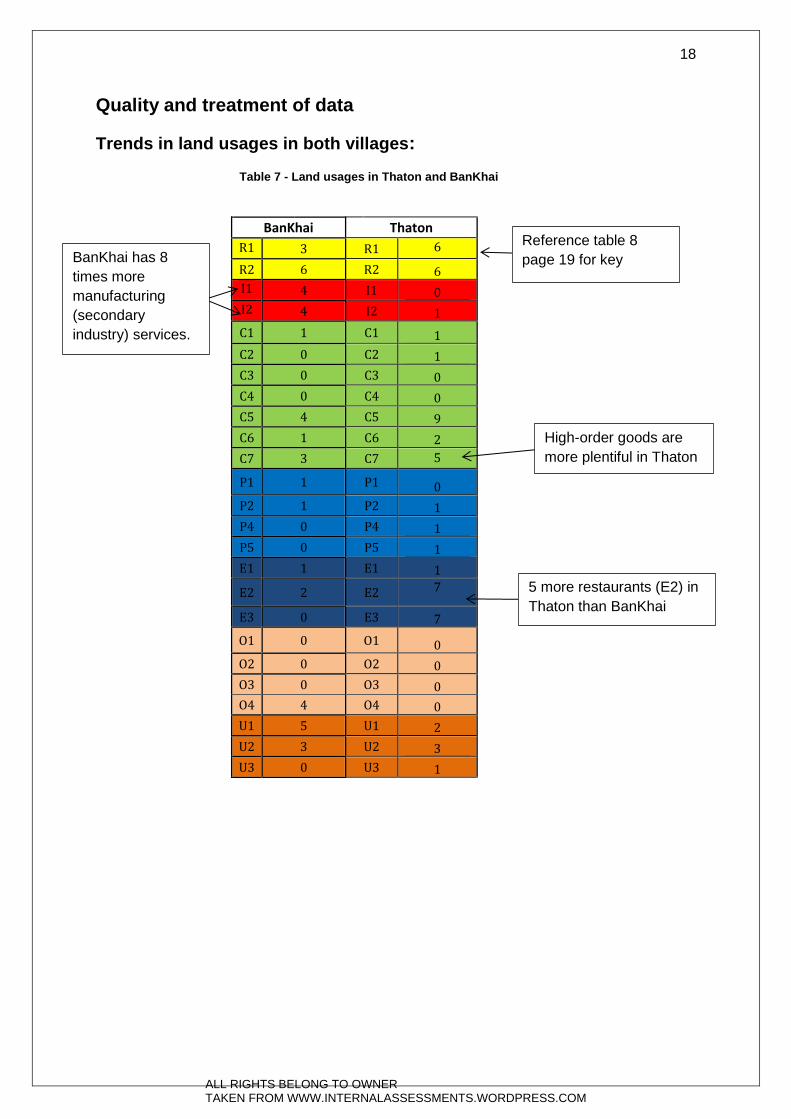
Table 7 - Land usages in Thaton and BanKhai
BanKhai Thaton
R1 3 R1 6
R2 6 R2 6
I1 4 I1 0
I2 4 I2 1
C1 1 C1 1
C2 0 C2 1
C3 0 C3 0
C4 0 C4 0
C5 4 C5 9
C6 1 C6 2
C7 3 C7 5
P1 1 P1 0
P2 1 P2 1
P4 0 P4 1
P5 0 P5 1
E1 1 E1 1
E2 2 E2 7
E3 0 E3 7
O1 0 O1 0
O2 0 O2 0
O3 0 O3 0
O4 4 O4 0
U1 5 U1 2
U2 3 U2 3
U3 0 U3 1
Reference table 8
page 19 for key
5 more restaurants (E2) in
Thaton than BanKhai
High-order goods are
more plentiful in Thaton
BanKhai has 8
times more
manufacturing
(secondary
industry) services.
ALL RIGHTS BELONG TO OWNERTAKEN FROM WWW.INTERNALASSESSMENTS.WORDPRESS.COM

19
Table 7 (above) shows the differences between the land usages in the two villages.
Thaton’s land use has 8 examples of high order services e.g. shops, ATMs, car
rentals etc (as opposed to 5 in BanKhai). Additionally there are 5 more restaurants in
Thaton which suggests that facilities in Thaton are catered towards tourists or that
Thaton residences have greater disposable incomes (Ozgener, et al, 2006) as
theorised by Myrdal’s multiplier effect. Such facilities
earn money from wealthier tourists, increasing their
personal wealth and that of surrounding businesses.
However, BanKhai has 250% more derelict land which
may also indicate that it has a weaker economic
situation than Thaton. The hypothesis is further
substantiated as BanKhai has eight times more
manufacturing shops (secondary industries) than
Thaton. This relates to the Clarke-Fisher model
whereby as an area develops, the secondary industry
declines (reference figure 14). These findings show
that Thaton is significantly more developed as proven
by its greater tertiary industry employment and a
correspondingly fewer manufacturing shops
(supporting the hypothesis).
Chi Square test:
Table 8- Key for figure 7
General Use Code Types
Residential R1 Low density
R2 High density
Industrial I1 Manufacturing (Small)
I2 Manufacturing (Large)
Commercial C1 ATM / Bank
C2 Garages
C3 Markets
C4 Offices
C5 Shops (Low order)
C6 Shops (Med order)
C7 Shops (High order)
C6 Others
Public buildings P1 Colleges / Schools
P2 Government
P4 Temples
P5 Others
Entertainment E1 Hotels / Guest houses
E2 Restaurants / Bars
E3 Others
Open space O1 Car parks
O2 Parks
O3 Recreation
O4 Others
Unused U1 Derelict
U2 Vacant
U3 Others
Figure 14- Clarke-fisher model
(Kokkinos, 2014)
ALL RIGHTS BELONG TO OWNERTAKEN FROM WWW.INTERNALASSESSMENTS.WORDPRESS.COM
20
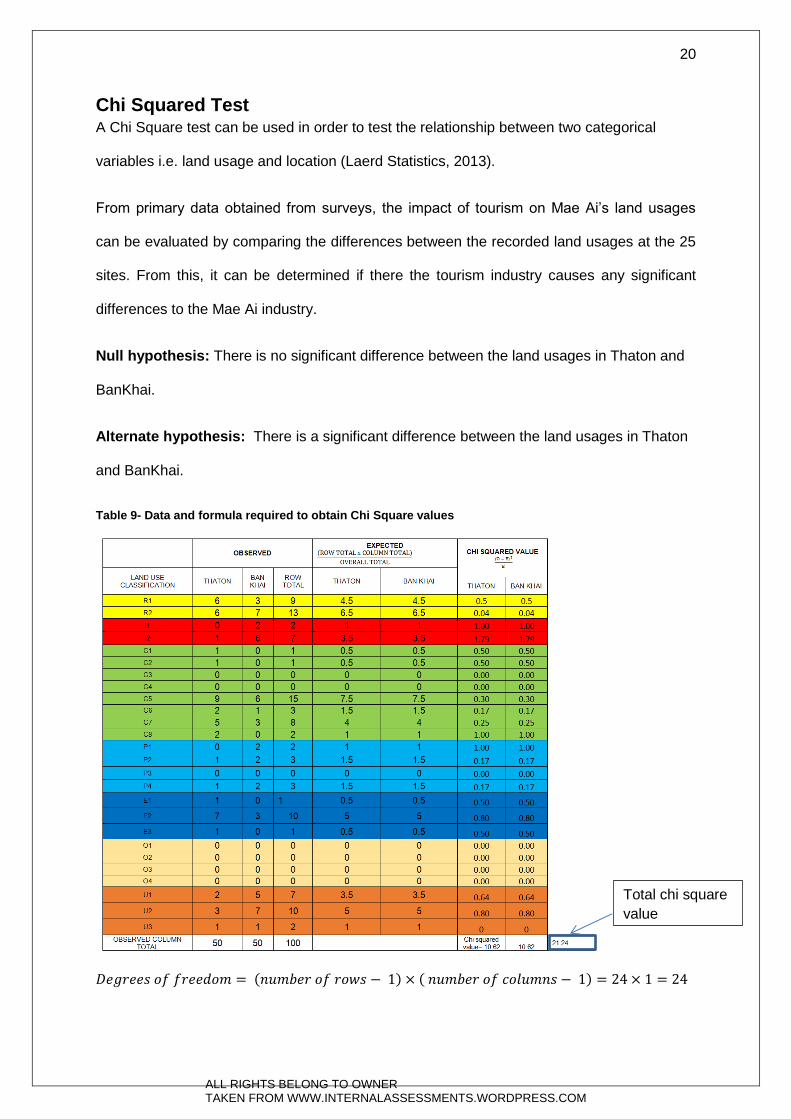
Chi Squared Test A Chi Square test can be used in order to test the relationship between two categorical
variables i.e. land usage and location (Laerd Statistics, 2013).
From primary data obtained from surveys, the impact of tourism on Mae Ai’s land usages
can be evaluated by comparing the differences between the recorded land usages at the 25
sites. From this, it can be determined if there the tourism industry causes any significant
differences to the Mae Ai industry.
Null hypothesis: There is no significant difference between the land usages in Thaton and
BanKhai.
Alternate hypothesis: There is a significant difference between the land usages in Thaton
and BanKhai.
Table 9- Data and formula required to obtain Chi Square values
𝐷𝑒𝑔𝑟𝑒𝑒𝑠 𝑜𝑓 𝑓𝑟𝑒𝑒𝑑𝑜𝑚 = (𝑛𝑢𝑚𝑏𝑒𝑟 𝑜𝑓 𝑟𝑜𝑤𝑠 − 1) × ( 𝑛𝑢𝑚𝑏𝑒𝑟 𝑜𝑓 𝑐𝑜𝑙𝑢𝑚𝑛𝑠 − 1) = 24 × 1 = 24
Total chi square
value
ALL RIGHTS BELONG TO OWNERTAKEN FROM WWW.INTERNALASSESSMENTS.WORDPRESS.COM
21
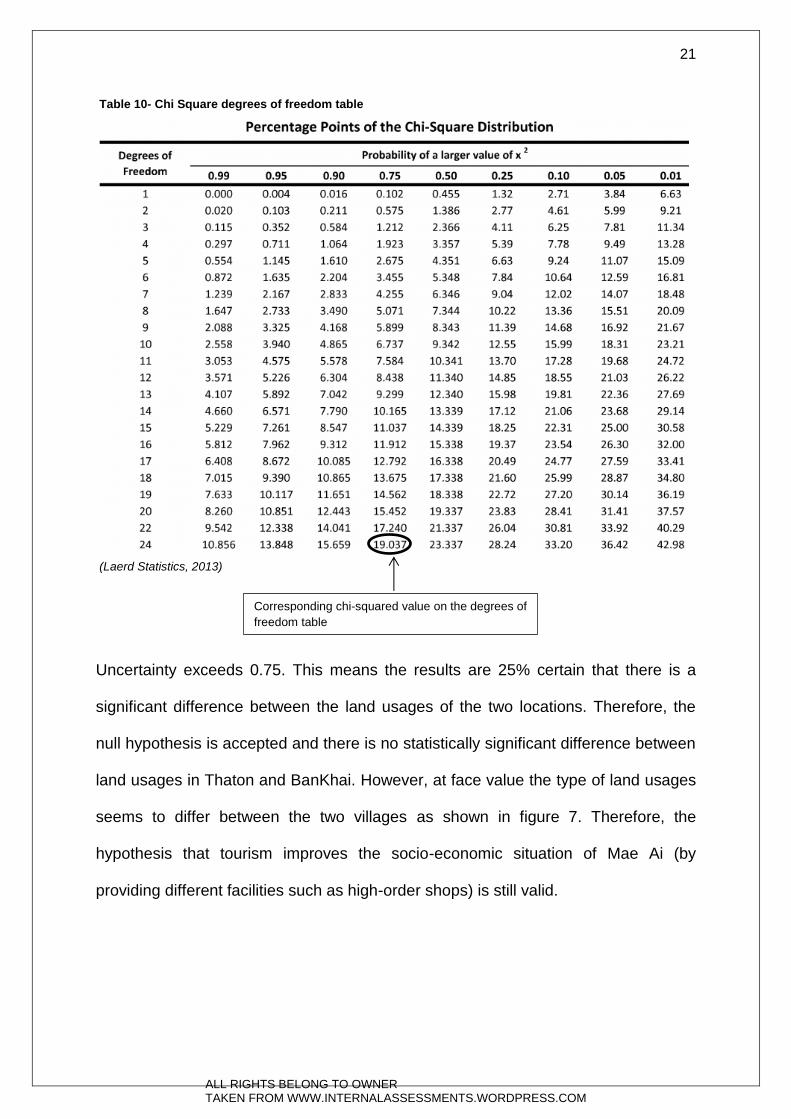
Uncertainty exceeds 0.75. This means the results are 25% certain that there is a
significant difference between the land usages of the two locations. Therefore, the
null hypothesis is accepted and there is no statistically significant difference between
land usages in Thaton and BanKhai. However, at face value the type of land usages
seems to differ between the two villages as shown in figure 7. Therefore, the
hypothesis that tourism improves the socio-economic situation of Mae Ai (by
providing different facilities such as high-order shops) is still valid.
(Laerd Statistics, 2013)
Corresponding chi-squared value on the degrees of
freedom table
Table 10- Chi Square degrees of freedom table
ALL RIGHTS BELONG TO OWNERTAKEN FROM WWW.INTERNALASSESSMENTS.WORDPRESS.COM
22
Trends between tourist density and vehicle count:
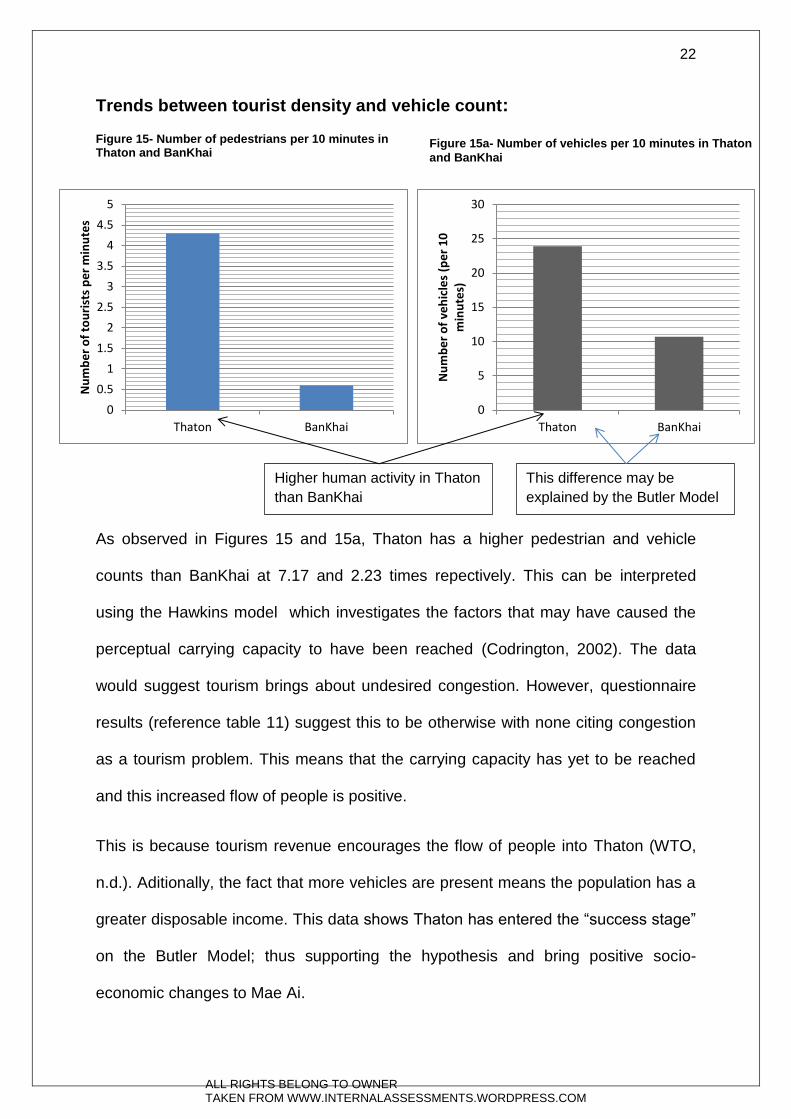
Figure 15- Number of pedestrians per 10 minutes in Thaton and BanKhai
As observed in Figures 15 and 15a, Thaton has a higher pedestrian and vehicle
counts than BanKhai at 7.17 and 2.23 times repectively. This can be interpreted
using the Hawkins model which investigates the factors that may have caused the
perceptual carrying capacity to have been reached (Codrington, 2002). The data
would suggest tourism brings about undesired congestion. However, questionnaire
results (reference table 11) suggest this to be otherwise with none citing congestion
as a tourism problem. This means that the carrying capacity has yet to be reached
and this increased flow of people is positive.
This is because tourism revenue encourages the flow of people into Thaton (WTO,
n.d.). Aditionally, the fact that more vehicles are present means the population has a
greater disposable income. This data shows Thaton has entered the “success stage”
on the Butler Model; thus supporting the hypothesis and bring positive socio-
economic changes to Mae Ai.
0
0.5
1
1.5
2
2.5
3
3.5
4
4.5
5
Thaton BanKhai
Nu
mb
er
of
tou
rist
s p
er
min
ute
s
0
5
10
15
20
25
30
Thaton BanKhaiN
um
be
r o
f ve
hic
les
(pe
r 1
0
min
ute
s)
Figure 15a- Number of vehicles per 10 minutes in Thaton
and BanKhai
Higher human activity in Thaton
than BanKhai
This difference may be
explained by the Butler Model
ALL RIGHTS BELONG TO OWNERTAKEN FROM WWW.INTERNALASSESSMENTS.WORDPRESS.COM
23
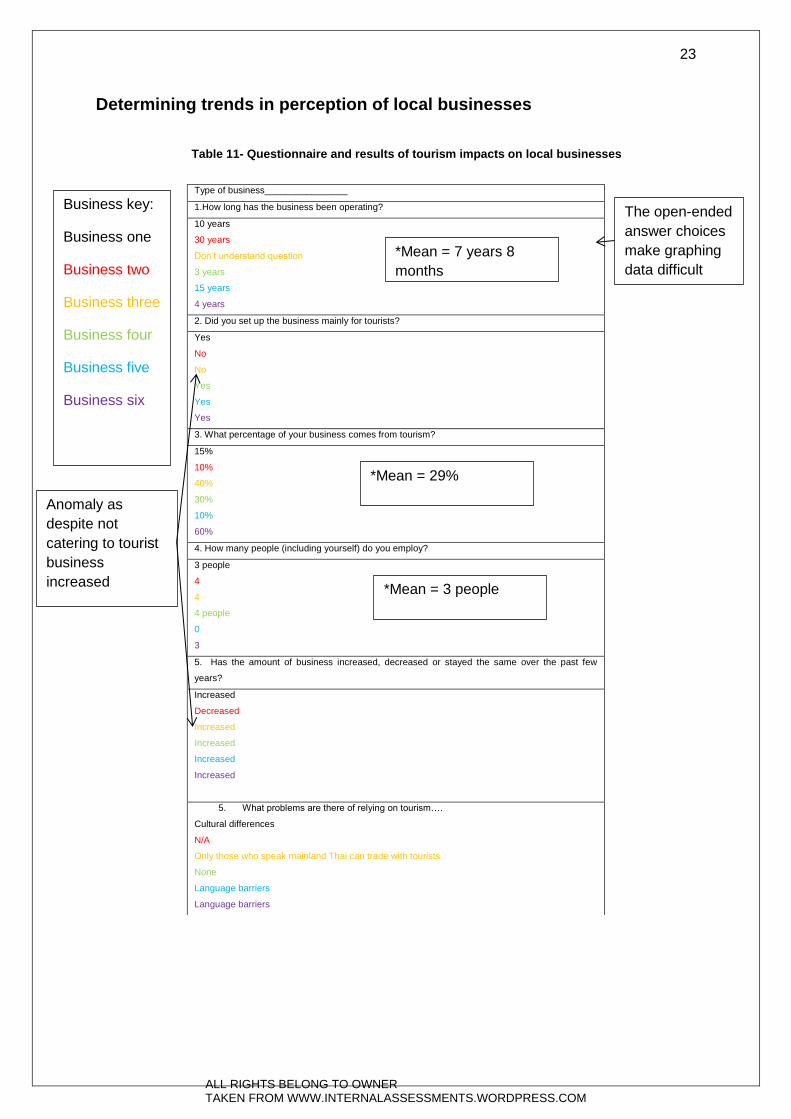
Determining trends in perception of local businesses
Table 11- Questionnaire and results of tourism impacts on local businesses
Type of business________________
1.How long has the business been operating?
10 years
30 years
Don’t understand question
3 years
15 years
4 years
2. Did you set up the business mainly for tourists?
Yes
No
No
Yes
Yes
Yes
3. What percentage of your business comes from tourism?
15%
10%
40%
30%
10%
60%
4. How many people (including yourself) do you employ?
3 people
4
4
4 people
0
3
5. Has the amount of business increased, decreased or stayed the same over the past few
years?
Increased
Decreased
Increased
Increased
Increased
Increased
5. What problems are there of relying on tourism….
Cultural differences
N/A
Only those who speak mainland Thai can trade with tourists
None
Language barriers
Language barriers
Business key:
Business one
Business two
Business three
Business four
Business five
Business six
Anomaly as
despite not
catering to tourist
business
increased
*Mean = 29%
*Mean = 3 people
*Mean = 7 years 8
months
The open-ended
answer choices
make graphing
data difficult
ALL RIGHTS BELONG TO OWNERTAKEN FROM WWW.INTERNALASSESSMENTS.WORDPRESS.COM
24
This results of the questionnaire shown in table 11 show that 5 in 6 shops reported
an “increase” in business with 80% surveyed shops catering for tourists. This
suggests that shops targeting (and thereby receiving more) tourists have higher
revenue. This is in accordance with the multiplier effect as more people benefited
from tourism. Similarly it changes the local perception of an “ideal” shop as when
they become wealthier they seek similar goods and services as their tourist
counterparts. This therefore stipulates to the further growth of tourist areas.
An anomaly was observed in Business 3 (a convenience store) that experienced an
increase in economic activity despite not targeting the tourists. Nevertheless, tourism
has indirectly benefitted this store as more people visited Thaton.
However, Business 2 (a noodle shop targeting locals) experienced a decrease in
income recent years due to over-competition. This means traditional businesses may
face competition from similar tourist orientated services (restaurants in this case).
While this constitutes a minority at present, this ought to be evaluated further to see
if there is a rising trend.
Despite anomalies, this data concludes that tourism does benefit the economic
situation of Thaton (in Mae Ai) as all of the businesses cater to tourists and most
shops overall experiencing an “increase” in business.
ALL RIGHTS BELONG TO OWNERTAKEN FROM WWW.INTERNALASSESSMENTS.WORDPRESS.COM
25
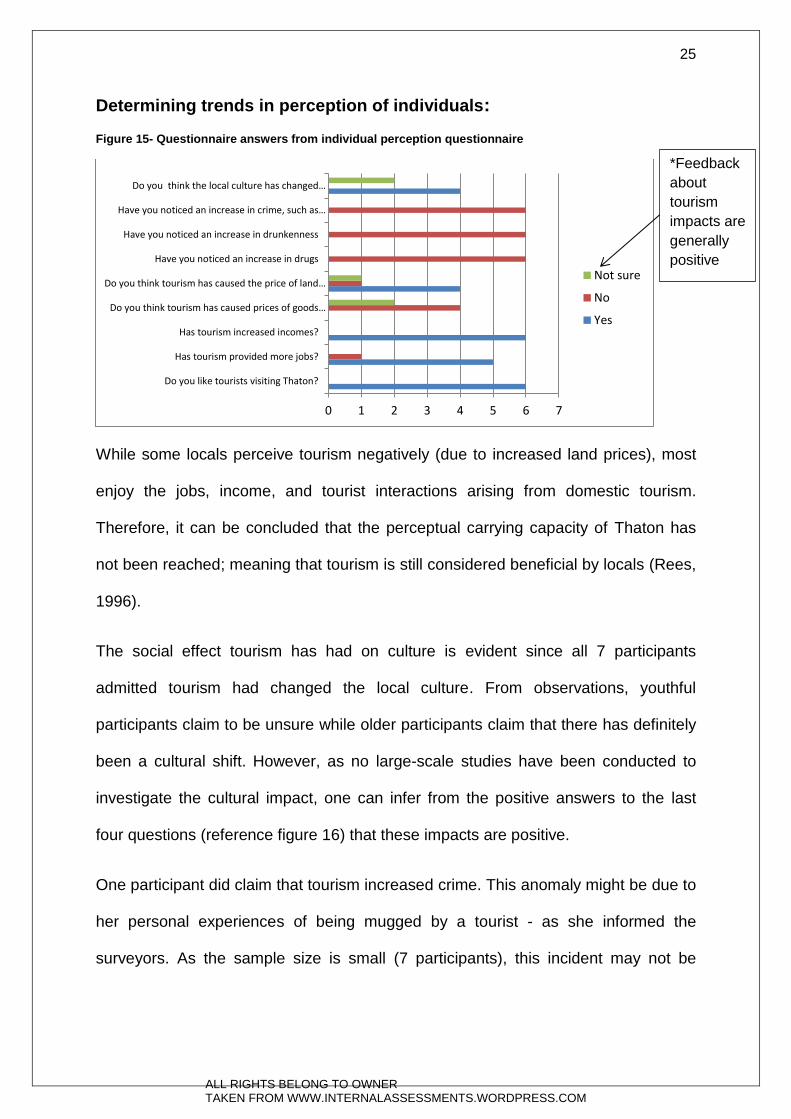
Determining trends in perception of individuals:
Figure 15- Questionnaire answers from individual perception questionnaire
While some locals perceive tourism negatively (due to increased land prices), most
enjoy the jobs, income, and tourist interactions arising from domestic tourism.
Therefore, it can be concluded that the perceptual carrying capacity of Thaton has
not been reached; meaning that tourism is still considered beneficial by locals (Rees,
1996).
The social effect tourism has had on culture is evident since all 7 participants
admitted tourism had changed the local culture. From observations, youthful
participants claim to be unsure while older participants claim that there has definitely
been a cultural shift. However, as no large-scale studies have been conducted to
investigate the cultural impact, one can infer from the positive answers to the last
four questions (reference figure 16) that these impacts are positive.
One participant did claim that tourism increased crime. This anomaly might be due to
her personal experiences of being mugged by a tourist - as she informed the
surveyors. As the sample size is small (7 participants), this incident may not be
0 1 2 3 4 5 6 7
Do you like tourists visiting Thaton?
Has tourism provided more jobs?
Has tourism increased incomes?
Do you think tourism has caused prices of goods…
Do you think tourism has caused the price of land…
Have you noticed an increase in drugs
Have you noticed an increase in drunkenness
Have you noticed an increase in crime, such as…
Do you think the local culture has changed…
Not sure
No
Yes
*Feedback
about
tourism
impacts are
generally
positive
ALL RIGHTS BELONG TO OWNERTAKEN FROM WWW.INTERNALASSESSMENTS.WORDPRESS.COM
26
anomalous, but significant. It is therefore prudent to increase sample size to confirm
whether tourism brings about a rise in crime rates.
In general, however, the social impacts of tourism from this data seem favourable
and the results support the hypothesis.
ALL RIGHTS BELONG TO OWNERTAKEN FROM WWW.INTERNALASSESSMENTS.WORDPRESS.COM

27
Trends in Quality of life:
0
5
10
15
20
25
30
35
40
45
50
1 2 3 4 5 6
Surv
ey
Sco
re
Group Number
Total Score
0
5
10
15
20
25
30
35
40
1 2 3 4 5 6
Surv
ey
sco
re
Group Number
Total Score
Maximum
score
refers to
highest
possible
scoring
Thaton unanimously scored higher
than BanKhai
Thaton mean score=
39
BanKhai mean score= 29
Figure 16- Quality of life survey scores in Thaton from 20 people
Figure 17- Quality of life survey scores in BanKhai from 20 people
ALL RIGHTS BELONG TO OWNERTAKEN FROM WWW.INTERNALASSESSMENTS.WORDPRESS.COM
28
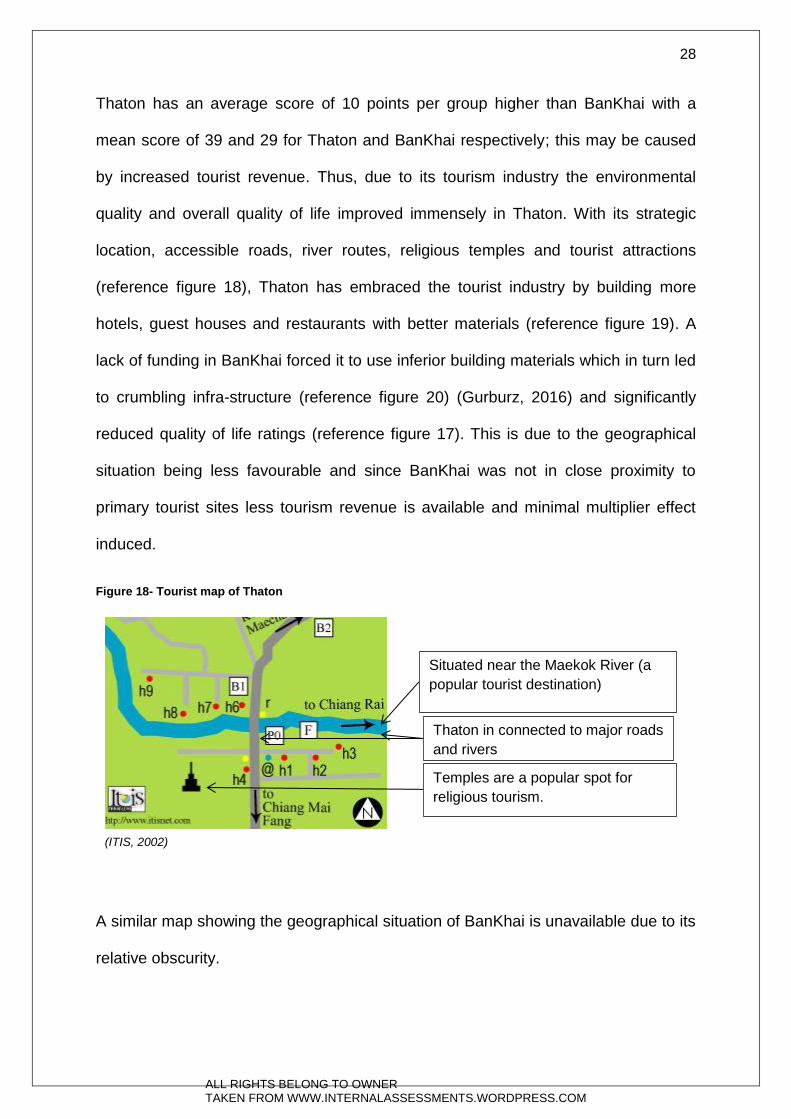
Thaton has an average score of 10 points per group higher than BanKhai with a
mean score of 39 and 29 for Thaton and BanKhai respectively; this may be caused
by increased tourist revenue. Thus, due to its tourism industry the environmental
quality and overall quality of life improved immensely in Thaton. With its strategic
location, accessible roads, river routes, religious temples and tourist attractions
(reference figure 18), Thaton has embraced the tourist industry by building more
hotels, guest houses and restaurants with better materials (reference figure 19). A
lack of funding in BanKhai forced it to use inferior building materials which in turn led
to crumbling infra-structure (reference figure 20) (Gurburz, 2016) and significantly
reduced quality of life ratings (reference figure 17). This is due to the geographical
situation being less favourable and since BanKhai was not in close proximity to
primary tourist sites less tourism revenue is available and minimal multiplier effect
induced.
Figure 18- Tourist map of Thaton
A similar map showing the geographical situation of BanKhai is unavailable due to its
relative obscurity.
Situated near the Maekok River (a
popular tourist destination)
(ITIS, 2002)
Temples are a popular spot for
religious tourism.
Thaton in connected to major roads
and rivers
ALL RIGHTS BELONG TO OWNERTAKEN FROM WWW.INTERNALASSESSMENTS.WORDPRESS.COM
29
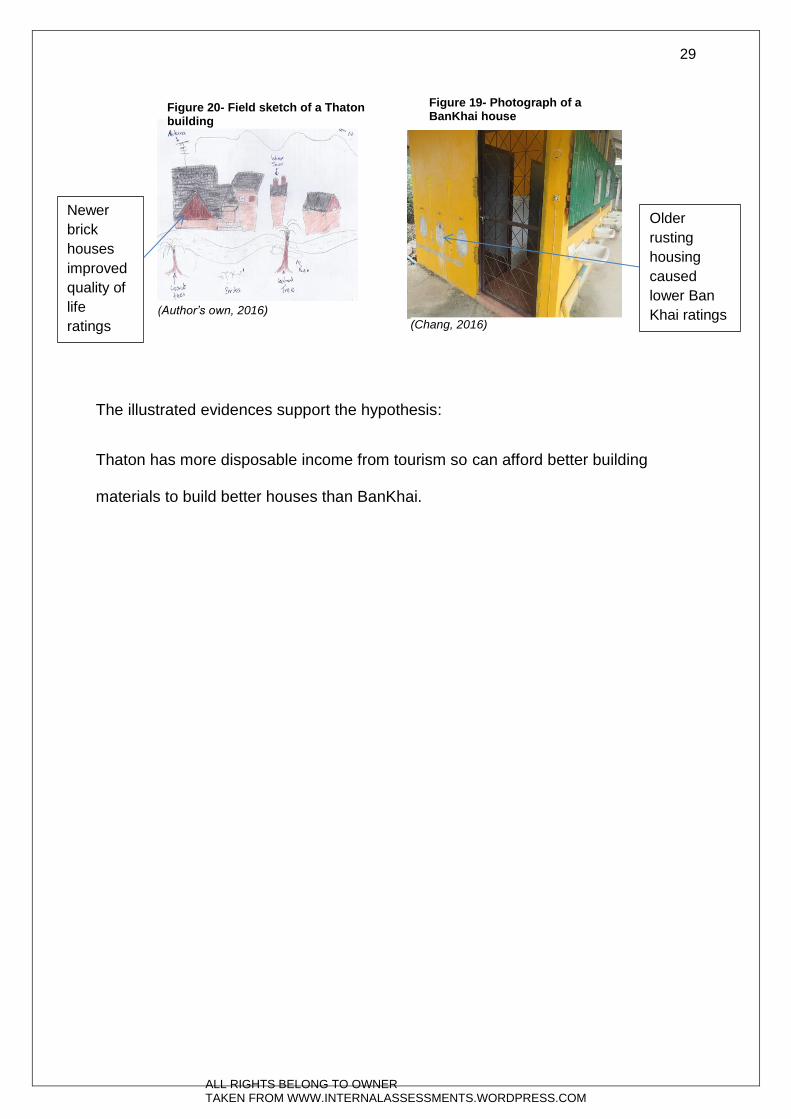
The illustrated evidences support the hypothesis:
Thaton has more disposable income from tourism so can afford better building
materials to build better houses than BanKhai.
Newer
brick
houses
improved
quality of
life
ratings
Older
rusting
housing
caused
lower Ban
Khai ratings (Chang, 2016)
(Author’s own, 2016)
Figure 19- Photograph of a BanKhai house
Figure 20- Field sketch of a Thaton building
ALL RIGHTS BELONG TO OWNERTAKEN FROM WWW.INTERNALASSESSMENTS.WORDPRESS.COM
30
Trends in standard of living:
2.54
2.52
2.4 3
3
00.5
11.5
22.5
3Roof material
Wall material
Generalcondition
Connected toelectricity
Connected towater
Calculated mean
results from both
villages (all
categories)
Figure 21- Thaton housing living quality mean rankings
Figure 22- Ban Khai housing living quality mean ranking
2.35
2.42
2.42 3
3
0
1
2
3Roof material
Wall material
Generalcondition
Connected toelectricity
Connected towater
Anomaly as ranking is
higher in BanKhai
(unexpected result)
ALL RIGHTS BELONG TO OWNERTAKEN FROM WWW.INTERNALASSESSMENTS.WORDPRESS.COM
31
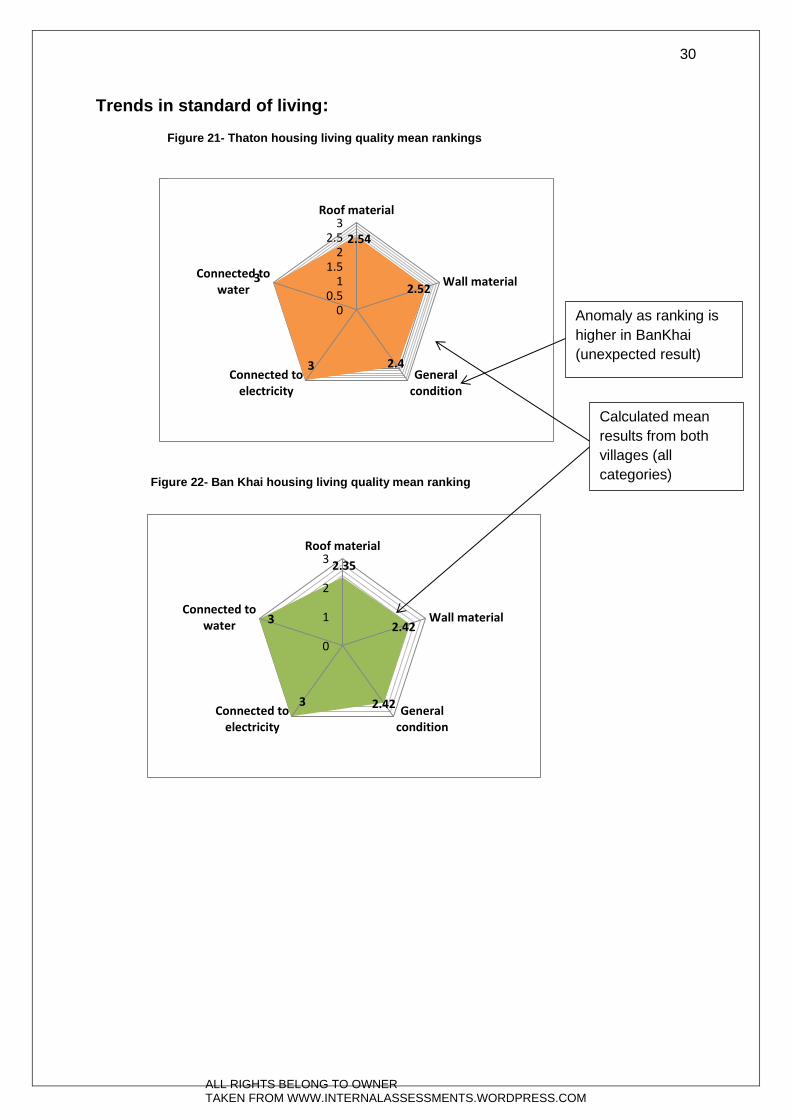
In Thaton, tourist revenue into the region has raised the disposable income of
individuals allowing them to construct better quality buildings. There is a tourist tax of
500 baht in Thailand (anon, 2013). This tax is re-invested into improving the living
standards of locals (which makes Thaton even more appealing to visitors). This led
to Thaton receiving a better ranking on categories such as Roof and Wall material
due to its greater development (reference figures 21 and 22). This is an example of
the classical Butler model in display, where Thaton has benefited from the increase
in tourist number, thus gaining in prosperity, upgrading of infrastructure and
flourishing of the village (Uysal, et al, 2012). BanKhai, unfortunately, lacks this
source of revenue leading to overall lower living standards.
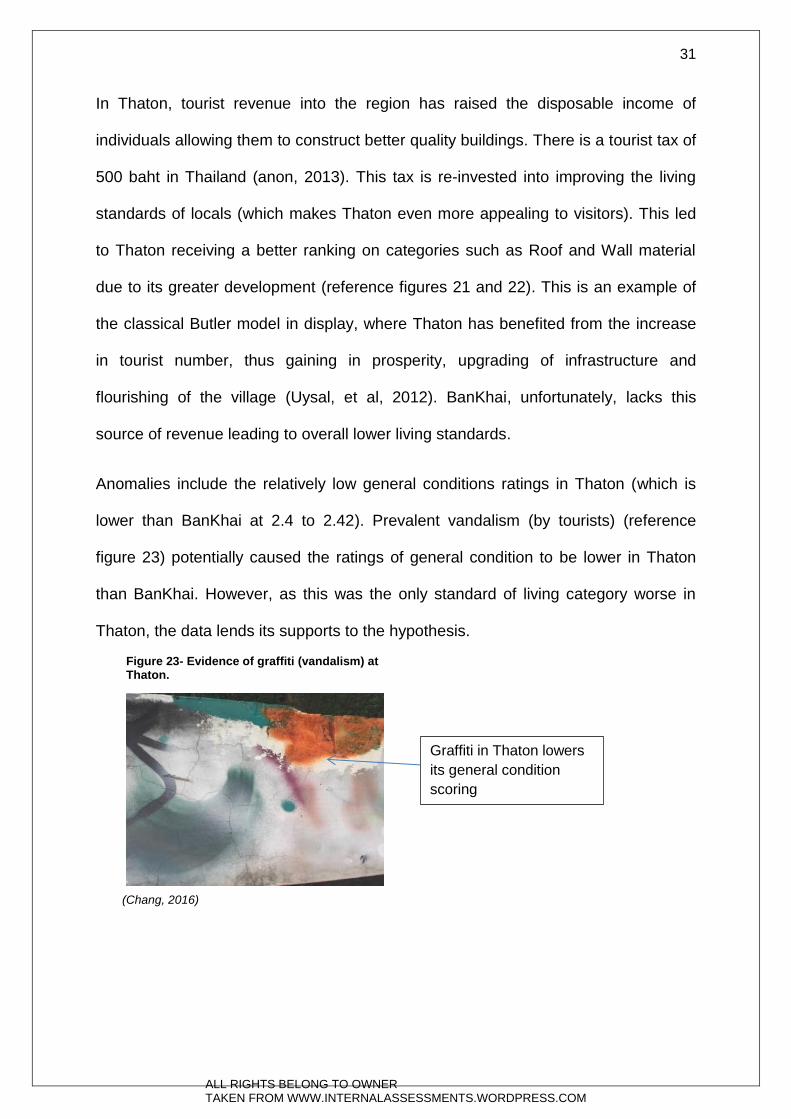
Anomalies include the relatively low general conditions ratings in Thaton (which is
lower than BanKhai at 2.4 to 2.42). Prevalent vandalism (by tourists) (reference
figure 23) potentially caused the ratings of general condition to be lower in Thaton
than BanKhai. However, as this was the only standard of living category worse in
Thaton, the data lends its supports to the hypothesis.
Graffiti in Thaton lowers
its general condition
scoring
(Chang, 2016)
Figure 23- Evidence of graffiti (vandalism) at Thaton.
ALL RIGHTS BELONG TO OWNERTAKEN FROM WWW.INTERNALASSESSMENTS.WORDPRESS.COM

32
Price comparison between the villages
Table 12- Prices of goods Thaton
Price comparison- Thaton (THB)
Price of land (one rai) (Massington, 2016)
1,200,000
Price of 500ml water 15
Price of lighter 5
Price of chewing gum 5
Price of 320ml Chang beer
35
Price of biscuit 7
Table 13- Prices of goods Ban Khai
Tables 12 &13 show significant increases in land prices and other goods that can be
justified by the multiplier-effect model. Increased tourist spending causes inflation.
Increased demand leads to increases in price. Higher inflation is a significant impact
of tourism (Icoz, 1991) as it can outprice locals despite what is perceived to be minor
increment by tourists’ standards. This survey showed that beer and water are 2 and
5 baht higher in Thaton. The most drastic difference is observed in Thaton’s land
price which is three times higher than nearby BanKhai due to increased land
demands in this tourism hotspot. This causes increased rental prices and would
subsequently lead to inflated goods prices that locals also have to pay. Tourism
facilities often take priority over local needs – an occurrence that is difficult to sustain
in the long term. This inflation data, unlike the others, does not support the
hypothesis as inflation is a negative impact the locals will have to suffer.
Goods Ban Khai (THB)
Price of land (one rai) (Massington, 2016)
400,000
Price of 500ml water 10
Price of lighter 5
Price of chewing gum 5
Price of 320ml Chang beer
33
Price of biscuit 5
Unreliable as
water brands
were not kept
constant
Land prices (B.Massington,2016)
Key:
Price Increase
Price Constant
Price Decrease
ALL RIGHTS BELONG TO OWNERTAKEN FROM WWW.INTERNALASSESSMENTS.WORDPRESS.COM
33
Conclusion
In conclusion, the hypothesis “Tourism has a positive socio-economic impact on Mae
Ai” is mostly true. The answer to what socio-economic impacts does tourism bring to
rural communities in the Mae Ai region of Thailand it would be increased prosperity,
quality of life, living standards but these positive impacts is countered by high
inflation rates. Unfortunately, several social issues such as potential crime from
tourism may have arisen, yet insufficient data was collected to address the relevance
of this result.
The results support the Multiplier-effect and Butler’s model which implies that tourism
stimulates development, but also causes inflation and potentially congestion
(reference figures 15, 15a, Tables 12 &13).
The main reason for the conclusion is that the perceptual carrying capacity has not
yet been reached and the socio-economic impacts are mostly positive.
ALL RIGHTS BELONG TO OWNERTAKEN FROM WWW.INTERNALASSESSMENTS.WORDPRESS.COM
34
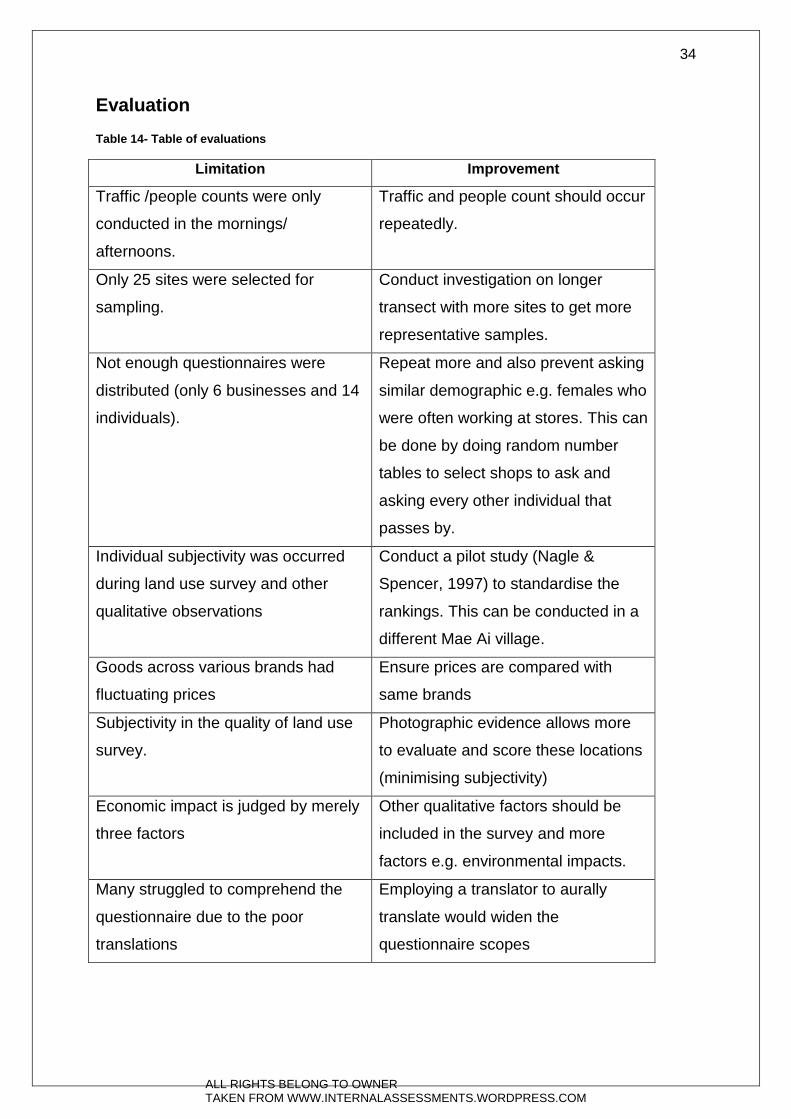
Evaluation
Table 14- Table of evaluations
Limitation Improvement
Traffic /people counts were only
conducted in the mornings/
afternoons.
Traffic and people count should occur
repeatedly.
Only 25 sites were selected for
sampling.
Conduct investigation on longer
transect with more sites to get more
representative samples.
Not enough questionnaires were
distributed (only 6 businesses and 14
individuals).
Repeat more and also prevent asking
similar demographic e.g. females who
were often working at stores. This can
be done by doing random number
tables to select shops to ask and
asking every other individual that
passes by.
Individual subjectivity was occurred
during land use survey and other
qualitative observations
Conduct a pilot study (Nagle &
Spencer, 1997) to standardise the
rankings. This can be conducted in a
different Mae Ai village.
Goods across various brands had
fluctuating prices
Ensure prices are compared with
same brands
Subjectivity in the quality of land use
survey.
Photographic evidence allows more
to evaluate and score these locations
(minimising subjectivity)
Economic impact is judged by merely
three factors
Other qualitative factors should be
included in the survey and more
factors e.g. environmental impacts.
Many struggled to comprehend the
questionnaire due to the poor
translations
Employing a translator to aurally
translate would widen the
questionnaire scopes
ALL RIGHTS BELONG TO OWNERTAKEN FROM WWW.INTERNALASSESSMENTS.WORDPRESS.COM
35
Alternative Investigations
This investigation has demonstrated that the social economic impacts of tourism are
generally positive for Mae Ai given that the perceptual carrying capacity has yet to be
reached. It would be highly interesting to repeat this investigation in a few years
when the tourist counts is likely to have increased and investigate whether or not
impacts were still similar or if the perceptual carrying capacity had been exceeded.
Alternatively, one could investigate the environmental impacts tourism brings to the
Mae Ai community to investigate whether or not the environmental carrying capacity
of Thaton has been reached.
An alternative question could be “What are the environmental impacts of tourism on
the region of Mae Ai?” and information such as soil degradation at tourist hotspots
e.g. around temples/ rivers could be collected and evaluated.
ALL RIGHTS BELONG TO OWNERTAKEN FROM WWW.INTERNALASSESSMENTS.WORDPRESS.COM

36
Bibliography:
Anon (2013), Thailand defends its position over the tourist tax that is 'worrying' travel
operators, http://www.dailymail.co.uk/travel/article-2476554/Thailand-tourist-tax-
Thailand-defends-position-controversial-possible-charge.html#ixzz4qAULTGPi
<accessed 9th August 2016>
B.Massington (2016) Price of land results, Aural
Geography Fieldwork (2013) Figure.7, online,
( http://geographyfieldwork.com/ButlerModel.html), (accessed 16th May 2016)
Chang (2016) Figures 1, 11, 13, 14, 17, 18 Phtographs
Colin Travis (2016), Figure (3-4) online
http://gps.motionx.com/maps/b92ba2d9d740342055c6d46ed4124c01, Thailand,
Motion X (accessed 13th May 2016)
Daniel Greenfield, http://greenfieldgeography.wikispaces.com/Definitions(2016),
Figure 6, online, UK, (accessed 16th May 2016)
ETSY (2016), online, beer bottles https://www.etsy.com/listing/399538717/custom-
printed-beer-bottles-set-of-96 Figure 15 (accessed 9th May 2016)
Gurbuz D. (2016) The Pros and Cons of Gentrification The Odyssey [online]
Available at: https://www.theodysseyonline.com/pros-and-cons-of-gentrification
[Accessed 24th May 2016].
IBO 2009. Geography Guide First examinations 2011, International Baccalaureate.
Icoz (1991), The impacts of inflation on the tourism sector., Anatolia, 2nd Volume,
page 19.
IT IS (2002), Thaton, Thailand, http://www.itisnet.com/english/asia/Thai/thaton/e-
thaton.htm Online, <accessed August 8th 2016>
Laerd Statistics, Pearson Product-Moment Correlation, 2013, Lund Research,
https://statistics.laerd.com/statistical-guides/pearson-correlation-coefficient-
statistical-guide.php , <accessed 10th December 2016>
Lonely planet (2014) Figure 3 online,
http://www.lonelyplanet.com/maps/asia/thailand/ , Unknown publication location,
lonely planet, (accessed 9th May 2016)
Nagle, G. and Spencer, K. (2000) Geographical Enquiries: Skills and Techniques for
Geography. Geography Fieldwork p. 18
ALL RIGHTS BELONG TO OWNERTAKEN FROM WWW.INTERNALASSESSMENTS.WORDPRESS.COM
37
Plant & Soil Sciences eLibrary (2011)
http://passel.unl.edu/pages/informationmodule.php?idinformationmodule=113044711
9&topicorder=8&maxto=16&minto=1 Chi Square test degrees of freedom table
(accessed 7th June 2016)
P.Chang (2016), Figures 10, 12, 13, 20, 23, Peter Chang
Rees, W.E. Popul Environ (1996) 17: 195. https://doi.org/10.1007/BF02208489 DOI
Kluwer Academic Publishers-Human Sciences PressPrint ISSN 0199-0039 Online
ISSN1573-7810, Vancouver
Şevki Ozgener, Rifat Iraz (2006), Customer relationship management in small–
medium enterprises: The case of Turkish tourism industry,
http://www.sciencedirect.com/science/article/pii/S0261517705000762, Tourism
Management Volume 27, Issue 6, December 2006, Pages 1356-1363, <<accessed
July 22nd 2016>>
Stephen Codrington (2002) Planet Geography, p370, 1st edition, Solid Star Press,
Sydney, Australia.
U.S. Department of the Interior | U.S. Geological Survey (2010), Figure 2 (World
map) http://hydrosheds.cr.usgs.gov/index.php, (online), (accessed 19th may 2016)
World Tourism Organization (n.d.), Tourism and Poverty Alleviation,
http://step.unwto.org/content/tourism-and-poverty-alleviation-1 <accessed 17th May
2016>
ALL RIGHTS BELONG TO OWNERTAKEN FROM WWW.INTERNALASSESSMENTS.WORDPRESS.COM