geohydrology and limnology of walden pond, concord - usgs
TRANSCRIPT

Geohydrology and Limnology of Walden Pond, Concord, Massachusetts
By John A. Colman and Paul J. Friesz
d- of
the
a
r-
Abstract
The trophic ecology and ground-water contributing area of Walden Pond, in Concord and Lincoln, Mass., were investigated by the U.S. Geological Survey in cooperation with the Massachusetts Department of Environmental Management from April 1997 to July 2000. Bathy-metric investigation indicated that Walden Pond (24.88 hectares), a glacial kettle-hole lake with no surface inlet or outlet, has three deep areas. The maximum depth (30.5 meters) essentially was unchanged from measurements made by Henry David Thoreau in 1846. The ground-water contributing area (621,000 square meters) to Walden Pond was determined from water-table contours in areas of stratified glacial deposits and from land-surface contours in areas of bedrock highs. Walden Pond is a flow-through lake: Walden Pond gains water from the aquifer along its eastern perimeter and loses water to the aquifer along its western perimeter. Walden Pond contrib-uting area also includes Goose Pond and its contributing area. A water budget calculated for Walden Pond, expressed as depth of water over the
lake surface, indicated that 45 percent of the inflow to the lake was from precipitation (1.215 meters per year) and 55 percent from ground water (1.47 meters per year). The grounwater inflow estimate was based on the averagetwo different approaches including an isotope mass-balance approach. Evaporation accountedfor 26 percent of the outflow from the lake (0.71 meters per year) whereas lake-water seepage toground-water system contributed 74 percent of the outflow (1.97 meters per year). The water-residence time of Walden Pond is approximately5 years.
Potential point sources of nutrients to ground water, the Concord municipal landfill andtrailer park, were determined to be outside the Walden Pond ground-water contributing area. A third source, the septic leach field for the WaldenPond State Reservation facilities, was within theground-water contributing area. Nutrient budgetsfor the lake indicated that nitrogen inputs (858 kilograms per year) were dominated (30 pecent) by plume water from the septic leach field and, possibly, by swimmers (34 percent). Phos-phorus inputs (32 kilograms per year) were
Abstract 1

tts, - -
-
- al
visi-od
ts e.
ty.
nt
d u-ta ifer e p-s-
igh
dominated by atmospheric dry deposition, back-ground ground water, and estimated swimmer inputs. Swimmer inputs may represent more than 50 percent of the phosphorus load during the sum-mer.
The septic-system plume did not contribute phosphorus, but increased the nitrogen to phos-phorus ratio for inputs from 41 to 59, on an atom-to-atom basis. The ratio of nitrogen to phosphorus in input loads and within the lake indicated algal growth would be strongly phosphorus limited. Nitrogen supply in excess of plant requirements may mitigate against nitrogen fixing organisms including undesireable blooms of cyanobacteria. Based on areal nutrient loading, Walden Pond is a mesotrophic lake. Hypolimnetic oxygen demand of Walden Pond has increased since a profile was measured in 1939. Currently (1999), the entire hypolimnion of Walden Pond becomes devoid of dissolved oxygen before fall turnover in late November; whereas historical data indicated dis-solved oxygen likely remained in the hypolimnion during 1939. The complete depletion of dissolved oxygen likely causes release of phosphorus from the sediments.Walden Pond contains a large population of the deep-growing benthic macro alga Nitella, which has been hypothesized to pro-mote water clarity in other clear-water lakes by sequestering nutrients and keeping large areas of the sediment surface oxygenated. Loss of Nitella populations in other lakes has correlated with a decline in water quality. Although the Nitella standing crop is large in Walden Pond, Nitella still appears to be controlled by nutrient availability. Decreasing phosphorus inputs to Walden Pond, by amounts under anthropogenic control would likely contribute to the stability of the Nitella population in the metalimnion, may reverse
oxygen depletion in the hypolimnion, and decrease recycling of phosphorus from the sediments.
INTRODUCTION
Walden Pond, the deepest lake in Massachusehas great historical, naturalistic, and limnological significance as the lake on which Henry David Thoreaulived from July 1845 to September 1847 and the subject of his well-known essay “Walden: or, Life in the Woods” (Thoreau, 1854). Since Thoreau’s time, the uses of Walden Pond and environs have included a wood lot, an amusement park in the late 1800’s, anda county park after 1922. In 1975 the area was designated a Massachusetts State Reservation. Walden Pond is located 24 km west northwest of Boston (fig. 1), in Concord, Mass., with a watershed that extends into Lincoln, Mass. Located in a large metropolitan area, Walden Pond potentially may be alteredby factors common to urban development: a municiplandfill, septic leachate from the Walden Pond State Reservation bathhouse and headquarters, and high tor use rates. Walden Pond retains clear, generally gowater quality primarily because of conservation efforthat protect the woods and shore surrounding the lakQuestions remain whether these conservation effortsare enough to continue to maintain good water quali
The cooperative investigation of the geohydrol-ogy and limnology of Walden Pond by the U.S. Geological Survey and the Massachusetts Departmeof Environmental Management was motivated by thehistorical significance of Walden Pond and by its unusual limnological characteristics: deepest naturallake in Massachusetts, protected drainage basin, anlack of surface inlet or outlet stream. This report docments present (1997–99) conditions and baseline dafor Walden Pond that can be used to understand aquand lake water levels and water-quality conditions. Thdata also may be compared with data from other seeage lakes formed in glacial outwash and deltaic depoits in eastern Mass., many of which are stressed by h
2 Geohydrology and Limnology of Walden Pond, Concord, Massachusetts

Introduction 3
216,000214,000212,000
914,000
912,000
910,000
908,000
L I N C O L N
C O N C O R D
SandyPond
Goose Pond
FairylandPond
Brook
Sudbur
yRi
ver
Concord Ri ver
Mill
Assabet River
Fairhaven Bay
WaldenPond
Little GoosePond
B E D F O R D
Base map from MassGIS digital data, State Plane Meters, Fipszone 2001,1:25,000 scale
Boston
0
MASSACHUSETTS
0 50 MILES
EXPLANATION
WETLANDS
OPEN WATER
Area shown in figure 4
50 KILOMETERS
300,000
200,000100,000
900,000
800,000
0 1/2 1 MILE
0 1 KILOMETER.5
Figure 1.
Location and setting of Walden Pond, Concord, Massachusetts.

a
o
d
h
e
, 6 m
he e
s ly
n m
is- re-
1
Lake level altitude of 48.27 m.
Table 1.
Bathymetric surveys of Walden Pond, Concord, Massachusetts
[Data sources: Thoreau (1854) and Deevey (1942). m
3
, cubic meter; m, meter; m
2
, square meter; --, no data]
Invest-igator
Number ofmeasurements
Area(m
2
)Volume
(m
3
)
Maximumdepth
(m)
Meandepth
(m)
Thoreau........... 75 249,800 -- 31.1 --Deevey ........... 50 248,200 3,224,150 31.3 12.99This investi-
gation .......... 1,700 248,800 3,211,450
1
30.5 12.91
use or other development pressures. The catographic, hydrologic, and limnologic resultsfrom the Walden Pond investigation are summarized in a map report (Friesz and Colman2001), depicting the entire ground-water contributing area at relatively high resolution.
The authors especially are indebted to Ariane Mercandante (U.S. Geological Survey) for help with field work, organiza-tion, and database management. Michelle Dumas and the staff at Walden Pond State Reservation always were helpful during the study. Also, the help of Mike Gildesgane (Massachusetts Department of EnvironmentManagement) in initiating and supporting theproject is greatly appreciated.
GEOLOGIC SETTING AND BATHYMETRY
Walden Pond is a kettle-hole lake, formed at the end of the last glaciation (Wisconsinan stage) about 15,000 years agby the melting of a large block of ice that broke off from the retreating glacier. Initially resting on the bottom of glacial Lake Sud-bury, the ice block eventually was surroundeby deltaic and outwash deposits (Koteff, 1963). These sorted, stratified deposits, whicnow form the shore and sides of the lake, range mainly in size from fine sand to coarsgravel (Koteff, 1964) (fig. 2). Lithologic and natural gamma logs, continuous seismic
4 Geohydrology and Limnology of Walden Pond, Conco
r-
-, -
l
reflection, and fathometer data collected during the current investigation indicate that the lake and its associated fine-grained lake sediments extend to the till and bedrock surfacewhich is granite (Zen, 1983), in the deepest areas of WaldenPond (fig. 2). Fine-grained lake sediments that extend about below the lake basins are approximately equal in thickness ineach deep area.
The bathymetry of Walden Pond reflects the shape of toriginal ice block and the topography of the bedrock under thlake. Two historical bathymetric investigations by Thoreau (1854) in the winter of 1846 and by Deevey (1942) in August1939, were less detailed than the bathymetry mapped for thiinvestigation (fig. 3), which revealed a middle basin, previousunmapped. Fathometer-measured depths in this investigatiowere corrected to a common water-surface elevation of 48.27above sea level. Decreased depth, by comparison with the htorical results (table 1), might indicate the recent rate of fillingin (sedimentation) of the lake; however, differences in measument techniques and unrecorded surface datums in previousinvestigations make direct comparisons invalid.
rd, Massachusetts

Geo
log
ic Settin
g an
d B
athym
etry5
Fine to coarse sand, trace gravel
with gravel layers
Fine to coarsesand,
trace gravel
Medium sand,trace fine
andcoarse sand
Till(sand and gravel)
Till
Water table
Stratified glacial depositsStratified glacial deposits
VERTICAL EXAGGERATION X 10
1,000 FEET0
300 METERS0
100
90
80
70
60
50
40
30
20
10
0
CT
W21
4
WALDEN POND
Fine-grainedbottom sediments
Bedrock
Water table
Stratified glacial deposits
A A'
EXPLANATION
CONTACT LINE—Dashedwhere inferred
ALT
ITU
DE
, IN
ME
TE
RS
AB
OV
E S
EA
LE
VE
L
0 20050 100 150
NATURAL GAMMALOG, IN COUNTS
PER SECOND
LITHOLOGICLOG
SPLIT-SPOON
INTERVALA
LTIT
UD
E, I
N M
ET
ER
S A
BO
VE
SE
A L
EV
EL
23.2
62.8
60
50
40
30
??
Till
Medium sand,trace fine
and coarse sand, trace gravel
Figure 2.
Generalized geologic cross section
A-A
′
through Walden Pond, Concord, Massachusetts, and split-spoon interval, lithologic log, and natural-gamma log from monitoring well CTW214. (Line of section shown in fig. 4.)

6G
eoh
ydro
log
y and
Lim
no
log
y of W
alden
Po
nd
, Co
nco
rd, M
assachu
setts
213,500
213,000
910,000
909,750
10
20
10
10
10
10
4
20
30
10
10 20
20
0 100 200 METERS
500 FEET0
EXPLANATION
DEPTH CONTOUR–In meters belowsurface altitude of 48.27 meters.Contour interval is 2 meters
FATHOMETER DATA POINTS
10
Deepest sounding30.5 metersDeepest sounding30.5 meters
Coordinates shown as 500 meter grid, Massachusetts StatePlane Projection, 1983
18
16
16
16
16
8
Figure 3.
Bathymetry of Walden Pond, Concord, Massachusetts.

n the -
in and
p
f r ed
e
le ls ot n r er e
ial
as
nd- in rs
HYDROLOGY
The aquifer underlying and surrounding Walden Pond, composed of stratified glacial deposits, is bor-dered by the Sudbury River and Concord River (fig. 1). Because there is no surface inlet or outlet to Walden Pond, the land-surface area contributing water to the lake is defined by its ground-water contributing area. Water from precipitation infiltrates the permeable surfi-cial deposits, recharges the aquifer, then flows in the direction of decreasing water levels and discharges to a surface-water body. Thus, the surface topography does not necessarily define the area contributing water to the lake. Along steep shoreline areas sloping towards Walden Pond, including areas outside of the ground-water contributing area, small amounts of overland flow may occur after intense precipitation events. Knowledge of the land-surface area contributing ground water to Walden Pond can be used by water-resource planners in lake management. Knowledge of the water balance of Walden Pond can improve the understanding of lake hydrology and nutrient budget.
Data-Collection Methods
Water levels collected at 40 monitoring wells and 8 ponds (fig. 4) provided data on water-table fluctuations and ground-water flow directions in the Walden Pond vicinity. Monitoring wells were installed for this study and in addition, other wells were present in the vicinity of the Concord municipal landfill. The monitoring wells were screened at or near the water table with the exception of CTW165, which is part of the USGS long-term ground-water level network in Massachusetts. The altitude of the monitoring wells and pond-stage measuring points were surveyed to determine consistent water-level measurements related to sea-level altitude.
Water samples for isotopic analysis were stored in glass bottles with polyseal caps to prevent evapora-tion and were analyzed for isotopic values at a U.S. Geological Survey laboratory in Reston, Va. Precipita-tion samples for isotopic analysis were collected over the duration of specific precipitation events or over several-week periods from July 1998 to September 1999 in a wet-fall bucket. The wet-fall bucket was part of an atmospheric deposition station (fig. 4) and was sealed from the atmosphere except during precipitation events. Volume-weighted bulk samples were analyzed
for each month, except for March and April 1999 wheone volume-weighted sample was used to represent2-month period. Water samples for isotopic composition of ground water were collected from well LVW30approximately monthly from July 1998 to June 1999 and less frequently from wells CTW203 and LVW33 (fig. 4). These ground-water samples were collectedafter an equivalent of at least three volumes of waterthe well casing had been removed and temperature specific conductance measurements had stabilized. Water samples for isotopic analysis were collected from the surface of Walden Pond at the east end deearea (fig. 4) approximately monthly during ice-free periods from June 1998 to June 1999. Atmospheric temperature and relative humidity, parameters used indirectly to calculate the atmospheric composition oevaporated water, were measured hourly by a senso2.7 m above the land surface at CTW205, and recordby a data logger.
Water-Table Configuration and Extent of the Ground-Water Contributing Area
The altitude and configuration of the water tablin areas of stratified glacial deposits surrounding Walden Pond on July 19, 1999, are shown in figure 4(modified from Friesz and Colman, 2001). Water-tabcontours were drawn in English units at 1-foot intervaexcept in areas with shallow gradients, where 0.5-fointervals were used. All ponds were assumed to be idirect hydraulic connection with the underlying aquifeand represent a surface-water expression of the wattable. Total precipitation for the 12 days previous to thwater-level measurements amounted to 2 mm. The direction of ground-water flow, shown by arrows in figure 4, can be determined in areas of stratified glacdeposits from the altitude and configuration of the water-table contours. In areas of bedrock highs, suchEmersons Cliff and Pine Hill, ground water flows downslope through the overlying saturated till in the direction of declining land-surface contours becausethe bedrock surface is relatively impermeable com-pared to surficial deposits. The boundary of the grouwater contributing area of Walden Pond, also shownfigure 4, was drawn based on the water-table contouand ground-water flow directions.
Hydrology 7

8 Geohydrology and Limnology of Walden Pond, Concord, Massachusetts
100
90
80
6070
5040
30
10
3020
10
2010
20
30
40
50
6070
80
90
60
Deep-holesamplingstation
160180
160
180
200
220
240
260280
300
320
200
160
180
200
180
180
200180
18020
0
200
200
200
200
200
200
200
180
200
200
180
180
180
180
200
180
180
200
200
200
200
200
200
200200
200
180
200
180
340
145146147148149150151152153
156157158
154
155
158
157
156 159158.5
159.5
158
158.18
159.64
158.43
155.65
151.75
158.14
158.25
157.46
155.24
158.20
157.92
154.11
155.18
155.68
144.30
158.37
158.93
CTW232
CTW231
CTW230
CTW224
CTW222
CTW221
CTW223
CTW225
CTW212
CTW211
CTW165
CTW243
CTW220
157.23CTW233
W A L D E N
HeywoodsMeadow
AndromedaPonds
Fairhaven
Hill
213,000
ThoreauHomesite
WymanMeadow
Concord Carlisle
High SchoolR
oute 126
Route 2
910,500
910,000
909,500
212,500212,000
A
Base map created by using TERRAMODEL and Mass GIS DTMs, 1999, Coordinates shown as 500 meter grid,Massachusetts State Plane Projection,1983 North American Datum; 1:5,000 Executive Office of Environmental Affairs (EOEA);Protected and Recreational Open Space data from MassGIS, 1989, Massachusetts State Plane Projection, 1983 North American Datum; 1:24,000 EOEA; Surficial Geology data from USGS,1964, Massachusetts State Plane Projection, 1983 North American Datum; 1:24,000 USGS;Building Footprints and Roads data from towns of Concord and Lincoln, 1999 State Plane Feet, Zone 5176, 1983 North American Datum; 1:5,000
Walden Pond State Reservation boundary
EXPLANATION
A'A
CTW224158.20
60
144.30
TILL AND BEDROCK—Unstippled area otherthan wetland or water is stratified glacialdeposits
BUILDINGS
ROADS
GEOLOGIC SECTION
LAND USE
Open water
Wetlands
Conservation
Conservation and recreation
Concord municipal landfill
Other
CONTOURS
Bathymetry—Water depth in feet below watersurface
Water table — Shows altitude of water table,July 19, 1999. Dashed where inferred. Datumis sea level.
Water table—Half foot contour line
BOUNDARIES
Waldon Pond ground-water contributing area
Goose Pond ground-water contributing area
Walden Pond State Reservation Boundary
MONITORING WELL —Alphanumeric code isU.S. Geological Survey well number. Numberindicates altitude of water table. Datum is sea level
SURFACE WATER SITE—Number indicatesaltitude of lake or pond surface in feet abovesea level.
GENERAL DIRECTION OF GROUND-WATERFLOW
158
158.5
55
Figure 4.
Altitude and configuration of the water table on July 19, 1999, extent of the ground-water contributing area, and

Hydrology 9
35
55
10
20
304050
40
50
60
5540
30
4050
60
160
180
200
220
160180
200
220
260
240
200
220
240
200
200
200
200
180
200 200
200
200
220
240
180
180
300
320
340
160
160
160
180
200
280
180
200
220
240
260
280
300
320
340
360
220 220
220
200
200
200
220
200
180
200
180
220
220
200
200
180
180
154
153
155
158
158.5
159
159.
5157
158.
5
159.
5159
160
159.5
156
159.26
159.24158.12
158.75158.39
158.63
159.39
NA159.19
159.45
159.10
158.27158.64
159.39
159.37
159.38
159.35
159.38
159.40
159.38
158.74
158.45
158.41
159.42
156.07
158.37
159.80
159.53
CTW204CTW218
CTW217
CTW213
CTW244
CTW216
CTW205
LVW30
CTW206
CTW207
CTW208
CTW227
CTW203
CTW214
CTW238
CTW239
CTW240
CTW241
LVW33
LVW31
CTW210
CTW226
CTW209
CTW242
152.39
155.44
158.70
153.75CTW234
CTW235
CTW236
CTW237
P O N D
EmersonsCliff
Boat Ramp
East-endsamplingstation
Reservation SepticLeachField
214,000
LINCOLN
CONCORD
213,500
Goose
Pond
ThoreauInstitute
Concord municipal landfill
Route 2
AtmosphericDepositionStation
Little GoosePond
220
910,500
910,000
909,500
PineHill
Trailer
Park
Route
126
65
A'
0
0
1,000 FEET
300 METERS
bathymetry, Walden Pond, Concord, Massachusetts.

o . 1 -
d
er i-ter-is-
nds
g-i-
er-ar
ea-e 1 d
y nd y
The water-table map indicates that Walden Pond is a flow-through lake in which the aquifer serves as both a recharge and discharge zone for Walden Pond; ground-water flows into the lake along its eastern perimeter and lake-water flows into the aquifer along its western perimeter. The ground-water contributing area for Walden Pond also includes the contributing area and the surface area of Goose Pond. Precipitation that falls directly on the surface of Goose Pond and ground water from the direction of Pine Hill that enters Goose Pond on its upgradient side, leaves the pond either through evaporation or as pond water that enters the aquifer on the downgradient sides of the pond. Because the altitude of Goose Pond is higher than most of the ground-water levels in the aquifer surrounding it, pond water flows in a radially outward pattern from the pond; some of this pond-derived water that enters the aquifer flows west toward Walden Pond.
The Walden Pond ground-water contributing area is mainly within the Reservation Boundary and other conservation land except for that part of the con-tributing area that also is part of Goose Pond and its contributing area. Depending on subsurface transport processes, the Reservation septic leach field and the leach fields from residences on privately owned land located in the contributing area east of Walden Pond are potential source of nutrients to the lake (fig. 4). Ground water in the Reservation septic leach field area flows westward toward the eastern shore of Walden Pond. Leach fields from houses in the contributing area are located in areas where ground water flows towards Walden Pond directly or indirectly through Goose Pond. Ground water in the southeastern part of Walden Pond contributing area generally flows northwest from till-covered bedrock highs, Emersons Cliff and Pine Hill. Most of the ground water from till-covered areas probably enters the stratified glacial deposits before discharging to Walden Pond. Northeast of Walden Pond, the Concord municipal landfill and the trailer park are located on the north side of a ground-water divide; ground water north of the divide flows gener-ally northward away from Walden Pond toward Fairy-land Pond and Mill Brook, a tributary to the Concord River (fig. 1). North of Walden Pond near well CTW212, a localized ground-water high is present. The high may result because of the increased water levels resulting from a decrease in flow in the fine-grained sediments in this area, thinner sediments than the surrounding area, or both.
Lake-derived ground water flows towards and discharges into the Sudbury and Concord Rivers or twetlands and streams draining into these rivers (figsand 4). Southwest of Walden Pond, between the bedrock high of Fairhaven Hill and Emersons Cliff, grounwater discharges to Heywoods Meadow and the Andromeda Ponds, which drain into the Sudbury Rivby way of Fairhaven Bay. The steep water-table gradent southwest of Walden Pond is caused by large walevel differences (14 ft) between Walden Pond and dcharging areas. Northwest of Walden Pond, ground water discharges into an unnamed stream and wetladraining into the Sudbury River or into the Mill Brookwatershed that drains into the Concord River.
Ground-Water and Lake-Stage Fluctuations
Ground-water levels in the aquifer surroundingWalden Pond fluctuate because of seasonal and lonterm variations in recharge to the aquifer from preciptation. Water levels in Walden Pond also fluctuate seasonally and over the long-term because inflows and outflows to the lake vary. Hydrographs from the long-term network well CTW165 and from Walden Pond, along with precipitation amounts, are shown in figures 5 and 6 to illustrate these seasonal and long-term fluctuations.
Water levels in well CTW165, located about 400 m north of Walden Pond near the intersection ofRoutes 2 and 126, have been measured periodicallysince February 1965. CTW165 consists of a 0.6 m screen about 8 m below the water table in an area where the unsaturated zone is about 12 m thick; watlevel fluctuations at this well are assumed to be similto water levels in wells screened at the water table. Mean ground-water-level altitude for the period of record is 48.12 m. The stage of Walden Pond was msured during this study and historical stage data weravailable from water levels collected by Walden PondState Reservation staff in 1956 and from 1959 to 197(Walker, 1971). Precipitation data for part of 1957 anfrom 1958 to 1999 are from a National Oceanic and Atmospheric Administration (NOAA) climatological station in Bedford, Mass., 5 km northeast of the studarea, whereas precipitation data from 1953 to 1956 apart of 1957 are from the NOAA climatological stationin Framingham, Mass, about 14 km south of the stud
10 Geohydrology and Limnology of Walden Pond, Concord, Massachusetts

WATER LEVEL IN WELL CTW165MEAN GROUND-WATER ALTITUDE FOR YEARS 1965–99MEASUREMENT ON JULY 19, 1999
WALDEN POND STAGEMEASUREMENT IN JUNE 1956MEASUREMENT ON JULY 19, 1999
PRECIPITATION AVERAGEFOR YEARS 1960–99
GR
OU
ND
-WAT
ER
LE
VE
L,
IN M
ETE
RS
AB
OV
E S
EA
LE
VE
LW
ALD
EN
PO
ND
STA
GE
, IN
ME
TER
S A
BO
VE
SE
A L
EV
EL
50
46
47
48
49
AN
NU
AL
PR
EC
IPIT
ATIO
N,
IN M
ETE
RS
1954
1956
1958
1960
1962
1964
1966
1968
1970
1972
1974
1976
1978
1980
1982
1984
1986
1988
1990
1992
1994
1996
1998
.84
.64
1.64
1.04
1.24
1.44
50
46
47
48
49
No data
eds . il
ore ta-es
Figure 5.
Water levels at well CTW165 and Walden Pond, Concord, Massachusetts, and annual precipitation amounts, Bedford and Framingham, Massachusetts, 1953–99.
area (U.S. Department of Commerce, National Oceanic and Atmospheric Administration, 1995–99; Hydro-sphere Data Products, 1995). The mean annual precipi-tation over the ground-water contributing area from 1960 to 1999 is 1.151 m.
The hydrograph from CTW165 (fig. 6) indicates, in general, that water levels rise from winter through early summer when recharge to the aquifer exceeds
ground-water discharge; therefore, water is added toaquifer storage. From summer through winter, waterlevels decline because ground-water discharge excerecharge and water is released from aquifer storageWater is available to recharge the aquifer after the somoisture deficit has been satisfied in autumn and beflate spring when evapotranspiration exceeds precipition. The annual cycle of water-level rises and declin
Hydrology 11

J M A M J J A S O N D J F M A M J J A S O N D J M A M J J A S O N D J M A M J J A S O N D J M A M J J A S1995 1996 1997 1998 1999
0.1
0.0
0.2
0.3
0.4
0.5
0.6
0.7
0.8
0.9
1.0
1.1
1.2
1.3
MO
NT
HLY
PR
EC
IPIT
ATIO
N, I
N M
ET
ER
S
MFJ
F F F F
A M J J A S O N D J F F F FM A M J J A S O N D J M A M J J A S O N D J M A M J J A S O N D J M A M J J A S1995 1996 1997 1998 1999
WAT
ER
LE
VE
LS, I
N M
ET
ER
S A
BO
VE
SE
A L
EV
EL
MONTHLY PRECIPITATION
WATER LEVEL IN WELL CTW165
WALDEN POND STAGE
49.0
49.5
50.0
47.0
47.5
48.0
48.5
ge is
in age - l
9.
ter-
- in
Figure 6.
Water levels at well CTW165 and Walden Pond, Concord, Massachusetts, and monthly precipitation amounts, Bedford, Massachusetts, 1995–99.
lag climatic conditions because of the transit time for precipitation to recharge the water table through the unsaturated zone and because of storage in the aquifer.
Water levels from Walden Pond show a fluctua-tion pattern that is similar to the ground-water hydrograph for the common years of data because the lake is hydraulically connected to the surrounding aquifer. The magnitude of fluctuations in Walden Pond are less than the aquifer, however, because the lake has proportionally greater storage capacity than the aquifer. Water levels in the lake rise when inflows from ground water and precipitation exceed outflow to ground water and evaporation; water levels decline when these outflows exceed inflows.
Long-term variations in water levels, reflective of long-term storage changes in the aquifer and Walden Pond, also are evident from the hydrographs (fig. 5). The lowest water-level altitude for the period of record, 46.38 m at CTW165 and 46.34 m at Walden Pond, was
in early 1967 after 4 successive years of below averaprecipitation; cumulative precipitation deficiency from1963 to 1966, amounting to about 1.17 m, caused thdepletion in storage. Two periods of relatively high water-level altitudes occurred in 1956 and 1984. Thehighest recorded altitude of Walden Pond of 49.8 m 1956 resulted from 4 successive years of above averprecipitation. The highest recorded ground-water altitude of 49.91 m in 1984 was due to 2 years of aboveaverage precipitation following 2 years of near normaprecipitation. Water levels fluctuated over a range of about 3.5 m for the period of record from 1956 to 199
Water-level altitude in CTW165 and of Walden Pond, measured on July 19, 1999, to prepare the watable map, are shown in figure 5. The ground-water altitude was 48.29 m, which is 0.17 m above the longterm average and indicates that the water-table mapfigure 4 is representative of near-normal water-table conditions. In the eastern half of Massachusetts,
12 Geohydrology and Limnology of Walden Pond, Concord, Massachusetts

m d
l -d
pe r
on-
r n no the l
on ly nd ; d
-
d and
ec-
ground-water levels and streamflows generally were below normal from autumn 1998 to late summer 1999 (Socolow and others, 2000). Water levels in Walden Pond and its contributing area, however, were at or above-average levels because of the large quantity of water in storage and because of the low outflow rates from the lake and aquifer.
Water Balance
A water balance is determined by measuring or estimating the inflows and outflows to a lake and the change, if any, in lake-volume storage (∆S). Water enters the lake from precipitation (P) that falls directly on the lake surface and from ground water upgradient of the lake (ground-water inflow, GWi ). Water dis-charges from the lake through evaporation (E) from the lake surface and from lake-water seepage to the aquifer (ground-water outflow, GWo). Thus, the water-balance equation for a lake, similar to Walden Pond, without surface inflows and outflows can be expressed as
∆S = P + GWi - E - GWo , (1)
with values expressed in consistent units of either volumetric flow rates or linear units.
The water balance for Walden Pond was defined based on average annual conditions during the 5-year period 1995–99. Preliminary water-balance calcula-tions indicated that the water-residence time of Walden Pond was approximately 5 years; therefore, inflows and outflows to the lake should be reflective of the cli-matic conditions during this period. There was no change in long-term lake storage during 1995–99 based on the ground-water hydrograph at CTW165 (fig. 6). Precipitation, ground-water inflow, and evaporation were determined from both site-specific and regional data, whereas ground-water outflow was calculated indirectly as a residual of the water balance. Inflow and outflow values are approximate because of uncer-tainties in the water-balance components, which can be attributed to measurement errors and the use of indi-rect calculations and regional data for site-specific purposes, among other factors (Winter, 1981).
Precipitation and Evaporation
The average annual precipitation on Walden Pond and surrounding area during 1995–99 was 1.215 m, which is 0.064 m above the 40-year long-teraverage. Annual precipitation during this 5-year perioranged from 0.147 m below to 0.404 m above long-term average annual precipitation. An average annuaevaporation of 0.71 m from the lake surface was estimated using regional-scale rates from Farnsworth anothers (1982), which were based on pan evaporationand pan coefficient measurements.
Ground-Water Inflow
The ground-water inflow rate to Walden Pond was determined by using contributing-area and isotomass-balance approaches. Quantifying ground-wateinflow with the contributing-area approach requires knowledge of the recharge rate and the size of the ctributing area where ground water flows directly to Walden Pond. In addition, because Goose Pond is within the contributing area, the quantity of pond wateentering the aquifer from Goose Pond and flowing asground water to Walden Pond must be considered. Aassumption of the contributing-area approach is that upgradient ground water flows beneath or by-passeslake because deep areas of the lake extend to the tiland bedrock surface.
The isotope mass-balance approach is based stable isotopes of oxygen and hydrogen that naturalare present in water. Inflows and outflows to a lake, athe lake water can have different isotopic signaturesthese isotopic differences, along with precipitation anevaporation rates, can be used to determine groundwater inflow to a lake using a technique described byKrabbenhoft and others (1990). This technique has been used successfully in climatic conditions of the Midwest (Krabbenhoft and others, 1990; LaBaugh anothers,1997) and the southern United States (Sacks others, 1998). The isotopic composition of oxygen (δ18Ο) and hydrogen (δD) is defined in delta (δ) notation and reported in parts-per-thousand (per mil)relative to Vienna Standard Mean Ocean Water (V-SMOW). Laboratory precision of the oxygen and hydrogen isotope results is ±0.2 and ±2 per mil, resptively, at the 95-percent confidence interval (Tyler Coplen, U.S. Geological Survey, written commun., 1999).
Hydrology 13

, -ro-
e
r o-
cu-or
-
ted
- si-
Contributing-Area Approach
Recharge to ground water was estimated based on mean annual runoff from watersheds drained by streams. Annual runoff, equivalent to precipitation minus evapotranspiration over the watershed, provides an estimate of maximum water available for recharge to ground water. Because the Walden Pond watershed lacks surface-water drainage, all water available to recharge the ground water should infiltrate the perme-able surficial deposits. Randall (1996) constructed lines of equal mean annual runoff for the glaciated Northeast United States based on record from streamflow-gaging stations over the 30-year period, 1951–80; annual runoff averaged 0.58 m (depth of water over a water-shed) when precipitation averaged 1.12 m. Watershed studies that have compared precipitation and runoff have found that annual evapotranspiration rates are not greatly affected by variations in annual precipitation (Lyford and Cohen, 1988); therefore, for this study, the recharge estimate was increased by 0.10 m to 0.68 m to account for the increased average precipita-tion during the 1995–99 period. The ground-water contributing area of Walden Pond that is not part of Goose Pond, 463,000 m2, was multiplied by the recharge value resulting in a ground-water inflow value of 315,000 m3/yr.
The ground-water contribution to Walden Pond from Goose Pond for 1995–99 was determined by a water-balance analysis. Precipitation falling directly on Goose Pond, which has a surface area of 46,000 m2, was computed to be 56,000 m3/yr. Ground-water inflow from the contributing area of Goose Pond, which covers an area of 112,000 m2, was calculated to be 76,000 m3/yr. Evaporation from the pond surface was equal to 33,000 m3/yr. The average annual ground-water outflow from Goose Pond of 99,000 m3/yr was determined by balancing the water budget on the basis of the above values. Because about 20 percent of the outflow perimeter of Goose Pond lies within the con-tributing area of Walden Pond, 20 percent of the aver-age annual ground-water outflow from Goose Pond, or 20,000 m3/yr, was assumed to flow toward Walden Pond.
The average annual ground-water inflow to Walden Pond totals 335,000 m3/yr or, expressed as depth of water over the lake surface, 1.35 m/yr (volumetric flow rate, 335,000 m3/yr, divided by
lake-surface area, 249,000 m2). The ground-water contribution from Goose Pond is 6 percent of this total ground-water inflow.
Isotope Mass-Balance Approach
The isotope mass-balance approach combinesthe water-balance equation (equation 1) with an isotopic mass-balance equation
∆S(δL) = P(δP) + GWi(δGWi) - E(δE)
- GWo (δGWo) , (2)
where ∆S, P, GWi, E, and GWo have been defined previ-ously and δL, δP, δGWi, δE, δGWo are the isotopic com-position of the lake, precipitation, ground-water inflowevaporated water, and ground-water outflow, respectively. This approach assumes that the lake is at hydlogic and isotopic steady-state and that the isotopic composition of ground-water outflow is equivalent tothe isotopic composition of a well-mixed lake. Becausthe water-balance equation is rearranged to solve foground-water outflow and then substituted into the istopic mass-balance equation, this component of the outflow drops out and, thus, does not need to be callated directly. The isotopic mass-balance approach fa lake without surface-water inflow and outflow to determine ground-water inflow is expressed as (Krabbenhoft and others, 1990)
, (3)
where all parameters are defined previously. Averageisotope values from water samples collected from July 1998 to June 1999 were assumed to represent the average isotopic values for the 5-year period of 1995–99.
The temporal distribution of the isotopic composition of precipitation, ground-water inflow, and lake water are illustrated using δ18Ο (fig. 7). The δD results have similar temporal trends and these values are lisin appendix A. The δ18Ο of precipitation varied seasonally ranging from -11.2 in December 1998 to -3.26 inJuly 1999. This seasonal variation in isotopic compotion of precipitation is due primarily to changes in
GW1
P δL δP–( ) E δE δL–( )+
δGW1δL–
-----------------------------------------------------------=
14 Geohydrology and Limnology of Walden Pond, Concord, Massachusetts

-
ria-n e
Figure 7.
Temporal variation in delta oxygen-18 of precipitation, ground-water inflow, and lake water, Walden Pond, Concord, Massachusetts, and monthly precipitation amounts, Bedford, Massachusetts, June 1998 to September 1999.
atmospheric temperature (Gat, 1980). Volume-weighted averages for the period July 1998 to June 1999 were -7.54 for δ18Ο and -42.8 for δD. Isotopic composition of ground-water inflow varied little spa-tially and temporally. Average values from LVW30, -9.35 for δ18Ο and -58.7 for δD, were used to represent the isotopic composition of ground-water inflow to Walden Pond. The average annual isotopic composition of ground water has lower values in δ18Ο and δD com-pared to the average annual isotopic composition of precipitation because precipitation recharges the aqui-fer primarily from autumn to spring, when atmospheric temperature is low. Evaporation from the lake surface
enriches the lake water in oxygen-18 and deuterium compared to precipitation and ground-water inflow. The δ18Ο of lake water ranged from -4.14 to -3.61, which indicated minimal seasonal variation in the isotopic composition of the lake, as is typical of deep surface-water bodies with relatively long water-residence times (Dincer, 1968). The variation in the isotopic composition of lake surface water that was present probably results because of the seasonal vation in evaporation rates and the seasonal variation ithe isotopic composition of precipitation. The averagisotopic composition of the lake water based on
Hydrology 15

, n n a f s. of
December 1998 and March 1999 isotope values, when Walden Pond was thermally and chemically mixed, was -3.94 for δ18Ο and -34.4 for δD.
Values of δ18Ο and δD of ground-water inflow, lake water, and rainfall-dominated precipitation sam-ples, excluding the precipitation sample from July 1999, which may have been affected by evaporation, are shown in figure 8. The local meteoric water line (LMWL), determined from the rainfall-dominated precipitation samples, is defined by the regression equation
δD = 7.22δ18O + 8.52 (n=11; R2=0.96).
This LMWL differs from the Global Meteoric Water Line (GMWL) of δD = 8δ18O + 10 probably because of the limited number and range of data points used in
the calculation. The isotopic composition of ground-water inflow plots along this LMWL, indicating that water recharging the aquifer was unaffected by evaporation. Lake water, which has been affected byevaporation, plots to the right of the LMWL because evaporation causes an increased enrichment of δ18Ο relative to δD in the lake water. An evaporation line ofless steep slope than the LMWL was drawn from themidpoint between the average annual isotopic composition of precipitation and ground-water inflowand through the lake samples. The midpoint betweethe source waters was used because, as explained isubsequent section of this report, about 50 percent othe inflows to the lake are from each of these sourceThis evaporation line indicates the isotopic evolution lake water from its source waters (Krabbenhoft and others, 1990).
16 Geohydrology and Limnology of Walden Pond, Concord, Massachusetts
-12 -2-11 -10 -9 -8 -7 -6 -5 -4 -3
DELTA OXYGEN-18, IN PER MIL
-80
-20
-70
-60
-50
-40
-30
DE
LTA
DE
UT
ER
IUM
, IN
PE
R M
IL
Local meteoric water line
Evaporation line
PRECIPITATION
LAKE WATER
GROUND-WATER INFLOW
Figure 8. Relation between delta oxygen-18 and delta deuterium in precipitation, ground-water inflow, and lake water, Walden Pond, Concord, Massachusetts, June 1998 to September 1999.

d-
ter
s-
d
-s al-e
r r
The isotopic composition of evaporated lake water was calculated indirectly based on an equation derived by Craig and Gorden (1965)
, (4)
where δE and δL have been defined previously and δA is the isotopic composition of atmospheric moisture; h is relative humidity normalized to the temperature of the lake surface water; α* is the equilibrium fractionation factor at the temperature of the air-water interface defined by Majoube (1971); ∆ε is the kinetic fraction-ation factor estimated as 14.3 (1-h) and 12.4 (1-h) for δ18Ο and δD, respectively (Gilath and Gonfiantini, 1983), in units of per mil; and ε is the total fraction-ation factor equivalent to 1,000 (1 - α*) + ∆ε, in units of per mil. The isotopic composition of atmospheric moisture was not measured directly as part of this investigation; however, this parameter can be estimated by assuming it is in isotopic equilibrium with precipita-tion. Krabbenhoft and others (1990) measured this parameter in their lake study and found that seasonal variation in the isotopic composition of atmospheric moisture parallels that of precipitation for most of the year with the poorest agreement during the warmest months of July and August. They also determined that most of the uncertainty in the isotope mass-balance approach from their lake study was due to the uncertainties in δE and evaporation.
Monthly average values of the isotopic composi-tion of evaporated water were calculated for ice-free months with equation 4; an annual volume-weighted average was then determined based on estimated monthly evaporation rates. The monthly average values used to calculate the δ18Ο of evaporated water are shown in table 2. The volume-weighted average for the July 1998 to June 1999 period was -23.3 for δ18Ο and -98.4 for δD.
Ground-water inflow calculated with equation 3 resulted in 1.73 m/yr for δ18Ο and 1.45 m/yr for δD, which compare favorably to the estimate based on the contributing-area approach. An average of 1.59 m/yr was calculated for the δ18Ο and δD values.
Average Ground-Water Inflow
Ground-water inflow calculated on the basis ofthe contributing-area approach was 1.35 m/yr. Grounwater inflow determined on the basis of the isotope mass-balance approach was 1.59 m/yr. A ground-wainflow value of 1.47 m/yr (366,000 m3/yr), based on the average of the contributing-area and isotope masbalance approaches, was used in the water-balanceanalysis for Walden Pond.
Water-Balance Results
Average annual inflow to Walden Pond for the 5-year period 1995–99, from precipitation and grounwater, totaled about 2.68 m/yr (667,000 m3/yr). The water-residence time for the lake, calculated by dividing the volume of the lake by the total inflow rate, wa4.8 years. A summary of the average annual water bance is shown graphically in figure 9 partitioned on thbasis of the magnitude of inflow and outflow compo-nents. Precipitation on the lake surface accounted foabout 45 percent of the inflow, whereas ground-wateinflow contributed about 55 percent of the inflow.
δE
α∗ δL hδA– ε–
1 h– 0.001∆ε+--------------------------------------=
PRECIPITATION(45%)
GROUND-WATERINFLOW
(55%)EVAPO-RATION(26%)
GROUND-WATER
OUTFLOW(74%)
Figure 9. Average annual water balance, Walden Pond, Concord, Massachusetts.
Hydrology 17

18G
eoh
ydro
log
y and
Lim
no
log
y of W
alden
Po
nd
, Co
nco
rd, M
assachu
setts
Table 2. Monthly average values used to calculate the delta oxygen-18 of evaporated water, Walden Pond, Concord, Massachusetts
[Temperature—Lake: Monthly or average of bimonthly temperature measurements of lake-surface water; March 1999 estimated from March 1998. Temperature—Air: July and August 1998 estimated from July and August 1999. Relative humidity: Normalized to the temperature of the lake-surface water. Isotopic composition of lake water: May 1999 is an average of April and June 1999. Evaporation: Average annual evaporation, distributed monthly is appoximated from the percentage of annual evaporation each month at Mirror Lake, New Hampshire, calculated for 1990–95 and 1997–98 (Mirror Lake data provided by Donald Rosenberry, U.S. Geological Survey, written commun., 2000). ˚C, degrees Celsius; δA, isotopic composition of atmospheric moisture; δP, isotopic compo-sition of precipitation; --, not applicable]
Date
Temperature (˚C)
Relative humidity(fraction)
Equilibrium fraction-
ationfactor
Kineticfraction-
ationfactor
(per mil)
Totalfraction-
ationfactor
(per mil)
Isotopic composition
of precip-itation
(per mil)
Equilibrium fractionation
factor between
δP and δA
Isotopiccomposition
of atmo-spheric
moisture(per mil)
Isotopic composi-
tion oflake water(per mil)
Isotopic composition
of evapo-rated water
(per mil)
Evaporation(meters)
Lake Air
July 1998................ 26.8 23.6 0.614 0.99086 5.52 14.66 -6.55 9.22 -15.8 -4.14 -23.2 0.15August 1998 ........... 25.8 21.0 .573 .99078 6.11 15.33 -5.33 9.31 -14.6 -3.61 -24.3 .12September 1998......22.8 18.2 .570 .99053 6.15 15.62 -7.87 9.56 -17.4 -3.78 -21.6 .10October 1998.......... 15.8 11.0 .551 .98994 6.42 16.48 -7.25 10.16 -17.4 -3.77 -23.3 .06November 1998...... 9.4 5.3 .555 .98935 6.36 17.01 -7.46 10.76 -18.2 -3.84 -23.7 .02
December 1998 ...... 5.8 2.4 .547 .98901 6.48 17.47 -11.2 11.11 -22.3 -3.85 -19.7 .01January 1999 .......... -- -3.0 -- -- -- -- -- -- -- -- -- --February 1999 ........ -- -.2 -- -- -- -- -- -- -- -- -- --March 1999 ............ 4.3 3.2 .598 .98886 5.75 16.89 -8.16 11.27 -19.4 -4.04 -22.7 .01April 1999 .............. 10.5 9.1 .519 .98946 6.88 17.42 -8.16 10.65 -18.8 -4.03 -23.9 .04
May 1999 ............... 17.6 14.9 .603 .99010 5.68 15.58 -5.31 10.00 -15.3 -3.86 -25.2 .08June 1999 ...............23.2 21.2 .612 .99057 5.55 14.98 -6.42 9.52 -15.9 -3.68 -22.5 .12
Annual volume-weighted average of the isotopic composition of evaporated water (per mil) ....................................................................................................................-23.3

n-
ng
ll e
n 5).
an
-
n ea ed
Outflow from the lake because of evaporation from the lake surface accounted for 26 percent of the outflow. Ground-water outflow (1.97 m/yr), calculated as the residual value of the water-balance equation, accounted for 74 percent. Ground water is the dominant pathway into and out of Walden Pond.
LIMNOLOGY
The primary public concern for Walden Pond relates to the trophic (nutritional) ecology of the lake—whether urban development or high public use at the Walden Pond State Reservation may have altered or will alter the relation between plant nutrient supplies and plant growth in the lake. Plant nutrient supplies, especially of growth-limiting nitrogen (N) and phos-phorus (P), are key water-quality features of kettle-lake investigations because nutrients determine the type and quantity of lake biomass production, and plant growth, in turn, affects water clarity and controls the amount of summer dissolved oxygen (DO) present in the deep water. In addition, cycling of natural bioactive chemi-cal constituents of the water is affected by plant pro-duction as is, to a degree, cycling of bioconcentrating pollutants like polychlorinated biphenyls and mercury. Trophic ecology, in turn, depends on hydrogeology—sources, amounts, and cycling of water, and on chemi-cal constituents carried by the water. The geohydro-logic appraisal of Walden Pond limnology developed in this report leads to a determination of the ecological trophic state of the lake and to assessments of past and potential future ecological changes.
External Inputs
Sources and amounts of water that enter Walden Pond were described in the “Hydrology” section of this report. In the “Limnology” section, estimates are made of the chemical constituents contained in the water and of the constituent fluxes represented by flow of water into Walden Pond. Sources of nutrient inputs for Walden Pond, which lacks a stream input, are ground water, atmospheric deposition, avian, stocked fish, swimmers, and direct runoff from parking-lot and road pavement.
Nutrient inputs for Walden Pond were estimated recently by Baystate Environmental (1995). The present investigation remeasured ground-water and atmospheric-deposition inputs, which are important particularly for nutrient budgets of kettle-hole seepage
lakes. Values for other nutrient budget components were taken directly or modified from Baystate Enviromental (1995).
Ground-Water Nutrient Inputs
Ground-water nutrient inputs were divided intopoint-source and background contributions. Dependion geochemical conditions in the aquifer, estimates of inputs from these sources can be determined fromthe product of ground-water flow and measured concentrations of nutrients.
Sampling and Analytical Methods for Ground Water
Chemical-constituent concentrations in groundwater were determined by sampling 12 monitoring wells open to the water table and 2 deeper wells, CTW 213 and CTW 214 (30.5 and 32.9 m, respec-tively, below ground surface) (fig. 10). The deeper wewas screened 19 m below the water table. Wells wercased with PVC and 1.5-m screens were installed, appropriate for sampling for nutrients, major ions, iro(Fe), and manganese (Mn) (Lapham and others, 199Additional information on ground-water quality was obtained from steel, temporary-drive-point wells located along the beach within the ground-water contributing zone (fig. 10).
Water quality was monitored in wells monthly during November 1998 to September 1999. Sampleswere collected after pumping at least three well vol-umes and after conductance stabilized. Whole-watersamples were collected first, followed by dissolved samples, which were collected using an in-line Gelmcartridge filter (0.4 µm pore size). During the March 1999 sampling, four wells (CTW 213, 214, 205 and 216) were packed off above the well screen using a Keck pump and packer to avoid contamination with atmospheric oxygen. After packing, wells were pumped from 2 to 4 L/min, and DO, pH, and conductance were monitored with a flow-through cell, until stable values were obtained.
In October 1999, the 19 temporary drive-point wells (0.76 m below lake water level) were installed ishallow water (0.3 m) and sampled once at intervalsalong most of the shore bordering the contributing arof Walden Pond (fig. 10). The samples were referencas “beach-perimeter samples.” Before sampling, thedrive-point wells were flushed for more than three casing volumes using a peristaltic tubing pump.
Limnology 19

20 Geohydrology and Limnology of Walden Pond, Concord, Massachusetts
; .
Figure 10. Specific conductance, nitrate concentrations, and estimated extent of the septic-system plume, in the area of the Walden Pond State Reservation septic leach field, Concord, Massachusetts.

-ng e ng
d
e
nd r
ch s - of
nd
Samples were collected by pumping directly to sample bottles, for whole-water samples, or through a capsule filter, for dissolved samples. In December 1998, two drive-point wells were installed in shallow water where contaminated ground water was thought to discharge to Walden Pond (fig. 10). Samples from these wells were obtained at 0.76 m intervals below the lake-water sur-face elevation continuing down to a depth of 4.6 m. These samples were referenced as “beach-depth samples.”
With the exception of samples obtained for P analysis, total and dissolved samples were preserved in the field according to methods of Fishman (1989) and shipped to the U.S. Geological Survey National Water Quality Laboratory for analysis. N, major ions, Fe, and Mn were analyzed according to U.S. Geological Survey methods (Fishman, 1989). Care was taken with P samples to minimize contamination during sampling. Procedures included use of acid-rinsed polyethylene bottles, use of plastic gloves during sampling, and transport of sample bottles in clean plastic bags. P sam-ples were preserved with ultra-pure, concentrated sul-furic acid, 20 drops acid (1 mL) dispensed from a teflon dropping bottle per 250 mL sample (Stauffer, 1983). In the laboratory, filtered and whole-water sam-ples were digested using potassium persulfate (Menzel and Corwin, 1965) and analyzed by the phosphomo-lybdate method (Strickland and Parsons, 1968, as mod-ified by Stauffer, 1983.) Digested whole-water and filtered sample results were reported as total phospho-rus and total dissolved phosphorus, respectively. With the use of the methods and procedures described above, a detection limit of 1 µg P/L was achieved. Analysis of two 25 µg P/L USGS standard-reference water samples were within 1 µg P/L of the standard value.
Geochemical Conditions in theAquifer
Determination of nutrient speciation and geochemical environment of the ground water was an investigative priority in addition to determination of nutrient content of the ground water. Speciation and geochemical conditions affect nutrient conservation during ground-water transport through the aquifer and during crossing of the sediment-water interface at discharge to the lake. In particular, the presence or absence of DO in the aquifer may determine whether
N species will be oxidized to nitrate (NO3-) or reduced
to ammonium (NH4+), or whether Fe will form the reduced, soluble ferrous ion (Fe+2). Determination of these forms for N is important because anions aremore nearly conserved in transport than are cations,and for Fe because Fe+2 precipitates in the presence of oxygen—during discharge at the sediment-water interface—and the hydrous ferric oxide formed can sorb or coprecipitate phosphate (PO4
3-) (Ryden and others, 1987).
Geochemical conditions of the aquifer were determined by collection of samples from packer-sampled wells, where changes in samples during samplicaused by contact with atmospheric oxygen would beliminated. The well sites selected for packer sampliwere chosen on the basis of proximity to areas of theaquifer that might be most subject to reduced condi-tions if those conditions did exist. DO can be removeduring ground-water flow in long, deep flow paths (DeSimone and others,1995) and in flow paths wherorganic carbon, such as might be present in septic leachate, has been discharged (Walter and others, 1996). Selected were the two deep wells, CTW 213 aCTW 214, and two wells open to the water table neathe Walden State Reservation septic leach field, CTW203 and CTW 216 (fig. 10).
The four packer-wells sampled in March 1999 were aerobic; DO concentrations ranged from 7.0 to10.7 mg/L (table 3). Redox sensitive constituents, suas N, Fe, and Mn, sampled for in these four as well ain nine other wells (table 3) also indicated that oxidizing conditions prevailed as indicated by the presenceNO3
-, rather than NH4+, and low concentrations of dis-solved Fe (below detection limit of 10 µg/L in all wells but two, with 150 and 200 µg/L). Only concentrations of dissolved Mn (4.2–1,000 µg/L) gave an indication of reducing conditions.
The results described above indicate that grouwater in the aquifer was aerobic and ground-water transport of N would be as NO3-, which moves conser-vatively, that is, without loss. Fe and P would not co-precipitate during passage through the interface, because Fe concentrations were too low to affect P. Nutrient loads from the aquifer to the lake, then can be determined by the product of dissolved-nutrient concentration and ground-water discharge.
Limnology 21

22G
eoh
ydro
log
y and
Lim
no
log
y of W
alden
Po
nd
, Co
nco
rd, M
assachu
setts
Table 3. Ground-water quality constituents that indicate geochemical conditions in the aquifer of Walden Pond, Concord and Lincoln, Massachusetts
[No., number; ˚C, degrees Celsius; µg/L, microgram per liter; µS/cm, microsiemens per centimeter; mg/L, milligram per liter; <, actual value is less than value shown; --, not measured]
Localidentifier
Station No. Date Time
Specificconduc-
tance(µS/cm at
25˚C)
FieldpH
(standardunits)
Watertemper-
ature(˚C)
Dissolvedoxygen
Calcium,dissolved
(mg/L)
Magnesium,dissolved
(mg/L)
Potassium,dissolved
(mg/L)
Sodium,dissolved
(mg/L)
Alkalinity(mg/L
as CaCO3)
Sulfate,dissolved
(mg/Las SO4)
PACKER-SAMPLED WELLS
CTW 213 4226270711959023-23-99 1225 33 6.1 9.3 8.8 2.5 0.75 1.1 2.1 6 3.0CTW 214 4226270711959033-23-99 1120 49 6.0 9.7 7.0 4.4 1.3 2.3 5.3 15 5.0CTW 203 4226220711959013-24-99 0820 124 5.9 8.7 8.9 9.8 2.0 1.1 8.6 8 11CTW 216 4226260711959013-24-99 1020 371 5.5 9.3 10.7 24 3.9 21 23 7 18
SAMPLED WITHOUT PACKER
CTW 244 4226250711959013-24-99 1138 537 5.3 -- -- 37 6.2 24 26 5 6.3CTW 205 4226270711959013-24-99 1455 132 5.8 -- -- 8.6 1.6 1.7 13 12 15CTW 205 4226270711959018-19-98 1330 436 5.4 -- -- 37 6.8 4.4 24 -- 4.3CTW 217 4226270711959043-24-99 1259 165 5.1 9.6 -- 9.8 3.1 2.2 9.0 3 1.5CTW 218 4226280711958013-24-99 1325 176 5.7 10.5 -- 13 2.2 6.9 8.7 10 7.7
LVW 30 4226160712003013-24-99 0920 124 5.8 8.8 -- 3.0 .88 .62 18 8 9.5CTW 204 4226270711957013-24-99 1400 58 6.5 9.5 -- 4.2 .88 .57 4.4 10 7.4CTW 206 4226260712004013-24-99 1430 77 6.1 -- 5.5 1.0 1.4 6.4 12 2.8LVW 33 4226130712012013-24-99 1540 60 5.9 8.5 -- 2.2 .55 .35 8.1 5 6.7

Lim
no
log
y23
Table 3. Ground-water quality constituents that indicate geochemical conditions in the aquifer of Walden Pond, Concord and Lincoln, Massachusetts—Continued
Localidentifier
Station No. Date TimeChloride,dissolved
(mg/L)
Fluoride,dissolved
(mg/L)
Silica,dissolved
(mg/Las SiO2)
Ammonia,nitrogen(mg/L as
N)
NO2 + NO3,nitrogen,dissolved
(mg/L as N)
Phos-phorus,
totaldissolved(mg/L as
P)
Iron, dissolved
(µg/L)
Iron,total
(µg/L)
Manga-nese,
dissolved(µg/L)
Manga-nese,total
(µg/L)
PACKER-SAMPLED WELLS
CTW 213 4226270711959023-23-99 1225 2.7 <0.10 9.9 0.144 0.39 -- 150 -- 158 --CTW 214 4226270711959033-23-99 1120 3.3 <.10 16 .036 .37 -- <10 -- 64 --CTW 203 4226220711959013-24-99 0820 9.8 <.10 16 .024 4.8 -- <10 -- 33 --CTW 216 4226260711959013-24-99 1020 85 <.10 31 .024 0.027 <10 3,100 629 660
SAMPLED WITHOUT PACKER
CTW 244 4226250711959013-24-99 1138 43 0.11 24 <.020 45.6 -- <10 270 1,000 1,100CTW 205 4226270711959013-24-99 1455 6.9 <.10 18 .035 5.06 -- <10 10 11 11CTW 205 4226270711959018-19-98 1330 35 <.10 19 .092 36.1 <.010 <10 -- 133 --CTW 217 4226270711959043-24-99 1259 14 <.10 16 .570 12.2 .060 200 450 829 830CTW 218 4226280711958013-24-99 1325 13 <.10 20 <.020 8.36 .022 <10 1,500 270 300
LVW 30 4226160712003013-24-99 0920 23 <.10 9.8 -- -- -- <10 -- 16 --CTW 204 4226270711957013-24-99 1400 4.3 <.10 14 .039 .32 -- <10 -- 4 --CTW 206 4226260712004013-24-99 1430 10 <.10 15 <.020 .43 -- <10 -- 6 --LVW 33 4226130712012013-24-99 1540 8.2 <.10 12 <.020 .05 -- <10 -- 10 --

ri-r
ses
n
ent
-k, .
-e i-ate
i-f r -
.
Ground-Water Point Sources
Three large point sources were present that potentially could discharge nutrients to ground water in the Walden Pond area: the Concord municipal landfill, septic leach fields associated with a former trailer park, and the septic leach field of the Reservation bathhouse and headquarters (fig. 4). Input to Walden Pond by way of ground water from the first two sources was ruled out by delineation of the ground-water contributing area (fig. 4), whereas the septic leach field of the Reservation bathhouse and headquarters was within the ground-water contributing area.
Ground-water flow direction at the septic leach field, as determined by triangulation among water table wells, varied by as much as 30 degrees during the course of a year but generally was in the direction of the plume indicated in figure 10. The presence of a ground-water plume containing N was measured in wells immediately downgradient from the Walden Pond State Reservation leach field (fig. 10 and table 4) and in the drive-point wells at the northeast shore of Walden Pond (fig. 10 and table 5). NO3
- ranged from 2.5 to 45.6 mg N/L (one outlier at 0.21 mg N/L) in the within-plume monitoring wells and from 0.9 to 6.7 mg N/L (one outlier at <0.05 mg N/L) in the northeast-shore beach samples. Repeated measurements at the monitoring well sites (table 4) indicated that conduc-tance and N concentrations fluctuated in the plume wells, likely because of changes in the ground-water flow pattern or source variability (seasonal use).
Comprehensive water analysis of selected ground-water samples (table 3) confirmed the plume presence by analogy with water-quality constituents in other sewage-related plumes. In coarse-grained, glacial drift aquifers in eastern Massachusetts, sewage plumes typically contain high levels of conductance, chloride (Cl), sodium (Na), and species of sulfur (S) and N, compared to ground water outside the plume. DO generally is present at low concentrations in the plumes and reducing conditions may develop (DeSimone and Howes, 1996; LeBlanc, 1984). Some of these characteristics of sewage plumes occur in the samples from the wells that are downgradient of the septic leach field between the leach field and Walden Pond. Calcium (Ca), magnesium (Mg), Mn, potassium (K), Na, Cl, sulfate (SO42-), and specific conductance, were higher in wells CTW 205, 216, 217, 218, and 244 downgradient of the leach field, compared to concen-trations of these constituents in the deep wells CTW 213 and CTW 214 and wells CTW 204,
CTW 206, LVW 30, and LVW 33, which were outsideof the plume (table 3). Well CTW 203 appears to be located south of the plume (fig. 10), but contained vaous constituents including N at concentrations similato that of plume water. A possible explanation is thatelevated N concentrations were reaching this well because it is adjacent to a corral containing 5–10 horduring the summer.
Nutrient load transported in the plume to WaldePond could be estimated from the product of the nutrient concentration in the leach-field feed water (table 4, septic tank) and water use at the bathhouseand Reservation headquarters, provided that no nutriloss occurred during transport. The possibility of nutrient loss is considered separately for N and P.
N loss during leachate infiltration and transportcan be determined by comparison of N concentrationwith specific conductance, which generally is conservative in waste water, in samples from the septic tanthe water-table wells, and the beach drive-point wellsN was present in the septic tank as NH4
+ and organic N and converted to NO3- during infiltration from the septic leach field to the water table (table 4). Conductance and N were an order of magnitude higher in thseptic-tank samples than in water-table wells immedately downgradient, indicating that the sewage leachwas diluted during infiltration and transport to the wells. Assuming end-member mixing of N in the plume with background ground water, the relation ofN to conductance should be linear if N is transportedconservatively and given as
, (5)
where N and C refer to nitrogen concentration and conductance, respectively, and the subscripts b, l, and s refer to concentrations in the background wells, the septic tank, and plume wells, respectively.
A plot of all the data and the theoretical end-member mixing line (fig. 11) indicates that the upgradent samples (samples out of the plume), and many othe downgradient well data, fall near the end-membemixing line, but the beach-depth samples and beachperimeter samples, with one exception, do not. The divergence of the first two data types from the end-member mixing dilution line could result from loss ofN in transport, or from a sewage N:conductance ratiothat fluctuates from the measured septic-tank valuesAssuming that the divergence represents N loss, thedegree of loss is not more than about 20 percent forthe downgradient wells (fig. 11).
Ns
Cs Nl Nb–( )Cl Cb–( )
------------------------------Cb Nl Nb–( )
Cl Cb–( )------------------------------– Nb+=
24 Geohydrology and Limnology of Walden Pond, Concord, Massachusetts

Lim
no
log
y25
Table 4. Ground-water concentrations of nutrients and specific conductance from water monitoring wells in the aquifer of Walden Pond, Concord and Lincoln, Massachusetts—Continued
Localidentifier
Station No. Dates Time
Specificconduc-
tance(µS/cm at
25˚C)
FieldpH
(standardunits)
Watertemper-
ature(˚C)
Alkalinity(mg/L as CaCO3)
Ammonianitrogen,dissolved
(mg/L as N)
Ammonia plus
organic nitrogen, dissolved
(mg/L as N)
Ammoniaplus
organicnitrogen,
total(mg/L as N)
NO2 + NO3,nitrogen,dissolved
(mg/L as N)
Phos-phorus,
total(mg/L as P)
Phos-phorus,total dis-solved
(mg/L as P)
SEPTIC TANK
5-28-99 4,040 -- -- -- 460 -- 460 0.05 60.2 --7-21-99 1248 -- 5.6 11.2 9 110 -- 100 <.05 10.5 11.49-14-99 1315 1,907 -- -- -- 150 -- 160 <.05 13.1 17.5
UPGRADIENT OR OUTSIDE OF THE SEPTIC-SYSTEM LEACH-FIELD PLUME
LVW 33 4226130712012012-18-99 1328 70 8.5 8.5 -- -- -- -- -- -- --4226130712012013-24-99 1540 60 5.9 8.5 5 <0.02 -- -- 0.05 0.048 0.0084226130712012014-26-99 1514 65 -- 8.9 -- -- -- -- -- -- --4226130712012016-04-99 1020 79 5.9 9 7 <.02 -- -- <.05 .105 .0134226130712012017-22-99 1015 62 5.9 9 6 <.02 -- -- .18 .062 .0094226130712012019-14-99 1232 63 5.9 8.8 7 <.02 -- -- <.05 -- .002
LVW 30 4226160712003017-10-98 1549 163 -- 10.4 -- -- -- -- -- -- --4226160712003018-12-98 1425 121 -- 8.9 -- -- -- -- -- -- --4226160712003019-18-98 1436 96 -- 8.9 -- -- -- -- -- -- --42261607120030110-20-98 1030 -- -- -- -- -- -- -- -- -- --42261607120030111-04-98 1420 -- -- -- -- -- <.1 -- .01 .021 .001
42261607120030111-20-98 0956 99 -- 9.1 -- -- -- -- -- -- --42261607120030112-11-98 1131 97 -- 8.6 -- -- -- -- -- -- --4226160712003011-20-99 1035 99 -- 8 -- -- -- -- -- -- --4226160712003011-20-99 1051 -- -- -- -- -- <.1 -- .02 -- --4226160712003012-18-99 1205 116 -- 8.5 -- -- -- -- -- -- --
4226160712003013-24-99 0913 124 5.8 -- 6 .03 -- -- .05 .053 .0044226160712003013-24-99 0920 124 5.8 8.8 8 -- -- -- -- -- --4226160712003013-24-99 1140 537 5.3 9.2 6 -- -- -- -- -- --4226160712003013-24-99 1459 132 5.8 9.5 14 -- -- -- -- -- --4226160712003014-26-99 1028 131 -- 9 -- -- -- -- -- -- --
4226160712003016-04-99 1215 156 -- 9.3 -- -- -- --4226160712003016-04-99 1220 156 5.8 9.3 8 <.02 -- -- <.05 .067 .0044226160712003017-22-99 0935 114 5.8 9.3 7 <.02 -- -- <.05 .018 .0044226160712003019-14-99 1052 105 5.8 9.1 17 <.02 -- -- <.05 -- .003
Table 4. Ground-water concentrations of nutrients and specific conductance from water monitoring wells in the aquifer of Walden Pond, Concord and Lincoln, Massachusetts
[E, estimated; No., number; ˚C, degrees Celsius; µS/cm, microsiemens per centimeter; mg/L, milligram per liter; <, actual value is less than value shown; --, not measured]

26G
eoh
ydro
log
y and
Lim
no
log
y of W
alden
Po
nd
, Co
nco
rd, M
assachu
setts
UPGRADIENT OR OUTSIDE OF THE SEPTIC-SYSTEM LEACH-FIELD PLUME— Continued
CTW 227 4226240712011011-27-99 1600 -- -- -- -- -- <0.1 -- 0.01 -- --4226240712011019-14-99 1015 77 6 -- 11 <0.02 -- -- <.05 -- <0.001
CTW 204 42262707119570111-04-98 1230 -- -- -- -- -- <.1 -- .13 0.022 .0224226270711957011-27-99 1110 -- -- -- -- -- <.1 -- .18 -- .0254226270711957013-24-99 1400 58 6.5 9.5 10 .04 -- -- .32 .027 .0254226270711957016-04-99 1105 70 6.1 10.1 11 <.02 -- -- .27 .027 .0274226270711957017-21-99 1455 58 6 10 10 <.02 -- -- .36 .027 .0254226270711957019-13-99 1445 57 6.1 9.8 8 <.02 -- -- .31 -- --
CTW 206 42262607120040111-04-98 1545 -- -- -- -- -- <.1 -- .32 .027 .0054226260712004011-27-99 1200 -- -- -- -- -- <.1 -- .29 -- .0164226260712004013-24-99 1430 77 6.1 -- 12 <.02 -- -- .43 .045 .0194226260712004016-04-99 1325 75 6.5 11.7 8 <.02 -- -- .26 .028 .0184226260712004017-22-99 0904 66 6.2 11.5 14 <.02 -- -- .27 -- --4226260712004019-13-99 1510 99 6 11.5 13 <.02 -- -- .16 -- .004
CTW 207 42262807120080111-04-98 1440 -- -- -- -- <.1 -- .02 .055 .006
CTW 213 4226270711959023-23-99 1225 33 6.1 9.3 6 .14 -- -- .39 .053 .0134226270711959025-28-99 0946 46 5.8 10.1 8 .11 -- -- .47 .038 .0114226270711959027-21-99 1320 51 6.2 10.1 10 .09 -- -- .41 -- .0324226270711959029-13-99 1415 54 6.2 9.8 10 .02 -- -- .50 .021 .004
CTW 214 4226270711959031-27-99 1530 -- -- -- -- -- <.1 -- .32 -- --4226270711959033-23-99 1120 49 6 9.7 15 .04 -- -- .37 .021 .0164226270711959036-04-99 1015 -- -- -- -- <.02 -- -- .36 .016 .0154226270711959037-21-99 1220 65 6.8 9.8 17 <.02 -- -- .39 -- .0324226270711959039-13-99 1130 65 6.7 10 16 .02 -- -- .47 .121 .003
CTW 203 42262207119590110-20-98 1125 -- -- -- -- -- -- -- -- -- --42262207119590111-04-98 1340 -- -- -- -- -- <.1 -- 3.14 .024 .02142262207119590112-11-98 1209 170 -- 9 -- -- -- -- -- -- --4226220711959012-18-99 1230 153 -- 9.1 -- -- -- -- -- -- --4226220711959013-24-99 0820 124 5.9 8.7 8 .02 -- -- 4.80 .030 .027
Table 4. Ground-water concentrations of nutrients and specific conductance from water monitoring wells in the aquifer of Walden Pond, Concord and Lincoln, Massachusetts—Continued
Localidentifier
Station No. Dates Time
Specificconduc-
tance(µS/cm at
25˚C)
FieldpH
(standardunits)
Watertemper-
ature(˚C)
Alkalinity(mg/L as CaCO3)
Ammonianitrogen,dissolved
(mg/L as N)
Ammonia plus
organic nitrogen, dissolved
(mg/L as N)
Ammoniaplus
organicnitrogen,
total(mg/L as N)
NO2 + NO3,nitrogen,dissolved
(mg/L as N)
Phos-phorus,
total(mg/L as P)
Phos-phorus,total dis-solved
(mg/L as P)

Lim
no
log
y27
UPGRADIENT OR OUTSIDE OF THE SEPTIC-SYSTEM LEACH-FIELD PLUME— Continued
CTW 203 4226220711959014-26-99 1102 108 -- 9.6 -- -- -- -- -- -- --4226220711959016-04-99 1235 140 5.9 9.5 12 <0.02 -- -- 3.89 0.227 0.0274226220711959017-21-99 1520 127 5.8 9.7 14 .03 -- -- 4.66 -- .0394226220711959019-14-99 1115 131 5.8 9.6 13 <.02 -- -- 4.88 -- .024
.013
DOWNGRADIENT FROM SEPTIC-SYSTEM LEACH-FIELD, WITHIN THE PLUME
CTW 244 4226250711959011-20-99 1343 -- -- -- --- <0.1 -- 25.6 -- --4226250711959013-24-99 1138 537 5.3 -- 5 <0.02 -- -- 45.6 0.019 0.0154226250711959016-04-99 0845 469 5.4 9.5 6 <.02 -- -- 13.5 .034 .0284226250711959017-21-99 1046 457 5.2 15.1 6 .25 -- -- 30.4 -- .0554226250711959019-13-99 1000 438 5.2 9.5 4 .42 -- -- 24.8 .017 .004
CTW 216 4226260711959011-20-99 1428 -- -- -- -- -- <.1 -- 30.4 -- --4226260711959013-24-99 1020 371 5.5 9.3 7 .02 -- -- -- .225 .0274226260711959016-04-99 0910 475 5.3 9.8 8 <.02 -- -- 26.3 .044 .0304226260711959017-21-99 1235 570 5.2 10.1 5 <.02 -- -- 38.5 .032 .0524226260711959019-13-99 1025 644 5.1 10.2 5 .12 -- -- 37.8 .015 .008
CTW 205 4226270711959018-19-98 1330 394 5.4 -- -- .09 -- -- 36.1 -- <.0142262707119590111-05-98 1045 -- -- -- -- -- .2 -- -- .013 .0164226270711959012-02-99 1055 124 5.8 9.1 -- -- <.1 -- 5.25 -- --4226270711959013-24-99 1455 132 5.8 -- 12 .04 -- -- 5.06 .026 .0254226270711959016-04-99 0945 260 5.7 11 11 <.02 -- -- 12.9 .020 --4226270711959017-21-99 1425 208 5.7 11.5 11 <.02 -- -- 11.9 -- .0474226270711959019-13-99 1150 162 5.8 11.3 12 <.02 -- -- 6.44 -- --
CTW 217 4226270711959041-20-99 1524 -- -- -- -- -- .1 -- .21 -- --4226270711959043-24-99 1259 165 5.1 9.6 3 .57 -- -- 12.2 .071 .0604226270711959045-28-99 0820 173 5.3 10.3 9 .27 -- -- 12.1 .314 .0624226270711959049-13-99 1212 162 5.5 10.8 10 .06 -- -- 8.68 -- .055
CTW 218 4226280711958011-21-99 1033 -- -- -- -- -- <.1 -- 2.56 -- --4226280711958013-24-99 1325 176 5.7 10.5 10 <.02 -- -- 8.36 .046 .0224226280711958016-04-99 1040 174 5.6 10.7 10 <.02 -- -- 8.72 .032 .0264226280711958017-21-99 1405 158 5.6 10.9 10 <.02 -- -- 8.95 -- .0444226280711958019-13-99 1330 226 5.5 10.6 7 .03 -- -- 13.6 .032 .007
Table 4. Ground-water concentrations of nutrients and specific conductance from water monitoring wells in the aquifer of Walden Pond, Concord and Lincoln, Massachusetts—Continued
Localidentifier
Station No. Dates Time
Specificconduc-
tance(µS/cm at
25˚C)
FieldpH
(standardunits)
Watertemper-
ature(˚C)
Alkalinity(mg/L as CaCO3)
Ammonianitrogen,dissolved
(mg/L as N)
Ammonia plus
organic nitrogen, dissolved
(mg/L as N)
Ammoniaplus
organicnitrogen,
total(mg/L as N)
NO2 + NO3,nitrogen,dissolved
(mg/L as N)
Phos-phorus,
total(mg/L as P)
Phos-phorus,total dis-solved
(mg/L as P)

28 Geohydrology and Limnology of Walden Pond, Concord, Massachusetts
0
5
10
15
20
25
30
35
40
45
50
0 100 200 300 400 500 600 700
NIT
RAT
E, I
N M
ILLI
GR
AM
S P
ER
LIT
ER
, AS
N
SPECIFIC CONDUCTANCE, IN MICROSIEMENSPER CENTIMETER AT 25 DEGREES CELSIUS
BEACH-DEPTHDRIVE POINT
BEACH-PERIMETERDRIVE POINT
AWAY FROM PLUME MONITORING WELLS
WITHIN PLUMEMONITORING WELLS
NO
LO
SS20
-PERCENT
LOSS
EXPLANATION
Figure 11. Relation between conductance and nitrate concentration in samples from ground-water wells away from the plume and within the plume from the Walden Reservation septic leach field, and samples from drive-point wells along the beach of Walden Pond, Concord, Massachusetts. [The solid lines show end-member mixing between water from the septic tank and background water for no-loss and 20-percent loss of nitrogen.]
Table 5. Ground-water concentrations of nutrients and specific conductance in the beach-depth temporary drive-point wells, Walden Pond, Concord, Massachusetts
[No., number; ˚C, degrees Celsius; m, meter; µS/cm, microsiemens per centimeter; mg/L, milligram per liter;--, no data]
Figure 10identifier
Station No. Date TimeDepth below
surface(m)
Specificconductance
(µS/cmat 25˚C)
NitrogenNO2 + NO3, dissolved
(mg/L as N)
Phosphorus,total dissolved
(mg/L as P)
Beach depth 1 422624071200601 12-04-98 1515 0.76 227 6.39 0.002422624071200601 12-04-98 1445 1.52 237 2.81 --422624071200601 12-04-98 1420 2.29 174 1.20 --422624071200601 12-04-98 1400 3.05 164 1.68 --422624071200601 12-04-98 1326 3.81 157 5.21 .007422624071200601 12-04-98 1230 4.57 155 .90 --
Beach depth 2 422623071200501 12-07-98 1105 .76 190 4.02 .001422623071200501 12-07-98 1135 1.52 190 3.96 .002422623071200501 12-07-98 1205 2.29 181 4.54 .007422623071200501 12-07-98 1245 3.05 187 6.24 .010422623071200501 12-07-98 1320 3.81 160 3.42 .008422623071200501 12-07-98 1400 4.57 145 2.66 .010

ed h t e ds. e on-lls
th
n
th cy of rt
n on- e
on e-
s-s
pic
Sorption of the NH4+ onto negatively charged solids in the aquifer can cause losses from the septic-tank N. Investigation of this process at septage-system infiltration beds in Orleans, Mass. (DeSimone and Howes, 1998), indicated that 80 percent of the N dis-charged to the beds arrived at the water table. The NH4
+ that is not lost through sorption, but rather con-verted to NO3- during passage through the unsaturated zone, likely will continue in transport through the satu-rated zone. NO3- in aerobic ground water is not readily converted to other forms, nor are anions such as NO3
- retarded in flow by interaction with the aquifer solid phase (Desimone and Howes, 1996; DeSimone and Howes, 1998).
Deviation from end-member mixing occurs for the beach-perimeter samples where the relation between conductance and NO3
- appears to breakdown. Results from the beach-perimeter sampling indicated that high N values were restricted to the northeast corner of the lake (fig. 10). Beach-depth sampling in the northeast location indicated the high N values extended some distance (up to about 4.5 m) below the surface (table 5). Although the nitrogen values indi-cated the discharge of plume water, the conductance:N values from the beach-depth and perimeter sampling generally were greater than those associated with dilu-tion of plume water (fig. 11). The wide distribution of high conductance in the beach sampling may result from highway salt applied to State Route 126 (fig. 10), which likely moves downgradient toward the lake. Only in the western-most sample on the south side of the lake does specific conductance approach values (less than 80 µS) from wells upgradient of the highway outside of the plume. The specific conductance at this site likely results from ground-water flow on a path from Emersons Cliff (fig. 4), which would not be affected by highway runoff. Consideration of highway salt explains how high conductance could be present on the shore without high NO3- concentrations.
Assuming 20-percent loss of N after discharge from the septic tank, concentration for the load compu-tation is 0.8 times the average of the three septic-tank nitrogen measurements (table 4). Water use at the bathhouse and Reservation headquarters averaged 1,350 m3/yr from 1996 to 1998. The product of the N concentration and water use delivered to Walden Pond in the plume is 260 kg N/yr (table 6).
In contrast to N, loss rates for P that occurred between the septic tank and ground water approach100 percent. Whole-water P concentrations were higin the leach-field feed water (10 to 60 mg/L, n=3), buP apparently adhered to aquifer solids during passagthrough 12 m of unsaturated sands underlying the beWhereas N concentration was about 10 times less inthe plume water adjacent to the leach field than in thseptic tank, P was 1,000 times less. Background P ccentrations tended to be greater from samples at webetween Goose Pond and Walden Pond (CTW 204, CTW 206, and CTW 203) than at those north and souof Walden Pond (LVW 30, LVW 33 and CTW 227). P concentrations in the plume wells were approxi-mately the same as the background concentrations iwells between Goose Pond and Walden Pond. P in water from the beach samples was not correlated wiN in those samples (table 5); there was not a tendentowards high P concentration in the northeast cornerthe lake where high N was detected. Thus, P transpoin the plume above that of background transport did not appear to be significant and was not estimated separately.
Seventeen residential point sources (houses oseptic systems) are in the Walden Pond contributingarea (buildings are shown in fig. 4). N inputs from allbut two of these would enter Goose Pond first and ctribute to Walden Pond input only as mediated by theoutput from Goose Pond. Nitrogen output from GoosPond (and lakes in general) would be expected to besubstantially less than inputs because of denitrificatiin lake sediments (Dillon and others, 1990). The movment of P from the residences to Walden Pond is unlikely because of the low sewage loading of dometic septic systems and because of the long flow pathinvolved from the septic systems to the lake.
Ground-Water Background Source
Nutrient loads from background ground water were determined by the product of an averagebackground concentration and ground-water discharge. The ground-water discharge value used (366,000 m3/yr), determined in the “Hydrology” sec-tion, was an average of the watershed-area and isotomethod results.
Limnology 29

30G
eoh
ydro
log
y and
Lim
no
log
y of W
alden
Po
nd
, Co
nco
rd, M
assachu
setts
Table 6. Annual and summer nutrient budgets for Walden Pond, Massachusetts, based on 1995–99 average ground-water and precipitation inflows and 1998–99 average nutrient concentration data
[N, nitrogen; P, phosphorus; kg/3 mo, kilogram for 3 months; kg/yr, kilogram per year; mg/L, milligram per year; --, not measured]
Source
Annual Summer
P concen-tration(mg/L)
P load (kg/yr)
Percentof total
load
N concen-tration (mg/L)
N load (kg/yr)
Percentof total
load
N:P ratio (atomic)
P load(kg/3 mo)
Percentof total
summerload
N load(kg/3 mo)
Percentof total
summerload
N:P ratio (atomic)
Background ground water...... 0.015 5.5 17 0.18 66 7.7 27 1.4 9 16 4 27Plume ground water ............... -- -- -- -- 260 30 -- -- -- 65 15 --Atmospheric wet .................... .0027 .8 3 .50 152 18 412 .2 1 38 9 412Atmospheric dry..................... -- 15 47 -- 75 8.7 11 3.8 23 19 4 11
Swimmers............................... -- 8.7 27 -- 290 34 74 8.7 54 290 67 74Waterfowl ............................... -- .6 2 -- 4 .5 15 .6 4 1 0 4Fish stocking .......................... -- .7 2 -- 6 .7 19 .7 4 2 0 5Direct runnoff......................... -- .8 2 -- 6 .7 16 .8 5 1 0 4
Total..................................... -- 32 100 -- 858 100 59 16 100 432 100 59
Total without plume............. -- 32 -- -- 598 -- 41 16 -- 367 -- 50
Total without swimmers ...... -- 23 -- -- 568 -- 54 7.4 -- 142 -- 43

as
-n l-
). nd o he ich
e--
h-
the et-tic as
in
-
was
n d n.
s -ts
e .
NO3--N background concentrations were mea-
sured in 39 samples from 9 wells located upgradient or outside of the septic-system leach-field plume (table 4). Concentrations in samples from CTW213 and 214 (deep wells) and CTW 204, CTW 206, and CTW 207 were consistently higher (average 0.32 mg/L) than in the other three wells (average 0.05 mg/L). Values of <0.05 mg/L listed for some of the samples (table 4) resulted from a high-detection limit method, and these values were not included in the average. CTW 203 was not used in averages because of anomalously high con-centrations as already discussed. The wells with higher concentrations of N were in the zone between Goose Pond and Walden Pond, whereas the wells with lower concentrations of N were in flow paths originating from local highs in the ground water north or south of Walden Pond (table 4 and fig. 4). The reason for the difference in concentrations is unknown. An intermedi-ate background concentration was computed as the grand mean (0.18 mg/L) of the means of the high and low concentration wells. A background N of 66 kg N/yr load was estimated by taking the product of average concentration and ground-water discharged to the lake .
Because P concentration was not significantly different in samples from the septic plume wells com-pared to samples from wells upgradient or outside of the plume, all well data were used to compute aver-age P concentration in the ground water. The average was computed by analogy with N as the grand mean (0.015 mg/L) of the mean from wells between Goose Pond and Walden Pond (0.024 mg/L) and the mean of wells north and south of Walden Pond (0.005 mg/L). Dissolved P data, rather than whole-water P data were used in the analysis, because substantial amounts of P could be leached off large particles (sand) in the whole-water samples by the acid preservation method used. The particles were assumed not to transport in the aqui-fer. The P contribution to Walden Pond from ground-water inflow was determined to be 5.5 kg/yr, the prod-uct of the average dissolved concentration and the volume of ground water discharged to the lake.
Atmospheric Deposition Source
Atmospheric sources, especially dryfall, often are ignored in lake nutrient budgets or estimated with-out local data because of technical or logistical difficul-ties associated with the collection or interpretation of the data. In this investigation, local atmospheric depo-sition measurements were included. Dryfall of P was
shown to be substantial in this investigation as also hbeen shown for a small lake investigated in New Hampshire (Cole and others, 1990).
Atmospheric inputs for both N and P were measured separately for wet deposition and dry depositioinputs using an Aerochem atmospheric deposition colector at the station northeast of Walden Pond (fig. 4The collector was in an open area on a platform withthe collection height positioned 3.4 m above the grouwith approximately 50-degree angle from horizontal tthe 17.5-m-tall tree canopy located 11.9 m distant. Tsampler consisted of two buckets and one cover, whmoved automatically to cover the dry or wet bucket according to signals from a precipitation sensor.
Dryfall was collected in a precleaned, acid anddeionized water rinsed plastic bucket (28.3 cm diamter) filled to a depth of approximately 5 cm with deionized water. The water was used as the collection surface to mimic the surface of the lake (Cole and oters, 1990). After the deployment period, usually two weeks, the bucket was covered and brought back to laboratory. The water amount was measured gravimrically, insects were screened out (2 mm screen plassieve), and N and P concentrations were measured,described previously in “Sampling and Analytical Methods for Ground Water.” Based on concentration the water and water volume, a weight of nutrient col-lected was computed. Time-weighted average collection during 16 collection periods, July 1998 through June 1999, adjusted to annual amount per lake area 75 kg/yr for N and 15 kg/yr for P. On a percentage-input basis, the dryfall P load was large (table 6). Givethe time dependency of dryfall deposition (fig. 12) anvisual observations of pollen in the collection bucket,the dryfall P input appeared to be dominated by polle
Wetfall samples were collected in an analogouprocessing, except that the buckets were put out dryand the water analyzed came from precipitation. Precipitation samples were not screened because insecgenerally were not present in the collected water. Annual wetfall loads were determined by adjusting the volume-weighted-average concentration from 19water-collection intervals from July 1998 through Jun1999 by annual rainfall and the area of Walden PondVolume-weighted concentrations were 500 µg/L of N and 2.7 µg/L of P. Loads were 152 kg/yr of N and 0.8 kg/yr of P.
Limnology 31

se
m-f N
rd
m f e
for
nt n- in
f
a, nt
t
o-nd
, d
Swimmer Source
Walden Pond receives about 500,000 visitors per year, concentrated during the summer months. The per-centage of visitors who swim also increases on the hot-test days during the summer. Swimmers have been found to be a large source of nutrients in other lakes (Schultz, 1981). Urine is the source of nutrients from swimmers (Caraco and others, 1992). Human output of nutrients in urine is well known and averages 27 g N/d (computations from Guyton, 1971) and 0.81 g P/d (Caraco and others, 1992). Assuming 270,000 visitors during June, July and August (as in 1996), that 80 per-cent are swimmers, and that 50 percent of the swim-mers urinate in the lake in the amount of 10 percent of their daily urine output, then the swimmer input of N and P to Walden Pond would amount to 290 kg/yr of N and 8.7 kg/yr of P.
Other Nutrient Sources
Previous avian input estimates, which were substantial when the nearby Concord Landfill was active, were 33 kg N/yr and 4.8 kg P/yr (Baystate Environmental, Inc., 1995). The previous estimate was weighted heavily towards winter gull presence (88
percent input) and away from summer ducks and gee(12 percent input). Gulls mainly were associated withthe active landfill. Retaining the ducks and geese coponent, the estimates used in this study are 4 kg/yr oand 0.6 kg/yr of P, which better reflect the current absence of gulls because of the closing of the Concolandfill. Nutrient input from stocking of trout was determined from a previous study to be 6.0 kg/yr of N and 0.7 kg/yr of P (Baystate Environmental, Inc., 1995). Previous estimates of annual nutrient loads frodirect road runoff were 5.8 kg/yr of N and 0.8 kg/yr oP (Baystate Environmental, Inc., 1995). These may blower-bound estimates because they did not accountthe amount of impervious surface in the Reservationparking lots.
Nutrient Limitation, Ratios, Source Size, Timing, and Disposal Strategies
Often in aquatic ecosystems, all algal nutrientsare in excess supply for algal growth except one, termed the (growth) limiting nutrient (Rutner, 1973). The average ratio in which algae require N and P, established by Redfield and others (1963), is 16:1 onan atom-to-atom basis. The N to P ratios in Walden Pond nutrient inputs (59 overall, see table 6) indicatethat N is in excess and P would be the limiting nutrieprovided that the nutrients were not subject to differetial loss in the lake. N to P ratios are greater than 16precipitation, estimated swimmer input, and in the septic leach-field plume water (table 6). Without the septic leach-field plume, which contains 30 percent othe total N input, the N to P ratio would decrease to 41—still well above the Redfield ratio.
Nutrient sources in which N is substantially in excess may mitigate against blooms of cyanobacteriwhich have the capability to satisfy their N requiremeby using (fixing) N from the atmosphere. A selective advantage of cyanobacteria over algae, which cannofix atmospheric N, may be removed when N is in excess supply (Levine and Schindler, 1999). As cyanbacteria blooms often form nuisance surface scums aeven may develop toxins, a high N to P ratio, and sources that contribute to it, such as the leach-field plume, may be desirable.
Control over the amount of algal biomass pro-duced is exerted by the input load of the limiting nutrient (P). The “percent of total load” column for the limiting nutrient P (table 6) indicates that the biggest sources are atmospheric dryfall (47 percent)swimmers (estimated at 27 percent), and backgroun
J J A S O N D J F M A M J J A
60
50
40
60
20
10
RAT
E O
F P
HO
SP
HO
RU
S D
RY-
DE
PO
SIT
ION
, T
O W
ALD
EN
PO
ND
, IN
KIL
OG
RA
MS
PE
R Y
EA
R
1998 1999
DATE
Figure 12. Dryfall deposition of phosphorus from June 1, 1998, to September 1, 1999, collected on a water surface in a collector near Walden Pond, Concord, Massachusetts. [Width of bar indicates interval of sample composite.]
32 Geohydrology and Limnology of Walden Pond, Concord, Massachusetts

ets g
le
us
e ds ut-m
s
pri-. re
lt
so is
er-ing re-n, he
ground water (17 percent). Of the large sources, the estimated swimmer source is perhaps the most subject to regulation.
The swimmer source greatly affects the summer nutrient budget. If the nutrient budget is recomputed for the 3-month summer period and ground-water and atmospheric-deposition sources are added in at one quarter of their annual value, estimated swimmer input becomes over 50 percent of the total summer P budget (table 6).
From perspectives of the amount and type of algal growth, an advantage was realized by routing waste from the State Reservation bathhouse located on the shore of Walden Pond to the thick (14 m) unsatur-ated zone underlying the leach field (figs. 4 and 10). P partitions away from the mobile water phase and absorbs to grain surfaces in the unsaturated zone. This results in an increase in the N to P ratio of ground-water nutrient inputs without (currently) increased P load. Prospects for long-term (greater than 100 years) sequestration of P in the unsaturated zone are less cer-tain. P is not transported in the unsaturated zone only because it moves from water to solids in the aquifer; P does not degrade or volatilize. Depending on the nature of the aquifer solid phase and quality and quantity of disposed waste, P can be transported eventually with the water phase, as it has been in a sewage plume in glacial outwash materials that are upgradient to Ashumet Pond on Cape Cod (Walter and others, 1996). The unsaturated zone was thinner at the Cape Cod sewage disposal site (6 to 11 m) than at the Walden State Reservation site (14 m). Also, the Cape Cod site handled a much greater waste load (varying from 140,000 to 2,200,000 m3/yr from 1936 through 1995) than the waste load handled by the leach field at Walden Pond (1,350 m3/yr). Both of these conditions would likely cause increased subsurface transport at the Cape Cod site compared to the Walden site. Another strategy for waste disposal without affecting the lake would be to locate disposal facilities downgra-dient from Walden Pond (at the west end or to the north), that is, outside the ground-water contributing area (fig. 4).
Nutrient Loading Trophic Index
Nutrient transport and ways of decreasing nutrient inputs were presented in the previous section without determination of whether decreases for
Walden Pond were necessary. To assess the relativeeffect of decreasing inputs on the lake, nutrient budgexpressed on an areal basis can be compared amonlakes, using comparison relations established by Vollenweider (1975). Walden Pond, at 0.13 g P/m2/yr, is approaching a eutrophic state between “permissiband critical P loads,” 0.084 and 0.17 g P/m2/yr, respec-tively, which apply for a lake with mean depth of 12.9 m and hydraulic residence time of 5 yr Vollenweider (1975). By comparison, more eutrophicAshumet Pond on Cape Cod, mentioned in the previosection, is estimated to receive between 0.24 to 0.29 g P/m2/yr (Jacobs Engineering Group, 2000). ThVollenweider loading concept usually is based on loato drainage lakes, such as from sewage-treatment ofalls and riverine inputs. Correspondence to loads frothe important nutrient sources for Walden Pond, ground water, dry deposition and, possibly, swimmeris unknown.
Although the nutrient budget comparison indi-cated that Walden Pond was in a mesotrophic state when compared with other lakes, it does not indicatewhether Walden Pond has changed or is at an approate state for an ecologically “healthy” kettle-hole lakeUsefulness of the nutrient budget assessment also islimited because two sources (swimmers and runoff) auncertain and the large dry-deposition term is difficuto extrapolate from the collector location to lake. In-lake response to nutrients in terms of plant growth almust be considered to determine if a kettle-hole lakein a desirable trophic state.
Plant Growth and Internal Cycling of Chemical Constituents
Nutrient budgets are important to trophic ecol-ogy because they control plant growth; however, unctainties regarding budget terms and nutrient processin a given lake system make desirable actual measuments of the growth response of plants. In this sectioplant growth in Walden Pond is examined as well as tchemical constituents in water that affect and are affected by plant growth.
Limnology 33

s n
, d
o nd r-, r
e
s
w ti-
m
es d, t
k
e -
d
Methods of Sampling and Analysis of the Water Column
Secchi-disk depth and in-lake depth-profile data for pH, DO, conductance, and temperature were col-lected every 2 weeks during temperature stratification and occasionally during winter from March 1997 to July 1999 at the deep-hole station in the western basin of the Walden Pond (fig. 4). These properties and con-stituents also were measured monthly at the east basin station (fig. 4) during 1997 and 1998. Water samples were collected at 1-m intervals by peristaltic pump and tubing at the deep-hole station for nutrient and chloro-phyll-a analysis on a monthly basis. Samples were taken for complete ion analysis, on September 10, 1997, and to measure levels of dissolved Fe and Mn, on August 19 and September 10, 1997.
During 1998, samples of benthic algae (primarily the macroalga Nitella) were collected along eight transects perpendicular to the shoreline from depths shallower to depths deeper than that of Nitella growth. Samples were collected at the transects by divers during May and again, by Ekman dredge (225 cm2), during October. The diving procedure involved pushing plastic buckets, from which the bottoms had been cut away, into the sediment substrate and scooping the plants from the ring interior (surface area 531 cm2). Comparisons between diver and dredge sampling indi-cated similar results were obtained by both methods. At the surface, plants were rinsed in lake water to remove attached sediment, blotted dry with paper tissue, wrapped in tared aluminum foil, and stored on ice in a cooler.
Methods of water analysis used were as described for ground-water analysis except for the field parameters of pH, DO, and conductance, which were measured in situ using a Hydrolab with a 30 m cable. The Hydrolab was calibrated using standard solutions for pH and conductance, and by air calibration for oxy-gen, at the beginning of each data-collection day. The Hydrolab thermistor probe was checked once per year by comparison with a National Institute of Standards and Technology traceable thermometer and determined to be accurate to within the precision of the thermome-ter (0.01˚C).
Chlorophyll-a samples were filtered through a glass-fiber filter, dried (Godfrey and Kerr, 2000), and analyzed by spectrometric methods (APHA, 1995).
Nitella biomass was determined by weighing samplefrom a known area of sediment surface that had beeoven-dried (100˚C) to a constant weight.
Temperature Stratification
Distribution of constituents within Walden Pondsuch as nutrients, DO, and even biomass is controllein part by annual thermal stratification of the lake (fig. 13). Warm water is less dense than cold water sthat the sharp temperature gradient that forms at arou6 m every summer (the thermocline) is a barrier to vetical mixing of the water. The short fetch and forestedsteep banks of Walden Pond further restrict the watemixing action of wind. In small New England lakes, vertical mixing in the zone above the thermocline (thepilimnion) continues during the stratified period, butvertical mixing in and below the thermocline is restricted. In the zone of steep temperature gradient(the metalimnion) vertical mixing probably approachethat of molecular diffusion, although in the zone belothe temperature-gradient zone (the hypolimnion) vercal mixing may be up to two orders of magnitude greater than molecular diffusion (Quay and others, 1980; Benoit and Hemond, 1996).
Phytoplankton, Nitella, and Light
Phytoplankton amounts can be determined froprofiles of chlorophyll a (fig. 14). The conversion factor between chlorophyll a and plant biomass varies according to species and nutritional status but averagabout 30, on a chlorophyll-to-carbon basis (Stricklan1960), or 67, on the basis of chlorophyll to dry-weighorganic matter (APHA, 1995).
The epilimnetic chlorophyll-a average, often used to assess trophic state, was 1.2 and 1.6 µg/L in 1997 and 1998, respectively. The chlorophyll-a profiles are somewhat variable (fig. 14), indicating changing phytoplankton bloom conditions. A metalimnetic peaconcentration at about 10 m occurred during most ofthe sampling dates in the stratified period. In 1998, when profiles are available for spring and summer, there was a tendency for low chlorophyll-a concentra-tions in the epilimnion (0 to 6 m) in the spring, whichincreased by the last sampling in June. Using averagvalues for 1997 and 1998 for epilimnetic and metalimnetic chlorophyll of 1.4 and 2.4 µg/L, respectively, and volumes from table 7, the average summer standingcrop of phytoplankton, is 103 kg in the epilimnion an182 kg in the metalimnion, dry-weight basis.
34 Geohydrology and Limnology of Walden Pond, Concord, Massachusetts
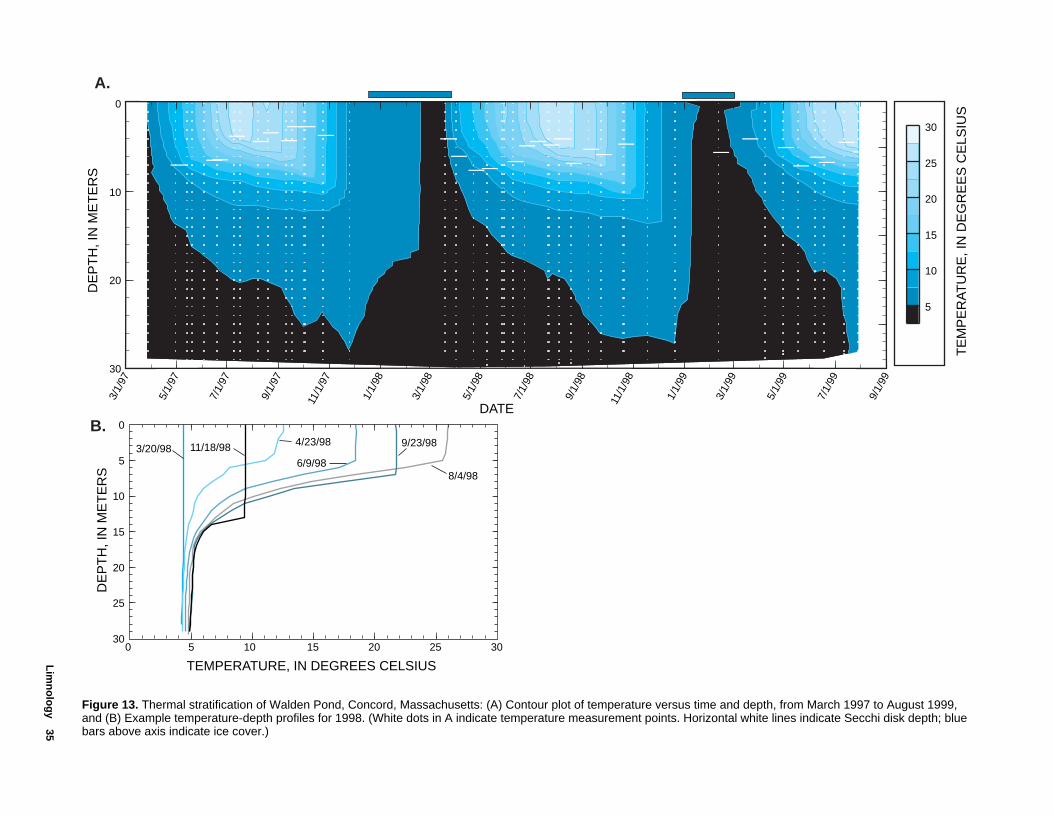
Lim
no
log
y35
30
25
20
15
10
5
0
0 5 10 15 20 25 30
DE
PT
H, I
N M
ET
ER
S
TEMPERATURE, IN DEGREES CELSIUS
3/20/984/23/98 9/23/98
8/4/986/9/98
11/18/98
B.
5
10
15
20
25
30
TE
MP
ER
AT
UR
E, I
N D
EG
RE
ES
CE
LSIU
S
30
20
10
03/
1/97
5/1/
97
7/1/
97
9/1/
97
11/1
/97
1/1/
98
3/1/
98
5/1/
98
7/1/
98
9/1/
98
11/1
/98
1/1/
99
3/1/
99
5/1/
99
7/1/
99
9/1/
99
DE
PT
H, I
N M
ET
ER
S
DATE
A.
Figure 13. Thermal stratification of Walden Pond, Concord, Massachusetts: (A) Contour plot of temperature versus time and depth, from March 1997 to August 1999, and (B) Example temperature-depth profiles for 1998. (White dots in A indicate temperature measurement points. Horizontal white lines indicate Secchi disk depth; blue bars above axis indicate ice cover.)
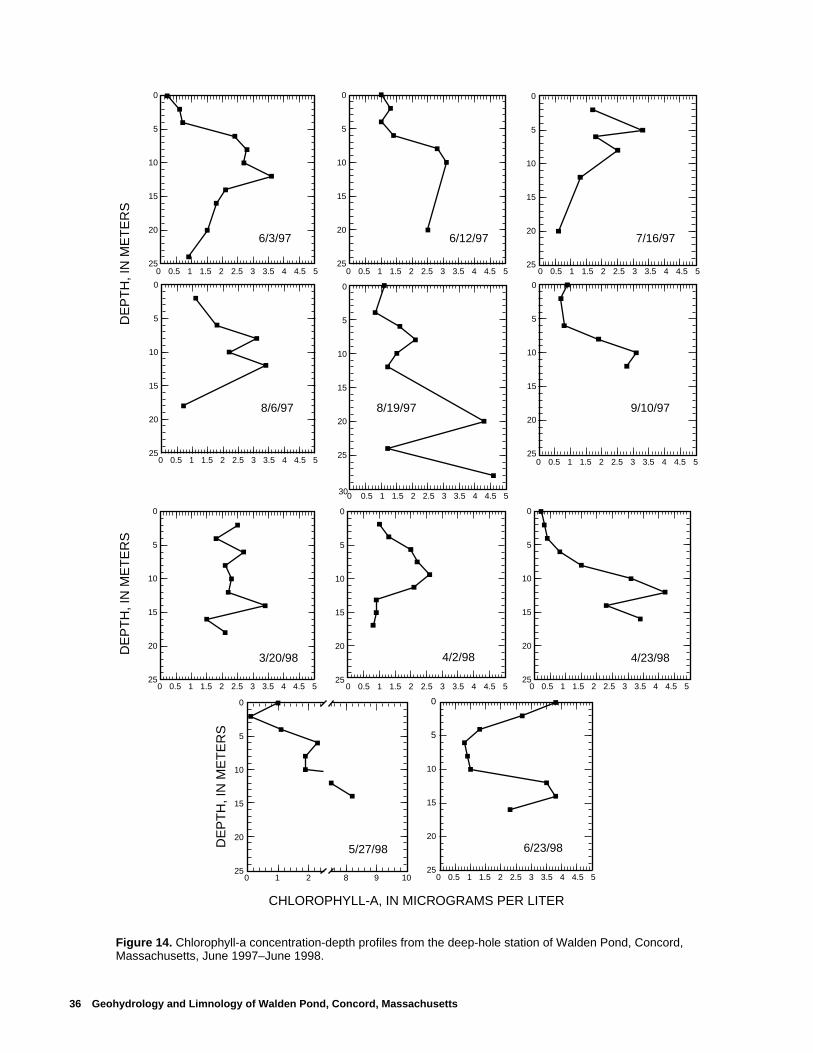
36 Geohydrology and Limnology of Walden Pond, Concord, Massachusetts
5
0
10
15
20
25
5
0
10
15
20
25
5
0
10
15
20
25
5
0
10
15
20
25
10
15
20
25
3/20/98 4/23/98
0 0.5 1 1.5 2 2.5 3 3.5 4 4.5 5
0 1 2 8 9 10
CHLOROPHYLL-A, IN MICROGRAMS PER LITER
5/27/98 6/23/98
4/2/98
0 0.5 1 1.5 2 2.5 3 3.5 4 4.5 5
5
0
0 0.5 1 1.5 2 2.5 3 3.5 4 4.5 5
0 0.5 1 1.5 2 2.5 3 3.5 4 4.5 5
5
0
10
15
20
25
5
0
10
15
20
25
5
0
10
15
20
25
5
0
10
15
20
25
5
0
10
15
20
25
5
0
10
15
20
25
30
0 0.5 1 1.5 2 2.5 3 3.5 4 4.5 5
0 0.5 1 1.5 2 2.5 3 3.5 4 4.5 5
0 0.5 1 1.5 2 2.5 3 3.5 4 4.5 5
0 0.5 1 1.5 2 2.5 3 3.5 4 4.5 5 0 0.5 1 1.5 2 2.5 3 3.5 4 4.5 50 0.5 1 1.5 2 2.5 3 3.5 4 4.5 5
6/3/97
8/6/97 8/19/97
6/12/97
9/10/97
7/16/97
DE
PT
H, I
N M
ET
ER
SD
EP
TH
, IN
ME
TE
RS
DE
PT
H, I
N M
ET
ER
S
Figure 14. Chlorophyll-a concentration-depth profiles from the deep-hole station of Walden Pond, Concord, Massachusetts, June 1997–June 1998.
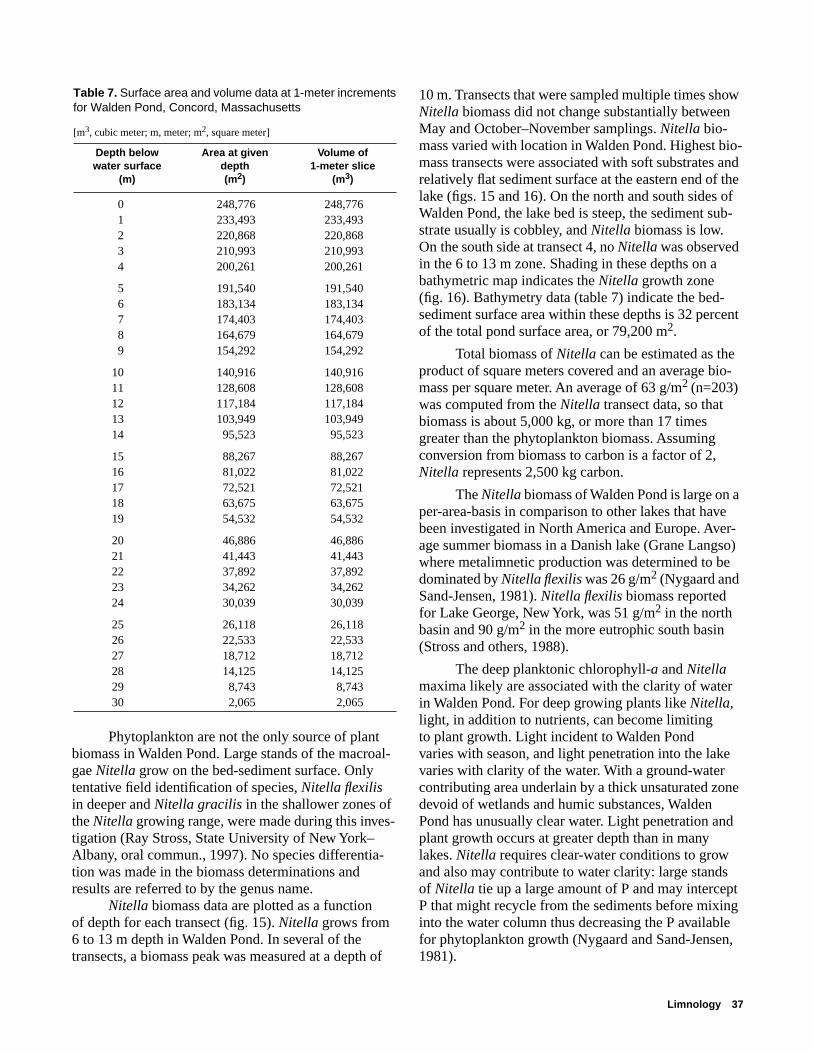
ow
io- and the of b-
ent
io-
a e r-o)
e
ne
d
pt g e ,
Phytoplankton are not the only source of plant biomass in Walden Pond. Large stands of the macroal-gae Nitella grow on the bed-sediment surface. Only tentative field identification of species, Nitella flexilis in deeper and Nitella gracilis in the shallower zones of the Nitella growing range, were made during this inves-tigation (Ray Stross, State University of New York–Albany, oral commun., 1997). No species differentia-tion was made in the biomass determinations and results are referred to by the genus name.
Nitella biomass data are plotted as a function of depth for each transect (fig. 15). Nitella grows from 6 to 13 m depth in Walden Pond. In several of the transects, a biomass peak was measured at a depth of
10 m. Transects that were sampled multiple times shNitella biomass did not change substantially betweenMay and October–November samplings. Nitella bio-mass varied with location in Walden Pond. Highest bmass transects were associated with soft substratesrelatively flat sediment surface at the eastern end of lake (figs. 15 and 16). On the north and south sides Walden Pond, the lake bed is steep, the sediment sustrate usually is cobbley, and Nitella biomass is low. On the south side at transect 4, no Nitella was observed in the 6 to 13 m zone. Shading in these depths on a bathymetric map indicates the Nitella growth zone (fig. 16). Bathymetry data (table 7) indicate the bed-sediment surface area within these depths is 32 percof the total pond surface area, or 79,200 m2.
Total biomass of Nitella can be estimated as theproduct of square meters covered and an average bmass per square meter. An average of 63 g/m2 (n=203) was computed from the Nitella transect data, so that biomass is about 5,000 kg, or more than 17 times greater than the phytoplankton biomass. Assuming conversion from biomass to carbon is a factor of 2, Nitella represents 2,500 kg carbon.
The Nitella biomass of Walden Pond is large on per-area-basis in comparison to other lakes that havbeen investigated in North America and Europe. Aveage summer biomass in a Danish lake (Grane Langswhere metalimnetic production was determined to bedominated by Nitella flexilis was 26 g/m2 (Nygaard and Sand-Jensen, 1981). Nitella flexilis biomass reported for Lake George, New York, was 51 g/m2 in the north basin and 90 g/m2 in the more eutrophic south basin (Stross and others, 1988).
The deep planktonic chlorophyll-a and Nitella maxima likely are associated with the clarity of waterin Walden Pond. For deep growing plants like Nitella, light, in addition to nutrients, can become limiting to plant growth. Light incident to Walden Pond varies with season, and light penetration into the lakvaries with clarity of the water. With a ground-water contributing area underlain by a thick unsaturated zodevoid of wetlands and humic substances, Walden Pond has unusually clear water. Light penetration anplant growth occurs at greater depth than in many lakes. Nitella requires clear-water conditions to grow and also may contribute to water clarity: large standsof Nitella tie up a large amount of P and may interceP that might recycle from the sediments before mixininto the water column thus decreasing the P availablfor phytoplankton growth (Nygaard and Sand-Jensen1981).
Table 7. Surface area and volume data at 1-meter increments for Walden Pond, Concord, Massachusetts
[m3, cubic meter; m, meter; m2, square meter]
Depth belowwater surface
(m)
Area at givendepth(m2)
Volume of1-meter slice
(m3)
0 248,776 248,7761 233,493 233,4932 220,868 220,8683 210,993 210,9934 200,261 200,261
5 191,540 191,5406 183,134 183,1347 174,403 174,4038 164,679 164,6799 154,292 154,292
10 140,916 140,91611 128,608 128,60812 117,184 117,18413 103,949 103,94914 95,523 95,523
15 88,267 88,26716 81,022 81,02217 72,521 72,52118 63,675 63,67519 54,532 54,532
20 46,886 46,88621 41,443 41,44322 37,892 37,89223 34,262 34,26224 30,039 30,039
25 26,118 26,11826 22,533 22,53327 18,712 18,71228 14,125 14,12529 8,743 8,74330 2,065 2,065
Limnology 37

38 Geohydrology and Limnology of Walden Pond, Concord, Massachusetts
0 100 200 300 400
0 100 200 300 400
0 100 200 300 400 0 100 200 30060
050
040
0
0 100 200 300 400
0 100 200 300 400 0 100 200 300 400
0 100 200 300 400
0
DE
PT
H, I
N M
ET
ER
S
DE
PT
H, I
N M
ET
ER
S
NITELLA, IN GRAMS DRY WEIGHT PER METER SQUARED
T-1
T-1
T-2
T-4
T-3
T-7
T-6T-5
T-8
5/19/987/7/98 7/7/9810/6/98 10/6/98
5/20/98 5/20/9810/23/98
5/21/98 5/26/98
5/26/98
11/13/98
11/13/98
5/21/98
3
5
7
9
11
13
15
3
5
7
9
11
13
15
3
5
7
9
11
13
15
Transect number
EXPLANATION
Figure 15. Nitella biomass measured along transects in Walden Pond, Concord, Massachusetts, 1998. (See fig. 16 for location of transects.)

Lim
no
log
y39
213,500
213,000
910,000
909,750
10
20
10
18
10
10
16
1616
16
8
10
20
30
10
10 20
20
4
EXPLANATION
ZONE OF NITELLA GROWTH
DEPTH CONTOUR–In meters below lake surface (altitude 48.27 m). Contour interval is 2 meters.
TRANSECT AND LABEL
10
T6
T7
T8 T3
T2
T1
T5T4
T6
Coordinates shown as 500 meter grid, Massachusetts StatePlane Projection, 1983
0 100 200 METERS
500 FEET0
Figure 16. Bathymetry with sampling transects and zone of Nitella growth, Walden Pond, Concord, Massachusetts, 1998.

ak a-
e
s, ke.
end -
l of e ly f
-s
ur-
ch -lt d d.
e
s re f le /L.
Interception of light by phytoplankton in the shallow depths decreases the light available for Nitella. Light penetration in the lake, as determined by Secchi-disk depth (fig. 13), indicated phytoplankton bloomed during early spring, that phytoplankton decreased (increase in water clarity) in the late spring, and that a second increase in phytoplankton occurred during the summer stratification period. Light penetration to the deep-dwelling Nitella would be greatest during the late-spring clear-water period. The light penetration period correlated with pale green shoots on Nitella samples, indicative of new growth (R.G. Stross, State University of New York–Albany, oral commun., 1997), which were present on Nitella harvested during early May and not present on plants harvested in late summer.
Data on phytoplankton and macrophyte standing crops do not indicate the amount of growth, because continual grazing of the crop by zooplankton and other organisms may occur, decreasing standing crop but stimulating growth. More exact determination of growth can be determined by considering the nutrients used in growth and DO generated by growth.
Dissolved Oxygen
Plant production and internal cycling of nutrients are coupled directly to DO, which is a product of pho-tosynthesis and is consumed in respiration. Analysis of changes in DO and nutrient content in lake zones defined by water stratification can be used to augment nutrient-budget estimates of lake trophic status.
During cold weather every year, Walden Pond, and most temperate-zone lakes, mix oxygen from the atmosphere into the water column. Therefore, lakes are nearly saturated with DO in the early spring (fig. 17). After this cold weather “inhalation” of oxygen and as the surface water warms, the deep water is cut off from the surface by thermal stratification, so that internal processes of photosynthesis and respiration alone determine DO concentration in the deep, colder water zone during the summer. Even the continuous dis-charge of oxygenated ground water does not affect the DO balance below the thermocline zone. Ground water from unconfined aquifers mostly enters lakes near the shoreline, in shallow water (Pfannkuch and Winter,
1984). In late fall, wind and cooling temperatures bredown the thermal stratification, and whole-lake circultion begins again.
Interpretation of DO profiles requires knowledgof their spatial and temporal variability. Horizontal mixing, unencumbered by density stratification, is much greater than vertical mixing (Fischer and other1979), so that points on a vertical DO profile may berepresentative of water extending across the entire laComparison of profiles measured the same day in opposite ends of Walden Pond (deep-hole and east-stations) indicate that DO concentrations are horizontally uniform, at least to the depth of the sill betweenbasins (fig. 18). Horizontal mixing is blocked by the sill so that different DO concentrations develop withineach basin below the depth of the sill (12.6 m).
Temporal variability that may occur on a diurnabasis also must be considered before interpretation the DO profiles in terms of seasonal change. BecausDO generation can occur through photosynthesis onduring the light period, DO profiles in the sunlit part othe water column may change from sunrise to mid-afternoon. Diurnal variation is unlikely to have contributed to the variation between profiles at opposite endthe Walden Pond, since only about 1 hour elapsed during measurements at each station. To quantify dinal variability, DO profiles were measured at the deep-hole station in morning (0640–0730) and mid-afternoon (1400–1450) on September 17, 1997, whiwas a cloudless day. The profiles indicated very littledifference during the day (fig. 18). Apparently, the differences in DO profiles measured through time resufrom cumulative changes that were small day to day,and were not affected greatly by variations associatewith the time of day when the profiles were measure
Dissolved Oxygen in theEpilimnion
DO concentrations in the epilimnion of WaldenPond generally were in equilibrium with oxygen in thatmosphere (fig. 17). Except during and following destratification (lake turnover), none of the 44 profilemeasured in open water (without ice cover) were mothan 5 percent away from saturation in the top 5 m othe lake. Because the surface waters warmed duringMarch to late July each year, DO became less soluband concentrations decreased from about 12 to 8 mg
40 Geohydrology and Limnology of Walden Pond, Concord, Massachusetts

Lim
no
log
y41
DIS
SO
LVE
D O
XY
GE
N, I
N M
ILLI
GR
AM
SP
ER
LIT
ER
0
2
4
6
8
10
12
14
16
DE
PT
H, I
N M
ET
ER
S
DATE
0 2 4 6 8 10 12 14 16
DE
PT
H, I
N M
ET
ER
S
DISSOLVED OXYGEN, IN MILLIGRAMS PER LITER
3/20/98
4/23/98
9/23/98
8/4/98
6/9/98
11/18/98
A.
B.
30
25
20
15
10
5
0
30
25
20
15
10
5
0
5/1/
97
7/1/
97
9/1/
97
11/1
/97
1/1/
98
3/1/
98
5/1/
98
7/1/
98
9/1/
98
11/1
/98
1/1/
99
3/1/
99
5/1/
99
7/1/
99
9/1/
99
3/1/
97
Figure 17. Distribution of dissolved oxygen in Walden Pond, Concord, Massachusetts, March 1997–August 1999 (A) Contour plot of dissolved oxygen in relation to depth and time (white dots indicate dissolved oxygen measuring points), and (B) Dissolved oxygen in relation to depth on selected dates.

42 Geohydrology and Limnology of Walden Pond, Concord, Massachusetts
Deep hole(0640–0730)
Deep hole(1400–1450)
0
30
0
10
20
0
30
0
10
20
0
30
0
10
20
DE
PT
H, I
N M
ET
ER
S
0 150 5 10
0 150 5 10
0 150 5 10
0 150 5 100 150 5 10
0 150 5 10 0 150 5 10
150 5 10
DISSOLVED OXYGEN, IN MILLIGRAMS PER LITER
EXPLANATION
EAST END DEEP HOLE
DEEP HOLE
4/30/97 5/14/97 6/19/97
7/17/97 8/7/97 9/17/97
10/24/97 11/25/97
Figure 18. Dissolved oxygen profiles from the deep-hole station compared with those from the east-end station, Walden Pond, Concord, Massachusetts, (1997); and morning profiles compared with afternoon profiles (September 17, 1997).

ion
th
n he
s u-
nt
nd
rol
y r r
-
e /L, r
In August and September, the surface water cooled, and DO concentrations increased, reaching more than 10 mg/L by late October. Although surface water con-tinued to cool through November and December (5.8˚C on December 21, 1998), DO concentrations decreased slightly during the fall (9.5 mg/L on December 21, 1998), and the surface water became undersaturated (76 percent saturation, December 21, 1998). DO moved into the surface water from the atmosphere during this period, but the rate was not sufficient to keep up with the cooling of the water and the upward mixing of low-DO water caused by a deepening thermocline.
Dissolved Oxygen in the Metalimnion
Unlike the epilimnion, the metalimnion is iso-lated from the atmosphere by the thermocline during the stratified period. Because of the pronounced ther-mal stratification present in the upper metalimnion, vertical mixing is restricted to molecular diffusion rates (Quay and others, 1980), and vertical solute flux would equal the product of solute gradient and molecular diffusivity, which is 2.35 x 10⁻⁵ cm2/s at 25˚C for DO (Thibodeaux, 1996). The sum of upward molecular diffusive flux of DO to the epilimnion and downward flux to the hypolimnion, assuming DO gradients of 3 mg/L/m, would reduce DO in the 8-m thick metalim-nion by about 0.01 mg/L over a period of 3 months. Thus, DO concentrations in the metalimnion are not affected materially by vertical transport and DO gener-ated (or consumed) in the metalimnion accrues until the thermocline deepens in the fall.
Plants respire continuously through light and dark periods, but conduct photosynthesis only during light portions of the day. Plant growth occurs when photosynthesis minus respiration, its chemical opposite reaction, is positive according to the reaction
. (6)
The difference between photosynthesis and respiratis also called net photosynthesis. Changes in DO concentration in the metalimnion during the stratifiedperiod can be interpreted as net production of the metalimnetic ecosystem. This interpretation is analogous to incubating light and dark bottles at depto determine production of the water contained in thebottle. The assumption is that rate of DO diffusion through the top and bottom planes of the metalimniois negligible because of temperature stabilization of twater column.
Net ecosystem production in the metalimnion adetermined from changes in DO includes any contribtion from Nitella and deep-growing algae that inhabit this zone. Metalimnetic DO concentrations increasedsubstantially between March 20 and April 23, 1998 (fig. 17B), generating 3.6 g O2/m2/day, which amounts to 1,300 kg DO in the metalimnion. The metalimnionreceives the most light during this period. Subsequemetalimnetic DO changes (after April) were minimal (fig. 17B). During the 1998 stratified period, maximumDO concentrations increased from 12.0 to 13.6 mg/Lbetween March 20 and April 23, dropped as low as 13.0 mg/L on June 23 and reached 14.2 mg/L in September. Similar patterns were observed in 1997 a1999.
Given the possibility of independent rates of photosynthesis and respiration that could occur, contof DO concentration in the metalimnion between 13 and 14 mg/L during the 6-month stratified period likelwas the result of some identifiable mechanism, rathethan by chance. The mechanism appears to be othethan control through oxygen solubility. The saturationconcentration for oxygen (not air) computed from Henry’s Law (Stumm and Morgan, 1996) for DO at adepth of 8 m (1.8 atmospheres) and 25°C is approxi-mately 60 mg/L and would be greater still at metalimnetic temperatures. Neither are DO concentrations limited by the physiology of plants, which are capablof generating DO concentrations greater than 14 mgas has been observed below the thermocline of othelakes (Cole, 1975).
6CO2 6H+ 2O C6H12O6 6O2+⇔r← espiration
photosynthesis→
Limnology 43

of
on- t n a ed
n r-rat-e
-
in-of
.
in s
-i-
-
A conceptual model was formulated during this investigation that metalimnetic DO was controlled by nutrient limitation and supply. Relations between N, P, DO, and organic carbon were assumed, for the pur-poses of the model, to be fixed by the stoichiometry of photosynthesis and respiration, expanded from equa-tion (6), as given by Stumm and Morgan (1996) of
106 CO2 + 16 NO3 + HPO42- +122 H2O + 18 H+
+ trace elements and energy
=(C106 H263O110N16P) + 138 O2. (7)
These stoichiometric ratios, on average, are measured in analyses of phytoplankton and have been found on average in many analyses of deep seawater (Broecker and Peng, 1982) and lake water (Stumm and Morgan, 1996), where phytoplankton constituents are metabolized by bacteria and returned to solution.
According to the conceptual model, plant growth in the spring in the metalimnion exhausts available supplies of nutrients, especially P, which is growth limiting. The metalimnetic plant growth likely begins before thermal stratification because of increased light penetration through the water surface in the spring and continues into the beginning of thermal stratification. The plant growth generates DO, which builds up after stratification, accounting for the high DO concentra-tions in the metalimnion during April (fig. 17B). The DO concentration does not exceed about 13.5 mg/L because available P in the metalimnion—from storage in overwintering Nitella, remineralization of the early spring algae, or other sources—becomes exhausted. Once P is depleted in the metalimnion, DO can not increase, because continued plant growth, which is what results in DO increase, would require more nutri-ents.
External sources of nutrients from, atmospheric deposition, and swimmers—enter the lake primarily through the epilimnion. Ground water, from uncon-fined aquifers, is discharged preferentially to lakes at the water table (Pfannkuch, and Winter, 1984). Trans-port of dissolved nutrients from above or below the metalimnion is blocked by thermal stratification restrictions on vertical mixing. Even though dissolved sources of nutrients are blocked during stratification, nutrients from degrading particulates continue to
supply the metalimnion. But respirative degradation particulates, whether present on the bed-sediment surface or descending from the surface as detritus, csumes DO. Under the conceptual model, a series ofcloudy days or turbid water might cause negative nemetalimnetic production, that is more respiration thaphotosynthesis, and result in a decrease in DO and release of nutrients. Similar decrease might be causby respirative degradation of a heavy detrital fall. When light penetrated again, however, net productioand DO generation could advance, but only in propotion to the amount of P released by respiration, geneing photosynthetic DO in the process equivalent to thDO amount lost in respiration.
The conceptual model described here is consistent with available data, but has not been verified by,for example, direct measure of nutrient limitation in Nitella. An alternative model for DO control is light limitation of plant growth. Light limitation is consistentwith the correlation of new plant shoots and Secchi disk depth, but does not provide a mechanism for mataining DO at a particular value. Although the cause constant metalimnetic DO remains uncertain, the implication of constant DO, that net metalimnetic production after April is zero remains essentially true
Dissolved Oxygen in theHypolimnion
During stratification, DO decreases in the hypolimnion, where bacterial respiration dominates, proportion to the amount of algal biomass that settledown from the sunlit surface water. By late fall, virtu-ally all the of the DO stored below a depth of 15 m inWalden Pond has been consumed (fig. 17A).
Conductance, pH, Nitrogen, Phosphorus, Iron, Manganese, and Internal Nutrient Recycling
Conductance varied during the investigation from 83 to 92 µS. These relatively low values are indicative of the relatively insoluble crystalline rock materals in the aquifer constituting the drainage area. As noted previously, the conductance is increased somewhat by the septic plume water and runoff from StateRoute 126 (fig. 4).
44 Geohydrology and Limnology of Walden Pond, Concord, Massachusetts

ed
-
al
the
tra-to
d t
on-
n
ns
Measured pH varied from about 6.5 throughout the water column during winter and spring mixing to about 8.5 in the metalimnion during the temperature stratified period (fig. 19). Measurements of pH in the hypolimnion decreased slightly during stratification from about 6.5 to 6.0. Changes in and vertical stratifi-cation of pH values result from generation and use of CO2 during photosynthesis and respiration. The well-known relation is caused by CO2 formation of carbonic acid, CO2 + H2O -> H2CO3, which in turn can dissoci-ate and contribute hydrogen ion to solution (Stumm and Morgan, 1996). Because of the connection of pH with CO2, initial production and subsequent balance in the metalimnion can be tracted by pH. As documented in figure 19, the seasonal pattern of pH change is simi-lar to that of DO, which as discussed is indicative of net primary production.
The cycling of N, P, Fe, and Mn is affected by a combination of thermal stratification, and by plant growth in the epilimnion and metalimnion, plant set-tling, and plant remineralization in the hypolimnion. The dissolved concentration of these elements can indi-cate the effect of geochemical redox state on nutrient release or sequestration by the bed sediments.
Measurements of N in the water column were analyzed as total combined organic-and-ammonia (NH3) N, and as dissolved NO3--plus-nitrite (NO2
-) N. Organic N, a component of biomass, indicates where phytoplankton is abundant. NH3 and NH4
+ are the forms that dissolved N takes in reducing conditions, and NO3
- and NO2- are the dissolved forms of N
present under aerobic conditions. A series of plots of N concentration and depth (fig. 20) indicates the effect of stratification and DO depletion on the N species. In March, before temperature stratification, NO3
- and organic-plus-NH3 N were uniform in the water column, with NO3
- about one third the concentration of the organic-plus-NH3 N. During the stratified period, NO3- and organic-plus-NH3 N began to build up in the hypolimnion but diverged in the upper water, where NO3
- was depleted and organic-plus-NH3 N followed the biomass concentrations. Later in the stratified period, (August and September), denitrification and reduction of NO3-, and ammonification of organic matter in the deepest 5 m of the lake, where oxygen became completely exhausted, resulted in depleted NO3
- and increased levels of organic-plus-NH3 N.
P was measured as total P and as total dissolvP (fig. 21). The total P--total-dissolved P couple (fig. 21) corresponds to a degree to the organic-plusNH3 N—NO3
- couple. Like N, P is a component of biomass and total P indicates the abundance of phy-toplankton. Like NO3, total dissolved P is increased bythe remineralization of phytoplankton. The effect of DO is different on P than on N however, because totdissolved P does not change form where DO is depleted. In fact, total dissolved P concentration increased in the deep water in the stratified period, where DO depletion occurred. The increase may be associated with reductive dissolution of sediment Fe(Stauffer, 1986), with which PO4-3, a component of total dissolved P, associates.
The N to P ratio for annual input of nutrients, as previously stated, was 59. Comparison with the Redfield ratio of 16 indicated phosphorus limitation. Monitoring the N to P ratio in the epilimnion is more directly indicative of potential limiting nutrient, because variable recycle may alter ratios there from ratio of input. The pattern of total nutrient concentra-tions in the epilimnion during the summer—about 0.2 mg/L for organic-plus-NH3 N and about 0.006 to 0.010 mg/L for total P—did not change substantially during the years of summer sampling. These concention ranges correspond to atomic N to P ratios of 44 74, similar to the ratio of inputs, and confirm that P limited plant growth in the water column.
The interaction of N, P, Fe, and Mn with DO anthe effects of temperature stratification were apparenin the late-stratification period (September, fig. 22). NO3
-, P, Fe, and Mn were depleted in the epilimnion and the metalimnion. The nutrients likely were absorbed by phytoplankton and Nitella in those zones; Fe and Mn were not present because high pH and ccentrations of DO keep these elements in insoluble oxide forms. In the upper hypolimnion, NO3
- concen-tration reached a maximum value, but P concentratioremained low. In the lower hypolimnion, where DO was completely depleted, P, Fe, and Mn concentratioincreased, but NO3- concentration decreased becauseof denitrification and reduction to NH3.
Limnology 45

46G
eoh
ydro
log
y and
Lim
no
log
y of W
alden
Po
nd
, Co
nco
rd, M
assachu
setts
6
6.5
7
7.5
8
8.5
9
9.5
pH, I
N S
TAN
DA
RD
UN
IT
3/1/
97
5/1/
97
7/1/
97
9/1/
97
11/1
/97
1/1/
98
3/1/
98
5/1/
98
7/1/
98
9/1/
98
11/1
/98
1/1/
99
3/1/
99
5/1/
99
7/1/
99
9/1/
99
DE
PT
H, I
N M
ET
ER
S
DATE
30
25
20
15
10
5
0
Figure 19. Distribution of pH in Walden Pond, Concord, Massachusetts, March 1997–August 1999. (White dots indicate pH measuring points.)

Limnology 47
TOTAL ORGANIC-PLUS- AMMONIA NITROGEN
DISSOLVED NITRATE- PLUS-NITRITE NITROGEN
NITROGEN, IN MILLIGRAMSPER LITER
NITROGEN, IN MILLIGRAMSPER LITER
NITROGEN, IN MILLIGRAMSPER LITER
EXPLANATION
0 0.1 0.2 0.3 0.4 0.5 0.6 0.7
0 0.1 0.2 0.3 0.4 0.5 0.6 0.7
0 0.1 0.2 0.3 0.4 0.5 0.6 0.7
0 0.1 0.2 0.3 0.4 0.5 0.6 0.7
0 0.1 0.2 0.3 0.4 0.5 0.6 0.7
0 0.1 0.2 0.3 0.4 0.5 0.6 0.7
0 0.1 0.2 0.3 0.4 0.5 0.6 0.7
0
5
10
15
20
25
30
0
5
10
15
20
25
30
0
5
10
15
20
25
30
DE
PT
H, I
N M
ET
ER
S
DE
PT
H, I
N M
ET
ER
S
6/23/98
9/23/98
4/23/983/23/98
7/22/98
5/27/98
8/18/98
Figure 20. Total organic-plus-ammonia nitrogen, and dissolved nitrate-plus-nitrite nitrogen concentration-depth profiles in Walden Pond, Concord, Massachusetts, March–September 1998. [For profiles of May 27, 1998, June 23, 1998, nitrate values below the detection limit (<0.05 mg/L) were plotted at 0.025 mg/L. For profiles of July 22, 1998, August 18, 1998, nitrate values below the detection limit (<0.005 mg/L) were plotted at 0.0025 mg/L.]

48 Geohydrology and Limnology of Walden Pond, Concord, Massachusetts
DE
PT
H, I
N M
ET
ER
S
PHOSPHORUS, IN MICROGRAMS PER LITER
TOTAL PHOSPHORUS
TOTAL DISSOLVED PHOSPHORUS
EXPLANATION
No total dissolvedphosphorus data
No total dissolvedphosphorus data
No total dissolvedphosphorus data
0 2 4 6 8 10 12 14 16 18 20
5/14/97
7/16/97 8/19/97
6/3/97 6/19/97
3/23/98
4/23/98 5/27/98 6/23/98
2/11/999/23/98
0
5
10
15
20
25
30
0
5
10
15
20
25
30
0
5
10
15
20
25
0
5
10
15
20
25
30
0 2 4 6 8 10 12 14 16 18 20
0 2 4 6 8 10 12 14 16 18 20
0 0 102 4 6 8 10 12 14 16 18 20
0 2 4 6 8 10 12 14 16 18 20
0 2 4 6 8 10 12 14 16 18 20
0 2 4 6 8 10 12 14 16 18 20
40 50 60
0
0
10
5 10
40 50 60
15 20 25 30 35 40
0 5 10 15 20 25 30 35 40
Figure 21. Total phosphorus and total dissolved phosphorus concentration-depth profiles in Walden Pond, Concord, Massachusetts, 1997–1998.

EXPLANATIONFOR TOP AXIS
DE
PT
H, I
N M
ET
ER
S
TRACE-CONSTITUENT CONCENTRATIONS,IN MILLIGRAMS PER LITER
SULFATE, OXYGEN, IN MILLIGRAMS PER LITER; TEMPERATURE IN DEGREES CELSIUS
DISSOLVED OXYGEN
TEMPERATURE
SULFATE, AS SO4
EXPLANATIONFOR BOTTOM AXIS
DISSOLVED IRON
DISSOLVED MANGANESE
TOTAL PHOSPHORUS, AS P
TOTAL DISSOLVED PHOSPHORUS, AS P
TOTAL ORGANIC-PLUS- AMMONIA NITROGEN
DISSOLVED NITRATE-PLUS- NITRITE NITROGEN30
0 0.5 2 2.5 3
25
20
15
10
5
00 5 10 15 20 25
c pre-
pe-is-ic ed the
his ted
Figure 22. Depth distribution of nitrogen, phosphorus, dissolved oxygen, and temperature from September 23, 1998; and iron, sulfate, and manganese from September 10, 1997, in Walden Pond, Concord, Massachusetts.
The ratio of S to Fe is thought to determine the relative availability of Fe for interaction with P in lakes. Under reducing conditions, sulfide forms and ties up Fe2+ in FeS precipitate. Hard-water lakes with abundant SO-24 from dissolution of carbonate rocks generally have little Fe available for association with P (Stauffer, 1987). Walden Pond, although soft water, has several additional sources of SO-2
4 including the septic plume and swimmers. Fe concentrations in the anaerobic layer of about 3 mg/L were intermediate between those measured in hard (0.06 mg/L) and soft-water (20 mg/L) systems (Stauffer, 1987). Where Fe is tied up by S, P is thought to recycle more efficiently—in aerobic conditions, because Fe-hydroxides, on
which P adsorbs, are not available—and in anaerobiconditions, because Fe is not released with the P to cipitate upon oxidation (Stauffer, 1987).
Analysis of the concentration profiles in figure 22 also indicates the degree to which internal cyclingof nutrients takes place. That N was recycled clearlywas indicated by the increased concentrations of N scies throughout the hypolimnion. Increases in total dsolved P, by contrast, were restricted to the anaerobzone in the deepest water. During most of the stratifiperiod, the anaerobic zone was so far removed from euphotic zone that none of the released P could be reused. Even when thermal destratification reaches tzone usually sometime after mid-December, associaDO would likely precipitate Fe and a portion of the PO4
-.
Limnology 49

t,
n. -d
e
.
e so -
ll -
rs. as
v-e
Nutrient recycling in Walden Pond at the end of stratification may be greater than recycling that occurs during the stratification period. Near the end of stratifi-cation, the annual recycling of P may be substantial in that DO decreased to zero in the entire hypolimnion just prior to turnover (fig. 17). This condition likely released the Fe-bound P that had been accumulating in the sediment during the summer.
Historical and Between-Lake Trophic Assessments
The relations between plant growth and cycling of water-column chemical constituents can be used in comparative investigations of trophic ecology. These assessments include historical comparisons within a specific lake and comparisons among lakes.
Trophic State from Water-Column Assessment
Trophic state can be measured on the basis of DO consumption in the hypolimnetic water during stratification. The rate at which lakes consume DO in their deep water during respiratory degradation of the particulate organic carbon (largely dead phytoplank-ton) that falls from the epilimnion has been quantified as the hypolimnetic oxygen deficit (HOD) and com-pared among lakes (Hutchinson, 1975). The measure-ment of HOD can be used, as are nutrient budgets and standing crops, to establish trophic state (Walker, 1979). HOD is most informative in lakes like Walden Pond that are deep and relatively oligotrophic, because their deep-stored DO content is large and not con-sumed too quickly after stratification, in which case the HOD record ends. In addition, lakes low in organic carbon (humic substances) derived from the watershed, like Walden Pond, are favored for HOD interpretation because consumption of DO by humic substances would obscure the relation between HOD and in-lake productivity. Comparison of HOD at different times during a season indicates when respiratory degradation of the organic matter in plankton is greatest. Annual comparisons are useful in identifying trends in produc-tion of water-column organic matter through time. HOD is a stable and sensitive measurement, because it reflects the summed phytoplankton production occur-ring during the entire stratified period (contrasting chlorophyll concentration data, which are more
representative of current bloom conditions), and thusis a useful measure to establish baseline data on productivity of Walden Pond.
Investigators have computed HOD in various ways to determine actual, absolute, relative, apparenand real oxygen deficits (Hutchinson, 1975). These various computations consider whether the lake is assumed to be at oxygen saturation in the spring, whether measured spring DO values are used, and whether the volume of the hypolimnion at each depthor simply a column of water is used in the computatioHOD based on measured spring conditions and horizontal volume elements of the hypolimnion associatewith each DO concentration in a profile most closelyconnects the amount of DO used with the amount of plankton falling from the epilimnion in a given growth season. When calculated by these methods and expressed in units of time per surface area of thtop of the hypolimnion surface, HOD is termed the relative hypolimnetic areal deficit (Hutchinson, 1975)
The degree of interconnectedness among the three basins of Walden Pond must be considered in the computation of HOD from DO profiles that were measured only at the deep-hole station, because DOprofiles from the east-end basin diverge at depths below the sill from DO profiles from the deep-hole basin. The top of the hypolimnion used in the HOD computations was taken at 13.5 m, approximately thlevel of the sill between the east and middle basins, the HOD can be calculated on the basis of a hypolimnion area and DO content exclusive of the east-end basin. No DO profiles were measured in the middle basin, because its existence was not known until weinto the investigation. For the purposes of HOD calculation, deep-hole station DO concentrations were applied to volumes in the middle basin at the same level.
The May through July HOD values computed during the 3 years of biweekly monitoring and additional 2000 data are nearly identical (0.049, 0.050, 0.051, 0.048 mg O2/cm2/d) from 1997 through 2000. The small difference in values at Walden Pondcan be compared with eutrophic Lake Mendota (0.11 g O2/cm2/d) in Wisconsin (Hutchinson, 1975). The constant values at Walden Pond result despite potential changes in P input during measurement yeaFor example, the swimming beach at Walden Pond wclosed during the July 4th weekend in 1997. In addi-tion, substantial amounts of phosphate fertilizer equialent to the entire annual P budget for the lake—wer
50 Geohydrology and Limnology of Walden Pond, Concord, Massachusetts

l
es te
d c-m-
im-
s-
applied to shoreline plantings in connection with a bank stabilization program in 1997 and 1998. A better understanding of variation in HOD is obtained by con-sidering the DO content of the hypolimnion on a week-to-week basis during this time period.
HOD and variation in development of HOD are indicated by hypolimnetic DO content plotted with time (fig. 23). The slope of the curve represents the HOD. During the 3 years of biweekly monitoring, 1997–99, hypolimnetic DO content was similar at the beginning of April. DO in the hypolimnion was com-pletely consumed by the end of stratification in the fall. As a consequence, the curves start together in April diverge and then converge after August as complete consumption of DO is approached. During 1997, the slope in April was less than that of April 1998 and 1999. After April, slopes were approximately the same during the three years studied. The offset of the 1997 data from that of 1998 and 1999 apparently was caused by differences in DO use (or resupply in the poorly stratified April water column) before May.
Historical Dissolved-Oxygen Profiles
Historical DO profiles from Walden Pond pro-vide an indication of how nutrient cycling and trophicstate may have changed through time. Four historicasummer profiles (data and data sources fig. 24) are available (1939, 1992, 1994, and 1996). These profilindicate that oxygen depletion is more advanced in lasummer in 1994 and 1996 than in previous years anindicate progressively greater metalimnion DO prodution than do the earlier profiles. The increased hypolinetic DO depletion could be interpreted as a greatersettling of phytoplankton biomass that resulted from growth of a larger biomass and a greater supply of nutrients to support the growth. The increased metalnetic production would follow from the hypothesized greater availability of plant nutrients.
Historical changes in HOD can be estimated from a few historical DO profiles available for WaldenPond. The biweekly DO data used to establish the 1997–99 HOD baseline (fig. 23) give a context for hitorical profiles (one per summer) from 1939, 1992,
Limnology 51
MAR. APR. MAY JUNE JULY AUG. SEPT. OCT. NOV.
9,000
8,000
7,000
6,000
5,000
4,000
3,000
2,000
1,000
0
KIL
OG
RA
MS
DIS
SO
LVE
D O
XY
GE
N,
IN H
YP
OLI
MN
ION
BE
LOW
13.
5 M
ET
ER
S C
BD
A
1999
1992
1997
1996
20001994
1939
Convergence
No dissolved oxygen
1998
Figure 23. Dissolved oxygen content of the hypolimnion of Walden Pond, Concord, Massachusetts, during summers of 1997, 1998, and 1999 (lines); dissolved oxygen content from single profiles in 1939, 1992, 1994, 1996, and 2000 (blue symbols); and lines projecting dissolved oxygen content for summer of 1939 (A-B and C-D).

e
ars
D l t rt
sed- s . r
er es
er
e tive . in
. s e-
ary
e
d
1994, and 1996 (fig. 23). Depending on spring condi-tions, the 1992 through 1996 profiles may represent conditions similar to those measured during the detailed monitoring. The 1939 profile deviates more substantially from the others. This profile, measured before membrane-electrode oxygen probes were avail-able, was based on the accurate Winkler titration method as described in Deevey (1940). The 1997–1999 data indicated that DO was consumed at an approxi-mately constant rate during the summer. If early spring conditions were similar in 1939 to 1997–1999, then a constant depletion rate would run along line A-B, and 1939 HOD would be 0.015 mg/cm2/d, or 30 percent of the current rate. Lower HOD in the past, however, may be associated with higher spring hypolimnetic oxygen content, so that line C-D, (HOD of 0.021 mg/cm2/d) may be more accurate. Both projected lines run through the historical August 1939 point and indicate that DO in the 1939 hypolimnion would not have been exhausted if Walden Pond stratified and turned over historically, at the same times as in the present. Later stratification and earlier turnover result in less DO depletion because there is less time for DO depletion to
occur. As indicated by freeze and breakup dates of icon lakes in the Northern Hemisphere, stratification duration may have increased by 12 days per 100 yefrom 1846 through 1995, or about 8 days since 1939(Magnuson and others, 2000).
According to the analysis described above, HOhas doubled since 1939, which implies that historicainputs of nutrients were less than present inputs. Buthe relation between nutrient supply and plant growthis not necessarily linear and can temporally lag, in pabecause of buildup and release of P in the lake bed iments. Although pre-recreational Walden Pond mayhave received less nutrient input, nutrient inputs mayhave been large in the past. One thousand swimmerwere observed at the 1939 sampling (Deevey, 1942)The Concord Herald newspaper reported on Septembe5, 1935, that summer Sunday afternoon crowds reached 25,000 at Walden Pond and that total summattendance was 485,000. The effect of initial increasin nutrient supply would be decreased because of P sequestration by the sediments. As the sediment-binding sites for P became filled, an increasingly largfraction would have been included in internal recy-cling. To the extent that DO in the hypolimnion becamdepleted, sequestered P would be released by reducdissolution of Fe minerals on which P was adsorbedThe first occurrence of DO depletion at a given level the hypolimnion may have been associated with a substantial bed-sediment release of P, which had accumulated with Fe, since the formation of the lake
If HOD could be reduced to the rate present in1939 so that DO was not exhausted in the final weekbefore turnover, then annual accumulation of P in thehypolimnetic sediments might begin again, with consquent increase in water clarity. Because some DO remains in the hypolimnion until nearly the end of stratification, the degree of P input decrease necessto sustain aerobic conditions may not be too large.
Comparisons of Dissolved Oxygen Among Lakes
Simple comparison of DO profiles among lakesindicates the consequences of the variability in HODamong lakes (fig. 25). Regarding deep DO in kettle-hole lakes in eastern Massachusetts, Gull Pond in thNational Seashore Cape Cod (Portnoy, 1990) and White Pond in Concord (Walker, 1989) show similar DO concentrations in the metalimnion to Walden Ponand similar DO deficits in the hypolimnion. Ashumet
30
25
20
15
10
5
0D
EP
TH
, IN
ME
TE
RS
DISSOLVED OXYGEN, IN MILLIGRAMS PER LITER
0 2 4 6 8 10 12 14 16
Figure 24. Historical dissolved oxygen profiles for Walden Pond, Concord, Massachusetts. [1939 data are from Deevey (1940); 1992 data are from Arthur Screpetis, Massachusetts Department of Environmental Management, written commun. (1994); 1994 data are from Baystate Environmental, Inc. (1995); and 1996 data are from this investigation.]
52 Geohydrology and Limnology of Walden Pond, Concord, Massachusetts

tts
d
n-t
e x-
rge rd-
). 8
pi-
, r
e
n
e n d.
et
-
nd
Pond, also on Cape Cod, differs with dissolved oxygen depletion in the metalimnion and the hypolimnion (Jacobs Engineering, 2000). Nutrient inputs are from water fowl, swimmers and septic leach fields of 21 summer residences at Gull Pond, swimmers and resi-dences on White Pond, Concord, and ground-water discharge of P and N from a sewage plume (with P transport) and residences at Ashumet Pond. These com-parisons verify the sensitivity of HOD to trophic state and highlight a key aspect of trophic variability among lakes in the oligotrophic to mesotrophic classification: the depth of the oxygenated zone.
Trophic Stability
Walden Pond may have become more eutrophic since 1939, but the water still is clear and the lake remains attractive to the public. Metalimnetic DO levels remain high throughout the stratified period so conditions for trout are favorable and the principal plant biomass consists of deep-growing macroalgae. Does the ecologic health of Walden Pond require a decrease in nutrient input in an attempt to achieve more oligotrophic conditions? The answer depends on the stability of the present condition.
Other kettle-hole lakes in eastern Massachusehave degraded episodically in water quality. In November 1998, the kettle-hole lake Cliff Pond in Nickerson State Park on Cape Cod, Mass., developea substantial cyanobacterial bloom that was blown to the shore by the wind. The decaying biomass smelled bad and contained naturally occurring toxins(S. Nichol, Massachusetts Department of Environmetal Management, oral commun., 2000). Two dogs thadrank water from the downwind shore died, a con-firmed consequence of cyanobacterial poisoning. Thbloom, which did not recur in 1999 or 2000, was unepected in that Cliff Pond is a deep (26 m), generally clear-water lake, surrounded by park land. It is assumed that Cliff Pond probably does not have a laP-input budget on a lake-area basis. Complaints regaing increased plant growth have been registered for Ashumet Pond and fish kills have occurred, althoughnot with yearly frequency (K-V Associates, Inc., 1991Although loading of P to Ashumet Pond (estimated 20to 255 kg/yr, Jacobs Engineering, 2000), is probablymuch larger than to Cliff Pond, there are no recordedpoisonings from cyanobacteria blooms for Ashumet Pond. The kettle-hole lakes appear to be subject to esodic water-quality degradation even when external nutrient loading, such as from ground-water sourcesappear to be constant. The question remains whetheWalden Pond could develop a substantial bloom of cyanobacteria such as in Cliff Pond in 1998 or becomsubject to fish kills, as has Ashumet Pond, without receiving the considerably greater per-area nutrient loading of Ashumet Pond.
The consequences of eutrophication, present iCliff Pond and Ashumet Pond, likely could be pre-vented in Walden Pond by maintenance of DO in themetalimnion. An oxygenated metalimnion decreasesinternal recycling of phosphorus. Currently (2000), thhigh, constant concentration of DO of the metalimniois a prominent feature of stratification in Walden PonAccording to the conceptual model developed in thesection “Dissolved Oxygen in the Metalimnion,” met-alimnetic DO in Walden Pond is increased at the onsof stratification by spring expansion of the metalim-netic plant biomass that proceeds until nutrient limitation. DO is maintained at a high level through a nutrient regulated balance of biomass degradation aregrowth until destratification in the fall. According tothe conceptual model, stability would be altered if shading of the metalimnion, such as from increased
30
25
20
15
10
5
0
0 2 4 6 8 10 12 14 16
DE
PT
H, I
N M
ET
ER
S
DISSOLVED OXYGEN, IN MILLIGRAMS PER LITER
Gull Pond 8/04/99
Walden Pond 7/29/99
Ashumet Pond 8/9/99
White Pond 8/3/88
Figure 25. Comparison dissolved oxygen profiles for eastern Massachusetts kettle-hole lakes: Ashumet Pond, Falmouth and Mashpee; Walden Pond, Concord; White Pond, Concord; and Gull Pond, Wellfleet.
Limnology 53

l
,
n
e-
-
er s at
t
he
the ve he g
as-
e n i-
nts
-r
growth of phytoplankton, switched control over metal-imnetic plant growth from nutrient to light. The con-ceptual model has not been tested, however, nor is the stability of the proposed regulatory mechanism known.
On the basis of plant biomass alone, the stability of the present trophic condition of Walden Pond likely involves the ecology of the macroalgae Nitella, which grows in the metalimnion of Walden Pond with a bio-mass 17 times greater than that of the phytoplankton in the epilimnion and metalimnion combined. Stross and Rottier (1989) hypothesized that Nitella helps maintain good water quality by uptake of nutrients, transfer of nutrients to the sediment at die-off, preven-tion of fine-particle resuspension, and facilitation of coagulation of colloids. Nygaard and Sand-Jensen (1981) hypothesized that the deep-growing charophyte species prevent release of Fe-bound phosphate to the water column by releasing oxygen near the sediment-water interface. In two European studies (Melzer, 1999; Riis and Sand-Jensen, 1998), presence of Nitella has been associated with clear-water conditions and later absence of Nitella with more turbid, eutrophic conditions. In Lake George, N.Y., lower biomass den-sity of Nitella was associated with the oligotrophic northern basin, compared to larger biomass density in the more eutrophic southern basin (Stross and others, 1988) and eventual disappearance in the formally most productive areas (R.G. Stross, State University of New York–Albany, oral commun., 1997). Whereas investi-gation is lacking that establishes a cause-and-effect relation between Nitella and water quality, cause and effect has been established for shallow-growing benthic-algal charophytes, with more completed exper-imentation (Scheffer, 1998). Charophytes, of which Nitella is a deep-growing member, have been reintro-duced in turbid shallow ponds to reestablish clear-water conditions that were lost because of shading of former benthic algal populations.
Without further investigation, the role, mecha-nism, and, thus, the stability of Nitella for maintaining DO in the metalimnion remain a matter of conjecture. Given the uncertainty over current metalimnetic regula-tion, the importance of the nutrient budget and histori-cal data is increased. Substantial eutrophication has occurred since the historical DO data collection at Walden Pond in 1939. The principal anthropogenic perturbation causing eutrophication is the hypothesized swimmer input of nutrients. Because of the long recre-ational history at Walden Pond, increased nutrient input may have resulted over a period of more than 100
years. There is insufficient HOD data between 1939 and the present to estimate whether the present leveof eutrophication has reached a new steady state orrather that HOD has increased continuously since 1939. Unlike the trophic perturbations in many lakeswhich result in part from alteration of drainage, hypothesized anthropogenic nutrient inputs to WaldePond potentially could be controlled.
Trophic Ecology and Management Options
At present, the water quality of Walden Pond appears to be desirable and may not require managment. Managing Walden Pond and its ground-water contributing area in a nutrient flux/eutrophication context could be needed only with changing conditions. These conditions could include long-term changes inseptic-system P retention by the aquifer, delayed eutrophication effects from past or current nutrient loads, or concern regarding potential water-quality instability and the size of the Nitella biomass.
Concerns about desorption of P from the aquifcan be addressed by monitoring ground water in thewells just downgradient from the septic leach field. Along as P concentrations in the septic plume remain background levels in those wells, plume associated transport is not occurring.
Other concerns about delayed effects of currennutrient loads, water-quality instability, and Nitella bio-mass all could be addressed by decreasing P load. Teffect of decreasing P load could be monitored by HOD assessment. If HOD is seen to decrease, then delayed effects of nutrient load necessarily would habeen overcome. Decreased P load would minimize thypothesized tendency toward instability, by increasinwater clarity and depth of DO generation, and decreing the amount of phytoplankton sedimentation and DO consumption. Decreased P load should decreasthe thickness of DO depleted water in the hypolimnioand decrease the amount of P recycled from the sedments. The Nitella population should grow less and, thus, be less subject to die-off from self shading. Because the principal source of anthopogenic nutrieis from swimmers, decrease of the source might be possible through a swimmer-education program.
If nutrient input can not be decreased, management efforts could concentrate on prevention of othecircumstances that would decrease water clarity and
54 Geohydrology and Limnology of Walden Pond, Concord, Massachusetts

i-
r
ual er-t
e
d ver
es. and
nd
er-er, ,
f
y ll ld e c ad-hos-t i-t
d
ts rus
is at
light penetration to the metalimnion. Road runoff and bank erosion should be avoided. Rerouting runoff from State Route 126 would decrease turbidity associated with storm runoff. Any runoff water rerouted from direct discharge to Walden Pond to infiltrate to the ground water instead would have turbidity and P largely removed. The bank stabilization program com-pleted in 1997 through 1998 had a potential for tempo-rarily increasing turbidity because soil was moved at the shore and in some cases heavy equipment was driven into shore water. The turbidity curtain which was installed to restrict sediment movement to near-shore areas was an important precaution.
Continued monitoring of HOD, and the amount and distribution of Nitella would be useful with or without a nutrient-reduction program. HOD is likely the most sensitive measure of trophic state available for Walden Pond.
SUMMARY AND CONCLUSIONS
Walden Pond, the deepest lake in Massachusetts, has historical, naturalistic, and limnological impor-tance. Walden Pond is a kettle-hole lake, 30.5 m deep, with 249,000-m2 surface area, located 24 km west northwest of Boston, in Concord, Mass., with a water-shed that extends into Lincoln, Mass. Located in a large metropolitan area, the pond potentially is threat-ened by factors common to urban development. That Walden Pond retains clear, generally good water qual-ity attests to conservation efforts that protect the woods and shore surrounding the pond. Questions remain whether these conservation efforts will continue to pre-serve lake-water quality. The U.S. Geological Survey, in cooperation with the Massachusetts Department of Environmental Management, began an investigation in 1997 to document present water-quality conditions and collect baseline data for Walden Pond.
The ground-water contributing area (621,000 m2) of Walden Pond was determined from water-table information in areas of stratified glacial deposits, measured at near-normal levels in 40 moni-toring wells and 8 ponds on July 19, 1999, and from land-surface contours in areas of bedrock highs. Results indicate Walden Pond is a flow-through lake. Ground water flows into Walden Pond along the east-ern perimeter and lake water flows into the aquifer along the western perimeter. The Walden Pond contrib-uting area includes Goose Pond, also a flow-through
pond, and its ground-water contributing area. Approxmately 6 percent of the inflow from ground water is derived from Goose Pond. Lake-derived ground watefrom Walden Pond discharges into the Sudbury and Concord Rivers or to wetlands and streams draininginto these rivers.
A water balance for Walden Pond, used to derive a nutrient budget, was based on average annconditions from 1995 through 1999 because the watresidence time of the lake was calculated to be abou5 years. There was no change in long-term lake storage during this 5-year period. Precipitation on thlake surface accounted for 45 percent of the inflow (1.215 m/yr) whereas ground-water inflow contribute55 percent (1.47 m/yr expressed as depth of water othe lake surface). The ground-water inflow estimate was based on the average of two different approachOne approach used the size of the contributing area the recharge rate to the aquifer from precipitation. A second approach was based on an isotopic mass-balance, which uses the stable isotopes of oxygen ahydrogen that naturally occur in water. Outflow from evaporation from the lake surface accounted for 26 pcent (0.71 m/yr) and lake-water seepage to the aquifcalculated as the residual value of the water balanceaccounted for 74 percent of the outflow (1.97 m/yr). Ground water is the dominant pathway into and out oWalden Pond.
Walden Pond contributing area excludes nearbpotential sources of nutrients to the lake from a landfiand a trailer park, but the Reservation septic leach fieand leach fields from private residences are within thcontributing area. At present, nitrogen from the septileach field of the Walden Pond State Reservation hequarters and bathhouse reaches Walden Pond, but pphorus is removed during transport with the net effecof increasing the nitrogen to phosphorus ratio of nutrent inputs. Nutrient budgets for the lake indicated thanitrogen inputs (858 kg/yr) were dominated (30 per-cent) by plume water and, possibly, by swimmers (34percent). Phosphorus input (32 kg/yr) was dominateby atmospheric dry deposition, background ground water, and estimated swimmer inputs. Swimmer inpumay represent more than 50 percent of the phosphoload during the summer.
Walden Pond has become more eutrophic in thcentury and loses dissolved oxygen in deep water thhistorical dissolved oxygen measurements indicate remained aerobic 60 years ago. Historical, and inter-lake comparisons of plant production, and estimated
Summary and Conclusions 55

18
. l
n: .
n a nd
:
d
ic .S.
l.
loads of nutrients to Walden Pond indicate the eutroph-ication of Walden Pond possibly could be reversed through management action and deep-water dissolved oxygen increased if phosphorus input to the lake were decreased, possibly through a swimmer-education program. This may benefit a population of a deep-growing macroalgae Nitella, which is hypothesized to maintain water quality by tying up nutrients in deep plant biomass, generating metalimnetic dissolved oxygen at the onset of stratification, and maintaining high metalimnetic dissolved oxygen concentrations during stratification.
REFERENCES CITED
Andersen, F.O., and Ring, P., 1999, Comparison of phosphorus release from littoral and profundal sediments in a shallow, eutrophic lake: Hydrobiologia, v. 408-409 p. 175–183.
APHA, (American Public Health Association, American Water Works Association, Water Environment Federation), 1995, Standard methods for the examination of water and wastewater: Washington, D.C., American Public Health Association, variable pagination.
Baystate Environmental, Inc., 1995, Study of trophic level conditions of Walden Pond, Concord, Massachusetts: Massachusetts Department of Environmental Management, Division of Resource Conservation, 111 p.
Benoit, G., and Hemond, H.F., 1996, Vertical eddy diffusion calculated by the flux gradient method—significance of sediment—water heat exchange: Limnology and Oceanography, v. 41, p.157–168.
Broecker, W.S., and Peng, T.-H., 1982, Tracers in the sea: Palisades, N.Y., Lamont-Doherty Geological Observatory, Columbia University, 690 p.
Carlson, R.E., 1977, A trophic index for lakes: Limnology and Oceanography, v. 2, p.361–369.
Caraco N.F., Cole, J.J., and Likens, G.E., 1992, New and recycled primary production in an oligotrophic lake—insights for summer phosphorus dynamics: Limnology and Oceanography, v. 37, p. 590–602.
Cole, J.J., Caraco, N.F., Likens, G.E., 1990, Short-range atmospheric transport—A significant source of phosphorus to an oligotrophic lake: Limnology and Oceanography, v. 35, p. 1230–1237.
Cole, G.A., 1975, Texbook of limnology: Saint Louis, Mo., Mosby, 283 p.
Craig, H., and Gorden, L.I., 1965, Deuterium and oxygen variations in the ocean and the marine atmosphere, in Tongiorgi, E., ed., Stable Isotopes in Oceanographic Studies and Paleotemperatures: Pisa, Italy, Spoleto, Consiglio Nazionale delle Ricerche, p. 9–130.
Deevey, E.S., 1940, Limnological studies in Connecticut. VA contribution to regional limnology: American Journaof Science, v. 238, p. 717–741.
Deevey, E.S., 1942, A re-examination of Thoreau’s WaldeThe Quarterly Review of Biology, v. 17, no. 1, p. 1–11
DeSimone, L.A., Barlow, P.M., Howes, B.L., 1995, A nitrogen-rich septage-effluent plume in a glacial aquifer, Cape Cod, Massachusetts, February 1990 through December 1992: U.S. Geological Survey Open-File Report 95-290, 92 p.
DeSimone, L.A. and Howes, B.L. 1996, Denitrification andnitrogen transport in a coastal aquifer receiving wastewater discharge: Environmental Science & Technology, v. 30, p. 1152–1162.
DeSimone L.A. and Howes B.L., 1998, Nitrogen transportand transformations in a shallow aquifer receiving wastewater discharge—A mass balance approach: Water Resources Research, v. 34, p. 271–285.
Dillon, P.J., Evans R.D., and Molot, L.A., 1990, Retention and resuspension of phosphorus, nitrogen, and iron icentral Ontario lake: Canadian Journal of Fisheries aAquatic Sciences, v. 47, p. 1269–1274.
Dincer, T., 1968, The use of oxygen 18 and deuterium concentrations in the water balance of lakes: Water Resources Research, v. 4, no. 6, p. 1289–1306.
Farnsworth, R.K., Thompson, E.S., and Peck, E.L., 1982,Evaporation atlas for the contiguous 48 United StatesU.S. Department of Commerce, National Oceanic anAtmospheric Administration, Technical Report NWS 33, 26 p., 4 pls.
Fischer, H.B., List, E.J., Koh, R.C.Y.H., Imberger, J., and Brooks, N.H., 1979, Mixing in inland and coastal waters: New York, Academic Press, 483 p.
Fishman, M.J., and Friedman, L.C., 1989, Methods for determination of inorganic substances in water and fluvial sediments: U.S. Geological Survey Techniquesof Water-Resources Investigations Report , book 5, chap. A1, 545 p.
Friesz, P.J., and Colman, J.A., 2001, Hydrology and trophecology of Walden Pond, Concord, Massachusetts: UGeological Survey Water-Resources Investigations Report 01-4153, 1 sheet.
Gat, J.R., 1980, The isotopes of hydrogen and oxygen in precipitation, in Fritz, P. and Fontes, J.Ch., eds., Handbook of environmental isotope geochemistry, vo1, The terrestrial environment A: New York, Elsevier, p. 21–47.
56 Geohydrology and Limnology of Walden Pond, Concord, Massachusetts

al nd
he
s:
of of
d
.
nal
,
d d
Gilath, C., and Gonfiantine, R., 1983, Lake dynamics, in Guidebook on Nuclear Techniques in Hydrology: International Atomic Energy Agency, technical report series no. 91, p. 129–161.
Godfrey, P.J., and Kerr, P.A., 2000, Preliminary evaluation of a promising forced air-drying technique for preserving chlorophyll on glass fiber filters: Lake and Reservoir Management, v. 16, p. 222–234.
Guyton, A.C., 1971, Texbook of medical physiology (4th ed.): Philadelphia, Pa., Saunders Company, 1032 p.
Hutchinson, G.E., 1975, A treatise on limnology—Chemistry of Lakes: New York, Wiley, v. I, Part 2, 541–1015 p.
Hydrosphere Data Products, Inc., 1995, Climate data: Boulder, Colo., National Climatic Data Center Summary of the Day, 1 CD-ROM.
Jacobs Engineering, 2000, Ashumet Pond Trophic Health Technical Memorandum: Massachusetts Military Reservation, v. 1, AFC-J23-35S18402-M17-0005, variable pagination.
Koteff, Carl, 1963, Glacial lakes near Concord, Massachusetts, Article 96, in U.S. Geological Survey Professional Paper 475-C: Washington, D.C., p. C142–C144.
Koteff, Carl, 1964, Surficial geology of the Concord Quandrangle, Massachusetts: Washington D.C., U.S. Geological Survey Map GQ-133., 4 p., 1 pl.
Krabbenhoft, D.P., Bowser, C.J., Anderson, M.P., and Valley, J.W., 1990, Estimating groundwater exchange with lakes 1—The stable isotope mass balance method: Water Resources Research, v. 26, no. 10, p. 2445–2453.
K-V Associates, Inc., 1991, Ashumet Pond Falmouth/Mashpee, Massachusetts, A diagnostic/feasibility study: Towns of Falmouth and Mashpee, 158 p.
LaBaugh, J.W., Winter, T.C., Rosenberry, D.O., Schuster, P.F., Reddy, M.M., and Aiken, G.R., 1997, Hydrological and chemical estimates of the water balance of a closed-basin lake in north central Minnesota: Water Resources Research, v. 33, no. 12, p. 2799–2812.
Lapham, W.W., Wilde, F.D., and Koterba, M.T., 1995, Ground-water data collection protocols and procedures for the National Water-Quality Assessment Program—Selection, installation, and documentation of wells, and collection of related data: U.S. Geological Survey Open-File Report 95-398, 69 p.
LeBlanc, D.R., 1984, Sewage plume in a sand-and-gravel aquifer, Cape Cod, Massachusetts: U.S. Geological Survey Water-Supply Paper 2218, 28 p.
Levine, S.N., and Schindler, D.W., 1999, Influence of nitrogen to phosphorus supply ratios and physicochemical conditions on cyanobacteria and phytoplankton species composition in the ExperimentLakes Area, Canada: Canadian Journal of Fisheries aAquatic Sciences, v. 56, p. 451–466.
Lyford, F.P., and Cohen, A.J., 1988, Estimation of water available for recharge to sand and gravel aquifers in tglaciated northeastern United States, in Randall, A.D., and Johnson, A.I., eds., The Northeast glacial aquiferAmerican Water Resources Association Monograph Series, no. 11, p. 37–62.
Majoube, M., 1971, Fractionnement en oxygene-18 et en deuterium entre l’eau et sa vapeur: Journal of Chemistry and Physics, v. 197, p. 1423–1436.
Melzer, A., 1999, Aquatic macrophytes as tools for lake management: Hydrobiologia, v. 395-396, p. 181-190
Menzel, D.W., and Corwin, N.C., 1965, The measurementtotal phosphorus in seawater based on the liberation organically bound fractions by persulfate oxidation: Limnology and Oceanography, v. 10, p. 280–282.
Nygaard, G., and Sand-Jensen, K., 1981, Light climate anmetabolism of Nitella flexilis (L.) Ag. in the bottom water of oligotrophic Lake Grane Langso, Denmark: Internationale Revue Der Gesamten Hydrobiologie, v66, p. 685–699.
Pfannkuch, H.O., and Winter, T.C., 1984, Effect of anisotropy and groundwater system geometry on seepage through lakebeds, 1—Analog and dimensioanalysis: Journal of Hydrology, v. 75, p. 213–237.
Portnoy, J.W., 1990, Gull contributions of phosphorus andnitrogen to a Cape Cod kettle pond: Hydrobiologia, v.202, p. 61–69.
Quay, P.D., Broecker, W.S., Hesslein, R.H., and SchindlerD.W., 1980, Vertical diffusion rates determined by tritium tracer experiments in the thermocline and hypolimnion of two lakes: Limnology and Oceanography, v. 25, p. 201–218.
Randall, A.D., 1996, Mean annual runoff, precipitation, anevapotranspiration in the glaciated Northwestern UniteStates, 1951–80: U.S. Geological Survey Open-File Report 96-395, 2 sheets.
Redfield, A.C., Ketchum, B. H., and Richards, F. A., 1963,The influence of organisms on the composition of seawater, in Hill, M.N., ed., In The Sea: New York, Wiley Interscience, v. 2, p. 26–77.
Riis, T. Oa, and Sand-Jensen, K., 1998, Development of vegetation and environmental conditions in an oligotropic Danish lake over 40 years: Freshwater Biology, v. 40, p. 123–134.
Ruttner, F., 1973, Fundamentals of limnology (3d ed): Buffalo, N.Y., University of Toronto Press, p. 295.
References Cited 57

y
2d
g
l
6, tts: p.
es
r,
Ryden J.C., Syers J.K., Tillman R.W., 1987, Inorganic anion sorption and interactions with phosphate sorption by hydrous ferric oxide gel: Journal of Soil Science, v. 38, p. 211–217.
Sacks, L.A., Swancar, A., and Lee, T.M., 1998, Estimating ground-water exchange with lakes using water-budget and chemical mass-balance approaches for ten lakes in ridge areas of Polk and Highlands Counties, Florida: U.S. Geological Survey Water-Resources Investigation Report 98-4133, 52 p.
Scheffer, M., 1998, Ecology of shallow lakes: New York, Chapman and Hall, p. 357.
Schultz, L., 1981, Nutrient input in lakes by bathers: Zentralblatt für Bakteriologie, Mikrobiologie, und Hygiene Ser. B Umwelthyg. Krankenhaushyg. Arbeitshyg. Praev. Med. v. 173, p. 528–548.
Socolow, R.S., Zanca, J.L., Murino, Dominic, Jr., and Ramsbey, L.R., 2000, Water resources data for Massachusetts and Rhode Island, water year 1999: U.S. Geological Survey Water-Data Report MA-RI-99-1, 401 p.
Stauffer, R.E., 1983, Determination of arsenic and phosphorus compounds in groundwater with reduced molybdenum blue: Analytical Chemistry, v. 55, p. 1205–1210.
_____1986, Cycling of manganese and iron in Lake Mendota, Wisconsin: Environmental Science and Technology, v. 20, p. 449–457.
_____1987, A comparative analysis of iron, manganese, silica, phosphorus, and sulfur in the hypolimnia of calcareous lakes: Water Research, v. 21, p. 1009–1022.
Strickland, J.D.H., 1960, Measuring the production of marine phytoplankton: Fisheries Research Board of Canada Bulletin, v. 122, 172 p.
Strickland, J.D.H., and Parsons, T.R., 1968, A practical handbook of seawater analysis: Fisheries Research Board of Canada, Ottawa, Special Publication No. 167, 311 p.
Stross, R.G., Huvane, J., and Sokol, R.C., 1988, Internal structure of deep-dwelling Nitella meadows: Aquatic Botany, v. 29, p. 329–345.
Stross, R.G., and Rottier, B., 1989, Protecting water claritin Lake George: The Conservationist, v. September–October, p. 44–46.
Stumm, W., and Morgan, J.J., 1996, Aquatic chemistry (3ded.): New York, Wiley Interscience, 1022 p.
Thibodeaux, L.J., 1996, Environmental chemodynamics (ed.): New York, Wiley Interscience, 593 p.
Thoreau, H.D., 1854, Walden; or, life in the woods, in Bode, Carl, ed., The Portable Thoreau: New York, The VikinPress, 1964, p. 258–591.
U.S. Department of Commerce, National Oceanic and Atmospheric Administration, 1995–99, Climatologicaldata annual summary—New England, (published annually): Asheville, N.C., National Climatic Data Center, variously paged.
Vollenweider, R.A., 1975, Input-output models with speciareferences to the phosphorus loading concept in limnology: Schweizerische Zeitschrift Fuer Hydrologie, v. 37, p. 53–62.
Walter, D.A., Rea, B.A., Stollenwerk, K.G., Savoie, J., 199Geochemical and hydrologic controls on phosphorustransport in a sewage-contaminated sand and gravelaquifer near Ashumet Pond, Cape Cod, MassachuseU.S. Geological Survey Water-Supply Paper 2463, 89
Walker, E.H., 1971, Walden’s way revealed: Man and Nature, p. 11–20.
Walker, W.W., 1979, Use of hypolimnetic oxygen depletionrate as a trophic state index for lakes: Water ResourcResearch, v. 15, p. 1463–1470.
Walker, W.W., 1988, White Pond water quality studies: Concord, Mass., White Pond Advisory Committee, 28 p.
Winter, T.C., 1981, Uncertainties in estimating the water balance of lakes: American Water Resources Association Water Resources Bulletin, v. 17, no.1, p. 82–115.
Zen, E-an, Goldsmith, G.R., Ratcliffe, N.L., Robinson, Peteand Stanley, R.S., 1983, Bedrock geologic map of Massachusetts: Washington D.C., U.S. Geological Survey, scale 1:250,000, 3 sheets.
58 Geohydrology and Limnology of Walden Pond, Concord, Massachusetts

APPENDIX A: Delta Deuterium and DeltaOxygen-18 of Lake Water, Ground-WaterInflow, and Precipitation, Walden Pond,
Concord, Massachusetts


Appendix A 61
Appendix A. Delta deuterium and delta oxygen-18 of lake water, ground-water inflow, and precipitation, Walden Pond, Concord, Massachusetts
DateDelta deuterium
(per mil)Delta oxygen-18
(per mil)
Walden Pond, East End Deep Area
6-09-98 -33.5 -3.987-06-98 -35.6 -4.148-04-98 -33.8 -3.619-08-98 -32.8 -3.7810-20-98 -34.3 -3.7711-18-98 -34.3 -3.8412-21-98 -34.4 -3.853-18-99 -34.3 -4.044-30-99 -34.0 -4.036-07-99 -32.3 -3.68
Well LVW 30
7-10-98 -59.7 -9.578-12-98 -60.4 -9.689-18-98 -60.1 -9.6010-20-98 -60.1 -9.6311-20-98 -61.7 -9.5612-11-98 -60.4 -9.711-20-99 -60.6 -9.542-18-99 -59.5 -9.393-24-99 -57.7 -8.954-26-99 -53.5 -8.636-04-99 -52.5 -8.56
Well LVW 33
2-18-99 -60.9 -9.644-26-99 -58.3 -9.12
Well CTW 203
10-20-98 -59.0 -9.2012-11-98 -58.2 -9.272-18-99 -56.3 -9.104-26-99 -58.1 -9.28
Precipitation, monthly bulk sample
July 1998 -40.4 -6.55August -29.2 -5.33September -50.4 -7.87October -40.7 -7.25November -41.9 -7.46December -72.9 -11.23January 1999 -41.7 -7.90February -47.4 -8.89March and April -47.2 -8.16May -29.5 -5.31June -41.2 -6.42July -19.8 -3.26August -37.2 -6.21September -55.8 -8.63