geoid height versus topography for oceanic plateaus and … · bermuda swell and cape verde rise)...
TRANSCRIPT

JOURNAL OF GEOPHYSICAL RESEARCH, VOL. 94, NO. B6, PAGES 7403-7418, JUNE 10, 1989
Geoid Height Versus Topography for Oceanic Plateaus and Swells
DAVID T. SANDWELL AND KEVIN R. MACKENZIE
Institute for Geophysics, The University of Texas at Austin
Oceanic plateaus and swells are a major component of the seafloor topography, yet they remain among the most poorly understood features. This is especially true of the oceanic plateaus which show large variations in crustal thickness. To determine the depth and mode of compensation for 53 of the largest plateaus and swells, we analyzed the relationship between geoid height and topography in polygonal areas containing each feature. Both geoid height and topography were first band-pass filtered (400 km < I < 4000 km) to isolate the signal associated with local compensation from flexural and deep mantle signals. The ratio of geoid height to topography was then determined by fitting a straight line to the data. Except for nine of the smaller features there is a high correlation between geoid height and topography that is positive in accordance with Airy and thermal compensation models. Eighteen features have high geoid/topography ratios that cannot be explained by the Airy compensation model of crustal thickening. These features (thermal swells) are partially supported by thermal buoyancy forces in the lower half of the lithosphere. The ratios are highest for active hot spot swells and decay, with the thermal age of the swell, to values consistent with Airy compensation of the enduring volcanic edifice. The remaining features (plateaus) have lower geoid/topography ratios in agreement with the Airy compensation model. Those plateaus with average height greater than 4 km are thought to be continental fragments; the shorter plateaus tend to be volcanic features. Modified continental plateaus, presumably small fragments of extended and intruded continental margin crust, cluster around heights of N3 km, overlapping the range associated with oceanic plateaus. Since the origin of many plateaus is poorly understood, this global geoid/topography analysis provides a new technique for comparing the deep structure of oceanic plateaus and swells.
INTRODUCTION
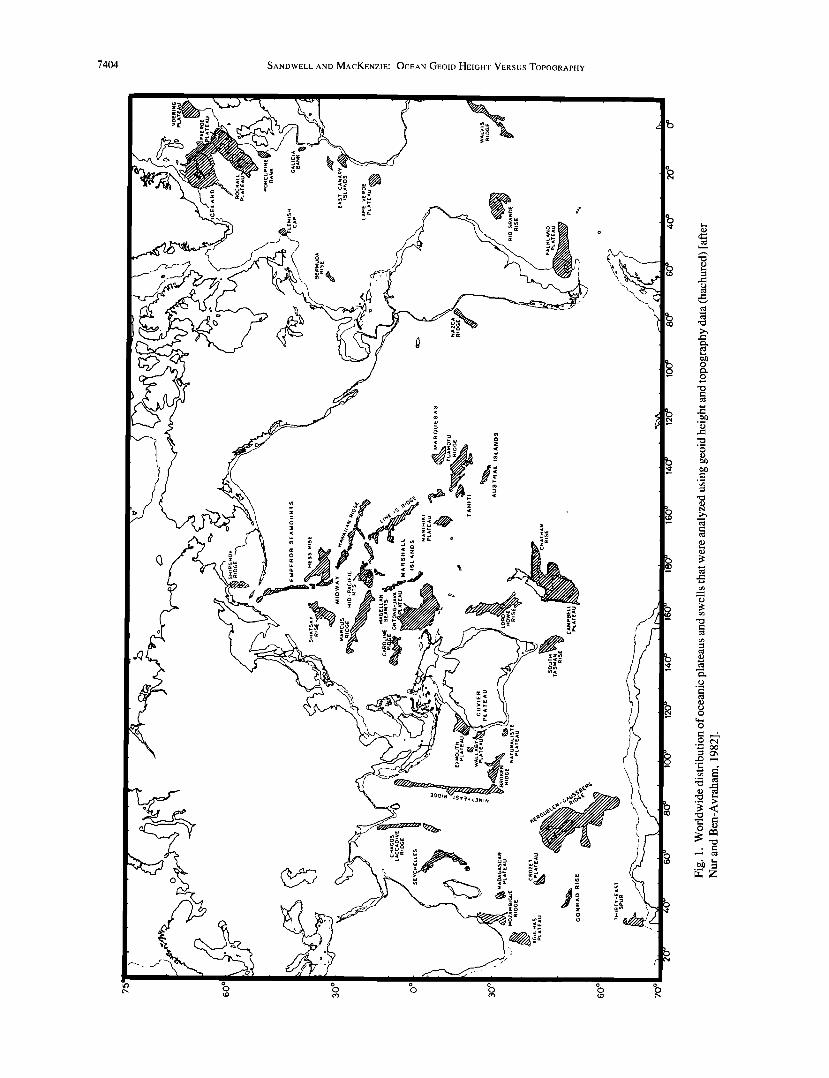
The word' s ocean basins contain more than 100 areas of elevated
seafloor which stand more than 2 km above the adjacent oceanic crust (Figure 1). These features are generally classified either as "oceanic plateaus" or "oceanic swells." Broad swells, usually topped by volcanos, are believed to be areas where the lithosphere has been thinned by an upwelling mantle plume [Detrick and Crough, 1978]. After about 40 Ma, the excess heat diffuses from the swell, and it
subsides. Many of these areas (for example, Hawaiian Swell, Bermuda Swell and Cape Verde Rise) have been studied using topography, heat flow, and geoid height data [Crough, 1978; Haxby and Turcotte, 1978; Detrick et al., 1981; Courtney and White, 1986], while others (for example, Rio Grande Rise, Conrad Rise, and Sierra Leone Rise) are less well understood.
The other, more numerous, elevations known as oceanic plateaus, have the following characteristics: steeply dipping margins, (gener- ally) calcareous sediment caps, lack of focused seismicity, nonlin- eated magnetic anomaly patterns, crustal thicknesses in excess of 15 km, and topographically correlated geoid anomalies [Carlson et al., 1980; Nut andBen-Avraham, 1982, Sandwell andRenkin, 1988]. In
total area, oceanic plateaus cover more than 3% of the seafloor. Therefore, they must play a significant role both in the evolution of oceanic basins and in the formation of collision-type margins [Vogt, 1973; Ben-Avraham et al., 1981].
Nonetheless, oceanic plateaus remain among the most poorly sampled seafloor topographic features. Only a few exhibit island exposures of basement, while the thick sediments blanketing most of these plateaus have made drilling and dredging basement founda- tions difficult. Until recently, the bulk of the existing knowledge of these features came from analog single-channel seismic reflection profiles and a small number of sparsely sampled seismic refraction profiles. In a literature review of over 100 oceanic plateaus worldwide,
Copyright 1989 by the American Geophysical Union.
Paper number 88JB03764. 0148-0227/89/88JB-03764505.00
Nut and Ben-Avraham [1982] have found that less than 20% have even one seismic determination of crustal thickness.
Carlson et al. [ 1980] have compared the published seismic veloc- ity models for 11 oceanic plateaus, arguing that, on the basis of seismic evidence alone, such features can be subdivided into "con-
tinental" and "oceanic" types. Other geological and geophysical evidence supports this differentiation. Continental rocks sampled on the Seychelles Bank [Baker and Miller, 1963], Rockall Plateau [Roberts et al., 1973], Falkland Plateau [Barker et al., 1977] and Agulhas Plateau [Tucholke et al., 1981 ] suggest that these plateaus are continental fragments. Observed crustal age progressions, ridge subsidence calculations, and geochemical arguments indicate a volcanic hot spot origin for some oceanic plateaus such as the Ninetyeast Ridge and the Walvis Ridge [Detrick et al., 1977; Dun- can, 1978; Rabinowitz and LaBrecque, 1979; Mahoney et al., 1983]. Winterer [ 1976] and Hussong et al. [ 1979] have proposed a spread- ing-center-related origin for the Ontong-Java Plateau, Shatsky Rise, and Manihiki Plateau. Many other oceanic plateaus are poorly surveyed, and their crustal natures remain unknown.
To determine the overall characteristics of the largest plateaus and swells, we performed a systematic, comparative study using currently available geoid height and topography data. At wavelengths shorter than 4000 km, geoid height is correlated with seafloor topography [Rapp, 1982]. Moreover, assuming the topography is locally compensated at wavelengths greater than the flexural wavelength (-•400 km), geoid height is nearly linearly related to topography [Ockendon and Turcotte, 1977]. The geoid/topography ratio N/h depends upon the average depth of compensation, and thus it can be used to estimate the mode of compensation [Haxby and Turcotte, 1978]. Features with geoid/topography ratios greater than 6 m/km are compensated beneath the lithosphere and must be dynamically supported by convective stresses [McKenzie et al., 1980]. Low geoid/topography ratios (0-2 m/km) are associated with shallowly (<50 km) Airy- (or Pratt) compensated plateaus [Angevine and Turcotte, 1983]. Finally, intermediate geoid/topography ratios (2-6 m/km) reflect average compensation depths of 50-80 km. This intermediate depth range corresponds to reheating of the lower
7403
7404 SANDWELL AND MACKENZIE: OCEAN GEOID HEIGHT VERSUS TOPOGRAPHY
I I
zor
SANDWELL AND MACKENZIE: OCEAN GEOID HEIGHT VERSUS TOPOGRAPHY 7405
lithosphere [Crough, 1978]. Since the ratio of geoid height to topography depends upon the average compensation depth, intermediate ratios could also reflect linear combinations of
compensation modes [Sandwell and Renkin, 1988]. Gridded geoid height data [Marsh et al., 1986], along with gridded
bathymetry data [Van Wykhouse, 1973], were used to estimate the average compensation depths of 53 swells and plateaus. Some of these features have been studied previously using similar techniques: Hawaiian Swell [Crough, 1978; Sandwell and Poehls, 1980; McNutt and Shure, 1986], Bermuda [Haxby and Turcotte, 1978; Detrick et al., 1986], Walvis Ridge [Angevine and Turcotte, 1980], Agulhas [Angevine and Turcotte, 1983], Crozet [Goslin and Diament, 1987], Marquesas [Fischer et al., 1987], North Pacific plateaus and swells [Sandwell andRenkin, 1988], Exmouth and Rockall plateaus [Fowler and McKenzie, 1988]. While our results largely agree with these previous studies, we have used the global data sets to perform a more systematic analysis. Since data from each area were processed in exactly the same way, we interpret variations in geoid/topography ratio as being caused by differences in compensation depth. In addition, this global analysis enables us to predict the compensation mechanisms of poorly surveyed plateaus and swells.
MODELS
Airy and thermal compensation models were used to explain the relationship between geoid height and topography. In both cases, the long-wavelength approximation for isostatically compensated to- pography [Ockendon and Turcotte, 1977] was used. This approxi- mation is most accurate when the characteristic wavelength of the topography is much greater than the average depth of compensation. Given these assumptions, geoid height N is the first moment of the density anomaly Ap beneath the observation point [Haxby and Tur- cotte, 1978]:
N(x ) = -2 n'G I g z Ap(x,z) dz (1) o
Since the topography is in isostatic equilibrium, the integral of Ap over depth is zero.
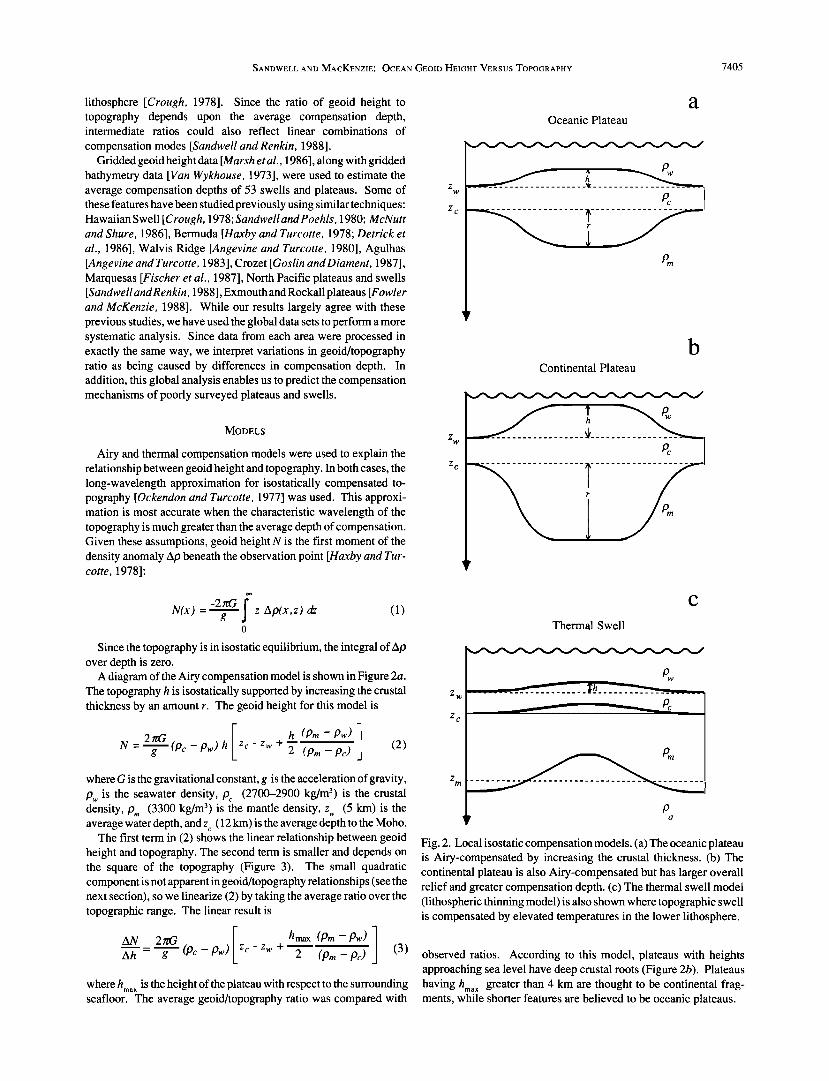
A diagram of the Airy compensation model is shown in Figure 2a. The topography h is isostatically supported by increasing the crustal thickness by an amount r. The geoid height for this model is
N = 2IcG I h (Pm-Pw) g (Pc-Pw) h Zc-Zw +'•' (Pro-Pc) (2)
where G is the gravitational constant, g is the acceleration of gravity, Pw is the seawater density, Pc (2700-2900 kg/m 3) is the crustal density, Pm (3300 kg/m 3) is the mantle density, z w (5 km) is the average water depth, and z• (12 km) is the average depth to the Moho.
The first term in (2) shows the linear relationship between geoid height and topography. The second term is smaller and depends on the square of the topography (Figure 3). The small quadratic component is not apparent in geoid/topography relationships (see the next section), so we linearize (2) by taking the average ratio over the topographic range. The linear result is
AN 2• I hmax (Pm - Pw) l Ah- g (Pc-Pw) Zc-Zw+ 2 (Pro-Pc) (3)
where hma x is the height of the plateau with respect to the surrounding seafloor. The average geoid/topography ratio was compared with
a Oceanic Plateau
Z C
p
b Continental Plateau
c
Thermal Swell
Z w
Z C
p
Fig. 2. Local isostatic compensation models. (a) The oceanic plateau is Airy-compensated by increasing the crustal thickness. (b) The continental plateau is also Airy-compensated but has larger overall relief and greater compensation depth. (c) The thermal swell model (lithospheric thinning model) is also shown where topographic swell is compensated by elevated temperatures in the lower lithosphere.
observed ratios. According to this model, plateaus with heights approaching sea level have deep crustal roots (Figure 2b). Plateaus having hma x greater than 4 km are thought to be continental frag- ments, while shorter features are believed to be oceanic plateaus.
7406 SANDWELL AND MACKENZIE: OCEAN GEOID HEIGHT VERSUS TOPOGRAPHY
16
14
'• 8
-a 6
4
2
'l'hmnmg/ Mode•//
• Airy, •
1 2 3 4 5 6
Topography (km)
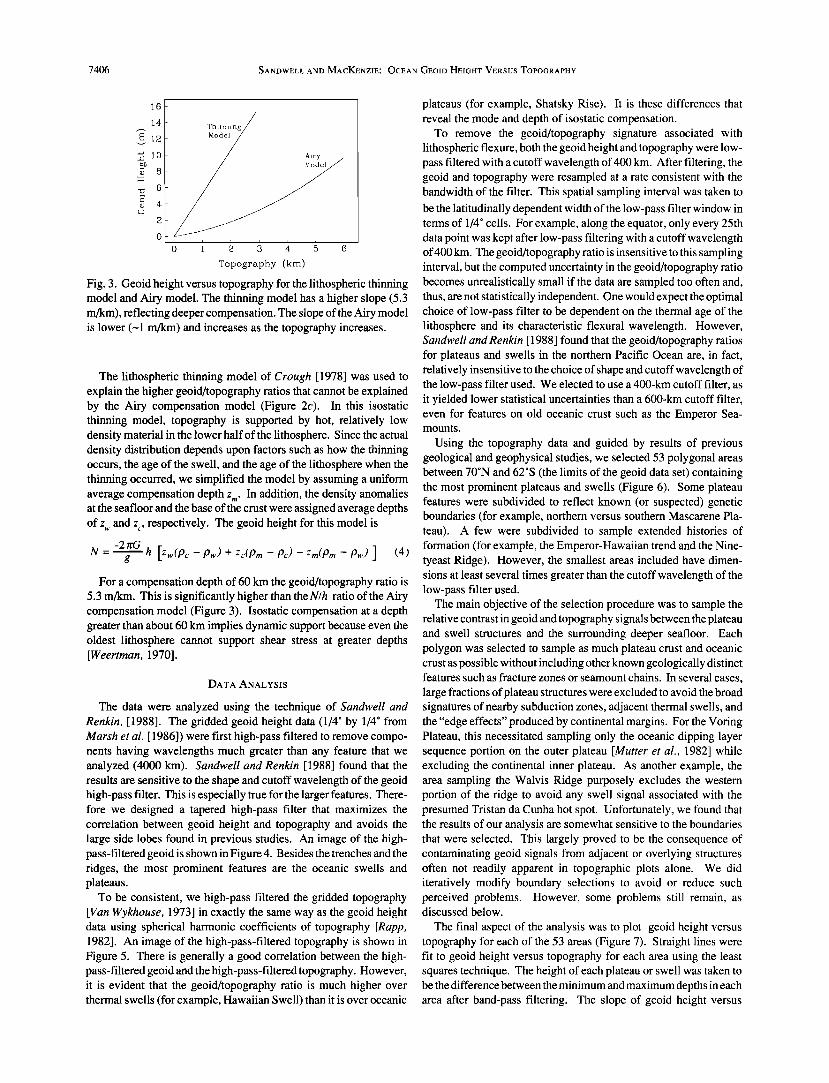
Fig. 3. Geoid height versus topography for the lithospheric thinning model and Airy model. The thinning model has a higher slope (5.3 m/km), reflecting deeper compensation. The slope of the Airy model is lower (-1 m/km) and increases as the topography increases.
The lithospheric thinning model of Crough [1978] was used to explain the higher geoid/topography ratios that cannot be explained by the Airy compensation model (Figure 2c). In this isostatic thinning model, topography is supported by hot, relatively low density material in the lower half of the lithosphere. Since the actual density distribution depends upon factors such as how the thinning occurs, the age of the swell, and the age of the lithosphere when the thinning occurred, we simplified the model by assuming a uniform average compensation depth z m. In addition, the density anomalies at the seafloor and the base of the crust were assigned average depths of z and z respectively. The geoid height for this model is w c'
N = -2•cG h [Zw(Pc - Pw) + Zc(Pm - Pc) - zm(Pm - Pw) ] (4) g
For a compensation depth of 60 km the geoid/topography ratio is 5.3 m/km. This is significantly higher than the N/h ratio of the Airy compensation model (Figure 3). Isostatic compensation at a depth greater than about 60 km implies dynamic support because even the oldest lithosphere cannot support shear stress at greater depths [Weertman, 1970].
DATA ANALYSIS
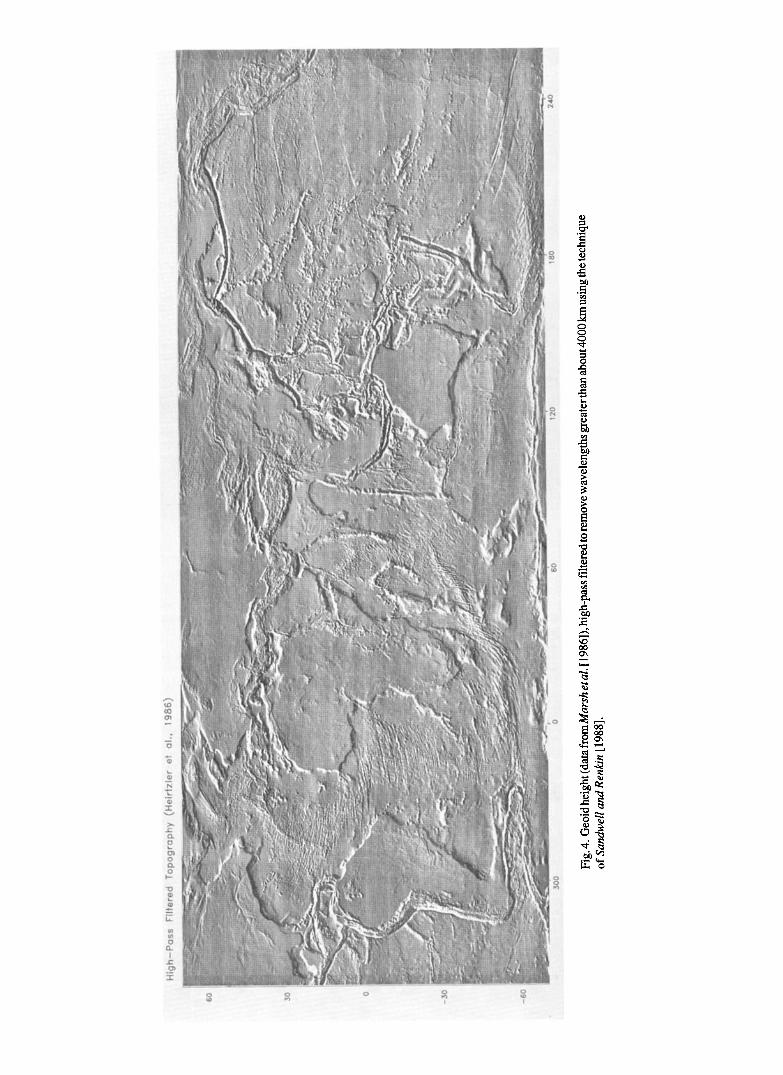
The data were analyzed using the technique of Sandwell and Renkin, [1988]. The gridded geoid height data (1/4 ø by 1/4 ø from Marsh et al. [ 1986]) were first high-pass filtered to remove compo- nents having wavelengths much greater than any feature that we analyzed (4000 km). Sandwell and Renkin [1988] found that the results are sensitive to the shape and cutoff wavelength of the geoid high-pass filter. This is especially true for the larger features. There- fore we designed a tapered high-pass filter that maximizes the correlation between geoid height and topography and avoids the large side lobes found in previous studies. An image of the high- pass-filtered geoid is shown in Figure 4. Besides the trenches and the ridges, the most prominent features are the oceanic swells and plateaus.
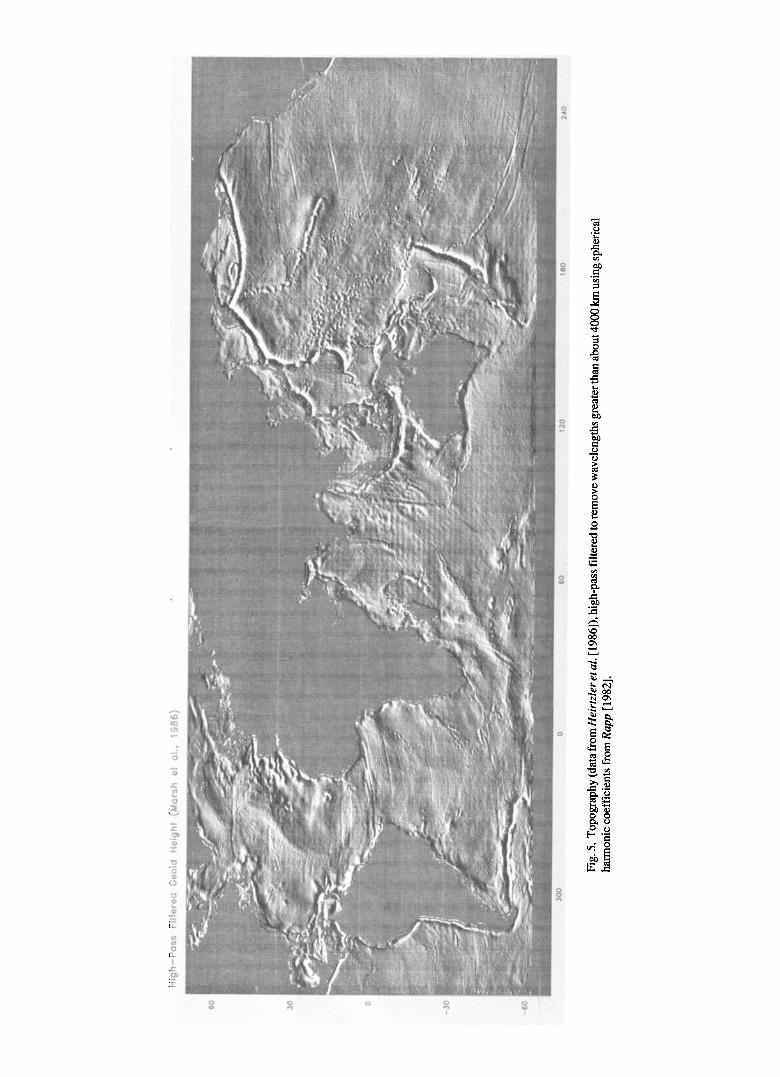
To be consistent, we high-pass filtered the gridded topography [Van Wykhouse, 1973] in exactly the same way as the geoid height data using spherical harmonic coefficients of topography [Rapp, 1982]. An image of the high-pass-filtered topography is shown in Figure 5. There is generally a good correlation between the high- pass-filtered geoid and the high-pass-filtered topography. However, it is evident that the geoid/topography ratio is much higher over thermal swells (for example, Hawaiian Swell) than it is over oceanic
plateaus (for example, Shatsky Rise). It is these differences that reveal the mode and depth of isostatic compensation.
To remove the geoid/topography signature associated with lithospheric flexure, both the geoid height and topography were low- pass filtered with a cutoff wavelength of 400 km. After filtering, the geoid and topography were resampled at a rate consistent with the bandwidth of the filter. This spatial sampling interval was taken to
be the latitudinally dependent width of the low-pass filter window in terms of 1/4 ø cells. For example, along the equator, only every 25th data point was kept after low-pass filtering with a cutoff wavelength of 400 km. The geoid/topography ratio is insensitive to this sampling interval, but the computed uncertainty in the geoid/topography ratio becomes unrealistically small if the data are sampled too often and, thus, are not statistically independent. One would expect the optimal choice of low-pass filter to be dependent on the thermal age of the lithosphere and its characteristic flexural wavelength. However, Sandwell and Renkin [ 1988] found that the geoid/topography ratios for plateaus and swells in the northern Pacific Ocean are, in fact, relatively insensitive to the choice of shape and cutoff wavelength of the low-pass filter used. We elected to use a 400-km cutoff filter, as it yielded lower statistical uncertainties than a 600-km cutoff filter, even for features on old oceanic crust such as the Emperor Sea- mounts.
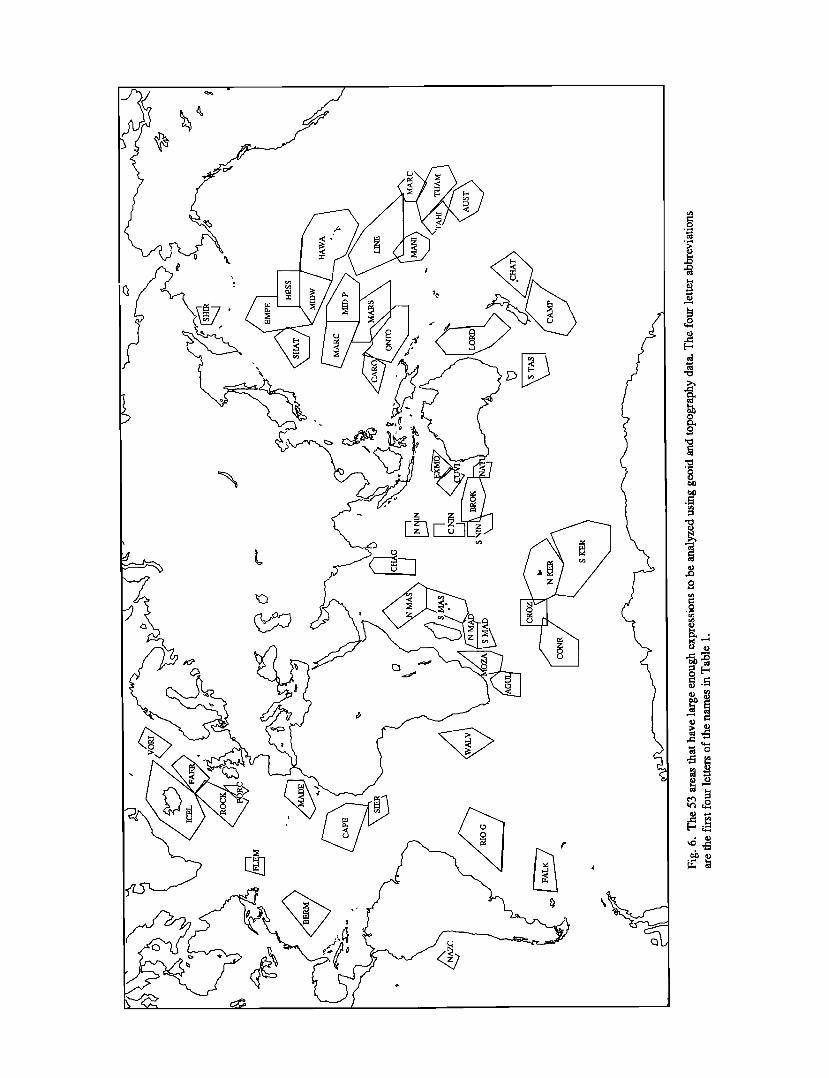
Using the topography data and guided by results of previous geological and geophysical studies, we selected 53 polygonal areas between 70øN and 62øS (the limits of the geoid data set) containing the most prominent plateaus and swells (Figure 6). Some plateau features were subdivided to reflect known (or suspected) genetic boundaries (for example, northern versus southern Mascarene Pla- teau). A few were subdivided to sample extended histories of formation (for example, the Emperor-Hawaiian trend and the Nine- tyeast Ridge). However, the smallest areas included have dimen- sions at least several times greater than the cutoff wavelength of the low-pass filter used.
The main objective of the selection procedure was to sample the relative contrast in geoid and topography signals between the plateau and swell structures and the surrounding deeper seafloor. Each polygon was selected to sample as much plateau crust and oceanic crust as possible without including other known geologically distinct. features such as fracture zones or seamount chains. In several cases..
large fractions of plateau structures were excluded to avoid the broad signatures of nearby subduction zones, adjacent thermal swells, and the "edge effects" produced by continental margins. For the Voring Plateau, this necessitated sampling only the oceanic dipping layer sequence portion on the outer plateau [Mutter et al., 1982] while excluding the continental inner plateau. As another example, the area sampling the Walvis Ridge purposely excludes the western portion of the ridge to avoid any swell signal associated with the presumed Tristan da Cunha hot spot. Unfortunately, we found that the results of our analysis are somewhat sensitive to the boundaries that were selected. This largely proved to be the consequence of contaminating geoid signals from adjacent or overlying structures often not readily apparent in topographic plots alone. We did iteratively modify boundary selections to avoid or reduce such perceived problems. However, some problems still remain, as discussed below.
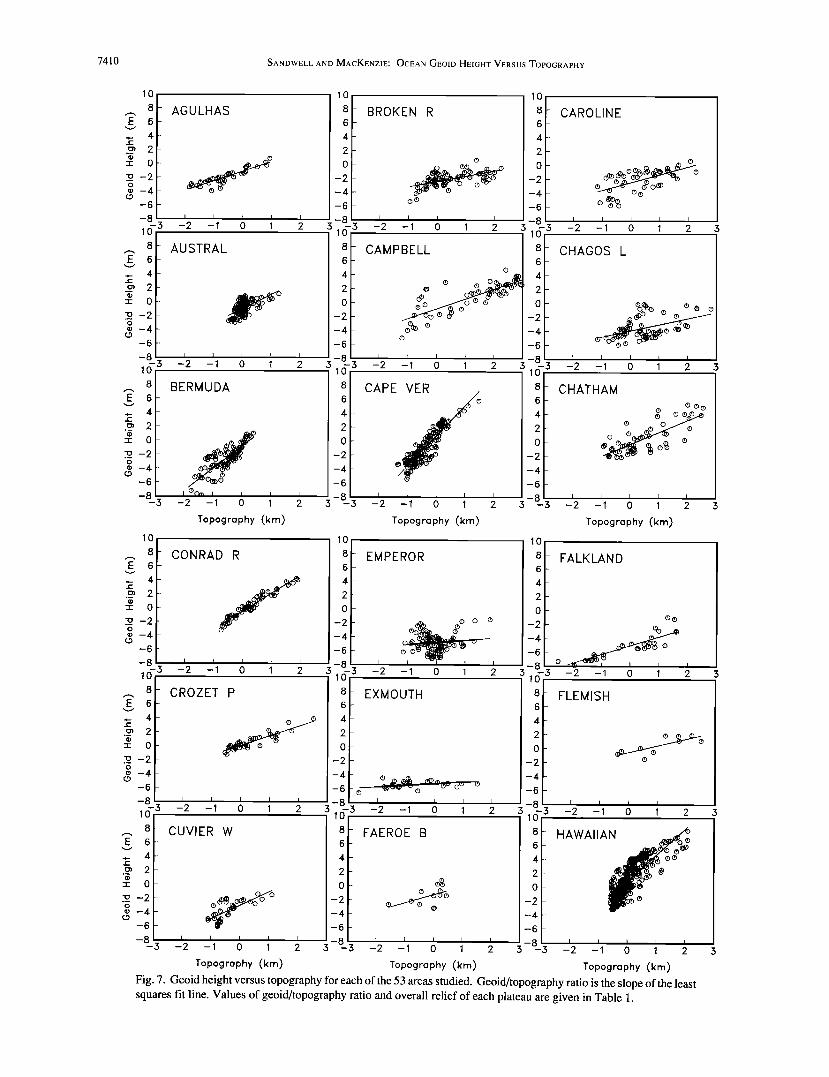
The final aspect of the analysis was to plot geoid height versus topography for each of the 53 areas (Figure 7). Straight lines were fit to geoid height versus topography for each area using the least squares technique. The height of each plateau or swell was taken to be the difference between the minimum and maximum depths in each area after band-pass filtering. The slope of geoid height versus
0
0
• ß
00•
L• o
o o
,4 o
7410 SANDWELL AND MACKENZIE: OCEAN GEOID HEIGHT VERSUS TOPOGRAPHY
10
8- AGULHAS BROKEN R CAROLINE E 6-
4-
.? 2-
:z:: O- ,z,
ß "o -2-
-6 oo
16'--3 -2 -1 0 1 2 3 3 -2 -1 0 1 2 5 5 -2 -1 0 8- AUSTRAL CAMPBELL CHAGOS L
E 6-
"r" O-
."'E_ -2-
0 O0 • ß -4- o% o (.D o
--6 -
--8 I I I I I I I I I I I -.5 -2 -1 0 1 2 .5 -2 -1 0 1 2 .5 .5 -2 -1 0 1 2 10
.-, 8- BERMUDA CAPE VER CHATHAM •,E 6 - o ooo •_ 4-
"r' O- o
• -2- o
ß -4 ½ o -6
-• -2 -• 0 • 2 • • -2 -• 0 • 2 • -• -2 -• 0
Topo9•ophy (•) Topo9•ophy (•) Topo9•ophy (•) 10..
8- CONRAD R EMPEROR FALKLAND E
• 2-
z 0
m -4- -6- o
1•3 -2 -1 0 1 2 3 1 -3 -2 -1 0 1 2 3 3 -2 -1 0 1 2 8- CROZET P EXMOUTH FLEMISH
4 - • - ø •ø • 2- , • 0-
.• -2 - -6 - -• e
8- CUVIER W • FAEROE B HAWAIIAN • 6-
I I I I I __• I I I I I I -8•3 -2 -1 0 1 2 3 3 -2 -1 0 1 2 3 ' 3 -2 -1 0 1 2 Topo9•oPhY (•) Topoe•ophy (•) Topoe•ophy (•)
Fig. 7. Geoid height versus topography for each of the 53 areas studied. Geoid/topography ratio is the slope of the least squares fit line. Values of geoid/topography ratio and overall relief of each plateau are given in Table 1.

SANDWELL AND MACKENZIE: OCEAN GEOID HEIGHT VERSUS TOPOGRAPHY 7411
lO
8- HESS RIS E 6-
v
4-
T 0 -
o
8
S KERGUE
-3 -2 -1 0 1 2 .3 .3 -2 -1 0 1 2 .3 10
-ICELAND _
_
_
_
-3 -2 -1 0 1 2 3 -2 -1 0 1 2 3 10
LINE SWE
8
ß --4 (D
--6
- N KERGUE -
LORD HOW
-.3 -2 -1 0 1 2 .3 .3 -2 -1 0 1 2 3
Topography (km) Topography (km)
10
8
(D
•6-3 -2 -• o • 2 3
- MANIHIKI
_
_
_
8
(D
--6
MARCUS W
o
-3 -2 -1 0 1 2 10
8
--4.
--6
MARQUESA
--8 I I ,I I I -.3 -2 -1 0 1 2
Topography (km)
MARSHALL
-2 -1 0 1 2 3
N MASCAR
-2 -1 0 1 2
S MASCAR
• o o
-2 -1 0 1 2
Topography (kin)
Fig. 7. (continued)
N MADAGA
-2 -1 o 1 2 3
S MADAGA
o
-2 -1 o 1 2 3
MADEIRA
o
-2 -1 o 1 2 3
Topography (km)
MID PACI
-2 -1 0 1 2
MIDWAY S
-2 -1 0 1 2 3
MOZAMBIQ
-2 -1 0 1 2 3
Topography (km)

7412 SANDWELL AND MACKENZIE: OCEAN GEOID HEIGHT VERSUS TOPOGRAPHY
lO
8- NATURALI E 6-
v
4-
• 2-
-F 0-
o
O --6- -3 -2 -1 0 1 2 3
10
8
ß --4 o
16 -
-3 -2 -1 0 1 2 3 10
- NAZCA RI _
_
_
_
8- N NINETY E 6-
v
4-
• 2-
-F 0-
o • 14 -
-6 - 8 © -3 -2 -1 0 1 2 3
Topography (km)
10
8
'• • 0 000
ß -4 - o• o
--6 -
-3 -2 -1 0 1 2 3 10
- SHATSKY _
_
_
_
_
8- SHIRSHOV E 6-
4-
• 2- ._
-F 0-
• --2 - ._
o • I 4 --
--6 -
-3 -2 -1 0 1 2 3 10
o
8- SIERRA L E 6-
4-
• 2-
-F 0-
• --2 - 0 • --4 -
--6 -
-3 -2 -1 0 1 2 3
Topography (km)
C NINETY
-2 -1 0 1 2 3
S NINETY
-2 -1 0 1 2 3
ONTONG J
o
-2 -1 o 1 2 3
Topography (kin)
PORCUPIN
-2 -1 0 1 2 3
RIO GRAN
-2 -1 0 1 2 3
ROCKALL
-2 -1 0 1 2 3
Topography (km)
C
TAHITI S •- VORING P 6-
4-
C-
4-
6-
-2 -1 0 1 2 3 •-3 -2 -1 0 1 2 3 S TASMAN 8 WALVIS R
6-
2 o ø _ oo
2
6
i i I i I 8 i i i I I -2 -1 0 1 2 • --• -2 -1 0 1 2
TUAMOTU
-2 -1 0 1 2 3
Topography (km)
Fig. 7. (continued)

SANDWELL AND MACKENZIE: OCEAN GEOID HEIGHT VERSUS TOPOGRAPHY 7413
topography (i.e., the geoid/topography ratio), its uncertainty, and the plateau height for each of the areas are given in Table 1.
We did not perform a sediment-loading correction because in a previous study [Sandwell and Renkin, 1988], it was shown that the sediment-loading correction has little influence on the results except
where the sediments are more than 1 km thick. Moreover, accurate
sediment thickness data are not available on the most remote and
interesting plateaus. Sediments increase the apparent height of a plateau but have little influence on its geoid expression because of their low density. This should result in systematic underestimation
TABLE 1. Geoid Height/Topography Ratios (N/h), Standard Deviation to the Least Squares Fit (%V/h) and Overall Relief (hmax) of the 53 Plateaus and Swells Studied
Abbrev i- Literature
Plateau or Swell ation N/h (JN/h hma x Type* Type* Reference
Agulhas Plateau AGUL 1.404 0.112 2.771 C m C Tucholke et al. [1981] Austral Swell AUST 2.056 0.285 1.736 S S Crough [1978] Bermuda Swell BERM 3.194 0.234 2.265 S S Derrick et al. [1986] Broken Ridge BROK 0.782 0.125 3.168 O O? MacKenzie [1984] Campbell Plateau CAMP 1.427 0.130 4.241 C C Denison and Coombs [ 1977] Cape Verde Rise CAPE 4.315 0.178 2.818 S S Courtney and White [!986] Caroline Seamounts CARO 1.145 0.206 3.440 O O Mattey [1982] Chagos-Laccadive Ridge CHAG 0.896 0.207 3.669 O O Duncan [ 1981 ] Chatham Rise CHAT 1.718 0.194 4.200 C C Adams and Robinson [1977] Conrad Rise CONR 2.633 0.090 2.638 S S Diament and Goslin [1986] Crozet Plateau CROZ 1.409 0.111 3.055 O O Goslin and Diament [1987] Cuvier and Wallaby Plateaus CUVI 1.939 0.331 2.203 S O Larson et al. [ 1979] Emperor Seamounts EMPE 0.351 0.252 3.012 O? O Derrick and Crough [1978] Exmouth Plateau EXMO 0.263 0.097 4.531 C C Larson et al. [1979] Faeroe Block FAER 1.185 0.621 2.010 O? C Bott et al. [1974] Falkland Plateau FALK 1.285 0.110 4.294 C C Barker, Dalziel et al. [1977] Flemish Cap FLEM 0.992 0.285 2.894 C m C Pelletier [1971] Hawaiian Swell HAWA 3.759 0.168 2.674 S S Derrick and Crough [ 1978] Hess Rise HESS 1.694 0.110 2.446 S? O Vallier et al. [1983] Iceland ICEL 1.532 0.229 2.828 S S Vogt [1974] North Kerguelen Plateau N KER 1.409 0.184 4.115 O O Mahoney et al. [1983] South Kerguelen Plateau S KER 1.800 0.127 3.224 S O? Houtz et al. [1977] Line Swell LINE 1.941 0.201 2.688 S S Sandwell and Renkin [1988] Lord Howe Rise LORD 0.813 0.062 4.258 C C Shor et al. [1971] North Madagascar Ridge N MAD 1.519 0.115 3.664 O O Goslin et al. [1981] South Madagascar Ridge S MAD 2.196 0.104 4.147 S O Sinha et al. [1981] Madeira Rise MADE 1.887 0.579 2.064 S? S Cazenave et al. [1988] Manihiki Plateau MANI 0.524 0.165 2.519 O O Winterer et al. [1974] Marcus-wake Seamounts MARC 0.927 0.290 1.511 O? O Heezen et al. [ 1973] Marquesas Swell MARQ 1.637 0.408 1.875 S S Fischer et al. [1987] Marshall-Gilbert Seamounts MARS 1.008 0.181 2.221 O O Schlanger et al. [1981] North Mascarene Plateau N MAS 1.687 0.102 5.064 C C Francis et al. [ 1966] South Mascarene Plateau S MAS 1.729 0.158 4.121 S S Duncan [1981] Mid Pacific Mountains MID P 0.342 0.111 2.714 O O Winterer and Metzler [ 1984] Midway Swell MIDW 2.070 0.256 1.811 S S Derrick and Crough [1978] Mozambique Plateau MOZA 1.814 0.118 2.550 S C Hales and Nation [1973] Naturaliste Plateau NATU 0.772 0.121 2.526 O O? Coleman et al. [1982] Nazca Ridge NAZC 1.390 0.204 1.980 O O Cutler [ 1977] North Ninetyeast Ridge N NIN 1.098 0.356 1.888 O? O Peirce [1978] Central Ninetyeast Ridge C NIN 0.990 0.288 2.509 O O Duncan [1978] South Ninetyeast Ridge S NIN 0.711 0.095 2.037 O O Duncan [1978] Ontong-Java Plateau ONTO 1.653 0.208 2.513 S* O Hussong et al. [1979] Porcupine Bank PORC 0.799 0.141 3.197 C m C Whitmarsh et al. [1974] Rio Grande Rise RIO G 2.277 0.166 3.823 S O Gamboa and Rabinowitz [1984] Rockall Plateau ROCK -0.173 0.193 2.373 Cm? C Scrutton [1972] Shatsky Rise SHAT 0.758 0.134 3.041 O O Den et al. [1969] Shirshov Plateau SHIR - 1.008 1.261 1.713 O? 9 Sierra Leone Rise SIER 2.094 0.220 1.780 S O Kumar [1979] Tahiti Swell TAHI 2.465 0.150 1.475 S S Duncan and McDougall [1976] South Tasman Rise S TAS 0.826 0.241 2.864 C m C Houtz [ 1974] Tuamotu Archipelago TUAM 0.690 0.060 3.187 O O Duncan and Clague [1985] Voring Plateau VORI 0.577 0.207 1.295 O O Mutter et al. [1982] Walvis Ridge WALV 1.407 0.140 3.131 O O Rabinowitz and LaBrecque [ 1979]
* S, thermal swell; O, oceanic plateau; C, continental plateau; Cm, modified continental plateau. * Apparent type resulting from signal contamination (see text for discussion). Also listed for each feature are both its crustal type as interpreted from the N/h data and its crustal type as derived from the
reference cited. The four- letter abbreviation for each plateau or swell name is used in the location map shown in Figure 6.
7414 SANDWELL AND MACKENZIE: OCEAN GEOID HEIGHT VERSUS TOPOGRAPHY
of geoid/topography ratios in the presence of low-density sediment cover. In the case of the Ontong Java Plateau, Sandwell and Renkin [1988] found that correction for sediment loading increased the resulting geoid/topography ratio by ---12%. Without the sediment correction, we suspect that the geoid/topography ratios for the plateaus with thick sediment cover included in this study (principally Ontong Java Plateau, Rockall Plateau, Lord Howe Rise, Exmouth Plateau, and Kerguelen Plateau) may be underestimated.
This band-pass filtering technique for determining the geoid/ topography admittance has several advantages over the usual Fourier transform method [Dotman and Lewis, 1970]. First, problems with edge effects are minimized because the filters are applied before the areas are selected. Second, this technique does not require that the data be projected onto a flat earth, and the areas can have irregular shapes to avoid contaminating signals. Third, there is the possibility of determining whether or not the geoid/topography relationship contains the nonlinear component predicted by the Airy model. One relative disadvantage is that the convolutions used for band-pass filtering are computationally much slower than the Fourier trans- forms used in the admittance analysis. However, the ever increasing speed of computers have rendered this problem insignificant.
RESULTS AND DISCUSSION
In general, we find a high linear correlation between geoid height and topography (Figure 7 and Table 1). Geoid/topography ratios range from - 1.01 m/km at Shirshov Plateau to 4.31 m/km at the Cape Verde Rise, although most ratios lie between 0.5 to 3.0 m/km Except for the Shirshov and Rockall plateaus, all of the 53 geoid/topography ratios determined are positive, in agreement with local isostatic compensation models. Six areas show a large amount of scatter in the geoid/topography plots, resulting in large uncertainties in geoid/ topography ratio. These areas include Emperor Seamounts, Faeroe Block, Madeira Rise, Marcus-Wake Seamounts, the northern seg- ment of the Ninetyeast Ridge, and Shirshov Plateau with its negative geoid/topography ratio. We believe that the areas selected to encompass these features may not contain structural highs of suffi- cient breadth to be analyzed and interpreted with this technique.
At least 19 of the areas have highly linear and unscattered relation- ships between geoid height and topography. They are Agulhas Plateau, Broken Ridge, Cape Verde Rise, Conrad Rise, Crozet Plateau, Exmouth Plateau, Falkland Plateau, Hess Rise, Lord Howe
Rise, north Madagascar Ridge, south Madagascar Ridge, Mozam- bique Plateau, Naturaliste Plateau, Nazca Ridge, south Ninetyeast Ridge, Porcupine Bank, Sierra Leone Rise, Tahiti Swell, and Tuamotu Archipelago. All of these features are quite massive and have relatively large geoid expressions. Although the data are somewhat more scattered, the remaining 28 areas exhibit relatively linear relationships between geoid height and topography in this wave- length band.
As described in the model section, the geoid/topography ratio depends upon the average depth of compensation, while the overall topographic relief depends on the mass deficit in the compensating root. Our results confirm that well-known thermal swells (for example, Hawaiian Swell) exhibit large geoid/topography ratios (for example, > 3 m/km), indicating relatively large average compensa- tion depths (-•60 km). Their high geoid/topography ratios result from the large geoid signal and the relatively low average topographic relief associated with swells. The overall topographic relief of these structures largely indicates the relative volume of the magmatic events which have built the volcanic edifices. Thermally older swells (for example, Midway Swell) manifest intermediate geoid/topogra-
phy ratios (i.e., 1.5-3.0 m/km), reflecting the cooling of the broad swell. Clearly the subsidence of the relatively low amplitude topographic swell results in only a negligible decrease in average relief (i.e., a few hundreds of meters). Thus, the observed ratios reflect the linear combination of decaying thermal compensation of the swell and shallow Airy compensation of the volcanic edifice.
We find that oceanic plateaus, large volcanic features in the ocean basins such as Manihiki Plateau and Shatsky Rise, are associated with a low geoid/topography ratio (< 1.5 m/km) and an overall relief of less than -•4 km. The remnant volcanic edifices of cooled thermal
swells (for example, Emperor Seamounts) fall in this category as well. Large continental plateaus, including Lord Howe Rise and Campbell Plateau, among others, also have relatively low geoid/ topography ratios but are characterized by high relief, generally in excess of 4 km. Results for all of these features are consistent with
shallow Airy-type compensation of these seafloor platforms. We suspect that the anomalous negative geoid/topography ratio for Rockall Plateau is an artifact, indicating that the several distinct morphologic elements comprising this plateau (i.e., Hatton Bank, Hatton-Rockall Trough, and Rockall Bank) should be analyzed as separate geologic features. This is supported by the ---10 km variation in crustal thickness observed under these features [Scrutton, 1972].
To illustrate the relationships between the different types of plateaus and swells, we plotted the geoid/topography ratio of each plateau or swell against its overall relief (Figure 8). Each feature is identified by its type as commonly espoused in the literature (see Table 1 for references). Also shown is the geoid/topography ratio as a function of overall relief computed for the Airy model (equation (3)) at each of four different crustal densities (2600, 2700, 2800, and 2900 kg/m3). These plot as the four straight lines in Figure 8.
Known continental plateaus follow the Airy model trend but largely separate into two distinct clusters. Larger continental frag- ments (north Mascarene Plateau, Chatham Rise, Campbell Plateau, Falkland Plateau, and Lord Howe Rise) comprise the first, exhibiting an overall relief in excess of 4 km. Exmouth Plateau probably belongs to this group, but its geoid/topography ratio is unexpectedly low with relatively little statistical scatter. The Chatham Rise has a relatively high geoid/topography ratio which may be the remnant thermal contribution of a linear, Miocene-to-Pliocene volcanic trend
across the plateau [Adams, 1983]. The smaller continental plateaus (Flemish Cap, Porcupine Bank,
and South Tasman Rise) form the second group. All of these plateaus are characterized by lower overall plateau relief (---3 km) and are located adjacent to passive continental margins from which they are separated by narrow troughs. We believe that whereas ridge jump fragmentation of continental crust may dominate the formation of the other, larger plateaus, continental margin extension and modification may be the dominant processes producing these, smaller modified continental plateaus. Although the Agulhas Plateau has been interpreted as an extensively modified continental fragment [Tucholke et al., 1981 ], the geoid/topography ratio for this plateau is significantly greater than that of other modified continental plateaus. This suggests that the low-density continental component of this feature may be relatively minor. Indeed, continental rocks dredged from the Agulhas Plateau are limited to its southern and southwestern margins [Allen and Tucholke, 1981 ]
All features identified in the literature as thermal swells occur over
geoid/topography ratios ranging from 1.5 to 4.5 m/km. We note that the area representing Iceland yields a relatively low geoid/topogra- phy ratio (1.53 m/km), but we expect that the large Airy-compen- sated plateau dominates the signatures of the thermal swell and spreading ridge. A few other unexpected results are apparent among

SANDWELL AND MACKENZIE: OCEAN GEOID HEIGHT VERSUS TOPOGRAPHY 7415
,*- Thermal Swell 4-
•H^W^ O-- Oceanic Plateau l- Continental Plateau
• gERM E 3-
CONR
s .,.• - "t•-•--•--:•b-•
ß • .... i[ ....
I mR I I I I I I I 1.0 2.0 3.0 4.0 5.0
Plateau Height (kin)
Fig. 8. Geoid/topography ratio versus overall relief for each of the 53 areas. Error bars indicate 1 standard deviation. Symbols indicate the popular classification of the structure as indicated in Table 1. The four straight lines represent the geoid/topography ratios computed for Airy models assuming each of the four different crustal densities annotated.
the structures with values of N/h greater than 1.5 m/km. For instance, the Kerguelen hot spot, thought to lie near Heard Island (north Kerguelen Plateau) [e.g., Duncan, 1978], may actually lie further to the southeast under the South Kerguelen Plateau, given its higher geoid/topography ratio. However, we do note that results for North Kerguelen Plateau are much more scattered, possibly concealing evidence of the swell's signature, and that the topography of the south Kerguelen area is not well constrained.
Several other features not generally recognized as active thermal swells exhibit high geoid/topography ratios as well. These include Sierra Leone Rise, Cuvier and Wallaby plateaus, south Madagascar Ridge, Rio Grande Rise, and Mozambique Plateau. While geologic evidence indicates Cretaceous or older ages for the first four plateaus and an Eocene age for Rio Grande Rise (see references in Table 1), our results would suggest that these structures are underlain by lithosphere which has been thermally rejuvenated much more re- cently.
The high geoid/topography ratio observed for Mozambique Pla- teau is particularly interesting, given that some authors consider this structure to be continental [Hales and Nation, 1973]. Many paleo- reconstruction models for Gondwanaland show a clear genetic association between Falkland Plateau, Mozambique Ridge, and Agulhas Plateau [e.g., Tucholke et al., 1981; Lawver et al., 1985]. Presumably, these features separated from one another and from other adjacent continental masses in approximately the Early Creta- ceous [e.g.,Lawver et al., 1985, Figure 3]. As the reconstructed fit of the present-day northern margin of the Falkland Plateau to the southeastern margin of Africa is very precise, Lawver et al. [ 1985] argue that this continental fragment has undergone very little exten- sion. However, our results indicate that, structurally, the Mozam- bique Ridge and the Agulhas Plateau are quite different from the Falkland Plateau. Given a geoid/topography ratio twice that of modified continental plateaus such as Flemish Cap or Porcupine Bank, the Mozambique Ridge is even less likely than the Agulhas Plateau to contain any significant continental component.
The remaining structures feature a broad range of overall relief extending from 1.30 km (the outer Voring Plateau) to 4.12 km (north
Kerguelen Plateau). Geoid/topography ratios range from a low of 0.34 m/km (Mid-Pacific Mountains) to 1.52 m/km (north Madagas- car Ridge). This oceanic plateau region includes recognized oceanic plateaus (for example, Shatsky Rise and Manihiki Plateau) and cooled volcanic remnants of hot spot activity (for example, Nine- tyeast Ridge and Chagos-Laccadive Ridge). Notably, this region also completely overlaps the small field containing the modified continental plateaus.
With few exceptions, the oceanic structures are reasonably well modeled by Airy-type compensation. However, as we did filter out signals resulting from lithospheric flexure, our geoid versus topogra- phy analysis cannot be used to determine which of these features may have been formed near spreading centers on young, hot lithosphere or intraplate on older, cooler lithosphere. The oceanic plateaus which have somewhat higher geoid/topography ratios include Nazca Ridge, Walvis Ridge, north Madagascar Ridge, and Crozet Plateau. In the case of the Nazca Ridge, the trace of a hot spot, this could reflect the last vestiges of thermal swell signal, although the age of this ridge,-30-45 Ma, is poorly determined [Cutler, 1977; Pilger and Handschumacher, 1981]. Casenave et al. [ 1980] have proposed that the Crozet Plateau is also the relatively recent product of intraplate (hot spot) volcanism based on lithospheric loading arguments, but this is disputed by Goslin and Patriat [1984], who argue that it is a shallowly compensated plateau of at least Eocene age. However, if these features are Airy compensated, they must have deep, high-density crustal roots. Indeed, Goslin and Sibuet [1975] find that an Airy model which includes an -25-km-deep crustal root with a density of 2950 kg/m 3 will satisfy gravity data from the eastern half of the Walvis Ridge (the principal component of our Walvis Ridge sampling). Seismic refraction and gravity data acquired over the north Madagascar Ridge suggest that the crust underlying this feature also has a high average density of 2910 kg/m 3 [Goslin et al., 1981 ].
Several of the plateaus have geoid/topography ratios which have been contaminated by signals from adjacent structures. For example, overlapping the high regional geoid signals associated with the Midway Swell, the Hess Rise not surprisingly exhibits a geoid/

7416 SANDWELL AND MACKENZIE: OCEAN GEOID HEIGHT VERSUS TOPOGRAPHY
_
0 VORI
SIER
AUST • MIDW -X•'CUVI -•'UNE
MARQ HESS • MOZA -X•'S KER • • -)/• ONTO
-,•ICE L WALV 0 •C AGUL • 0 0
CROZ
0 •s •M OCA.O • NIN • s T• BROK• PORC
m o 0 S NIN 0 •TU S•T • • OMANI
OUlD P
*- Thermal Swell
O- Oceanic Plateau
ß- Continental Plateau
[]- Modified Continental Plateau
')•'RIO G .)/•.S MAD
ON MAD
OCHAG
S MAS • ßCHAT ß NMAS
0 ßCAMP N KER IFALK
I I I
1.0 2.0 3.0 4.0 5.0
Plateau Height (km)
Fig. 9. Interpreted results of our study plotted as geoid/topography versus overall relief. Symbols are the same as in Figure 8. Areas with overly scattered results or exhibiting evidence of signal contamination have been omitted. The data generally fall into four broad categories (continental plateau, modified continental plateau, oceanic plateau, or thermal swell) depending upon geoid/topography ratio and overall relief. The derived plateau types are listed in Table 1 for comparison with published interpretations.
topography ratio considerably higher than that predicted for its •- 100- Ma age [Vallier et al., 1983]. The area selected to sample the north Mascarene Plateau accidentally overlapped the sediment-covered Dhow and VLCC fracture zones in the Somali Basin. With its •-40-
Ma age offset [Bunce and Molnar, 1977; J.-Y. Royer, personal communication, 1988], this fracture zone introduces a large negative geoid anomaly (Figure 7; relative geoid heights of less than 0 m), increasing the apparent geoid/topography ratio for the north Mascar- ene Plateau to 1.69 m/km from its true value of •-1.2 m/km.
Similarly, we believe that our estimate for the geoid/topography ratio for the Ontong Java Plateau is probably too high. This feature is undergoing collision with the Solomon Islands as manifested by the intense structural deformation and broad regional folding of its southwestern margin [Kroenke, 1984; Kroenke et al., 1986]. Flex- ural wavelengths associated with the bending of this old (95-110 Ma) oceanic lithosphere are likely to exceed our 400-km cutoff wavelength, adding an unintended flexural component to the crustal compensation signal.
The summary and interpretation of our geoid/topography analysis is shown in Figure 9 where the geoid/topography ratios are plotted as a function of plateau height. The seven areas having scattered geoid/ topography relationships were omitted, and the uncertainties in the geoid/topography ratios are also not shown. Each area was reclassified as a thermal swell, oceanic plateau, continental plateau, or modified continental plateau on the basis of its geoid/topography ratio and elevation. Since we were unable to distinguish an oceanic plateau from a modified continental plateau using this geoid/topography analysis, we categorized these features using previous studies. This geoid/topography analysis is most useful for identifying thermal swells having no recent volcanism.
CONCLUSIONS
1. A systematic analysis of 53 plateaus and swells shows that geoid height is linearly related to topography between wavelengths
of 400 and 4000 km as predicted by isostatic compensation models. Several of the smaller areas have a scattered relationship between geoid height and topography.
2. The geoid/topography ratio depends on the average depth of compensation. None of the 53 areas have geoid/topography ratios greater than 5 m/km. Since all ratios are less than the maximum ratio for the thermal swell model (4.3 m/km), we see no direct evidence for dynamic support of thermal swells. However, since we measure an average geoid/topography ratio, thermal swells could have a small component of dynamic support if this deeper compensation signature is averaged with a shallow signature. Using similar geoid/topogra- phy data along with heat flow data [Courtney and White, 1986] and flexural rigidity information, [McNutt, 1988] has shown that there must be a component of dynamic support beneath the Cape Verde Rise; we agree with these conclusions. Our data do not rule out dynamic support, but they do not require it either.
3. Most thermal swells have intermediate geoid/topography ratios which we interpret as a linear combination of the decaying thermal swell signature (with its minimal effect on average topogra- phy) and that of the persisting Airy-compensated volcanic edifice. While we are unable to separate these two effects, McNutt and Shure [1986] have shown that it is possible when all wavelengths of geoid height and topography are retained.
4. The relationship of geoid/topography ratio versus overall relief can be used to distinguish between three types of plateau structures: thermal swells, oceanic plateaus, and continental pla- teaus. A fourth type of plateau composed of extensively modified continental crust has geoid/topography ratios which cluster within the field associated with oceanic plateaus.
5. The ratio of geoid height to topography for Airy-compensated plateaus increases with the overall relief of the plateau. Our analysis shows this increase and therefore tends to confirm the Airy compen- sation model. Continental plateaus with overall relief greater than 4.2 km have roots that extend to depths of 25-35 km. Oceanic plateaus have lower relief (1.2-4.2 km) and, consequently, shallower

SANDWELL AND MACKENZIE: OCEAN GEOID HEIGHT VERSUS TOPOGRAPHY 7417
roots (15-25 km). Modified continental plateaus, presumably the product of crustal extension, exhibit intermediate relief (~3 km) with compensating roots extending to depths of 20-25 km.
Acknowledgments. We wish to thank Dave McAdoo and one anonymous reviewer for their constructive commentary. We also thank Jim Marsh for providing the gridded geoid data set and Dick Rapp for providing the spherical harmonic coefficients topography. This work was supported by The University of Texas at Austin and the NASA Geodynamics Program (NAG5-787). University of Texas Institute for Geophysics contribution 763.
REFERENCES
Adams, C., Age of the volcanoes and granite basement of the Auckland Islands, southwest Pacific, N. Z. J. Geol. Geophys., 26, 227-237, 1983.
Adams, C., and P. Robinson, Potassium-argon ages of schists from Chatham Island, New Zealand Plateau, southwest Pacific, N. Z. J. Geol. Geophys., 20, 287-301, 1977.
Allen, R., and B. Tucholke, Petrography and implications of continental rocks from the Agulhas Plateau, southwest Indian Ocean, Geology, 9, 463-468, 1981.
Angevine, C. L., and D. L. Turcotte, On the compensation mechanism of the Walvis Ridge, Geophys. Res. Lett., 7, 477-479, 1980.
Angevine, C. L., and D. L. Turcotte, Correlation of geoid and depth anomalies over the Agulhas Plateau, Tectonophysics, 100, 43-52, 1983.
Baker, B., and J. Miller, Geology and geochronology of the Seychelles Islands and structure of the floor of the Arabian Sea, Nature, 199, 346-359, 1963.
Barker, P., et al., Initial Reports of the Deep Sea Drilling Project, 36, U.S. Government Printing Office, Washington, D. C., 1977.
Ben-Avraham, Z., A. Nur, D. Jones, and A. Cox, Continental accretion: From oceanic plateaus to allochthonous terranes, Science, 213, 47-54, 1981.
Bott, M., J. Sunderland, and P. Smith, Evidence for continental crust beneath the Faeroe Islands, Nature, 248, 202-204, 1974.
Bunce, E., and P. Molnar, Seismic reflection profiling and basement topography in the Somali Basin: Possible fracture zones between Ma- dagascar and Africa, J. Geophys. Res., 82, 5305-5311, 1977.
Carlson, R., N. Christensen, and R. Moore, Anomalous crustal structures in ocean basins: Continental fragments and oceanic plateaus, Earth Planet. Sci. Lett., 51, 171-180, 1980.
Cazenave, A., B. Lago, K. Dominh, and K. Lambeck, On the response of the ocean lithosphere to seamount loads from GEOS 3 satellite altimeter observations, Geophys. J. R. Astron. Soc., 63, 233-252, 1980.
Cazenave, A., K. Dominh, M. Rabinowicz, and G. Ceuleneer, Geoid and depth anomalies over ocean swells and troughs: Evidence of an increas- ing trend of the geoid to depth ratio with age of plate, J. Geophys. Res., 93, 8064-8077, 1988.
Coleman, P., P. Michael, and J. Mutter, The origin of the Naturaliste Plateau, SE Indian Ocean: Implications from dredged basalts, J. Geol. Soc. Aust., 29, 457468, 1982.
Courtney, R. C., and R. S. White, Anomalous heat flow and geoid across the Cape Verde Rise: Evidence for dynamic support from a thermal plume in the mantle, Geophys. J. R. Astron. Soc., 87, 815-867, 1986.
Crough, S. T., Thermal origin of mid-plate hot-spot swells, Geophys. J. R. Astron. Soc., 55, 4451-4469, 1978.
Cutler, S., Geophysical investigation of the Nazca Ridge, M.Sc. thesis, Univ. of Hawaii, Honolulu, 1977.
Den, N., W. J. Ludwig, S. Murauchi, J. I. Ewing, H. Hotta, N. T. Edgar, T. Yoshii, T. Asanuma, K. Hagiwara, T. Sato, and S. Ando, Seismic refraction measurements in the northwest Pacific Basin, J. Geophys. Res., 74, 1421-1434, 1969.
Denison, R., and D. Coombs, Radiometric ages for some rocks from Snares and Auckland Islands, Campbell Plateau, Earth Planet. Sci. Lett., 34, 23-29, 1977.
Derrick, R. S., and S. T. Crough, Island subsidence, hot spots, and lithospheric thinning, J. Geophys. Res., 83, 1236-1244, 1978.
Derrick, R. S., J. G. Sclater, and J. Thiede, The subsidence of aseismic ridges, Earth Planet. Sci. Lett., 34, 185-196, 1977.
Derrick, R. S., R. P. Von Herzen, S. T. Crough, B. Epp, and U. Fehn, Heat flow on the Hawaiian Swell and lithospheric reheating, Nature, 292, 142-143, 1981.
Derrick, R. S., R. P. Von Herzen, B. Parsons, D. Sandwell, and M. Dougherty, Heat flow observations on the Bermuda Rise and thermal models of midplate swells, J. Geophys. Res., 91, 3701-3723, 1986.
Diament, M., and J. Goslin, Emplacement of the Marlon Dufresne, Lena and Ob seamounts (south Indian Ocean) from a study of isostasy, Tectonophysics, 121,253-262, 1986.
Dorman, L. M., and B. T. R. Lewis, Experimental isostasy, 1: Theory of the determination of the Earth's isostatic response to a concentrated load, J. Geophys. Res., 75, 3357-3365, 1970.
Duncan, R., Geochronology of basalts from the Ninetyeast Ridge and continental dispersion in the eastern Indian Ocean, J. Volcanol. Geoth- erm. Res., 4, 283-305, 1978.
Duncan, R., Hotspots in the southern oceans--An absolute frame of refer- ence for motion of the Gondwana continents, Tectonophysics, 74, 29-42, 1981.
Duncan, R., and D. Clague, Pacific plate motion recorded by linear volcanic chains, in The Ocean Basins and Margins, vol. 7A, The Pacific Ocean, edited by A. Naim, F. Stehli, and S. Uyeda, pp. 89-121, Plenum, New York, 1985.
Duncan, R. A., and I. MacDougall, Linear volcanism in French Polynesia, J. Volcanol. Geotherm. Res., 1,197-227, 1976.
Fischer, K., M. McNutt, and L. Shure, Thermal and mechanical constraints on the lithosphere beneath the Marquesas swell, Nature, 322,733-736, 1987.
Fowler, S., and D. P. McKenzie, Flexural studies of Exmouth and Rockall
Plateaux using SEASAT altimetry, Earth Planet. Sci. Lett., in press, 1989.
Francis, T., D. Davies, and M. Hill, Crustal structure between Kenya and the Seychelles, Philos. Trans. R. Soc. London, Ser. A, 259, 240-261, 1966.
Gamboa, L., and P. Rabinowitz, The evolution of the Rio Grande Rise in the southwest Atlantic Ocean, Mar. Geol., 58, 35-58, 1984.
Goslin, J., and M. Diament, Mechanical and thermal isostatic response of the Del Cano Rise and Crozet Bank (southern Indian Ocean) from altimetry data, Earth Planet. Sci. Lett., 84,285-294, 1987.
Goslin, J., and P. Patriat, Absolute and relative plate motions and hypotheses on the origin of five aseismic ridges in the Indian Ocean, Tectonophysics, 101,221-244, 1984.
Goslin, J., and J. Sibuet, Geophysical study of the easternmost Walvis Ridge, South Atlantic, Geol. Soc. Am. Bull., 86, 1713-1724, 1975.
Goslin, J., M. Recq, and R. Schlich, Structure profunde du Plateau de Madagascar: Relations avec le Plateau de Crozet, Tectonophysics, 76, 75-97, 1981.
Hales, A., and J. Nation, A seismic refraction study in the southern Indian Ocean, Bull. Seismol. Soc. Am., 63, 1951-1966, 1973.
Haxby, W. F., and D. L. Turcotte, On isostatic geoid anomalies, J. Geophys. Res., 83, 5473-5478, 1978.
Heezen, B. C., J. L. Matthews, R. Catalano, J. Natland, A. Coogan, M. Tharp, and M. Rawson, Western Pacific guyors, Initial Reports of the Deep Sea Drilling Project, 20, 653-724, 1973.
Heirtzler, J. R., M. Edwards and A. L. Dilonardo, Relief of the surface of the Earth, hemispheric images, Rep. MGG-2, Natl. Oceanic and Atmos. Admin., Boulder, Colo., 1986.
Houtz, R. E., South Tasman Basin and borderlands: A geophysical summary, Initial Reports of the Deep Sea Drilling Project, 29, 1135-1146, 1974.
Houtz, R., D. Hayes, and R. Markl, Kerguelen Plateau bathymetry, sediment distribution and crustal structure, Mar. Geol., 25, 95-130, 1977.
Hussong, D., L. Wipperman, and L. Kroenke, The crustal structure of the Ontong Java and Manihiki oceanic plateaus, J. Geophys. Res., 84, 6003-6010, 1979.
Kroenke, L., Solomon Islands: San Cristobal to Bougainville and Buka, Cenozoic Tectonic Development of the Southwest Pacific, Tech. Bull. 6, edited by L. Kroenke, pp. 47-61, U.N. ESCAP, United Nations Eco- nomic and Social Commission for Asia and the Pacific Committee for
Coordination of Joint Prospecting for Mineral Resources in South Pacific Offshore Areas, Bangkok, 1984.
Kroenke, L., J. Resig, and P. Cooper, Tectonics of the southeastern Solomon Islands: Formation of the Malaita Anticlinorium, in Geology and Offshore Resources of Pacific Island Arcs--Central and Western Solo- mon Islands Region, Earth Sci. Ser., vol. 4, edited by J. Vedder and D.

7418 SANDWELL AND MACKENZIE: OCEAN GEOID HEIGHT VERSUS TOPOGRAPHY
Tiffin, pp. 109-116, Circum-Pacific Council for Energy and Mineral Resources, 1986.
Kumar, N., Origin of "paired" aseismic rises: Ceara and Sierra Leone rises in the equatorial and the Rio Grande Rise and Walvis Ridge in the South Atlantic, Mar. Geol.,30, 175-191, 1979.
Larson, R. L., J. C. Mutter, J. B. Diebold, G. B. Carpenter, and P. Symonds, Cuvier Basin: A product of ocean crust formation by Early Cretaceous rifting off western Australia, Earth Planet. Sci. Lett., 45, 105-114, 1979.
Lawver, L. A., J. G. Sclater, and L. Meinke, Mesozoic and Cenozoic recon- structions of the South Atlantic, Tectonophysics, 114, 233-254, 1985.
MacKenzie, K., Crustal stratigraphy and realistic seismic data, Ph.D. thesis, 121 pp., Univ. of Calif., San Diego, 1984.
Mahoney, J., J. Macdougall, G. Lugmair and K. Gopalan, Kerguelen hot spot source for Rajmahal traps and Ninetyeast Ridge?, Nature, 303,385-389, 1983.
Marsh, J. G., A. C. Brenner, B. D. Beckley, and T. V. Martin, Global mean sea surface based on the Seasat altimeter data, J. Geophys. Res., 91, 3501-3506, 1986.
Mattey, D., Minor and trace element geochemistry of volcanic rocks from Truk, Ponape, and Kusaie, eastern Caroline Islands: Evolution of a young hot spot trace across old oceanic crust, Contrib. Mineral. Petrol., 80, 1-13, 1982.
McKenzie, D. P., A. B. Watts, B. Parsons, and M. Roufouse, Planform of mantle convection beneath the Pacific Ocean, Nature, 288, 442-446, 1980.
McNutt, M., Thermal and mechanical properties of the Cape Verde Rise, J. Geophys. Res., 93, 2784-2794, 1988.
McNutt, M., and L. Shure, Estimating compensation depth of the Hawaiian Swell with linear filters, J. Geophys. Res., 91, 13,915-13,923, 1986.
Mutter, J., M. Talwani, and P. Stoffa, Origin of seaward-dipping reflectors in oceanic crust off the Norwegian margin by "subaerial seafloor spreading," Geology, 10, 353-357, 1982.
Nur, A., and Z. Ben-Avraham, Oceanic plateaus, the fragmentation of continents, and mountain building, J. Geophys. Res., 87, 3644-3661, 1982.
Ockendon, J. R., and D. L. Turcotte, On the gravitational potential and field anomalies due to thin mass layers, Geophys. J. R. Astron. Soc., 48, 479-492, 1977.
Peirce, J., The northward motion of India since the Late Cretaceous, Geophys. J. R. Astron. Soc., 52,277-311, 1978.
Pelletier, B., A granodioritic drill core from the Flemish Cap, eastern Canadian continental margin, Can. J. Earth Sci., 8, 1499-1503, 1971.
Pilger, R., and D. Handschumacher, The fixed-hotspot hypothesis and origin of the Easter-Sala y Gomex-Nazca trace, Geol. Soc. Am. Bull., 92, 437-446, 1981.
Rabinowitz, P., and J. LaBrecque, The Mesozoic South Atlantic Ocean and evolution of its continental margins, J. Geophys. Res., 84, 5973-6001, 1979.
Rapp, R. H., Degree variances of the Earth's potential, topography and its isostatic compensation, Bull. Geod., 56, 84-94, 1982.
Roberts, D., D. Ardus, and R. Deamley, Pre-Cambrian rocks drilled from the Rockall Bank, Nature (London) Phys. Sci., 244, 21-23, 1973.
Sandwell, D. T., and K. A. Poehls, A compensation mechanism for the central Pacific, J. Geophys. Res., 85, 3751-3758, 1980.
Sandwell, D. T., and M. L. Renkin, Compensation of swells and plateaus in the North Pacific: No direct evidence for mantle convection, J. Geophys. Res., 93, 2775-2783, 1988.
Schlanger, S. O., J. F. Campbell, J. A. Haggerty, and L. Premoli-Silva, Cretaceous volcanism and Eocene failed atolls in the Radak Chain: Im-
plications for the geological history of the Marshall Islands (abstract), Eos, Trans. AGU, 62, 1075, 1981.
Scrutton, R. A., The crustal structure of Rockall Plateau microcontinent, Geophys. J. R. Astron. Soc., 27, 259-275, 1972.
Shor, G., H. Kirk, and H. Menard, Crustal structure of the Melanesian area, J. Geophys. Res., 76, 2562-2586, 1971.
Sinha, M., K. Louden, and B. Parsons, The crustal structure of the Madagas- car Ridge, Geophys. J. R. Astron. Soc., 66, 351-377, 1981.
Tucholke, B., R. Houtz, and D. Barrett, Continental crust beneath the Agulhas Plateau, southwest Indian Ocean, J. Geophys. Res., 86, 3791-3806, 1981.
Vallier, T. L., W. E. Dean, D. K. Rea, and J. Thiede, Geologic evolution of Hess Rise, central North Pacific Ocean, Geol. Soc. Am. Bull., 94, 1289-1307, 1983.
Van Wykhouse, R., SYNBAPS (Synthetic Bathymetric Profiling Systems), Tech. Rep. TR-233, Nav. Oceanogr. Office, Washington, D.C., 1973.
Vogt, P., Subduction and aseismic ridges, Nature, 241,189-191, 1973. Vogt, P., The Iceland phenomenon: Imprints of a hot spot on the ocean crust,
and implications for flow below the plates, in Geodynamics of Iceland and the North Atlantic Area, edited by L. Kristjansson, pp. 105-126, D. Reidel, Hingham, Mass., 1974.
Weertman, J., The creep strength of the Earth's mantle, Rev. Geophys., 8, 145-168, 1970.
Whitmarsh, R. B., J. J. Langford, J. S. Buckley, R. J. Bailey, and D. J. Blundell, The crustal structure beneath Porcupine Ridge as determined by explosion seismology, Earth Planet. Sci. Lett., 22, 197-204, 1974.
Winterer, E. L., Anomalies in the tectonic evolution of the Pacific, in The Geophysics of the Pacific Ocean Basin and Its Margins, edited by G.H. Sutton, M. H. Manghnani, R. Moberly, pp. 269-278, Am. Geophys. Union, Washington, D.C., 1976.
Winterer, E., P. Lonsdale, J. Matthews, and B. Rosendahl, Structure and acoustic stratigraphy of the Manihiki Plateau, Deep Sea Res., 21,793-814, 1974.
Winterer, E. L., and C. V. Metzler, Origin and subsidence of guyots in Mid- Pacific Mountains, J. Geophys. Res., 89, 9969-9979, 1984.
K. R. MacKenzie and D. T. Sandwell, Institute for Geophysics, University of Texas at Austin, 8701 North Mopac Boulevard, Austin, TX 78759.
K. R. MacKenzie and D. T. Sandwell, Institute for Geophysics, University of Texas at Austin, 8701 Mopac Boulevard, Austin, TX 78759.
(Received June 8, 1987; revised July 21, 1988;
accepted October 3, 1988.)