geoinformatics and cartographic analysis, based on ... · geoinformatics and cartographic analysis,...
TRANSCRIPT
DESERT
Desert Online at http://desert.ut.ac.ir
Desert 21-1 (2016) – 14-23
Geoinformatics and cartographic analysis, based on modeling and
mapping of the microclimate and groundwater flow
S. Zareiea, H. Khosravib*, A. Abolhasanic
a Institute of Earth Sciences, Saint Petersburg State University, Saint Petersburg, Russian Federation b Department of Arid and Mountainous Regions Reclamation, Faculty of Natural Resources, University of Tehran, Karaj,
Iran c Desert Management Dept., International Desert Research Center(IDRC), University of Tehran, Tehran, Iran
Received: 7 September 2015; Received in revised form: 5 March 2016; Accepted: 24 April 2016
Abstract
The study of the groundwater resources and their properties are very important due to the vast desert
areas and arid conditions. Given the current situation in Iran, the water supply is one of the most
important territorial and environmental problems. In this study, groundwater resources were surveyed
and mapped in Yazd Province and their properties were modeled to determine their effectiveness for
grazing and agricultural activities. The main objective of this study was to develop and establish
groundwater geoinformatics and cartographic monitoring of the meteorological data and groundwater
formation. Also, the climatic characteristics were evaluated as determinants parameters of groundwater
flow to measure its parameters variations. The thematic charts and geoinformatics maps were provided.
Profile software was used for modeling microclimate and groundwater flow’s parameters, like
groundwater level and moisture transfer for several decades. Priznak model was used for comparison
and multi-parameter analysis of specified profiles and their classification. Finally, different regions of
Yazd Province were mapped and classified with different degrees of possibility for grazing and
agricultural activities. Results showed that groundwater levels in the study territory are at depths ranging
from 40 to 145 m. According to the results, it was observed that the changes in groundwater level and
microclimate can be used to evaluate the land capability for grazing and agricultural activities.
Keywords: Yazd; Profile Software; Priznak; Groundwater; Modeling
1. Introduction
Geoinformatics is aimed at the development and
application of methods and concepts of computer
science for the study of spatial objects and
phenomena. Spatial relationships in
geoinformatics are considered as binding
elements. Development of geoinformatics is
achieved using creation of geoinformation
monitoring as a research tool (Kapralov et al.,
2004). Micro-watershed level planning requires
a host of interrelated information to be generated
and studied in relation to each other (Narmada et
Corresponding author. Tel.: +98 26 32223044,
Fax: +98 26 32249313.
E-mail address: [email protected]
al., 2015). Knowledge of groundwater conditions
is a prerequisite for integrated land and water
management (Batelaana et al., 2003). By
combining both land resources with water
resources using the GIS techniques, a composite
map on the Resource Potential Zones (RPZ) can
be created (Magesh et al., 2012; Narmada et al.,
2015). Groundwater prospect zones were
delineated through the integration of the
reclassified raster map layers of geomorphology,
slope percent, drainage buffer, geology,
landuse/land cover and soil texture using the
weighted overlay analysis in ArcGIS (Dinesan et
al., 2015). A key output of groundwater
resources study is useful information in
developing targeted management to reduce
Zareie et al. / Desert 21-1(2016) – 14-23 15
aquifer depletion and degradation (Switzman et
al., 2015.).
Using GIS and RS can study relationships
between groundwater and its related
hydrological factors to mapping the regional
groundwater potential (Oha et al., 2011). By
combination of water balance and flow models,
catchment turnover times and produce related
maps can be calculate based on the groundwater
discharge rates and flow parameters (Pacheco,
2015).
Formation of groundwater resources in Yazd
Province has to be studied in order to clarify the
prospects of using groundwater resources in the
region, which result in infrastructure
development in plains and mountain areas. At the
current time the water supply is the most
important issue in Iran, as the significantly low
amount of precipitations below the world
average are observed in desert, hot and dry areas.
Desert lands occupy more than 50% of Yazd
Province, and the low amount of annual
precipitations have been reported (Negaresh and
Fallahian, 2010). Based on the general statistics
reports of the country, Yazd is designated as a
point of low precipitations. Currently, limited
water resources, reduction of aquifer levels and
drought are the main problems of natural
resources management in Yazd. In semi-arid and
arid areas, groundwater and agricultural water
use are two critical and closely interrelated
hydrological processes (Tian et al., 2015). The
object of this study is to characterize
groundwater dynamics and the factors affecting
groundwater flow. Improving irrigation
efficiency can increase groundwater levels and
thus will follow the development of the
agricultural industry (Berim Nezad and Paykani,
2004). Relevance and the practical importance of
the microclimate and groundwater flow
modeling in Yazd Province determined by
necessity: 1) Territorial separation with different
provision groundwater and comparative
evaluation of possibilities for the development of
animal husbandry, 2) Assess the resource
potential of bio-components of the landscape.
Understanding the distribution of groundwater
levels and quantifying the contribution of
groundwater to be important for managing and
protecting the surface water resources
(Cartwright and Gilfedder, 2015; Zarutsky and
Krasilnikova, 1989). Variations in groundwater
inflows are related to geology and topography.
Hydrogeological mapping of groundwater
resources is one of the main tools for the
controlled development of groundwater
resources. Remote sensing data with their
synoptic view and repetitive coverage provide
more meaningful information on terrain
parameters such as geology, landforms, land use
and soil condition and other physical parameters
of the study area. Integrated remote sensing and
GIS are widely used in groundwater mapping.
Remotely sensed surface indicators of
groundwater provide useful data where practical
classical alternatives are not available (Fathy,
2012; Nobre et al., 2007). The nature of remote
sensing-based groundwater exploration is to
delineate all possible features connected with
localization of groundwater (García-Gil et al.,
2015; Vershinin et al., 2005). The produced
groundwater maps can serve in land and
groundwater development planning (Ozdemir,
2011).
The main aims of this study were to develop
and establish groundwater geoinformatics, to
characterize the factors affecting groundwater
flow and modeling groundwater flow; and to
evaluate the different water resources
management via the modeling (Tian et al., 2015).
2. Materials and Methods
2.1. The study area
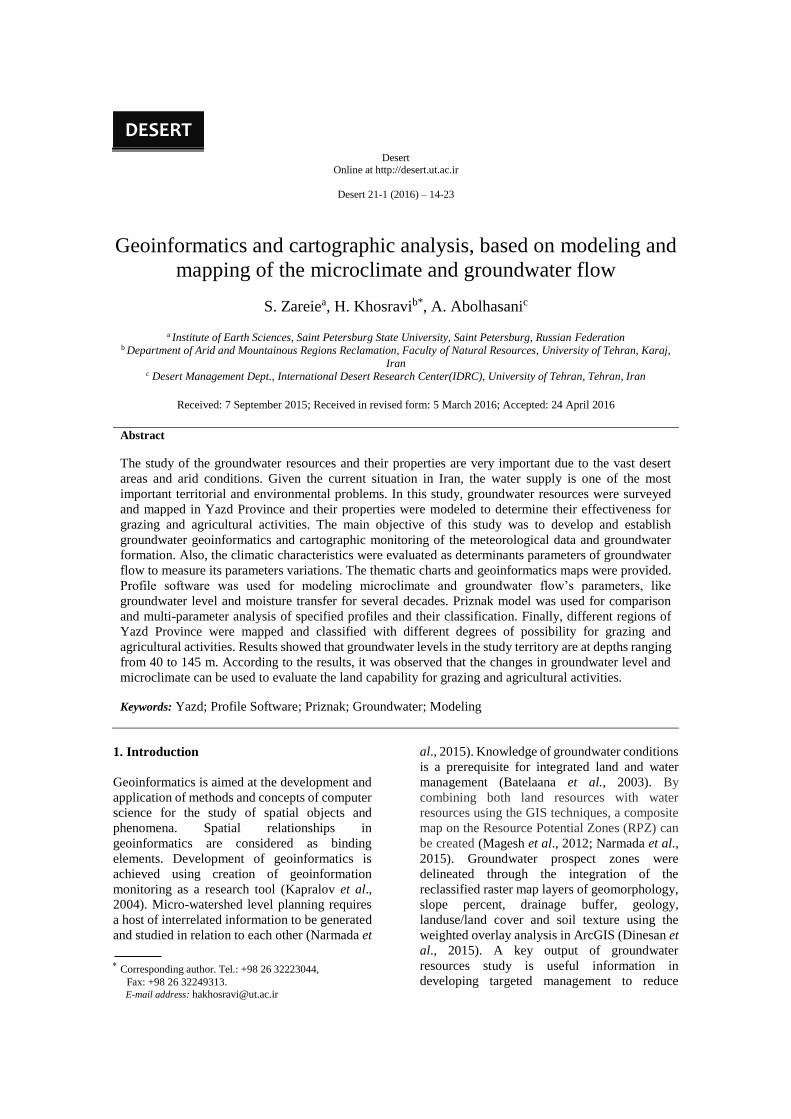
The study area is the western half of Yazd
Province in center of Iran, that is located in
29˚40'-33˚40' north latitude and 52˚52'-57˚50'
east longitude (Fig. 1). Yazd is located in a belt
of arid and semi-arid areas in the northern
Hemisphere. The power of wind erosion is one of
the most important factors changing the
landforms of area. Yazd is one of the provinces
with the lowest precipitation in Iran, since the
average annual amount of precipitations is only
61.02 mm (Omidvar, 2006). Temperature
seasonal and diurnal fluctuations are very high.
The maximum temperature of Yazd province has
been recorded in July about 45°C and the
minimum temperature has been recorded in
January about -20°C (Omidvar, 2006). Low
amount of precipitations, high temperature
variations, high evaporation rates and deep
groundwater level define the unfavorable
climatic conditions for plants communities’
biomass. Most lands in the province are not
suitable for agricultural activities due to the
excessive amount of salt and alkaline minerals in
area. Surface horizons of soils are salt and
gypsum deposits. Based on the above factors the
climate of the region is classified as arid and
semi-arid area.
Zareie et al. / Desert 21-1(2016) – 14-23 16
Fig.1. Location of Yazd province in Iran
2.2. Methodology
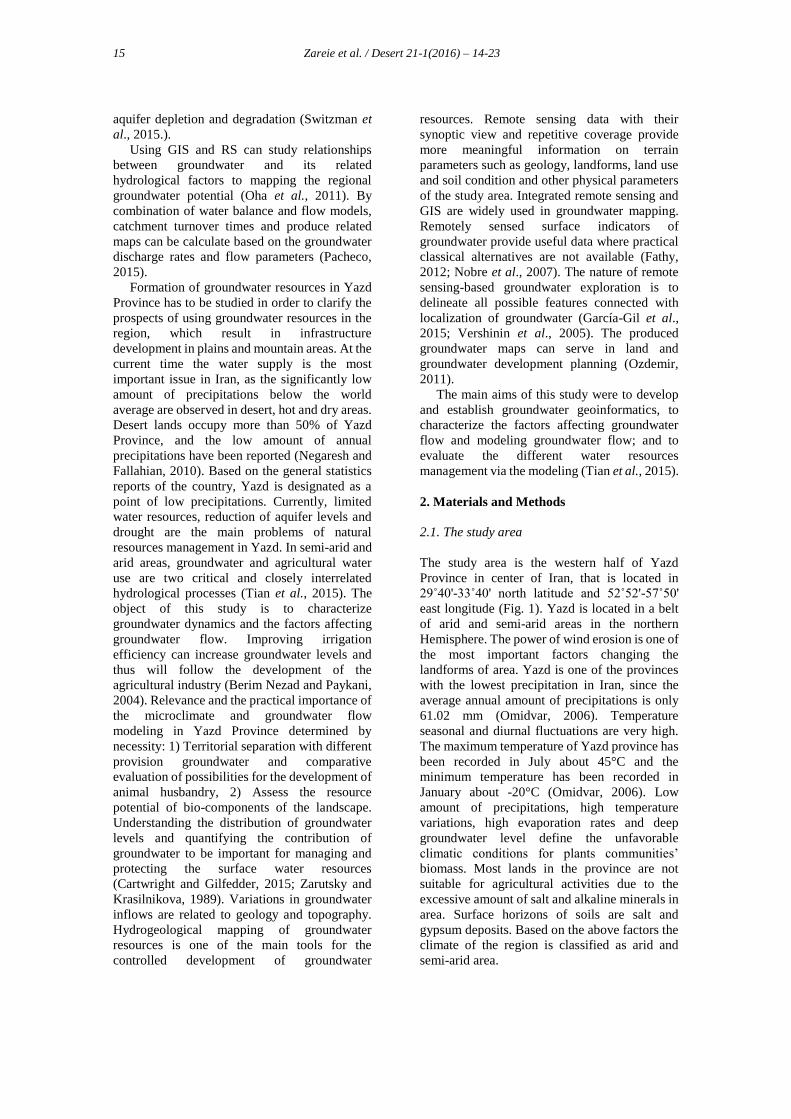
A topographic map of Iran with scale 1: 500,000
was used as a cartographic basis. After scanning
topographic map, cartographic base and thematic
layers were created in ArcGIS program. The
required images were created using trapeziums
H-39-A, H-39-B, H-40-A and H-40-B (Fig. 2).
Fig. 2. Cartographic basis of modeled territory
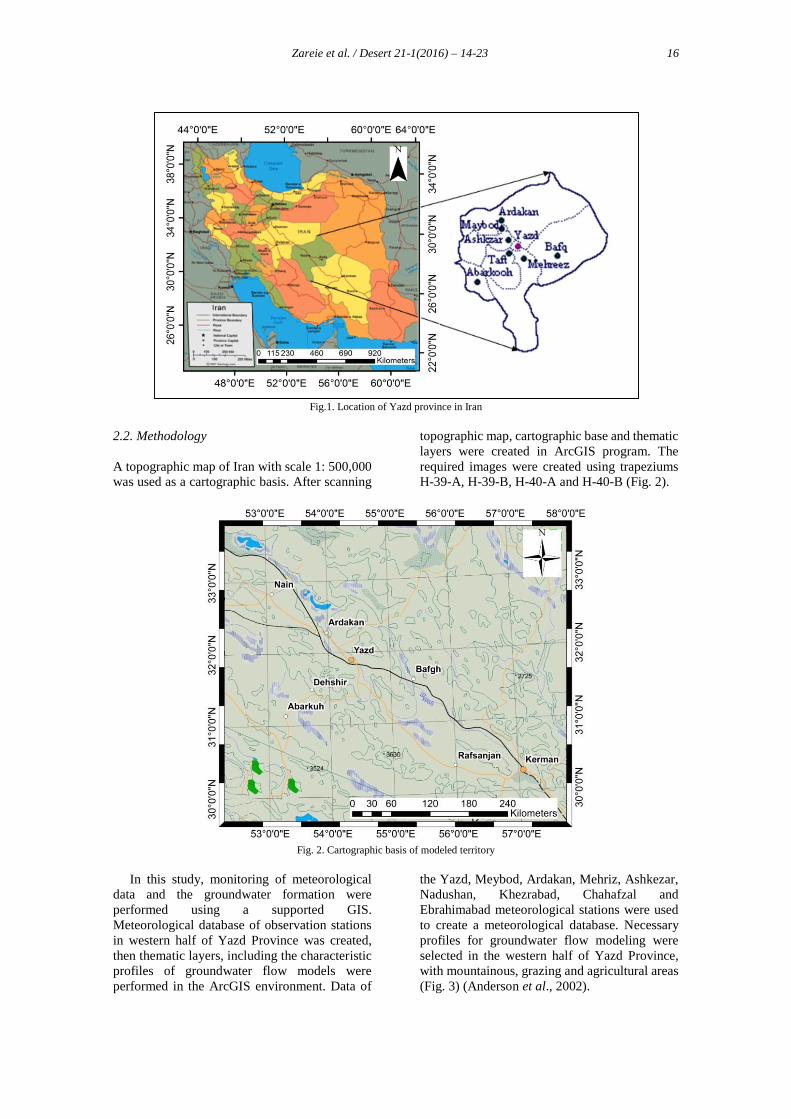
In this study, monitoring of meteorological
data and the groundwater formation were
performed using a supported GIS.
Meteorological database of observation stations
in western half of Yazd Province was created,
then thematic layers, including the characteristic
profiles of groundwater flow models were
performed in the ArcGIS environment. Data of
the Yazd, Meybod, Ardakan, Mehriz, Ashkezar,
Nadushan, Khezrabad, Chahafzal and
Ebrahimabad meteorological stations were used
to create a meteorological database. Necessary
profiles for groundwater flow modeling were
selected in the western half of Yazd Province,
with mountainous, grazing and agricultural areas
(Fig. 3) (Anderson et al., 2002).
Zareie et al. / Desert 21-1(2016) – 14-23 17
Fig. 3. Profiles of groundwater flow
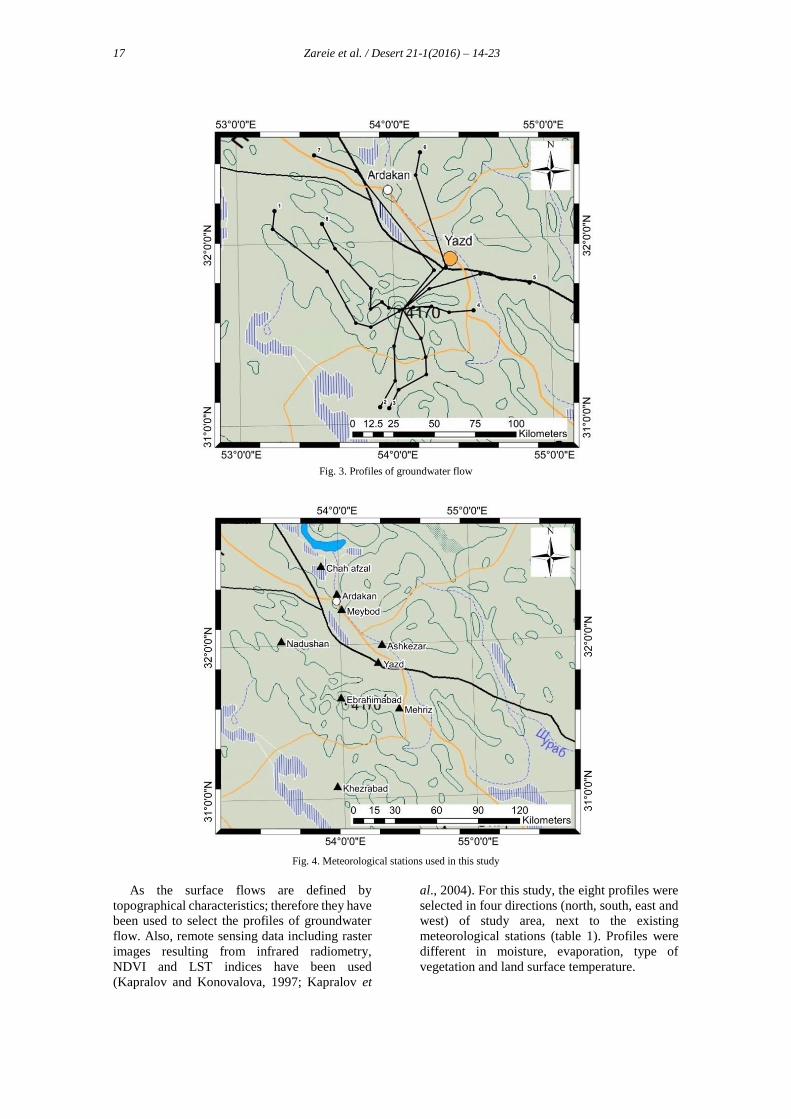
Fig. 4. Meteorological stations used in this study
As the surface flows are defined by
topographical characteristics; therefore they have
been used to select the profiles of groundwater
flow. Also, remote sensing data including raster
images resulting from infrared radiometry,
NDVI and LST indices have been used
(Kapralov and Konovalova, 1997; Kapralov et
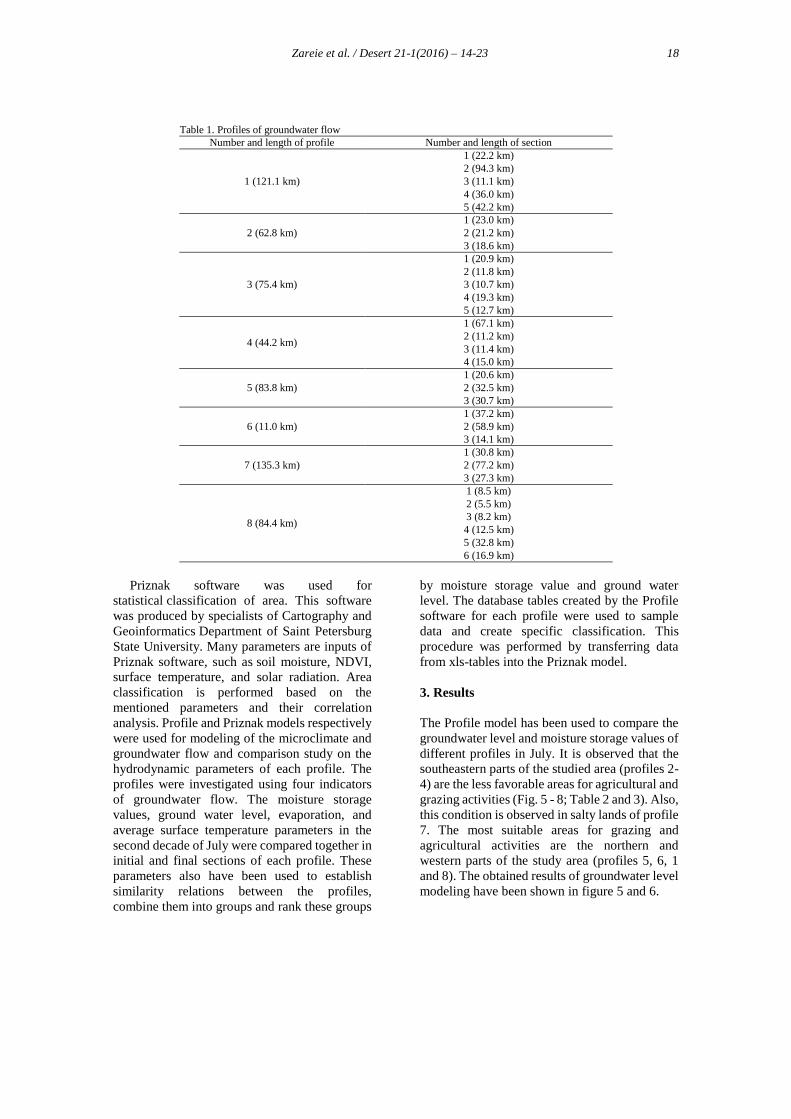
al., 2004). For this study, the eight profiles were
selected in four directions (north, south, east and
west) of study area, next to the existing
meteorological stations (table 1). Profiles were
different in moisture, evaporation, type of
vegetation and land surface temperature.
Zareie et al. / Desert 21-1(2016) – 14-23 18
Table 1. Profiles of groundwater flow
Number and length of profile Number and length of section
1 (121.1 km)
1 (22.2 km)
2 (94.3 km)
3 (11.1 km)
4 (36.0 km)
5 (42.2 km)
2 (62.8 km)
1 (23.0 km)
2 (21.2 km)
3 (18.6 km)
3 (75.4 km)
1 (20.9 km)
2 (11.8 km)
3 (10.7 km)
4 (19.3 km)
5 (12.7 km)
4 (44.2 km)
1 (67.1 km)
2 (11.2 km)
3 (11.4 km)
4 (15.0 km)
5 (83.8 km)
1 (20.6 km)
2 (32.5 km)
3 (30.7 km)
6 (11.0 km)
1 (37.2 km)
2 (58.9 km)
3 (14.1 km)
7 (135.3 km)
1 (30.8 km)
2 (77.2 km)
3 (27.3 km)
8 (84.4 km)
1 (8.5 km)
2 (5.5 km)
3 (8.2 km)
4 (12.5 km)
5 (32.8 km)
6 (16.9 km)
Priznak software was used for
statistical classification of area. This software
was produced by specialists of Cartography and
Geoinformatics Department of Saint Petersburg
State University. Many parameters are inputs of
Priznak software, such as soil moisture, NDVI,
surface temperature, and solar radiation. Area
classification is performed based on the
mentioned parameters and their correlation
analysis. Profile and Priznak models respectively
were used for modeling of the microclimate and
groundwater flow and comparison study on the
hydrodynamic parameters of each profile. The
profiles were investigated using four indicators
of groundwater flow. The moisture storage
values, ground water level, evaporation, and
average surface temperature parameters in the
second decade of July were compared together in
initial and final sections of each profile. These
parameters also have been used to establish
similarity relations between the profiles,
combine them into groups and rank these groups
by moisture storage value and ground water
level. The database tables created by the Profile
software for each profile were used to sample
data and create specific classification. This
procedure was performed by transferring data
from xls-tables into the Priznak model.
3. Results
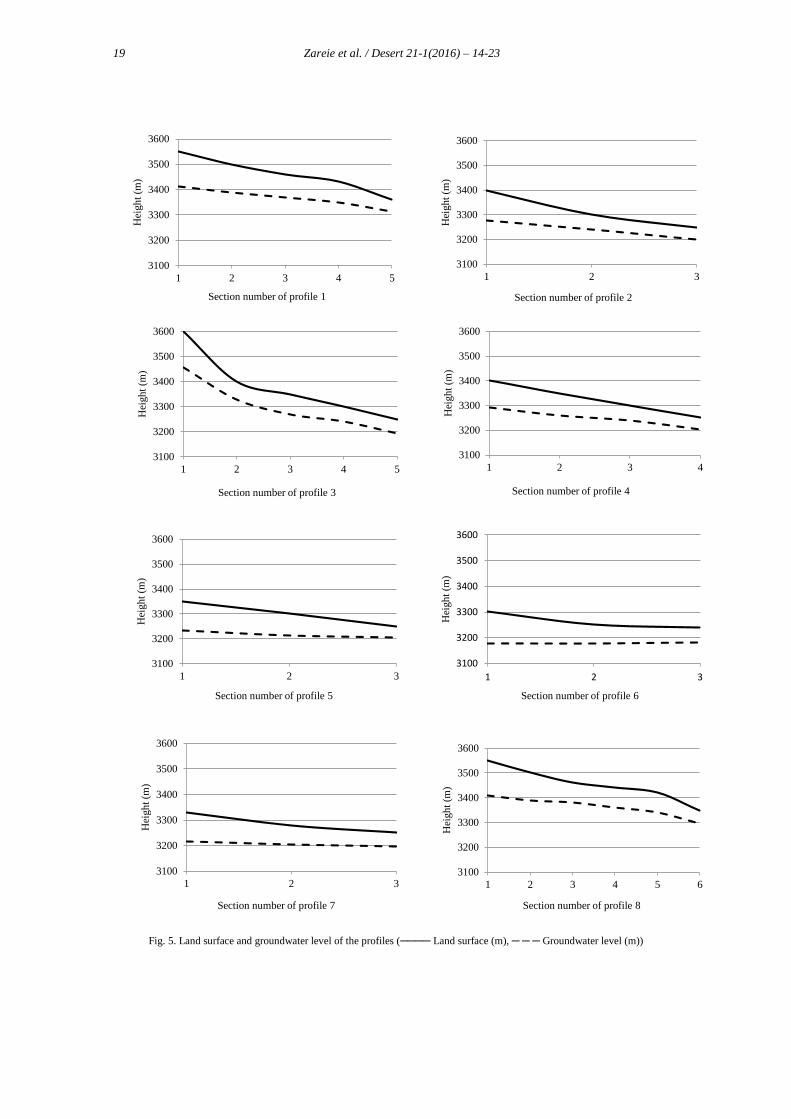
The Profile model has been used to compare the
groundwater level and moisture storage values of
different profiles in July. It is observed that the
southeastern parts of the studied area (profiles 2-
4) are the less favorable areas for agricultural and
grazing activities (Fig. 5 - 8; Table 2 and 3). Also,
this condition is observed in salty lands of profile
7. The most suitable areas for grazing and
agricultural activities are the northern and
western parts of the study area (profiles 5, 6, 1
and 8). The obtained results of groundwater level
modeling have been shown in figure 5 and 6.
Zareie et al. / Desert 21-1(2016) – 14-23 19
Fig. 5. Land surface and groundwater level of the profiles (──── Land surface (m), ─ ─ ─ Groundwater level (m))
3100
3200
3300
3400
3500
3600
1 2 3 4 5
Hei
gh
t (m
)
Section number of profile 3
3100
3200
3300
3400
3500
3600
1 2 3 4
Hei
gh
t (m
)
Section number of profile 4
3100
3200
3300
3400
3500
3600
1 2 3
Hei
gh
t (m
)
Section number of profile 5
3100
3200
3300
3400
3500
3600
1 2 3
Hei
gh
t (m
)
Section number of profile 6
3100
3200
3300
3400
3500
3600
1 2 3
Hei
gh
t (m
)
Section number of profile 7
3100
3200
3300
3400
3500
3600
1 2 3 4 5 6
Hei
gh
t (m
)
Section number of profile 8
3100
3200
3300
3400
3500
3600
1 2 3 4 5
Hei
gh
t (m
)
Section number of profile 1
3100
3200
3300
3400
3500
3600
1 2 3
Hei
gh
t (m
)
Section number of profile 2
Zareie et al. / Desert 21-1(2016) – 14-23 20
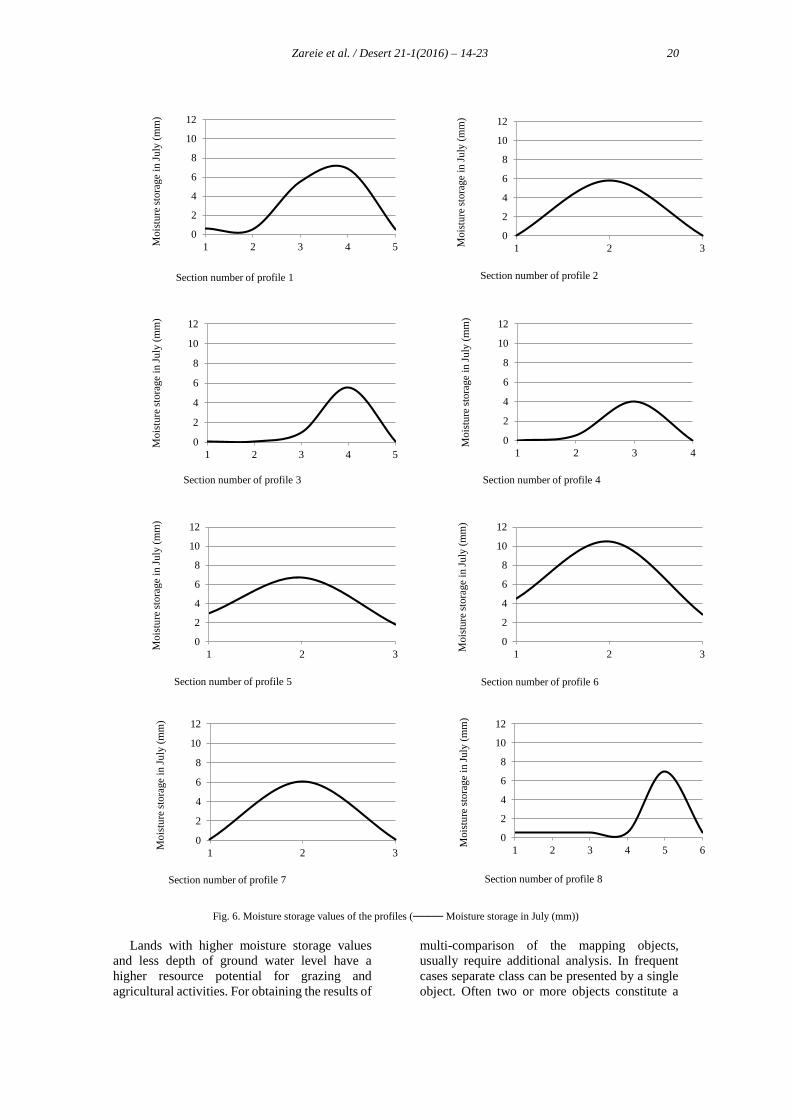
Fig. 6. Moisture storage values of the profiles (──── Moisture storage in July (mm))
Lands with higher moisture storage values
and less depth of ground water level have a
higher resource potential for grazing and
agricultural activities. For obtaining the results of
multi-comparison of the mapping objects,
usually require additional analysis. In frequent
cases separate class can be presented by a single
object. Often two or more objects constitute a
0
2
4
6
8
10
12
1 2 3 4 5Mois
ture
sto
rage
in J
uly
(m
m)
Section number of profile 1
0
2
4
6
8
10
12
1 2 3Mois
ture
sto
rage
in J
uly
(m
m)
Section number of profile 2
0
2
4
6
8
10
12
1 2 3 4 5
Mois
ture
sto
rage
in J
uly
(m
m)
Section number of profile 3
0
2
4
6
8
10
12
1 2 3 4M
ois
ture
sto
rage
in J
uly
(m
m)
Section number of profile 4
0
2
4
6
8
10
12
1 2 3
Mois
ture
sto
rage
in J
uly
(m
m)
Section number of profile 5
0
2
4
6
8
10
12
1 2 3
Mois
ture
sto
rage
in J
uly
(m
m)
Section number of profile 6
0
2
4
6
8
10
12
1 2 3
Mois
ture
sto
rage
in J
uly
(m
m)
Section number of profile 7
0
2
4
6
8
10
12
1 2 3 4 5 6
Mois
ture
sto
rage
in J
uly
(m
m)
Section number of profile 8
Zareie et al. / Desert 21-1(2016) – 14-23 21
separate class and object classes intersect this
means that the detected objects as belonging to
one and to the other class (there is a transition
class). In such cases, the mapping objects are
ranked according to the most important sign.
Data obtained by the Profile software for each
profile, created specific classification and
transferring data from xls-tables into the Priznak
model used for multi criteria analysis have been
described in tables 2 and 3.These data were
transferred to the final tables in ArcGIS to build
the respective layers of maps.
Table 2. Data of initial sections for comparative analysis of profiles
Profile number Moisture storage (mm) Bedding depth of ground waters (m) Pasture and agricultural conditions
6 2.82 60 Most favorable
5 1.80 43
1 0.54 45 Slightly favorable
8 0.54 55
7 0.09 55
Not favorable 2 0.08 48
3 0.07 58
4 0 45
Table 3. Data of final sections for comparative analysis of profiles
Profile number Moisture storage (mm) Bedding depth of ground waters (m) Pasture and agricultural conditions
6 4.52 124 Most favorable
5 3.01 117 Favorable
1 0.59 138 Slightly favorable
8 0.59 141
7 0.1 116
Not favorable 2 0.09 125
3 0.09 144
4 0 108
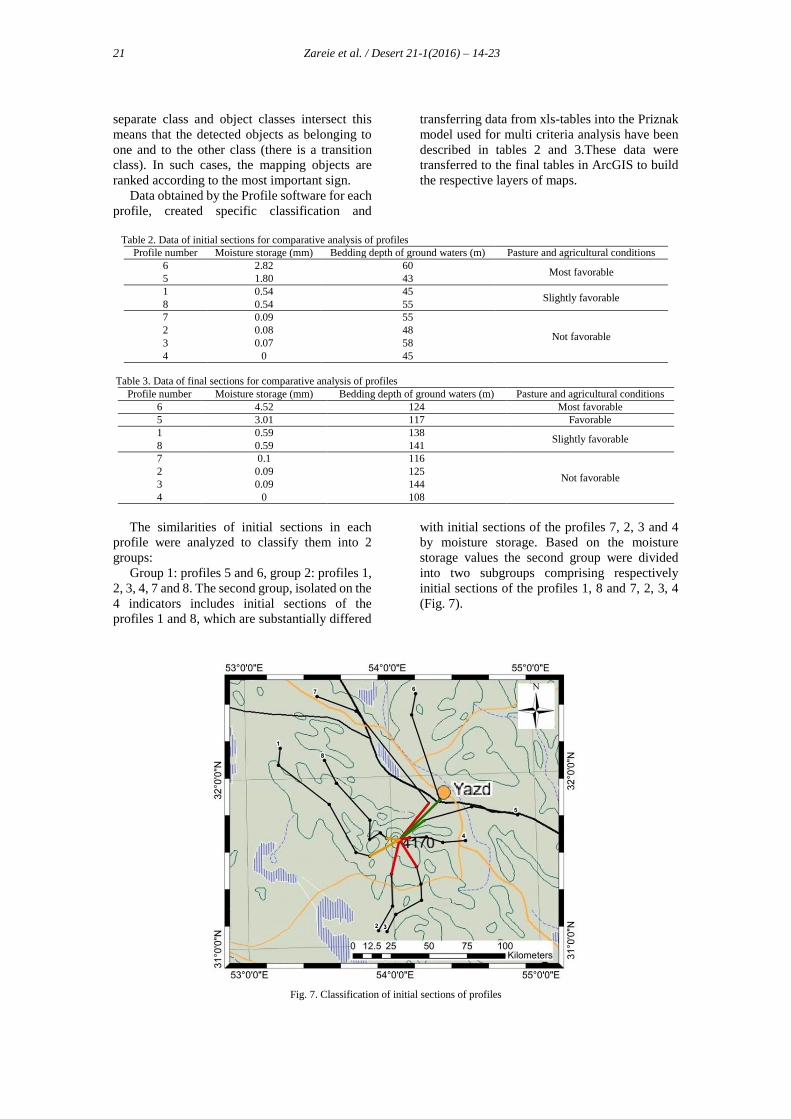
The similarities of initial sections in each
profile were analyzed to classify them into 2
groups:
Group 1: profiles 5 and 6, group 2: profiles 1,
2, 3, 4, 7 and 8. The second group, isolated on the
4 indicators includes initial sections of the
profiles 1 and 8, which are substantially differed
with initial sections of the profiles 7, 2, 3 and 4
by moisture storage. Based on the moisture
storage values the second group were divided
into two subgroups comprising respectively
initial sections of the profiles 1, 8 and 7, 2, 3, 4
(Fig. 7).
Fig. 7. Classification of initial sections of profiles
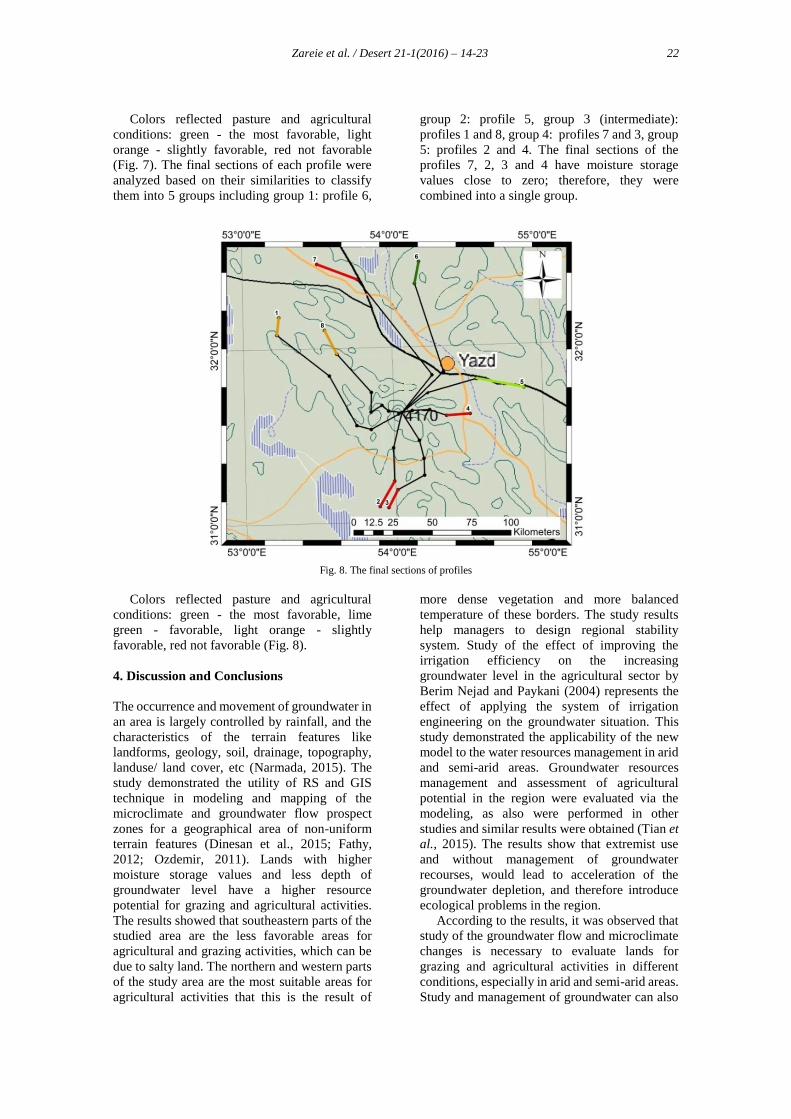
Zareie et al. / Desert 21-1(2016) – 14-23 22
Colors reflected pasture and agricultural
conditions: green - the most favorable, light
orange - slightly favorable, red not favorable
(Fig. 7). The final sections of each profile were
analyzed based on their similarities to classify
them into 5 groups including group 1: profile 6,
group 2: profile 5, group 3 (intermediate):
profiles 1 and 8, group 4: profiles 7 and 3, group
5: profiles 2 and 4. The final sections of the
profiles 7, 2, 3 and 4 have moisture storage
values close to zero; therefore, they were
combined into a single group.
Fig. 8. The final sections of profiles
Colors reflected pasture and agricultural
conditions: green - the most favorable, lime
green - favorable, light orange - slightly
favorable, red not favorable (Fig. 8).
4. Discussion and Conclusions
The occurrence and movement of groundwater in
an area is largely controlled by rainfall, and the
characteristics of the terrain features like
landforms, geology, soil, drainage, topography,
landuse/ land cover, etc (Narmada, 2015). The
study demonstrated the utility of RS and GIS
technique in modeling and mapping of the
microclimate and groundwater flow prospect
zones for a geographical area of non-uniform
terrain features (Dinesan et al., 2015; Fathy,
2012; Ozdemir, 2011). Lands with higher
moisture storage values and less depth of
groundwater level have a higher resource
potential for grazing and agricultural activities.
The results showed that southeastern parts of the
studied area are the less favorable areas for
agricultural and grazing activities, which can be
due to salty land. The northern and western parts
of the study area are the most suitable areas for
agricultural activities that this is the result of
more dense vegetation and more balanced
temperature of these borders. The study results
help managers to design regional stability
system. Study of the effect of improving the
irrigation efficiency on the increasing
groundwater level in the agricultural sector by
Berim Nejad and Paykani (2004) represents the
effect of applying the system of irrigation
engineering on the groundwater situation. This
study demonstrated the applicability of the new
model to the water resources management in arid
and semi-arid areas. Groundwater resources
management and assessment of agricultural
potential in the region were evaluated via the
modeling, as also were performed in other
studies and similar results were obtained (Tian et
al., 2015). The results show that extremist use
and without management of groundwater
recourses, would lead to acceleration of the
groundwater depletion, and therefore introduce
ecological problems in the region.
According to the results, it was observed that
study of the groundwater flow and microclimate
changes is necessary to evaluate lands for
grazing and agricultural activities in different
conditions, especially in arid and semi-arid areas.
Study and management of groundwater can also
Zareie et al. / Desert 21-1(2016) – 14-23 23
improve irrigation efficiency, because can
increase the groundwater level in a long time and
thus will follow the development of the
agricultural industry. According to the results,
localization of groundwater and modeling their
levels are important for managing the surface
water resources. Mapping of groundwater
resources is one of the main tools for the
controlled development of groundwater
resources.
Based on the analysis of initial data, which
were used to solve the problems of modeling and
interpretation in this study, it was considered that
Profile and Priznak models are suitable to study
the microclimate and groundwater flow,
mapping agricultural potential areas. Fresh water
was not observed in the mapping territory, except
temporary streams formed during rain floods.
Also, iced water was not observed in the surface
horizons of soils, while they are frozen due to
negative night temperatures in winter.
Groundwater levels were observed at depths
ranging from 40 to 145 m in the study territory,
and it can significantly reduce access to fresh
water, even by constructing aqueduct. Based on
the results, the studied area is generally not
favorable for grazing and agricultural activities
and seems to be unpromising.
References
Anderson. E. I., 2002. Conformal mapping of
groundwater flow fields with internal boundaries.
Advances in Water Resources, 25; 279–291.
Batelaana, O., F. De Smedta, L. Triestb, 2003. Regional
groundwater discharge: phreatophyte mapping,
groundwater modelling and impact analysis of land-
use change. Journal of Hydrology, 275; 86–108.
BerimNezad, V., G.R. Paykani, 2004. The effect of
improving the irrigation efficiency on the increasing
groundwater level in the agricultural sector.
Agricultural Economics and Development, 47; 69-
94.
Cartwright, I., B. Gilfedder, 2015. Mapping and
quantifying groundwater inflows to Deep Creek
(Maribyrnong catchment, SE Australia) using
222Rn, implications for protecting groundwater-
dependent ecosystems. Applied Geochemistry, 52;
118–129.
Dinesan, V.P., M.K. Girish Gopinath, Ashitha, 2015.
Application of Geoinformatics for the Delineation of
Groundwater Prospects Zones- A Case Study for
Melattur Grama Panchayat in Kerala, India. Aquatic
Procedia, 4; 1389–1396.
Fathy, A., 2012. Mapping of groundwater prospective
zones using remote sensing and GIS techniques: A
case study from the Central Eastern Desert, Egypt.
Journal of African Earth Sciences, 70; 8–17.
García-Gil, A., E. Vazquez-Sune, M.M. Alcaraz, A.S.
Juan, J.A. Sanchez-Navarro, M. Montlle, G.
Rodríguez, J. Lao, 2015. GIS-supported mapping of
low-temperature geothermal potential taking
groundwater flow into account. Renewable Energy,
77; 268-278.
Tikunova V.S., (Eds.), 2004. Basics of Geoinformatics:
textbook guide. Center Academy, Moscow, 352 p.
Kapralov, E.G., N.V. Konovalova, 1997. Introduction to
GIS: textbook guide. GIS Association, 155 p.
Magesh, N.S., N. Chandrasekar, J. Prince
Soundranayagam, 2012. Delineation of groundwater
potential zones in Theni district, Tamil Nadu, using
remote sensing, GIS and MIF techniques.
Geoscience Frontiers, 3(2); 189-196.
Narmada, K., K. Gobinath, G. Bhaskaran, 2015. An
Assessment of Resource Potentials for Sustainable
Development of Micro-watershed in Tirunelveli
District Using Geoinformatics– A Case of Nambiyar
Micro-watershed in Tirunelveli District, Tamil
Nadu, India. Aquatic Procedia, 4; 1299–1306.
Negaresh, H., H. Fallahian Firouzabad, 2010. The Study
of Negative Effects of Wind Morph dynamic
Activities in Khezer Abad Region of Yazd. 4th
International Congress of the Islamic World
Geographers (ICIWG), 14-16 April, Zahedan, Iran.
Nobre, R.C.M., O.C. Rotunno Filho, W.J. Mansur, M.
Nobre, C.A.N. Cosenza, 2007. Groundwater
vulnerability and risk mapping using GIS, modeling
and a fuzzy logic tool. Journal of Contaminant
Hydrology, 94; 277–292.
Oha, H.J., Y.S. Kim, J.K. Choi, E. Park, S. Lee, 2011. GIS
mapping of regional probabilistic groundwater
potential in the area of Pohang City, Korea. Journal
of Hydrology, 399; 158–172.
Omidvar, K., 2006. A study on the temporal- spatial
chances for precipitation enhancement in Yazd
province. Quarterly Research Bulletin of Isfahan
University (Humanities), 20(1); 93-120.
Ozdemir, A., 2011. GIS-based groundwater spring
potential mapping in the Sultan Mountains (Konya,
Turkey) using frequency ratio, weights of evidence
and logistic regression methods and their
comparison. Journal of Hydrology, 411; 290–308.
Pacheco, F.A.L., 2015. Regional groundwater flow in
hard rocks. Science of the Total Environment, 506;
182–195.
Switzman, H., P. Coulibaly, Z. Adeel, 2015. Modeling the
impacts of dryland agricultural reclamation on
groundwater resources in Northern Egypt using
sparse data. Journal of Hydrology, 520; 420–438.
Tian, Y., Y. Zheng, B. Wu, X. Wu, J. Liu, C. Zheng, 2015.
Modeling surface water-groundwater interaction in
arid and semi-arid regions with intensive
agriculture. Environmental Modelling & Software,
63; 170–184.
Dmitriev, V.V., (Eds.), 2005. Microclimate, groundwater
flow and mass transfer modeling. Theory and
practice collection of ecological and geographical
studies. Saint Petersburg, pp. 250-262.
Zarutsky I.P., N.V. Krasilnikova, 1989. Maps designing
and forming. Nature maps, MSU press, 206 p.