geol100 homework hot spot volcanism in … homework hot spot volcanism in western north america part...
TRANSCRIPT
GEOL100 Homework Hot spot volcanism in western North America
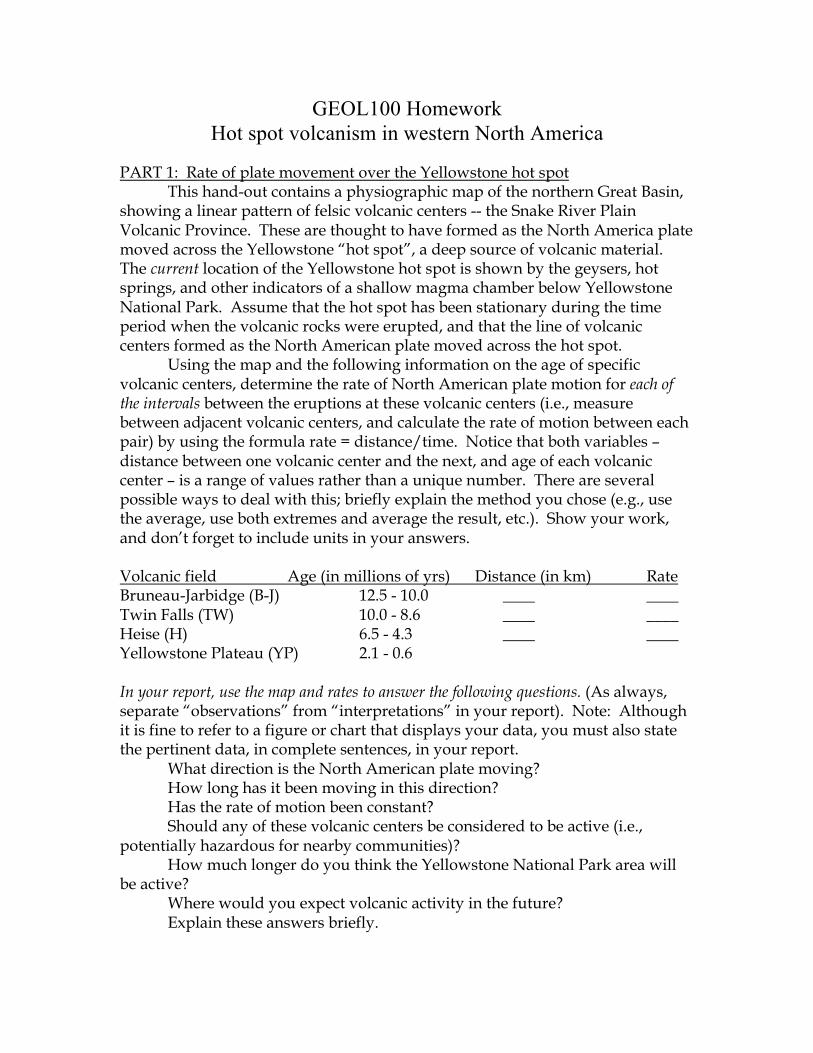
PART 1: Rate of plate movement over the Yellowstone hot spot This hand-out contains a physiographic map of the northern Great Basin, showing a linear pattern of felsic volcanic centers -- the Snake River Plain Volcanic Province. These are thought to have formed as the North America plate moved across the Yellowstone “hot spot”, a deep source of volcanic material. The current location of the Yellowstone hot spot is shown by the geysers, hot springs, and other indicators of a shallow magma chamber below Yellowstone National Park. Assume that the hot spot has been stationary during the time period when the volcanic rocks were erupted, and that the line of volcanic centers formed as the North American plate moved across the hot spot. Using the map and the following information on the age of specific volcanic centers, determine the rate of North American plate motion for each of the intervals between the eruptions at these volcanic centers (i.e., measure between adjacent volcanic centers, and calculate the rate of motion between each pair) by using the formula rate = distance/time. Notice that both variables – distance between one volcanic center and the next, and age of each volcanic center – is a range of values rather than a unique number. There are several possible ways to deal with this; briefly explain the method you chose (e.g., use the average, use both extremes and average the result, etc.). Show your work, and don’t forget to include units in your answers. Volcanic field Age (in millions of yrs) Distance (in km) Rate Bruneau-Jarbidge (B-J) 12.5 - 10.0 ____ ____ Twin Falls (TW) 10.0 - 8.6 ____ ____ Heise (H) 6.5 - 4.3 ____ ____ Yellowstone Plateau (YP) 2.1 - 0.6 In your report, use the map and rates to answer the following questions. (As always, separate “observations” from “interpretations” in your report). Note: Although it is fine to refer to a figure or chart that displays your data, you must also state the pertinent data, in complete sentences, in your report. What direction is the North American plate moving? How long has it been moving in this direction? Has the rate of motion been constant? Should any of these volcanic centers be considered to be active (i.e., potentially hazardous for nearby communities)? How much longer do you think the Yellowstone National Park area will be active? Where would you expect volcanic activity in the future? Explain these answers briefly.

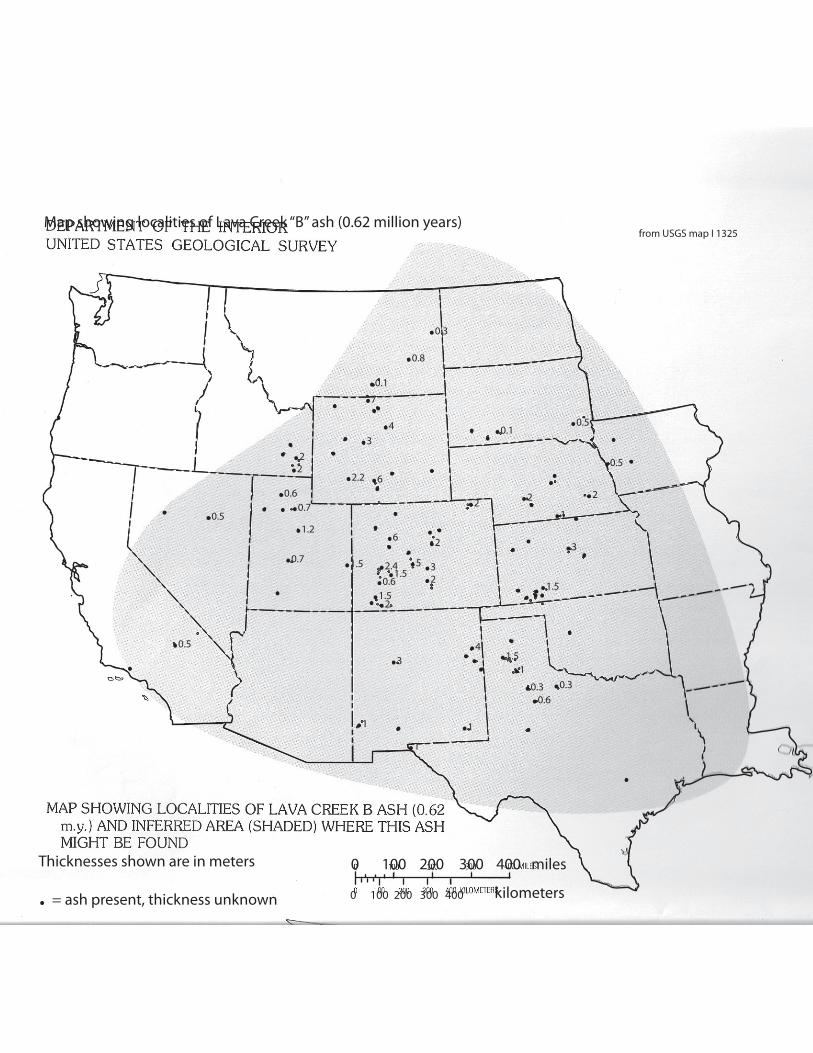
PART 2: Ash distribution from a Yellowstone eruption This problem involves interpretation of data related to the eruption of the “Lava Creek B ash” (0.62 m.y.) from the Yellowstone volcanic center. Attached is a map showing the thicknesses of ash deposits from this eruption that have been identified at selected locations. Contour these data on the map, using a 1 m interval. Label your map clearly. In your report, use your contour map of ash thicknesses to answer the following questions. (As always, separate “observations” from “interpretations” in your report). Where are the thickest ash deposits? How far from Yellowstone are the most distant ash deposits? Describe the distribution of ash relative to the source (Yellowstone). How do you explain this distribution? In some places, there is a dramatic difference in ash thickness for localities that are relatively close together. What is the most probable explanation for this? Which of the two thicknesses do you think is the most representative of the original ash thickness in the region? Please turn in the following for EACH of the two parts of this assignment: 1) A 1/2 page, typed report, using the same outline as your lab reports. 2) The data on which this part of the report is based, i.e., the table (with calculations), for part 1 the contour map (with contours labeled), for part 2

Skeletal Grading Key: Yellowstone hot spot, 25 points Introduction (2 pts) Methods (4 pts) Observations (6 pts) Interpretation (11 pts) 0 – 2 pts for correct differentiation of data from interpretations Ash distribution, 25 points Introduction (2 pts) - location of area, problem to be solved Methods (4 pts) - kinds of data, methods used Observations (10 pts) - contour map, clearly labeled Interpretation (7 pts) - answers to questions, based on data presented 0 – 2 pts for correct differentiation of data from interpretations PHCf08

Snake River Plain VolcanicProvince
O - H
B - J
TWP
H
YP
Montana
Utah
Idaho
Wyom
ing
NevadaOregon
45
44
43
41
116 112
0 200 km
0 100 200 300 400 miles
0 100 200 300 400 kilometers
.0.5
.0.5.0.1
.2 .2
.1
.3
.1.5
.0.6.0.3.0.3
.1.1.5
.1
.3
.1.1
.4.0.5
.0.5
.0.6
.1.5
.0.7
.0.7
.1.2
.2.2
.4
.2.2 .6
.3
.7
.0.3
.0.8
.0.1
.2
.2.4 .2
.2
.2.6
.3.5.1.5.0.6.1.5
..
....
. .
...
.. ...
..
.....
.... .
..
...
.
.
.
.
.
.
. .
..
...
from USGS map I 1325Map showing localities of Lava Creek “B” ash (0.62 million years)
Thicknesses shown are in meters
. = ash present, thickness unknown