geologic atlas of benton county,...
TRANSCRIPT
STATE OF MINNESOTADEPARTMENT OF NATURAL RESOURCESDIVISION OF ECOLOGICAL AND WATER RESOURCES
GEOLOGIC ATLAS OF BENTON COUNTY, MINNESOTA
COUNTY ATLAS SERIESATLAS C-23, PART B, PLATE 8 Of 9
Hydrogeology of the Buried Aquifers and the Rice Area Aquifer System
The DNR Information Center
Twin Cities: (651) 296-6157Minnesota toll free: 1-888-646-6367Information for the hearing impaired (TDD/TTY): (651) 296-5484TDD/TTY Minnesota toll free: 1-800-657-3929DNR web site: http://www.mndnr.gov
This information is available in alternative format on request.
Equal opportunity to participate in and benefit from programs of the Minnesota Department of Natural Resources is available regardless of race, color, national origin, sex, sexual orientation, marital status, status with regard to public assistance, age, or disability. Discrimination inquiries should be sent to Minnesota DNR, 500 Lafayette Road, St. Paul, MN 55155-4031, or the Equal Opportunity Office, Department of the Interior, Washington, DC 20240.
© 2012 State of Minnesota,Department of Natural Resources, and theRegents of the University of Minnesota.
This map was compiled and generated using geographic information systems (GIS) technology. Digital data products, including chemistry and geophysical data, are available from DNR Ecological and Water Resources at http://www.dnr.state.mn.us/waters.This map was prepared from publicly available information only. Every reasonable effort has been made to ensure the accuracy of the factual data on which this map interpretation is based. However, the Department of Natural Resources does not warrant the accuracy, completeness, or any implied uses of these data. Users may wish to verify critical informa-tion; sources include both the references here and information on file in the offices of the Minnesota Geological Survey and the Minnesota Department of Natural Resources. Every effort has been made to ensure the interpretation shown conforms to sound geologic and cartographic principles. This map should not be used to establish legal title, boundaries, or locations of improvements.Base modified from Minnesota Geological Survey, Benton County Geologic Atlas, Part A, 2010.Project data compiled from 2010 to 2011 at a scale of 1:100,000. Universal Transverse Mercator projection, grid zone 15, 1983 North American datum. Vertical datum is mean sea level. GIS and cartography by Jeremy Rivord, Greg Massaro, and Shana Pascal. Edited by Neil Cunningham and Jan Falteisek.
Prepared and Published with the Support of the MINNESOTA ENVIRONMENT AND NATURAL RESOURCES TRUST FUND and the CLEAN WATER, LAND AND LEGACY AMENDMENT
HYDROGEOLOGY OF THE BURIED AQUIFERS
By
Jeremy S. Rivord
2012
FIGURE 1. Elevation of the potentiometric surface and water use for 2010 in the supra-Emerald buried aquifer unit (se).
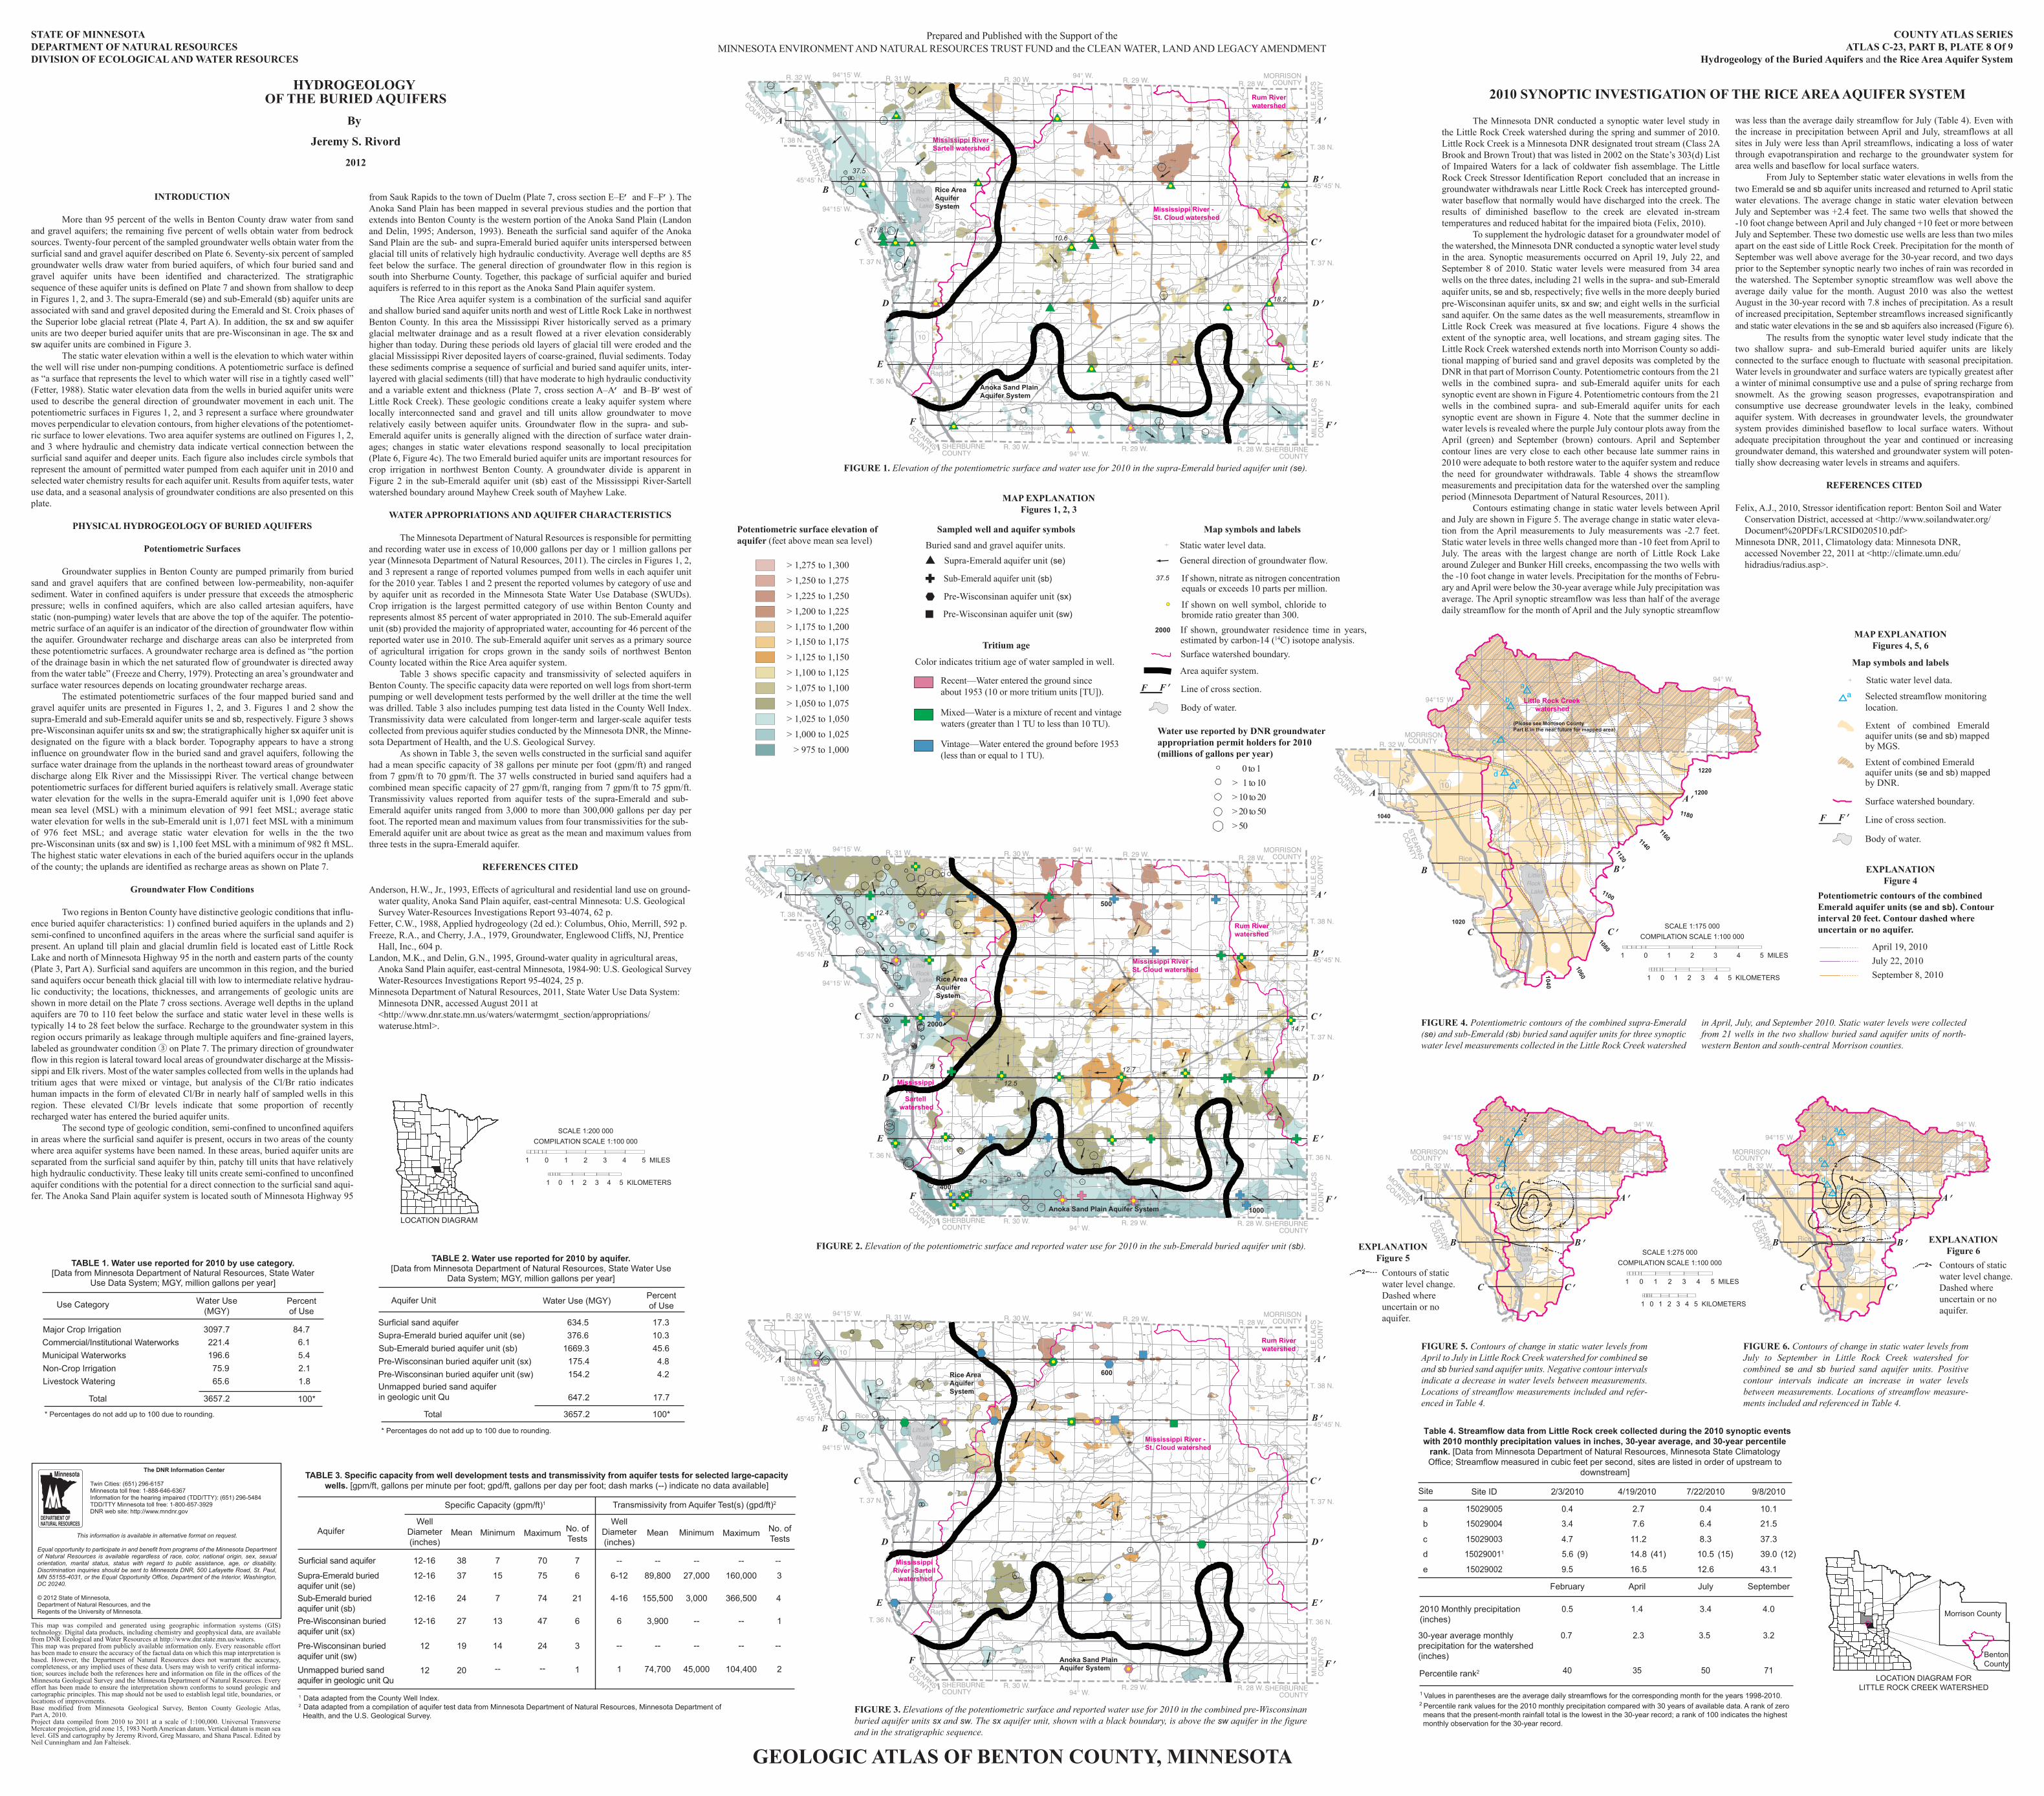
FIGURE 2. Elevation of the potentiometric surface and reported water use for 2010 in the sub-Emerald buried aquifer unit (sb).
FIGURE 3. Elevations of the potentiometric surface and reported water use for 2010 in the combined pre-Wisconsinan buried aquifer units sx and sw. The sx aquifer unit, shown with a black boundary, is above the sw aquifer in the figure and in the stratigraphic sequence.
FIGURE 6. Contours of change in static water levels from July to September in Little Rock Creek watershed for combined se and sb buried sand aquifer units. Positive contour intervals indicate an increase in water levels between measurements. Locations of streamflow measure-ments included and referenced in Table 4.
FIGURE 5. Contours of change in static water levels from April to July in Little Rock Creek watershed for combined se and sb buried sand aquifer units. Negative contour intervals indicate a decrease in water levels between measurements. Locations of streamflow measurements included and refer-enced in Table 4.
TABLE 1. Water use reported for 2010 by use category.[Data from Minnesota Department of Natural Resources, State Water
Use Data System; MGY, million gallons per year]
Water Use (MGY)
* Percentages do not add up to 100 due to rounding.
Use Category Percent of Use
3657.2Total 100*
Livestock Watering 1.865.6Non-Crop Irrigation 2.175.9
Commercial/Institutional Waterworks 6.1221.4Municipal Waterworks 5.4196.6
Major Crop Irrigation 84.73097.7
TABLE 3. Specific capacity from well development tests and transmissivity from aquifer tests for selected large-capacity wells. [gpm/ft, gallons per minute per foot; gpd/ft, gallons per day per foot; dash marks (--) indicate no data available]
Aquifer
Specific Capacity (gpm/ft)1 Transmissivity from Aquifer Test(s) (gpd/ft)2
1 Data adapted from the County Well Index.2 Data adapted from a compilation of aquifer test data from Minnesota Department of Natural Resources, Minnesota Department of Health, and the U.S. Geological Survey.
Surficial sand aquifer
Supra-Emerald buried aquifer unit (se)Sub-Emerald buriedaquifer unit (sb) Pre-Wisconsinan buried aquifer unit (sx)
Unmapped buried sand aquifer in geologic unit Qu
Pre-Wisconsinan buried aquifer unit (sw)
Well Diameter(inches)
12-16
12-16
12-16
12-16
12
12
Mean
38
37
24
27
20
19
Minimum
7
15
7
13
--
14
Maximum
70
75
74
47
--
24
No. of Tests
7
6
21
6
1
3
WellDiameter(inches)
--
6-12
4-16
6
1
--
Mean
--
89,800
155,500
3,900
74,700
--
Minimum
--
27,000
3,000
--
45,000
--
Maximum
--
160,000
366,500
--
104,400
--
--
No. of Tests
3
4
1
2
--
Potentiometric surface elevation of aquifer (feet above mean sea level)
> 975 to 1,000> 1,000 to 1,025> 1,025 to 1,050
> 1,075 to 1,100> 1,100 to 1,125> 1,125 to 1,150> 1,150 to 1,175> 1,175 to 1,200> 1,200 to 1,225> 1,225 to 1,250> 1,250 to 1,275> 1,275 to 1,300
> 1,050 to 1,075
MAP EXPLANATIONFigures 1, 2, 3
2010 SYNOPTIC INVESTIGATION OF THE RICE AREA AQUIFER SYSTEM
LOCATION DIAGRAM FORLITTLE ROCK CREEK WATERSHED
Morrison County
BentonCounty
FIGURE 4. Potentiometric contours of the combined supra-Emerald (se) and sub-Emerald (sb) buried sand aquifer units for three synoptic water level measurements collected in the Little Rock Creek watershed
in April, July, and September 2010. Static water levels were collected from 21 wells in the two shallow buried sand aquifer units of north-western Benton and south-central Morrison counties.
MAP EXPLANATIONFigures 4, 5, 6
Map symbols and labels
Potentiometric contours of the combined Emerald aquifer units (se and sb). Contour interval 20 feet. Contour dashed where uncertain or no aquifer.
April 19, 2010July 22, 2010September 8, 2010
Static water level data.
Surface watershed boundary.
Line of cross section.
Body of water.
Extent of combined Emerald aquifer units (se and sb) mapped by DNR.
a
TABLE 2. Water use reported for 2010 by aquifer.[Data from Minnesota Department of Natural Resources, State Water Use
Data System; MGY, million gallons per year]
Total
Surficial sand aquiferSupra-Emerald buried aquifer unit (se)Sub-Emerald buried aquifer unit (sb)Pre-Wisconsinan buried aquifer unit (sx)Pre-Wisconsinan buried aquifer unit (sw)Unmapped buried sand aquiferin geologic unit Qu
17.310.345.64.84.2
17.7
100*
Percent of Use
634.5376.6
1669.3175.4154.2
647.2
3657.2
Water Use (MGY)Aquifer Unit
* Percentages do not add up to 100 due to rounding.
INTRODUCTION
More than 95 percent of the wells in Benton County draw water from sand and gravel aquifers; the remaining five percent of wells obtain water from bedrock sources. Twenty-four percent of the sampled groundwater wells obtain water from the surficial sand and gravel aquifer described on Plate 6. Seventy-six percent of sampled groundwater wells draw water from buried aquifers, of which four buried sand and gravel aquifer units have been identified and characterized. The stratigraphic sequence of these aquifer units is defined on Plate 7 and shown from shallow to deep in Figures 1, 2, and 3. The supra-Emerald (se) and sub-Emerald (sb) aquifer units are associated with sand and gravel deposited during the Emerald and St. Croix phases of the Superior lobe glacial retreat (Plate 4, Part A). In addition, the sx and sw aquifer units are two deeper buried aquifer units that are pre-Wisconsinan in age. The sx and sw aquifer units are combined in Figure 3. The static water elevation within a well is the elevation to which water within the well will rise under non-pumping conditions. A potentiometric surface is defined as “a surface that represents the level to which water will rise in a tightly cased well” (Fetter, 1988). Static water elevation data from the wells in buried aquifer units were used to describe the general direction of groundwater movement in each unit. The potentiometric surfaces in Figures 1, 2, and 3 represent a surface where groundwater moves perpendicular to elevation contours, from higher elevations of the potentiomet-ric surface to lower elevations. Two area aquifer systems are outlined on Figures 1, 2, and 3 where hydraulic and chemistry data indicate vertical connection between the surficial sand aquifer and deeper units. Each figure also includes circle symbols that represent the amount of permitted water pumped from each aquifer unit in 2010 and selected water chemistry results for each aquifer unit. Results from aquifer tests, water use data, and a seasonal analysis of groundwater conditions are also presented on this plate.
PHYSICAL HYDROGEOLOGY OF BURIED AQUIFERS
Potentiometric Surfaces
Groundwater supplies in Benton County are pumped primarily from buried sand and gravel aquifers that are confined between low-permeability, non-aquifer sediment. Water in confined aquifers is under pressure that exceeds the atmospheric pressure; wells in confined aquifers, which are also called artesian aquifers, have static (non-pumping) water levels that are above the top of the aquifer. The potentio-metric surface of an aquifer is an indicator of the direction of groundwater flow within the aquifer. Groundwater recharge and discharge areas can also be interpreted from these potentiometric surfaces. A groundwater recharge area is defined as “the portion of the drainage basin in which the net saturated flow of groundwater is directed away from the water table” (Freeze and Cherry, 1979). Protecting an area’s groundwater and surface water resources depends on locating groundwater recharge areas. The estimated potentiometric surfaces of the four mapped buried sand and gravel aquifer units are presented in Figures 1, 2, and 3. Figures 1 and 2 show the supra-Emerald and sub-Emerald aquifer units se and sb, respectively. Figure 3 shows pre-Wisconsinan aquifer units sx and sw; the stratigraphically higher sx aquifer unit is designated on the figure with a black border. Topography appears to have a strong influence on groundwater flow in the buried sand and gravel aquifers, following the surface water drainage from the uplands in the northeast toward areas of groundwater discharge along Elk River and the Mississippi River. The vertical change between potentiometric surfaces for different buried aquifers is relatively small. Average static water elevation for the wells in the supra-Emerald aquifer unit is 1,090 feet above mean sea level (MSL) with a minimum elevation of 991 feet MSL; average static water elevation for wells in the sub-Emerald unit is 1,071 feet MSL with a minimum of 976 feet MSL; and average static water elevation for wells in the the two pre-Wisconsinan units (sx and sw) is 1,100 feet MSL with a minimum of 982 ft MSL. The highest static water elevations in each of the buried aquifers occur in the uplands of the county; the uplands are identified as recharge areas as shown on Plate 7.
Groundwater Flow Conditions
Two regions in Benton County have distinctive geologic conditions that influ-ence buried aquifer characteristics: 1) confined buried aquifers in the uplands and 2) semi-confined to unconfined aquifers in the areas where the surficial sand aquifer is present. An upland till plain and glacial drumlin field is located east of Little Rock Lake and north of Minnesota Highway 95 in the north and eastern parts of the county (Plate 3, Part A). Surficial sand aquifers are uncommon in this region, and the buried sand aquifers occur beneath thick glacial till with low to intermediate relative hydrau-lic conductivity; the locations, thicknesses, and arrangements of geologic units are shown in more detail on the Plate 7 cross sections. Average well depths in the upland aquifers are 70 to 110 feet below the surface and static water level in these wells is typically 14 to 28 feet below the surface. Recharge to the groundwater system in this region occurs primarily as leakage through multiple aquifers and fine-grained layers, labeled as groundwater condition ③ on Plate 7. The primary direction of groundwater flow in this region is lateral toward local areas of groundwater discharge at the Missis-sippi and Elk rivers. Most of the water samples collected from wells in the uplands had tritium ages that were mixed or vintage, but analysis of the Cl/Br ratio indicates human impacts in the form of elevated Cl/Br in nearly half of sampled wells in this region. These elevated Cl/Br levels indicate that some proportion of recently recharged water has entered the buried aquifer units. The second type of geologic condition, semi-confined to unconfined aquifers in areas where the surficial sand aquifer is present, occurs in two areas of the county where area aquifer systems have been named. In these areas, buried aquifer units are separated from the surficial sand aquifer by thin, patchy till units that have relatively high hydraulic conductivity. These leaky till units create semi-confined to unconfined aquifer conditions with the potential for a direct connection to the surficial sand aqui-fer. The Anoka Sand Plain aquifer system is located south of Minnesota Highway 95
from Sauk Rapids to the town of Duelm (Plate 7, cross section E–E’ and F–F’). The Anoka Sand Plain has been mapped in several previous studies and the portion that extends into Benton County is the western portion of the Anoka Sand Plain (Landon and Delin, 1995; Anderson, 1993). Beneath the surficial sand aquifer of the Anoka Sand Plain are the sub- and supra-Emerald buried aquifer units interspersed between glacial till units of relatively high hydraulic conductivity. Average well depths are 85 feet below the surface. The general direction of groundwater flow in this region is south into Sherburne County. Together, this package of surficial aquifer and buried aquifers is referred to in this report as the Anoka Sand Plain aquifer system. The Rice Area aquifer system is a combination of the surficial sand aquifer and shallow buried sand aquifer units north and west of Little Rock Lake in northwest Benton County. In this area the Mississippi River historically served as a primary glacial meltwater drainage and as a result flowed at a river elevation considerably higher than today. During these periods old layers of glacial till were eroded and the glacial Mississippi River deposited layers of coarse-grained, fluvial sediments. Today these sediments comprise a sequence of surficial and buried sand aquifer units, inter-layered with glacial sediments (till) that have moderate to high hydraulic conductivity and a variable extent and thickness (Plate 7, cross section A–A’ and B–B’west of Little Rock Creek). These geologic conditions create a leaky aquifer system where locally interconnected sand and gravel and till units allow groundwater to move relatively easily between aquifer units. Groundwater flow in the supra- and sub-Emerald aquifer units is generally aligned with the direction of surface water drain-ages; changes in static water elevations respond seasonally to local precipitation (Plate 6, Figure 4c). The two Emerald buried aquifer units are important resources for crop irrigation in northwest Benton County. A groundwater divide is apparent in Figure 2 in the sub-Emerald aquifer unit (sb) east of the Mississippi River-Sartell watershed boundary around Mayhew Creek south of Mayhew Lake.
WATER APPROPRIATIONS AND AQUIFER CHARACTERISTICS
The Minnesota Department of Natural Resources is responsible for permitting and recording water use in excess of 10,000 gallons per day or 1 million gallons per year (Minnesota Department of Natural Resources, 2011). The circles in Figures 1, 2, and 3 represent a range of reported volumes pumped from wells in each aquifer unit for the 2010 year. Tables 1 and 2 present the reported volumes by category of use and by aquifer unit as recorded in the Minnesota State Water Use Database (SWUDs). Crop irrigation is the largest permitted category of use within Benton County and represents almost 85 percent of water appropriated in 2010. The sub-Emerald aquifer unit (sb) provided the majority of appropriated water, accounting for 46 percent of the reported water use in 2010. The sub-Emerald aquifer unit serves as a primary source of agricultural irrigation for crops grown in the sandy soils of northwest Benton County located within the Rice Area aquifer system. Table 3 shows specific capacity and transmissivity of selected aquifers in Benton County. The specific capacity data were reported on well logs from short-term pumping or well development tests performed by the well driller at the time the well was drilled. Table 3 also includes pumping test data listed in the County Well Index. Transmissivity data were calculated from longer-term and larger-scale aquifer tests collected from previous aquifer studies conducted by the Minnesota DNR, the Minne-sota Department of Health, and the U.S. Geological Survey. As shown in Table 3, the seven wells constructed in the surficial sand aquifer had a mean specific capacity of 38 gallons per minute per foot (gpm/ft) and ranged from 7 gpm/ft to 70 gpm/ft. The 37 wells constructed in buried sand aquifers had a combined mean specific capacity of 27 gpm/ft, ranging from 7 gpm/ft to 75 gpm/ft. Transmissivity values reported from aquifer tests of the supra-Emerald and sub-Emerald aquifer units ranged from 3,000 to more than 300,000 gallons per day per foot. The reported mean and maximum values from four transmissivities for the sub-Emerald aquifer unit are about twice as great as the mean and maximum values from three tests in the supra-Emerald aquifer.
REFERENCES CITED
Anderson, H.W., Jr., 1993, Effects of agricultural and residential land use on ground- water quality, Anoka Sand Plain aquifer, east-central Minnesota: U.S. Geological Survey Water-Resources Investigations Report 93-4074, 62 p.Fetter, C.W., 1988, Applied hydrogeology (2d ed.): Columbus, Ohio, Merrill, 592 p.Freeze, R.A., and Cherry, J.A., 1979, Groundwater, Englewood Cliffs, NJ, Prentice Hall, Inc., 604 p.Landon, M.K., and Delin, G.N., 1995, Ground-water quality in agricultural areas, Anoka Sand Plain aquifer, east-central Minnesota, 1984-90: U.S. Geological Survey Water-Resources Investigations Report 95-4024, 25 p.Minnesota Department of Natural Resources, 2011, State Water Use Data System: Minnesota DNR, accessed August 2011 at <http://www.dnr.state.mn.us/waters/watermgmt_section/appropriations/ wateruse.html>.
The Minnesota DNR conducted a synoptic water level study in the Little Rock Creek watershed during the spring and summer of 2010. Little Rock Creek is a Minnesota DNR designated trout stream (Class 2A Brook and Brown Trout) that was listed in 2002 on the State’s 303(d) List of Impaired Waters for a lack of coldwater fish assemblage. The Little Rock Creek Stressor Identification Report concluded that an increase in groundwater withdrawals near Little Rock Creek has intercepted ground-water baseflow that normally would have discharged into the creek. The results of diminished baseflow to the creek are elevated in-stream temperatures and reduced habitat for the impaired biota (Felix, 2010). To supplement the hydrologic dataset for a groundwater model of the watershed, the Minnesota DNR conducted a synoptic water level study in the area. Synoptic measurements occurred on April 19, July 22, and September 8 of 2010. Static water levels were measured from 34 area wells on the three dates, including 21 wells in the supra- and sub-Emerald aquifer units, se and sb, respectively; five wells in the more deeply buried pre-Wisconsinan aquifer units, sx and sw; and eight wells in the surficial sand aquifer. On the same dates as the well measurements, streamflow in Little Rock Creek was measured at five locations. Figure 4 shows the extent of the synoptic area, well locations, and stream gaging sites. The Little Rock Creek watershed extends north into Morrison County so addi-tional mapping of buried sand and gravel deposits was completed by the DNR in that part of Morrison County. Potentiometric contours from the 21 wells in the combined supra- and sub-Emerald aquifer units for each synoptic event are shown in Figure 4. Potentiometric contours from the 21 wells in the combined supra- and sub-Emerald aquifer units for each synoptic event are shown in Figure 4. Note that the summer decline in water levels is revealed where the purple July contour plots away from the April (green) and September (brown) contours. April and September contour lines are very close to each other because late summer rains in 2010 were adequate to both restore water to the aquifer system and reduce the need for groundwater withdrawals. Table 4 shows the streamflow measurements and precipitation data for the watershed over the sampling period (Minnesota Department of Natural Resources, 2011). Contours estimating change in static water levels between April and July are shown in Figure 5. The average change in static water eleva-tion from the April measurements to July measurements was -2.7 feet. Static water levels in three wells changed more than -10 feet from April to July. The areas with the largest change are north of Little Rock Lake around Zuleger and Bunker Hill creeks, encompassing the two wells with the -10 foot change in water levels. Precipitation for the months of Febru-ary and April were below the 30-year average while July precipitation was average. The April synoptic streamflow was less than half of the average daily streamflow for the month of April and the July synoptic streamflow
was less than the average daily streamflow for July (Table 4). Even with the increase in precipitation between April and July, streamflows at all sites in July were less than April streamflows, indicating a loss of water through evapotranspiration and recharge to the groundwater system for area wells and baseflow for local surface waters. From July to September static water elevations in wells from the two Emerald se and sb aquifer units increased and returned to April static water elevations. The average change in static water elevation between July and September was +2.4 feet. The same two wells that showed the -10 foot change between April and July changed +10 feet or more between July and September. These two domestic use wells are less than two miles apart on the east side of Little Rock Creek. Precipitation for the month of September was well above average for the 30-year record, and two days prior to the September synoptic nearly two inches of rain was recorded in the watershed. The September synoptic streamflow was well above the average daily value for the month. August 2010 was also the wettest August in the 30-year record with 7.8 inches of precipitation. As a result of increased precipitation, September streamflows increased significantly and static water elevations in the se and sb aquifers also increased (Figure 6). The results from the synoptic water level study indicate that the two shallow supra- and sub-Emerald buried aquifer units are likely connected to the surface enough to fluctuate with seasonal precipitation. Water levels in groundwater and surface waters are typically greatest after a winter of minimal consumptive use and a pulse of spring recharge from snowmelt. As the growing season progresses, evapotranspiration and consumptive use decrease groundwater levels in the leaky, combined aquifer system. With decreases in groundwater levels, the groundwater system provides diminished baseflow to local surface waters. Without adequate precipitation throughout the year and continued or increasing groundwater demand, this watershed and groundwater system will poten-tially show decreasing water levels in streams and aquifers.
REFERENCES CITED
Felix, A.J., 2010, Stressor identification report: Benton Soil and Water Conservation District, accessed at <http://www.soilandwater.org/ Document%20PDFs/LRCSID020510.pdf>Minnesota DNR, 2011, Climatology data: Minnesota DNR, accessed November 22, 2011 at <http://climate.umn.edu/ hidradius/radius.asp>.
Site ID 7/22/2010 9/8/2010
15029005 0.4 10.1
15029004 6.4 21.5
15029003 8.3 37.3
150290011 10.5 39.0
15029002 12.6 43.1
Table 4. Streamflow data from Little Rock creek collected during the 2010 synoptic events with 2010 monthly precipitation values in inches, 30-year average, and 30-year percentile
rank. [Data from Minnesota Department of Natural Resources, Minnesota State Climatology Office; Streamflow measured in cubic feet per second, sites are listed in order of upstream to
downstream]
July September
a
b
c
d
e
1 Values in parentheses are the average daily streamflows for the corresponding month for the years 1998-2010. 2 Percentile rank values for the 2010 monthly precipitation compared with 30 years of available data. A rank of zero means that the present-month rainfall total is the lowest in the 30-year record; a rank of 100 indicates the highest monthly observation for the 30-year record.
2/3/2010
0.4
3.4
4.7
5.6
9.5
February
4/19/2010
2.7
7.6
11.2
14.8
16.5
April
30-year average monthly precipitation for the watershed (inches)
3.5 3.20.7 2.3
Percentile rank2 40 35 50 71
Site
(9) (41) (15) (12)
Extent of combined Emerald aquifer units (se and sb) mapped by MGS.
LOCATION DIAGRAM
Map symbols and labels
Water use reported by DNR groundwater appropriation permit holders for 2010 (millions of gallons per year)
> 1 to 10> 10 to 20> 20 to 50> 50
0 to 1
Line of cross section.
Static water level data.
Body of water.
Surface watershed boundary.
General direction of groundwater flow.
If shown on well symbol, chloride to bromide ratio greater than 300.
Area aquifer system.
2010 Monthly precipitation (inches)
3.4 4.00.5 1.4
Sampled well and aquifer symbols
Sub-Emerald aquifer unit (sb)
Pre-Wisconsinan aquifer unit (sx)
Pre-Wisconsinan aquifer unit (sw)
Supra-Emerald aquifer unit (se)
Buried sand and gravel aquifer units.
Tritium age
Color indicates tritium age of water sampled in well.
Recent—Water entered the ground since about 1953 (10 or more tritium units [TU]).
Mixed—Water is a mixture of recent and vintage waters (greater than 1 TU to less than 10 TU).
Vintage—Water entered the ground before 1953(less than or equal to 1 TU).
If shown, groundwater residence time in years, estimated by carbon-14 (14C) isotope analysis.
2000
Selected streamflow monitoring location.
Contours of static water level change. Dashed where uncertain or no aquifer.
EXPLANATIONFigure 6
2
EXPLANATIONFigure 4
EXPLANATIONFigure 5
2 Contours of static water level change. Dashed where uncertain or no aquifer.
37.5 If shown, nitrate as nitrogen concentration equals or exceeds 10 parts per million.
1 0 1 2 3 4 5 MILES
SCALE 1:200 000
1 0 1 2 43 5 KILOMETERS
COMPILATION SCALE 1:100 000
1 0 1 2 3 4 5 MILES
SCALE 1:175 000
1 0 1 2 43 5 KILOMETERS
COMPILATION SCALE 1:100 000
1 0 1 2 3 4 5 MILES
SCALE 1:275 000
1 0 1 2 43 5 KILOMETERS
COMPILATION SCALE 1:100 000
10
94° W.
94°15' W.
Rice
STE
AR
NS
CO
UN
TY
MORRISONCOUNTY
COUNTY
MORRISON
R. 32 W.
Lake
LittleRock
25
STE
AR
NS
CO
UN
TY
STEARNS
COUNTY SHERBURNECOUNTY SHERBURNE
COUNTY
MIL
LE L
AC
SC
OU
NT
Y
10
COUNTY
MORRISON
MORRISONCOUNTY
MIL
LE L
AC
SC
OU
NT
Y
Mississippi
River
R. 28 W.R. 29 W.R. 30 W.
R. 28 W.R. 29 W.R. 30 W.R. 31 W.R. 32 W.
T. 36 N.T. 36 N.
T. 37 N. T. 37 N.
T. 38 N.T. 38 N.
Mayhew
Sucker
Mayhew
Lake
LittleRock
LakeDonovan
LakeMayhew
West
hcna
rB
River
St. F
rancis
Bailey
Creek
Creek
Creek
Cre
ek
Zulege
r
Little
kcoR
Platte
River
Creek
River
Stony
Brook
Col
lner
Cre
ek
River
St. Francis
CreekCreek
RiverRum
River
Elk
Estes Brook
Elk
Bunker Hill
23
23
25
95
25
15
10
45°45' N.45°45' N.
94° W.
94° W.
94°15' W.
94°15' W.
Foley
Oak
Rice
Park
SaukRapids
95
Mississippi River -Sartell
watershed
Mississippi River -St. Cloud watershed
Rum Riverwatershed
Rice AreaAquiferSystem
Anoka Sand PlainAquifer System
STE
AR
NS
CO
UN
TY
STEARNS
COUNTY SHERBURNECOUNTY SHERBURNE
COUNTY
MIL
LE L
AC
SC
OU
NT
Y
10
COUNTY
MORRISON
MORRISONCOUNTY
MIL
LE L
AC
SC
OU
NT
Y
Mississippi
River
R. 28 W.R. 29 W.R. 30 W.
R. 28 W.R. 29 W.R. 30 W.R. 31 W.R. 32 W.
T. 36 N.T. 36 N.
T. 37 N. T. 37 N.
T. 38 N.T. 38 N.
Mayhew
Sucker
Mayhew
Lake
LittleRock
LakeDonovan
LakeMayhew
West
hcna
rB
River
St. F
rancis
Bailey
Creek
Creek
Creek
Cre
ekZule
ger
Little
kcoR
Platte
River
Creek
River
Stony
Brook
Col
lner
Cre
ek
River
St. Francis
CreekCreek
RiverRum
River
Elk
Estes Brook
Elk
Bunker Hill
23
23
25
95
25
15
10
45°45' N.45°45' N.
94° W.
94° W.
94°15' W.
94°15' W.
Foley
Oak
Rice
Park
SaukRapids
95
Mississippi River -Sartell
watershed
Mississippi River -St. Cloud watershed
Rum Riverwatershed
Rice AreaAquiferSystem
Anoka Sand Plain Aquifer System
STE
AR
NS
CO
UN
TY
STEARNS
COUNTY SHERBURNECOUNTY SHERBURNE
COUNTY
MIL
LE L
AC
SC
OU
NT
Y
10
COUNTY
MORRISON
MORRISONCOUNTY
MIL
LE L
AC
SC
OU
NT
Y
Mississippi
River
R. 28 W.R. 29 W.R. 30 W.
R. 28 W.R. 29 W.R. 30 W.R. 31 W.R. 32 W.
T. 36 N.T. 36 N.
T. 37 N. T. 37 N.
T. 38 N.T. 38 N.
Mayhew
Sucker
Mayhew
Lake
LittleRock
LakeDonovan
LakeMayhew
West
hcna
rB
River
St. F
rancis
Bailey
Creek
Creek
Creek
Cre
ek
Zulege
r
Little
kcoR
Platte
River
Creek
River
Stony
Brook
Col
lner
Cre
ek
River
St. Francis
CreekCreek
RiverRum
River
Elk
Estes Brook
Elk
Bunker Hill
23
23
25
95
25
15
10
45°45' N.45°45' N.
94° W.
94° W.
94°15' W.
94°15' W.
Foley
Oak
Rice
Park
SaukRapids
95
Mississippi River -Sartell watershed
Mississippi River -St. Cloud watershed
Rum Riverwatershed
Rice AreaAquiferSystem
Anoka Sand PlainAquifer System
10
94° W.
94°15' W.
Rice
STE
AR
NS
CO
UN
TY
MORRISONCOUNTY
COUNTY
MORRISON
R. 32 W.
Lake
LittleRock
25
Sucker
Creek
Creek
Cre
ek
Zulege
r
Littl
eR
ock
Platte
River
Creek
Baker Hill
Little Rock Creek watershed
(Please see Morrison CountyPart B in the near future for mapped area)
10
94° W.
94°15' W.
Rice
STE
AR
NS
CO
UN
TY
MORRISONCOUNTY
COUNTY
MORRISON
R. 32 W.
Lake
LittleRock
25
-2
-2
-2
-2
-4
-4
-8 -6
2
2
4
8 6
4
1020
1040
10601040
1080
1100
1120
1140
1160
1180
1200
1220
A’
C’
B’
A
B
C
A’
C’
B’
A
B
C
A’
C’
B’
A
B
C
A’
C’
B’
D’
E’
F’
A
B
C
D
E
F
A’
C’
B’
D’
E’
F’
A
B
C
D
E
F
A’
C’
B’
D’
E’
F’
A
B
C
D
E
F
ab
c
de
ab
c
d e
a
b
c
de
600
12.4500
2000
1000
400
14.7
12.5
12.7
17.810.6
37.5
18.2