geological-seishological eyaluation of … report gl-86-16 usam crsgeological-seismologi cal...
TRANSCRIPT

7 AD-AI?3 230 GEOLOGICAL-SEISHOLOGICAL EYALUATION OF EARTHOUAKE aHAZARDS AT FRANKLIN FAL.. (U) RNY ENGINEER WATERNAYSEXPERIMENT STATION VICKSBURG MS GEOTE..
UCLRSSIFIED EKRINITZSKY ET AL. SEP 86 F/0 9/11 NL

. -
.2 e
AA.
.62
MIRCP EOUINTSNAINLBREUo HR
STANARDN9,3-

TECHNICAL REPORT GL-86-16
USAm CrsGEOLOGICAL-SEISMOLOGI CAL EVALUATION %___of EginersOF EARTHQUAKE HAZARDS AT FRANKLIN - A
FALLS DAMSITE, NEW HAMPSHIRE
cv, by EE. L. Krinitzsky, J. B. Dunbar *,.
Geotechnical Laboratory
DEPARTMENT OF THE ARMYWaterways Experiment Station, Corps of Engineers -I
P0 Box 631, Vicksburg, Mississippi 39180-0631
EDTIC ..S LECT E
D J
September 198 . .
Final Reporta. Z
Approved For Public Release, Distribution Unlimited .
.. ai;C'q
L...
vi
LABORATORY Prepared toi US Army Engineer Division, New EnglandWaltham, Massachusetts 02254-9149
86 1*.~~~ -,----. <-. * ~ ~... . <~f* * ~ ~ ~ ~ t.. .. ~- ~ ~a% a %

r %_o ._ _- -
.AL ..- .i'
Unclassified /SECURITY CLASSIFICATION OFTHIS PAGE k4/ "Apro d-~
REPORT DOCUMENTATION PAGE I ONo o o4oe0
la REPORT SECURITY CLASSIFICATION lb RESTRICTIVE MARKINGSUnclassified t J . .
2a SECURITY CLASSIFICATION AUTHORITY 3 DISTRIBUTION/AVAILABILITY OF REPORT
DECLASSIFICATION/_DOWNGRADINGSCHEDULE_ Approved for public release; 4__bSCHEDULE distribution unlimited
4 PERFORMING ORGANIZATION REPORT NUMBER(S) S MONITORING ORGANIZATION REPORT NUMBER(S)
Technical Report GL-86-16
6a NAME OF PERFORMING ORGANIZATION 6b OFFICE SYMBOL 7a NAME OF MONITORING ORGANIZATION .'.USAEWIES (If applicable) .j%#
Geotechnical Laboratory WESGR-R6c ADDRESS (City, State, and ZIP oe)7b ADDRESS (City, State, and ZIP Code) _ _
PO Box 631 "-'-."-Vicksburg, MS 39180-0631
Ba. NAME OF FUNDING /SPONSORING 8b OFFICE SYMBOL 9 PROCUREMENT INSTRUMENT IDENTIFICATION NUMBERORGANIZATION (If applicable)See reverse side DAEN-CWO-R . ...v
Bc. ADDRESS (City, State, and ZIP Code) 10 SOURCE OF FUNDING NUMBERS * .
PROGRAM PROJECT TASK WORK UNIT424 Trapelo Road ELEMENT NO NO NO ACCESSION NOWaltham, MA 02254-9149 .
11 TITLE (Include Security Classification) %Geological-Seismological Evaluation of Earthquake Hazards at Franklin FallsDamsite, New Hampshire
12 PERSONAL AUTHOR(S)Krinitzsky, E. L., Dunbar, J. B.
13a TYPE OF REPORT 13b TIME COVERED 14 DATE OF REPORT (Year, Month, Day) 15 PAGE COUNTFinal report FROM 1983 tO_8 September 1986 159 --
16 SUPPLEMENTARY NOTATIONAvailable from National Technical Information Service, 5285 Port Royal Road, Springfield, "
VA 22161. .17 COSATi CODES 18 SUBJECT TERMS (Continue on reverse If necessary and identify by block number) -"
FIELD GROUP SUB-GROUP Earthquake Northern New EnglandEarthquake motions Seismic zoning %Franklin Falls Dam
19 ABSTRACT (Continue on reverse if necessary and identify by block number)
Seismic zones were developed for northern New England based on geological and geo-physical data and on historic seismicity. Each zone was assigned a floating maximumearthquake and earthquake motions were attenuated to the site from their sources. Thesite was found to be subject to a local earthquake (acceleration 0.15 g, velocity27 cm/sec, and duration > 0.5 g of 9 sec) and an earthquake originating from theOssipee area (acceleration 0.38 g, velocity 25 cm/sec, and duration > 0.05 g of 6 sac). ."-Accelerograms and response spectra appropriate to these values were selected. ... ,
20 DISTRIBUTION AVAILABILITY OF ABSTRACT 121 ABSTRACT SECURITY CLASSFICATION*UNCLASSIFIEDUNLIMITED LI SAME AS RPT l oIC uSE RS Unclassified
2ia NAME OF RESPONSIBLE NDIVIDUAL 22b TEP-ON( (Include ,l-eaCode) 27 OFFCE SYMBO%, .*l..
DO FORM 1473, 84 MAR B3 APR .-d i ay he isd I -,h,~st.d ( ,ASS 'CAT!ON OF 'H S PAE.All o her edtlo 'lae obwleIe Unclassified
"""" '- " -" ' " . .. - " "- -" ' .' - -" " . '- "- *- "- "- ".' -. . * -'. . . - -. .- - . -.'. - ." - - - - '--
8a. NAME OF FUNDING/SPONSORING ORGANIZATION (Continued).
US Army Engineer Division, New England.- '% -...;.p...j
%" "e .
J. % . ,
% .-
:.% . .%
0% *le, % .
V-.-'.nt." *1%'
,_ ... '-.,.,
4..... -
J %. ..
. 4...o'"*'.\% ,,% ,
%P .,.-.
I' '2
."< f%\
.v -..,
4 . . . .-
o,-*
* * *- 4 . 4
...
. ~ .4. 4 4.. . .
PREFACE o.
The US Army Engineer Waterways Experiment Station (WES) was authorized to
conduct this study by the US Army Engineer Division, New England. This study :. :
was prepared by Dr. E. L. Krinitzsky, Engineering Geology and Rock Mechanics ..
Division (EGRMD), and Mr. J. B. Dunbar, Regional Studies Unit (RSU), Engi-"'.
neering Geology Applications Group (EGAG), EGRMD, Geotechnical Laboratory P .
(GL). A field reconnaissance of the Franklin Falls damsite and vicinity was "-'-,
made by Mr. Dunbar with Dr. P. J. Barosh of Concord, Mass. Mr D. Barefoot, .-•-;-
EGRMD, assisted in compiling the data. The project was under the general•..,
supervision of Dr. L. M. Smith, Chief, RSU, EGAG, and Mr. J. H. Shamburger, #-
Chief, EGAG, EGRMD, and under the general direction of Dr. D. C. Banks, Chief,' -. ["
EGRMD, and Dr. W. F. Marcuson III, Chief, GL...--.
COL Allen F. Grum, USA, was the previous Director of WES. COL Dwayne G.-.%,
Lee, CE, is the present Commander and Director. Dr. Robert W. Whalin is -
Technical Director. - %
Accesion For "., .:
NTIS CRA&I -- H" "
DTIC TAB [ '---.U,,aio,,,.cd i]"-::::
............... . . .. ' .'
By . :'-.
Av~il,,biitv (.'o6's
4',ci.,-'',L.'or
Di.. -.t..
7 '
condct his tud by he S Ary Eginer Dvisin, ew Eglad. Tis tud
s wa-rpre yD. .L riizkEnierngGooy n ok ehnc
..-.......-, Division....... (EGRMD)-, ,.- and Mr . B. Dunbar,, ,.,... .:-, Re i n l ,t d es Ui,( S ) Engi...; -...-.........- ,.-...-.-.-,...
'P~~~ .Ajl w J
CONTENTS .%4
Page
PREFACE.............................................................1
PART I: INTRODUCTION ............................................... 3
Pu p s n co e. . . . .. . . . . . .. . . . . . .. . . . .
Study Area ...................................................... 3
PART II: GEOLOGY ..................................................... 4
Regional Geology ................................................. 4Local Geology ................................................... 8Faulting and Lineamients ......................................... 12
PART III: SEISMIC HISTORY ............................................ 16
Distribution of Historic Earthquakes ............................ 160Seismicity and Geology Relationship ............................. 20Earthquake Recurrence ........................................... 25
PART IV: SEISMIC SOURCE ZONES.......................................28
Earthquakes Felt at Franklin Falls Danisite ...................... 28Earthquakes Zones and Intensities ............................... 31
PART V: EARTHQUAKE MOTIONS AT FRANKLIN FALLS DAMSITE ............... 341
Field Conditions ................................................ 34Recommended Motions .......................................... 34Recommended Accelerograis.......................................39Motions for Nearby Nuclear Power Plants ..........................40Amplification of Base Motions at the Dam Crest .................. 41
PART VI: CONCLUSIONS ................................................ 414
REFERENCES............................................................45
TABLES 1-3
APPENDIX A: STRATIGRAPHY OF FRANKLIN FALLS DAMSITE AND VICINITY .... Al
APPENDIX B: EARTHQUAKES IN NORTHERN NEW ENGLAND ...................... B1
APPENDIX C: SUMIMARY AND) ANALYSIS OF THE 1982 GAZA, NEW HAMPSHIRE '
EARTHQUAKE ............................................... Cl
APPENDIX D: SELECTED ACCELEROGRAMS, RELATIVE VELOCITY RESPONSESPECTRA, AND QUADRIPARTITE RESPONSE SPECTRA .............. D1
2
. . . .. . . . . . . . . . . . .. .
GEOLOGICAL-SEISMOLOGICAL EVALUATION OF EARTHQUAKE HAZARDS /0
AT FRANKLIN FALLS DAMSITE. NEW HAMPSHIRE
N1 %
PART I: INTRODUCTION
Purpose and Scope .. '. ." '
1. The purpose of this investigation was to define the maximum potential
for earthquakes at the Franklin Falls damsite, located in New Hampshire, and
to provide appropriate ground motions for earthquake shaking at the dam.
These ground motions are for use in the design analysis of the present earth
dam and associated structures.
2. This investigation includes both a geological and seismological study
and consists of the following parts: (a) an examination of the local and
regional geology including an evaluation of faulting, (b) a review of the
historical seismicity of the northern New England region, and (c) the deter-
mination of the maximum earthquakes that will affect the damsite as well as
the attenuated peak ground motions at the damsite.
Study Area
3. The area covered by this study includes that portion of the eastern "
United States in which earthquakes have occurred that might affect the dam-
site, roughly a five-state area ranging from New York to Maine, with Massa- .- ,
chusetts along the southern boundary and southern Quebec in Canada along the
northern boundary. Extremely severe earthquakes, centered outside the study
area, were examined on an individual basis to determine their effects, if any,
on the damsite.
4. Franklin Falls Dam is located in south-central New Hampshire, ap-
proximately 32 km (20 miles) north of Concord, the state's capital. The dam ,
derives its name from the town of Franklin Falls where it is located. Frank-
lin Falls Dam is an earth-and-rock fill dam constructed between 1939 and 1943
on the Pemigewasset River, a tributary to the Merrimack River.
, .% .-. .
3 % -.

N. -.-- .
PART II: GEOLOGY • .44,
Regional Geology
Tectonic provinces
5. The bedrock geology of the New England region is composed of highly
folded and faulted sedimentary, metairorphic, and volcanic rocks of Paleozoic
age (570 to 245 million years (M.Y.) before present) and Mesozoic age (245 to .
66 M.Y. before present), with numerous unconformable and isolated Precambrian
age (before 570 M.Y.) exposures of crystalline basement rock.
6. The state of New Hampshire is characterized by north and northeast
trending highly folded metamorphosed sedimentary belts that are occasionally.---
separated by faulting. These metasedimentary belts form a parallel series of
distinct topographic ridges, anticlines or anticlinoriums, separated by to-
pographic lows or valleys, synclines or synclinoriums. -. '
7. The Franklin Falls damsite is situated in the approximate central
portion of the Merrimack synclinorium (see Figure 1), bounded on the north by
the White Mountain Series of volcanic intrusives, on the west by the Connecti-
cut Valley synclinorium and Bronson Hill anticline, and on the south by the
Fitchburg Pluton and Rockingham anticlinorium (from Billings, 1955). Mapped
faulting is absent at the Franklin Falls damsite, but it is present to the
west along the Bronson Hill anticline, to the north along the northern margin JA
of the Ossipee hotspot, and to the south along the northern margin of the
Fitchburg Pluton. 444';.,
Tectonic history .. ''8. The Franklin Falls damsite is located in the northern portion of the
Appalachian Mountains. The geology of the northern Appalachians is extremely
complex, with a rock record spanning a time frame in excess of one billion -.4 .
years (B.Y.). The stratigraphic record reveals that virtually all rock types
are present in this region and outcrop at the surface. These rocks have a .- _. -
broad range of origins and environments of deposition. Rock types range from
those found only in the lower crust or upper mantle of the earth, to those 4.*
formed on the continent, to those formed in the deep ocean basins. It is be-
yond the scope of this study to examine the tectonic history of this region in .
detail, but the following summary of events should provide the reader with
V 4
o' - . - .'-
"44 444 . -- 4".. . . . . .
... - 4 4 - -. . . . . . . . . . . . . . . .
,"4 4 ~ . 4 * 4 ~ ~ . 4 - ~ * 4 4 . . . . 4 . . 4 4 4 , 4 * * 4 " 5. ,, °

%
GENERAL STRUCTURE AND IGNEOUS '
PETROLOGY, NEW HAMPSHIRE I -46*00'
r7-73WHITE MOUNTAINPLUTONIC-VOLCANIC SERIES %
NEW HAMPSHIREPLUTONIC SERIC$S
r~iOLIVERIAN PLUTONIC SERIES.FRoMING CORE$ OF DOMES
0 10 20 30 40
4t~~~1 e' v.1 40
J-J
.53
* '~'*~' "~4 FRANKLIN FALLS DAM
72'00! 1,30 00
5* %%.* V
7:.I
,'. *. .
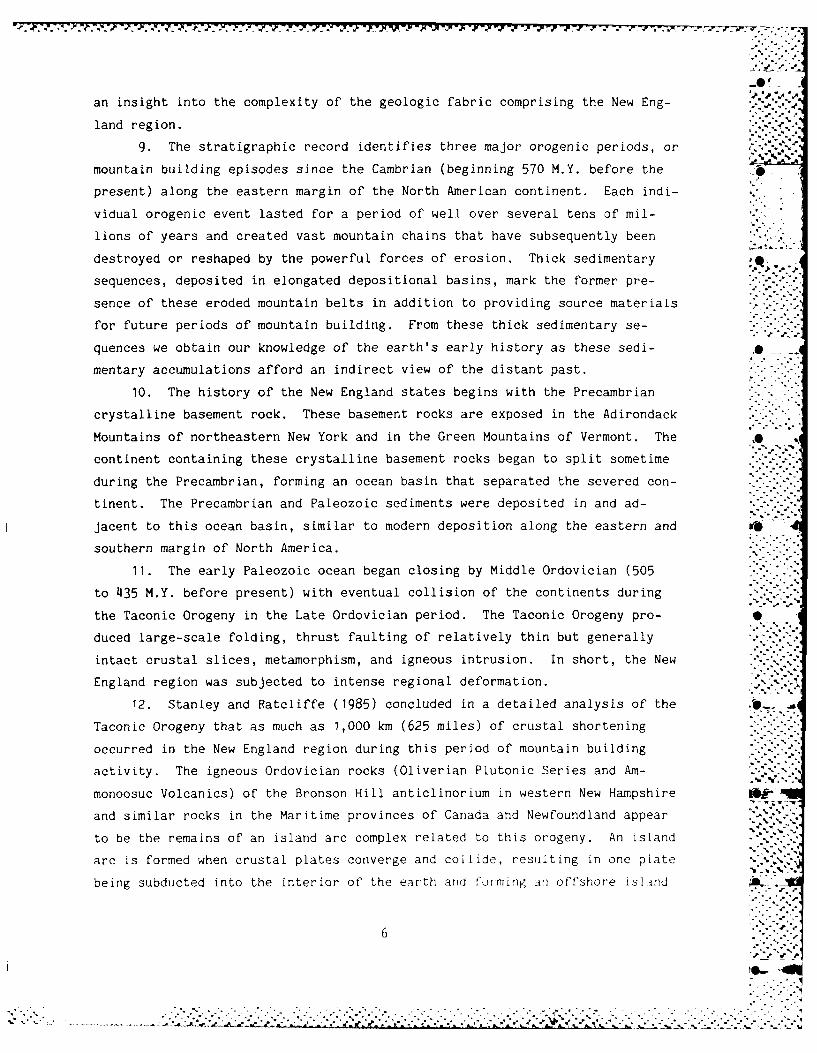
an insight into the complexity of the geologic fabric comprising the New Eng-
land region.
9. The stratigraphic record identifies three major orogenic periods, or '. ,
mountain building episodes since the Cambrian (beginning 570 M.Y. before the
present) along the eastern margin of the North American continent. Each indi-
vidual orogenic event lasted for a period of well over several tens of mil-
lions of years and created vast mountain chains that have subsequently been
destroyed or reshaped by the powerful forces of erosion. Thick sedimentary
sequences, deposited in elongated depositional basins, mark the former pre-
sence of these eroded mountain belts in addition to providing source materials -..-
for future periods of mountain building. From these thick sedimentary se-
quences we obtain our knowledge of the earth's early history as these sedi-
mentary accumulations afford an indirect view of the distant past.
10. The history of the New England states begins with the Precambrian
crystalline basement rock. These basement rocks are exposed in the Adirondack . -
Mountains of northeastern New York and in the Green Mountains of Vermont. The
continent containing these crystalline basement rocks began to split sometime
during the Precambrian, forming an ocean basin that separated the severed con-
tinent. The Precambrian and Paleozoic sediments were deposited in and ad-
jacent to this ocean basin, similar to modern deposition along the eastern and vS
southern margin of North America.
11. The early Paleozoic ocean began closing by Middle Ordovician (505
to 435 M.Y. before present) with eventual collision of the continents during
the Taconic Orogeny in the Late Ordovician period. The Taconic Orogeny pro- S
duced large-scale folding, thrust faulting of relatively thin but generally
intact crustal slices, metamorphism, and igneous intrusion. In short, the New
England region was subjected to intense regional deformation.
12. Stanley and Ratcliffe (1985) concluded in a detailed analysis of the / -
Taconic Orogeny that as much as 1,000 km (625 miles) of crustal shortening
occurred in the New England region during this period of mountain building
activity. The igneous Ordovician rocks (Oliverian Plutonic Series and Am-
monoosuc Volcanics) of the Bronson Hill anticlinorium in western New Hampshire
and similar rocks in the Maritime provinces of Canada and Newfoundland appear -'
to be the remains of an island arc complex related to this orogeny. An island
arc is formed when crustal plates converge and collide, resulting in one plate -
being subducted into the interior of the earth and forming an offshore island
6
. -2" -

with an associated deep oceanic trench. It appears that the Bronson Hill
island arc was the leading edge of the plate that collided with the eastern
margin of North America during the Taconic Orogeny (Suppe, 1985; and Stanley
and Ratcliffe, 1985). The Oliverian Plutonic Series are thought to be a
series of deformed subvolcanic plutons.
13. By Middle Silurian (time period beginning at 420 M.Y. before the
present), erosion eventually wore down the Taconic Mountain Range and the
ocean again transgressed over the eroded continent. The passage of the
Taconic Mountain Range from a prominent physiographic feature to a low area
transgressed by an ocean is recorded by the thick accumulation of sediment
beginning in western New York that is known as the Queenston Delta.
14. The cycle was again repeated in the New England region with the _-
Acadian Orogeny during the Late Devonian Period (375 M.Y. before present).
The ocean was expelled as the crustal plates collided. Large-scale de-
formations were produced during this period of mountain building, that is, V,
folding, faulting, metamorphism, and igneous intrusion. The New Hampshire •
Plutonic Series is related to this period of orogenic activity. The more
prominent types of deformation to occur during this orogeny were large-scale
folding and metamorphism. Several different periods of folding are recorded
in the Bronson Hill antclinorium. The geologic record for this period of
mountain building is defined by the thick sedimentary accumulation beginning
in western New York. This thick clastic wedge, the Catskill Delta, records
the erosion of the Acadian Mountains with the passing of time.
15. The next large-scale period of deformation that occurred along 0
the eastern continental United States began in the Pennsylvanian Period
(320 M.Y. before the present) and ended sometime during the early Permian
Period 275 M.Y. before the present), affecting the central and southern -.
Appalachian Mountains in what is known as the Alleghenian Orogeny. The north-
ern Appalachian region did not generally experience any major deformation at-
tributable to this orogeny period. The deformations associated with this
orogeny are better displayed by the large-scale folding associated with the
sediments of western Pennsylvania, and the igneous intrusion and metamorphism
in Rhode Island.
16. The next major event to mark the geologic record in the northern Ap-
palachian region occurs during the Mesozoic age in the Middle to Late Jurassic
Period (180 M.Y. before the present) with the opening of the present Atlantic
7 -. * °.*,* , . .
1 ~% ° "-I
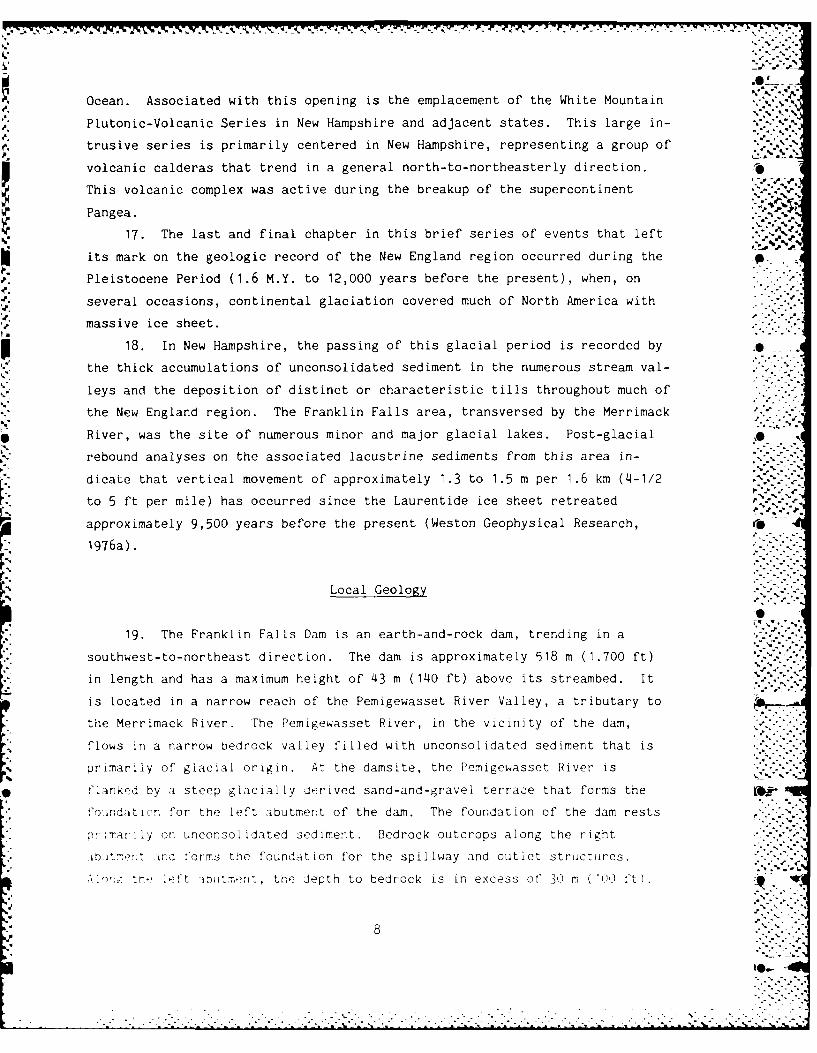
Ocean. Associated with this opening is the emplacement of the White Mountain
Plutonic-Volcanic Series in New Hampshire and adjacent states. This large in-
trusive series is primarily centered in New Hampshire, representing a group of
volcanic calderas that trend in a general north-to-northeasterly direction.
This volcanic complex was active during the breakup of the supercontinent
Pangea. -J
17. The last and final chapter in this brief series of events that left %
its mark on the geologic record of the New England region occurred during the
Pleistocene Period (1.6 M.Y. to 12,000 years before the present), when, on
several occasions, continental glaciation covered much of North America with
massive ice sheet.
18. In New Hampshire, the passing of this glacial period is recorded by
the thick accumulations of unconsolidated sediment in the numerous stream val-
leys and the deposition of distinct or characteristic tills throughout much of
. the New England region. The Franklin Falls area, transversed by the Merrimack
River, was the site of numerous minor and major glacial lakes. Post-glacial
rebound analyses on the associated lacustrine sediments from this area in-
dicate that vertical movement of approximately 1.3 to 1.5 m per 1.6 km (4-1/2
to 5 ft per mile) has occurred since the Laurentide ice sheet retreated
pm approximately 9,500 years before the present (Weston Geophysical Research,
1976a).
Local Geology
19. The Franklin Falls Dam is an earth-and-rock dam, trending in a
southwest-to-northeast direction. The dam is approximately 518 m (1,700 ft)
in length and has a maximum height of 43 m (140 ft) above its streambed. It
is located in a narrow reach of the Pemigewasset River Valley, a tributary to
the Merrimack River. The Pemigewasset River, in the vicinity of the dam,
flows in a narrow bedrock valley filled with unconsolidated sediment that is
primarily of glacial origin. At the damsite, the Pemigewasset River is
t'lanked by a steep glacially derived sand-and-gravel terrace that forms the .ir,
forindatirn for the left abutmer:t of the dam. The foundation of the dam rests
ar,:arily on unconsolidated sediment. Bedrock outcrops along the right
ir torms the foundation for the spillway and outlet structures.
.:'v: the eft t~tm, : , the depth to bedrock is in excess of 30 m ("'00 ft .
I.

,.., J, "., .
20. The unconsolidated sediment underlying the dam is predominantly
coarse grained, consisting primarily of stratified sandy silt and silty sand.
In addition, these unconsolidated sediments generally contain minor amounts of
gravel. It should be noted, however, that a boring drilled near the center of -
the dam during the initial foundation analysis encountered a 6-m- (20-ft-) '
thick zone of cobbles and small boulders beginning at a depth of approximately ,'-.,
16.5 m (55 ft).
21. The bedrock underlying the Pemigewasset River and outcropping near O
the right abutment is a micaceous gneiss and granular mica schist with numer-
ous but minor veins of coarse-grained granite. Detailed boring logs indicate ...
that the bedrock is generally solid with only slight weathering. In addition, .
a general site inspection of the damsite also revealed a narrow (less than S.O..
1 m) andesitic dike that outcrops downstream from the spillway and is ori- .
entated roughly parallel to the spillway. On a much larger scale, the bed-
rock underlying the Franklin Falls Dam is part of the Littleton Formation .....
(Billings, 1955). O
22. The Littleton Formation is present throughout much of central New
Hampshire and has been defined as a series of Devonian metamorphic sediments
believed to have been deformed and metamorphosed during the Acadian Orogeny.
The Littleton Formation varies from a schist to a gneiss and displays dif-
ferent metamorphic grades or facies. These metamorphic grades are defined by
unique metamorphic minerals formed under different temperature and pressure
regimes (i.e., garnet, staurolite, and sillimanite).
23. The stratigraphy of the central New Hampshire area is extremely com- 0
plex. The rocks in this area have undergone intense deformation and repeated
episodes of volcanic or igneous intrusion. The geology of the Franklin Falls
damsite and vicinity is presented in Figure 2 with a detailed definition and
description of individual rock types presented in Appendix A (from Bil-
lings, 1955). It should be noted that several rock or stratigraphic units
from the Billings Geologic Map of New Hampshire have been reassigned to dif-
ferent geologic periods based on more recent geologic data. These changes are s. .
described below.
24. In general, the stratigraphic succession of the central New Hamp-
shire area consists of the intruded Ordovician Oliverian Plutonic domes, com-
posed primarily of granite, quartz monzonite, and granodiorite. The domes are
overiain by the Ammonoosuc Volcanics, a series of metamorphic volcanics in the
i ' -

'bg Sc 01 D' i I iQ Di(.0 (a ..
Di0' .g91 . 0 ~0
01 D Di 01 U d)I ( ) Si
S md
at 0
01 btgDig .
(at Di w
(0 Ig-~ Dig ' g Q
010
DDig
(Digi
CVVDig Di Dig. ig
(.0 DiDii ~ .b(9- DIDi
1200'b~ D15 10 I1
, 0 S 20 KLMETn
Fiue2welg fFaki al anadvcntformof inphboltesin urnoverainby te FtchFormtio, coposd o
marble,~ ~ qurzt1adsit-n ntr oeli yati icniuu%,rtit and cogoeaekonaVhDluh urztadfnlytpe
Thease Figthe 2oug QGartzit is Fanki angulr unconormiyasocatdtity
them Taon unionformiy which canrbest be obeed hFurthertio thepowet intef
Apalachiatforeand This serie of tamnovrhi sedimetsi hascounderoein
tense fLinglto whichmaytaeteiipiieogneltosip.ifcutt n
ter 5e ine Surface n expsues Tlohi surtimplified accountofr stratigraphic nd@
arybewen heuneryig ldr rdvicanrok ndth yunerroksa10e
The ~ ~ ~ ~ ~ ~ ~ ~ ~ ~ ~ ~ ~ ~ ~ ~ d. baeo h luhQatzt sa nua nonomt soitdwt
. .Z_
the~~~~~~ ~ ~ ~ ~ ~ Taoi -nofomt whc can bes beosre.ute otews nter.?.

.° .,. t. i'
sequence of the central Mew Hampshire area, a period of Late Paleozoic andI" .
Mesozoic volcanic intrusions (associated with the New Hampshire and White
Mountain Plutonic Series) is added. Both intrusive series are generally
felsic in composition.
26. It should be noted that the Oliverian Plutonic Series and the White NIP%
Mountain Intrusive Series have been reassigned to different geologic time
periods than described by Billings' (1955) New Hampshire Geologic Map (see r If
Figure 2 and Appendix A). In the case of the Oliverian Plutonic Series--it
has been moved to the Ordovician Period. The White Mountain Series has been
moved to the Late Permian and Early Cretaceous Periods (260 to 190 M.Y.) as a
result of more recent work (including isotopic dating) (Weston Geophysical
Research, 1976a; and Suppe, 1985). 0--_
27. An alternate and more recent view of the rock underlying the Frank-
lin Falls damsite and surrounding vicinity has been expressed by Barosh
(1984). Barosh includes the rocks underlying the damsite, and the majority of
those belonging to the Merrimack synclinorium (including the Littleton
Formation), as part of the Sturbridge geocline. The Sturbridge geocline is a
northeasterly trending belt of generally northwesterly dipping strata, ex-
tending from Connecticut through Massachusetts and into southeastern New
Hampshire. "-
28. Rock beneath the dam is assigned to the Brimfield Group, the upper " ._
most stratigraphic sequence in the Sturbridge geocline. Use of the term _.
Littleton Formation under this more recent classification of New England geol- '1 %Q1
ogy is restricted to its type local in the Bronson Hill anticlinorium and 0 ...
other minor exposures. Under this interpretation, the bulk of the rock clas-
sified as belonging to the Littleton Formation by the Billings' (1955) geo-
logic map is reassigned to the Brimfield Group. In general, the igneous
geology remains unchanged.
29. The age of the Brimfield Group is considered to be Ordovician (Pep-
per, Pease, and Seiders, 1975) and may even be Precambrian in age (Barosh, ..-.
1984). It was originally formed of siltstone, graywacke, and shale that was
later highly metamorphosed to shists and gneiss, intruded by several different
igneous periods, and also cut by numerous west-dipping thrust faults.
30. In summary, the foundation of the Franklin Falls Dam rests primarily
on glacial and fluvial unconsolidated sediments. These sediments are gener-
ally coarse grained, composed of sandy silts and silty sands with minor
.-.O-. -
.-,.-_.- .
;. -.-'.-' '

. .. . . . ~ , -.-
amounts of gravel. Metamorphic rock outcrops along the right abutment of the
dam and immediately upstream and downstream from the dam's outlet structure.
In addition, a narrow andesitic dike outcrops downstream from the spillway and
is orientated generally parallel to it. The metamorphic rock beneath the dam
is chiefly shist and gneiss with minor granitic veins. Stratigraphic and age
relationships of the metamorphic rocks underlying the damsite are questionable
and require further definition. Rock beneath the dam has been assigned to
Littleton Formation by Billings (1955) and to the undifferentiated Brimfield
Group by Barosh (1984). Under the Brimfield Group classification, the term ..-
Littleton Formation is primarily restricted to its type local.
Faulting and Lineaments 0-
31. Surface faulting and lineaments at the Franklin Falls damsite and
vicinity are presented in Figure 3 (from Slemmons and Glass, 1978). Mapped
faulting nearest to the Franklin Falls Dam is located approximately 55 km ,e
(35 miles) to the northeast at Ossipee. Faulting at Ossipee is confined to
the north edge of the igneous intrusion with short fault segments trending in
northeast and north directions. Other areas of known faulting near the
damsite include short northwest and northeast trending faults approximately
55 km (35 miles) southeast of the dam, between Manchester and Portsmouth, and
also approximately 40 km (25 miles) northwest of the dam, near the Vermont and ... ,-.
New Hampshire border. Intense north-to-northeast and northwest faulting oc-
curs west of the Vermont-New Hampshire border in the area known as the Bronson
Hill anticlinorium (see Figure 1), and also to the south, near Boston.
32. On a smaller scale, a general field reconnaissance of the Franklin
Falls damsite and vicinity revealed possible faulting (not previously mapped)
*along the rock face forming the right abutment of the dam. The vertical cliff
face along the right abutment is orientated in a northwesterly direction mea-
suring approximately 120 m (400 ft) in length with approximately 23 m (75 ft)
of exposed relief along segments of the cliff face. A suspected fault zone is
approximately centered on this vertical rock exposure located immediately
" downstream from the crest of the spillway. The fracture zone measures approx-
imately 23 m (75 ft) in width with two normal faults orientated at right
angles to the rock face along a variable north/south to north/15-deg east
* strike with an approximate 70-deg north dip that marks the lateral limits
,12
...... . . ... . .

-~ %l
jo o
to
4k4
K - K,10, y

- . ...
of the zone. Evidence of plastic deformation is visible along the north end .0 .
of the fault zone with drag features present. On the south margin of thiszone, chatter marks and slickensides are visible. Surface evidence for this
fault zone is lacking as vegetation and glacial deposits have covered the area -.
where the suspected zone would intersect the surface. No evidence of recent
faulting was observed along this zone. It is believed that the age of the%d"If_-"V
faulting is related to the regional faulting of this area. * ....
33. Mapped lineaments near the Franklin Falls Dam are more numerous than
the mapped faults. The mapped lineaments are shown in Figure 3 and consist of '.'- ..
several types including those determined by Landsat imagery, topography, aero-
magnetism, and those compiled from other data (Slemmons and Glass, 1978, which
includes data from Barosh, 1977, and Weston Geophysical Research, 1976b). The .O
general trend of these linear features is orientated along northeast and
northwest directions. A major northwest-to-southeast linear is mapped adja-
cent to the dam and runs parallel to the Merrimack River Valley. Barosh -. '--
(1985) includes this linear as belonging to a general zone of northwest 0
trending lineaments that collectively form the Winnipesaukee-Winooski linea-
ment zone. This narrow lineament zone extends from coastal New Hampshire and
Maine through central New Hampshire and into north-central Vermont (see Fig-
ure 20 in Appendix C). In addition to the northwest-to-southeast trend of the "4
Merrimack River, stream drainage throughout the Winnipesaukee-Winooski
lineament zone typically follows this same general orientation.
34. The age of the youngest faulting in the northern New England area, .. ,
particularly the state of New Hampshire and near the damsite, is approximately
middle Mesozoic and is related to emplacement of the White Mountain IntrusiveSeries which marks the opening of the Atlantic Ocean. Using geological and
seismological analyses for nuclear power plant evaluation, detailed studies ... ,
were conducted by Weston Geophysical Research (1976c) on unmineralized joint-
ing from the White Mountain Intrusive Series of the central and northern New
-' England area to identify signs of postintrusion subsidence and offsets. Stud-
* ies conducted at numerous locations along both linear and circular igneous in- ..-. ,
trusions revealed no major structural offsets. It was concluded that, with ___
the exception of crustal depression and rebound associated with the Pleis-
tocene continental glaciation, no evidence was detected of anomalous crustal
deformation since emplacement of the White Mountain Series of intrusives. The
Weston studies found no evidence of Pleistocene faulting in the central New
Hampshire area.
14
e~~~~. °ee gn,_e.-e
°.d.,o
.- . .
.. . . . . . . ". , . . .

"- %%
"
35. A later study for signs of active faulting in New England was per-
formed by Slemmons, Sanders, and Whitney (1980). Their study included a low-
sun angle aerial reconnaissance examination of major faults, lineaments, and
seismic zones. Their study examined faulting north of the Boston area along
the Clinton-Newberry fault zone, at Cape Ann, at the Ossipee hot spots, andother areas in New England. Their study concluded that the faults were in-
active and that the age of the faulting was Paleozoic or Mesozoic.
15-
.S%--
° . -. .
. % * .-"- - - .
o...-.° ; .
~. ... j
° .. .
~ -. ~***~* ~A A - , -

PART III: SEISMIC HISTORY
Distribution of Historic Earthquakes
Introduction
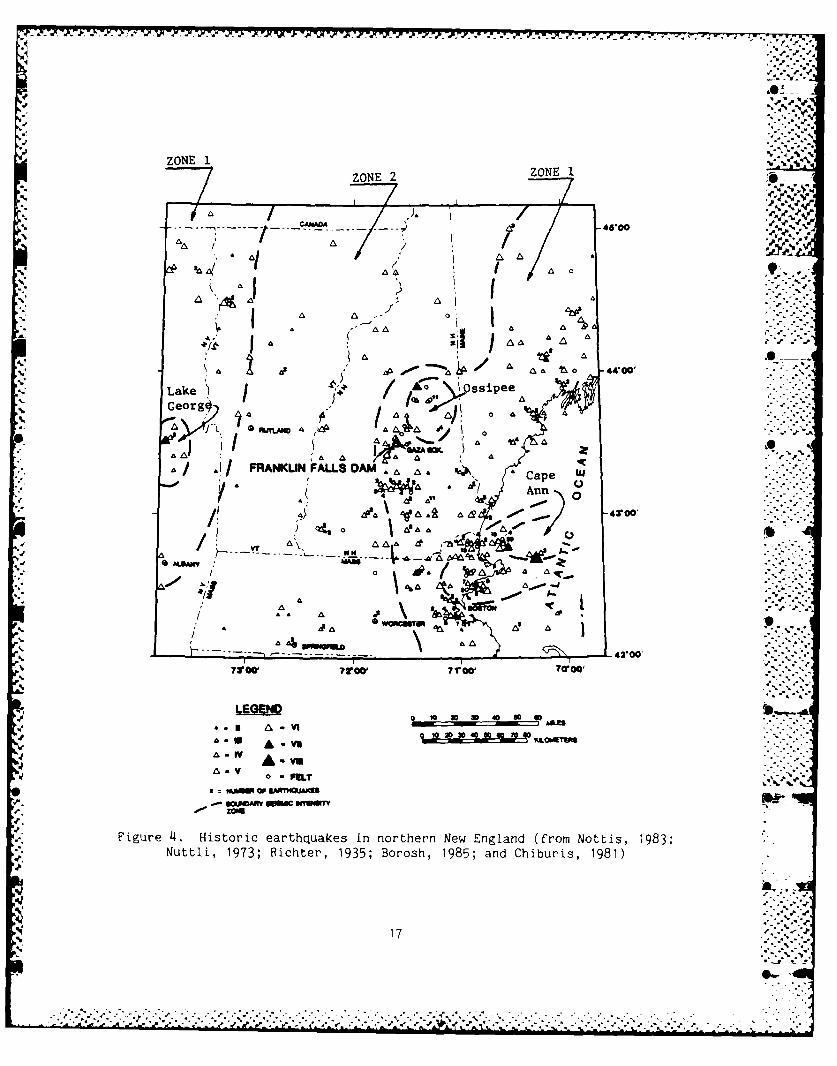
36. The distribution of historic earthquakes for the northern New Eng-
land region from 1627 to 1982 is presented in Figure 4. A catalog listing
these earthquakes is presented in Appendix B and is derived primarily from '., .Nottis (1983), with additional data from Nuttli (1973), Richter (1935), Barosh
(1985, see Appendix C), and Chiburis (1981). The list of historic earthquakes
is arranged by state and includes geographic and coordinate location of the
epicenter, date, earthquake magnitude, and earthquake intensity. e0
37. The magnitude scale in common use is the Richter Scale that is re-
tricted to fairly recent events as seisometers are used in magnatude deter-
minations. In the New England region, only since 1977 have adequate earth-
quake motions been instrumentally measured and recorded, particularly for very e
. weak or low magnitude earthquakes.
-. 38. The intensity scale in common use is the Modified Mercalli (MM) In-
tensity Scale (see Figure 5) that rates earthquakes according to the damage
produced in structures and landforms and by the manner in which the earthquake
is felt. Use of this scale allows historic earthquakes to be catalogued from ./-*-.
written accounts as described by newspapers or personal diaries. A review of " -
Figure 5 indicates that at intensity MM III ground shaking is just noticeable,
at intensity MM VIII damage is slight in well-engineered structures, and at 0
intensity MM XII the damage is total.
Historical seismicity
39. An examination of the historic earthquake catalog (Appendix B) and
Figure 4 identifies New Hampshire and the northern New England and adjacent.--
areas as experiencing low-to-moderate seismic activity. Over a period of more
than 350 years, two events of MM VIII occurred offshore from Cape Ann in Mas-
sachusetts, and one event occurred at Massena, New York. Five events of
MM VII have occurred at several locations--one event in southeast Maine, one kiw-
at Cape Ann, two at Ossipee in New Hampshire, and one event at Warensburg, New
, York. The remaining historic earthquakes (approximately 600) are less than
MM VII. The overwhelming majority of historic earthquakes have been MM IV, or . .
Less.
16
I.-
* -,-- 'S
- - - - - --- - - - - - -.. ~ - - - - - -- %
4? 4-4., %
Lak 9P sie
4 A0
MAAWA
4 A
2 lw 2'00?VOWA ?rw VO Mo
-IV
0IIL2 wL1a -."UAM
80.MM sea= "no
'V. ?00 7OO' V0O'7000
Figue 4.Hisoriceartquaes i nother NewEngand fromNotis, 983
Nutli 1973; Riher 95;Brsh 95;adCh rs, 91
A-17
.116
A ir-e. L ~ soi atcu si oter e nln fo ots 93

. 5-,, .,*- w ..J--.-5-w...' . -- .- .- -. - -J -,~ ' -. . .. . . . .. . . . . . . . . . .. -. - -
MODIFIED MERCALLI INTENSITY SCALE OF 1I --
(Abridged)
1. Not felt except by a very few under especially favorable circumstances.I. Felt only by a few persons at rest, especially on upper floors of buildings.
Delicately suspended objects may swing.III. Felt quite noticeably indoors, especially on upper floors of buildings, but
many people do not recognize it as an earthquake. Standing motor carsmay rock slightly. Vibration like passing of truck. Duration e.timated.
TV. During the day felt indoors by many, outdoors by few. At night someawakened. Dishes, windows, doors disturbed; walls made crackingsound. Sensation like heavy truck striking building. Standing motorcars rocked noticeably.
V. Felt by nearly everyone; many awakened. Some dishes, windows, etc.,broken; a few instances of cracked plaster; unstable objects overturned.Disturbance of trees, poles and other tall objects sometimes noticed. %
Pendulum clocks may stop.VI. Felt by all; many frightened and run outdoors. Some heavy furniture
moved; a few instances of fallen plaster or damaged chimneys. Damageslight. .
VII. Everybody runs outdoors. Damage negligible in buildings of good designand construction; slight to moderate in weU-built ordinary structures;considerable in poorly built or badly designed structures; some chimneysbroken. Noticed by persons driving motor cars.
VIII. Damage slight in spe.ially designed structures; considerable in ordinarysubstantial buildings with partial collapse: great in poorly built struc-
tures. Panel walls thrown out of frame structures. Fall of chimneys,factory stacks, columns, monuments, walls. Heavy furniture overturned.Sand and mud ejected in snll amounts. Changes in well water. Dis- 0turbed persons driving motor cars.
IX. Damage considerable in specially designed stnctures; well designed frame
structures thrown out of plumb; great in substantial buildings, with
partial collapse. Buildings shifted off foundations. Ground cracked
conspicuously. Underground pipes broken.X. Some well-built wooden structures destroyed; most masonry and frame
structures destroyed with foundations; ground badly cracked. Rails bent.
Landslides considerable from river banks and steep slopes. Shifted sand
and mud. Water splashed (slopped) over banks.XI. Few, if any (masonry), structures remain standing. Bridges destroyed.
Broad fissures in ground. Underground pipe lines completely out of .
service. Earth slumps and land slips in soft ground. Rails bent greatly.
XII. Damage total. Waves seen on ground surfaces. Lines of sight and level
distorted. Objects thrown upward into the air.
Figure 5. Modified Mercalli Intensity Scale of 1931
(abridged) (from Barosh, 1969)
40. North of the New England states, well removed from the Franklin
Falls damsite, and along the St. Lawrence River Valley in Quebec, Canada, mod-
erate to severe earthquake activity has occurred. The St. Lawrence River
Valley has had one event of MM X, four events of MM IX, one event of MM VIII,
and two events of MM VII. The ground motions created by these earthquakes and
felt at the Franklin Falls damsite are examined in greater detail.
41. An examination of the historic earthquake record for the New Hamp-
shire area identifies well over 200 earthquakes occurring between 1728
and 1982. These are concentrated primarily along the eastern boundary and in
the southern half of the state. Moving outside of New Hampshire's boundaries,
18
,°.
f%"
.." -.
" - " " '" " " ""' " "i"i-" % "-,""" ":" "-" " " '- """" " """"'" " "" -" "'" "" """ "-" """ %""" " " ' -""-""" , ". """- ." -"

the distribution of historical earthquakes is primarily concentrated in a nar-
row zone along the eastern margin of the continental United States, along a
100-km- (60-mile-) wide zone extending from southern Massachusetts into %
Maine. Earthquake activity is generally diminished outside this zone.
Further to the west, in western Vermont and eastern New York, the distribution .'
of earthquake activity is again appreciably increased. Earthquake activity in
this area is concentrated around Lake George, New York. Within the coastal
zone, earthquake activity is concentrated in several distinct areas--off the S
coast of Massachusetts at Cape Ann, the Ossipee area in New Hampshire, and
along the Merrimack River in New Hampshire and Massachusetts.
Earthquake zones
42. In Figure 4 on the basis of the distribution of historic earthquakes,
seismic boundaries were drawn. These boundaries separate the northern New
England region into distinct earthquake zones--a coastal zone of relatively
greater seismicity (Zone 1' and a relatively stable interior region
(Zone 2). In addition, an interior region in eastern New York is shown as A
Zone 1 because of its locally greater seismicity. An earthquake zone as used
in this report is an inclusive area over which a given maximum credible
earthquake can be assigned. This is the largest earthquake that can reason-
ably be expected to occur. It may be moved anywhere in the earthquake zone,
and thus is a floating earthquake. The earthquake is moved in this manner
because causative faults in the northern New England area have not been
identified.
43. The presence of causative surface faulting is important as earth- ..
quake sources and an estimation of intensity can be easily determined. Earth-
quakes are produced when strain energy is suddenly released in the form of
movement along a fault, either an existing or newly created fault. Strain
energy causing faulting is derived from regional tectonic stresses produced
within the earth's crust. The sudden movement or slip of the earth's crust
produces an elastic rebound between the fractured segments resulting in vi-
brations felt as an earthquake. Severe earthquakes are caused by slippage ."-
along large fault segments from tens to hundreds of kilometres in length. I, -
The depth of fault movement must also reach crystalline basement rock in order .. ..
to provide the large stress drop and energy release to produce the severe ... '
earthquake shaking.
44. In the Franklin Falls area, surface evidence of recent movement
* 19
7 .. . . .
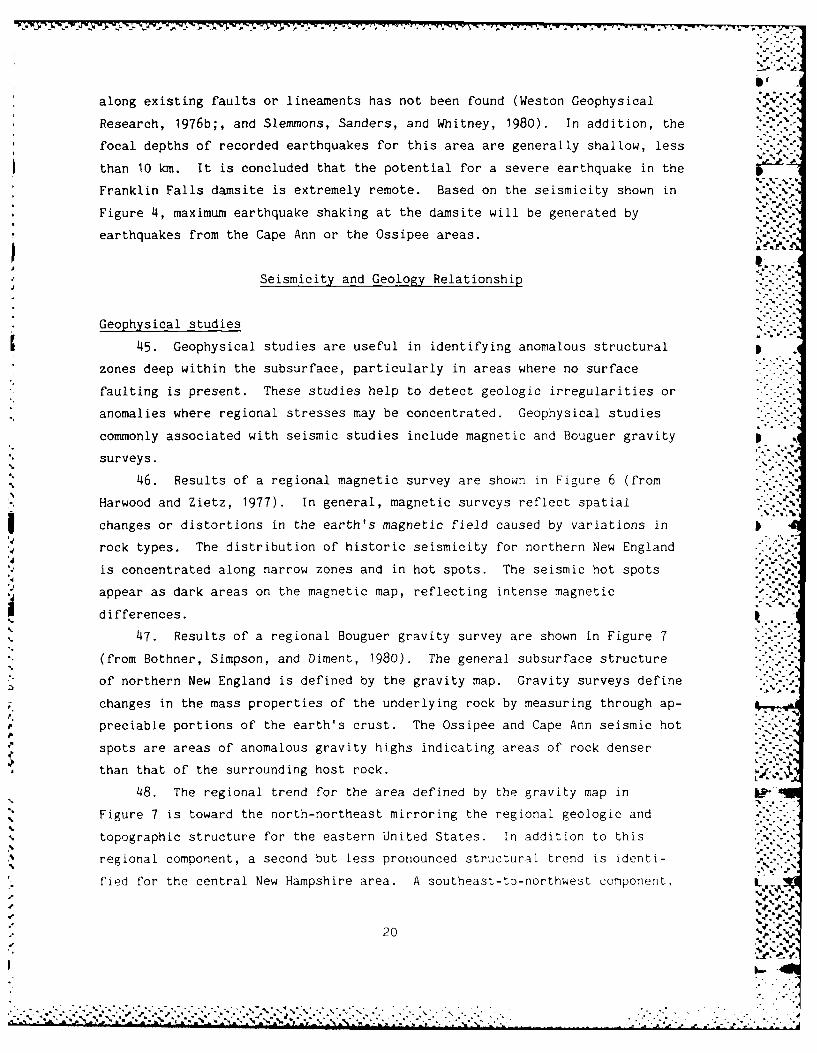
along existing faults or lineaments has not been found (Weston Geophysical
Research, 1976b;, and Slemmons, Sanders, and Whitney, 1980). In addition, the
focal depths of recorded earthquakes for this area are generally shallow, less
than 10 km. It is concluded that the potential for a severe earthquake in theV VI
Franklin Falls damsite is extremely remote. Based on the seismicity shown in '.. .
Figure 4, maximum earthquake shaking at the damsite will be generated by
earthquakes from the Cape Ann or the Ossipee areas. .
Seismicity and Geology Relationship .'.
Geophysical studies
45. Geophysical studies are useful in identifying anomalous structural
zones deep within the subsurface, particularly in areas where no surface
faulting is present. These studies help to detect geologic irregularities or
anomalies where regional stresses may be concentrated. Geophysical studies
commonly associated with seismic studies include magnetic and Bouguer gravity I
surveys.
46. Results of a regional magnetic survey are shown in Figure 6 (from
Harwood and Zietz, 1977). In general, magnetic surveys reflect spatial
changes or distortions in the earth's magnetic field caused by variations in
rock types. The distribution of historic seismicity for northern New England
is concentrated along narrow zones and in hot spots. The seismic hot spots
appear as dark areas on the magnetic map, reflecting intense magnetic
differences.
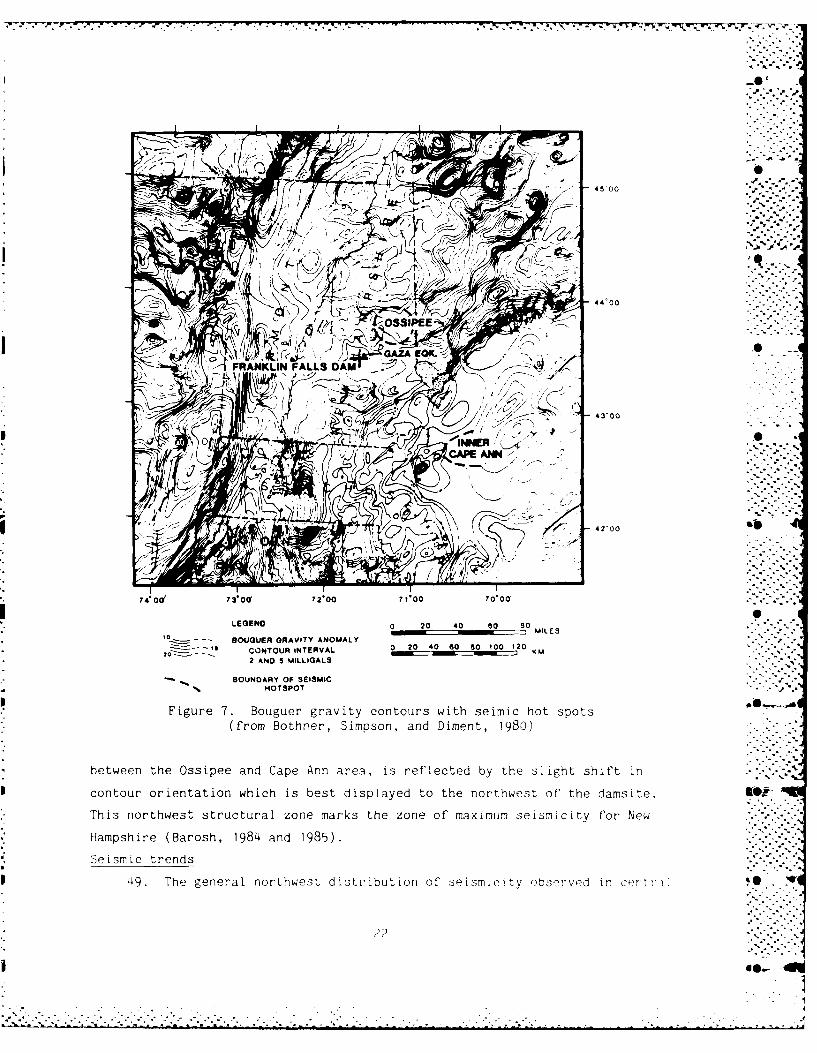
47. Results of a regional Bouguer gravity survey are shown in Figure 7
(from Bothner, Simpson, and Diment, 1980). The general subsurface structure
of northern New England is defined by the gravity map. Gravity surveys define
changes in the mass properties of the underlying rock by measuring through ap-
preciable portions of the earth's crust. The Ossipee and Cape Ann seismic hot
spots are areas of anomalous gravity highs indicating areas of rock denser
than that of the surrounding host rock.
48. The regional trend for the area defined by the gravity map in WO
Figure 7 is toward the north-northeast mirroring the regional geologic and
topographic structure for the eastern United States. In addition to this
regional component, a second but less pronounced structural trend is identi- . ..
fled for the central New Hampshire area. A southeast-to-northwest component, L
20
p -!,

~,%
o 44'00!
"00.H. .-- -.
o4
FRA.* V %FALLS GAZ
rW~
0 10 20 30 40 so
''CONdTOUR INTERVALS 50 AND) 200 0AWAAS 0 20 0 60 0 S
Mp=00 KM
BOUNDARY OF SEISWU HOTSPOT%
Figure 6. Magnetic anomalies with seismic hot spots *
(from Harwood and Zietz, 1977)
21
45 00
4400
0 %
LEGEND 0 20 40 80 so
- OUGUER ORAVITY ANOMALY ~M.E-L' CONTOUR INTERVAL 0 04 0BM0 2
2 AND 5 MIL LIGALS
BOUNDARY OF SEISMICNOT SPOT
Figure 7. Bouguer gravity contours with seimic hot spots(from Bothner, Simpson, and Diment, 1980)
between the Ossipee and Cape Ann area, is reflected by the slight shift in
I contour orientation which is best displayed to the northwest of the damsite. Kok..
This northwest structural zone marks the zone of maximum seismicity for New
* Hampshire (Barosh, 198'4 and 1985).
* Seismic trends
I49. The general northwest distribution of seismnicity observed in cert r< 0

New Hampshire is believed to be part of a much longer seismic belt that ex-
tends from Boston to north of Ottawa, Canada (Fletcher, Sbar, and Sykes, - 4
1978). The Boston-Ottawa trend is approximately 160 km (100 miles) in width
and is inferred to extend offshore to the northwest extension of the New
England Seamounts. This trend parallels a similar trend (postulated by the
above authors) to extend from Charleston, South Carolina, to New Madrid, Mis-
souri. The New Madrid area was the site of intense earthquake activity during
the early 1800s. S
50. These long and linear seismic trends, according to Fletcher and his -
associates, mark Middle-to-Late Mesozoic rift zones that formed during the
opening of the Atlantic Ocean. These Paleo-rift zones are regions of crustal
weakness containing large-scaled igneous intrusions (i.e., White Mountain -
Intrusive Series). As a result, the ancient rift zones are regions where
crustal stresses are focused, and when released produce earthquake activity..
A major implication of this theory is that severe earthquakes can occur along
the full length of the seismic zone, even in areas where the historical record S
indicates that no such activity has occurred.
51. Another seismic trend previously mentioned is a general north-to- . .
northeast seismic distribution identified by Aggarwal (1978) as the Piedmont-
Appalachian trend. This northeast trend extends from northern Virginia into
Maine, paralleling the Atlantic coastline. This trend is discussed later in
greater detail.52. In summary, the distribution of historic earthquakes, based on a %
nearly 40C-year record, defines areas or zones where seismic activity is con- I
centrated. Seismic limits as used in this report are restricted to zones or
areas where historical activity has previously occurred. To project an earth-
quake into an area or a zone that has displayed no seismic history, but is .
considered part of a major trend, such as in the Boston-Ottawa seismic trend,
is not considered valid by the present authors unless there is some additional
evidence in the form of seismicity that suggests a hot spot or a tendency to
produce a hot spot.
Causes of seismicity
53. Several theories have been proposed to explain seismicity for the . .
New England states as n, major faulting has been identified to account for the
moderate earthquake activity. Barosh (1981) suggests that most of the seismic
qctivity along the northern Atlantic coast can be explained in terms of
23
-... ?. .- .-.
. . . . . . . . .. . . . . .-.- * *.-*o"
* ,-. -- *~.7777:. 7.--7- 7777 7 - - - -
-t >~.'4. 4
-
0I00
IbI All
E4
If >c
24
4C.

._ . ...
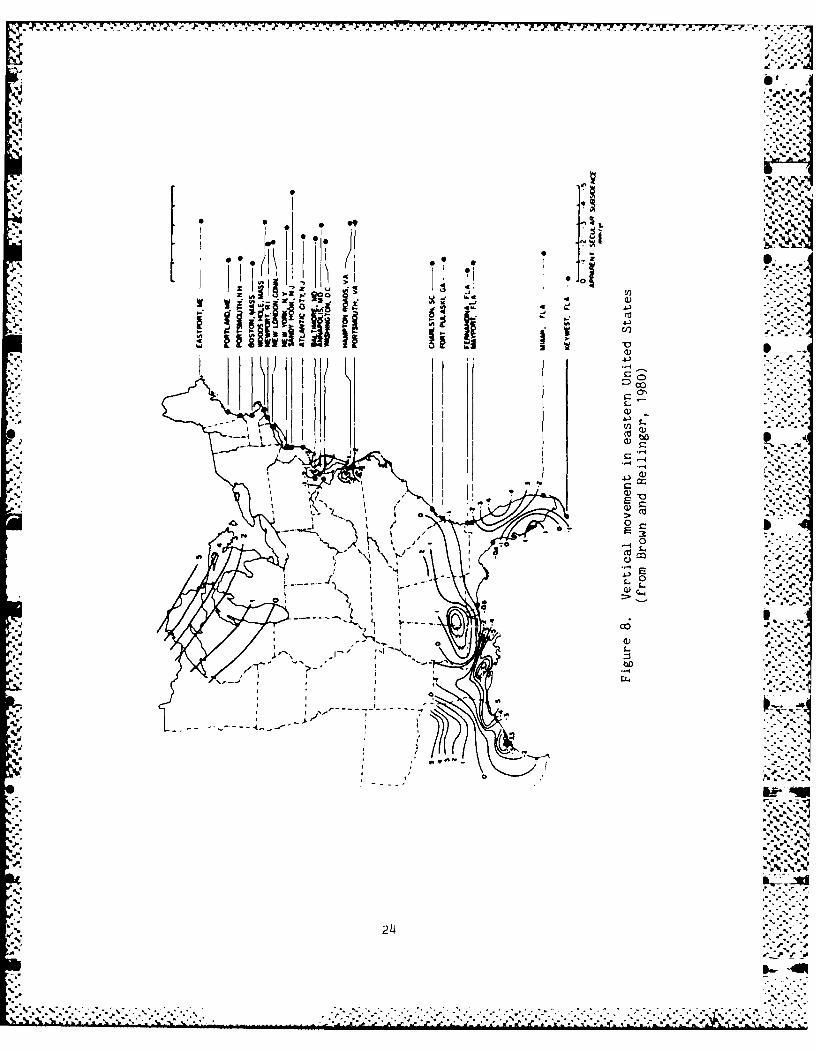
regional subsidence. This subsidence is apparently caused by the continued
opening of the Atlantic Ocean. Subsidence along the eastern coastline for
selected cities was defined by Brown and Reilinger (1980) indicating a vari-
able subsidence rate, between 1 and 4 mm (in.) per year, from coastal Con- b
necticut to Maine, as shown by Figure 8.
54. Other views of New England seismicity, particularly at Cape Ann and ... --
Ossipee, are described below (from Krinitzsky, 1984). '-%
a. Focusing of regional stresses at heterogeneities (plutons) in 0the subsurface and release of the stresses along preexisting deep ...seated faults (Weston Geophysical Research, 1976d). ,.,,
b. Possible small-scale introduction of magmatic material into the -.
plutons at depth with an accompanying buildup of stresses.
c. Focusing and release of regional stresses along the Boston-Ottawatrend (Sbar and Sykes, 1973). This trend is interpreted as anancient rift zone with magmatic intrusions and is thus a zone ofweakness.
d. Slow regional compression causing activation of preexisting regionaloverthrusts (Wentworth and Mergner-Keefer, 1980).
e. Extensional movement which activates irregularities in thecoastline, principally where major grabens intersect the down-warping. Inland these forces may cause activation of preexistingfaults with northwesterly and northerly orientations (Barosh,1981). This view is an extension for the cause of seismicity that -
was initally proposed in this section. .. '-
Earthquake Recurrence
55. Prediction of seismic hazards or earthquake recurrence of a spe- 0
cific intensity for a designated geographical location is based on probability
theory. A major problem with a probability approach is that earthquake pre-
aiction requires personal judgment of the seismic source areas and attenu
ation of the earthquake event to the area of interest. A second major problem r.
with this approach is that it fails to identify a maximum event which can
realistically be expected to occur. The probability approach assumes that . .
because no maximum event is specified, the frequency of such an event be
comes greater with more and more time elapsing. In terms of the operating
life for an engineering structure, such an approach can be misleading as the '. .p
typical operating life for a dam is approximately 100 years.
56. A probablistic approach was employed by Acharya, Lucks, and
Christian (1982) for the Boston, Massachusetts, area, which is approximately
4%.
25

M. .'o.' .
145 km (90 miles) south of the Franklin Falls Dam. Results of this study,
calculated by several different workers and methods, indicated that the
recurrence interval for a intensity VII (MM) earthquake for the Boston area
ranges from approximately 1,000 years to nearly 12 million years. -
57. Another study of interest describing earthquake recurrence in close .%
,,. proximity to the Franklin Falls damsite was conducted by Toksoz (1982) on the
Knightville Dam in Huntington, Massachusetts. An earthquake catalog similar
to the one presented in Appendix B was used by Toksoz for estimating earth-
quake recurrence. This study concluded that for an intensity VII (MM)
earthquake, the return time was approximately 80 years, an intensity VIII (MM)
earthquake could be assumed to occur every 330 years, and an intensity IX (MM)
earthquake every 1,300 years.
58. An alternate study for the entire New England area, as opposed to a
specific geographical location, was conducted by Chiburis (1980) and thereturn frequencies for various intensity levels are as follows.
I.
Mean ReturnMM Intensity M Time, years .
VI 4.6 0.6 .
5.0 1.1
VII 5.2 1.5
5.5 8.8
VIII 5.8 53
6.0 175
IX 6.4 1,923
6.5 3,500
M Magnitude (Ms ) for events greater
than 6.5 (not specified for less than6.5).
59. For the purposes of this report, the rate of recurrence is not
used. Instead, a deterministic approach is followed where a maximum earth-
quake is interpreted to occur for the seismic region or zone, regardless of
recurrence time. As a result, a maximum earthquake is thus assigned to a
site or seismic zone and is attenuated to the area of interest from the site 2
26 -
.: .. .. .

- ... -.-.-. '-
or zone boundary. The basic assumption in this deterministic approach is -
that the engineering structure of interest must be designed to withstand the ..
predicted intensity of a maximum credible earthquake and its associated ground
motions.
a."o_..
I_
27.,-..
'. ". "
...,. --.,.,-

PART IV: SEISMIC SOURCE ZONES ".A
Earthquakes Felt at Franklin Falls Damsite
60. An individual examination was conducted for all historic earth-
quakes of intensity MM VI or greater for the study area (see earthquake
catalog in Appendix B) that were judged to have been felt at the Franklin ,. * .
Falls damsite. These earthquakes are presented geographically and chrono-
logically in Table 1. Included in Table 1 are several major earthquakes
* judged to have been felt at the Franklin Falls damsite but well removed from
the study area boundaries (i.e., at New Madrid, Missouri, Charleston, South
Carolina, and in the St. Lawrence River Valley, Quebec, Canada). Distances .0
from the damsite to the earthquake source area are included in Table 1 along
with the interpretation of attenuated earthquake intensity at the damsite.
61. The attenuation procedure selected for this study is based on the
diminution of intensity with distance, as determined by Chandra (1979). This .
procedure, using the curve for the eastern province, is shown in Figure 9.
Attenuation of MM intenstiy with distance is determined by first calculating
the distance in kilometres between the earthquake epicenter and the area of
interest, selecting this distance on the horizontal axis of the attenuation *
curve in Figure 9, and then deriving the MM intensity reduction factor on the
vertical axis. The intensity reduction factor is subtracted from the MM in-
tensity value at the source to produce the attenuated intensity at the site of
interest.
62. The earthquake list in Table I spans approximately 350 years of rec- %
ord and shows that only 39 earthquakes were judged to have been felt at the
damsite for this period. The distribution of felt earthquakes is as fol-
lows: five events of MM intensity II, seven events of MM intensity III,
thirteen events of MM intensity IV, and seven events of MM intensity V. The
severest earthquakes interpreted to have been felt at the damsite were MM
intensity VI on seven separate occasions. These seven earthquakes are all _ "
centered less than 150 km (93 miles) from the damsite. The vast majority of 'U
these earthquakes occurred less than 60 km (37 miles) from the damsite. These
seven earthquakes originated from three general locations: Cape Ann, Ossipee,
and along a 40-km (25-miles) reach of the Merrimack River with Franklin Falls
located in the approximate center of this zone.
28 -%.-.* Q
.% -.% . % % • -. . . . . .. -. .° . %. ... ...... . % " % . .. . .. .. .. °... . %"% ° • - . -°.- . .° ° -° ." . ,

0.00- %.*. . *,./
-- . h'
-2.0 - "e'
EASTERN PROVINCE (P-SiCENr , U.',
I- o -. !::. :-:
-4.0
0 10) 200 300 400 5W
ENCENTRAL W 6TANCI. KM
Figure 9. Attenuation of MM intensities, with distance (A Anderson, . - |
G = Gupta, H-S = Howell-Schultz) (from Chandra, 1979)
63. A recent and well-recorded MM intensity VI earthquake, centered
- approximately at Gaza, New Hampshire, occurred on 19 January 1982 (time ex-
pressed in Universal Coordinate Time; time expressed in Eastern Standard Time b
would have the earthquake occurring on 18 January 1982). This earthquake was %%.
recorded by several strong motion accelerograms, including instruments locatedat the Franklin Falls Dam approximately 9.0 km (6 miles) southwest of the
epicenter. The strong motion records from the dam registered a peak accel- S
eration of 0.55 g. Other locations of strong motion recordings are shown in
Figure 10 (from Chang, 1983). Strong motion recordings were registered at
four other dams--Union Village, North Hartland, North Springfield, and Ball
Mountain.
64. The strong motion recordings generated by the Gaza earthquake in-
.. clude the highest values recorded east of the Rocky Mountains. In addition, -.
these strong motion recordings indicate that earthquake motions attenuate more -*.
rapidly to the south than to the west and southwest (Krinitzsky, 1984). These RF -
relationships are valuable for the development of earthquake patterns and
distance-related motions in the New England region. The peak ground motions %,.
at the Franklin Falls damsite have been incorporated into the Corps of
, .. +. ,- •
P' 29
29 ~--
S . S . :-:.:-. .;: ",:.-+-,;-""- --;-- - --:- k -:.-",--"-:--"----"-- - - ;- -- "-' ' :"": - -". ."."-.".-.- -.:". .'-.-.. . . .:'".":-.:".-.. . . .-.- ". .:-. .

LEGEND .. /4
+4. EPICENTER. IS JAN 1982N.H. ECK(.
UNION VILLAGE DAM%x ACCELEROMETERS
NOT TRIGGEREDS - LONGITUDINAL AXIS OF DAM
4% WHITE RIVER JUNCTION
FRANKLIN FALLS DAM
X CONCORDe
X( MANCHESTERVAI.HOSPITAL J
10 0 10 20 30 0aM1
0?1 0 10 4000d 50 9M _
VERMONT NEW HAMPSHIRE -
73 71'
Figure 10. Locations of principal strong motion recordingsgenerated by the 18 January 1982 New Hampshire earthquake ..
(from Chang, 1983)
Engineers' strong motion data collection and the specifications on near field
motions (Chang, in press).
65. A detailed report of the Gaza earthquake is included in Appendix C ~ -*
(Barosh, 1985). The Gaza earthquake was felt over much of the New England
region and parts of Canada. This earthquake was judged to have been felt
over an area of approximately 127,000 sq km of the United States (Stover et
al, 1983) (see Figure C8, Appendix C). Included in Appendix C is a detailed N
assessment of the damage in the epicentral area of the Gaza area, as 2W* investigated and described by Barosh.
%p.-.
30
e. 0--

Earthquake Zones and Intensities
66. The earthquake zones previously defined (see Figure 4) are assigned a
floating MM intensity value based on a detailed review and analyses of the 1
regional and local geology and historic seismicity. Within each earthquake .
zone, the assigned value is constant for any site in the zone or the hot spot
boundary. The earthquake intensity value assigned to each zone is relatively
conservative with one MM intensity value greater than the largest historical .
earthquake identified for that zone. Two seismic zones and three hot spot
areas are identified by the data described above. Floating earthquake inten-
sities and the approximate corresponding Richter magnitude for these areas .
are as follows (see Figure 11): .
Area MM Intensity Richter Magnitude.. • .
Zone I VII 5.5 "
Zone 2 VI 5.0 S
Cape Ann (inner) IX 6.3
Cape Ann (outer) VIII 6.0
Ossipee VIII 6.0
Lake George VIl 5.5
67. The corresponding Richter magnitudes shown above are based on the ,
general relationships developed by Mitronovas (1982) for New York and adjacent
areas. In addition, the Cape Ann area is judged to have an inner and outer S
seismic zone, as defined by the historical seismicity (see Figures 4 and 11
for limits). The earthquake intensities from these source zones attenuated to
the Franklin Falls damsite, including the distance from the source (1o) to the
site (Is), are defined as follows.-. . ," -
Source Distance, km MM 1o MM Is .. ,.
Zone 1 Local VII VII
Zone 2 12 V vi ,"
Cape Ann (inner) 110 IV VII
Cape Ann (outer) 94 VIII VIOssipee 21 VII VIII ".
Lake George 152 VII IV
31
% %~

Ir.p _W.
N
qAAAA 45*00
ZONE OEZONE TWO .-MI.=u I MU=VI
,k I a00,
I ~ ' HOTSPOT
00/ 1 / I&M ='
DAN
LAKEVIV M:O1O01
-GERG CAP 1300
-. ~lm = VON0
32*0
Figue 1.: Seimi sorc zone an maximum
ielw_ c- e%%.5 7-t %,*=='5
~ S % *

68. In summary, the most severe earthquakes that have the potential to
be felt at the Franklin Falls damsite are those originating from the Ossipee
hot spot. The maximum earthquake interpreted for the Franklin Falls damsite
from the Ossipee area is an intensity MM VIII earthquake. Intensity VII
earthquakes at the damsite are possible from a severe earthquake originating -
in the inner Cape Ann area and from a local earthquake in Zone 1.
%'f3 '.
•.° .4' "
33-...... d
.'5 -. '
°"."o.° '-

PART V: EARTHQUAKE MOTIONS AT FRANKLIN FALLS DAMSITE /
Field Conditions '. -
69. Ground motions from the above-identified sources and felt at the
Franklin Falls damsite are of two general types. Ground motions originate -
either from near field or far field sources. Simply defined, near field %./4.
sources or conditions are those occurring near the source and characterized
by a large range of ground motions caused by asperities in the fault plane
that produce the earthquake, complicated reflection and refraction patterns, .-
resonance effects, and impedance mismatches. Near field conditions are diffi- .- :
cult to predict because of the numerous complications associated with the
motions. In contrast, far field conditions are well removed from the source,
the wave patterns are generally muted or dampened, and as a result the ground
motions are more predictable.
70. Near or far field conditions are determined by the following
empirical relationship of distance and magnitude developed by Krinitzsky and
Chang (1977).
Richter MM Maximum Radius of sitMagnitude Intensity Near Field .-
M Io km
5.0 VI 5
5.5 VII 15
6.0 VIII 25 ,
6.3 to 6.5 IX 35
-,,, ..
71. In summary, the near and far field conditions are determined by the
severity of the earthquake that governs the distance of separation between the
two field conditions.
Recommended Motions
72. The Franklin Falls damsite is susceptible to earthquakes by both
near and far field sources as follows (see Figure 11):
34
.... -.. -

* Zone 1-near field: MM intensity VII, M : 5.5
Zone 1-far field: MM intensity VII, M 5.5
Ossipee-near field: MM intensity VIII, M 6.3 to 6.5
Ossipee-far field: MM intensity VIII, M 6.3 to 6.5
Other: Earthquake Zone 2 and the Lake George and the CapeAnn hot spots are eliminated from consideration as earth- . .
quakes from Zone 1 and the Ossipee hot spot would be equalto or greater than earthquakes from these sources.
73. The parameters for earthquake motions specified in this report are
horizontal peak acceleration, velocity, and duration. Duration or the total
*] time of measured ground motion is bracketed duration and is greater than or
equal to 0.05 g. Values are for free-field motions on rock at the surface.
74. The ground motion parameters of interest to the engineer are deter-
mined from the Krinitzsky and Chang curves (see Krinitzsky and Marcuson, 1983)
• relating intensity to the three ground motion variables. Figure 12 is for a
. near field (NF) hard site and relates intensity to acceleration (Figure 12a),
velocity (Figure 12b), and duration (Figure 12c). Similarly, Figure 13 is for S
a far field (FF) hard site. The maximum ground motion values from the source
areas of concern are summarized in Table 2 where G equals acceleration based
on one G = 980 cm/sec2 ( 32 ft/sec2), V velocity expressed in centi-
metres per second, and T duration in sec.
75. As shown by Table 2 and Figure 13, far field ground motion data for
a hard site having an intensity MM VIII earthquake are missing. Recorded
Sground motion data for a far field, hard site, intensity MM VIII earthquake
j have not been measured and are believed not to exist. An intensity VII earth-
* quake marks the threshold of intensity for a far field site for which ground
motions have been identified. As an alternative for the MM VIII data for a
hard site however, ground motion data are available for an intensity MM VIII
*. earthquake for a soft site and are presented in Figure 14 (see also Table 2).
It should be noted that, except for duration, the near field hard site data
exceed the far field soft site data for the Ossipee area. Duration for the
soft site is three to four times greater than the near field hard site.
76. Recommended peak motions are the mean plus one standard deviation or .
the 84 percentile. Values at this level are conservative as these values are
determined from the historic seismicity which also includes a conservative
safety margin. Values from the mean plus two standard deviations are used
W, only if a proven causative fault were present at or adjacent to the site. No
35

(n) NOR. DATA UNITS(2.....0 LIMIT OF DATA PACOIMA
11 MEAN +2w _ 2---- EN + N" OR DATA UNITS 2
...... MEAN ___ LIMIT OF DATA
1.ACOI1A/ 110 --- MEAN * 2c' PAOMNEAR FIELD --- MEAN + o
10- HARD SITE (2) -0MA100-
09HARD SITEi
I, (12) ~0.3 -14(2W . so -, -
0O.7 . 7
(161 KYA, I~~ 0.6 MELENOY) -
FRANKLINPAOMFALSDA- ~ GAZLI
A GAZLI40 - -
0.2 -- /
0. - -- -
00 ----JI.
ME X M ITNST 316 -C M -zI w i E EMM INUMTVMM INTENISITY
a. Acceleration versus MM intensity b. Velocity versus MM intensity
*3
k 74 40 NERFIELD--- -_
a HARD SITE
(211 2--2
0 MM NTENITMM.. INTESIT
c. Duration versus MM intensity
Figure 12. Ground motion data for a near field, hard site, all earthquakes
36
- - -- - -' --.....

In HOR.J. - . DAT UNIT W. YOR OAT U . . . -
W6.9>
-0MEAN -0 MEAN0.- - k. ~ 4
-- tallEUREKA. CA
0.1- (30)-1 -' - - -
0.2.
14 1.42(ni ~ ~ ~ ~ ~ ~ . PO.DT NTS-4 *4
Mu ~ ~ HR SITEIYMMITEST
In bA nA ~~
-x---------------w
---- MA - -
307
101
0..
1z IE x '1M
MU... I .'.-.. 4

',,l...... .: LIMIT. Of.r .DATA , -.. .. . ... , 3 ..":.I. OF DATA '' R.- . F.-I..-EL -D. ,.., . 2?.... ,. , , ,
0.5 - EN+24 o - MA 1
(ni..V, DATUN.T
LMANO+ wT"O.T ST....... •LIIT F DTA.. LIMIT OF DATA FAR FIELD.---- MEAN 2.5...-MAN 0--°AEANAN -'---- SOFT SITE-"
---- MEAN ( r (74) (2) MS6.9-. 0 MEAN -0 MEAN
c0. 'FAR FIELD~ (2) __- u 0 I _ .__ _
SOFT SITE,,- M54.9 7) i'""0.30 0 .(1341
cc .3
(134) (16ri.2 O20- (106) "*'.. " . ..
..,.,,..0.1 --- - 10'- --
IX r 3 3 3 " 33 x w Ir " rm 3 1K xAM INTENSITY MM INTENSITY
-,... ',
a. Acceleration versus MM intensity b. Velocity versus MM intensity
so..
In) NOR. DATA UNIS1........ 4 LIMIT OF DATA FAR FIELD
so ---- & MEAN + 2w SOFT SITE -" -'MEAN + S.3,/
-MEAN40.--- -'- °
0
w (70) (2)
- !-I l '"""I.,0
MM INTENSITY
c. Duration versus MN intensity
Figure 14. Ground motion data for a far field, soft site, M 5 6.9
38.
"" ~38 ""'"-' .-v:..5,.
,r. ". .-% 5"4" ~~- . ".
5." '" '
"-,- -"' , .'."-"" .". .". -- "-'-S- -2 ;" - -- " " " " ,"' " " ' - '- : .' " -"' " ".".- -- ,' . .'' . . '.

& .~. .. - .. ...M•* ...
evidence of causative faulting has been defined for the Franklin Falls damsite
and vicinity.
77. Figure 12a has some very high values, over 0.5 g, for accelerations ,'
at Melendy Ranch and at the Franklin Falls Dam. These are high-frequency, 0
high-spiked acceleration peaks with low energy. Nuttli (1979) defines %
criteria for measuring peak values and indicates that these values are not ,
considered valid for design purposes unless the structural components have
natural frequencies between 10 and 25 Hz. ..- *
78. The recommended values for mean plus one standard deviation for peak
motions are as follows: '0.
%
Earthquake Acceleration Velocity Duration .0Source G cm/sec Sec, 0.05 g
Zone 1 (FF) 0.15 27 9
Ossipee (NF) 0.38 25 6., .'
Recommended Accelerograms
79. Table 3 presents a selection of accelerograms and associated groundmotion data interpreted for the Franklin Falls damsite. The selection of
accelerograms includes two from a FF site (earthquake from Zone 1) and two ....
from a NF site (earthquake from the Ossipee area). A scaling factor for each
accelerogram is included in Table 3. The accelerograms are presented in
Appendix D. The data for these accelerograms are derived from the following
three sources: the California Institute of Technology (1971-1975), US Geo-
logical Survey (1983), and US Department of Conservation Division of Mines and
Geology (1984).
80. The accelerograms are obtained from soft, intermediate, and hard
sites that are identified in Table 3. The scaling factor for the four ac- *.
celerograms ranges from 0.5 to 1.2. The distance from the source area to the
site is representative of study area conditions which, for the FF, is nearly
40 km while the NF ranges from 14 to 25 km.
81. The records presented in Table 3 are by no means the only records
that may be used. They are presented as appropriate accelerograms to be used
in an engineering analysis of the damsite. -
-&.•- ..'°.°.
Motions for Nearby Nuclear Power Plants
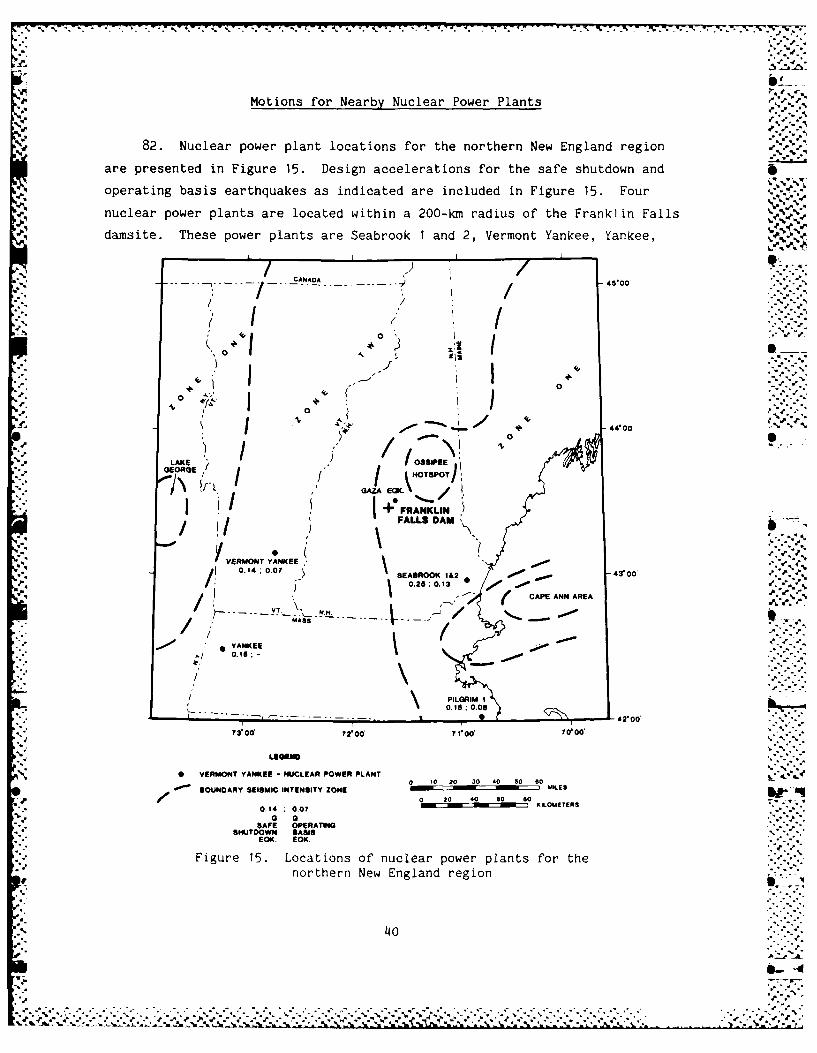
82. Nuclear power plant locations for the northern New England region
are presented in Figure 15. Design accelerations for the safe shutdown and
operating basis earthquakes as indicated are included in Figure 15. Four
nuclear power plants are located within a 200-km radius of the Franklin Falls
damsite. These power plants are Seabrook 1 and 2, Vermont Yankee, Yankee,%
CANADA 40
01 0
0
o 4'e00'
LAKE 03S)PS5/ 0101, /f ( \OTSPOT)
, i/ FALLS DAM'
VEMNT YANKEE %.j 0.14 .0? SEABROOK 1A42 43'00 4'4
4.../ y0.25 0.13NM ,~' CAPE ANN AREA
YANKEE./ 0.16;
I PILGAIM I
JA- 0 A 42*00'
:r d0 2 iro' 700' 70*00*
II VERMONT YANKEE - NUiCLEAR POWER PLANT0 10 20 30 40 so so
SOUNDARY SEISMIC INTENSITY ZONE -H~ Cz3ENz MES
0 20 d0 so s00.14 ; 0.07 0t= KILOUETERS
SAFE OPERATINGSI4JTOOWN BASIS
10K. OK.
Figure 15. Locations of nuclear power plants for thenorthern New England region
S--

*I
° , , . p . - . ..- - -. •- .. .
and Pilgrim !. Two nuclear power plants, Seabrook 1 and 2 and Pilgrim 1, are
located in Zone 1. The Seabrook 1 and 2 power plant is located near the Cape
Ann area.
83. Peak accelerations for Zone 1 nuclear power plants compare favorably
with those selected for Zone 1 at the Franklin Falls damsite. Ground motion
values for the Franklin Falls damsite originating from the Ossipee area are
much higher than those accorded to the Seabrook 1 and 2 plant near the Cape
Ann area as the Franklin Falls damsite is located along the margin of the "
Ossipee seismic hot spot.
84. The recommended ground motions for the Franklin Falls damsite are
more conservative than the maximum peak accelerations assigned to the nuclear
power plants. However, the Franklin Falls damsite is in closer proximity to ,0
an area of intense seismic activity than any of these New England power
plants. ...
* Amplification of Base Motions at the Dam Crest
85. The seismic stability of nonliquefiable embankment dams can be esti-
mated by idealization of the potential slide mass as a sliding block on an
inclined plane that undergoes earthquake-induced accelerations. The technique
known as a pseudostatic stability analysis can serve as a useful screening
procedure to distinguish between safe dams and those requiring more special-
ized evaluation techniques, such as a dynamic analysis.
86. A necessary step in a pseudostatic evaluation of embankment sta-
bility is to determine the amplification of the base motions into the dam or
embankment. Amplification curves have been developed by Hynes-Griffin and
Franklin (1984) for estimating the amplification factor provided that the area
of concern is not subject to earthquakes of magnitude 8 or greater, materials
,,. in either the embankment or the foundation are not susceptible to liquefaction
*.'. under the design cyclic loading, or the dam does not have safety-related .- -
features that are vulnerable to small displacements.
87. These amplification curves were derived from 27 strong motion M
earthquake records and from computed amplification values from numrous . -.
visco-elastic shear beam analyses. The curves for determining tho estimated
*- amplification of earthquake-generated motions at any point -4ithir 'he Jam or
embankment are shown in Figure 16 and consist of three curv,es r v's' ; ... ,h -
.41
.
.- . •-4
% % % % .. °

mean, mean plus one standard deviation, and the upper bound of the peak ampli- /- ,4
fications observed from each record. To use the curves, simply calculate the ..
ratio between the the depth of sliding (y) being investigated as compared with
the total thickness of the embankment (h) and then find the corresponding am- S
plification factor for this ratio. The amplification factor obtained is then %.A
multiplied by the peak bedrock acceleration value to estimate an upper-bound
amplified acceleration at the depth of interest in the embankment.
CREST 0 -"-'"
0.2
y_T' h
0.4
y/h* C b
0 +
0.6 40b
0.8
BASE 1.00 1.0 2.0 3.0 4.0 5.0
amplification factor
Figure 16. Amplification factor for embankment dams (from
Hynes-Griffin and Franklin, 1984)
88. The amplification factor for the peak acceleration in an earth
dam at the crest ranges from 3, 4~, or 5 times depending on the degree of
y/h // .'S.-.-
severity specified. Results of this study indicate the Franklin Falls dam-
site is susceptible to a maximum credible earthquake originating from the
Ossipee area and having a peak bedrock acceleration of 0.38 G. As defined
'42
i" l 1 .- .-
?',E,-,.':
by the Hynes-Griffin and Franklin curves, peak acceleration at the dam's crest
using the maximum credible earthquake value would be less than 1.14 G, 1.52 G, -
or 1.9 G depending on the amplification curve specified. The mean plus one
standard deviation value (1.52 G) is considered a reasonable estimate for the
Franklin Falls damsite by this technique. The upper bound curve in Figure 16
would be extremely conservative since no known causative surface faulting is
present in the study area; the assigned value for the maximum credible earth- " --
quake already has a conservative factor of safety built in; and, last, the
historic record indicates no major earthquake activity is associated with the
study area. Actual motions or motions found to occur by a more detailed
analysis will probably be less. .[.
4*0 4
43~
. .. .-. .
,.'.
............... .,

• .
PART VI: CONCLUSIONS '
89. A seismic zoning was developed for the northern New England region
based on the geology, historic seismicity, and geophysical data. The seismic S
zones include an interior stable zone, a narrow active coastal margin, and
several seismic hot spots. The seismic hot spots are Ossipee, Cape Ann, and
Lake George. Floating earthquakes were assigned to these seismic zones as no
active faults have been identified for the northern New England region.-,-. -
90. The Franklin Falls damsite is susceptible to a floating earthquake "
as follows:
Zone 1: Local source, MM VII, M 5.5 0
Ossipee: Distance : 21 ki, MM VIII, M = 6.o to 6.3
Cape Ann: Distance 110 km, MM VII, M 5.5
91. Recommended peak motions based on the MM intensity and ground motion
relationships of Krinitzsky and Chang (1977) are as follows:
Earthquake Acceleration Velocity Duration
Source G, in m/sec2 cm/sec sec, 0.05 g
Zone 1 0.15 27 9 -..
Ossipee 0.38 25 6
Values for Zone 1 and the Cape Ann area are identical. Accelerograms and
response spectra (Appendix D) for the recommended peak motions are included as a.
representative of appropriate ground motions. . .
44-..
"'av.;-
LS,,".-
% " -" "."%*1
a'". " -. .- "
~"-a a-." a"." '' "° '" * " -"" -"" '" ' -"." .' " - " " ' '" .' - " " '." ". """"""" ' """ ".' " " "' -"=
a. a . m . ,m .m . _m . ., ,L J . .. .,_.z -- ,m a. = * . . . m ._ ._. a _. . . I.im .- . i_ , .,','# . _ , - a ._. ak . -

N N
REFERENCES
Acharya, H. K., Lucks, A. S., and Christian, J. T. 1982. "Seismic Hazard in .Northeastern United States," Soil Dynamics and Earthquake Engineering Confer-
ence, Southampton, England, pp 979-996.
Aggarwal, Y. P. 1978. "Earthquake Risk Provinces in Northeastern North
America," Earthquake Notes, Vol 49, No. 3, p 8.
Barosh, P. J. 1969. "Use of Seismic Intensity Data to Predict the Effects ofEarthquakes and Underground Nuclear Explosions in Various Geologic Settings,"Bulletin 1279. US Geological Survey, Washington, DC.
1977. "Preliminary Map Showing Bedrock Geology Superimposed onan Aeromagnetic Base Map of the Worcester Region, Massachusetts, Connecticut,Rhode Island," Open-File Report 77-131, scale 1:250,000, Washington, DC.
1981. "Causes of Seismicity in the Eastern United States: APreliminary Appraisal," Earthquake and Earthquake Engineering: the Eastern .United States, Vol 1, pp 397-417.
1984. "Geology of Coastal Lowlands Boston, MA to Kennebunk, ME,"
76th Annual New England Intercollegiate Geologic Conference, Lindley S.Hanson, ed., Salem State College, Mass.
1985. "Summary and Analysis of the 1982 Gaza, New HampshireEarthquake," prepared for the US Army Engineer Waterways Experiment Station,Vicksburg, Miss.
Billings, M. P. 1955. "Geologic Map of New Hampshire," US Geological Survey,Washington, DC, scale 1:250,000.
Bothner, W. A., Simpson, R. W., and Diment, W. H. 1980. "Bouguer Gravity Mapof the Northeastern United States and Adjacent Canada," Open-File Report80-2012, US Geological Survey, Washington, DC.
Brown, L. D., and Reilinger, R. E. 1980. "Releveling Data in North America:Implications for Vertical Motions of Plate Interiors," Dynamics of PlateInteriors, A. W. Bally, P. L. Bender, T. R. McGetchin, and R. I. Walcott,
eds., American Geophysicial Union, Geodynamics Series, Vol 1, pp 131-144.
California Institute of Technology. 1971-1975. "Strong Motion EarthquakeAccelerograms; Corrected Accelerograms and Integrated Ground Velocities and
Displacements," Vol 2, Parts A-N, Earthquake Engineering Research Laboratory, -Pasadena, Calif. h
Chandra, U. 1979. "Attenuation of Intensities in the United States," Bul-letin Seismological Society of America, Vol 69, No. 6, pp 2003-2024.
Chang, F. K. 1983. "Analysis of Strong-Motion Data from the New HampshireEarthquake of 18 January 1982," NUREG/CR-3327, Nuclear Regulatory Commission,Washington, DC; prepared by the US Army Engineer Waterways Experiment Station,
Vicksburg, Miss.
Chang, F. K. (in press). "Earthquake Response Spectral Analysis of an EarthDam in the Eastern United States," Proceedings 3rd US National Conference onEarthquake Engineering, Charleston, S. C.
45 -.. .j _
.o.
'... . . . . . . . . . . . . .. . .

Chiburis, E. F., 1980. "Seismicity, Recurrence Rates, and SeismicRegionalization of the Northeastern United States and Southeastern Canada,"New England Seismotectonic Study Activities During Fiscal Year 1980, WestonObservatory, Boston, Mass.; pp 23-26.
Chiburis, E. F. 1981. "Seismicity, Recurrence Rates, and Regionalization of
the Northeastern United States and Adjacent Southeastern Canada," WestonObservatory, Boston, Mass.; prepared for Nuclear Regulatory Commission,Washington, DC.
Fletcher, J. B., Sbar, M. L., and Sykes, L. R. 1978. "Seismic Trends andTravel Time Residuals in Eastern North America and Their TectonicImplications," Bulletin, Geological Society of America, Vol 89, pp 1656-1676.
Harwood, D. S., and Zietz, I. 1977. "Geologic Interpretation of an Aero-
magnetic Map of Southern New England: Map GP-906," US Geological Survey,
Washington, DC. .
Hynes-Griffin, M. E., and Franklin, A. G. 1984. "Rationalizing the Seismic
Coefficient Method," Miscellaneous Paper GL-84-13, US Army Engineer WaterwaysExperiment Station, Vicksburg, Miss.
Krinitzsky, E. L. 1984. "Geological-Seismological Evaluation of EarthquakeHazards at Surry Mountain Damsite, New Hampshire," Technical Report GL-84-7,US Army Engineer Waterways Experiment Station, Vicksburg, Miss.
Krinitzsky, E. L., and Chang, F. K. 1977. "State of the Art for AssessingEarthquake Hazards in the United States, Specifying Peak Motions for DesignEarthquakes," Report 7, Miscellaneous Paper S-73-1, US Army Engineer WaterwaysExperiment Station, Vicksburg, Miss.
Krinitzsky, E. L., and Marcuson III, W. F. 1983. "Principles for Selecting -'Earthquake Motions in Engineering Design," Bulletin of the Association of
Engineering Geologists, Vol 20, No. 3, pp 253-256.
Mitronovas, W. 1982. "Earthquake Statistics in New York State," Earthquake
Notes, Vol 53, No. 2, pp 5-22.
Nottis, G. N., ed. 1981. "Epicenters of the Northeastern United States and ..... ,Southeastern Canada, Onshore and Offshore; Time Period 1534-1980," New York 3
State Geological Survey Map and Chart Series, No. 38, New York State Museum,University of the State of New York, Albany, N. Y.
Nuttli, 0. W. 1973. "Seismic Wave Attenuation and Magnitude Relations ofEastern North America," Journal Geophysical Research, Vol 78, pp 876-885.
-- 1979. "The Relation of Sustained Maximum Ground Acceleration and
Velocity to Earthquake Intensity and Magnitude," Miscellaneous Paper S-73-1,Report 16, State of the Art for Assessing Earthquake Hazards in the UnitedStates, US Army Engineer Waterways Experiment Station, Vicksburg, Miss. .-.-..
Pepper, J. D., Pease, M. H., and Seiders, V. M. 1975. "Stratigraphic andStructural Relationships of the Brimfield Group in Northeastern Connecticut
and Adjacent Massachusetts," US Geological Survey Bulletin 1389, Washington,DC.
Richter, C. F. 1935. Elementary Seismology, W. H. Freeman and Co., San
Francisco, Calif.
I46
if-, "l-• [~..1.
i~~b . 2 ._ ¢ ' 4. ..4 ,£,.2,le_'.... f .,.:- . '.€_, '¢ ¢ ,_ :_,t € _ .. . -'ie .-'m -'._''_,_ ._:_-_,_;2 ._', :".. '

%
Sbar M. L., and Sykes, L. R. 1973. "Contemporary Compressive Stress andSeismicity in Eastern North America: An Example of Intra Plate Tectonics,"Geological Society of America Bulletin, Vol 84, No. 6, pp 1861-1881.
Slemmons, D. B. and Glass, C. E. 1978. "Remote Sensing Analysis of Fault-Related Structures in New England and Related Seismic Hazard at Corps ofEngineers Projects," prepared for the US Army Engineer Division, New England, ._ _Wal tham, Mass. %"
Slemmons, D. B., Sanders, C., and Whitney, R. A. 1980. "Low-Sun Angle AerialReconnaissance of Faults and Lineaments of Southern New England," prepared forthe US Army Engineer Division, New England, Waltham, Mass.
Stanley, R. S., and Ratcliffe, N. M. 1985. "Tectonic Synthesis of theTaconian Orogeny in Western New England," Geological Society of AmericaBulletin, Vol 96, No. 10, pp 1227-1250.
Stover, C. W., et al. 1983. "Earthquakes in the United States, January-March1982," Geological Survey Circular 896-A, US Department of Interior, GeologicalSurvey.
Suppe, J. 1985. Principles of Structural Geology, Prentice-Hall, Inc.Englewood Cliffs, N. J.
Toksoz, M. N. 1982. "Seismic Hazard Analysis for the Knightville Dam,Huntington, Massachussetts: Geology and Seismicity Report," US Army EngineerDivision, New England, Waltham, Mass.
United States Department of Conservation, Division of Mines and Geology.1984. "Strong Motion Data from the Morgan Hill, California Earthquake ofApril 24, 1984," Interim Report Morganhill 84, Sacramento, Calif. .•
United States Geological Survey. 1983. "The Coalinga Earthquake SequenceCommencing May 2, 1983," Open-File Report 83-511.
Wenthworth, C. M., and Mergner-Keefer, M. 1980. "Atlantic-Coast Reverse-Fault Domain: Probable Source of East-Coast Seismicity," Geological Societyof America Abstracts w/Program, Vol 12, 1o. 7, p 547.
Weston Geophysical Research. 1976a. "Summary Report Geologic and Seismologic "Investigations," Boston Edison Company, Pilgrim Unit 2, Docket No. 50-471.
1976b. "Geologic Investigations," Boston Edison Company,Pilgrim Unit 2, Docket No. 50-471.
1976c. "Model of the White Mountain Series Intrusives Basedon Gravity and Magnetic Data," Boston Edison Company, Pilgrim Unit 2, Docket
L No. 50-471.
.- ,_______ 1976d. "Aeromagnetic Survey of Southeastern New England andthe Western Gulf of Maine," Boston Edison Company, Pilgrim Unit 2, Docket . .
No. 50-471.
.,4,.
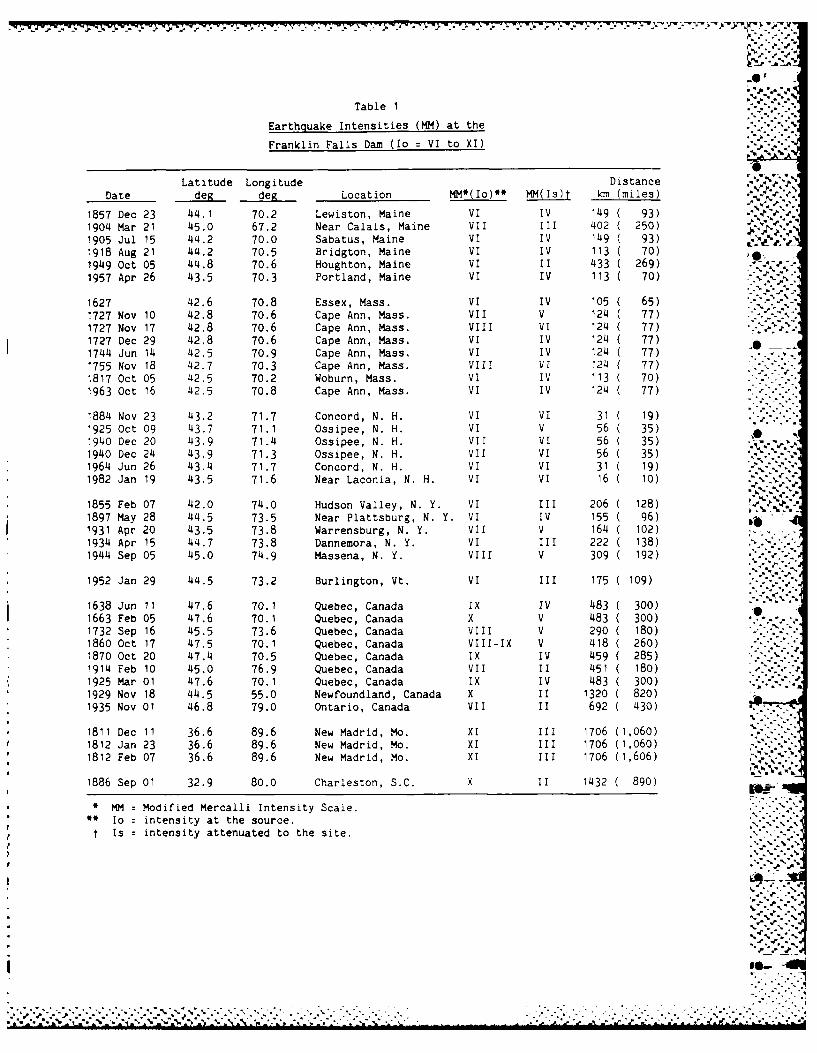
m- -:- '_ -77, . -7
, .. .. -..os
Table 1
Earthquake Intensities (MM) at the %
Franklin Falls Dam (Io = VI to XI)-'.A
Latitude Longitude Distance ',
Date deg deg Location MM*(Io)** MM(Is)t km (miles) .-
1857 Dec 23 44.1 70.2 Lewiston, Maine VI IV 149 ( 93) , J .1904 Mar 21 45.0 67.2 Near Calais, Maine VII III 402 ( 250)1905 Jul 15 44.2 70.0 Sabatus, Maine VI IV 149 ( 93)1918 Aug 21 44.2 70.5 Bridgton, Maine VI IV 113 ( 70)1949 Oct 05 44.8 70.6 Houghton, Maine VI II 433 ( 269)1957 Apr 26 43.5 70.3 Portland, Maine VI IV 113 ( 70) --. "
1627 42.6 70.8 Essex, Mass. VI IV 105 ( 65)1727 Nov 10 42.8 70.6 Cape Ann, Mass. VII V 124 ( 77)1727 Nov 17 42.8 70.6 Cape Ann, Mass. VII VI 124 ( 77)1727 Dec 29 42.8 70.6 Cape Ann, Mass. VI IV 124 ( 77) A1744 Jun 14 42.5 70.9 Cape Ann, Mass. VI IV 124 ( 77)1755 Nov 18 42.7 70.3 Cape Ann, Mass. Vill VT 124 ( 77)1817 Oct 05 42.5 70.2 Woburn, Mass. VI IV 113 ( 70)1963 Oct 16 42.5 70.8 Cape Ann, Mass. VI IV 124 ( 77)
1884 Nov 23 43.2 71.7 Concord, N. H. VI VI 31 19)1925 Oct 09 43.7 71.1 Ossipee, N. H. VI V 56 35)1940 Dec 20 43.9 71.4 Ossipee, N.H. VII VI 56 35) A
1940 Dec 24 43.9 71.3 Ossipee, N. H. VII VI 56 35)1964 Jun 26 43.4 71.7 Concord, N. H. VI VI 31 19)1982 Jan 19 43.5 71.6 Near Laconia, N. H. VI VI 16 10)
1855 Feb 07 42.0 74.0 Hudson Valley, N. Y. VI Ill 206 ( 128)1897 May 28 44.5 73.5 Near Plattsburg, N. Y. VI IV 155 ( 96)
1931 Apr 20 43.5 73.8 Warrensburg, N. Y. VII V 164 C 102)1934 Apr 15 44.7 73.8 Dannemora, N. Y. VI III 222 C 138)1944 Sep 05 45.0 74.9 Massena, N. Y. VIII V 309 ( 192)
.-. ", .. '
1952 Jan 29 44.5 73.2 Burlington, Vt. VI III 175 ( 109).,-
1638 Jun 11 47.6 70.1 Quebec, Canada IX IV 483 ( 300)1663 Feb 05 47.6 70.1 Quebec, Canada X V 483 ( 300)1732 Sep 16 45.5 73.6 Quebec, Canada VIII V 290 ( 180)1860 Oct 17 47.5 70.1 Quebec, Canada VIII-IX V 418 ( 260) .
1870 Oct 20 47.4 70.5 Quebec, Canada IX IV 459 ( 285) ".-1914 Feb 10 45.0 76.9 Quebec, Canada VII II 451 ( 180) '-**..1925 Mar 01 47.6 70.1 Quebec, Canada IX IV 483 ( 300)1929 Nov 18 44.5 55.0 Newfoundland, Canada X II 1320 ( 820)1935 Nov 01 46.8 79.0 Ontario, Canada VII II 692 ( 430)
1811 Dec 11 36.6 89.6 New Madrid, Mo. XI IlI 1706 (1,060) ".-'"'" "'-1812 Jan 23 36.6 89.6 New Madrid, Mo. XI III 1706 (1,060) -:-[1812 Feb 07 36.6 89.6 New Madrid, Mo. XI III 1706 (1,606)
* , ,. .a .k
1886 Sep 01 32.9 80.0 Charleston, S.C. X II 1432 ( 890)
* ' MM Modified Mercalli Intensity Scale. ....
Io intensity at the source. ,-.*.t Is: intensity attenuated to the site. - .
p../:..pW. .', '
a, °. ",
,.,-
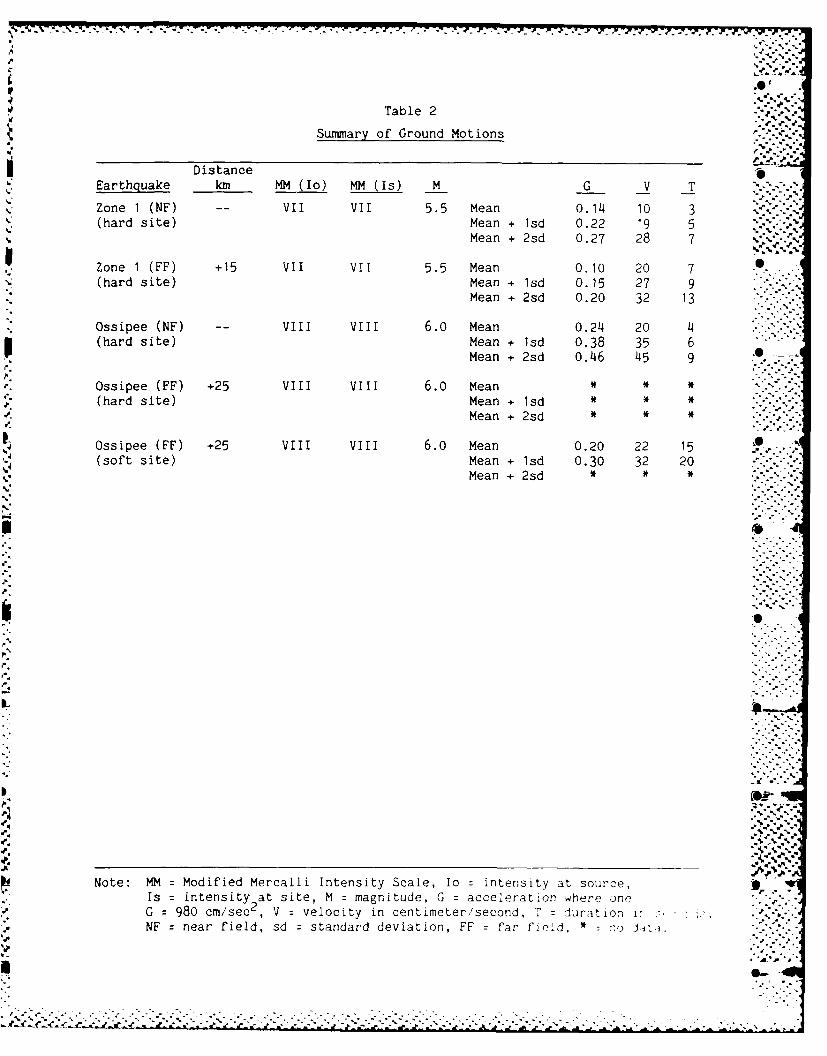
J.S A-
Table 2
Smayof Ground Motions
I DistanceEarthquake km MM (10) MM (Is) H G V T
Zone 1 (NF) -- VII VII 5.5 Mean 0.14 10 3(hard site) Mean + lsd 0.22 19
Mean +2sd 0.27 28 7
*Zone 1 (FF) +15 VII VII 5.5 Mean 0.10 20 7(hard site) Mean + sd 0.15 27 9
Mean + 2sd 0.20 32 13
*Ossipee (NF) -- VIII VIII 6.0 Mean 0.24 20 4(hard site) Mean + lsd 0.38 35 6
Mean + 2sd 0.46 45 9
Ossipee (FF) +25 VIII VIII 6.0 Mean * *(hard site) Ma~s
Mean +2sd * *
Ossipee (FF) +25 VIII VIII 6.0 Mean 0.20 22 15- ~ (soft site) Mean + lsd 0.30 32 20
Mean +2sd * *
PI
Note: MN Modified Mercalli Intensity Scale, Io intensity at source,-. Is intensity at site, M = magnitude, G = acceleration where one
G 980 cm/sec2 , V velocity in centimeter/second, T duration iNF znear field, sd zstandard deviation, F far fie1d *' to jA.
glI
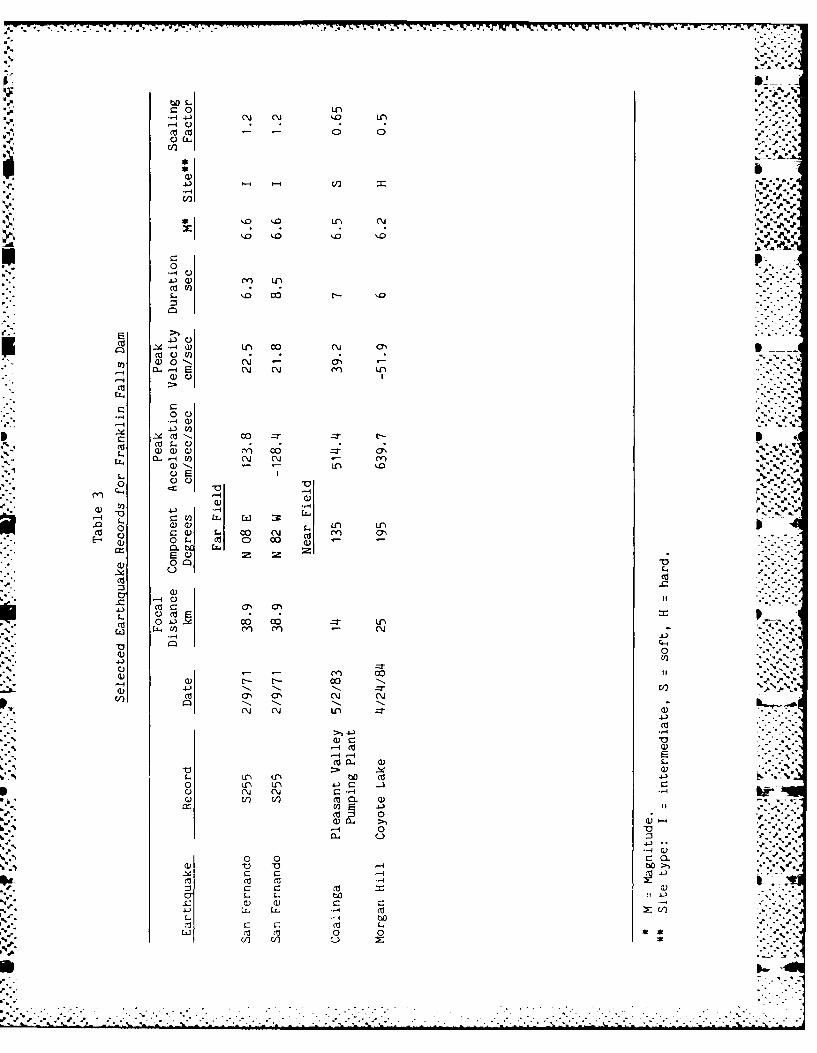
c5 ~0 In-4 * 4m) c~ ('4) '. 1
-z .-. 0 0
St C/)
43a)C1 V- C)
* 00' 0 t-- C\ *j d
'.0 0'O'
EL0a
* -4 00 _rr
t.0 COC) .
.0-4 u-) Q) (.\J a'
0)CCa
009=
alj 0a~ 00 0U4 UW ('?) CYO a'
Cs..4
%C.. 0
0) 00 .. .
,4--
a)U- .5) ----~ -~ C) N Cs. C~ s. n I
fl) aVa) C.. a
0.) a. Q
0*
ca Q
C13 0cn n

4.
St. W4
4.
4,
U'
0
--- 4.,
.4-, 4.94
.4 ~.44
'S
4.
4.
.4
S-- '4.... 4.*
.4
4.
-. 4
0* 0
44.44.4.,
4, APPENDIX A: STRATIGRAPHY OF FRANKLIN FALLS, DANSITEAND VICINITY (TO ACCOMPANY FIGURE 1 IN MAIN TEXT)
444..4.4 4 ~4 4.**
4.
* 4.,-.
,J.'-4
:94.- . -' * 4..
.4
4.
S. ~.~ '
1r
-.4
4' ..- -
.4,
I.-
4.
---. 4.. *.4.*... 4 4 4.. 4.

-0
METASEDIMENTARY, METAVOLCANICAND VOLCANIC ROCKS r.- ,
Mississippian (?)
Mm Moat volcanics (Extrusive phase of White Mountain plutonic-volcanicseries) - Flows, tuffs, and breccias composed chiefly of light-gray,bluish gray, and rhyolite, black basalt, and dark-gray andesite, butincluding some red trachyte.
Devonian
Littleton formation
DI Gray quartz-mica schist and gray mica schist, with such minerals as -
(g) biotite, garnet, and/or staurolite.
DI Gray quartz-mica schist and gray mica schist, with such minerals as(st) biotite, garnet, and/or staurolite.
D Gray micaceous quartzite and gray coarse-grained mica schist, with(si) such minerals as biotite, garnet sillimanite, and locally, andalusite. " "
Div(si) Dark-green medium-grained amphibolite and gray mica schist. - .-
DIg(si) Gray gneiss, much of it rusty brown.
Dli Schist and gneiss, respectively, injected by numerous dikes and sills of(si) binary granite; many such injected areas have not been separately
distinguished.
DIk Schist injected by numerous sills and dikes of kinsman quartz
(si) monzonite.
Dlkg Schist injected by numerous sills and dikes of Kinsman quartz
(si) monzonite and Winnipesaukee quartz diorite.
Si lurian
Sf White to buff marble, greenish-gray diopside-actinolite granulite, (st)(st) greenish-gray actinolite marble, purplish-brown actinolite-biotite
schist, purplish-brown biotite-calcite schist, light-gray arenaceousmarble, white quartzite, and light-gray mica schist.
Sc Clough quartzite - White quartzite and quartz conglomerate, coarse ,(g) crystalline, some mica schist with such minerals as biotite, garnet,
and/or staurolite.
Sc Clough quartzite - White quartzite and quartz conglomerate, coarse(st) crystalline, some mica schist with such minerals as biotite, garnet,
and/or staurolite.
.%,, %_ "*
A2| -
16f.

OT ""93- ".. _r. 771 .S .- .1 7
Sc Clough quartzite - rocks similar to those in zones g and st, except that(si) schists contain sillimanite rather than staurolite.
Ordovician (?)
Oam Ammonoosuc volcanics - Light-gray fine-grained biotite gneiss,(st) dark-green to black amphibolite and conglomeratic amphibolite, gray
mica schist, and gray micaceous quartzite.
Oo Orfordville formation - Dark gray mica schist with porphyroblasts of(g) garnet, staurolite, and/or '<yanite; locally ottrelite schist; includes
some volcanic rocks, chiefly amphibolite and fine-grained biotitegneiss..% .
Oop Orfordville formation - Post pond volcanic member; amphibolite and(g) some fine-grained biotite gneiss. *S...
PLUTONIC ROCKS , -_
(Including a few dike rocks and shallowintrusive volcanic rocks)
Mississippian (?)
Volcanic rocks 81 '
v Shallow intrusive rocks composed of tuff, breccia, rhyolite, quartzlatite, keratophyre, andesite, and trachyte.
Cg Conway granite - Coarse- to medium-grained biotite granite; includesfine-grained biotite granite on Red Hill.
Granite porphyry
gp Pink, gray, green, and red medium-grained granite porphyry. IncludesMount Lafayette granite porphyry of Mount Lafayette region. "
Pqs Porphyritic quartz syenite - Pink, gray, and green medium- to coarse-grained porphyritic quartz syenite. (Albany and Mound Garfieldporphyritic quartz syenite.) Includes some black fine-grainedporphyritic quartz syenite.
qs Quartz syenite - Gray, white, pink, and light-brown fine- to medium-grained quartz syenite, locally porphyritic.
ns Nephelite-sodalite syenite - Light-gray medium- to coarse-grainednephelite-sodalite syenite.
Sy Syenite - Dark green, light-gray, and pink coarse- to medium-grainedsyenite. Includes syenite porphyry.
qm Quartz monzonite - Dark-gray fine- to coarse-grained quartz ..monzonite, locally porphyritic.
gd Granodiorite - Gray to dark-gray fine-grained granodiorite.
A3
.. ~55.-.,5. ,,PV V V...........
I . , .# ' "
".'.''.Ao

* .. %... "..
m Monzonite - Gray to pink fine- to medium-grained monzonite; includes - .dark-gray to light-gray medium-grained monzodiorite. %
d Diorite - Dark-gray to black fine- to coarse-grained diorite. Generallymassive, but is foliated in Pawtuckaway Mountains Intruded andbrecciated by Conway granite in Belknap Mountains. Includes quartz Vdiorite 4 miles southeast of Franconia.
--. ~g Gabbro - Dark-gray, medium- to coarse-grained gabbro, including some .
olivine gabbro and anorthosite. North of Union is gray to dark-gray "
fine- to medium-grained massive to foliated diorite-gabbro.
Devonian (?)
gqg Granite, quartz monzonite, and granodiorite - Where mapped in detail,east of longitude 71°IS , these rocks are pink to gray medium- tocoarse-grained massive to foliated biotite granite, quartz monzonite,and granodiorite. West of longitude 71l5', where these rocks have notbeen mapped in detail, some areas of schist have not been separatelydistinguished. Continuous with Fitchburg granite of Massachusetts.
big Binary granite - White to light-gray fine- to coarse-grained biotite-muscovite granite and quartz monzonite (Concord and Bickford -granites).
kqm Kinsman quartz monzonite - Dark-gray to light-gray medium- tocoarse-grained biotite-quartz monzonite, in many places with - "phenocrysts of potash feldspar I to 3 inches long; massive to well .. :
foliated. Includes Meredith granite of Lake Winnipesaukee region. -4
bg Bethlehem gneiss - Dark-gray to light-gray medium-grained biotitegneiss, strongly to weakly foliated, granoblastic texture common.Chiefly granodiorite, some quartz diorite and quartz monzonite.
qd Quartz diorite - Dark-gray to gray medium-grained biotite-quartzdiorite; massive to well foliated; includes some diorite, granodiorite, .and quartz monzonite (Winnipesaukee quartz diorite of central part ofState, Spaulding quartz diorite of southwestern part of State, Remicktonalite west of Littleton and Lisbon, and unnamed quartz dioriteelsewhere.)
ol Granite, quartz monzonite, and granodiorite - Pink to gray medium- tocoarse-grained granite, quartz monzonite, and granodiorite; in manyplaces foliated and granoblastic; elsewhere massive. Depending uponthe ratio of potash feldspar to total feldspar, the rocks are granite,quartz monzonite, granodiorite, and rarely quartz diorite.
w Water
Metanorphic Zonal Classification
(g) garnet(st) staurolite(si) sillimanite
.7.

. . .- --. * . A A A - .-. .4 '.
* .*% l.."
MAP REFERENCE . -
Billings, Marland P. (compiler), 1955, "Geologic Map of New Hampshire,"
scale 1:250,000, New Hampshire Planning and Development Commission, TheDivision of Geological Sciences, Harvard University and the U. S. GeologicalSurvey, one sheet.
~~~-. .'..•
O.
% ' %r
A5
A ... o .,
..

r ' . -. 7 5 -- . 5 . . j . - . 2 - 5 - - l . :I.. 7 - :. , -
*- o.•
° 'pO _
w.
•.-p. 'pg
Nuttl, 193; ad Ricter,1935
4.. .1- .?
dO--
•% , -' . .-. , %- °, -. % .o -% .. . . .. . %, . ., . ,. " '° . . . ° . .. . ' . .° o . ... ' ° °°. .° ° o -° .. °.

' MAINE
Lat. Long. M.M.,"
Date Location deg. see. deg. see. Int. Nag.*
1766 Jan. 23 Portland 43 42 70 18 V1766 Jan. 24 Portland 43 42 70 18 F1769 Oct. 19 Portland 43 42 70 18 IV
*1769 Oct. 19 Portland 43 42 70 18 IV1805 Feb. 07 Augusta 44 18 69 48 F1806 Jun. 13 Kennebec River 44 00 69 54 F1807 Feb. 22 Windham 43 42 70 30 111
%1807 May 06 Saco River 43 30 70 30 IV .
18141 Nov. 29 Windham 43 42 70 18 v 4.0(B)1821 Mar. 07 Brunswick 43 54 70 00 IV1828 Jul. 25 Busik43 54 70 00 IVe.P1829 Aug. 27 Brunswick 43 54 70 00 1111829 Aug. 27 Brunswick 43 54 70 00 1111829 Aug. 27 Gardiner 44 14 69 46 IV1847 Apr. 02 Limington 43 42 70 42 F1850 Jul. 20 Portland 43 42 70 18 1111853 Jun. 17 Portland 43 42 70 18 1111853 Jun. 20 Portland 43 42 70 00 1111853 Jul. 17 Portland 43 30 70 12 IV01853 Jul. 20 Portland 43 42 70 1 II1855 Jan. 16 Otisfield 44 00 71 00 V 5.0(B)1855 Jan. 17 Otisfield 44 00 71 00 IV1855 Jan. 19 Portland 43 42 70 18 1111855 Jan. 20 Portland 43 42 70 18 1111857 Dec. 23 Lewiston 44 06 70 12 VI 4.0(B)1857 Dec. 28 Lewiston 44 06 70 12 IV
*1868 Mar. 01 Augusta 44 18 69 42 111*1870 Feb. 08 Gardiner 44 06 69 48 IV'.1873 Jan. 11 Brunswick 43 54 70 00 II
1873 Apr. 17 Waterville 44 30 69 42 1111874 Feb. 12 Saco 43 30 70 30 II1877 Feb. 18 Portland 43 42 70 18 1111880 Mar. 29 Sanford 43 24 70 42 1111881 Jan. 21 Bath 44 00 70 00 V1881 Feb. 27 Augusta 44 18 69 48 111
'N1888 Feb. 01 Industry 44 42 70 06 IV1888 Aug. 15 Wayne 44 18 70 00 IV1904 Mar. 21 Lubec 45 00 67 12 VII1905 Jul. 15 Sabbatus 44 12 70 00 VI1906 Oct. 19 Saco 43 30 70 30 IV1906 Oct. 20 Saco 43 30 70 30 IV1907 Jun. 29 Biddeford 43 30 70 50 1111910 Jan. 23 Windham 43 48 70 24 IV1914 Feb. 22 Rangeley Lake 45 00 70 30 V1914 Feb. 22 Rangeley Lake 45 00 70 30 V1914 Feb. 22 Rangeley Lake 45 00 70 30 V
*1918 Aug. 21 Bridgeton-Norway 44 12 70 30 VI1919 Jul. 11 Brunswick 43 54 70 00 1IV1919 Jul. 23 Portland 43 42 70 18 IV .~
1920 Jun. 07 Saco 43 30 70 30 IV
*1925 Oct. 18 Lewiston 44 06 70 12 IV
B2
N -. V
J".'. -i
. . . . . . . . . . . . . . . . . . ..-..
Date Location~ de. ee d-.se. n. Ma . " .
** Ni
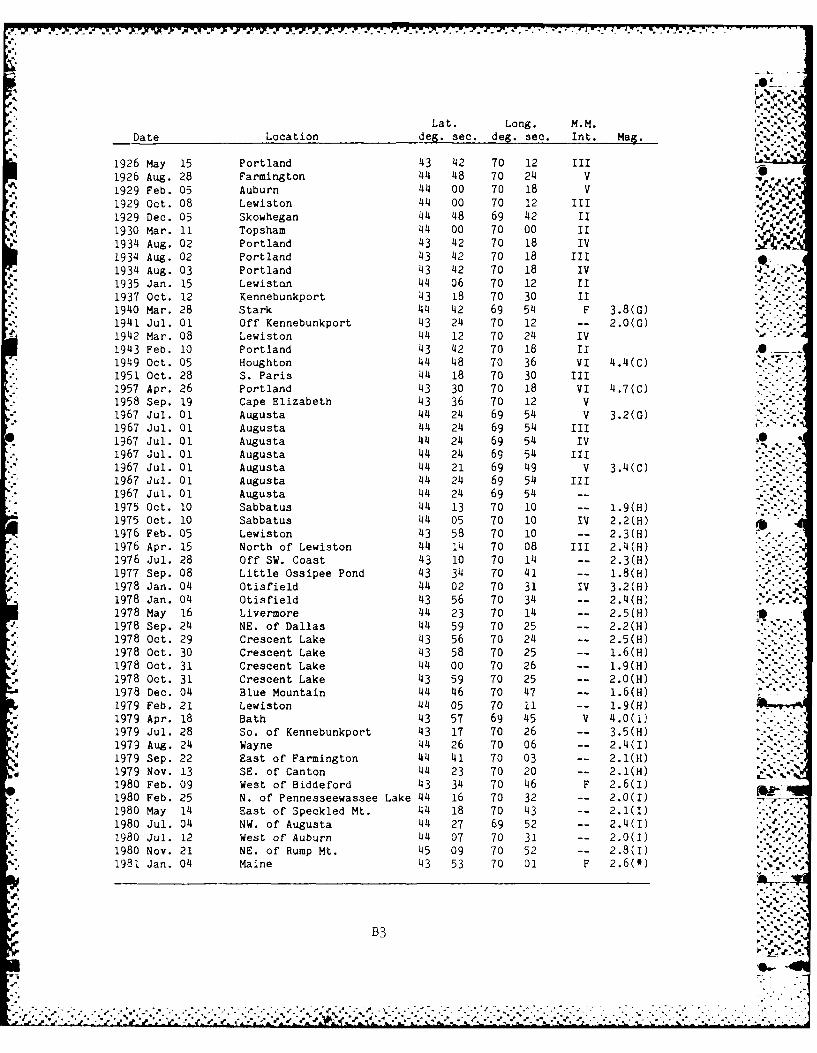
I.U
Lat. Long. M.M.
Date Location deg. sec. deg. sec. Int. Mag. ,-: ,.'v
1926 May 15 Portland 43 42 70 12 III1926 Aug. 28 Farmington 44 48 70 24 V
1929 Feb. 05 Auburn 44 00 70 18 V1929 Oct. 08 Lewiston 44 00 70 12 III1929 Dec. 05 Skowhegan 44 48 69 42 II
1930 Mar. 11 Topsham 44 00 70 00 II1934 Aug. 02 Portland 43 42 70 18 IV1934 Aug. 02 Portland 43 42 70 18 1111934 Aug. 03 Portland 43 42 70 18 IV d .°"
1935 Jan. 15 Lewiston 44 06 70 12 II1937 Oct. 12 Kennebunkport 43 18 70 30 II1940 Mar. 28 Stark 44 42 69 54 F 3.8(G)1941 Jul. 01 Off Kennebunkport 43 24 70 12 -- 2.0(G)1942 Mar. 08 Lewiston 44 12 70 24 IV1943 Feb. 10 Portland 43 42 70 18 II .01949 Oct. 05 Houghton 44 48 70 36 VI 4.4(C)
*1951 Oct. 28 S. Paris 44 18 70 30 1111957 Apr. 26 Portland 43 30 70 18 VI 4.7(C)1958 Sep. 19 Cape Elizabeth 43 36 70 12 V1967 Jul. 01 Augusta 44 24 69 54 V 3.2(G)1967 Jul. 01 Augusta 44 24 69 54 III
1967 Jul. 01 Augusta 44 24 69 54 IV1967 Jul. 01 Augusta 44 24 69 54 III1967 Jul. 01 Augusta 44 21 69 49 V 3.4(C)1967 Jul. 01 Augusta 44 24 69 54 1111967 Jul. 01 Augusta 44 24 69 54 --
1975 Oct. 10 Sabbatus 44 13 70 10 -- 1.9(H)1975 Oct. 10 Sabbatus 44 05 70 10 IV 2.2(H)1976 Feb. 05 Lewiston 43 58 70 10 -- 2.3(H)1976 Apr. 15 North of Lewiston 44 14 70 08 III 2.4(H)1976 Jul. 28 Off SW. Coast 43 10 70 14 -- 2.3(H)1977 Sep. 08 Little Ossipee Pond 43 34 70 41 -- 1.8(H)
1978 Jan. 04 Otisfield 44 02 70 31 IV 3.2(H) . %.1978 Jan. 04 Otisfield 43 56 70 34 -- 2.4(H) " .
1978 May 16 Livermore 44 23 70 14 -- 2.5(H) -1978 Sep. 24 NE. of Dallas 44 59 70 25 -- 2.2(H)
. 1978 Oct. 29 Crescent Lake 43 56 70 24 -- 2.5(H)1978 Oct. 30 Crescent Lake 43 58 70 25 -- 1.6(H)1978 Oct. 31 Crescent Lake 44 00 70 26 -- 1.9(H)1978 Oct. 31 Crescent Lake 43 59 70 25 -- 2.0(H)1978 Dec. 04 Blue Mountain 44 46 70 47 -- 1.6(H)1979 Feb. 21 Lewiston 44 05 70 11 -- 1.9(H) rift
1979 Apr. 18 Bath 43 57 69 45 V 4.0(1)1979 Jul. 28 So. of Kennebunkport 43 17 70 26 -- 3.5(H)
4 1979 Aug. 24 Wayne 44 26 70 06 -- 2.4(I)1979 Sep. 22 East of Farmington 44 41 70 03 -- 2.1(H)1979 Nov. 13 SE. of Canton 44 23 70 20 -- 2.1(H)1980 Feb. 09 West of Biddeford 43 34 70 46 F 2.6(I)1980 Feb. 25 N. of Pennesseewassee Lake 44 16 70 32 -- 2.0(I)1980 May 14 East of Speckled Mt. 44 18 70 43 -- 2.1(I)1980 Jul. 04 NW. of Augusta 44 27 69 52 -- 2.4(I)1980 Jul. 12 West of Auburn 44 07 70 31 -- 2.0(I)1980 Nov. 21 NE. of Rump Mt. 45 09 70 52 -- 2.8(I)1981 Jan. 04 Maine 43 53 70 01 F 2.6(')
-B3.-
€ 3,4...,

MASSACHUSETTS
Lat. Long. M.M.Date Location deg. sec. deg. sec. Int. Mag.
1627 Essex 42 36 70 48 VI
1638 Jul. 01 Salem 42 30 70 54 III1639 Jan. 25 Lynn 42 30 70 54 III1643 Mar. 15 Newbury 42 48 70 48 V . .*-"
1643 Jun. 11 Newbury 42 48 70 48 IV1653 Nov. 08 Danvers 42 36 70 54 IV
1658 Apr. 14 Lynn 42 30 70 54 V ,. .,
1668 Apr. 03 Boston 42 18 71 06 IV
1668 Jun. 26 Roxbury 42 18 71 06 II 411669 Nov. 30 Boston 42 18 71 06 II1670 Boston 42 18 71 06 II1685 Feb. 18 Danvers 42 42 70 48 IV1701 Feb. 10 Danvers 42 36 70 54 III1701 Mar. 08 Danvers 42 36 70 54 III
1705 Jun. 27 Boston 42 24 71 06 IV
1706 Boston 42 18 71 06 II1721 Jan. 19 Boston 42 18 71 06 II1727 Nov. 10 Cape Ann 42 48 70 36 VII 5.0(B)
1727 Nov. 10 Cape Ann 42 48 70 36 IV .-
1727 Nov. 10 Cape Ann 42 48 70 36 IV .
" 1727 Nov. 14 Cape Ann 42 48 70 36 V1727 Nov. 17 Cape Ann 42 48 70 36 VIII1727 Nov. 18 Cape Ann 42 48 70 36 V1727 Dec. 01 Cape Ann 42 48 70 36 IV
1727 Dec. 16 Cape Ann 42 48 70 36 IV
1727 Dec. 19 Cape Ann 42 48 70 36 IV
1727 Dec. 29 Cape Ann 42 48 70 36 VI
1728 Jan. 05 Cape Ann 42 48 70 36 V1728 Feb. 05 Cape Ann 42 48 70 36 IV1728 Feb. 08 Cape Ann 42 48 70 36 IV1728 Feb. 10 Cape Ann 42 48 70 36 V1728 May 16 Cape Ann 42 48 70 36 IV1728 May 214 Cape Ann 42 48 70 36 IV..'-1728 May 29 Cape Ann 42 48 70 36 IV
1728 May 29 Cape Ann 42 48 70 36 IV
1728 Jul. 30 Cape Ann 42 36 70 36 IV .
1728 Aug. 02 Cape Ann 42 48 70 36 IV ... _1729 Feb. 10 Cape Ann 42 48 70 36 V
1729 Mar. 30 Cape Ann 42 48 70 36 IV
1729 Nov. 25 Cape Ann 42 48 70 36 IV
1729 Dec. 09 Cape Ann 42 48 70 36 IV
1730 Feb. 20 Cape Ann 42 48 70 36 V
1730 Feb. 20 Cape Ann 42 48 70 36 V1730 Mar. 09 Cape Ann 42 48 70 36 IV
1730 Apr. 24 Cape Ann 42 48 70 36 IV
4. 1730 Nov. 17 Cape Ann 42 48 70 36 IV ..
1730 Dec. 07 Cape Ann 42 48 70 36 IV .-.-1730 Dec. 18 Cape Ann 42 48 70 36 IV1C4
1730 Dec. 22 Cape Ann 42 48 70 36 IV1730 Dec. 24 Cape Ann 42 48 70 36 IV
- 1730 Dec. 30 Cape Ann 42 48 70 36 V". ',.
1731 Jan. 12 Cape Ann 42 48 70 36 IV
B~4
#.-p"'

Lat. Long. M.M.Date Location deg. sec. deg. sec. Int. Mag.
1731 Oct. 13 Cape Ann 42 48 70 36 IV1732 Feb. 19 Cape Ann 42 48 70 36 V1734 Nov. 23 Cape Ann 42 48 70 36 V1734 Nov. 27 Cape Ann 42 48 70 36 IV -1736 Oct. 12 Cape Ann 42 48 70 36 V1736 Nov. 23 Cape Ann 42 48 70 36 IV1737 Feb. 17 Cape Ann 42 48 70 36 V1737 Sep. 20 Cape Ann 42 48 70 36 IV1739 Aug. 13 Cape Ann 42 48 70 36 V1740 Dec. 25 Cape Ann 42 48 70 36 F1741 Jan. 29 Cape Ann 42 48 70 36 F1741 Feb. 05 Cape Ann 42 48 70 36 F1741 Jun. 24 Boston 42 12 71 12 V1741 Dec. 17 Boston 42 18 71 12 IV1744 Jun. 13 Cambridge 42 18 71 12 F1744 Jun. 14 Cape Ann 42 30 70 54 VI 4.7(B)1744 Jun. 14 Salem 42 30 70 54 IV1744 Jun. 15 Salem 42 36 70 54 F1744 Jul. 01 Salem 42 30 70 54 V1744 Jul. 09 Salem 42 30 70 54 III1744 Dec. 23 Cape Ann 42 48 70 36 F1745 Jan. 03 Newbury 42 48 70 54 III1745 Jun. 12 Boston 42 18 71 06 F1746 Feb. 03 Boston 42 18 71 06 F1746 Feb. 14 Boston 42 18 71 06 F
1746 Aug. 13 Newbury 42 48 70 54 F1747 Jan. 17 Newbury 42 48 70 54 F1747 Dec. 14 Newbury 42 48 70 54 F .1747 Dec. 17 Newbury 42 48 70 54 F1748 Mar. 22 Newbury 42 48 70 54 F1755 Nov. 18 Cape Ann 42 42 70 18 VIII 6.0(B)1755 Nov. 18 Cape Ann 42 42 70 18 IV1755 Nov. 23 Cape Ann 42 42 70 18 V1755 Dec. 20 Cape Ann 42 42 70 18 IV1756 Jan. 02 Boston 42 18 70 06 III1756 Mar. 11 Newbury 42 48 70 54 F1756 Nov. 16 Boston 42 18 71 06 III1756 Dec. 05 Boston 42 18 71 06 III1756 Dec. 19 Boston 42 18 71 06 F .
1757 Jul. 08 Boston 42 24 71 06 IV1758 Feb. 02 Boston 42 18 71 06 F1759 Feb. 02 Boston 42 18 71 06 IV1760 Feb. 03 Boston 42 18 71 06 II1760 Nov. 09 Boston 42 18 71 06 F1761 Feb. Boston 42 18 71 06 F1761 Mar. 12 Boston 42 30 70 54 V 4.6(B) .*:*:..-" -
1761 Mar. 16 Boston 42 18 71 06 IV1765 Jan. 05 Newbury 42 48 70 54 F1766 Jan. 09 Boston 42 18 71 06 V1766 Jun. 14 Essex 42 42 70 54 III ..
1. o. ° . ,
.
d- B5
. .. .. ... .

.0
Lat. Long. N.M.
Date Location deg. sec. deg. sec. Int. Mag.
1768 Jan. 15 Newbury 42 48 70 54 F1768 Jun. 2C Newbury 42 48 70 54 F _1769 Jul. 13 Newbury 42 48 70 54 F %1770 Feb. 24 Newbury 42 48 70 54 F r.. 2. .
1771 Mar. 03 Salem 42 36 70 54 F1780 Nov. 29 Lynn 42 30 70 54 IV
1785 Jan. 02 Dover 42 18 71 06 IV1786 Jan. 09 Cambridge 42 48 70 54 F1786 Nov. 29 Newbury 42 24 71 06 III
1786 Dec. 06 Newbury 42 48 70 54 F1787 Feb. 25 Cambridge 42 24 71 06 III1792 Jan. 10 Salem 42 30 70 54 F1800 Nov. 11 Boston 42 18 71 06 F1803 Jan. 18 Salem 42 30 70 54 IV
1804 Feb. 08 Salem 42 30 70 54 F A1805 Apr. 06 Lynn 42 30 70 54 IV1805 Apr. 25 Salem 42 30 70 54 IV1805 May 12 Newbury 42 48 70 48 F1817 Sep. 07 Lynn 42 30 70 54 III1817 Oct. 05 Woburn 42 30 71 12 VI 4.0(B)1830 Dec. 02 Lynn 42 30 70 54 III1837 Jan. 15 Lynn 42 30 70 54 IV 01846 May 30 Cape Ann 42 42 70 18 IV
1846 Aug. 25 Marblehead 42 30 70 48 V 5.0(B)1849 Feb. 15 Springfield 42 06 72 36 III1849 Oct. 08 Middlesex Co. 42 30 71 24 IV1852 Nov. 27 Northeastern Mass. 42 48 71 00 V1854 Jan. 24 Palmer 42 12 72 18 1 %1854 Jan. 27 Palmer 42 12 72 18 III
1854 Feb. 23 Reading 42 30 71 06 III1854 Dec. 10 Newburyport, Mass. 42 48 70 48 V %
1855 Jan. 23 Newbury 42 36 70 24 III %
1860 Mar. 17 Off Provincetown 42 12 70 30 V1860 Mar. 17 Off Provincetown 42 12 70 30 V %
1861 Mar. 01 Boston 42 24 71 06 III1862 Feb. 04 Cambridge 42 30 71 12 III
1870 Oct. 23 Springfield 42 06 72 36 III1873 Jul. 16 Worchester 42 18 71 48 II 'N
1874 Jan. 25 Lowell 42 36 71 24 IV1874 Nov. 24 Salem-Newbury 42 42 70 54 IV .'.-'.
1875 May 15 Cambridge 42 24 71 06 II1875 Nov. 01 Cambridge 42 24 71 06 1I
1876 Sep. 21 Southeastern Mass. 42 48 70 54 V
1877 Sep. 10 Cambridge 42 24 71 06 II-1880 May 12 Boxford 42 42 71 00 V1881 Feb. 02 Boston 42 18 70 06 II1881 Feb. 03 Plymouth 42 00 70 42 II1881 Jun. 19 Newburyport 42 48 70 54 IV1881 Dec. 16 Dorchester 42 18 71 06 III1884 Oct. 10 Roxbury 42 18 71 06 . "1884 Dec. 0;4 Northampton 42 18 72 42 1I1891 Jan. 15 Fitchburg 42 36 71 48 F,893 Mar. 14 Leeds 42 21 2 40 IV1)03 Jan. 21 Eastern Mar-. 42 36 70 54 V
e % _. r % .
, - . - ..o "• -" ". . - p " ." p-. . '*.*. . . -- -' p,' .- ... ." "," -" . .. . . .. P . 4 "

L. "'_ -'-"
Lat. Long. M.M.Date Location deg. sec. deg. sec. Int. Mag.
1903 Apr. 24 Merrimac Valley 42 42 71 00 IV
1907 Oct. 16 Newbury 42 48 71 00 VI, 1908 Feb. 05 Needham 42 18 71 12 II K-"1909 Aug. 16 Needham 42 18 71 12 II,..,-
1910 Aug. 21 Merrimac Valley 42 42 71 06 IV
1911 Feb. 06 Cambridge 42 24 71 06 II
1913 Mar. 31 Worchester 42 18 71 48 II1914 Jan. 14 Needham 42 12 71 12 III1915 Feb. 21 Merrimac Valley 42 48 71 06 IV
1921 Jul. 29 Cambridge 42 30 70 24 IV -.
1923 Groveland 42 48 71 00 II1925 Jan. 07 Cape Ann 42 36 70 36 V 4.0(B)
1925 May 04 Lynn 42 30 70 54 IV1926 Jan. 22 Cambridge 42 24 71 06 III1926 Mar. 04 Lynn 42 30 70 54 II
1926 Oct. 25 Brockton 42 06 71 00 III1927 Aug. 20 Quincy 42 18 71 00 IV1929 Sep. 17 Holbrook 42 12 71 00 II1930 Mar. 27 West Springfield 42 06 72 42 III1931 May 04 Amherst 42 24 72 30 III
1932 Jul. 20 Lake Garfield 42 12 73 12 II . "-.P
1934 Aug. 02 Cape Ann 42 36 70 12 IV .1935 Jan. 30 Billerica 42 36 71 18 II1935 Apr. 24 Off Cape Cod 42 12 70 12 IV
1938 Jun. 23 Chelmsford 42 36 71 25 V1939 Feb. 01 Chelmsford 42 36 71 24 II1940 Jan. 02 Littleton 42 30 71 30 III1941 Oct. ii Sturbridge 42 18 72 18 IV 3.0(G)
1943 Mar. 31 Northampton 42 18 72 36 II1951 Mar. 31 Palmer 42 12 72 12 IV1954 Jul. 29 Cape Ann 42 48 70 42 V 4.0(C)1963 Oct. 16 Marble Head 42 24 70 24 -- 3.8(C)
1963 Oct. 16 Near Coast of Mass. 42 30 70 48 VI1963 Oct. 17 Dunstable 42 42 71 30 III1963 Oct. 30 Off Cape Ann 42 42 70 48 VI 3.2(G) .1967 May 15 NE. of Provincetown 42 18 69 48 -- 3.2(G)
1971 Oct. 21 Lawrence 42 42 71 12 V1975 Aug. 03 Ipswich 42 42 70 54 -- 2.4(G)1977 Jul. 01 Cape Ann 42 53 70 04 -- 2.6(H)1978 Aug. 06 Wakefield 42 27 71 04 -- 1.6(H)1978 Aug. 06 Wakefield 42 26 71 02 -- 1.8(H)
1978 Sep. 01 Boxborough-Acton 42 29 71 28 II 2.0(H)1979 Nov. 20 Quincy 42 13 71 02 -- 2.2(H)1980 Nov. 23 Lowell 42 38 71 22 IV 2.6(I)
New Hampshire
1728 Jan. 12 New Hampton 43 36 71 42 III "".1747 Aug. 25 Dover 43 12 70 54 III
1751 Jul. 21 Dover 43 12 70 54 III -.
1761 Nov 02 South of Concord 43 06 71 30 IV1766 Dec. 17 Portsmouth 43 06 70 48 IV :
1772 Aug. 15 Shelburne 44 24 71 06 F1777 Sep. 14 Manchester 43 00 71 30 F
B'. ""
B7,-,...
.-''-.'

Lat. Long. M.M.Date Location deg. see. deg. sec. Int. Mag.
180 Dec. O NW" f Newport 4 18 IV
18].Ma. U Portsmouth 11 Ob IVMar. 1 '04 0I
1801 Mar. 18 Portsmouth 43 06 70 48 F
1807 Jan. 12 North Hampton 43 00 70 54 F1807 Jan. 14 Exeter 43 00 71 00 IV1810 Nov. 10 Portsmouth 43 00 70 48 V 4.0(B)1823 Jul. 23 Off Hampton 42 54 70 36 V 4.0(B) %1829 Jan. 01 Portsmouth 43 06 70 48 IV "- -
1845 Nov. Lebanon 43 36 72 18 IV1846 Jul. 10 Deerfield 43 06 71 18 III1846 Sep. 12 Deerfield 43 06 71 18 1111846 Oct. 30 Deerfield 43 06 71 18 II11846 Oct. 31 Deerfield 43 06 71 18 II --- "1846 Nov. 13 Deerfield 43 06 71 18 III ..
1846 Dec. 02 Deerfield 43 06 71 18 III1847 Feb. 02 Deerfield 43 06 71 18 1i1.. . . .1847 Feb. 14 Deerfield 43 06 71 18 III1847 Feb. 21 Deerfield 43 06 71 18 1111851 Oct. 12 Deerfield 43 06 71 18 III1852 Jun. 30 Claremont 43 24 72 18 III1852 Aug. 11 Deerfield 43 06 71 18 III1852 Nov. 28 Exeter 43 00 70 54 V A1853 Nov. 21 Antrim 43 00 71 54 III1853 Nov. 28 Antrim 43 00 71 54 IV1854 Oct. 01 Keene 42 54 72 18 F1854 Oct. 25 Keene 42 54 72 18 IV1854 Dec. 11 North Hampton 43 00 70 48 V1855 May 29 Coos Co. 44 42 71 36 IV1871 Jul. 20 Concord 43 12 71 30 IV1872 Nov. 18 Concord 43 12 71 36 V1873 Oct. 05 Derry 42 54 71 18 III1874 Jan. 06 Wolfeboro 43 36 71 12 II -. e1874 Jan. 26 Manchester 43 00 71 30 IV1874 Jan. 26 Manchester 43 00 71 30 III1875 May 06 Wolfeboro 43 36 71 12 II1875 Dec. 01 Keene 42 54 72 18 IV
1875 Dec. 01 Keene 42 54 72 18 IV1875 Dec. 01 Keene 42 54 72 18 111877 Apr. 23 Auburn 43 00 71 18 II1879 Oct. 26 Manchester 43 00 71 30 IV .. .-
1879 Nov. 03 Contoocook 43 12 71 42 II1880 Jul. 13 Concord 43 12 71 36 II1880 Jul. 21 Manchester 43 00 71 30 IV1880 Aug. 21 Barrington 43 12 71 06 II1881 Feb. 04 Greenland 43 00 70 48 II1881 Feb. 12 Portsmouth 43 00 70 48 II1881 Apr. 03 Antrim 43 00 71 54 1II1 . -\1881 May 18 Contoocook 43 12 71 42 11 -1881 May 18 Contoocook 43 12 71 42 II " " 1.,1881 Aug. 13 Contoocook 43 12 71 42 II1
1881 Oct. 06 Bristol 43 12 71 36 III1881 Oct. 31 Contoocook 43 12 71 42 I.1882 Apr. 17 Hopkinton 43 12 71 42 IV1882 May 08 Concord 43 12 71 36 III1882 Dec. 19 Concord 43 12 71 24 IV
B8 ¢ " -'
• .. - ' ,
~..........................° ".--°.... ..... ... "
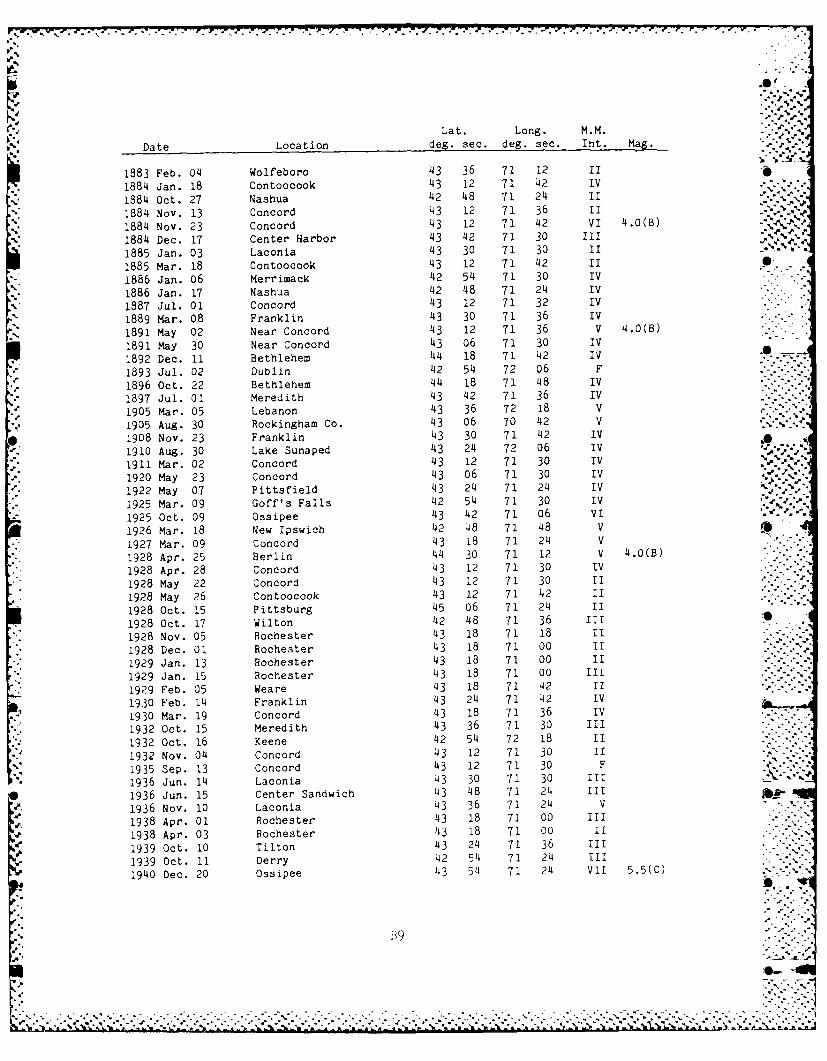
7' 7, 7.-77. 9
Lat. Long. M.M.
Date Location deg. sec. deg. sec. Int. Mag.
1883 Feb. 04 Wolfeboro 43 36 71 12 II
1884 Jan. 18 Contoocook 43 12 71 42 IV
1884 Oct. 27 Nashua 42 48 71 24 II -.1
1884 Nov. 13 Concord 43 12 71 36 II
1884 Nov. 23 Concord 43 12 71 42 VI 4.0(B)
1884 Dec. 17 Center Harbor 43 42 71 30 III
1885 Jan. 03 Laconia 43 30 71 30 II
1885 Mar. 18 Contoocook 43 12 71 42 II •
1886 Jan. 06 Merrimack 42 54 71 30 IV
1886 Jan. 17 Nashua 42 48 71 24 IV
1887 Jul. 01 Concord 43 12 71 32 IV
1889 Mar. 08 Franklin 43 30 71 36 IV
1891 May 02 Near Concord 43 12 71 36 V 4.0(B)
1891 May 30 Near Concord 43 06 71 30 IV
1892 Dec. 11 Bethlehem 44 18 71 42 IV
1893 Jul. 02 Dublin 42 54 72 06 F
1896 Oct. 22 Bethlehem 44 18 71 48 IV
1897 Jul. 01 Meredith 43 42 71 36 IV
1905 Mar. 05 Lebanon 43 36 72 18 V
1905 Aug. 30 Rockingham Co. 43 06 70 42 V
1908 Nov. 23 Franklin 43 30 71 42 IV O ,
1910 Aug. 30 Lake Sunaped 43 24 72 06 IV
1911 Mar. 02 Concord 43 12 71 30 IV
1920 May 23 Concord 43 06 71 30 IV N.
1922 May 07 Pittsfield 43 24 71 24 IV -e
1925 Mar. 09 Goff's Falls 42 54 71 30 IV :. ..-
1925 Oct. 09 Ossipee 43 42 71 06 VI . -'-
1926 Mar. 18 New Ipswich 42 48 71 48 V r
1927 Mar. 09 Concord 43 18 71 24 V
1928 Apr. 25 Berlin 44 30 71 12 V 4.0(B)
1928 Apr. 28 Concord 43 12 71 30 IV
1928 May 22 Concord 43 12 71 30 II
1928 May 26 Contoocook 43 12 71 42 II
1928 Oct. 15 Pittsburg 45 06 71 24 II
1928 Oct. 17 Wilton 42 48 71 36 III
1928 Nov. 05 Rochester 43 18 71 18 II
1928 Dec. 01 Rochester 43 18 71 00 II
1929 Jan. 13 Rochester 43 18 71 00 II
1929 Jan. 15 Rochester 43 18 71 00 III
1929 Feb. 05 Weare 43 18 71 42 II
1930 Feb. 14 Franklin 43 24 71 42 IV
1930 Mar. 19 Concord 43 18 71 36 IV
1932 Oct. 15 Meredith 43 36 71 30 III
1932 Oct. 16 Keene 42 54 72 18 II
1932 Nov. 04 Concord 43 12 71 30 II -
1935 Sep. 13 Concord 43 12 71 30 F
1936 Jun. 14 Laconia 43 30 71 30 III
1936 Jun. 15 Center Sandwich 43 48 71 24 III
1936 Nov. 10 Laconia 43 36 71 24 V
1938 Apr. 01 Rochester 43 18 71 O0 III
1938 Apr. 03 Rochester 43 18 71 00 U.
1939 Oct. 10 Tilton 43 24 71 36 III
1939 Oct. 11 Derry 42 54 71 24 III .
1940 Dec. 20 Ossipee 43 54 71 24 VII 5.5(C) .- . .
B9
I .o+ .'
-go ,t , ' "
S- -. X..~ ~ ~ ~ ~. A 2.2.,A.h" ,.. -:.N.". ,N. N

Lat. Long. M. M. .
Date Location deg. sec. deg. sec. Int. Mag.
1940 Dec. 24 Ossipee 43 48 71 18 F1940 Dec. 24 Ossipee 43 54 71 18 VII 5.5(C).51940 Dec. 24 Ossipee 43 48 71 18 F 2.8(C) .o
1940 Dec. 24 Ossipee 43 48 71 18 F .- .1940 Dec. 25 Ossipee 43 48 71 18 F 3.7(C)1940 Dec. 27 Ossipee 43 48 71 18 F 3.8(C)1941 Jan. 02 Ossipee 43 48 71 18 F
1941 Jan. 04 Ossipee 43 46 71 18 F1941 Jan. 18 Ossipee 43 48 71 18 F1941 Jan. 21 Ossipee 43 48 71 18 F 3.6(G)1941 Jan. 23 Ossipee 43 48 71 18 F 2.9(C) %1941 Feb. 12 Ossipee 43 48 71 18 F1943 Mar. 14 Meredith 43 42 71 36 -- 3.9(G)1944 Mar. 06 Concord 43 12 71 36 II1944 Mar. 06 Concord 43 12 71 36 II A1944 Apr. 11 Woodstock 44 00 71 42 ..
1945 Mar. 22 Concord 43 12 71 36 III1949 Sep. 02 S. Tanworth 43 48 71 18 111 ,.
1950 Feb. 24 SW. of Concord 43 00 71 48 III1952 Oct. 26 Wolfeboro 43 36 71 12 II1953 May 11 Conway 44 00 71 06 IV ,', "1954 Oct. 07 Pelham 42 42 71 18 III 1958 Nov. 21 Woodstock 44 00 71 42 IV1962 Dec. 29 Nashua 42 48 71 42 V .1963 Dec. 04 Laconia 43 36 71 36 V 3.6(G)1964 Apr. 01 Laconia 43 36 71 30 IV 2.4(G) . -1964 Jun. 26 Concord 43 25 71 41 VI 3.2(D) .1965 Jan. 03 Laconia 43 31 71 47 IV 3.0(G)1966 Apr. 28 Benton 44 06 71 54 IV1966 Oct. 23 Manchester 43 00 71 24 V 3.1(G)1967 Jan. 26 North of Berlin 44 36 70 54 -- 2.1(G)1969 Aug. 06 Ossipee 43 48 71 24 F 2.6(G)1976 Jun. 12 Franconia 44 14 71 37 -- 2.4(H)1976 Jun. 14 Franconia 44 17 71 41 -- 2.0(H)1976 Nov. 15 Laconia 43 34 71 37 -- 1.5(H)1976 Nov. 22 Laconia 43 32 71 36 -- 1.8(H)1977 Dec. 25 Hopkinton 43 11 71 39 V 3.2(H) ..
1978 Jan. 18 East of Keene 42 59 72 09 -- 1.9(H)1978 Mar. 20 NW. of Manchester 43 05 71 31 -- 2.4(H)1978 Mar. 31 Dunbarton 43 06 71 38 -- 2.7(H)1978 Jun. 21 Winnipesaukee 43 40 71 23 -- 1.8(H)1978 Aug. 17 Winnisquam Lake 43 31 71 34 -- 1.9(H)1978 Aug. 25 Seabrook 42 52 70 50 II 2.3(H)
1979 Jan. 01 SE. of Bristol 43 31 71 38 1.9(H)1979 Jul. 09 South of Lanconia 43 23 71 27 -- 2.4(H)1980 Apr. 01 NE. of Squam Lake 43 50 71 24 2.0(I) .'
1980 Apr. 07 West of Highland Lake 43 08 72 13 -- 2.8(I) -.
1980 May 21 NW. of Keene 43 01 72 24 -- 1.8(I)1980 Nov. 05 N. Lake Winnipesaukee 43 40 71 22 -- 2.7(I) Orr" 11981 Jun. 28 New Hampshire 43 34 71 33 F 3.1(*)
1982 Jan. 19 West of Laconia 43 30 71 37 VI 4.7(I) %e%-11982 Jan. 27 West of Laconia 43 32 71 37 V 2.9(H) .-
1982 Dec. 01 North of Laconia 43 37 71 31 F 2.2(H) %
.' ...2"' "%L
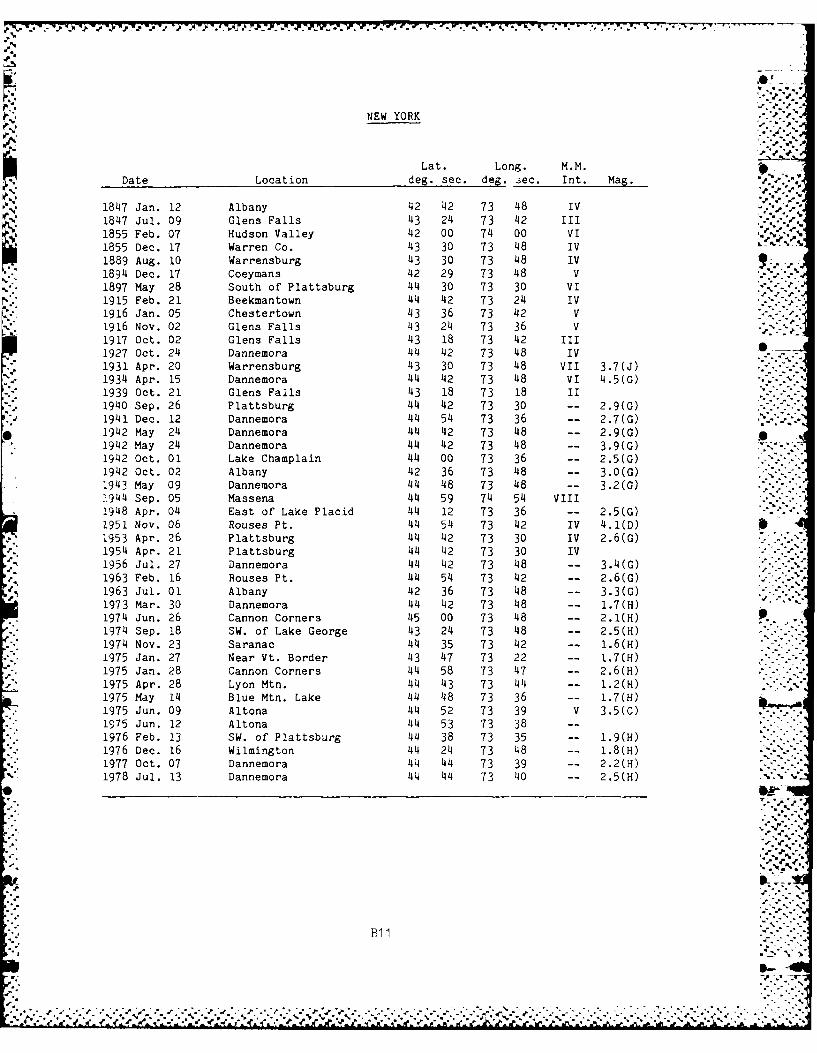
NEW YORK
LocatonLa.e. Long. M.M.DateLocaion eg. ec.deg. sec. Int. Mag.
18147 Jan. 12 Albany 42 142 73 148 IV18147 Jul. 09 Glens Falls 43 214 73 142 1111855 Feb. 07 Hudson Valley 42 00 714 00 VI %1855 Dec. 17 Warren Co. 43 30 73 48 IV1889 Aug. 10 Warrensburg 43 30 73 48 IV18914 Dec. 17 Coeymans 42 29 73 48 V1897 May 28 South of' Plattsburg 1414 30 73 30 VI
195 e. 1 Beekmantown 1414 42 73 214 IV
1916 Jan. 05 Chestertown 43 36 73 42 V1916 Nov. 02 Glens Falls 43 214 73 36 V ~1917 Oct. 02 Glens Falls 43 18 73 42 1111927 Oct. 214 Dannemora 144 42 73 148 IV1931 Apr. 20 Warrensburg 43 30 73 48 VII 3.7(J)1934 Apr. 15 Dannemora 144 42 73 148 VI 4.5(G)1939 Oct. 21 Glens Falls 43 18 73 18 II19140 Sep. 26 Plattsburg 144 42 73 30 -- 2.9(G)19141 Dec. 12 Dannemora 414 514 73 36 -- 2.7(G)19142 May 214 Dannemora 1414 42 73 148 -- 2.9(G)19142 May 214 Dannemora 1414 42 73 48 -- 3.9(G)19142 Oct. 01 Lake Champlain 144 00 73 36 -- 2.5(G)19142 Oct. 02 Albany 42 36 73 48 -- 3.0(G)19143 May 09 Dannemora 414 48 73 48 -- 3.2(G) -
19414 Sep. 05 Massena 1414 59 74 514 VIII19248 Apr. 014 East of Lake Placid 1414 12 73 36 -- 2.5(G)1951 Nov. 06 Rouses Pt. 1414 514 73 142 IV 4.1(D)
*1953 Apr. 26 Plattsburg 1414 42 73 30 IV 2.6(G)19514 Apr. 21 Plattsburg 414 42 73 30 IV1956 Jul. 27 Dannemora 144 42 73 148 -- 3.14(G)
196 Fb.16 Rouses Pt. 44 514 73 14 - 2.6(G)1963 Jul. 01 Albany 42 36 73 148 -- 3.3(G)1973 Mar. 30 Dannemora 1414 42 73 148 -- 1.7(H)
*19714 Jun. 26 Cannon Corners 145 00 73 148 -- 2.1(H)*19714 Sep. 18 SW. of Lake George 143 214 73 148 -- 2.5(H)
19714 Nov. 23 Saranac 1414 35 73 142 -- 1.6(H)*1975 Jan. 27 Near Vt. Border 143 14 3 2 - 1.7(H)
1975 Jan. 28 Cannon Corners 414 58 73 147 -- 2.6(H)1975 Apr. 28 Lyon Mtn. 144 143 73 144 -- 1.2(H) -
1975 May 114 Blue Mtn. Lake 1414 48 73 36 -- 1.7(H)*1975 Jun. 09 Altona 1414 52 73 39 V 3.5(C).
*1(175 Jun. 12 Altona 144 53 73 38 %-1976 Feb. 13 SW. of Plattsburg 144 38 73 35 -- 1.9(H)..
*1976 Dec. 16 Wilmington 414 214 73 48 -- 1.8(H)1977 Oct. 07 Dannemora 144 1414 73 39 -- 2.2(H)1978 Jul. 13 Dannemora 144 414 73 140 -- 2.5(H) '*
B11-
N;. ~

,* -.
... .... ... .... ...
VERMONT
Lat. Long. M.M.
Date Location deg. see. deg. sec. Int. Mag. -'
1843 Mar. 14 North of Montpelier 44 24 72 30' IV
1851 Dec. 25 Bridgeport 44 O0 73 18 III
1856 Jun. 10 Bellows Falls 43 06 72 30 II
1863 Jun. 09 East of Burlington 44 30 73 00 IV
1867 Dec. 18 Vermont 44 O0 73 00 V1873 Nov. 05 Burlington 14,4 30 73 12 11
1873 Nov. 05 Burlington 44 30 73 12 III C % P
1878 Mar. 12 Milford 42 42 71 36 II1880 Sep. 23 Charlotte 44 18 73 18 II
1895 May 28 Putney 43 00 72 30 III
1898 Jun. 11 Brattleboro-Vernon 42 48 72 36 IV
1905 Oct. 22 Newport 44 54 72 12 V
1908 Aug. 16 Milton 44 36 73 06 III1934 Apr. 11 Rutland-Montpelier 44 00 72 42 III
1934 Apr. 11 Rutland-Montpelier 44 00 72 42 III1935 Nov. 01 Montpelier 44 18 72 36 II
1936 Nov. 10 Bloomfield 44 42 71 42 IV1937 Dec. 02 Burlington 44 30 73 12 II
1938 Apr. 13 Manchester 43 12 73 06 II1941 May 19 North of Hanover, NH 43 48 72 18 -- 2.0(G)1943 Jul. 06 Swanton 44 48 73 00 IV 4.1(D)
1944 Jun. 04 Northfield 44 12 72 48 III1945 Aug. 05 Woodstock 43 36 72 30 III
1948 Oct. 20 Burlington 44 30 73 12 F -
1952 Jan. 29 Burlington 44 30 73 12 VI .
1953 Mar. 31 Brandon 43 42 73 00 III1953 Mar. 31 Brandon 43 42 73 06 V 4.0(D)1955 Feb. 02 Burlington 44 30 73 12 V
1957 Apr. 24 St. Johnsbury 44 24 72 00 V ..
1962 Apr. 10 Middlebury 44 06 73 00 V 4.2(D)1967 Jan. 11 North of Montpelier 44 42 72 36 -- 1.9(G)
1976 Dec. 29 Burlington 44 25 73 08 -- 1.7(H) .
1977 May 05 Lake Fairlee 43 52 72 16 -- 2.1(H)1978 Aug. 07 NW. of Montpelier 44 22 72 38 -- 1.8(H)
1978 Sep. 27 East of Bristol 44 08 73 02 -- 1.8(H)
1978 Oct. 24 SE. of Bristol 44 06 72 59 -- 1.9(H)1979 Jan. 29 North Hero 44 49 73 11 II 2.5(H)
1979 Jan. 31 Ludlow 43 23 72 38 -- 1.5(H)
1979 May 04 North of Middlebury 44 04 73 14 -- 1.3(I)
1979 May 15 North of Middlebury 44 05 73 13 -- 1.4(1)
1980 Jun. 30 South of Montpelier 44 08 72 35 -- 1.9(I)
1980 Dec. 25 NW. of Newbury 44 06 72 05 -- 2.5(I) " -,
B12Bi 2 - -.
"' %" %o - .

QUEBEC CANADA
Lat. Long. M.M.Date Location deg. sec. deg. see. Int. Mag. -
1638 Jun. 11 LaMelbaie 47 36 70 06 Ix1663 Feb. 05 LaMelbaie 47 36 70 06 x1732 Sep. 16 Montreal 45 30 73 36 VIII1860 Oct. 17 East of Montgomery 47 30 70 06 Ix ?1870 Oct. 20 Baie St. Paul 47 214 70 30 Ix1914 Feb. 10 West of Perth 45 00 76 54 VII
*1925 Mar. 01 LaMelbaie 47 36 70 06 Ix1929 Nov. 18 S. of Newfoundland 44 30 55 00 x1935 Nov. 01 Temiscamina Station 46 48 79 00 VIII.1971 May 14 Lacolle 45 06 73 24 IV 3.2(H)1974 Aug. 12 SE. of Montreal 45 03 73 20 -- 2.1(G)1975 Sep. 19 St. Chrysostone 45 08 73 49 -- 2.2(G)1979 Mar. 14 Lake Ontario 43 32 73 20 -- 2.4(G)1980 Apr. 19 SE. of Montreal 45 08 73 02 -- 2.6(H) ..
1980 Jun. 26 Stanbridge Station 45 07 70 02 -- 1.9(I)*1980 Aug. 11 South of Montreal 45 08 73 38 -- 2.0(G)
* .,B13
rL7S

Note: Dates were based on Greenwich Mean Time. . .
B Felt area magnitude based onMbLg (Nuttli, 1973)
C MbLg (Nuttli, 1973)computed from seismograms
D MbLg (Nuttli, 1973)computed from seismograms
,.4G ML (Richter, 1935 - computed
from seismograms by theEarth Physics Branch,Ottawa, Canada
H MbLg (Nuttli, 1973) - computedfrom seismograms by data ... - .
contributors to the Northeastern .- .United States Seismic Network
I Signal duration magnitude basedon Mb (Nuttli, 1973),calcued by Weston Observatory, .' -. _
Boston College
J Felt area magnitude based on ML(Richter, 1935), and adjustedby Ebel (1982) for the seismicwave attenuation of the northeastern United States
Mag. not specified. Stover (1984).Stover, Carl W. (1984)United States Earthquakes, 1981.U.S.G.S. Special Publication.Washington, 136 pp.
B14;
n .'
'. .%p:. -:.
B14 :'----'-'
., .~. : .. ..-.

- * g . -. ,o.. 0
References .
" Barosh, P. J. 1985. "Summary and Analysis of the 1982 Gaza, New Hampshire
Earthquake," Appendix C of this report.
Chiburis, E. F. 1981. "Seismicity, Recurrence Rates, and Regionalization of :,the Northeastern United States and Adjacent Southeastern Canada," Weston
Observatory, Boston Mass, prepared for Nuclear Regulatory Commission,Washington, DC.",
Nottis, G. N., ed. 1983. "Epicenters of Northeastern United States andSoutheastern Canada, Onshore and Offshore; Time Period 1534-1980," New York
State Geological Survey Map and Chart Series, No. 38, New York State Museum;the University of the State of New York; the State Education Department;
Albany, N. Y., plus tabulations by Patrick J. Barosh (Appendix C, this -"C"
report). ,.
Nuttli, O.W. 1973. "Seismic Wave Attenuation and Magnitude Relations forEastern North America," Journal Geophysical Research, Vol 78, pp 876-885.
Richter, C. F. 1935. "Elementary Seismology," W. H. Freeman & Co., San
Francisco, Calif., 768 pp.
.f.-.. -.. -.
C.-
B15.
--. '.. .
.C,.
oB,,--.

• "-%*,,.u
,o_ ......
'. *v "
? ...:.';
.'o ° o' I' °
• . . o*.
5, - .
&'- .A%j,
.'-..S.,:
i.5_ ...,,~
...-- { :.
.,., :- ..-.. *
.5", ,' , .
-: liI .5I
• . " ,,,K *

4.-
SUMMARY AND ANALYSIS OF THE 1982 GAZA, NEW HAMPSHIRE EARTHQUAKE
TABLE OF CONTENTS .%.
Introduction .............................................................. C6
Seismicity of New Hampshire ............................................... C6
19140 Ossipee Earthquakes ............................................. C11
*Seismic Paremeters of the Gaza Earthquake ................................ C15
Strong Motion Data ................................................... C17 ... \
Aftershocks .......................................................... C21 -
Intensity of the Gaza Earthquake and Aftershock of Jan. 27 ................C22
Regi nal Int nsit es ... .... ... ... ... .... ... ... .... ... ... C2Rpiegional Intensities............................................... C22Epierack Intensities.............................................. C36
Aftogcehock Intensities.............................................. C38
Geiog ic Setting.....................................................C47
Boston-Ottawa Seismic Belt ........................................... C47Merrimack-White Mountain Seismic Area ................................ C48Seismic Source Zones ................................................. C148Focal Plane Solutions ................................................ C55
Probable Cause of Earthquakes in Central New Hampshire ....................C59 N,~
*Implications to the Franklin Falls Dam Site .............................. C60
Sum ar .. .. ... .. ... .. ... .. ... .. ... .. ... .. ... .. ... .. ... C6Summry...s...............................................................C65
Appendix: Earthquakes Catalog of New Hampshire .......................... C70
.C2
. ~~~~ ~. .. . .. . .

797wr.""° - " -°'
ILLUSTRATIONS .
FIGURE
1 Index map showing the location of the Gaza earthquake andits felt limits.
2. Epicentral map of New Hampshire and adjacent areas to 1980.
3. Epicentral map of the northeastern United States periodOctober 1975 to September 1983.
4. Isoseismal map of the 1940 Ossipee earthquakes .
5. Detailed isoseismal map of the 1940 Ossipee earthquakes.
6. Index map showing location of strong-motion seismographstations in New Hampshire and Vermont.
7. Chart showing attenuation of acceleration with distance fromthe Gaza earthquake.
8. Isoseismal map of the Gaza earthquake.
9. Map showing the intensities in the epicentral area of theGaza earthquake.
10. Photograph of greenhouse at Pleasant View Gardens, Loudon,New Hampshire showing concrete base of supporting steel piperaised out of ground.
11. Photograph of interior of house on Old Payson Road, "Northfield, New Hampshire showing split beam.-....
12. Photograph of cellar of house on Old Payson Road,Northfield, New Hampshire showing crack in poured concrete .wall.
13. Photograph of cellar of house on Center Street, Laconia,New Hampshire showing cracks in stone cellar wall adjacent .-- _ _to collapsed corner.
14. Photograph of cellar of colonial house on Morrison Road,
Gaza, New Hampshire showing collapsed chimney foundation.
15. Photograph of cracks in brick chimney attached to trailer in ,.Hill, New Hampshire.
16. Photograph of back wall of Joe's Market in Bristol, NewHampshire showing cracked mortor seam. ..
17. Map showing the intensities from the January 27, 1982
aftershock.
18. Geologic map of New England and adjacent areas.
C3
SN.

.-. '..'77'%
FIGURE*d% .. _
19. Geologic sketch map of the Nashua area, New Hampshire. .•
20. Map of the northeastern United States and adjacent Canadashowing recent earthquakes, the Winnipesaukee-Winooskilineament and other selected structures. .
21. Map showing regional fault zones and metamorphic grade in
New England.
22. Epicentral map of New Hampshire and adjacent areas to 1980
showing seismic zones.
23. Epicentral map of the northeastern United States periodOctober 1975 to September 1983 showing seismic zones in NewHampshire.
24. Structure map of New Hampshire showing seismic zones.
25. Gravity map of New Hampshire and Vermont showing seismiczones. [ .-
26. Gravity map of central New Hampshire showing seismic zones.
27. Map of the northwestern part of the epicentral area of theGaza earthquake showing epicenter and selected topographiclineaments.
28. Map of the southern part of the epicentranal area of the1982 Gaza earthquake showing epicenter of the 1964 intensityVI earthquake and selected lineaments.
29. Sketch map showing possible fault configuration andmovements to account for the seismic activity in central NewHampshire. N.
r%' V.'. ,
L, .. .
* . 1. -
,- C -
. . . . . . . . . . . . . . . . . . . . . . . . .
r217~o 47-o N-_ 7..
TABLES
1. Seismic parameters of the Gaza earthquake
2. Strong-motion stations responding to the Gaza earthquake.
3. Strong-motion records from the Gaza earthquake.
4. Aftershocks of the Gaza earthquake.
5. Intensities for January 27, 1982 earthquake.
101
,'% , ~.. ,
*..,.. >- •
C5
., , .-. -, .-. ....< [ ,, ]..:.- .- ,, .,. -. ..[ .-, -< '.,---.-- : -.. , .. ]. -,. -- .. .--....-., .. :-.-....--.- .....-..] ..-.- ... :,

INTRODUCTION .1,
On January 18, 1982 EST a magnitude 4.7 Mc earthquake
occurred near the village of Gaza, N.H., about 3.5 miles from the
Franklin Falls dam on the Pemigewasset river (Fig. 1) . The
earthquake was widely felt and produced epicentral intensities of
low VI, about the same as those from the much larger, magnitude N .
5.8 Mn Mirimachi earthquake in New Brunswick, nine days earlier. .•-
The Gaza earthquake also produced an unusually high acceleration
and resulted in the first set of strong-motion records for the
northeastern United States. The data from this earthquake, along
with that from the improved seismic network, offers an
opportunity to reassess the seismicity in central New Hampshire
and its potential effect at the Franklin Falls Dam site..
In the following report the source parameters of the earth-
quake will be reviewed, the damage in the epicentral area de-
scribed, and possible source zone and cause analyzed. The
implications of this investigation to the Franklin Falls dam site
are discussed. ".. .
SEISMICITY OF NEW HAMPSHIRE
New Hampshire experiences low to moderate seismic activity. Over
200 earthquakes are recorded from the state between 1728 and
September 1983, disregarding the small aftershocks (Appendix)
(Figs. 2 and 3). Most of these are felt, as non-felt earthquakes
have only been adequately recorded since 1977. 23 earthquakes
above magnitude 1.0 were recorded in the last full year of
c6?c6L ¢ "

10043.50ON. 71.0.
OTTOWA-
FELT..
LIMIT'
100. Km. .\
GAZAMI NNHW EARHQAK
Figu 1:14 InexST. maNhwigth1octonoteGaaeatquk-~n MAG s 4.7t Mc imits.
- . ZI'C7

I S A
A tw-960091 0
0~~~ I -J.-
A-.
A5 -p
0~ .l-'Icoilo 0
A A,
1 IM IT"
Z 0
1034 A 19114II
Pe~iga...ee'.
05 0 92
0 0 9"A8.~.
5-. %~
- lmrimzl R 0 OU

F .
2E'X.A.AT.,.i .[%~..Li"
.
.'.'Figure 2. EXPLANATION - J
.5 KEY TO EPICENTER SYMBOLS
Symbols
Intensity (MM)* Type 1 Type 2 Type 3
111 0 A .
IV 4sV l
1 x ,A-
TyoIsymbols indrato In ecene ha a dpmie frm fetrprsonly and had ani epicentrat
Intensity (MMJ) a, Indicated.
Type 2 qynibols indicute u,,rthounkP. dloeiid by seismograntis or in epicenter that was deternined fmromseism.,oran analysts and find nn0 rtpcentrat intensity 1MM) as 117m1cal.
*Typo I ymbonls indicate in opiconter that was dyte-11not Ironi sienoIrain analysis -and tit tho earthquake -
Miltrono as I Iltdwas not tell. An intensify symbol is asslutned to the earthquake uqlnoI the lo -M formula developtedtl y
F oFl intensity in Moditied Mercalli scale alter Wood and Nyuanen IjI
"S v, i'-'.".-
.N..
i X
° V. .,'.
-~~~Or .1.v5 **
C9
J..
" T u yA. r~l.t 'n ell'.elo h tw sd t'm n d fo etrpo t nya d h d a pc nrl."
'"
V. l~ot.. ,, -t . * . '-* .
.-
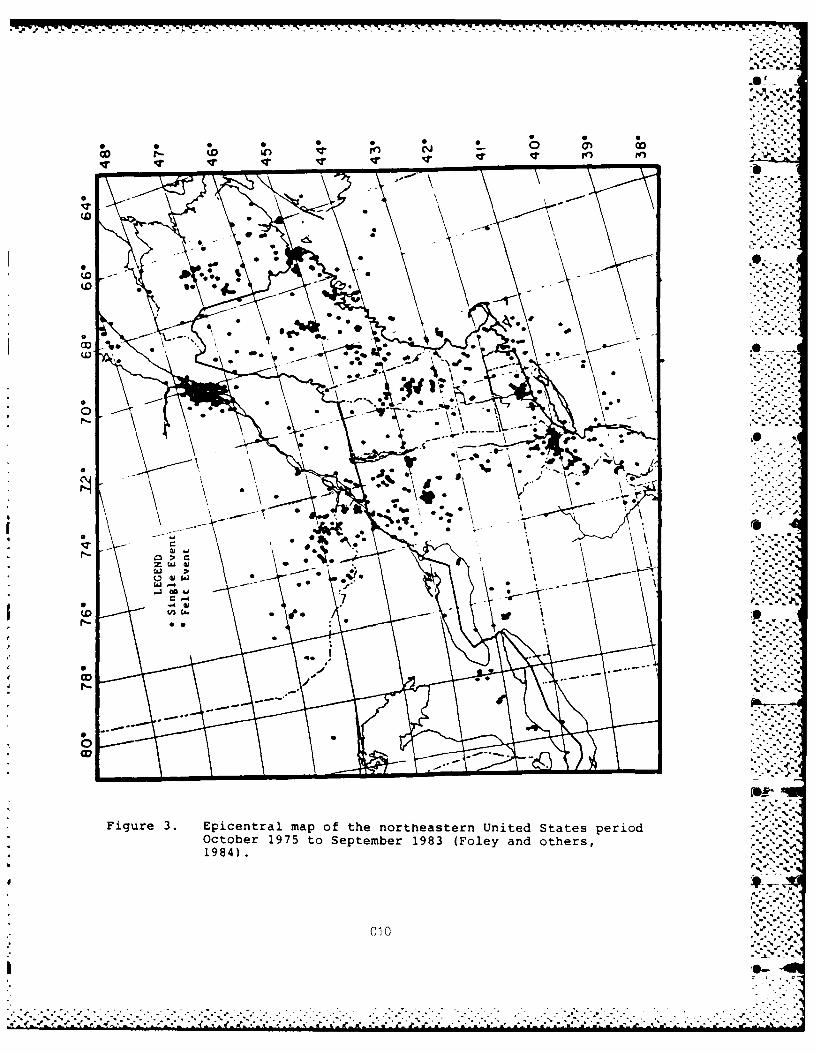
0 0
0 0 00 0 14
(.0 i q- N- 0
pa. now
01
operation. The two Ossipee earthquakes of December 1940 with
intensities of VII and magnitudes of 5.5 are the largest known.
Four intensity VI earthquakes have occurred, including the Gaza
event. An earthquake of V or greater occurs about every 8 years
in the state.
Most of the earthquakes are clustered in a zone through the
state along the Merrimack river valley and around Lake
Winnipesaukee at the southern edge of the White Mountains. The
largest earthquakes and the Gaza event are in the northern part
of this cluster. Some earthquakes occur along the coast not far
from Cape Ann, and a few along the Connecticut River. ,--
The focal depths recorded show a range of 0.53 to 18.75 km J
with the great majority 10.0 km or less. The average depth is
just over 7 km. Errors in depth of 2.0 to 2.5 are typical of
recent years. The listed epicentral accuracies for 1983 are
generally 0.9 to 1.9 km and the potential location error for .- ....
earlier earthquakes increases with their age.
1940 Ossipee Earthquakes
Earthquakes of nearly equal strength occurred north of Lake
Winnipesaukee on December 20 and 24, 1940. The first was located -
at approximately 43.870 N and 71.370 W at a depth of 10.0 km and ...
the second slightly to the east at 7.6 km depth (Dewey, 1983).
Both reached intensity VII. The Richter magnitudes were reported
as about 6.0 and slightly higher, respectively by Leet and
Linehan (1942) and reevaluated as 5.5 mbLg magnitude by Street
and Turcotte (1977). 129 aftershocks were recorded through
/ January 31, 1941 by one observer (Neumann, 1941), although only
10 were instrumentally recorded (Leet and Linehan, 1942). The
C, C ll .-." ...

0 N..A.
*00
0 2,
00%
ell q -V O - - 0 .%. d
C.PS%
~0 \. et'0 O Aq V4
.-6
0r
ell.S ob-
dl 0 44P
JSS '0
.9 012.9,0
Figue 4 Isseisal ap f th 190 Osipe eathqake (Neman, 142)
W:-I..IN.
9C1
p.''. Z

S. S
aa
-k
10.
~~4S A' 01,
0
Figure 5. Detailed isoseismal map of the 1940 Ossipee earthquakes (data from
Neumann, 1942, Smith, 1966).
d5, C13

-rT ~~~~~~~~~~~ I-- V% lzl% 1r1 _m "M _M-W-
earthquakes were first thought to be deep and deep crustal causes,.'.,. ;
were sought (Billings, 1942; Leet, 1942), but the reevaluation by
Dewey (1983) indicates they are shallow, despite the large felt
area, and similar to other nearby earthquakes.The earthquakes were very widely felt, especially to the
southwest. The reported felt area extended from the New
Brunswick border to southwest New Jersey and an isolated report
from Shelby, North Carolina. Some tall buildings were shaken
rather severely in Boston, Massachusetts and Albany, New York by
the earlier shock (Neumann, 1942). The maximum effects were in
the valley at Tamworth, New Hampshire, where 20 old chimneys were -
reported damaged, some being thrown down (Neumann, 1942). Ground
cracks were seen, but the snow cover made an accurate appraisal. 9.'.
difficult.
The reports of effects of the two earthquakes were hard to
separate and they were, thus combined to make a single isoseismal --
map. The produced map has been generalized into a slightly
irregular bulls eye pattern (Fig. 4) , however, contouring of the
reported effects with minimal generalization produces a highly
complex pattern (Fig. 5) The high intensities in the epicentral
area show a northwest-trend centered on the northwest-trending
Wonalancet river valley. Large lobes in the isoseismal lines for
* intensity V also trend northwestward across New Hampshire andVermont. Some relatively higher intensities appear to follow'
river valleys such as along the Merrimack river in southern New
9%
Hampshire, along the Hudson river in east-central New York, the , .".4...,
Connecticut valley in Connecticut and along the Delaware river. %
There is also a slight extension to the southwest along the shore
"" C14
. ., .... . . . . . . . .

- ~ . .,- _ atb- .
of the Great Lakes. A northeast-trending lobe of intensity V
extends into southern Maine. Much of the irregularity in th data
can thus be attributed to poor ground along major river valleys,
but the strong northwest-trends nearer the center may represent
structural and tectonic influence.
SEISMIC PARAMETERS OF THE GAZA EARTHQUAKE . ,.*
-O --.
An earthquake struck central New Hampshire January 18, 1982 .
at 7:14 p.m. EST and was felt over most of New England and New ".*-
York (Fig. 1) (Table 1). It was centered about 1.5 miles (2.4
km) southwest of the village of Gaza in Sanbornton and 7.5 miles , '
(12 km) west of Laconia, New Hampshire, at a depth of about 8 km.
according to Foley and others (1984) and 3 km according to Pulli
and others (1983). The epicenter is located 3.5 ± .56 miles (5.6
± .9 km) northeast of the Franklin Falls dam. The earthquake had
mb and Mn magnitudes of 4.5 and a coda magnitude of 4.7 (Foley
and others, 1984). The variation in parameters listed on Table I
is one indication of the range of error involved and suggests
that the present given accuracies for earthquakes in this region
may be overstated.
The earthquake was accompanied by a great deal of noise in
the epicentral region. Close to the epicenter the noise was
described as resembling a plane crash or bomb and caused one
person's ears to ring for a few hours afterwards.
C15
L ,***.-

TABLE 1 ;,. •
SEISMIC PARAMETERS OF THE GAZA NEW HAMPSHIRE, EARTHQUAKE * "
(compiled from Stover and others (1983) (USGS) andFoley and others (1984) (NEB) Pulli and others (1983) (MIT)
Origin Time:January 19, 1982, 00 hrs. 14 min. 42.67 sec.
Universal Coordinated Time. , 'January 18, 1982, 7:14 p.m. Eastern Standard Time
Epicenter:
43.40- N, 71.60- W (USGS)430 - 30.50', 710 - 37.13 W (NEB)
(43.5080 N, 71.619 0 W)43.52- N, 71.61- W (MIT)
30 stations recorded event in northeast USLargest azimuthal separation between stations is 75'30 phase arrivals used in epicenter locationStandard error of epicenter is 0.9 km
Depth:
7.41 km (NEB)Fair solution qualityStandard error of depth 1.2 km8 km (USGS) (Approximation of NEB)3 km (MIT)
Magnitude:"4.5 mb (USGS source, Gutenberg and Richter (1956) modified
by USGS)-.
4.6 mb (MIT)4.5 Mn (VA Poly Inst. source, Nuttli (1973) calculated
equivalent to Ml magnitude at Richter (1958).4.7 Mc (NEB source, coda duration magnitude)
Maximum Intensity: -.
VI
Felt Area:127,000 sq. km in U.S.
CI 6 "'- .a •a...:. .
<i .:'* . ".
. C..
c16
r -

. • st -, *-
Strong-Motion Data
The earthquake triggered strong-motion instruments across
the region. Eleven instruments at six stations operated by the
U.S. Army Corps of Engineers and one at Seabrook Nuclear Power -
Plant responded (Fig. 6) (Table 2). These were set to trigger at
a vertical acceleration of 0.01 g. The acceleration values from -'
the Corps records have been analyzed by Chang (1983) , Toksoz
(1982) and Sauber (in press) (Table" 3, Fig. 6). The instrument
at Seabrook was just triggered and is about the threshold value
0.01g. The high acceleration values were very unusual for an
earthquake of this magnitude; reaching 0.555g at the abutment of
Franklin Falls Dam. The ground motion causing the acceleration
decayed to the threshold value at approximately 100 km to the
west-southwest and to the southeast (Fig. 7) , but the decay rate
was greater to the south and southwest. It appears to have
decayed at at least twice the rate to the south (Fig. 6). No
instruments were available for control to the north and
northeast.
TABLE 2
STRONG-MOTION STATIONS RESPONDING TO THE
GAZA EARTHQUAKE OF JANUARY 19, 1982(modified from Chang, 1983)
" 21
Responding Site Distance to Epicenter, Direction
Franklin Falls Dam, NH 6 km SWUnion Village Dam, VT 60 km NWWhite River Junction, VT 60 km W-NW .North Hartland Dam, VT 61 km W
North Springfield Dam, VT 76 km W-SW "SSeabrook Nuclear Power Plant, NH 93 km SEBald Mountain Dam, VT 103 km SE. '
Non Responding Site Distance to Epicenter, Direction ... x.
Manchester V.A. Hospital, NH 58 km S-SW _i.Surry Mountain Dam, NH 78 km SW -.
Townshend Dam, VT 99 km SW
C17

372 I44ORANGE
LEGEND
+ EPICENTER
S RECORDED STATION
X UNRECORDED STATION .- m LONGITUDINAL AXIS OF DAM -
-' - - CONCORC- 9 °
V E R M 0 N T ;-'"
N"S" % Ew "W-.'-
M P S
CEHE" L H M P S H I R E"--
%4. .'.
99.:"
SM0 :Z1"... ," . ' ..,
SBS
TrOWNSHENO I
e y t "'' "" '''.'
4"1 IrdlNOHAM MANCHESTER ( V A HOSPITAL) b" "
CHESHIRE HILLSBO0RO .- ,J . °,"
M A S S A C H1 U S E T T S73' 71
.?....:,
Figure 6. Index map showing location of strong-motion seismograph *1-stations in New Hampshire and Vermont (modified from ..Chang, 1983).
-%
C1. ,'
.. -. 4-....,,. " ., .. ...
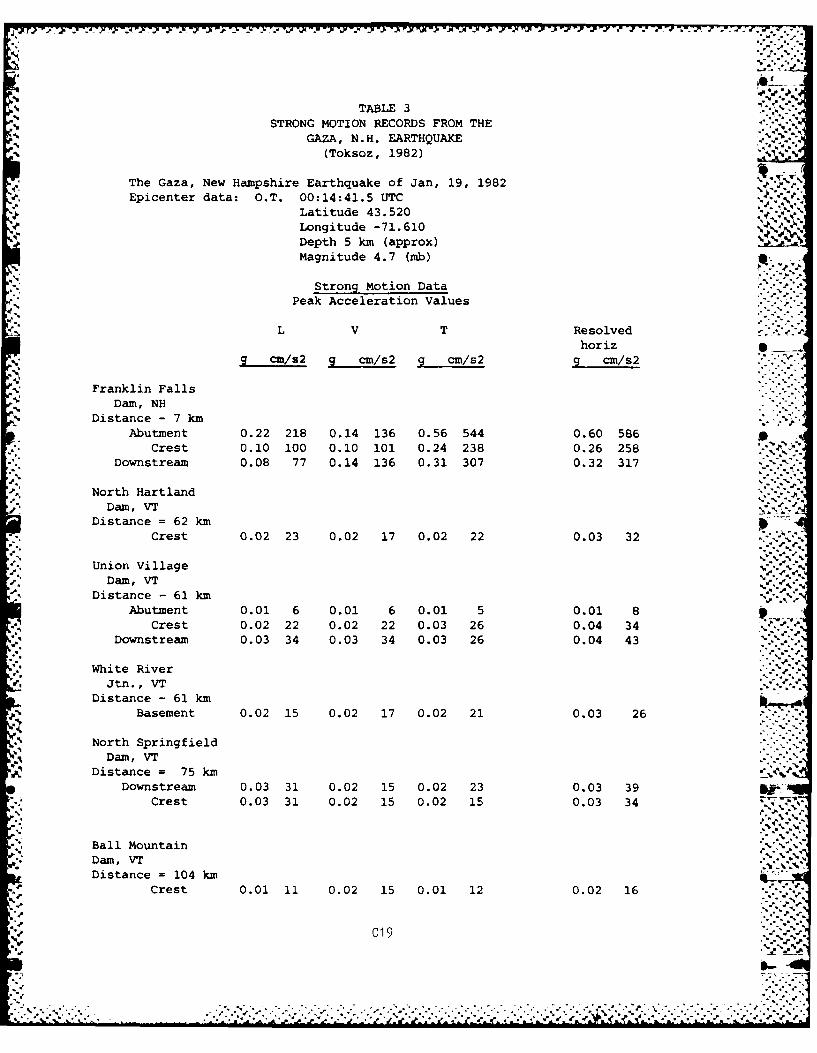
TABLE 3STRONG MOTION RECORDS FROM THE .
GAZA, N.H. EARTHQUAKES. (Toksoz, 1982) ~
The Gaza, New Hampshire Earthquake of Jan, 19, 1982 ,.* *
Epicenter data: 0.T. 00:14:41.5 UTC .~-i .
Latitude 43.520 S.
Longitude -71.610
Depth 5 km (approx)Magnitude 4.7 (mb)
Strong Motion DataPeak Acceleration Values
L V T Resolved. ..
horizg cm/s2 g cm/s2 g cm/s2 g cm/s2
Franklin FallsDam, NH
S-Distance - 7 kmAbutment 0.22 218 0.14 136 0.56 544 0.60 586
Crest 0.10 100 0.10 101 0.24 238 0.26 258*Downstream 0.08 77 0.14 136 0.31 307 0.32 317
55 STOGMTO EODSFO H -S
North HartlandSToDam, VT
Distance = 62 km
Crest 0.02 23 0.02 17 0.02 22 0.03 32
5,. Union Village
Dam, VT 4.Distance - 61 km
Abutment 0.01 6 0.01 6 0.01 5 0.01 8Crest 0.02 22 0.02 22 0.03 26 0.04 34
Downstream 0.03 34 0.03 34 0.03 26 0.04 43
MnuWhite RiverJtn., VT
Distance - 61 kmBasement 0.02 15 0.02 17 0.02 21 0.03 26
North SpringfieldDam, VT
Distance = 75 km-'S.Downstream 0.03 31 0.02 15 0.02 23 0.03 39
Crest 0.03 31 0.02 15 0.02 15 0.03 34" k"
Ball MountainDam, V-T
S. Distance = 104 km
C Crest 0.01 11 0.02 15 0.01 12 0.02 16
C19.
Clam V9 -.Distace = 2 km
¢ Cest .02 3 0.2 17 0.02 22 003 3 .I- '"

Data are Resolvedg Horizontal VI+2 -
9Mb=4. 7 Gaza, N HC
e IN
r
0* Tn
e8
I o Distance (kmn
LEGEND
X Franklin Falls Danm, NH Downstream 0Sea Brook, NH
'7 Union Village Dam, VT Downstream DNorth Springfield, VJT Downstream
* White River Junction, Vt Basement ofVA Hospital .. *-
Figure 7. Chart showing attenuation of acceleration with distancefrom the Gaza earthquake. .The vector sum of the longitudinal and transversecomponents of peak horizontal acceleration formdownstream stations are used. General curves fordifferent magnitudes from Battis, (1981) (modifiedfrom Toksoz, 1982).
C2 0
9.~~I* Am~~ ~%
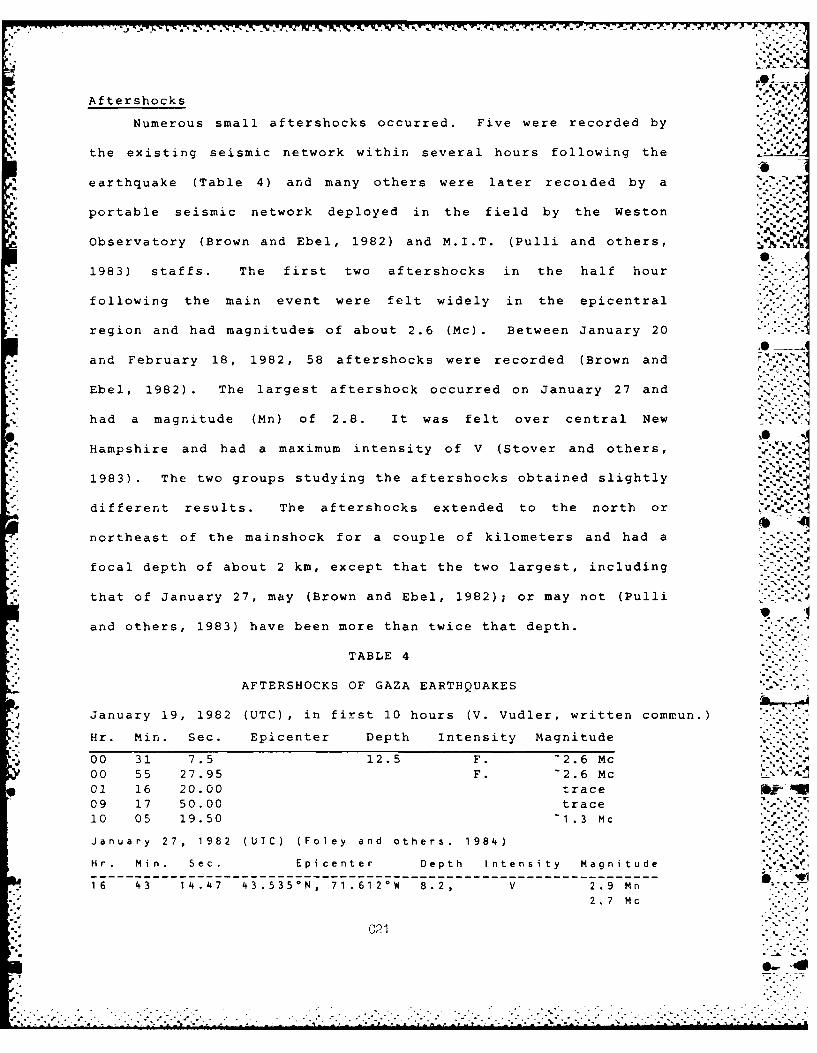
Aftershocks
Numerous small aftershocks occurred. Five were recorded by .-*, 4 ..
the existing seismic network within several hours following the .______
earthquake (Table 4) and many others were later recoided by a %
*: portable seismic network deployed in the field by the Weston
Observatory (Brown and Ebel, 1982) and M.I.T. (Pulli and others,
1983) staffs. The first two aftershocks in the half hour
following the main event were felt widely in the epicentral Iregion and had magnitudes of about 2.6 (Mc). Between January 20 -"'"-"I
and February 18, 1982, 58 aftershocks were recorded (Brown and
Ebel, 1982). The largest aftershock occurred on January 27 and .
had a magnitude (Mn) of 2.8. It was felt over central New
Hampshire and had a maximum intensity of V (Stover and others,,,~.. ,..-
1983). The two groups studying the aftershocks obtained slightly .
different results. The aftershocks extended to the north or ..
northeast of the mainshock for a couple of kilometers and had a
focal depth of about 2 km, except that the two largest, including
that of January 27, may (Brown and Ebel, 1982); or may not (Pulli
and others, 1983) have been more than twice that depth.
TABLE 4
AFTERSHOCKS OF GAZA EARTHQUAKES
January 19, 1982 (UTC), in first 10 hours (V. Vudler, written commun.)
Hr. Min. Sec. Epicenter Depth Intensity Magnitude
00 31 7.5 12.5 F. -2.6 Mc00 55 27.95 F. -2.6 Mc01 16 20.00 trace a *I09 17 50.00 trace10 05 19.50 -1.3 Mc
January 27, 1982 (UTC) (Foley and others. 1984) ' "
Hr. M i. 5ec . Epicenter Depth Intensity Magnitude .'. ,- % , /
16 43 14.47 43. 535-N, 71.612 0 W 8 .2, V 2 9 Mn -
2. 7 Mc
C2 1

a - - I.- M- - ... .... . - . °
INTENSITY OF THE GAZA EARTHQUAKE AND AFTERSHOCK 'i
Regional Intensities
The earthquake was widely felt in the northeast United
States and the adjacent edge of Canada and had a felt area of
127,000 sq. km in the US (Fig. 8) It was felt to the southwest
as far as New York City, but not felt in the-Catskill Mountains
and was felt to the northwest as far as Ottawa (Gary Nottis, oral
commun.). The intensities distribution shows a regional pattern
(Fig. 8) more complex than for 1940 Ossipee earthquakes, probable
reflecting a greater density of reports. Nevertheless several
features can be noted. The distribution of intensity V shows a
irregular, but definite northwest-trend extending from
Portsmouth, New Hampshire (V reported, but not shown on figure)
to Burlington, Vermont. There is a sharp drop off of intensity V
to the northeast and a moderately sharp, albeit irregular, drop
off to the southwest as well. Northwest-trending lobes of
intensity V also cross southwest Vermont and adjacent New York;
echoing subtler lobes in the Ossipee earthquake data (Fig. 5). A
northeast-trending lobe also extends into southern Maine. The '
Connecticut river valley shows a little correspondence with
intensity distribution and perhaps the Mohawk river in New York,
but otherwise river valley control is not obvious.
Epicentral Intensities .
The intensity at several localities in the epicentral region -
reached a low VI (MM) and a few scattered VIs were also recorded
in sensitive spots at more distant locations (Stover and others, -...
1983). The area of intensity VI damage in the epicentral region
C22
%.. .............-............. ..... .....

76 74 72 70 68
46---L
CA.NADA /--
8urlingtort -0)
44gstNEW Y K v
11-1v
Figure 8.yrocsosimlmpoeh aaerhuk Sae n
othersd 1983
Scrnto
PENIg M
EXLN TIN1Near
40I-
Fiue8 ssiml a fteGz arhuk Soe n
otes-18)

RD-R173 23 1 GEOLOGIC L-SEISOLO IC L E VLU TION OF E RTHGUR E 2 ',HZRDSA RNKLIN FRL..(U) ARMY ENGINEER WiATERWAYSEXPERIMENT STATION VICKSBURG MS GEOTE..
USIFEEL RNTSYT . SEP 86 F/0G S/11l
I lff~f..ll.flf

1. ,
\ -
11111 21
L 336 _'.
L.M 0 11
111ff12.2
Ill,,
IMIROCOPY RESOLUTIO TE .
MICROCoPy RESOLUTION TEST CHART ; ".
NA L N L 6 H AU; OF ,ANi;Apb> 'F; A
'%
.4iI

*. It,
-- 0-i,, I''" Ashland
- "/ N q-. *
/ " /Bridgewater
-',. • '. -
- .-- '. e'- .
Bristol@
Hill \0 0/EPICENTER Laconia
DanburyEPICNTER/ .
Franklin Fallsk Dam
Franklin.
N k Northfield * U"+1
G m,,. , N
-.-
Loudon , 0 \ ..
Figure 9. Map showing location of damage in the epicentralS-area of the Gaza earthquake.
C2 4
S.- 0
- * U ~ . -' - *.-. *,....% *- C+*'~ * ~ * . '~ ,

,:_
,' extends from southern Loudon northwestward to southern
Bridgewater (Fig. 9). The damaged area has a northwest
elongation that widens abruptly at its northwest end to somewhat
of a northeast-southwest trend; a shape reminescent of a
hammerhead shark (Fig. 9). A northwest-trending topographic "
lineament, that passes through the epicenter, and a couple of •
others are placed on the map for comparison to northwest-trending
topographic features.
Two days were spent in the field investigating the damage . _
shortly after the earthquake by myself and M.H. Pease, Jr. Also
numerous telephone calls concerning reports of damage were both
received and made. A great many questionnaires on effects from4' .. . .
this earthquake were received and reviewed by E. Schlesinger - .
Miller at Lamont-Doherty Geological Observatory and the U.S. .
Geological Survey. The following short descriptions of the * 4
damage in the epicentral region are those from the field investi- .- '..'.-
gation supplemented by reports listed by the U.S. Geological
Survey (Stover and others, 1983).
""- Loudon
Pleasant View Garden, Pleasant Street, south of Loudon
Center.
Steel posts, set in concrete, supporting northwest side ... o-',
7 of greenhouse raised six inches out of ground (Fig. 10)
and a 36 inch high platform along the wall tilted away
from it. A sliding door in the wall was also pulled
away a little.
C25 ."
* . .e-. 411

;, ll~l~, .pi~
N a ' N77777-77-"
4 I.
.• Ja_ .*,
'%. .
ml a*~. P{
'"* 1
°-''..
k-V
F u 1. P o g
Figure 0. Photograph of greenhouse at Pleasant View Gcz-dens,.-..-..
Loudon, New Hampshire showing concrete base ofsupporting steel pipe raised out of ground.
.
C26- .- V-.-p- -. -
-' ',~ - %-V* - ...x. -' ~ A~s V. - a a• .- ..*..____ _..____
C26 ,.',-.f N.' V-
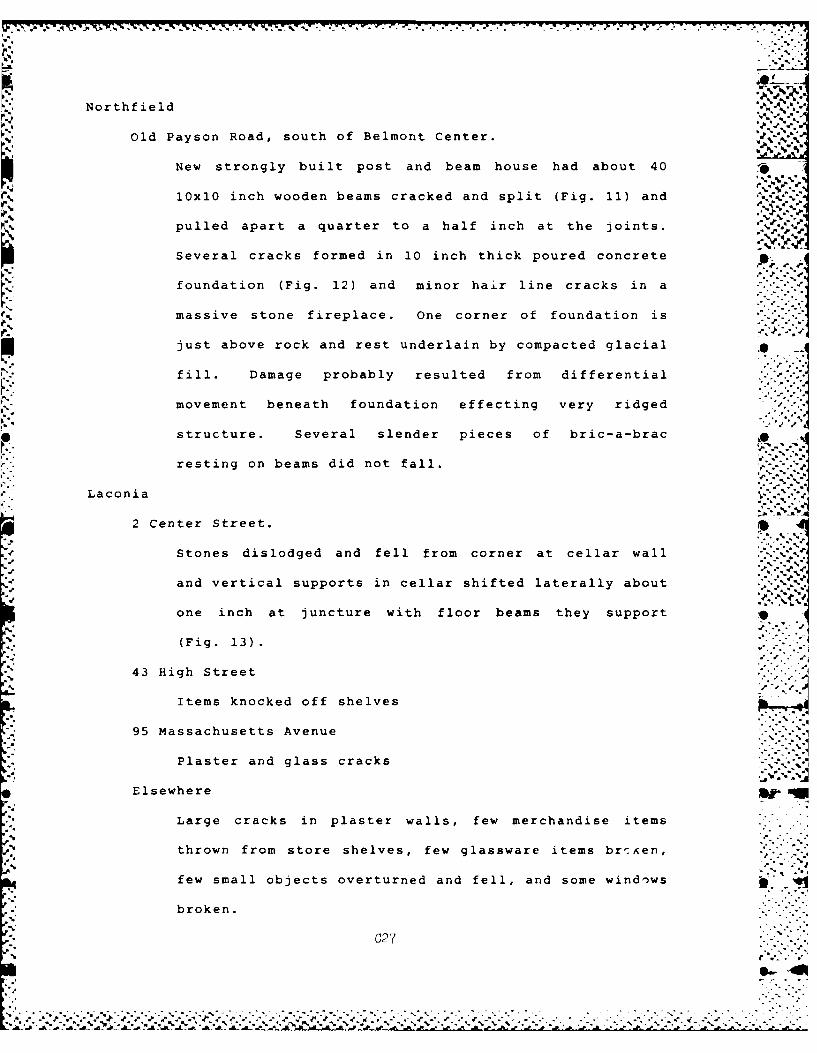
Northfield
Old Payson Road, south of Belmont Center.
New strongly built post and beam house had about 40,: ~.,.. :.:. -,
-% ~10xl0 inch wooden beams cracked and split (Fig. 11) and ,.,.>
% pulled apart a quarter to a half inch at the joints.
Several cracks formed in 10 inch thick poured concrete
foundation (Fig. 12) and minor hair line cracks in a
massive stone fireplace. One corner of foundation isjust above rock and rest underlain by compacted glacial
. fill. Damage probably resulted from differential
movement beneath foundation effecting very ridged
structure. Several slender pieces of bric-a-brac
resting on beams did not fall.
Laconia
2 Center Street.
Stones dislodged and fell from corner at cellar wall
". and vertical supports in cellar shifted laterally about
one inch at juncture with floor beams they support
(Fig. 13).
43 High Street
Items knocked off shelves
95 Massachusetts Avenue
Plaster and glass cracks
Elsewhere a P0
Large cracks in plaster walls, few merchandise items
thrown from store shelves, few glassware items br, en, "*. "
few small objects overturned and fell, and some windows *.*.
broken.
C27
................................................ .-- - .".
A. ' : .l. * .. . --. ;
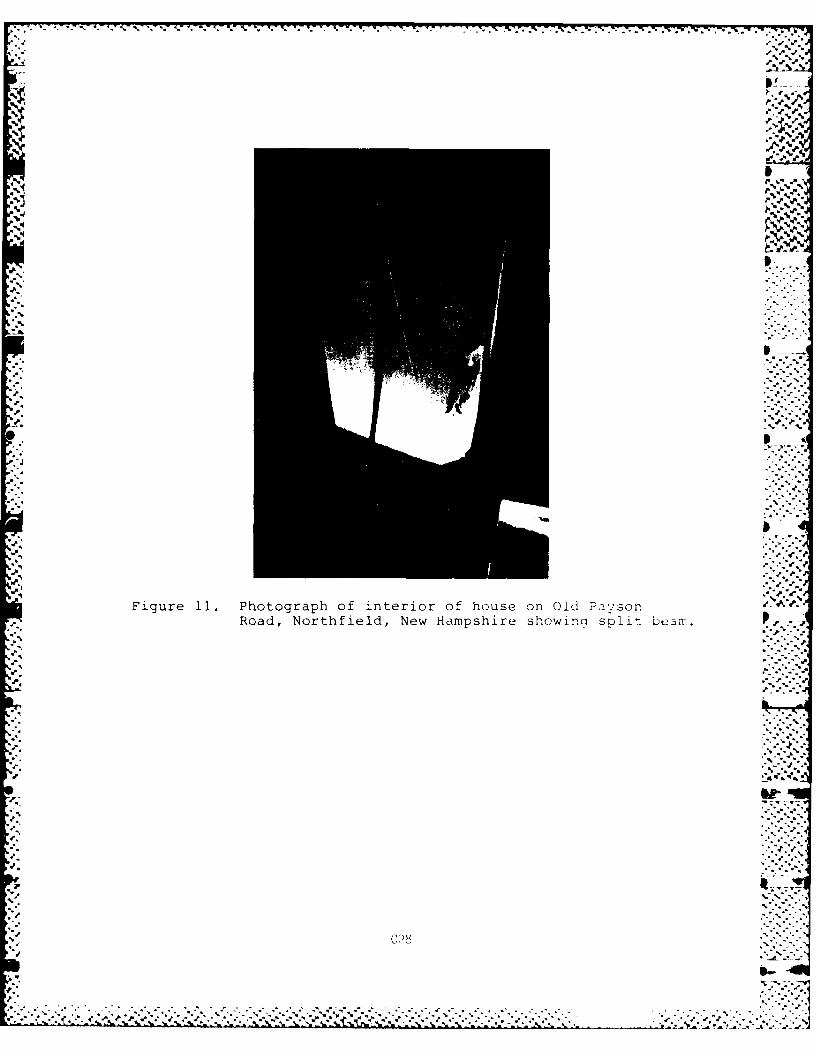
4.4..'.~k ~I
Ift
4.,
Si.
.- 4dw-4.,
Iis ~.
3.4.,
5%
I
5-.
.4.
4.
4..
I
4. .
4.
Figure 11. Photograph of interior of house or. Old Pavsor.
Road, Northfield, New Hampshire showinq split bcan . P
4.
S.-
4..4.
.5..
.5
4.
5-- III..5.
4. . 5.**
Si..'5..
S..
.55'.
C? ~.
-~1S 5*5* ~*> . ~ .j.-.-.*-.*,*.. *....
- . . .. -..~ ~ C:'t..~YN:- -. 5 **~ /** * S S . ~ '.. .. j

. .9
A.A
0~
IC2
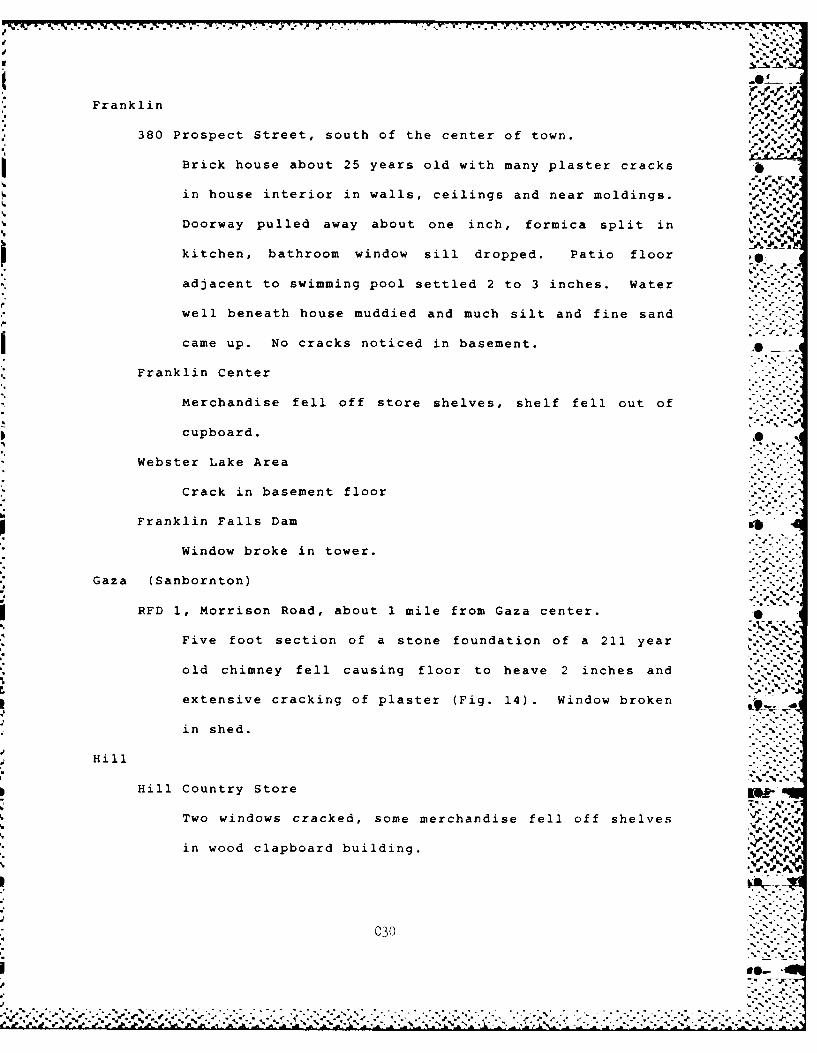
T-. 7. 77 -b 17 7 IT-. . ..- ... 4
Franklin -*'. ."...'.
380 Prospect Street, south of the center of town.
Brick house about 25 years old with many plaster cracks 7
in house interior in walls, ceilings and near moldings.. %
Doorway pulled away about one inch, formica split in
kitchen, bathroom window sill dropped. Patio floor
adjacent to swimming pool settled 2 to 3 inches. Water
well beneath house muddied and much silt and fine sand."-
came up. No cracks noticed in basement.
Franklin Center
Merchandise fell off store shelves, shelf fell out of
cupboard.
Webster Lake Area
Crack in basement floor
Franklin Falls Dam
Window broke in tower.
Gaza (Sanbornton)
RFD 1, Morrison Road, about 1 mile from Gaza center.
Five foot section of a stone foundation of a 211 year
old chimney fell causing floor to heave 2 inches and
extensive cracking of plaster (Fig. 14) . Window broken
in shed.
Hill
Hill Country Store Kok
Two windows cracked, some merchandise fell off shelves%
in wood clapboard building.
NO
C30
-p-
%'•. -. .%".. . . . .
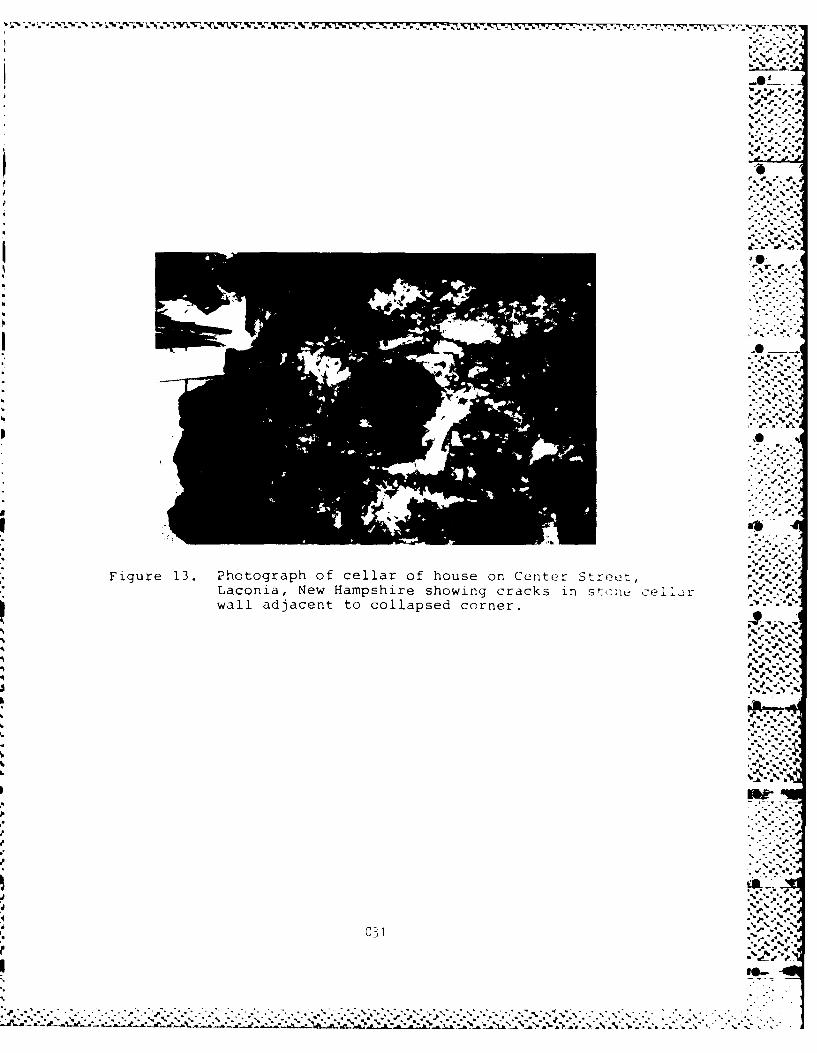
I ,'*@ .- '
4..'... .,
.4'-. ..
. .P A
4 •-" "
Figure13. rto~ogapil f celar ofhouse1n Ce t.r
Lacoia, ew Hmpshre sowin craks i s'ei-..-,~wall ajacentto colapsed orner
S . J"
DW r.
..:::, .:
I-./?
pO-"
-N.i
N * ,4* m
) "."2 - .-J " . "". """" % "" . - J % , , , " , % '" " 2"" ,. ... .' ,'.",",' " . . . ,',.. ,'. . ' ., .-

.7 T
Figure~~~~~~ ~ ~ ~ ~ ~ ~ 14. Phtgaho elro olna os nMrio
Road,~~~~~ ~ ~ ~ ~ ~ Gaa e aphr hwn olpe hme
foundt'o0
C32,

-. *. --- -. -
-o.
Hill Fire Department %
One story cement block building with fine cracks around - -. -
and a few through the blocks, especially on south wall.
Trailer Park north of Hill
Brick stove chimney attached to trailer cracked near
stove pipe hole (Fig. 15).
Bristol
Joe's Market, east side of center of town.
Large single story cement block building with cracks
along mortar joints; mainly along seams, where no
blocks overlap, in back wall, but a few elsewhere
(Fig. 16). Leak in roof increased. Few merchandiseA
items thrown from store shelves.
International Packing Corporation
Single story cement block building on concrete slab had
few fine mortar cracks.
Elsewhere
Split interior walls, cracked plaster walls, few
glassware items broken, few small objects overturned
and fell.
Danbury
Few chimneys cracked. Interior walls had hairline cracks.
Few merchandise items thrown from store shelves and few
glassware items broken. Few small objects overturned and
fell.
Bridgewater
92 Pine Street, east side of Newfound Lake.
Window broken. .-
C33 . ,
*0- % ""
-.... >..,,. _- 1 1. -
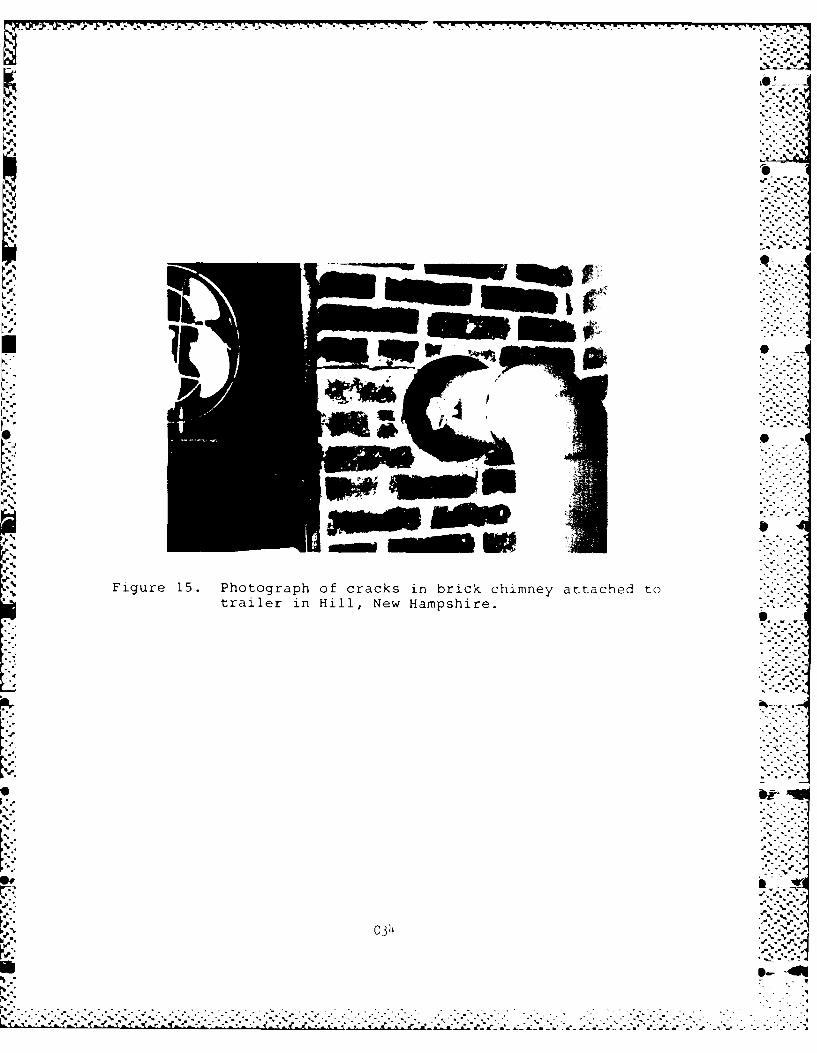
10 Figure 15. Photograph of cracks in brick chimney attached totrailer in Hill, New Hampshire.
C314

- -. .'.-- .....- -- .- -.................................................................
* *~.***
~Of
.. *.
*~. ~
*~.%_.~y*S
-5--.-
)5~
S
* S
N
a-.
5-. -e-
55
* Figure 16. Photograph of back wall of Joe's Market inBristol, New Hampshire showing cracked mortcr Learn. S
5.
.* 5..~
5,
.55
*
5-
'S.. 55
C 3%
I.-
.5-..
. ,~.
. ............ . -55~ - . . .5..-
S S . .5 5 .. ~ .....

a..' ., i.~
" ~ ~.. .. v
Ashland -..- .
Cracked chimneys, few merchandise items thrown from store
shelves and few glassware items broken.
," Aftershock Intensities $,
The largest aftershock in January 27, 1982 occurred slightly
north-northwest of the main shock and produced a maximum intensi-
ty of V (Table 5). The pattern of intensity distribution is
different from the main shock as it has a northeast-trend
(Fig. 17). This may be due to under reporting or possibly due to
adjustments along a fault of a different trend.
,, '.. hTABLE 5 . .
INTENSITIES FOR JANUARY 27, 1982, Earthquake
(Stover and others, 1983)Ab
Origin time: 16 43 14.5Epicenter: 43.53-N., 71.61- W.Depth: 2kmMagnitude: 2.8Mn
Intensity V: O
Laconia--hairline cracks in plaster walls, felt by many
Lochmere--few glassware broken, few small objectsoverturned and fell.
Weare--few glassware broken, few small objects over-turned and fell *..._
Intensity IV; Bristol, Center Harbor, Danbury, Hill,Sanbornton.
Intensity III: Alton, Belmont (press report), Contoocook,Franklin, Guild, Penacook, Wendell,West Ossipee.
Intensity II: Center Sandwich, New Durham.
C36
.L..o .°'o
__ __ __ --c- - - -.. ,'-a..

I. %%
% .P
0023
020
0
-0 02
t0 10 0Z 0~ 3
1982 afeshc (dt rmptvran tes,18)
C37

GEOLOGIC SETTING
New Hampshire consists of slightly to highly metamorphosed ' "
pre-Yississippian sedimentary and volcanic rock of the eastern
Appalachian organic belt cut by a great variety of pre-teritary 4...
% . .intensive rock (Billings 1955) The principal structural ele- .%,
ments are the north to north-east trending regional pre-Mesozoic
* structural trend, remnants of a north-trending chain of Mesozoic
. volcanos and a broad regional northwest-trending fracture zone
that crosses the bend in the regional structure and has at least
some post-Cretaceous movement. These three structural features
cross in central New Hampshire.
Little structural information is directly available from the '4''4
Gaza area in central New Hampshire, but the kinds of structures
present can be inferred with some confidence from work in the
bordering areas.
Central New Hampshire is shown as formed mainly of Devonian
4. Littleton Formation folded into the northeast-trending Merrimack.4. ,*°-4*°%
Synclinorium (Billings 1955); and little other structural.O
information is present on the state geologic map (Fig. 18) . It
is now known to consist mainly of Schist and gneiss of the
Pre-Ordovician, probably pre-Cambrian, Brimfield Group from
detailed work in Connecticut, Massachusetts and reconnaissance
. along routes 93 and 3 in central New Hampshire (Peper and others,
1975; Barosh, 1984; M.H. Pease, Jr., oral commun.). There is no
evidence for a synclinorium, instead the rock, by analogy for the '
south and geomorphic analysis is cut by a series of
northeast-trending, west-dipping thrust-faults, that have served
to control many later intrusive bodies (Fig. 19). Nearer the "'
. . 8 . -" .-.. .
| ,4

?-r -%-
%..-
..... 0
• . , - , -- "-;S~h1. le %.
% **% %.
QuebecNY v
ma'ne
"C ' 0%- %-
't-
Mass.
"3 500 E '' ' '
• . • .
, .:.. .::0
1, 4 .
C39 j j i"n-ia"--~ _50 YWES Aantat
. , ..- -%l
Figure 18. Geologic map of New England and adjacent areas %
(Weston Geophys. Res., 1976). i--
C3 9 0 *2.:7

A -P
Figure 18. Explanation
BEDROCK GEOLOGY OF THE NEW ENGLAND REGION 1
STRATIFIED ROCKS PLUTONIC ROCKS N~ e4 i
UTertiary and Cretaceous -ZL......JCoastal Plain sediments Crtaceous 1 c t%
Trasi continental sedi- Iu::i ena
TRANSLATIONAL FAULTING - PERM4IAN DIS TURBANCE
UF 1 Late Devonian to Pennsylvanian corwi- 4
1Jnental sedinary and volcanic rocks .
Now Hampshire plu tonic seriesD j evonian Ptatform deposits and other intrusive rocks of
0 Unmetamorphosed volcano-clastic Erly to Middle Devonian ages
0,........ rocks of Siluro-Oevonian ageSiluro-Oevonian metamorphic rocks.
<predominantly imotasedimfents
Cambro- Ordovician Platform deposits Rok fOrdo'vici n age including
Cambo-Orowean, etaiorpi rcks ultrabasSic bodies in Vermont and
~J including dated Cambrian rocks in the Easer r.'hso QeeBoston and Narragansett Basins
- Undifferenlia led basement racks. Ages about SOO0to 650 *
million years in the southeast; greater than W00my elsewhwee
FAULTS IMF~o Moo TRS FOLD or FOLIATION TRENDS ~-
J.0
.1 %Uq

4e..
i4.CLC
ww
r.4
CL U
IL 0 ~ m' 0 awww) w1IL. J.*
Ifs~~Q to-. .- 'IL~
d11
0..
IL -* w
a L41(

coast the thrust faults are near vertical and have repeated the
rock units beneath the Brimfield (Barosh, 1984). Such thrust
faults, where mapped, have west over east and right-lateral
components of movement. The faults may have been initiated in.*. -
the late Precambrian and are locally intruded Ordovician and
Silurian intrusive rock. Some have been reactivated- at times and
slivers of younger rocks have been locally caught in these fault
zones by later Paleozoic movement. The major Clinton-Newbury
fault zone lies off shore.
Analysis of these early fault and joint patterns in southern .
New England suggest a maximum compressive stress with a general
orientation of east-northeast-west-southwest, but with many local
variations near major structures. The recorded strain measure-
ments in rock in the region apparently represent residual strain
from this stress. These thrust faults are cut by later north-
west, north-northwest and north-trending faults in the Merrimack
river valley south of Manchester and these cross faults are
indicated by geomorphic analysis to occur further north as well
(Fig. 19) . The course of the Merrimack River in southern New
Hampshire is closely controlled by these structures, the
orientation of different stretches correspond to those of the
local controlling fault.
Intrusive rock representing a chain of Mesozoic volcanos
(part of the White Mountain plutonic series) extends northward
through east-central New Hampshire and into adjacent southern
Maine and northeast Massachusetts. At the Quebec border it meets
another chain, the Monteregion Hills, that extends westward to
Montreal (Fig. 18). The ages range from Triassic to Cretaceous
ck 2 d[[iJ
... ...-..... . . . .-... . .. . . . . . ..

.7. 1.O'__ .
%
and are mainly younger than mid-Jurassic. Mount Ossipee
northeast of Gaza is one of the more prominent volcanic cores.
This volcanic chain may may have formed along a
north-trending zone of extension in the crust following the
northeast-trending one that parallels the coast and developed
prior to the mid-Jurassic during the initial formation of the
Atlantic basin. It may be similar to the extension along the
north-trending Connecticut River valley and the Lake Champlain -
Lake George region. The north-trending Merrimack and -p.""""
Pemigewasset river valleys could be similar.
The maximum compressive force is thus indicated to have a
general northeast-southwest orientation in the early part of the
Mesozoic and a north-south orientation later. Analysis of the
widespread Misozoic dikes in the New Hampshire region suggest
some local variations or changes in the stress orientation may
have occurred (McHone, 1978).
A broad northwest-trending i.acture zone crosses central New
Hampshire, southernmost Maine and continues into east-central and
northwestern Vermont., based on geomorphic analysis that has been
field checked in adjacent areas (Fig. 20). The stream and small
valleys across the entire region show a pronounced
northwest-southeast orientation. Many streams are aligned over
long distances as if along extensive fault zones, although many
shorter alignments may be controlled by joint zones. Such
geomorphic features also occur although in lessor concentration
to the northeast and southwest and where mapped in Massachusetts,
southern New Hampshire or western Maine are found to be faults.
Hobbs (1907) indicated a general lineament through the region,
C4 3
*. 4. " * 4. . 4. % • .. ". " .. % .%, - . . -." . . . , . , ....... .% .. ........ .. %,.. ... .... .'.. I
~~~~~~~~.~~~~~* Aft4 t .~~ .~4Zt.4L. . .-- 4
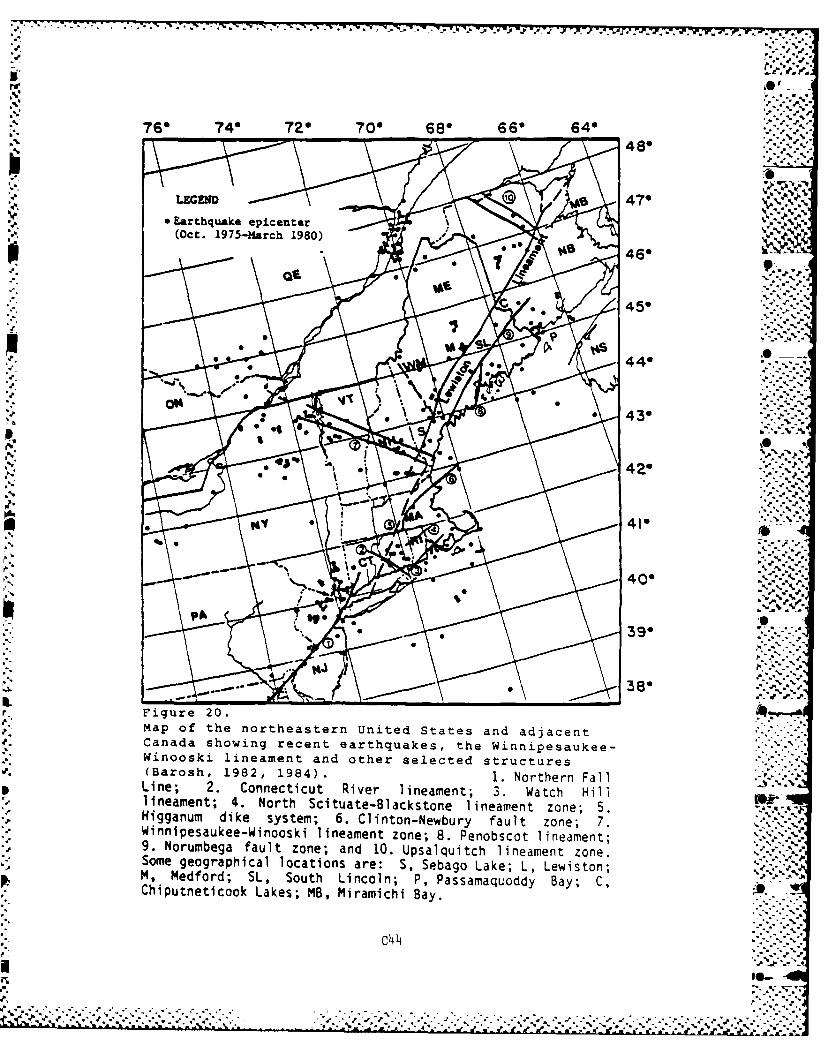
76' 746 720 70O 680 660 640480
*Earthquake epicenter V ~.C.. (Oct. 1975-March 1980) .
46'
45*.
440 0 -
4C. 420
PrP
49'
38" 'Se
Figure 2-
Ma ftenrtesenUitdSae n adacn ......Canada ~ ~ ~ ~ ~ ~ ~ ~ ~ ~ .shwn eeterhuketeWnieake
Figaue 20.e sytm .CitnNwuyfutzn;7
Wniae-Wiooski lineament nde othe Peeceosrcturiesmnt
9iemt . NorfuthZne Sctande1B.ackstone lineament zone .
Some geographical locations are: S, Sebago Lake; L, Lewiston;-, M, Medford; SL, South Lincoln; P, Passamaquoddy Bay; C,Chiputneticook Lakes; MB, Miramichi Bay.
.'
c4 4
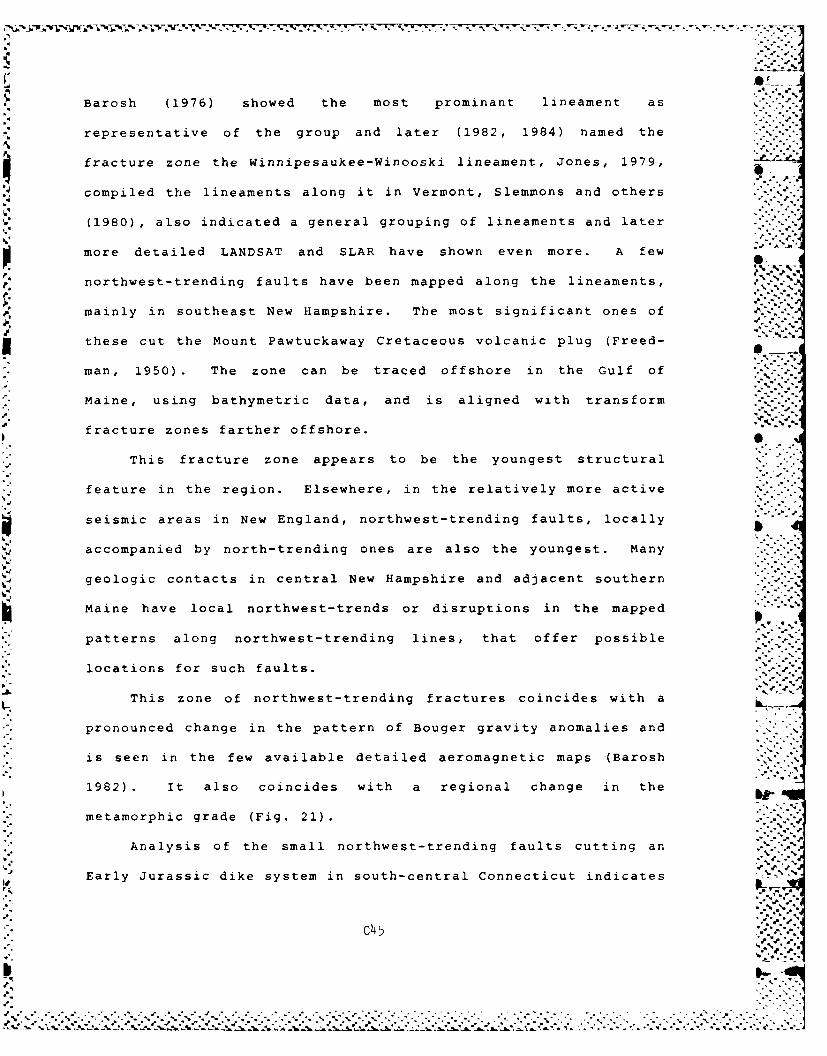
.9.
Barosh (1976) showed the most prominant lineament as
% "representative of the group and later (1982, 1984) named the
fracture zone the Winnipesaukee-Winooski lineament, Jones, 1979,
compiled the lineaments along it in Vermont, Slemmons and others
(1980), also indicated a general grouping of lineaments and later
more detailed LANDSAT and SLAR have shown even more. A few
* northwest-trending faults have been mapped along the lineaments, .4..
-, mainly in southeast New Hampshire. The most significant ones of
these cut the Mount Pawtuckaway Cretaceous volcanic plug (Freed-
. man, 1950) . The zone can be traced offshore in the Gulf of
Maine, using bathymetric data, and is aligned with transform
fracture zones farther offshore.
This fracture zone appears to be the youngest structural
feature in the region. Elsewhere, in the relatively more active
seismic areas in New England, northwest-trending faults, locally
accompanied by north-trending ones are also the youngest. Many
geologic contacts in central New Hampshire and adjacent southern
Maine have local northwest-trends or disruptions in the mapped
patterns along northwest-trending lines, that offer possible
* locations for such faults. .
This zone of northwest-trending fractures coincides with a Z' -.-
Spronounced change in the pattern of Bouger gravity anomalies and
is seen in the few available detailed aeromagnetic maps (Barosh
1982) . It also coincides with a regional change in the
metamorphic grade (Fig. 21).
Analysis of the small northwest-trending faults cutting an
Early Jurassic dike system in south-central Connecticut indicates
C45

^ %,
/LIMEIT OFCOMPILA r/ON e %I.
/450
Im .
. . . . . . . . .
orS
j~
C 1 4 3
REGIONAL.. MEAMRPICMA07.~Lo P/ r- wr-~~y',-*r. ***
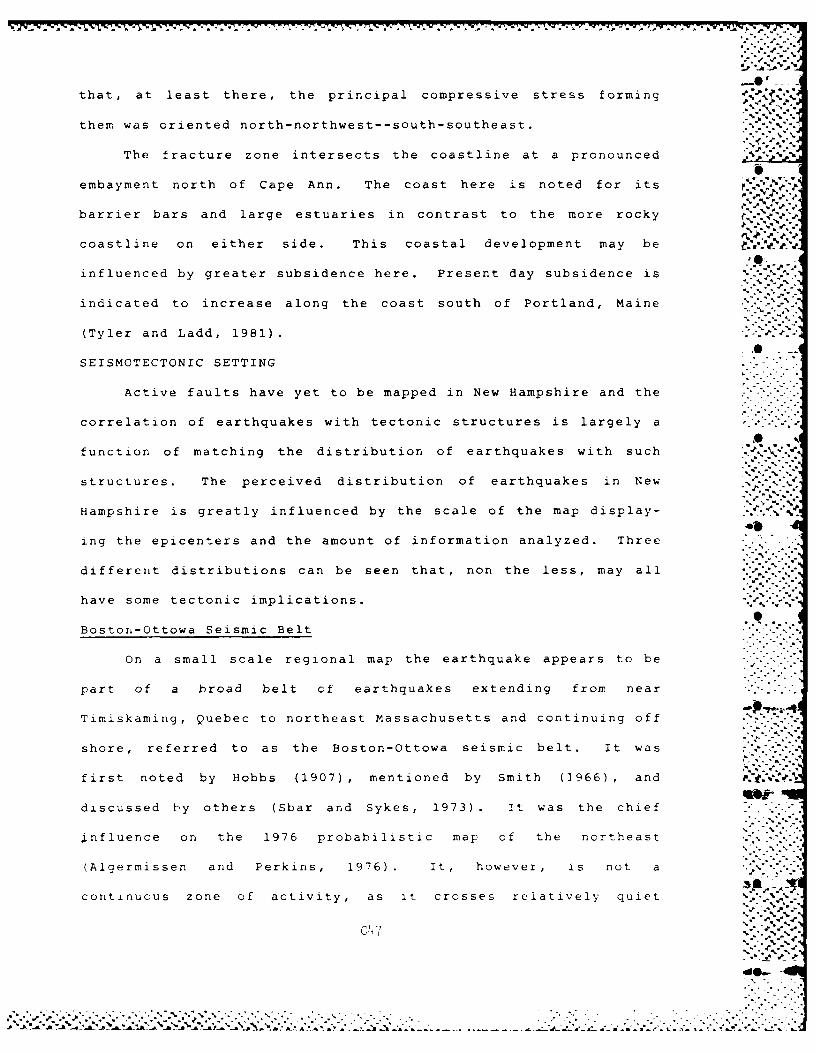
F. •- R . . .. . .. .•
that, at least there, the principal compressive stress forming %"%
them was oriented north-northwest--south-southeast.
The fracture zone intersects the coastline at a pronounced
embayment north of Cape Ann. The coast here is noted for its r. .
barrier bars and large estuaries in contrast to the more rocky -
coastline on either side. This coastal development may be
influenced by greater subsidence here. Present day subsidence is '-
indicated to increase along the coast south of Portland, Maine
(Tyler and Ladd, 1981).
SEISMOTECTONIC SETTING
Active faults have yet to be mapped in New Hampshire and the
correlation of earthquakes with tectonic structures is largely a
function of matching the distribution of earthquakes with such
structures. The perceived distribution of earthquakes in New
Hampshire is greatly influenced by the scale of the map display- -.
ing the epicenters and the amount of information analyzed. Three
different distributions can be seen that, non the less, may all
have some tectonic implications.
Boston-Ottowa Seismic Belt
On a small scale regional map the earthquake appears to be
part of a broad belt of earthquakes extending from near
Timiskaming, Quebec to northeast Massachusetts and continuing off
shore, referred to as the Boston-Ottowa seismic belt. It was .-. ..
first noted by Hobbs (1907) , mentioned by Smith (1966) , and
discussed by others (Sbar and Sykes, 1973) . It was the chief
,Influence on the 1976 probabilistic map of the northeast
(Algermissen and Perkins, 1976). It, however, is not a
continuous zone of activity, as it crosses relatively quiet
-Ij
40 Go
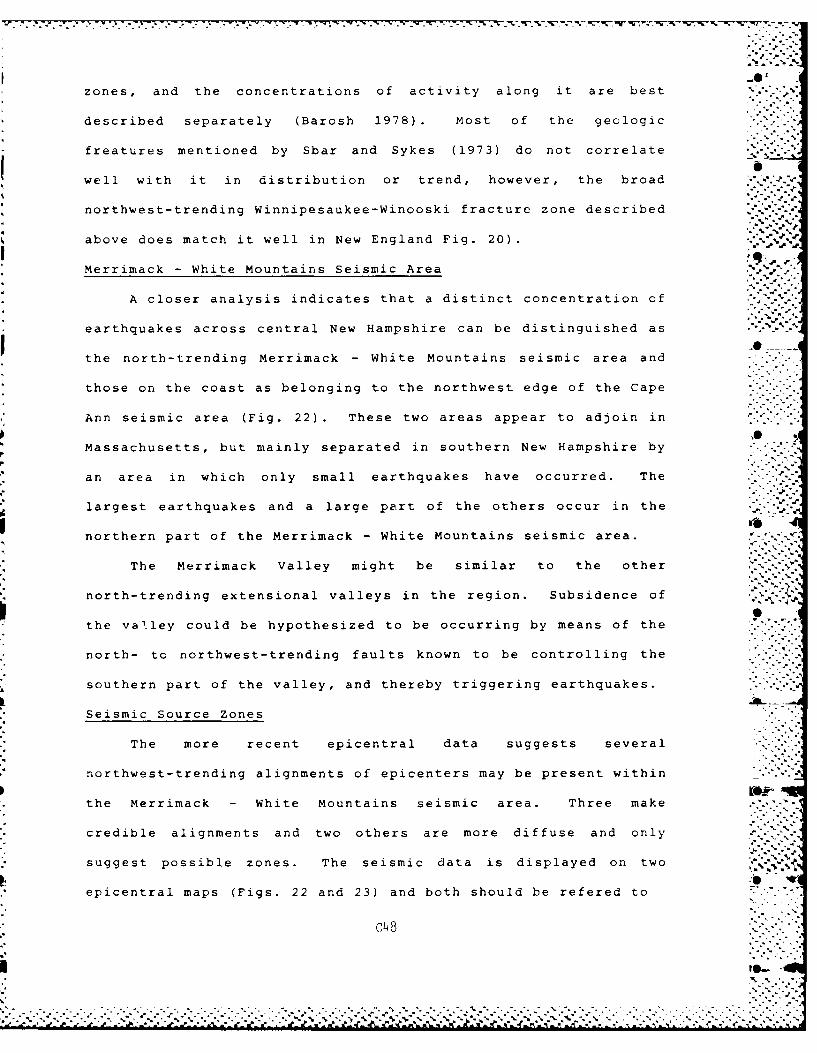
zones, and the concentrations of activity along it are best
described separately (Barosh 1978) . Most of the geologic
freatures mentioned by Sbar and Sykes (1973) do not correlate
well with it in distribution or trend, however, the broad
northwest-trending Winnipesaukee-Winooski fracture zone described
above does match it well in New England Fig. 20). %
Merrimack - White Mountains Seismic Area
A closer analysis indicates that a distinct concentration of
earthquakes across central New Hampshire can be distinguished as
I O ___the north-trending Merrimack - White Mountains seismic area and
those on the coast as belonging to the northwest edge of the Cape
Ann seismic area (Fig. 22). These two areas appear to adjoin in
Massachusetts, but mainly separated in southern New Hampshire by
an area in which only small earthquakes have occurred. The
largest earthquakes and a large part of the others occur in the
northern part of the Merrimack - White Mountains seismic area.
The Merrimack Valley might be similar to the other
north-trending extensional valleys in the region. Subsidence ofS
the val.ley could be hypothesized to be occurring by means of the
north- to northwest-trending faults known to be controlling the
southern part of the valley, and thereby triggering earthquakes.
Seismic Source Zones
The more recent epicentral data suggests several
northwest-trending alignments of epicenters may be present within
the Merrimack - White Mountains seismic area. Three make
credible alignments and two others are more diffuse and only
suggest possible zones. The seismic data is displayed on two %
epicentral maps (Figs. 22 and 23) and both should be refered to
c4 8
C48 ,.."..... . . .
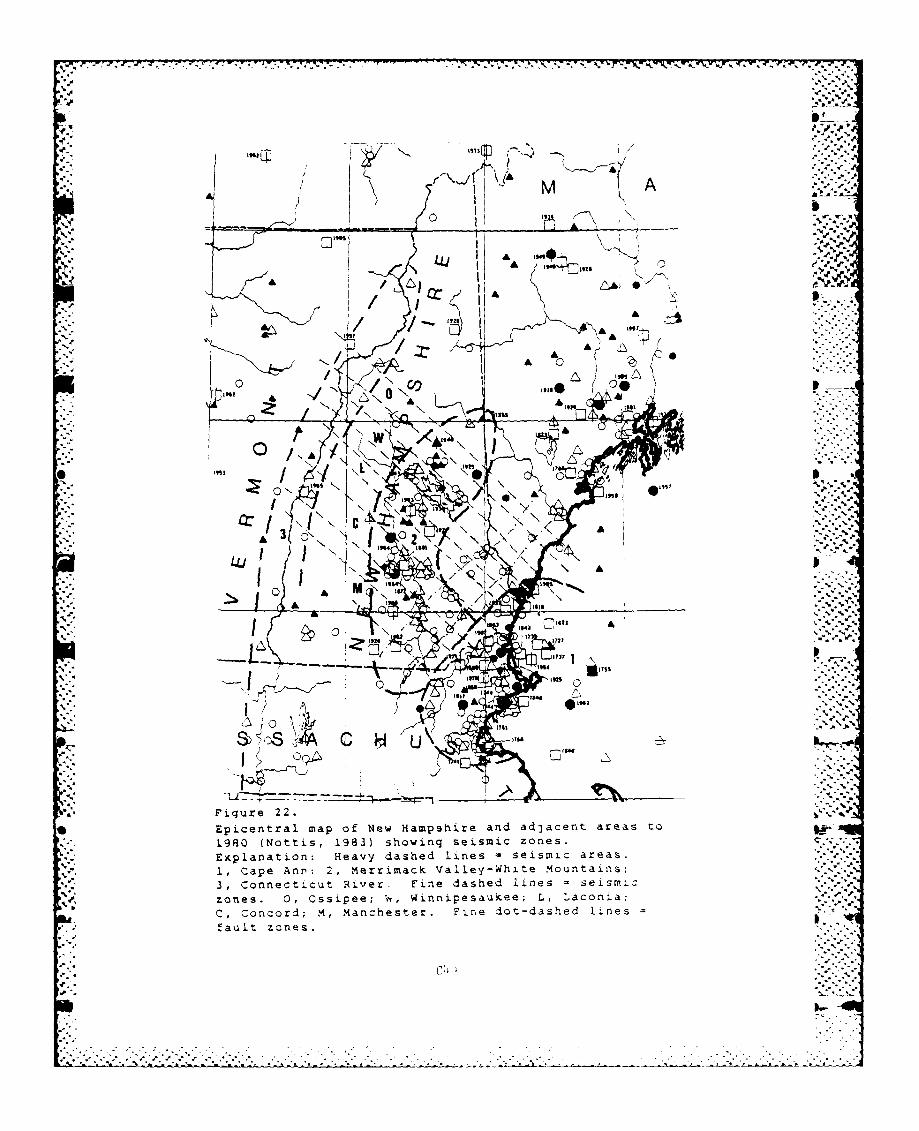
A. 7.77-7. U , R- . * I W-p00R 7 477
04
AS
w p..~A
i~i3~1~DA
1" It
A t isle.";
& I A
173
"4.
ism M
I0IGI Al
4-. On-
Figure 22.
p Eicentral map of New Hampshire and adjacent areas to1980 (Nottis, 1983) showing seismic zones.Explanation: Heavy dashed lines -seismic areas.
1, Cape Ann;' 2, Merrimack Valley-White Mountains;3, Connecticut River. Fine dashed lines -seismic
zones. 0, Ossipee; 'W', Winnipesaukee; L, Laconia;
C, Concord; M, Manchester. Fine dot-dashed lines -
fault zones.
.4J

IA-4
% ZD
Zo
0 JM% %
05
(.~~ IJLZ
%~0 .

to see their zones. These zones are aligned parallel with the* ..• .-
- northwest-trending post-Cretaceous fracture and geomorphic trend
and cross rivers at bends. This apparent geologic correlation *0
suggests they may represent actual seismic source zones. If so,
any actual structural zone would be narrower than these zones
that encompass earthquake locations of varying accuracies.
Ossipee Zone
The Ossipee zone passes northeast of Lake Winnipesaukee
through Lake Ossipee, the Wonalancet river valley and the bend in
the Connecticut river west of Littleton, New Hampshire. It is
defined by the 1940 earthquakes, a 1925 intensity VI event, an -.
intensity V earthquake in Vermont near the river bend and over 20 0
smaller events (Figs. 22 and 23) . The elongated epicentral %
isoseismal pattern for the 1940 Ossipee earthquake extends along
it (Fig. 5).
Winnipesaukee Zone
The broad Winnipesaukee zone passes through the Lake and
southeastward along the bend and northwest-trending stretch in .
the Salmon Falls river at the Maine-New Hampshire border. To the
northwest it passes through short northeast-trending river '-'
segments, between north-trending ones on both the Pemigewasset
(north of Plymouth, N.H.) and Connecticut rivers (north of
Bradford, VT) It is defined by a somewhat diffuse zone of
activity of mainly intensity III or lower, but includes two
intensity V earthquakes in Lake Winnipesaukee area and a couple
on the coast (Figs. 22 and 23). . -
C51 N"a.."".,
"?"-a -..".:
• """" "" ".*" "•"."- -'-"." " "-'." ""- - "" " .,". ."".. .. .-. .-.-. ". ." .""-.".. . . .". .-. "-.". .".. .-.. . ."" -""""," , " -"."
."".'

'- -.. -. ,*---". *.*.- .
Laconia Zone
The Laconia zone passes along the southwest side of Laconia,e-..*.
N.H. , through the sharp bend in the Pemigewasset river, east of
Bristol, through Newfound Lake and a short northeast-trending
stretch of the Connecticut River near Oxford, N.H. It is defined ',. .'.A.
by the Gaza earthquake, two intensity V earthquakes near Laconia
and others near the coast and a number of recent small
earthquakes (Fig. 22 and 23).
Concord Zone
The Concord zone extends along the northwest-trending
stretch of the Merrimack River near Concord and through the bend
of the Ccnnecticut River near Hanover, N.H. and the bend in the0D
coastline near the mouth of the Merrimack River (Fig. 22 and 23).
The zone is defined by a cluster of activity, including two
intensity VI events along the Merrimack River, intensity V
earthquakes at both the Connecticut River and shore and numerous
small events.
Manchester Zone
The Manchester zone represents a diffuse cluster of earth-
quakes in southern New Hampshire, that only vaguely form a
northwest-trending group passing through the bend in the
Merrimack River south of Manchester. Intensity V earthquakes
have occurred in this cluster.
Relations of the Seismic Zones to Geology i.
.1 The seismic zones appear to correspond to some geologic%. .
%' changes and trends in the available geologic data despite its
limited nature. The Ossipee zone crosses the bend in the region-
al geologic struc."-re from north-northeast to northeast of the ..%
C52
,, 7.0 4
ES~.. .. I,-. . E... ,_...'. E-,-.._ E. . p :. ES :. .. *.-_ ..., S - -.. ... : .1. .,5, .. ES ..... -. .1 S .--. -, - - -. .. "--: -. -:,"

2i'
western edge of New Hampshire, lies along the southwest edge of
the White Mountain botholith, the northeast side of the
Winnipesaukee pluton and extends into southern Maine along a line
Swhere contacts change from predominantly northeast-trending on
* the southwest to northwest-trending on the northeast (Fig. 24).
The Winnipesaukee zone extends along a line of abrupt changes in
contact direction and termination of units in western New Hamp-
shire. Through the southwest margin of the Winnipesaukee pluton
and a northwest-trending aeromagnetic lineament along Salmon
Falls River where the Fitchburg and Exeter plutons end.
(Fig. 24). The Laconia zone also lies along a line of changes in
contacts and ends of units in western New Hampshire, along the
southwesternmost edge of the Winnipesaukee pluton and an inferred
fault (Fig. 21) and crosses the Fitchburg pluton at a zone of
disruption and some known northwest-trending faults and crosses
the Exeter pluton where it changes widtn (Fig. 24). Geologic
changes along the Concord zone are a little less pronounced, but
again include changes in contact trends and termination of units
along it in western and central New Hampshire and an abrupt bend 0. -.
in the contact of the Fitchburg pluton (Fig. 24). The Manchester
zone has only slight changes in trend of geologic contacts across A.,-,
it and a couple of terminations of units against it. Where the - -
units mapped along the western edge of New Hampshire, the
Oliverian dames and Ammonoosuc Volcanics are crossed by the zones
they step to the east north of each zone crossing suggesting
right-lateral movement along the zones (Fig. 24). -A-"
The four zones show a correspondence with the broad north-
west-trending disruption of the gravity pattern in New Hampshire -
C53 -..
:L .. -."A7_-:A -A.,

EX LATIN A I N_
C A N A A .
9~N. -k h -- wS" I
pk. 0
.__ 0-
STRUCTURE MAP ,,
NEW HAMPSHIRE
'S %~0 %
4M4
'0.
Z k9
Z'4
A A C H U S T *
*Figure 24. Structure map of New Hampshire (Billings,1955) showing seismic zones.
* Explanation, 0, Ossipee; W, Winnipesaukee; LLaconia; C, Concord; M, Manchester
-~~~~~~ ~ ~ ~ ~ 54 - - - - - - -7I

k- - . 1.' - .
% .
and Vermont. The Ossipee and Manchester zones lie close to the ..*. ...'
border of the disruption and the other two along some changes
within it (Fig. 25). Slightly more detailed gravity information
in central New Hampshire shows a good correspondence of the trend "
of the gravity changes and the Laconia and Concord zones (Fig. .- ,
* ~26).
Focal Plane Solutions . "-# "p p". j .I *?
The interpretation of compressional or dilational movement
from seismograms have been used to construct hypothetical fault .- .,*-.
plane attitudes for the fault movement producing the earthquake. ..
The focal or fault plane solutions that have been interpreted for
several New Hampshire earthquakes vary greatly in orientation -.
(Graham and Chiburis 1980) and are of no apparent use in regional --
* tectonic interpretation.
"" A focal plane solution was constructed for the earthquake
i 4using 24 reliable P-wave first motions (Pulli and others, 1983,
Sauber, in press). A strike-slip motion was interpreted from the *.
data, although two stations did not fit. The attitudes given by * ,
Puli and others (1983) are N 20 0 E, 80*E dip and N 100*E (N80*W)
750 N dip. However, attitudes calculated from the figure showing
the data for the two possible solutions given by Sauber (in
press) and using her dips are north 230 east, 680 southeast dip,
left-lateral motion and north 700 west, 750 northeast dip,
right-lateral. The interpreted northwest striking plane is
roughly in line with the north 45 to 55 west-trending topographic
lineaments near the epicenter and the approximately north 400
west trend of the damage.
C55
. . . . . . .. . . .. - -~- .... . - -p.. - -. -. -. ..-

- .l
-, - *% . ~- ~VSq 'f -.-
r
A\'N
yj ~ ~ 1-
^j./
Figu e 2 . Gr vit map of ew amps ire and erm nt (ild eth1979)showig sesmic ones
Explnaton, , Osipe; W Winipeauke; LLaona C, Cocod;M Mncese

GRAVITY - A-
Insruenal SEISMICITY- - --. *Historica
20 M1-zS /
*\--7 ~
ssp
-r~ %AI
IZ
. kt
Ni~e at ( 76)- --- ----
Figure~~~~~~ ~ ~ ~ ~ ~ ~ ~ 26 rviympofcnra e amsie Wso Goh
Res.,~~~~~ ~ ~ ~ ~ 196 hwnsimczns. Epaain
L, ~~~ ~ ~ ~ ~ ~ ~ *~* Laoi;C ocr;MMnhse. (oeepicentral~~.~ loaton ar icoret.
C57

Fiur 26. Expanaio
GENEALIED BDROK GELOG
Figuref 26.Explanatio
PAIZOCGEERLED BNEDRCKGOLG
IONMTE -QUARTZ UIOP4ITE ~-dmeblc
FO DI UTTLETON FORMdATION Foult inferred from0FS51MERRIMACX GROUP aomaNiesRtI
LOWER . N110A.OZOIC L.OROVCIANUNDIEREN4TIATED
PRECABRIAN MASSUaESIC GNEISS
1PIAYSOURCES: Billings 1954; Nison, of ii, 1976; Weston Goooftscal Research, 1916
B- IOUGUER GRAVITY ANOMALY MAP 42 MILLIGUL CONTOUIR INTMNAL
Im. ot 01, 1976
:J-
I0
6 C5
6NN

O'
PROBABLE CAUSE OF EARTHQUAKES IN CENTRAL NEW HAMPSHIRE
The seismicity in the eastern United States appears to be
due to a combination of factors related to movements generated by
the continued opening of the North Atlantic basin. Earthquakes
appear to occur in areas of vertical movement along north-
west-trending fracture zones, related to the off shore transform
fracture zones, and associated north-trending extensional fault
zones (Barosh, 1981, in press). Other faults may be locally
reactivated where they are intersected. The activity in central
New Hampshire fits with this theory, although lacking information
on vertical movement.
Possible subsidence in the Merrimack-White Mountains seismic
area may localize movement along several zones where it is
crossed by the Winnipesaukee-Winooski fracture zone. This
fracture zone is probably also controlling seismicity where it
crosses the apparently downwarping coast near Cape Ann and the
St. Lawrence lowland. Epicentral data now suggest the activity
is concentrated mainly along four zones within the fracture zone. p
The northwest-trending isoseismal pattern in the epicentral areas
of the Ossipee and Gaza earthquakes and the rapid dropoff of the .*'.
strong motions to the south are consistent with north-
west-trending source zones.
Some minor activity between the Merrimack Valley and Cape
Ann seismic areas appears to be spatially associated with a s .
northeast-trending fault zone along either side of the Fitchburg
pluton where crossed by the fracture zone (Fig. 22) . Such an .-
intersection with extensional faults near the Connecticut River
may also account for the activity there (Fig. 22).
C59
-V. I-.!'

.o - . .- q
The Gaza earthquake is suggested to have occurred along a
broad northwest-trending fault zone and to have had some compo-
nent of right-lateral movement. The movement might possibly have
occurred along a topographic lineament that extends north 4504,. '.. . '
west from the epicenter through Bristol to the northwest and
south 50 ° east through "The Gulf," on the west side of
Sanbornton, and along the Belknap-Merrimack county line to the
southeast (Figs. 9, 27 and 28). A splay extends off this
lineament west of "The Plains" and extends into the Pemigewasset
river east of Hill. The aftershock of January 27 may have been
due to adjustments along an intersected northeast-trending fault.
Salmon brook, that extends north-northeast from near theA
epicenter, lies approximately along the trend and extent of the
aftershocks and could be the location for such fault (Fig. 27).
The Ossipee earthquakes probably had a similar cause.
However, the distribution of seismicity and epicentral intensity
data both indicate that the Gaza and Ossipee earthquakes occurred
on different northwest-trending structural zones. .' ',. -'
A working hypothesis for the local cause of the Gaza
earthquake and other earthquakes in central New Hampshire would
be right-lateral movement along a series of northwest-trending
fault zones and related extensional movement along north to
northeast-trending faults between them (Fig. 29)
IMPLICATIONS TO THE FRANKLIN FALLS DAM SITE
The 1982 Gaza earthquake occurred about 3.5 miles (5.6 km)
northeast of the dam site, but does not greatly change the known
seismic hazard at the site as another intensity VI earthquake,
with a slightly less magnitude, 3.2, had occurred 4 miles
c6o• ., °- 1

I -~KPZ 2 -li
(14,/ ~ 4 J ~ z ~ -- 400
4$
E 1,
rr4-14
-4 U~
3z-0 "-4
3 3l
vil0
C6 1

vr 0 -777
/ ()
.- Ia.
4 4
- ~ ~~-1 62
p -'IiAN

S~
4. *a.4J. #.~.
4.V -,( .pNA
F:~
1
4.
4.
6 0
4.
in-.
SI *
.4
* 29. Sketch map showing possible fault configuration andmovements to account for the seismic activity in central NewHampshire.
* ~
c6 ~
B.-
(6.4 km) to the south-southwest in 1964. The high accelerations
recorded from the earthquake were a surprise, but this very short
period movement produced no damage at the dam site. A previous Istudy on earthquake zonation placed the site on the border of a
zone with a maximum credible local earthquake of intensity VIII ..-
(Barosh, in press) and this study does not change this value. AI
The analysis of the data, however, does clarify possible
earthquake controls in the region. The data suggests there are
northwest-trending seismic source zones in the area. The Laconia
zone, containing the Gaza event, and the Concord zone; each
passing about 3 miles on either side of the dam site. No indica-
tion of an active zone through the dam itself is suggested,
although some structure is probable controlling the position of
the Pemigewasset river there. There is also the suggestion that
sections of north- to northeast-trending structures may have
moved or at least greatly transmitted the seismic force. One
passes through Bristol to the north and possibly through
Northfield to the southwest, but none are indicated at the dam
site.
The analysis indicates that the 1940 Ossipee and Gaza ..
earthquakes are not on some northeast-trending structure that ,
would project very close to the dam, but are on separate north- -
west-trending ones.
C.
c6'....'..-- *. .
•0i[
. . _ _ ,.,. . , ._ , ..._ _ _, ,_,.. . . . .. . . <,_._ . _o . .,_. ..< _.. ,z._ . ,. _. . ,_., ,. .: _.. _, 2_ _ ._ .: .' ,. .,., ., .,
SUMMARY %
The Gaza earthquake, like the 1940 Ossipee earthquake, was a
shallow event with about a normal magnitude-epicentral intensity
relation. The depth was 3-8 km and the epicentral intensity', ".-°...
relation. 4.7 Mc magnitude produced a low VI epicentral •'..
intensity. The shallowness may have been responsible for the -'orecorded very high acceleration values and high noise level, yet
• did not limit the very widespread effects. The distribution
pattern for intensities in the epicentral region for the Gaza and
Ossipee events showed a definite northwest trend as did the
lessor intensities in Vermont. The drop off of values to the.',.
* northeast and southwest is more abrupt, although the decrease to
the southwest is very irregular, due in part to more sensitive
habitats along river valleys. The acceleration values also ... '-
decreased at over twice the rate to the south as to the west,
west-soutwest and southeast. The aftershock sequence and ,%
. intensities displayed a more north to northeast trend for these %.*? . .
shallow, mostly 2 km, earthquakes
The distribution of seismicity and earthquake intensity
and available geologic information are used to produce working
hypothesis, that apears to satisfy the present data, to explain
the crustal movements in central New Hampshire. A broad
northwest-trending fracture zone with known post-Cretaceous
movement, that crosses New England and extends into Canada is
locally active where critical structure is crossed and perhaps .
subsidence is taking place. Central New Hampshire forms one of
these active areas, where a north- to north-northeast-trending PP'.
area of seismicity lies mainly along a fault controlled river
c65
- . 5..--.. .. ........ . .. ..-., • . . -. ...-................... ....-. . - . .. " .' ..

valley and is parallel to extensional Mesozoic faulting along the %.% %1
e 1'.
Connecticut river valley to the west. Within this seismic area
there are suggestions of separate northwest-trending zones of F
epicenters. These apparent zones parallel the geomorphic .'-
expression of the regional fracture zone. The Gaza earthquake '
occurred on one of these zones and produced an elongated pattern
of intensity VI in the epicentral area that coincided with the
zone. The aftershocks, however display a north to northeast
trend and could be due to adjustments along a fault of this trend
north of the epicenter. The 1940 Ossipee earthquakes lie on a
different zone, but showed a similar relation of intensities in
the epicentral region to that zone. Changes in geologic pattern
suggest that right-lateral movement may occur along these zones.
If so, a working hypothesis to account for the seismicity would
be minor right-lateral movement occuring along zones within the,% .% .* .
broad fracture zone resulting in some extensional movement along
north to north-northeast-trending faults adjacent to the zones.
The Franklin Falls dam lies close to and between two zones, that
have experienced intensity VI earthquakes, but no zone is indi- -
cated to pass through the site. The dam site is at the edge of
an earthquake zone with a maximum credible earthquake of VIII for
a local earthquake.
.C. .-.6V.,-. ,. -
c6 6.,"'
,.."..

REFERENCES
Algermissen, S.T. Perkins, D.M., 1976. A probabilistic estimateof maximum acceleration in rock in the contiguous United States.U.S. Geol. Survey Open-File Rept. 76-416
Barosh, P.J., 1976, Compilation of faults and selected lineaments %0.
in the northern Appalachian region: U.S. Geol. SurveyOpen-File Rept. 76-843, 6 p., 1 pl scale 1=1,250,000
Barosh, P.J., ed., 1978, New England Seismotectonic Study
activities during fiscal year 1977: U.S. Nuclear Reg. Comm.Rept., NUREG/CR-0081, 138 p.
*" Barosh, P.J. , 1981, Cause of seismicity in eastern United States:A preliminary appraisal in Beavers, J.E., ed., Earthquakesand earthquake engineering: the eastern United States,
v. 1, p. 397-417, Ann Arbor Science, Ann Arbor, Mich. Bluff .O
fault complex.
% Barosh, P.J., 1982, Structural interpretation of magnetic and ..
gravity data of New England: Soc. Explor. Geophysicists52nd Ann. Intermt. Meeting, Tech. Program Abs., p. 261-262.[ .O
Barosh, P.J., 1984, Regional geology and tectonic history of ..
southeastern New England in Hanson, L.S., ed., Geology of thecoastal lowlands from Boston, MA to Kennebunk, ME: New England
.5 Intercollegiate Geologic Conf., 76 ann. meeting guidebook,Salem State College, MA, p. 1-35. | 4
Barosh, P.J., in press, Seismic source zones of the eastern U.S.and seismic zoning of the Atlantic seaboard and Appalachianregions: U.S. Army Corps of Engineers, Waterways ExperimentStation, State-of-the-art for assessing earthquake hazards inthe United States, Rept. O
Billings, M.P., 1942, Geology of the area of the Ossipee
Earthquakes: Seismol. Soc. Amer. v. 32. p. 83-92.• .'I, .
Brown, E. J. and Ebel, J.E., 1982, A study of selected aftershocksof the January, 1982 earthquake near Laconia, New Hampshire;Earthq. Notes. V. 53, p. 14. " .
Chang, F.K., Analysis of strong-motion data from the New Hampshireearthquake of 18 January 1982: U.S. Army Corps of Engineers, ..
Waterways Experiment Station, Tech. Rept. U.S. NuclearRegulatory Commission Rept. NUREG/CR-3327 '"''
Dewey, J.W. and Gordon, D.W., 1364, Map showing recomputed .5
hypocenters of earthquakes in the eastern and central United
States and ad3acent Canada , 1925-1980: U.S. Geol. SurveyMisc. Field Studies Ma MF-2699, pamphlet 39 p. - %55<
I.'.. C. -

% 7 T.W7 -. -
Foley, J.E. and others, compil., 1984, Seismicity of thenortheastern United States, January 1 - March 31, 1982:Northeastern U.S. Seismic Network Bull. 26, 40 p.
Foley, J.E. and others, compil., 1985, Seismicity of the• northeastern United States, July 1 - September 30, 1983:
Northeastern U.S. Seismic Network Bull. 32, 34 p.hs .%;
Freedman, Jacob, 1950, Stratigraphy and structure of the %Mt. Pawtuckaway quadrangle, southeastern New Hampshire:Geol. Soc. America Bull., v. 61, no. 5, p. 449-492.
Graham, Timothy and Chiburis, E.F., 1980, Fault plane solutionsand the state of stress in New England: New EnglandSeismotectonic Study Rept. prepared for the U.S. NuclearRegulatory Commission, Weston Obser. Boston Coll., 17 p.
Gutenburg, Beno and Richter, C.F., 1956, Earthquake magnitude,intensity, energy and acceleration (2nd paper): Seismol.Soc. Amer. Bull. v. 46, n. 2, p. 105-145.
Hildreth, C.T., compiler, 1979, Bouguer gravity map of north-eastern United States and southeastern Canada, onshore and aoffshore: New York Geological Survey, N.Y. State MuseumMap and Chart ser. no. 32, 1:1,000,000 scale.
Hobbs, W.H., 1907, Earthquakes: New York, D. Appleton and Co.
Jones, T.W., 1979, Study of linear features of Vermont usingremote sensor data: New England Seismotectonic Study Rept.,Univ. Vt., 196 p.
Leet, L.D., 1942, Mechanics of earthquakes where there is nosurface faulting: Seismol. Soc. Amer. Bull. v. 32, p. 93-96.
Leet, D.L. and Linehan, D, 1940, Instrumental study of the NewHampshire earthquakes of December 1940: Seismol Soc. Amer. . -
Bull., v. 32, p. 75-82.
McHone, J. G., 1978, Distribution, orientation and ages ofmafic dikes in central New England: Geol. Soc. Am. Bull.v. 89, p. 1645-1655.
Neumann, Frank, 1942, U.S. Earthquakes 1940: Coast and GeodeticSurvey ser. n. 647, 74 p. '. "
Nottis, G.N., ed., 1983, Epicenters of northeastern United r-States and southeastern Canada, onshore and offshore: timeperiod 1534-1980: N.Y. State Geol. Survey, NY State MuseumMap and Chart ser. n. 38, scale 1:1,000,000. .
Osberg, P.H., Hussey A.M. II and Boone, G.M., eds., 1984Bedrock geologic map of Maine: Maine Geol. Survey,Open - File Rept. 84-1, Scale 1:500,000.
c68
.4Z.
* * :~ .. ~ ~ > * . . . . . . . . . . . .

°.. - - I
Peper, J.D., Pease, M.H., Jr., and Seiders, V.E., 1975,Stratigraphy and structural relationships of the Brimfield %d
group in north-central Connecticut and adjacent Massachusetts: '. e. *.
U.S. Geol. Survey Bull. 1389, 31 p. .. '
Pulli, J.J., Nabelek, J.L. and Sauber, J.M., 1983, Source para- *meters of the January 19, 1982 Gaza, N.H. earthquake:Earthquake Notes v. 54, p. 28.
Sauber, J. M., in press, Determination of source parameters %%for Gaza, N.H. Earthquake.
Sbar, M. L., and Sykes, L. R. , 1973, Contemporary compressivestress and seismicity in eastern North America: An example-?of intra-plate tectonics, Geol. Soc. Amer., Bull., v. 84, . 1
p. 1861-1881. .- ?..
Slemmons, D.B., Sanders, C., and Whitney, R.A., 1980, Low-Sunangle aerial reconnaissance of faults and lineaments ofsouthern New England: prepared for U.S. Army Engineer, NewEngland Div., Waltham, Mass. a'
Smith, P.V., and Barosh, P.J., 1983, Structural geology of theNashua area, south-central New Hampshire in Barosh, P.J.,and Smith, P.V., eds., New England Seismotectonic Studyactivities during fiscal year 1981: U.S. Nuclear Reg. Comm.Rept. NUREG/CR-3253, p. 116-123.
Smith, W.E.T, 1966, Earthquakes of eastern Canada and adjacentareas, 1928-1959: Dom. Obs. Ottawa Pub., v. 32, p. 87-121.
Stover, C. W., Minsch, J.H., Reagor, B.G. and Baldwin, F.W.,1983, Earthquakes in the United States, January - March, 1982:U.S. Geol. Survey Circ. 896A, 42 p.
Street, R.L., and Turcotte, F.T., 1977, A study of northeasternNorth American spectral moments, magnitudes and intensities:Seismol. Soc. Amer. Bull., v. 67, p. 599-614.
Toksoz, M.N., 1982, Seismic hazard analysis of the KnightvilleDam, Huntington, Massachusetts: geology and seismicity report:U. S. Army Engineer, New England Div., Waltham, Mass.
Tyler, D.A., Ladd, J.W., 1981, Vertical crustal movement inMaine, in Barosh, P.J., and Smith, P.V., eds., New EnglandSeismotectonic Study activities during fiscal year 1980:U.S. Nuc. Reg. Comm. Rept., p. 158-159.
Vudler, Vladimir and others, 1981, Seismicity of the northeasternUnited States January 1, 1981 - March 31, 1981: NortheasternU.S. Seismic Network Bull. 22, 28 p. V..
Weston Geophysical Research, 1976, Boston Edison Company Pilgrim '4Unit 2: Summary report geologic and seismologic investigations:
-' Boston Edison Co., BE-SG7602.
c69
%.- 1%-P.J.- .- ..-,.-, .
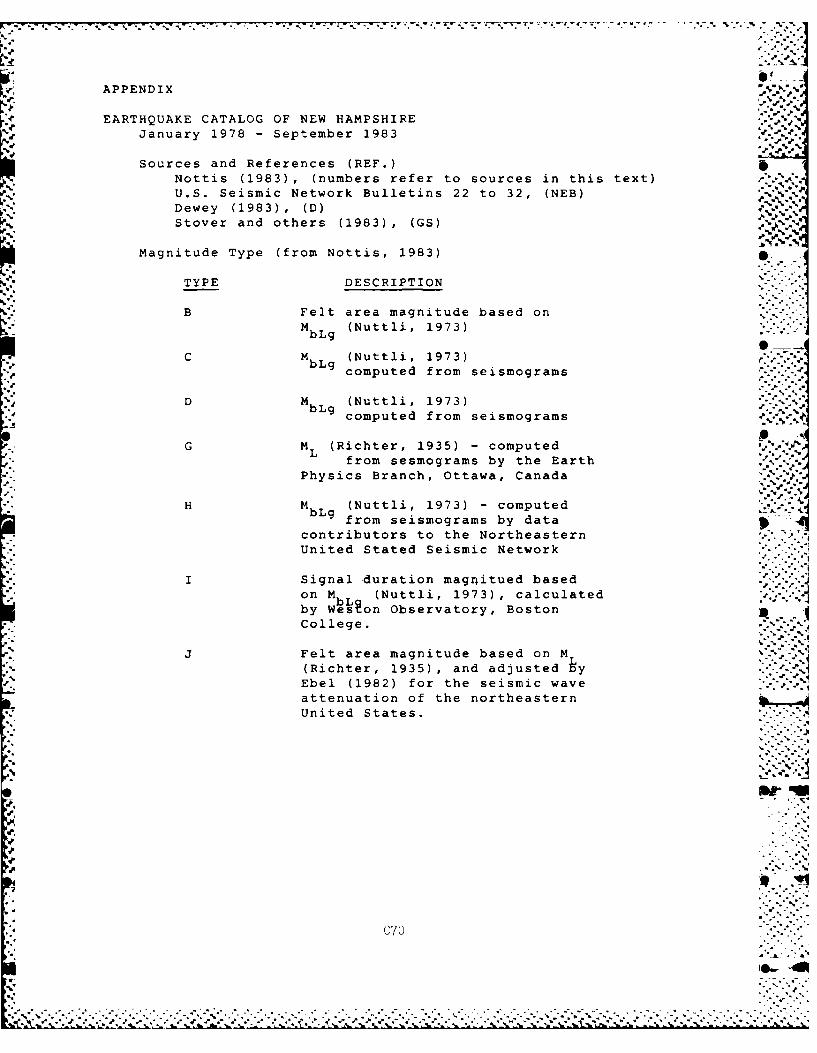
APPENDIX - %.- "
EARTHQUAKE CATALOG OF NEW HAMPSHIRE
January 1978 - September 1983. % %
Sources and References (REF.)Nottis (1983), (numbers refer to sources in this text)U.S. Seismic Network Bulletins 22 to 32, (NEB)Dewey (1983), (D)
% Stover and others (1983), (GS) . '
Magnitude Type (from Nottis, 1983)
TYPE DESCRIPTION " ''
B Felt area magnitude based onM (Nuttli, 1973)
SMbLg (Nuttli, 1973) sesorm-. computed from seismograms
D M (Nuttli, 1973)
bLg computed from seismograms
G M (Richter, 1935) - computedL.-from sesmograms by the Earth
Physics Branch, Ottawa, Canada
H MbLg (Nuttli, 1973) - computedfrom seismograms by data Sol.
contributors to the Northeastern
United Stated Seismic Network
I Signal duration magnitued based
on MbL (Nuttli, 1973), calculated .''-'
by Wes on Observatory, BostonCollege.
J Felt area magnitude based on M(Richter, 1935), and adjusted iy
Ebel (1982) for the seismic wave .
attenuation of the northeasternUnited States.
:.* ...
a.,o,- 4i
io° - • .C70C
i I IlllllI 0 iii'
I I I II i I I " l * I i - t I I l i I I I -I I II I
II I I I
Ii-- I" I
III
i I i I III I
i" I- ! I . - • I I I I I Ili* N.
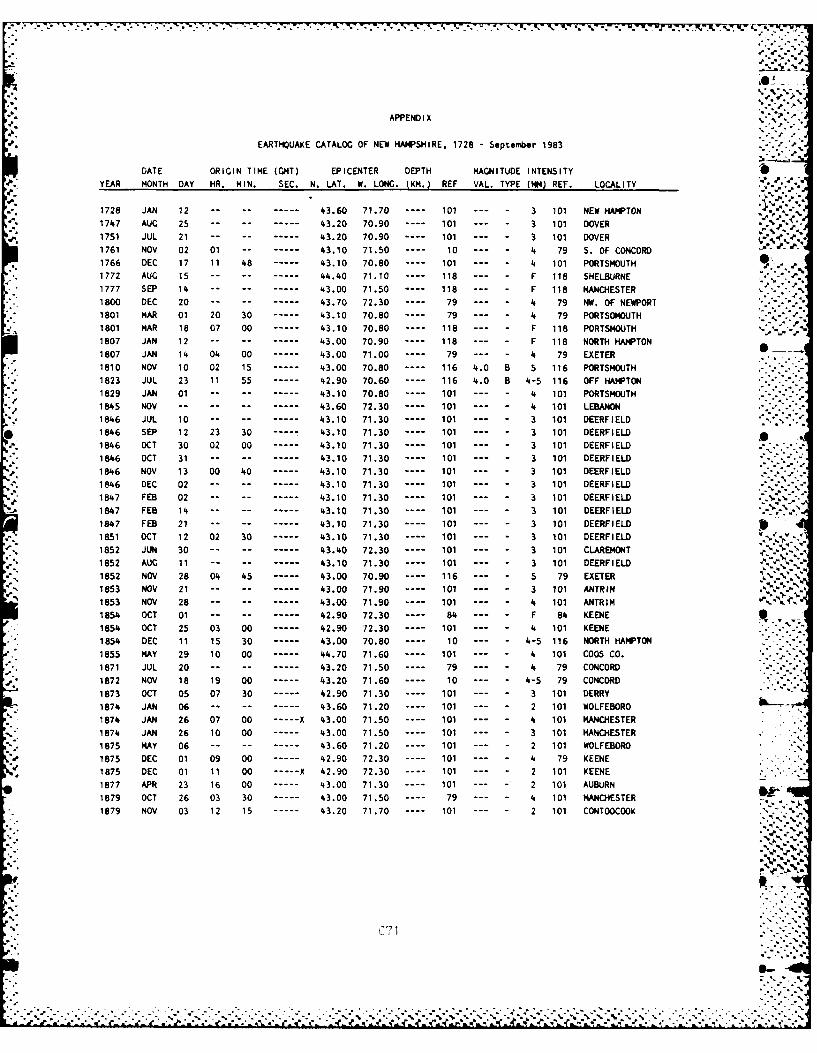
-% -S-..
APPENDIX
EARTHQUAKE CATALOG OF NEW HAMPSHIRE, 1728 - September 1983
DATE ORIGIN TIME (GHT) EPICENTER DEPTH MAGNITUDE INTENSITY 0YEAR MONTH DAY HR. MIN. SEC. N. LAT. W. LONG. (KM.) REF VAL. TYPE (M) REF. LOCALITY .
1728 JAN 12 ..-----. 43.60 71.70 ---- 101 --- 3 101 NEW HAMPTON
1747 AUG 25 ..-----. 43.20 70.90 ---- 101 -- - 3 101 DOVER
1751 JUL 21 ..----- -43.20 70.90 ---- 101 3 101 DOVER1761 NOV 02 01 -- ----- 43.10 71.50 ---- 10 --- 4 79 S. OF CONCORD1766 DEC 17 11 48 43.10 70.80 ---- 101 - 4 101 PORTSMOUTH -1772 AUG 15 -- - ----- 44.40 71.10 ---- 118 F 118 SHELBURNE
1777 SEP 14-- ..----- 43.00 71.50 ---- 118 F 118 MANCHESTER1800 DEC 20 ..-----. 43.70 72.30 ---- 79 --- 4 79 NW. OF NEWPORT
1801 MAR 01 20 30 4---- 43.10 70.80 ---- 79 --- 4 79 PORTSONOUTH r
1801 MAR 18 07 00 4---- 43.10 70.80 ---- 118 --- F 118 PORTSMOUTH '., ..,- '1807 JAN 12 -- -- ----- 43.00 70.90 ---- 118 F 118 NORTH HAMPTON
1807 JAN 14 04 00 43.00 71.00 ---- 79 - 4 79 EXETER
1810 NOV 10 02 15 ----- 43.00 70.80 ---- 116 4.0 B 5 116 PORTSMOUTH1823 JUL 23 11 55 4---- 42.90 70.60 ---- 116 4.0 B 4-5 116 OFF HAMPTON
1829 JAN 01 -- -- ----- 43.10 70.80 ---- 101 --- - 4 101 PORTSMOUTH., 1845 NOV -- ------ 43.60 72.30 ---- 101 - 4 101 LEBANON
1846 JUL 10 ...-----. -- 43.10 71.30 ---- 101 - 3 101 DEERFIELD1846 SEP 12 23 30 4.... 43.10 71.30 ---- 101 --- 3 101 DEERFIELD
1846 OCT 30 02 00 4---- 43.10 71.30 ---- 101 --- 3 101 DEERFIELD
1846 OCT 31 -- -- ----- 43.10 71.30 ---- 101 --- 3 101 DEERFIELD
1846 NOV 13 00 40 43.10 71.30 ---- 101 - 3 101 DEERFIELD '.r1846 DEC 02 ----- ----- 43.10 71.30 ---- 101 - 3 101 DEERFIELD - -
1847 FEB 02 ----- 43.10 71.30 .--- 101 - 3 101 DEERFIELD
1847 FEB 14- ..-----. 43.10 71.30 ---- 101 - 3 101 DEERFIELD
1847 FEB 21 ..-----. 43.10 71.30 ---- 101 --- 3 101 DEERFIELD
1851 OCT 12 02 30 4---- 43.10 71.30 ---- 101 --- 3 101 DEERFIELD1852 JUNR 30 -- -- ----- 43.40 72.30 ---- 101 - 3 101 CLARE4ONT
1852 AUG 11 -- -- ----- 43.10 71.30 ---- 101 --- 3 101 DEERFIELD1852 NOV 28 04 45 4---- 43.00 70.90 ---- 116 --- 5 79 EXETER,. . ',
1853 NOV 21 -- -- ----- 43.00 71.90 ---- 101 - 3 101 ANTRIN1853 NOV 28 ..-----. 43.00 71.90 ---- 101 - 4 101 ANTRIM1854 OCT 01 ..-----. 42.90 72.30 ---- 84 - F 84 KEENE
1854 OCT 25 03 00 4---- 42.90 72.30 ---- 101 - 4 101 KEENE
1854 DEC 11 is 30 43.00 70.80 ---- 10 --- 4-5 116 NORTH HAMPTON1855 MAY 29 10 00 ----- 44.70 71.60 ---- 101 - 4 101 COOS CO.
1871 JUL 20 .. .. .....- -43.20 71.50 ---- 79 - 4 79 CONCORD
1872 NOV 18 19 00 ----- 43.20 71.60 ---- 10 - 4-5 79 CONCORD
1873 OCT 05 07 30 ----- 42.90 71.30 ---- 101 - 3 101 DERRY
1874 JAN 06 - -- ----- 43.60 71.20 ---- 101 - 2 101 WOLFEBORO
1874 JAN 26 07 00 ----- X 43.00 71.50 ---- 101 - 4 101 MANCHESTER1874 JAN 26 10 00 4---- 43.00 71.50 ---- 101 - 3 101 MANCHESTER1875 MAY 06---- . .----- 3.60 71-.-20 -- 101 --- 2 101 WOLFEBORO
1875 DEC 01 09 00 4---- 42.90 72.30 ---- 101 - 4 79 KEENE1875 DEC 01 11 00 X 42.90 72.30 ---- 101 --- 2 101 KEENE
1877 APR 23 16 00 ----- 43.00 71.30 ---- 101 - 2 101 AUBURN
1879 OCT 26 03 30 4---- 43.00 71.50 ---- 79 -- - 4 101 MANCHESTER1879 NOV 03 12 15 4---- 43.20 71.70 ---- 101 - 2 101 CONTOOCOOK
ilk7
-

.~~~ ." .% .' .
DATE ORIGIN TIME (GMT) EPICENTER DEPTH MAGNITUDE INTENSITY
YEAR MONTH DAY HR. MIN. SEC. N. LAT. W. LONG. (KM.,.) REF VAL. TYPE (MM) REF. LOCALITY
1880 JUL 13 04 00 43.20 71.60 ---- 101 --- 2 101 CONCORD
1880 JUL 21 00 00 43.00 71.50 ---- 79 --- 4 101 MANCHESTER ,1880 AUG 21 -- -- ----- 43.20 71.10 ---- 101 --- 2 101 BARRINGTON1881 FEB 04- ..-----.. -43.00 70.80 ---- 101 -- - 2 101 GREENLAND
1881 FEB 12 ..------ -43.00 70.80 .-- 101 --- 2 101 PORTSMOUTH
1881 APR 03 09 25 - 43.00 71.90 ---- 101 3 101 ANTRIM
1881 MAY 18 05 20 *3.20 71.70 ---- 101 3 101 CONTOOCOOK1181 KAY 18 08 30 43.20 71.70 ---- 101 "~" 3 101 CONTOOCOOK1881 AUG 13 .. .. - 43.20 71.70 ---- 101 --- 3 101 CONTOOCOOK
1881 OCT 06 05 03 4---- 43.20 71.60 ---- 101 --- 3 101 BRISTOL1881 OCT 31 06 40 43.20 71.70 ---- 101 --- 2 101 CONTOOCOOK
1882 APR 17 19 00 ----- 43.20 71.70 ---- 101 --- 4 101 HOPKINTON
1882 MAY 08 09 00 43.20 71.60 ---- 101 -- 3 101 CONCORD1882 DEC 19 22 20 ----- 43.20 71.40 ---- 10 --- 4 10 CONCORD
1883 FEB 04 20 05 - 43.60 71.20 ---- 101 --- 2 101 WOLFEBORO .O1884 JAN 18 07 00 - 43.20 71.70 ---- 101 --- - 4 101 CONTOOC-OK
1884 OCT 27 01 00 - 42.80 71.40 ---- 101 "'- 2 101 NASHUA . . ..
1884 NOV 13 00 50 - 43.20 71.60 ---- 101 --- 2 101 CONCORD
1884 NOV 23 05 30 ----- 43.20 71.70 ---- 10 4.0 B 5-6 101 CONCORD1884 DEC 17 07 00 ----- 43.70 71.50 ---- 101 --- - 3 101 CENTER HARBOR
1885 JAN 03 07 00 - 43.50 71.50 ---- 10 -- - 2 101 LACONIA
1885 MAR 18 17 00 - 43.20 71.70 ---- 101 -- - 2 101 CONTOOCOOK.--
1886 JAN 06 00 10 - 42.90 71.50 ---- 79 -- - 4 79 MERRIMACK1886 JAN 17 22 14 ----- 42.80 71.40 ---- 79 "'" - 4 79 NASHUA
1887 JUL 01 02 00 4---- 43.20 71.53 ---- 79 -- - 4 79 CONCORD "
1889 MAR 08 -- -- ----- 43.50 71.60 ---- 79 - - 4 79 FRANKLIN . ..1891 MAY 02 00 10 - 43.20 71.60 ---- 10 4.0 B 5 10 NEAR CONCORD1891 MAY 30 00 00 - 43.10 71.50 ---- 101 - 4 101 NEAR CONCORD.
1892 DEC 11 16 30 --- 44.30 71.70 ---- 79 - 4 79 BETHLEHEM1893 JUL 02 -- -- ----- - 42.90 72.10 ---- 84 F 84 DUBLIN
1896 OCT 22 10 30 ----- 44.30 71.80 ---- 79 "-- - 4 79 BETHLEHEM
1897 JUL 01 09 20 4- 3.70 71.60 ---- 101 -"- - 4 101 MEREDITH
1905 MAR 05 02 25 - 43.60 72.30 ---- 116 --- - 4-5 116 LEBANON1905 AUG 30 10 40 --- 43.10 70.70 ---- 116 --- 5 116 ROCKINGHNA4 CO.
1908 NOV 23 13 00 - 43.50 71.70 ---- 79 --- - 4 79 FRANKLIN
1910 AUG 30 14 30 - 43.40 72.10 ---- 10 --- - 4 10 LAKE SUNAPEE
1911 MAR 02 21 30 4---- 43.20 71.50 .... 79 --- - 4 79 CONCORD1920 MAY 23 08 00 43.11C 71.50 ---- 101 --- 4 101 CONCjRD. ,
1922 MAY 07 22 40 --- 43.40 71.40 ---- 101 --- - 4 101 PITTSFIELD1925 MAR 09 -- -- ----- 42.90 71.50 ---- 101 --- 4 101 GOFF'S FALLS " '1925 OCT 09 14 00 43.70 73.10 ---- 79 --- - 6 116 OSSIPEE .. -
1926 MAR 18 21 09 - 42.80 71.80 ---- 116 -- " 5 116 NEW IPSWICH1927 MAR 09 04 08 - 43.30 71.40 ---- 10 --- 4-5 116 CONCORD1928 APR 25 23 38 - - 44.50 71.20 ---- 37 4.0 B 5 102 BERLIN1928 APR 28 22 07 ----- 43.20 71.50 ---- 37 --- - 4 102 CONCORD
1928 NAY 22 00 24 ----- 43.20 71.50 ---- 37 -- - 2 102 CONCORD -1928 MAY 26 -- -- ----- 43.20 71.70 ---- 37 -- - 2 102 CONTOOCOOK
1928 OCT 15 ------------ 45.10 71.40 ---- 37 - 2 102 PITTSBURG1928 OCT 17 00 30 ----- 42.80 71.60 ---- 37 --- - 3 102 WILTON ,j.__1928 NOV 05 04 00 43.30 71.30 ---- 37 - 2 102 ROCHESTER
1928 DEC 01 -- .-- ----- 43.30 71.00 ---- 37 -- - 2 102 ROCHESTER
.. 5, ,'
C72
a 0-p
.? 5..%.'

DATE ORIGIN TIME (GMT) EPICENTER DEPTH MAGNITUDE INTENSITY
YEAR MONTH DAY HR. MIN. SEC. N. LAT. W. LONG. (K4.) REF VAL. TYPE (mm) REF. LOCALITY
1929 JAN 13 -- -- ----- 43.30 71.00 ---- 38 --- 2 102 ROCHESTER b1929 JAN 15 02 45 ----- 43.30 71.00 .... 38 --- 3 102 ROCHESTER
1929 FEB 05 17 10 ----- 43.30 71.70 ---- 38 --- 2 102 WEARE
1930 FEB 14 06 15 4---- 43.40 71.70 ---- 65 --- 3-4 102 FRANKLIN
1930 MAR 19 00 1s - - 43.30 71.60 6- - 6 54 102 CONCORD1932 OCT 15 03 10 ----- 43.60 71.50 ---- 67 --- 3 102 MEREDITH
1932 OCT 16 19 12 42.90 72.30 ---- 67 --- 2 102 KEENE
1932 NOV 04 05 00 43.20 71.50 ---- 67 --- 2 102 CONCORD .
• 1935 SEP 13 03 49 4---- 43.20 71.50 ---- 70 --- F 70 CONCORD
. 1936 JUN 14 0 40 43.50 71.50 ---- 71 --- 3 102 LACONIA
1936 JUN 15 DO 49 43.80 71.40 ---- 102 --- 3 102 CENTER SANDWICH
" 1936 NOV 10 02 46 ----- 43.60 71.40 ---- 102 --- 5 79 LACONIA
1938 APR 01 22 15 ----- 43.30 71.00 ---- 73 --- 3 73 ROCHESTER
1938 APR 03 ..-----. 43.30 71.00 ---- 102 --- 2 102 ROCHESTER
1939 OCT 10 ..-----. 43.40 71.60 ---- 102 --- 3 102 TILTON
1939 OCT 11 18 49 -2.90 71.40 ---- 102 ... 3 102 DERRY
1940 DEC 20 07 27 26.20 43.87 71.37 10.0 32D 5.5 C 7 74 OSSIPEE
1940 DEC 24 13 00 ----- X 43.80 71.30 .... 74 --- - F 74 OSSIPEE
1940 DEC 24 13 43 45.OOX 43.90 71.28 7.6 32D 5.5 C 7 74 OSSIPEE
1940 DEC 24 14 33 ----- X 43.80 71.30 ---- 74 2.8 C F 74 OSSIPEE
1940 DEC 24 18 12 ----- X 43.80 71.30 ---- 74 --- - F 74 OSSIPEE
1940 DEC 25 05 04 ----- X 43.80 71.30 ---- 74 3.7 C F 74 OSSIPEE
1940 DEC 27 19 56 ----- x 43.80 71.30 ---- 102 3.8 C F 102 OSSIPEE
1941 JAN 02 03 43 ----- x 43.80 71.30 ---- 74 --- - F 74 OSSIPEE
1941 JAN 04 11 10 ----- X 43.80 71.30 ---- 74 - - F 74 OSSIPEE
1941 JAN 18 23 25 ----- X 43.80 71.30 ---- 74 --- F 74 OSSIPEE
1941 JAN 21 02 28 ----- X 43.80 71.30 ---- 74 3.6 G F 74 OSSIPEE
1941 JAN 23 00 15 ----- x 43.80 71.30 ---- 74 2.9 C F 74 OSSIPEE
1941 FEB 12 22 24 ----- X 43.80 71.30 ---- 74" --- - F 74 OSSIPEE
1943 MAR 14 14 02 ----- 43.70 71.60 ---- 102 3.9 G - MEREDITH
1944 MAR 06 05 46 43.20 71.60 ---- 6 -- - 2 102 CONCORD
1944 MAR 06 12 15 43.20 71.60 ---- 6 --- 2 102 CONCORD
.f 1944 APR 11 20 25 44.00 71.70 ---- 6 --- 3 102 WOODSTOCK ,
1945 MAR 22 08 04 4---- 43.20 71.60 ---- 7 --- 3 102 CONCORD
1949 SEP 02 05 48 4---- 43.80 71.30 ---- 10 --- 3 102 S. TAHKWORTH
1950 FEB 24 13 04 4---- 43.00 71.80 ---- 102 --- 3 102 SW. OF CONCORD
1952 OCT 26 09 05 - 43.60 71.20 ---- 10 --- 2 102 WOLFEBORO
1953 MAY 11 06 13 44.00 71.10 .... 102 -'- - 4 102 CONWAY
* 1954 OCT 07 -- -- ----- 42.70 71.30 ---- 102 -" 3 102 PELHAM.
1958 NOV 21 23 30 ---- 44.00 71.70 -.. 102 --- 4 102 WOODSTOCK
1962 DEC 29 06 19 42.80 71.70 ---- 79 --- 5 79 NASHUA <1 p
1963 DEC 04 21 32 34.80 43.60 71.60 8.6 32D 3.6 G 5 106 LACONIA
1964 APR 01 11 21 4---- 43.60 71.50 ---- 79 2.4 C 4 107 LACONIA ., ._
1964 JUN 26 11 04 49.00 43.41 71.68 1.0 32D 3.2 0 6 107 N. of CONCORD %
" 1965 JAN 03 17 05 02.50 43.52 71.78 ---- 32 3.0 G 4 108 LACONIA
1966 APR 28 12 02 44.10 71.90 ---- 109 --- 4 109 BENTON or
1966 OCT 23 23 05 4---- 43.00 71.40 ... 109 3.1 G 5 109 MANCHESTER r
1%7 JAN 26 04 10 4---- 44.60 70.90 ---- 122 2.1 C - . N. OF BERLIN
1969 AUG 06 16 02 4---- 43.80 71.40 ---- 124 2.6 C F 124 OSSIPEE
1976 JUN 12 21 00 59.00 44.24 71.61 ---- 13 2.4 H - - FRANCONIA
1976 JUN 14 05 31 49.80 44.29 71.69 ---- 13 2.0 H - FRANCONIA
C7 . -_
S-.... .....-.-- .. :* ...

Cv --v- - r r - . .~ .rr ~ X i~. ~ r~r ~ ~ .> &'.. -.--. ,-*-,.
DATE ORIGIN TIME (GMT) EPICENTER DEPTH MAGNITUDE INTENSITY
YEAR MONTF DAY HR. MIN. SEC. N. LAT. W. LONG. (KM.) REF VAL. TYPE (MM) REF. LOCALITY
1976 NOV 15 15 20 32.50 43.56 71.62 ---- 15 1.5 H - LACONIA1976 NOV 22 22 49 38.00 43.54 71.60* ---- 15 1.8 H - LACONIA
1977 DEC 25 15 35 54.00 43.19 71.66 12.3 19D 3.2 H 5 145 HOPKINTON
1978 JAN 18 00 28 57.30 42.98 72.15 ---- 20 1.9 H - - E. OF KEENE
1978 MAR 20 08 16 54.10 43.09 71.52 20 2.4 H - - NW. OF MANCHESTER
1978 MAR 31 14 27 57.00 43.10 71.63 ---- 20 2.7 H - - DUNBARTON .
978 JLN 21 18 31 10.00 43.66 71.38 ---- 21 1.8 H - - WINNIPESAUKEE
1978 AUG 17 21 41 08.10 43.52 71.56* ---- 22 1.9 H - WINNISOUAM LAKE -
1978 AUG 25 20 01 30.50 42.87 70.83 ---- 22 2.3 H 2 22 SEABROOK1979 JAN 01 04 13 47.40 43.52 71.63 ---- 24 1.9 H - - SE. OF BRISTOL
1979 APR 23 00 05 45.70 43.04 71.24 ---- 25 3.1 H 3-4 25 CANDIA
1979 JUL 09 05 42 32.20 43.39 71.45* ---- 26 2.4 H - - S. OF LACONIA
1980 APR 01 04 48 36.40 43.84 71.40 ---- 113 2.0 I - - NE. OF SQUAM LAKE
1980 APR 07 09 36 00.40 43.13 72.22 ---- 113 2.8 I - - W. OF HIGHLAND LAKE1980 MAY 21 19 22 17.90 43.01 72.40 ---- 113 1.8 I - - NW. OF KEANE
1980 NOV 05 22 40 01.40 43.66 71.36 ---- 137 2.7 I - - N. LAKE WINNIPESAUKEE1981 FEB 09 03 14 10.42 43.22 71.58 4.4 NEB 1.9 H - - NW OF CONCORD
1.7 I
1981 JUN 28 22 42 35.10 43.57 71.55 OR NEB 3.1 H F NEB W OF LACONIA
3.0 I1981 SEP 04 06 59 54.70 43.33 71.69 10.0 NEB 1.9 H - NW OF CONCORD ,
1.9 11981 OCT 28 00 27 29.63 44.174 71.446 5.00 NEB 2.3 H WHITE MOUNTAINS
2.0 I
1982 JAN 19 00 14 42.67 43.508 71.619 7.41 NEB 4.7 I 6 G5 W OF LACONIA
1982 JAN 27 16 43 14.47 43.535 71.612 8.82 NEB 2.9 H 5 CS W OF LACONIA
2.7 1 b1982 FEB 15 20 13 46.48 43.091 71.493 2.48 NED 2.1 H - - SE OF CONCORD
1.9 I1- .-
1982 FEB 26 22 04 46.98 43.093 71.496 8.51 NEB 1.9 H - - S OF CONCORD1.7 1
1982 MAR 05 02 15 30.27 43.281 71.619 5.00 NEB 1.7 H - - NEAR CONCORD
1.5 1
1982 MAR 10 18 40 07.72 43.779 71.438 14.20 NEB 1.0 H - - W OF OSSIPEE
1.6 11982 AUG 04 21 33 10.11 42.989 71.581 5.00 NEB 2.1 - NW OF MANCHESTER1.8oI
1982 AUG 09 15 05 03.35 43.564 71.999 1.1 NED 2.4 H - N OF NEW LONDON
1.9 1
1982 AUG 12 16 59 43.15 43.535 71.932 13.28 NEB 2.6 H - - OF DANBURY
2.4 1I FDABR
1982 AUG 30 01 47 25.40 43.467 71.624 14.54 NEB 2.0 I - - Sw OF LACONIA
1982 SEP 11 05 28 02.67 43.475 71.534 9.82 NEB 1.9 H - - W OF LACONIA
1.6 I
1982 SEP 14 22 33 03.56 44.325 71.902 1.43 NEB 2.4 H - - NW OF FRANCONIA
2.3 I 111982 SEP 14 23 37 07.15 44.401 71.939 9.69 NED 2.1 - NW OF FRANCONIA .°- .
1982 SEP 21 21 37 41.20 44.365 71.802 11.34 NED 1.9 1 - SW OF LANCASTER
- C7)4-e.. d1
.. o.
.- -C7-.. "..-.. -
%.°4. -. . .-.- o .
.- -. :..-:. . . . . . -a.--
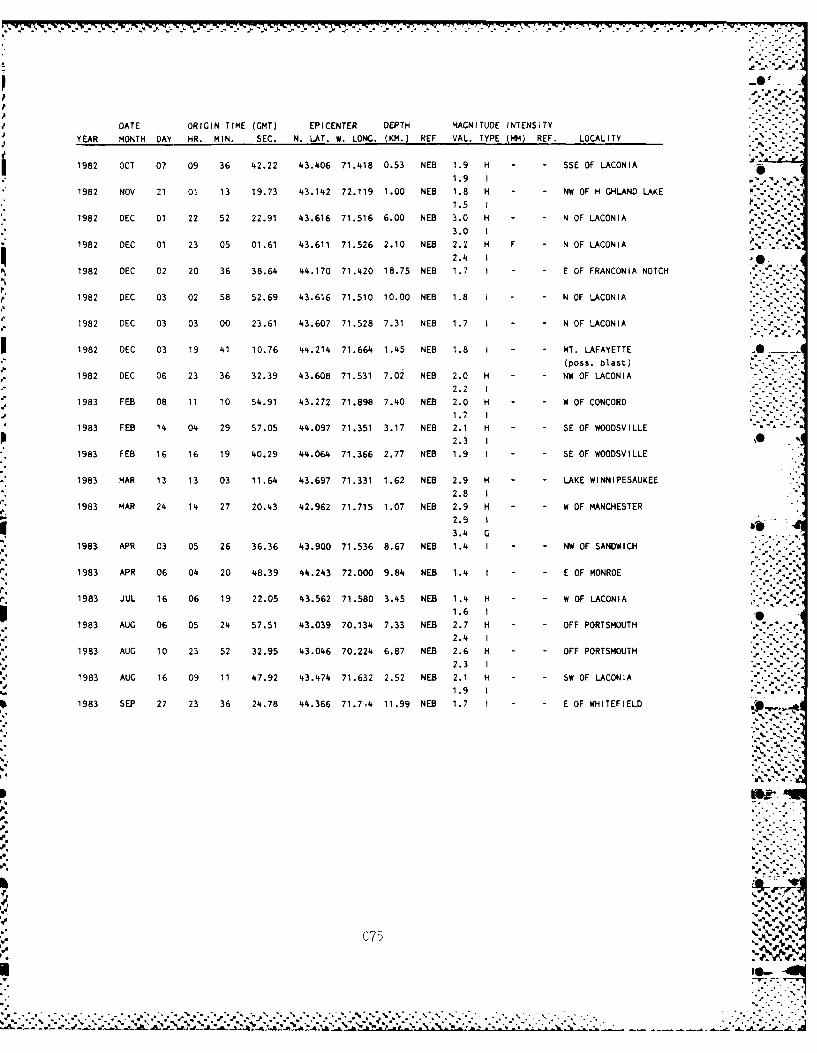
p 0,p"= .
DATE ORIGIN TIME (GMT) EPICENTER DEPTH MAGNITUDE INTENSITYYEAR MONTH DAY HR. MIN. SEC. N. LAT. W. LONG. (KM.) REF VAL. TYPE (MM) REF. LOCALITY
1982 OCT 07 09 36 42.22 43.406 71.418 0.53 NEB 1.9 H - - SSE OF LACONIA
1982 NOV 21 01 13 19.73 43.142 72.119 1.00 NEB 1.8 H - - NW OF HIGHLAND LAKE1.5 1 ''"
1982 DEC 01 22 52 22.91 43.616 71.S16 6.00 NEB 3.0 H N OF LACONIA .
3.0 I.;''e'-"
1982 DEC 01 23 05 01.61 43.611 71.526 2.10 NEB 2.2 H F - N OF LACONIA2.4 10 .
1982 DEC 02 20 36 38.64 44.170 71.420 18.75 NEB 1.7 I - - E OF FRANCONIA NOTCH
1982 DEC 03 02 58 52.69 43.616 71.510 10.00 NEB 1.8 1 - - N OF LACONIA
1982 DEC 03 03 00 23.61 43.607 71.528 7.31 NEB 1.7 I - - N OF LACONIA
1982 DEC 03 19 41 10.76 44.214 71.664 1.45 NEB 1.8 I - - MT. LAFAYETTE .
(poss. blast)1982 DEC 06 23 36 32.39 43.608 71.531 7.02 NEB 2.0 H - - NW OF LACONIA
2.2 11983 FEB 08 11 10 54.91 43.272 71.898 7.40 NEB 2.0 H - - W OF CONCORD
1.7 I1983 FEB 14 04 29 57.05 44.097 71.351 3.17 NEB 2.1 H - - SE OF WOODSVILLE
2.3 11983 FEB 16 16 19 40.29 44.064 71.366 2.77 NEB 1.9 I - - SE OF WOODSVILLE
1983 MAR 13 13 03 11.64 43.697 71.331 1.62 NEB 2.9 H LAKE WINNIPESAUKEE
2.8 I1983 MAR 24 14 27 20.43 42.962 71.715 1.07 NEB 2.9 H W OF MANCHESTER
-2.9 13.4 C
1983 APR 03 05 26 36.36 43.900 71.536 8.67 NEB 1.4 - NW OF SANDWICH .-. .
1983 APR 06 04 20 48.39 44.243 72.000 9.84 NEB 1.4 I - E OF MONROE
1983 JUL 16 06 19 22.05 43.562 71.580 3.45 NEB 1.4 H - W OF LACONIA . '
1.6 I
1983 AUG 06 05 24 57.51 43.039 70.134 7.33 NEB 2.7 H OFF PORTSMOUTH2.4 I
1983 AUG 10 23 52 32.95 43.046 70.224 6.87 NEB 2.6 H OFF PORTSMOUTH2.3 I
1983 AUG 16 09 11 47.92 43.474 71.632 2.52 NEB 2.1 H SW OF LACONIA1.9 i
1983 SEP 27 23 36 24.78 44.366 71.7',4 11.99 NEB 1.7 1 E OF WHITEFIELD
I', , % 4 ".F '
% -
4..:. .
p...
,'(, , . % .
" .I- . - . • . . , , . . - ., , , . - . ., -. -j - . . - . . - . -. -., -. - , , . . . , , - . . . . . . , . . .- .-j, .' . ' " .:. - -'-> '-'., - ..-", .,J --' : : -:. :.: . . ."" " ". -".' -.'. ' .. __ . ... ... . ... '.L ' '--- L '. '-,

-. .-
S.4
L. ~
S
I.
he
S
I..1*
4'
S_.4
p S
APPENDIX D: SELECTED ACCELEROGRAI4.S, RELATIVE VELOCITY RESPONSESPECTRA, AND QUADRIPARTITE RESPONSE SPECTRA
(from California Institute of Technology, 1971-1975;USGS, 1983; and US Department of Conservation,
Bureau of Mines and Geology, 198~4)
I
.5..
p
if
. . . ..- -
S.
1. 1
~pp
S.'
9
~
''~ I]-~ C ttS Ct CACS .x.t S. , ................................................................................................................................................. .- '5~~

a- I - )
CF a-
I CD m
aDC: x
In *L 1 F.FCF*.*
L-*-'ndC, .r
-JQMu~j
ED C
>n (NJ
CFD
ULJU-)
CCD U)
rr'ED
U-) C1L
(-(N r~i
-' -- (-NJLflD
* D2
%0~

% A6 .~..
LU. - p.'>.
cr-
(JD0l cc..-
4 (n)..J An.-
a-o'
>LLLO. o
LL.J 0I )zL) ."* >UJ U-
>- Lu
-j"
z n
C) > n(
-r cc/N -~ z1JlA~I~~
C33
U")-
LO .0 ..
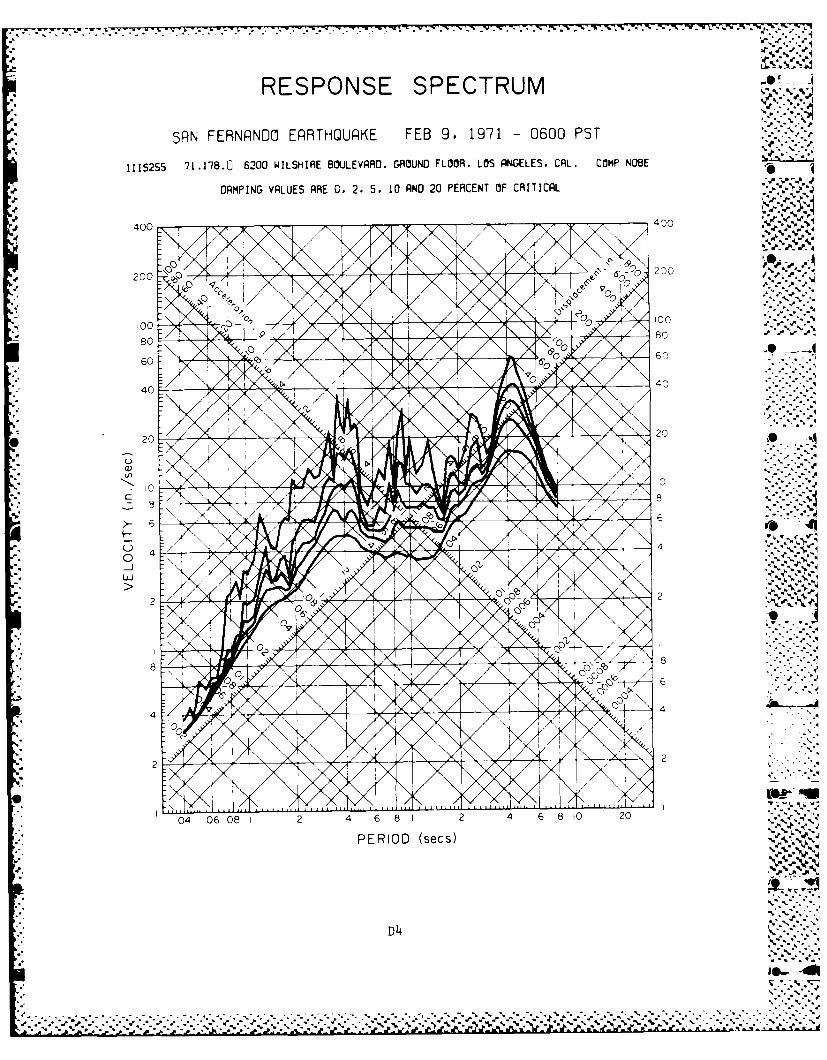
RESPONSE SPECTRUM
SAN FERNANDO EARTHQUAK~E FEB 9. 1971 - 0600 PST
II152SS 71.178.6 6200 WILSHIRE BOULEVARD. GROUND FLOOR. LOS ANGELES. CAL. COMP NOBE.* .
DAMPING VALUES ARE 0. 2. 5. 10 AND 20 PERCENT OF CRITICAL
400 400
00
60 6/D 80
A - -60~( 71 6 6
40. ( 40-
20 20
-J8 ~
Ir~
4*,~-0V
2 2
44
2 2
04 06 08'1 2 .4 68 1 2 4 68 10 20
PERIOD (secs)
D14

%
z~ u
EDC 0
CDJ Ln~
LU . .
D .Z
C-LI)
-J-C)-) LL
UujC a
*m z CDLLJ =
-L S7~L
C--
CD U
CDC
C*NJ M . % %
CD D5
C7.'.

-. L V,_ -. ,
1 .~j
z r -
ZU
z-
CL z
LL/ u- - -
>- U. C
cc C aco-I-Jz
w cc
z-~ -
_j U- C.F
9z~
0cc
0,00
0j 0C 0 0
44 - :3S/NI AIkIJ913A 3AIltfl3W
4% D6

%'
RESPONSE SPECTRUM
SAN FERNANDO EARTHQUAKE FEB 9, 1971 - 0600 PST
IIIS25S 71.178.0 6200 WILSHIRE BOULEVARD. GROUND FLOOR, LOS ANGELES. CAL. COMP N82W
DAMPING VALUES ARE 0. 2. 5, 10 AND 20 PERCENT OF CRITICAL
40041
80\' I
60
___600
20 (b %
0
'2 2
44
22
0j4 06 -J 2 4 68 2 4 £ 8: C 2. ..
PERIOD (secs)
D7 N

I ?F-, - F W. R-I
-1 Q6'
C4 ~
cc~ %
-Jo
'non
0 2..
o0
-'~~ a) z
a. Li
~zo,J -c -
c- J
.I (D
LA.4M ZI-
02In
0 0
-~% %
ZOS0SY4)(3 m)(o
N-I8330 AiIO 13 iNMO-d
00D8

a.MORGAN HILL EARTHQUAKE APRIL 24, 1984 13 15 PST
COYOTE LAKE DAM (SAN MARTIN)
CHN 3- 195 DEG
ACCELEROGRAM BANOPASS-FILTERED WITH RAMPS AT .05-07 TO 23.0-25.0 HZ.57217-S2494-841 16.01 061484. 1641-QM84A217
- RESPONSE SPECTRA- PSV, PSA & SDO FOURIER AMPLITUDE SPECTRUM.F
DAMPING VALUES- 0.,5, 10, 207. .
FREQUENCY (HZ) 10
-10 1 10
PSA (G) SD (IN)
* 100
10 1000.
SO (CM
Li.
z~ 10
100
10 101
0--
D9
JL- A

cr..
~..0
CL ;- 0
o w
-7
-- ~C P= -
c
L.4,
Qa)
w cu
oCL.
a-) .lo.-

-. t - -- -. - - - - -. - - - . . . . . .- . -- .
10000.00 1~*
IX4000. 00 -J
t~~~I 00.0 /
10000
2- '00.00
CL
J~~. A. X. X11
Al \.'-
10.00
4.00
2.0.0L4 0.1 0.2 0.'4 1 2 '4 10 2C
UNDP.MPEO NATURPL PERIO0-sEC'ON:7
Pseudo-velocity response curves (0, 2, 5, 10, 20 percentcritical dampi ng) computed for earthquake of 2 May 1983 (2342 UTC)as recorded on 1350 horizontal component at P)leasant Valley pumpinqplant (switchyard). ',Band pass 'iltered 0.1 to 50 Hz, Butterworthorder 8 lowcut, cosine taper 50 Hz highcut, U.S. National Strong-Motion Data Center) .
D11~~

rwrrrW~rr'r~r w r r r ..- r rr~.. ...
I.,.A
Si
- _____________________ 4...
Ip -p
p,-.
~. ..
'J..
.5...5-
5-a-
I~.J.
~
'-'5
i.5-s
'5.-
a--
.- .5...5..
a-L


AD-A173 239 GEOLOGICAL-SEISMOLOGICAL EVALUATION OF EARTHQUAKEHAZARDS AT FRANKLIN FAL (U) ARMY ENGINEER NATERWAYSEXPERIMENT STATION VICKSBURG MS GEOTE
UNCLASSIFIED E L KRINITZSKV ET AL SEP 86 F/G 8/l NLI'll

11111 50
MICROCOPY RESOLUTION TEST CHART S
NATIONAL BUREAU OF STANDARDS- 1963-A

IJ
7 'PLEMENTARY9
FI
b* I
S. S
-.. 4~)
* . . p* . . - 5-
* -5-- -~
* I.
. S
* - - *
... . ~.*..> k. *~ - a' ~. F' ~-
)
- ... 'a'-.
* . *.A*-* * I
. . *-* I,,* **
- .. - .
- . . . .. .
S -
7 * * . . a
-'a *
- I
d
IU'>INFGRMATIOtW 7
.1
.5 I..4.. ______________________ _____________ ___________ _________
-. * w

DEPARTMENT OF THE ARMYWATERWAYS EXPERIMENT STATION. CORPS OF ENGINEERS
P.O. BOX 631VICKSBURG, MISSISSIPPI 39180-0631
REPLY TO
ATTENTION OF
WESGR-GR 19 December 1986eq
Errata Sheet
No. I
GEOLOGICAL-SEISMOLOGICAL EVALUATION OF EARTHQUAKE HAZARDS
AT FRANKLIN FALLS DAMSITE, NEW HAMPSHIRE
Technical Report- GL-86-16
September 1986
1. DD Form 1473, Block 19, Abstract, Line 6: Change
velocity 25 cm/sec, to velocity 35 cm/sec,
2. Page 39, paragraph 78: Change second reading in third column oftabulation to
35
3. Page 44, paragraph 91: Change second reading in third column of
tabulation to
35
HYDRAULICS GEOTECHNICAL STRUCTURES ENVIRONMENTAL COASTAL ENGINEERINGLABORATORY LABORATORY LABORATORY LABORATORY RESEARCH CENTER

r7
T/