geological survey of india - · pdf filethat is mineral exploration mapping, ... the data...
TRANSCRIPT
Geological Survey of India
1 RSAS
MISSION - IB HYPER SPECTRAL MAPPING DIVISION
REMOTE SENSING AND AIRBORNE SURVEY BANGALORE
DRAFT DOCUMENT ON HYPER SPECTRAL MAPPING (Version – 1)
The spectroscopy is the study of light as a function of wavelength that has been emitted, reflected or scattered from a solid, liquid or gas. The spectrometers presently are being used in the laboratory, in the field, in aircraft and on satellites. Imaging spectroscopy is a technique for obtaining spectrum in each position of a large array of spatial position so that any one spectral wavelength can be used to make a recognizable image. Every object has a distinctive signature embedded in the spectra of light emitted or reflected by it. This spectral characteristic of the object is determined by the electronic and vibrational energy states of the constituents. These spectral characteristics are of a very unique 'spectral signatures'. Hyper spectral images collected within narrow and continuous spectral channel can detect the spectral signatures characteristic to mineral and therefore help immensely in lithological mapping based on mineralogy. Presently, many countries are using this technique in geoscientific studies to detect mineralogical compositions of rocks of earth surfaces and also for rocks and minerals in other planets of the universe. Apart from targeting mineral zones, this technique is using for multi-facet usage. That is mineral exploration mapping, coastal ocean, estuary, river, and lake analysis, modeling of atmospheric and cloud properties, forest classification mapping, agriculture and urban development. Hyperspectral remote sensing combines imaging and spectroscopy which often includes large data sets and require new processing methods. Hyperspectral data contains hundreds to thousands of bands, relatively narrow bandwidth or spectral resolution (5-10 nm), and contiguous bands usually by one sensor. Actual detection of materials is dependent on the spectral coverage, spectral resolution and signal to noise ratio of the spectrometer, the abundance of the material and the strength of absorption feature for that material in the wavelength region measured. Hyperspectral imagery is typically collected as a data cube with spatial information collected in the X-Y plane and spectral information represented in the Z direction. Therefore, this technology can be applied to mineral exploration, geological mapping and environmental monitoring. Geological mapping includes primary rock type, signatures of alterations in mineralized zones etc. LITHOLOGIC MAPPING: The key elements in planning a mineral exploration program prior to undertaking intensive field exploration activities are: Obtain preliminary

Geological Survey of India
2 RSAS
details of a geographic area through lithological mapping. Identifying the potential targets with particular mineral. Lithology and structural history of a areas.
Minerals that can be successfully identified with hyperspectral images are: OH-bearing minerals, carbonates, sulfates, olivines, pyroxenes, iron oxides and hydroxides. The identification of these minerals provides a framework for exploration of precious and base metals, diamonds, etc.
GSI has taken two pilot projects in collaboration with Space Application Center and National Remote Sensing (ISRO) in Gujarat and Karnataka during FSP: 2009-10 as a use of hyper spectral Remote Sensing data for search of Mineral provinces. This program includes collection of data using spectro-radiometer identifying spectral signatures and preparation of spectral library. FUTURE STRATEGIC PLANS FOR CREATING INFRASTRUCTURE IN ZONAL LEVELS OF ALL REGIONS: GSI has already initiated the development of infrastructure at the regional levels and it has planning to procure the High-end computer systems dedicated for using Hyper spectral image processing, Advanced Hyper spectral image processing software (GIS/ENVI latest version) and field radio-spectrometers for collecting field data. TRAINING OF PERSONNEL: Recently a training course on 'Hyper spectral Remote Sensing in Geo-science Application' (19th - 23rd April 2010) has been taken place at NRSC (ISRO) center, Hyderabad. 14 officers of GSI were participated in the training course are of the opinion that infrastructure should be created at the earliest in zonal level to take up the hyper spectral mapping programs in future. The department is planning to give training course in collaboration with ISRO on hyper spectral mapping for more personnel in batches to strengthen the hyper spectral mapping teams in all the regional levels. After achieving this in face-wise more areas can be selected on priority basis of mineral belts/state wise. DATA COLLECTION: I) Space borne Hyperion- 1 from USA. Hyperion is a hyper spectral instrument on the earth -observing (EQ-1) spacecraft that was launched by NASA, USA. Hyperion is a push-broom, imaging spectrometer. Each ground image contains data for 7.65 km wide by 185 km long track. Each pixel covers an area of 30 x 30 m on the ground, and a complete spectrum covering 400-2500 nm collected for each pixel. The total numbers of bands are 242 but the spectral bands are 220. II) Airborne visible/infrared imaging spectra (AVARIS) from USA. It is a unique optical sensor that delivers calibrated images of the upwelling spectral radiance in 224 contiguous spectral channels (bands) with wavelength from 400-2500 nm. AVIRIS is used for measuring and monitoring the constituents of earth's surface and atmosphere based on molecular absorption and particles scattering signatures. This data mainly used for understanding process related to global environment and climate changes.

Geological Survey of India
3 RSAS
III) HyMap, an advanced hyper spectral sensor developed by integrated spectronics, Sydney Australia. Imaging spectrometer or hyper spectral sensors provide a unique combination of both spatially contiguous spectra and spectrally contiguous images of the earth surface unavailable from other sources. This sensor covers the 0.45 - 2.5 mm range over a 512-pixel swath provides 126 spectral bands. The bands having 3-10m spatial resolution and signal-to-noise ratio is 500-1000 or better. At present no Indian hyper spectral sensor exits, thus the hyper spectral data has to be procured from Hyperion (EQ-1) and AVIRIS from USA or HyMap from Australia. The data available freely at the movement is very very limited. If we put requisition for particular area it takes long period for the data acquisition, as the temporal resolution of satellite is 200 days. If the data has not made available in the first visit then requisition has made again and again. This uncertainness remains till the data made available for the indenter. IV) Advanced space borne thermal emission and reflection radiometer (ASTER) is an imagery instrument flying on terra, satellite launched by NASA in 1999. ASTER is being used to obtain detailed maps of land surface, temperature, reflectance and elevation. ASTER imagery captures high special resolution data in 14 bands, from the visible to the thermal infrared wavelength, and provides stereo-viewing capability for digital elevation model creation. This data is readily available but the bands will not give many details to mineral target areas. IIV) Landsat Thematic +ETM data (USGS and NASA). This data offers satellite images at a resolution of 15-30 m, available for entire globe. Landsat 7 uses enhanced Thematic Mapper plus panchromatic band with 15 m resolution and a thermal band. Products developed from this data include maps showing areas dominated by clay, lithological, structural and thermal enhancements with stereo images and prospective views. All TM bands are quantized by as 8 bit data THE HYPER SPECTRAL DATA COLLECTION: SELECTION OF TIME AND DAY: The timing of the field data collection is very important to calibrate or interpret a hyperspectral image. The hyperspectral image should be collected under illumination conditions similar to those when the image was acquired. Time of day and date are the major controlling factors of direct illumination geometry, while atmosphere conditions relating to scattering and clouds are the major factors controlling the geometry and relative intensity of direct illumination. If field spectra are to be used to convert a hyperspectral sensor image to reflectance, spectra should be acquired simultaneously with image acquisition. The best time for sensor image/hyper spectral data collection is 10am to 2pm. The spectral measurements made on various types of land and cover features. The measurements made in the field using sun light as source shows large amount of noise in the spectral intervals. This is due to the fact the incident sun’s radiation is almost completely absorbed by the water vapors present in the atmosphere.
Geological Survey of India
4 RSAS
SAMPLING STRATEGY: The selection of a particular sampling strategy should be based upon the objectives of the study. If the objective is to determine the detectability of either a target material or of a process effecting the spectral signature of a target material, the sampling strategy must encompass the target material under all expected conditions as well as all other background material Consideration must be given to all the processes modifying target and background spectral signatures; these includes illumination, slope and aspect, and target surface architecture. Adequate vegetation is even more problematic due to the wide range of processes that effect their spectral signature. These include soil chemical properties, soil reflectance, water availability, and time of day, time of year, cloud cover, temperature and relative humidity. If the purpose of a study is to understand how processes affect the spectral signature of a target without consideration of how background materials and other sources of variability effects the spectral signature, variance from source other than the one f interest should be minimized in the selected targets. This is achieved by carefully controlling viewing and illumination geometry, often in a laboratory. This type of study id often performed as a feasibility study prior to a full study evolving collection of spectra of background material. THE COMPARISON OF TRADITIONAL MULTI-SPECTRAL DATA AND HYPER SPECTRAL DATA: i.High spectral resolution and many bands. The increase in the number of bands and the consequent decrease I the spectra; band width mean that it is possible to obtain the diagnostic features of the object more precisely in terms of the presence of the absorption emission peaks of the object and their relative strengths can be used to qualify the fraction of the presence within the image area. ii.High correlation between most of the bands for given set of object. There is a correlation exists between the adjacent spectral bands. This effectively increases the volume of data to be processed without providing additional information. The large number of spectral bands lead to the curse of dimensionality when statistical image analysis techniques are to be used. This implies different approach has to used for the analysis of hyper spectral data. One approach is based on the spectral library and the other using suitable dimensionality reduction technique based on object based methods. Both these methods to be designed as multilevel feature selection in hierarchical approach. In the first approach the first level is the identification of dominant absorption/emission/reflected peak location/s and their comparison with library spectral peaks. This will reduce the number of object spectra to be compared in the next level. At this stage either spectral angle mapper technique or sub pixel fraction estimation technique based on least square principle can be used. In the second approach, the K-L transform technique can be used in different spectral regions by dividing the spectra into number of segments and selection 2-3 dominant

Geological Survey of India
5 RSAS
features. These bands carry almost all the information present in those spectra bands for the object of interest, while avoiding the curse of dimensionality. PROCESSING AND INTERPRETATION OF HYPER SPATIAL DATA: The data processing mainly involves following steps in GIS/ENVI software. I) The Hyperion data converting Hyperion level 1B data to radiance. II) Pre-processing of data for atmospheric corrections - need FLAASH module in ENVI software. III) Performing mapping using SAN etc technique - need spectro radiometer to collect spectra of rocks/minerals. IV) Comparing results with field truth/maps. FIELD INPUT AND GENERATION OF SPECTRAL DATA: The field evaluation includes the following steps: I) Collection of published geological maps/reports. II) Synthesis and analysis of satellite imagery and digital aerial photos. III) Reconnaissance of field traverses. IV) Collection of ground spectral signatures using field spectro-radiometer. Using the same field samples in laboratory Spectral signatures has to generate for spectral library. FIELD DATA COLLECTION AND COMPARISON: After identifying one or two suitable areas one has to make efforts to acquire the remote sensing data of Hyperion/Landsat +ETM and ASTER data. After acquiring the data the targeted areas has to be planned on the data sets to plan to evaluate the ground truth. The spectral signatures have to be collected in the targeted field area using field radio spectrometers. The bedrock samples of the same should be collected to create spectral signatures under ideal laboratory condition. ANALYSIS AND INTEGRATION OF SPECTRAL LIBRARY:. Analysis of data through image processing spectral matching, enhancement, filtering density slicing etc has to be carried out. During this stage the spectral signatures created in laboratory may be compared with airborne, satellite and field signatures of the same rock/mineral. These spectral signatures can be compared with USGS and other standard spectral signature libraries available freely. After careful study and comparison the spectral signatures may be stored in separate spectral library. During this stage NRSC/SAC’s help may be sought for finalizing the signatures rocks/minerals of the respective zones. INTERPRETED HYPER SPECTRAL DATA FOR GENERATION OF OUTPUT THEMATIC MAPS - HARD COPY AND SOFT COPY: GROUND TRUTH SUPPORTING ANALYSIS: I) Bed rock samples for specific element/metal signature: XRF analysis. II) Samples for Petrological studies. III) Samples for EPMA study.
Geological Survey of India
6 RSAS
IV) Samples for XRD study. 10. All the developments takes place in the zonal level includes the formulation of FSP proposals, collaboration details, data acquisition, analytical results, spectral signature etc should be communicated in time to time to Dy. DG (GP). GSI, Bangalore. COMPARISON OF ASTER AND HYPERION DATA: Multiple information can be gained from modern sensors like ASTER and Hyperion. Regarding the data quality, the Hyperion result suffered from the partly severe radiometric errors, although both classifications differentiated generally the similar areas. Thus, for this study, only through discarding most of the affected bands, which also included valuable information that had to be omitted, satisfying mapping results were possible. To achieve more detailed classification results or material identification, an adequate radiometric correction of the Hyperion data is therefore essential. On the other hand, no further data quality issues were experienced with the ASTER data after the crosstalk correction was applied. Though, an identification of surface types seems to be difficult, the spectral analysis of the ASTER data, plus the possibility to extract elevation data of relative high resolution from the ASTER data was very valuable for the investigations. In conclusion, the costs and data availability issues beside the quality, the results provided by ASTER data were more valuable for this study compared to the Hyperion data. However, there are a few things to note when using ASTER imagery for regional mineralogical mapping. 1.Cloud cover, vegetation and atmospheric effects can severely mask. 2.Bands and band ratios do not indicate the occurrence of a minerals with absolute certainty so ground truth is essential. 3. Every terrain is different, so ratios which work in some areas for a particular mineral or assemblage may not show the same thing elsewhere. As a result of these factors, it is important not to look at ASTER images in isolation from other data. If possible, datasets such as geology and structural maps, geochemistry, PIMA analyses (ground truth), radiometric, and any other available data should be used in conjunction with ASTER for best results. DATA PROCESS IN ENVI: The methodology using correction of data to apparent reflectance are: the use of a linear transformation to minimize noise and determine data dimensionality, location of the most spectrally pure pixels, extraction and automated identification of end member spectra, and spatial mapping and abundance estimation for specific image end members summarizes under following approach. Spatial/Spectral Browsing, Spectral Data Reduction, Spatial Data Reduction, Visualization and End member Selection, Identification and Mapping. Standardized Processing methods for hyperspectral data analysis: The basic concept is to reduce the data to manageable levels by finding those pixels in the image that can explain every other pixel in terms of a mixing model. The apparent reflectance correction serves to put the data into the same coordinate space as most
Geological Survey of India
7 RSAS
spectral libraries for comparison by spatial/spectral browsing. The MNF transform reduces the spectral dimensionality of the data by finding linear combinations of bands that explain the inherent dimensionality of the data. The PPI and n-D Visualizer reduce the spatial dimensionality by finding key endmembers. Once endmember spectra have been extracted using these methods, then automated identification procedures are used to match against a spectral library. These identified image endmembers are then used to extend the analysis back to the full spatial/spectral dataset to produce image maps showing the location and abundance of specific materials. METHODOLOGY FOR PREPARATION OF HYPERSPECTRAL SIGNATURE CURVES: To achieve the preparation of hyperspectral signature curves, the following approaches and methods will be adopted in the present research work.
1. Collection of base line information and secondary data, maps and preparation of base/location maps for the rock types and mineral resources of the study region and study the existed literatures on the hyperspectral remote sensing spectral signatures.
2. Study the rock types and mineral resources using high-resolution satellite data
and preparation of different resources thematic maps.
3. Interpretation of reflectance and absorption curves in spectral signature characteristics of rock types, mineral resources in hyperspectral region and understanding their physical, optical and chemical characters.
4. Measurement of spectral signatures from field and laboratory using Ground Truth
Spectroradiometer and GPS based georeferenced mineral and rock sample collection.
5. Study the field sites, physical, optical and chemical characters of samples using
sophisticated analytical instruments and correlating their hyperspectral signature. 6. Study of physical and mathematical models, faster processing algorithms,
improve the spectral matching techniques, autonomous intelligent processing, atmospheric effects and correction, sub-pixel unmixing retrieval techniques, identification of the end member spectra etc.
7. Categorizing the spectral curves of different rock types and mineral resources and
maintaining data as in the library system. PROJECT SUMMARY: Mineral resources of the Earth’s land surface can be readily interpreted using satellite imagery. Concerns over the widespread anthropogenic impacts on exploration have led to the development of earth observing satellite system capable of providing primary data sets for monitoring human impacts on mineral system process. The recent advent of both
Geological Survey of India
8 RSAS
space borne and airborne hyperspectral satellite data and its applications has opened a new vista in the identification, systematic scientific surveying and mapping of mineral resources, materials and man made features, in which spectral signature characterization is playing a vital role with the phenomenon of spectra and its underlying principles. Atoms and molecules of minerals are constantly communicating with us and sending us messages. They sign their names with their spectral signature and decode the messages. The signature of a mineral is a characteristic, or combination of characteristics, by which a mineral or rock can be identified on an image or photograph. A good understanding of background and object spectral signatures and their dynamic behavior in realistic environment is essential to the exploitation of hyperspectral imagery for operational applications. To achieve this level of understanding, the spectral image analyst has to address atmospheric effects, autonomous intelligent processing, spectral signature database usage, sub-pixel mixing retrieval techniques, scene generation models, and other spectral techniques. The spectral signatures of target surfaces can be measured in the laboratory, field and from the collected sensor image itself. The spectral signature within a pixel of hyperspectral image consists of an average of reflectance of all materials within the pixel. Interpretation of hyperspectral remote sensing data to determine standard man-made and natural materials like vegetation, water, soil, mineral and rock types can be accomplished without much ground-truth or validation d0ata. For example, for a spatial resolution of 10 m, the spectral response for a truck rest stop will consist of a combination of a spectral of all man-made object types-asphalt, concrete, the soil, grass, etc, within the 10-m picture element pixel. The field data collections to develop the spectral library consist of obtaining spectrometer readings or object samples for as many of the categories/classes of man-made and natural material types as possible. Reflectance readings obtained in the field should be representative of those obtained by airborne or satellite remote hyperspectral image sensors. For instance, these truck rest stop categories could include grassy fields, parking lots, vehicles, trees and buildings. Samples of each category may be from various angles and heights. It is also valuable to collect actual material samples for laboratory analysis of reflectance to provide endpoints in the analysis. For minerals, leaf, soil, etc. the litter measurements can be carried out in a laboratory which involve the use of a power-stabilized known light source and calibration standard. The spectral signatures collected should be used to develop exemplar spectral, which capture the spectral content of the materials. A further consideration is that of sample stratification, i.e., whether to collect many readings in a single location or to collect few samples at many locations, depending on project goals or site conditions. However, ground-truth data should still be collected, if possible, to determine specific conditions about material types such as vegetative stress, age of the asphalt, or specific water quality criteria. In general, the following collections of types of ground-truth or validation data are recommended: atmospheric conditions, dark and light calibration targets, surface water, ground etc.

Geological Survey of India
9 RSAS
Mineral/Mineral Group Name
Signature details and cause of the signature
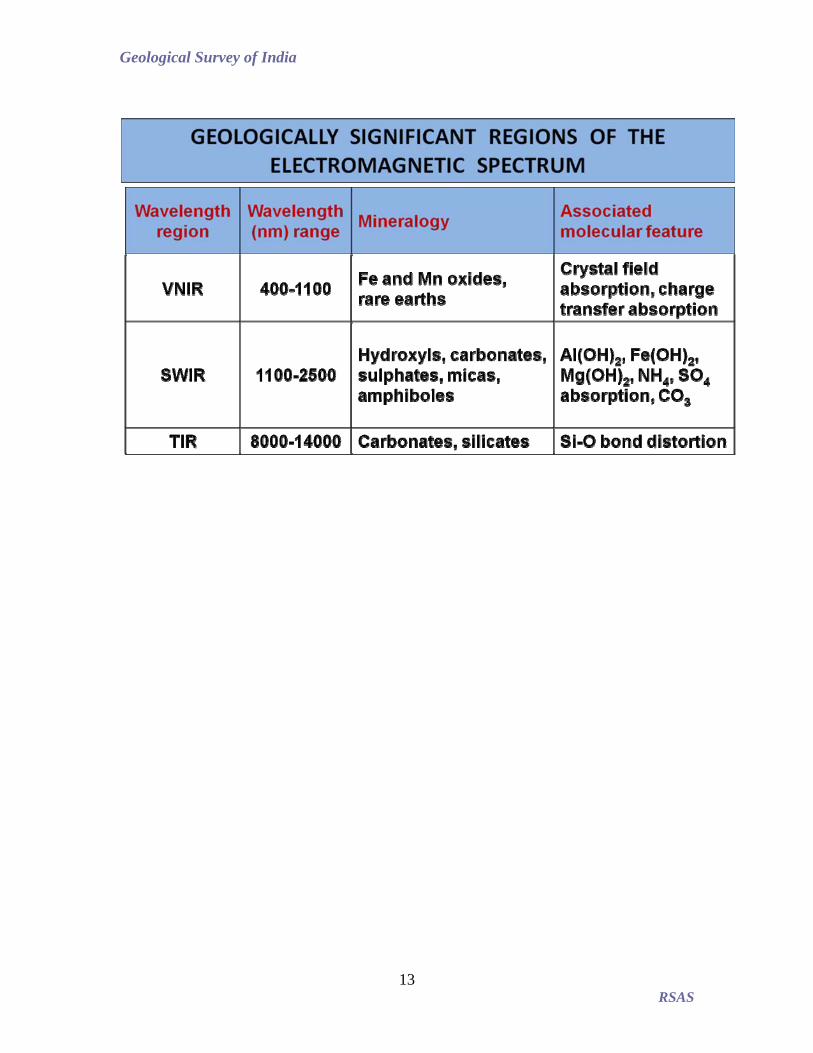
Limonite (Iron Oxide) Absorption due to Fe-O charge transfer effect (0.7 µm for ferric ion).
Quartz Absorption in Thermal –TR region (Si-O vibration absorption of tectosilicate in 10 µm.
Pyroxenes and Olivines Absorption in 0.7, 1,2 µm for absorption caused in ferrous and ferric ion for crystal field and charge transfer effect. Chain silicate has Si-) absorption in 11.5 µm.
Amphiboles Absorption signature due to Iron occur in the VNIR (0.4, 0.5 µm region and also in SWIR region (1,2 µm). absorption mainly due charge transfer effect.
Micas and Clay Absorption due to vibrational absorption of Hydroxyl ion in the SWIR region (1.4, 1.9 µm) and those due to vibration in AL-OH, Mg-OH molecules in clay in SWIR region (2.1-2.4 µm).
All Carbonates 1.9-2.35 µm, latter being more intense for combination overtone of Vibration of Co3 molecule.

Geological Survey of India
10 RSAS
SPECTRAL SIGNATURES OF ROCKS Broad Rock Type Rock
Category Signature details and cause of signature
Granite
A) Absorption bands in 1.4, 1.9, 2.2 µm corresponding to absorption bands in OH and H2O absorption. B) Absorption in 0.7 and 1 µm corresponding to absorption for crystal field effect/charge transfer in ferrous (Fe+2) and Fe+3
Mafic rocks
B) 0.7 µm and 1.0 µm for absorption bands for ferrous Fe+2 and Fe+3 ion occurs mineral like pyroxene, amphibole, Olive.
IGNEOUS
Ultra mafic rocks
A) Absorption band at 1.0 µm and 2 µm specially for Fe+2 as observed in rock like Dunite.
Sandstone A)Absorption for Ferrous and Ferric ions. Fe rich sandstone produce absorption in 0.87. Greywacke produce absorption due to fundamental /overtone vibration of clay minerals in 2.1-2.4 µm.
Shale A)Mostly due to vibrational overtone combination in OH and H2O and also due to vibrational absorption for AL-OH and Mg-OH in 2.1 µm and 2.4 µm respectively.
SEDEMENTARY
Limestone and Dolomite
A)Absorption in 1.9-2.35 µm, latter being more increase for combination overtone to the substitution of Mg2+by Fe2+.
Schist A)Absorption signature in 0.7, 1, 2 µm general due to ferrous and ferric ion and 2.1, 2.3, 2.4 for vibrational absorption for AL-OH, MG-OH bond in clay mineral.
METAMORPHIC
Marble A)1.9-2.35 µm, latter being more intense for combination overtone of vibration CO3 molecule.

Geological Survey of India
11 RSAS

Geological Survey of India
12 RSAS
modeled atmospheric transmittance, visible to near-infrared. Most of the absorptions are due to water. Oxygen occurs at 0.76 µm, carbon dioxide at 2.0 and 2.06 µm. See text.
Geological Survey of India
13 RSAS

Geological Survey of India
14 RSAS