geology and ground-water resources of hettinger …
TRANSCRIPT

GEOLOGY AND GROUND-WATER RESOURCES
of
HETTINGER and STARK COUNTIES ,
NORTH DAKOT A
by
Henry Trapp, Jr . and M. G. Crof t
U. S . Geological Survey
COUNTY GROUND-WATER STUDIES 16 — PART INorth Dakota State Water CommissionVernon Fahy, State Enginee r
Prepared by the United States Geological Surveyin cooperation with the North Dakota State Water Commissionand Hettinger and Stark Counties Water Management District s
1975

GEOLOGY AND GROUND-WATER RESOURCES
of
HETTINGER and STARK COUNTIES ,
NORTH DAKOT A
by
Henry Trapp, Jr . and M. G. Croft
U. S. Geological Surve y
COUNTY GROUND-WATER STUDIES 16 — PART INorth Dakota State Water Commissio nVernon Fahy, State Engineer
Prepared by the United States Geological Surveyin cooperation with the North Dakota State Water Commissio nand Hettinger and Stark Counties Water Management District s
197 5
Bismarck, North Dakota
CONTENTS
Page
ABSTRACT 1
INTRODUCTION 2Purpose and objectives of the investigation 2
Previous investigations 2
Geology 2
Groundwater 3
Acknowledgments 4
Geographic setting 4
Climate 6
Well-numbering system 6
GEOLOGY OF THE GROUND-WATER RESERVOIR 7
Consolidated rocks of Cambrian to Cretaceous age 10
Semiconsolidated rocks of Cretaceous age 1 0
Fox Hills Formation 1 1Hell Creek Formation 1 1
Semiconsolidated rocks of Tertiary age 12
Ludlow and Cannonball Formations 12Tongue River Formation 1 5
Geologic structure 15
Sentinel Butte Formation 17
Golden 'Valley Formation 17
White River Formation 20
Arikaree Formation 20
Unconsolidated deposits of Quaternary age 2 1
AVAILABILITY AND QUALITY OF GROUND WATER 2 1Aquifers in deposits of Cretaceous and Tertiary age 23
Fox Hills and basal Hell Creek aquifer system 23
Upper Hell Creek and lower Cannonball-Ludlowaquifer system 29
Upper Ludlow and Tongue River aquifer system 3 1
Sentinel Butte aquifer system 35
Golden Valley aquifer system 38
White River aquifer system 38
Undifferentiated lignite aquifers in theTongue River and Sentinel Butte Formations 39
Aquifers in deposits of Quaternary age 39

Page
USE OF GROUND WATER 40Belfield 4 1Dickinson 4 1Mott 4 2New England 4 2Regent 4 3Richardton 4 3
SUMMARY 43
SELECTED REFERENCES 46
GLOSSARY OF SELECTED TERMS 50
ILLUSTRATION S
Plate1. Geologic and structure map of Hettinge r
and Stark Counties (in pocket )
2. Geohydrologic section A-A' (in pocket )
3 . Geohydrologic section B-B' (in pocket )
4. Map showing geohydrology of the uppe rLudlow and Tongue River aquifer system (in pocket)
Figure1. Map showing physiographic divisions i n
North Dakota and location of report area 5
2. Diagram showing system of numbering wells ,springs, and test holes 8
3. Map showing aggregate sandstone thicknes sin and depth to the top of the basal sandston emember of the Tongue River Formation 16
4. Map showing aggregate sandstone thicknes sof the basal sandstone member of th eSentinel Butte Formation 18
u

Page
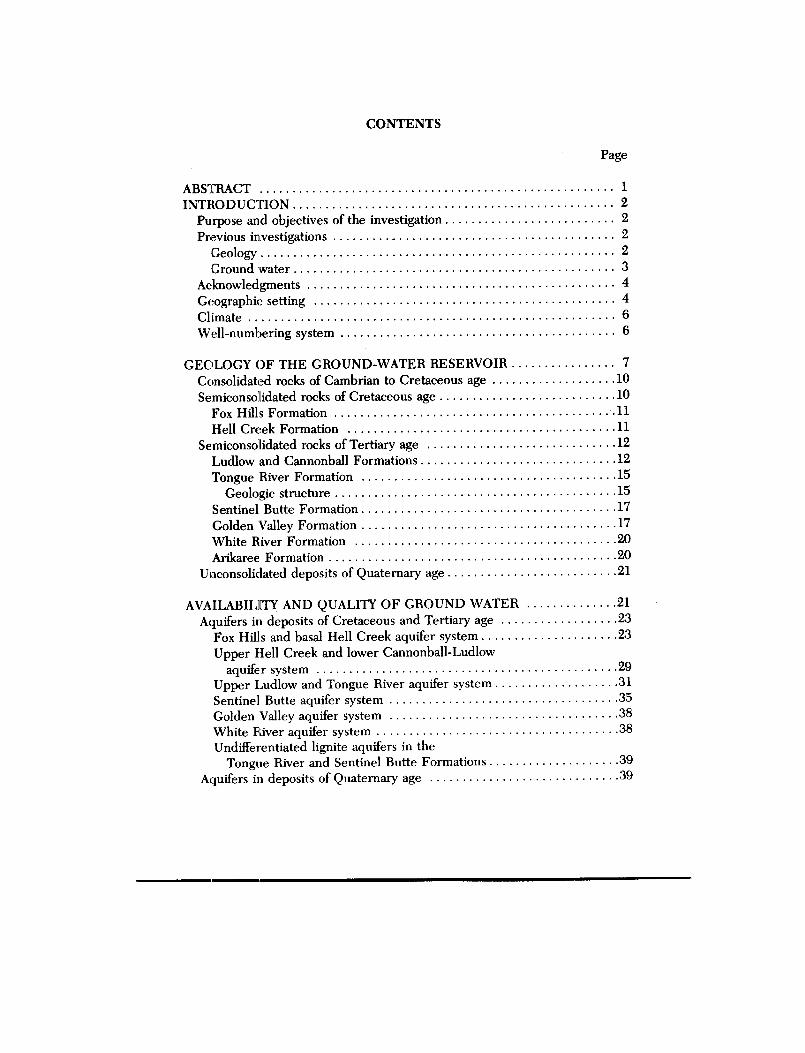
5. Map showing aggregate sandstone thickness inthe upper part of the Sentinel Butte Formation 19
6. Diagram showing classification ofirrigation water 25
7. Map showing potentiometric surface of theFox Hills and basal Hell Creek aquifer system 26
8. Map showing transmissivity of the Fox Hillsand basal Hell Creek aquifer system 27
9. Graph showing average values of major constituent sin water in the principal aquifer systems 2 8
10. Map showing potentiometric surface of theupper Hell Creek and lower Cannonball-Ludlo waquifer system 3 0
11. Trilinear diagram showing major constituentsin water from the basal sandstone member o fthe Tongue River Formation 33
12. Hydrograph showing water-level fluctuation sin the Sentinel Butte aquifer system, an dprecipitation at the Dickinson ExperimentStation, 1968-70 35
13. Trilinear diagram showing major constituentsin water from the Sentinel Butte aquifersystem and from aquifers in deposits of Quaternar yage 37
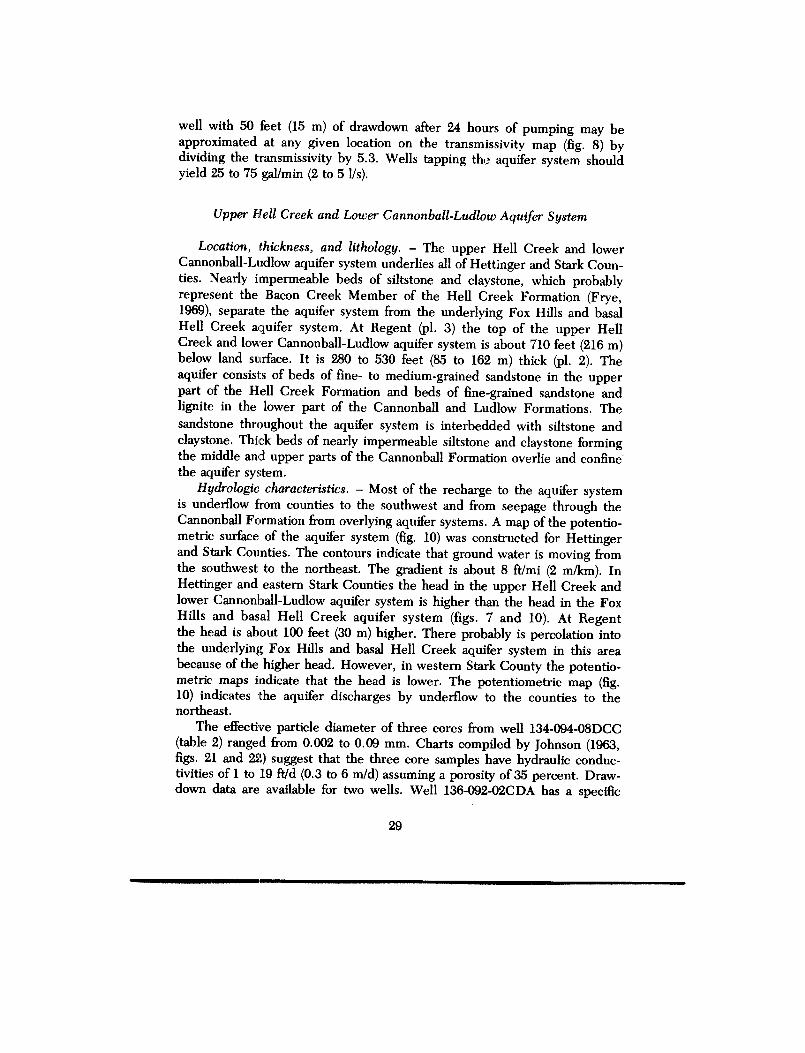
14. Hydrograph showing water-level fluctuation sin aquifers in deposits of Quaternary age ,and precipitation at Richardton, 1966-69 40
TABLE S
Table1 . Stratigraphic column, Williston basin
North Dakota and adjacent areas 9
iii

Page
2. Analysis of particle-size distributio ncurves 1 3
3. Major constituents in water — their sources ,effects upon usability, and recommende dconcentration limits 24
4. Estimated use of ground water, in millio ngallons per day, in 1969 4 1
iv

SELECTED FACTORS FOR CONVERTING ENGLISH UNITS T OINTERNATIONAL SYSTEM (SI) UNIT S
A dual system of measurements — English units and the Internationa lSystem (SI) of units — is given in this report . SI is a consistent system ofunits adopted by the Eleventh General Conference of Weights and Measure sin 1960. Selected factors for converting English units to SI units are give nbelow.
Multiply English units ByInches 25 . 4Feet .3048Miles 1 .609Square miles (mil) 2 .590Acres .4047Gallons 3 .785Million gallons (Mgal) 3,785Acre-feet 1,233
1 .233 x 10-3Gallons per minut e
(gal/min).06309
Million gallons per day(Mgal/d)
.0438 1
Gallons per minute perfoot [(gal/min)/ftl
.2070
Feet per day (ft/d) .3048Square feet per day
(ftz/d).09290
Feet per mile (ft/mi) .18943
To obtain SI unitsmillimetres (mm )metres (m)kilometres (km)square kilometres (km 2)hectares (ha)litre scubic metres (m 3)cubic metres (m 3)cubic hectometres (hm3)litres per second
(Us )cubic metres pe r
second (m3/s )litres per second per
metre [(l/s)/m ]metres per day (m/d)square metres per day
(m2/d )metres per kilometre
(m/km )
v

GEOLOGY AND GROUND-WATER RESOURCES O FHETTINGER AND STARK COUNTIES, NORTH DAKOT A
By Henry Trapp, Jr ., and M. G. Croft
ABSTRACT
The sedimentary rocks of Paleozoic, Mesozoic, and Cenozoic age in Het-tinger and Stark Counties, on the south-central flank of the Williston struc-tural basin, are about 14,000 feet (4,270 metres) thick . They are gently folde d
into north-plunging anticlines and synclines . The major aquifer systems con-sist of interbedded fine- to medium-grained sandstone, siltstone, and clay -stone. As much as 100 gallons per minute (6 .3 litres per second), per indi-vidual well, of usable ground water is available from the semiconsolidate drocks of Late Cretaceous and Tertiary age.
The Fox Hills and basal Hell Creek aquifer system underlies the entirearea at depths greater than 1,100 feet (335 metres). The water in this systemis a sodium bicarbonate type with a dissolved-solids concentration of 1,310 to1,540 milligrams per litre . The transmissivity of the aquifer system range sfrom 110 feet squared per day (10 metres squared per day) to 390 fee tsquared per day (36 metres squared per day) . Wells should yield as much as75 gallons per minute (5 litres per second) .
The upper Hell Creek and lower Cannonball-Ludlow aquifer syste munderlies all of Hettinger and Stark Counties . The aquifer system contains asodium bicarbonate type water with a dissolved-solids concentration rangin gfrom 1,450 to 1,890 milligrams per litre .
The transmissivity of the basal sandstone member of the Tongue Rive r
Formation ranges from 70 feet squared per day (7 metres squared per day)to 530 feet squared per day (49 metres squared per day) . Wells should yiel das much as 100 gallons per minute (6 .3 litres per second) . Ground waterin the basal sandstone member is generally a sodium bicarbonate type witha dissolved-solids concentration ranging from 704 to 1,470 milligrams per litre .
The Sentinel Butte aquifer system underlies most of Stark County . Anal-yses indicate the water is generally of a sodium sulfate type . Dissolved-solids concentration of the samples ranged from 378 to 11,700 milligramsper litre with a median value of 1,050 milligrams per litre .
Approximately 6,800 acre-feet (8 .4 cubic hectometres) of water was ob-tained from ground-water and surface-water sources in 1969. Ground-water
sources furnished about 40 percent of the total water supply .
1

INTRODUCTION
This geologic and hydrologic investigation was made cooperatively by th eU .S . Geological Survey, the North Dakota State Water Commission, and th eHettinger and Stark Counties Water Management Districts .
Data referred to in this report are in Part II (Trapp, 1971) of this seriesunless otherwise referenced . The geologic names used in this report are thoseof the North Dakota Geological Survey and, in some instances, may diffe rfrom terms currently used by the U .S . Geological Survey . English units andabbreviations and the factors for conversion to the equivalent Internationa lSystem (SI) units and corresponding abbreviations are in front of the report .
Purpose and Objective of the Investigation
The purpose of the investigation in Hettinger and Stark Counties was t odetermine the quantity and quality of ground water available for municipal ,domestic, livestock, industrial, and irrigation uses . The investigation beganin July 1966 . Specifically, the objectives were to: (1) determine the loca-tion, extent, and nature of the major aquifers and confining beds ; (2) evaluatethe occurrence and movement of ground water, including the sources ofrecharge and discharge ; (3) estimate the potential yields of wells ; and (4 )determine the chemical quality of the ground water .
Previous Investigation s
Geolog y
The earliest geologic investigations in Hettinger and Stark Counties wer emade to study the regional stratigraphy (Leonard, 1911) and the minera lresources such as clay (Clapp, Babcock, and Leonard, 1906) and lignit e(Lloyd, 1914; Leonard, Babcock, and Dove, 1925) . In the 1920's the NorthernPacific Railway Company mapped lignite deposits throughout much of th earea . Although the information has not been published, the company mad ethe information available .
Alden (1932) studied the regional land forms and glacial history of th eNorthern Great Plains . Hennen (1943) published a geologic cross sectio nfrom Sentinel Butte in western North Dakota through Stark County to cen-tral Burleigh County. He attempted to show that certain Tertiary beds couldbe used for mapping over long distances . Brown (1948) disagreed with Hen-nen 's conclusions .
Benson (1951) prepared a generalized geologic map of southwesternNorth Dakota that included Hettinger and Stark Counties . Benson (1952)
2

also prepared a report on the Knife River area that included part of north -eastern Stark County . Brant (1953) mapped lignite beds in Hettinger an dStark Counties . Hansen (1953) investigated limestone beds within the Whit eRiver Formation in Stark and Hettinger Counties, and provided test-hol elogs and detailed maps of the stratigraphy . Caldwell (1954) prepared geologi cstructure maps of western Stark County and adjoining areas .
Colton, Lemke, and Lindvall (1963) mapped the glacial features in north-eastern and southeastern Stark County . Denson and Gill (1965) studied theLittle Badlands area southwest of Dickinson for uranium. Anderson (1966 )prepared subsurface geologic maps for southwestern North Dakota .
K. S. Soward and G. D. Mowat, of the U.S. Geological Survey (ora lcommun ., 1970), have prepared geologic reports on the White Butte (Het-tinger and Stark Counties) and Clark Butte (Hettinger, Stark, Morton, an dGrant Counties) 15-minute quadrangles . The geologic studies were made toevaluate the lignite resources. Geologic contacts in these quadrangles weregeneralized from their preliminary maps . Some of the geologic interpretationsin the vicinity of Dickinson and South Heart were based on unpublishe dwork by C. E . Erdmann, U.S. Geological Survey .
The location, tonnage, and characteristics of lignite and overburden i nwestern North Dakota are summarized by Pollard, Smith, and Knox (1972) .
Ground Water
The earliest known investigation of the ground-water resources in Het-tinger and Stark Counties was made by Simpson (1929) . Between 1920 and1930 declining water levels in the Dakota aquifer resulted in a statewid eprogram of periodic inspection of flowing wells under the direction of th eState Geologist . Several flowing wells in Hettinger and Stark Counties wereinventoried and inspected periodically under this program .
Abbott and Voedisch (1938) published a summary of the municipal ground-water supplies in North Dakota. In 1938-39 the Works Projects Adminis-tration, in cooperation with the State, inventoried ground-water supplies inthe two counties . As a result of the inventory, the U .S . Geological Surve ybegan a program to monitor water-level changes in observation wells inHettinger and Stark Counties . McLaughlin and Greenlee (1946) reported o nthe potential for increased withdrawals from the aquifers supplying municipalwells at Dickinson . The U .S . Bureau of Reclamation drilled test holes in 194 6at the Dickinson damsite in the Cannonball River valley near Mott . Tychsen(1950) provided additional information on the ground-water resources of theDickinson area. In 1951-52, Powell and Paulson (1961) conducted a ground-water study and drilled several test holes in the Richardton area .
The U.S . Geological Survey made a reconnaissance study (unpublished )of the ground-water supplies for the city of New England in 1958, includin g
3

an aquifer test using the municipal wells . Schmid (1963) investigated aquifersnear Dickinson in an attempt to locate additional water supplies for the city .Lindvig (1964) reported the results of an aquifer test at Dickinson at a sit erecommended by Schmid (1963, p . 6) .
Acknowledgments
The authors are grateful to the residents of Hettinger and Stark Countie sand the operators of the municipal water systems who contributed valuabl einformation . The following drilling contractors supplied logs of wells and tes tholes : Moe Drilling Co ., Mann Drilling Co ., Opp Well Drilling, Sande rDrilling Co ., Bandy Drilling Co ., and Kruger Well Drilling Co. Richard D .Smith, of the University of North Dakota also furnished logs and other infor-mation . Burlington Northern, Inc . (formerly Northern Pacific Railway Co .) andthe U.S. Bureau of Reclamation supplied maps and logs of wells and tes tholes . The North Dakota State Highway Department furnished logs an dchemical analyses of water samples from wells at Interstate 94 rest stops ,and the North Dakota State Department of Health and the State Laboratorie sDepartment furnished copies of other water analyses .
L. L. Froelich, geologist for the North Dakota State Water Commission ,logged most of the test holes and wells drilled for the project . M. O. Lind-vig, Director, Hydrology Division of the North Dakota State Water Commis-sion, assisted in project planning, and G . O. Muri, North Dakota StateWater Commission, provided chemical analysis of water samples .
Geographic Settin g
Hettinger and Stark Counties are largely in the unglaciated Missour iPlateau section of the Great Plains physiographic province (fig .1) . Bothcounties are within the Missouri River drainage basin . Hettinger County isdrained by the Cannonball River and several tributaries of Cedar Creek .Stark County is drained principally by the Heart River, tributaries of theKnife River, and by the Cannonball River .
The rolling plateau surface of the two counties is highly dissected b yerosion . Scattered buttes, capped by resistant sandstone, limestone, o r"scoria e" beds, are remnants of sedimentary strata that once covered the are amore extensively . The highest point in Hettinger County is Black Butte(pl . 1, in pocket), north of Regent, with an altitude of 3,025 feet (922 m )above mean sea level . The highest point in Stark County is 3,061 fee t(933 m) in the SW cor. sec . 17, T. 137 N ., R. 97 W., at U .S. Coastand Geodetic Survey triangulation station Brown . The lowest point in thetwo-county area is in northeastern Stark County in the NE e/4 sec. 27, T .'Scoria is claystone baked by burning lignite beds .
4

01
102°
100°
98 °
100°
0
20
40 MILE SGISiSISIMI
10 0 10 30 50 KILOMETRE S
\ p~IN
46°
FIGURE 1 .-Physiographic divisions in North Dakota and location of report area .

141 N., R. 91 W., where the Little Knife River leaves the county . Detailedmeasurements are lacking, but the altitude is about 2,050 feet (625 m). Totalrelief in the county is about 1,000 feet (305 m) .
Hettinger County has an area of 1,135 mi 2 (2,940 km 2) and a populationof 5 .075 (1970 census) . The county seat and largest city is Mott (populatio n1,368) . Other incorporated cities include New England (population 906) ,and Regent (population 344). The economy is based almost entirely on ' agri-culture, principally dryland small-grain farming and feeding of beef cattle .Lignite mining was once a thriving industry and is expected to increas egreatly in the near future . Gravel is intermittently quarried at Burt . Therehas been considerable seismic exploration for oil and some production hasbeen reported .
Stark County has an area of 1,319 mi 2 (3,416 km2) and a population o f19,613 (1970 census) . The largest city and county seat is Dickinson, popula-tion 12,405, which is the largest city and the main trading center in Nort hDakota southwest of the Missouri River . Other incorporated cities in Star kCounty are Belfield (population 1,130), Richardton (population 799), Glad -stone (population 222), Taylor (population 162), and South Heart (population
132) . The economy is based mainly on agriculture — principally drylandsmall-grain farming and feeding of beef cattle . There is also oil production
and mining of lignite, gravel, and clay . Large strippable reserves of lignite
are northwest of Dickinson (Pollard and others, 1972, fig . 1) .
Climate
The climate in the two counties is characteristic of the interior of the
continent and the latitude . Relatively large extremes in the weather occur
rapidly. The mean annual precipitation at Dickinson is 15 .50 inches (394 mm),
and at Mott it is 15 .80 inches (401 mm) . The lowest annual precipitation
on record in the area was 6.12 inches (155 mm) at Mott (1936) and the
highest annual precipitation was 31 .16 inches (791 mm) at Dickinson (1941) .The mean annual snowfall is about 31 inches (787 mm), with a minimum of9 inches (229 mm) at Mott during the winter of 1957-58 and a maximum o f74 inches (1,880 mm) at Dickinson during the winter of 1896-97 . Most pre-
cipitation falls in summer thunderstorms, which can be intense and accom-
panied by hail . Precipitation in amounts of 1 inch (25 mm) or more occurs
about twice a year.The average annual temperature is 40 .7°F (Fahrenheit ; 4.8°C, Celsius )
at Dickinson and 42°F (5 .6°C) at Mott . The record high and low tempera-tures are 114°F (45 .6°C) and -47°F (—43 .9°C) at both cities .
Well-Numbering System
The wells, springs, and test holes in the tables are numbered accordingto a system based on the location in the public land classification of the U .S .
6

Bureau of Land Management. The system is illustrated in figure 2 . The firstnumeral denotes the township north of a base line, the second numera ldenotes the range west of the fifth principal meridian, and the third numera ldenotes the section in which the well is located . The letters A, B, C, andD designate, respectively, the northeast, northwest, southwest, and southeas tquarter section, quarter-quarter section, and quarter-quarter-quarter sectio n(10-acre or 4-ha tract) . For example, well 133-091-15DAA is in the NEY4 -NEY4SE'/4 sec . 15, T. 133 N., R. 91 W. Consecutive terminal numerals areadded if more than one well is recorded within a 10-acre (4-ha) tract .
GEOLOGY OF THE GROUND-WATER RESERVOIR
Hettinger and Stark Counties are on the south-central flank of the Willis -ton basin, a broad structural depression underlying parts of North and Sout hDakota, Montana, Manitoba, and Saskatchewan (Denson and Gill, 1965, pl .5) . The basin contains sedimentary rocks from the Cambrian through th eQuaternary Period . These rocks are divided into numerous geologic forma-tions (table 1) and have a combined thickness of at least 14,000 feet (4,270 m )in northwestern Stark County. During Late Cretaceous and Early Tertiarytime, compression deformed and warped the rocks into gentle north-plungin ganticlines and synclines (pl . 1). All rocks from the Deadwood Formationthrough the White River Formation are folded to some degree .
The rocks of Paleozoic and Mesozoic age have been penetrated by nu-merous oil and gas test holes in Hettinger and Stark Counties, and hav ebeen divided into numerous formations . Well logs and lithologic description sare available from the North Dakota Geological Survey, and only brief litho -logic descriptions of the rocks older than the Fox Hills Formation of Creta-ceous age are even here . The rocks older than the Fox Hills Formation arelikely to yield saline water; they underlie the area at depths greater than i sgenerally practical to drill water wells . They have an aggregate thicknessranging from about 9,000 feet (2,740 m) in southeastern Hettinger Countyto about 12,00() feet (3,660 m) in northwestern Stark County .
Most of the usable ground water in Hettinger and Stark Counties is inthe semiconsolidated rocks of Late Cretaceous and Tertiary ages. Theserocks, which include the Fox Hills and overlying formations (table 1), wer estudied in detail with special reference to their water-bearing properties an dare shown in detail in cross sections (pls . 2 and 3, in pocket) . Small quanti-ties of water are available from the unconsolidated deposits of Quaternary age .
7

FIGURE 2 .-System of numbering wells, springs, and test hole s
8

TABLE 1 . — Stratigraphic column, Williston basi nNorth Dakota and adjacent areas
(Modified from North Dakota Geol . Soc ., 1954, p . 2 )
Era Period Group Formatio n
Quaternary Glacial (hilt
Tertiary
Arikare eWhite Rive rGolden Valle y
Fort UnionSentinel ButteTongue Rive rCannonball and Ludlow
Cretaceous
Hell Cree k
\lunhmaFox Hill sPierre
ColoradoNiobraraCarlileGreenhornBelle Fourche\Iowry'
DakotaNewcastl eSkull Cree kFall Rive rLakota
JurassicMorrisonSwiftRierdonPipe r
Triassic Spearfis hPermian NIinnekaht a
()peck.~_ Pennsvkanian \linnelus a
Mississippian
Amsde n
Big Snoss yHeat hOtte rKibbe• \
MadisonCharle sNI ission Canyo nLodgepolBakke n
Devonian
Three Fork sSaskatchewan Nisk u
I)uperowBea\erhill Lake Souris Rise r
Dawson BayPrairie\Winnipegosi sAshern_
Silurian Interlake Interlak e_
OrdovicianStour Mountai nRed River\Winnipeg
Cambrian Deadwood
9

Consolidated Rocks of Cambrian to Cretaceous Ag e
The Late Cambrian to Early Ordovician Periods are represented by th eDeadwood Formation, a marine deposit of sandstone, shale, and limeston ethat gradually thins eastward across the Williston basin . The basin began tosubside during Middle Ordovician time and was partially filled with a rela-tively thin deposit of clastic rocks of the Winnipeg Formation, followed b ypredominantly carbonate deposition of the Red River and Stony MountainFormations, and the Silurian Interlake Formation . An unconformity occur sat the top of the Interlake Formation .
The rocks of Devonian age (Ashern, Winnipegosis, Prairie, Dawson Bay ,Souris River, Duperow, Nisku, and Three Forks Formations) are predomi-nantly carbonate deposits, with the exception of the Prairie Formation, whic hincludes evaporite beds . The Bakken Formation consists mainly of shale andis overlain by alternating carbonate and evaporite deposits of the Lodgepole ,Mission Canyon, and Charles Formations that form the Madison Group . TheBig Snowy Group, which includes the Kibbey, Otter, and Heath Formations ,consists predominantly of sandstone and shale . The Amsden, which rest sunconformably on rocks of the Big Snowy Group, is shown as Mississippian ,but is regarded by a few geologists as Pennsylvanian . The Pennsylvanian andPermian rocks, the Minnelusa, Opeche, and Minnekahta Formations, consis tof marine sandstone and shale interbedded with evaporite and carbonat edeposits .
The Spearfish Formation of Triassic age consists of nonmarine redbed ssimilar to the underlying Pennsylvanian and Permian Formations . The PiperFormation of Jurassic age consists of limestone, anhydrite, and shale an drests unconformably on the Spearfish . The Rierdon, Swift, and Morriso nFormations consist mainly of sandstone and shale .
Semiconsolidated Rocks of Cretaceous Age
The Williston basin received thick deposits of sand, silt, and clay durin gthe Cretaceous Period . These deposits, which were subsequently forme dinto sandstone and shale, are not exposed to land surface. The Lakota, Fal lRiver, and Newcastle Formations are composed principally of sandstone ; theSkull Creek, Mowry, Bell Fourche, Carlile, and Niobrara Formations con-sist mainly of dark-gray shale . The Pierre Formation is a thick gray marineshale overlain by alternating shale, siltstone, and sandstone of the Fox Hill sand Hell Creek Formations . The top of the Pierre forms the base of th efresh-water-bearing units in the report area.
10

Fox Hills Formatio n
The Fox Hills Formation consists of interbedded very fine to medium -grained sandstone, siltstone, claystone, and rarely a few thin beds of car-bonaceous and lignitic shale . The total thickness of the Fox Hills (pls . 2 and3) ranges from 240 to 410 feet (73 to 125 m), and depth to the top of theformation ranges from 1,020 to 1,630 feet (311 to 497 m) below land sur-face . The formation is thickest in the northwestern part of the area .
The Fox Hills Formation is underlain by the Pierre Formation, a dark -colored marine shale . In most test holes and oil and gas logs the lower par tof the Fox Hills contained less sand than the upper part. Drilling usuallybecomes more difficult upon entering the Pierre . Shale from the PierreFormation generally is darker than shale from the Fox Hills . Croft (1970, p .71 and 76, fig. 6, pl. 2) identified the top of the Pierre at a higher altitud ein Mercer County than was mapped in this report .
In the Little Missouri valley of western North Dakota, the upper contactis locally unconformable within overlying strata (Frye, 1969, p . 20-23). Thecontact is easily identified where the uppermost member of the Fox Hills ,the Colgate Member, which consists mainly of sandstone, is overlain by th eHell Creek Formation . In adjoining areas the Colgate Member weathers to alight-gray color, whereas the Hell Creek is brown . In many areas the lower partof the formation is mainly siltstone and claystone . Electric logs were use dfor correlation purposes in the geohydrologic sections (pls . 2 and 3).
Hell Creek Formation
The Hell Creek Formation does not crop out in the study area and i sknown only from well and test-hole data . The top of the Hell Creek is atdepths of 800 to 1,140 feet (244 to 347 m) below land surface (pls . 2 and3), and the formation is 220 to 510 feet (67 to 155 m) thick. Brown (1952, p .92) recommended the Hell Creek-Ludlow contact be drawn at the base o fthe lowest coal bed . This was not practicable in all test holes or logs be -cause of insufficient data ; therefore, in some logs the contact is arbitrary .Lignite occurred near the contact in several test holes, but rarely at greate rdepths . In some cases, a thickening of the drilling fluid and a change to adark-brown color were noted in test holes during penetration of the upperpart of the Hell Creek. Frye (1969, pl . 2) divided the Hell Creek Formationfrom eastern Montana to central North Dakota into nine members . Beds ofolive-gray siltstone and claystone, which are tentatively identified as theBacon Creek Member of Frye (1969), divide the Hell Creek into two majoraquifers (pls . 2 and 3). However, further detailed subdivision of the HellCreek was not practicable for this study .
11

The Hell Creek consists of fine- to medium-grained sandstone, siltstone ,bentonitic and carbonaceous claystone, and shale, with zones of sideriti c
nodules and concretions . Four samples were cored from the upper part of
the Hell Creek in test hole 134-094-08DCC and particle-size distribution
curves made . The samples (table 2) from a depth of 1,050 to 1,060 feet (320
to 323 m) consisted of very fine to fine-grained sandstone with clay and sil t
content ranging from 6.1 to 32 .5 percent . Median particle diameter range d
from 0.09 to 0 .2 mm . The effective particle diameter ranged from less tha n
0.002 to 0 .09 mm. The coefficient of uniformity ranged from 1 .7 to 70 . Thesamples with high coefficient of uniformity values are poorly sorted .
In addition, particle-size distribution curves were made for two uppe rHell Creek cores from test hole 141-090-19CCD in Mercer County . Bothsamples are clayey and silty fine-grained sandstone, much like the sample sfrom test hole 134-094-08DCC . In the core from 892 feet (272 m), takenjust below the top of the Hell Creek, clay and silt sizes constituted 49 . 4percent of the sample . The core from a depth of about 1,028 feet (313 m)was 42 .4 percent clay and silt . Median particle size was 0.065 and 0.096mm, respectively, in the two samples, and effective diameter was less tha n0.01 mm .
Semiconsolidated Rocks of Tertiary Ag e
Most of the rocks of Tertiary age are nonmarine claystone, siltstone ,and sandstone derived from the west, and include the Ludlow, Tongue River ,Sentinel Butte, Golden Valley, White River, and Arikaree Formations . Anexception is the shallow marine rocks of the Cannonball Formation . Rocksof the Tongue River Formation are the oldest exposed in the study area (pl .1) .
Ludlow and Cannonball Formations
The Ludlow and Cannonball Formations of the Fort Union Group, whichwere deposited contemporaneously, are not exposed in the study area. Geo-logic cross sections (pls . 2 and 3) show an upper and a lower member o fthe Ludlow separated by the Cannonball Formation . The top of the LudlowFormation occurs from 275 to 755 feet (84 to 230 m) below land surface .The two formations are 310 to 650 feet (94 to 198 m) thick (pls . 2 and 3) .The Ludlow Formation was deposited in a continental environment, where -as the Cannonball was deposited in a marine environment and is the young-est marine strata known in the northern Great Plains .
The Ludlow Formation consists of fine-grained continental sandstone ,green and brown carbonaceous claystone, siltstone, and lignite . The sand-stone is generally coarser grained than the Cannonball and forms parts o f
12

TABLE 2 . - Analysis of particle-size distribution curves
Geologic
DepthMedian particlediameter (Dso)
Effective particlediameter (Dio)
Coefficient ofuniformity
Deo
Hydraulicconductivity
(From Johnson, 1963,fig. 21-22 )
Well formation
(feet) (millimetre) (millimetre) Dio ft/d
132-092-21DDD2 Tongue River 60-60.5 0 .055 0.004 15 < 1
134-094-08DCC Hell Creek 1050-1051 .09134-094-08DCC do . 1053-1054 .2 .09 2.4 1 9
134-094-08DCC do. 1055-1056 .1 .002 70 < 1
134-094-08DCC do . 1059-1060 .09 .06 1 .7 8
134-096-25BBB2 Tongue River 310 .1 .04 2.7 4
134-096-25BBB2 do . 311 .09 .004 22.5 < 1
134-096-25BBB2 do. 311.5 .1 1137-098-12BBB Cannonball 741 .12
137-098-12BBB do. 742-742.5 .09137-098-12BBB do. 743 .125
139-095-21DDD2 Sentinel Butte 180-180 .5 .1 .0015 83 < 1
139-095-21DDD2 do. 182 .17
139-098-19CBB2 do . 60 .14
139-098-19CBB2 do . 61 .14
139-098-19CBB2 do . 62 .15 .075 2.1 1 2
140-094-03DDD2 do . 131 .5-132 .15 -
140-094-03DDD2 do . 134-134 .5 .16
140-094-03DDD2 do . 136-136 .5 .13 .002 70 < 1

two major aquifers (pls . 2 and 3) . The Cannonball Formation consists mainlyof marine light-olive-gray to dark-greenish-gray nearly impermeable clayston eand siltstone . The beds thin westward and interfinger with deposits of th eLudlow. Beds of fine-grained sandstone are present in some areas withinthe Cannonball and are locally an important aquifer . However, the majorfunction of the formation in the ground-water system is that of a confining bed .
Samples from test hole 138-092-32DDD were examined by Robert H .Tschudy (written commun., 1971), U .S . Geological Survey, for plant spore sand other microfossils . He stated :
" Paleocene pollen and spores identified from these samples include th efollowing : Pistillipollenites, Ulmipollenites, Alnus, Abietineaepollenites ,Maceopolipollenites, Osmundacidites, Erdtmanipollis, Azolla, Carya ,Aquilapollenites, Inaperturopollenites, Stereisporites, Kurtzipites ,Ghoshispora, and Wodenhouseia . "Two samples collected from 1,035 to 1,040 feet (315 to 317 m) an d
from 1,095 to 1,100 feet (334 to 335 m) contained abundant polle nand spores. There were no Cretaceous species in the assemblages . There -fore, the Hell Creek-Ludlow contact should probably be below 1,100 fee t(335 m) rather than at 896 feet (273 m) as reported in part II (Trapp, 1971) .The presence of Azolla, a fresh-water fern, and a few dinoflagellates sugges tdeltaic deposition .
Samples obtained from depths of 730 to 735 feet (222 to 224 m), con-sidered to be from the Cannonball, did not contain hystrichospheres o rdinoflagellates or any other evidence of marine deposition . Therefore, th einterval from 730 to 735 feet (222 to 224 m) may be Ludlow rather tha nCannonball as reported in part II . Samples collected from 750 to 810 fee t(229 to 247 m) from the Cannonball, contained a few hystrichospheres an ddinoflagellates, and samples collected from 830 to 835 feet (253 to 255 m )contained an abundant suite of marine fossils . However, the samples fro m830 to 835 feet (253 to 255 m) also contained numerous pollen and spor especimens, suggesting that deposition was near shore rather than from mid -basin .
Particle-size distribution curves were made from cores of sandstone fromthe Cannonball from test hole 137-098-12BBB (table 2) . In addition, curveswere made for a Cannonball core sample from a depth of 647 .5 feet (197 .4 m )and for a Ludlow core sample from a depth of 770 feet (235 m) in tes thole 141-090-19CCD in Mercer County . The samples ranged from clayey silt -stone to fine-grained sandstone with from 17 to 88 .2 percent clay and sil tsizes . Median particle size for the samples from well 137-098-12BBB range dfrom 0 .09 to 0 .125 mm .
14

Tongue River Formation
The Tongue River Formation of the Fort Union Group, the oldest roc kstrata exposed at the surface in the two-county area, crops out in the streamvalleys of Hettinger County and eastern Stark County (pl . 1) . The formationis predominantly sandstone interbedded with claystone, siltstone, lignite ,carbonaceous shale, and bentonitic claystone . The HT Butte lignite bed, inthe uppermost part of the Tongue River, is regionally extensive and a dis-tinctive stratigraphic marker . The formation is typically lighter colored thanthe overlying Sentinel Butte .
The Tongue River Fjormation varies from about 250 to at least 570 fee t(76 to 174 m) in thickness . A basal sandstone member, which is an impor-tant source of ground water, is persistent, but quite variable in thickness ,across the area (pls . 2 and 3). The maximum known thickness of the sand -stone member is 199 feet (61 m) in well 137-091-13ACC2, but more com-monly the thickness is about 50 feet (15 m) . The aggregate sandstone thick-ness, excluding the interbedded siltstone and claystone, is shown in figure 3 .
Particle-size distribution curves were made of cores from the Tongu eRiver Formation from test holes 132-092-21DDD2 and 134-096-25BBB2 . Inaddition, a particle-size distribution curve from a depth of 165 feet (50 m )in test hole 141-090-19CCD in Mercer County was reported . The samplesranged from sandy siltstone to very fine sandstone, with from 19 .6 to 78.0percent clay and silt sizes . Median particle size (table 2) of samples fro mHettinger and Stark Counties ranged from 0.055 to 0 .11 mm. The effectivediameter ranged from less than 0.004 to 0.04 mm, and the coefficient ofuniformity ranged from 2 .7 to 22.5, indicating the sandstone was generallypoorly sorted .
Geologic structure . – The geologic structure in Hettinger and Star k
Counties (pl . 1) is shown by structure contours drawn on the top of the TongueRiver Formation . This stratigraphic horizon was chosen : (1) because it under-lies most of the study area, (2) because it is a fairly well defined contact ,and (3) because the Tongue River and overlying Sentinel Butte Formation s
are important aquifers in the counties . The solid contours depict the con -figuration of this horizon where it occurs in the subsurface ; the dashed con-tours represent the inferred position of the horizon before it was remove dby erosion .
Structure contours (pl . 1) indicate that the rocks have been warped intosynclines and anticlines . The synclinal folds plunge gently northward an dare generally more distinct structures than the anticlines . The highest altitudeof the top of the Tongue River Formation is near the southwestern corne rof Hettinger County where it is more than 2,800 feet (853 m) above mean
sea level . The lowest point is in northern Stark County where the top o f
15

FIGURE 3.-- Aggregate sandstone thickness in and depth t othe top of the basal sandstone member of th eTongue River Formation .
T140 N
T139 N
T138 N
T137N
EXPLANATIO N
300
LINE OF EQUAL APPROXIMATE DEPTH TO TOP OF BASE LSANDSTONE MEMBER OF THE TONGUE RIVER FORMATION.INTERVAL 100 FEET (30 METRES) . DATUM IS LAND SURFAC E
AGGREGATE SANDSTONE THICKNESS, IN FEET METRES )
100-200
(30-61 )
50-10 0(15-30 )
LESS TI-IAN 50(15 )
16

the Tongue River is at an altitude of less than 1,900 feet (579 m) . The regionalgradient, therefore, is to the north at about 19 ft/mi (3 .6 m/km) .
Sentinel Butte Formation
The Sentinel Butte Formation, the uppermost formation of the For tUnion Group, forms the land surface in about 70 percent of Hettinger andStark Counties (pl . 1) . The formation consists of silty fine- to medium-grainedsandstone, carbonaceous and bentonitic claystone, and lignite. Where theformation is overlain by younger rocks of Tertiary age and can be measured ,the total thickness of the Sentinel Butte is about 450 feet (137 m). It i sthickest a few miles south of Dickinson .
On weathered exposures, the Sentinel Butte Formation can usually bedistinguished from the underlying Tongue River Formation by its overal ldarker color when viewed from a distance . The HT Butte lignite bed, inthe uppermost part of the Tongue River, is generally overlain by the beds ofsandstone at the base of the Sentinel Butte Formation . The color contrastbetween the Sentinel Butte and the Tongue River is rarely recognizable i nthe subsurface, and the formations were mapped using the sandstone bedsat the base of the Sentinel Butte and the HT Butte lignite bed in the TongueRiver .
Thick beds of sandstone in the lower part of the Sentinel Butte Forma-tion are important sources of ground water in Hettinger and Stark Counties .The aggregate sandstone thickness, which excludes the interbedded siltston eand claystone, is shown in figure 4 ; the thickness is greatest northwest o fDickinson and east of Lefor . Commonly the sandstone is silty and cross -bedded and in some areas grades laterally into a montmorillonite sandy clay -stone .
The upper part of the Sentinel Butte consists of interbedded sandstone,siltstone, and claystone interbedded with lignite . The sandstone and ligniteare important sources of ground water . The aggregate sandstone thickness ,exclusive of the basal sandstone member, is shown in figure 5. The greatestaggregate thickness, up to 220 feet (67 m), is in central Stark County .
Particle-size distribution curves were made from cores taken from th eSentinel Butte Formation in test holes 139-095-21DDD2, 139-098-19CBB2 ,and 140-094-03DDD . The curves indicate that the sandstone is very fine tofine-grained with 6 to 38 percent clay and silt . Median particle size (table 2 )ranged from 0 .1 to 0.17 mm; the effective diameter ranged from 0.0015 to0.075 mm, and the coefficient of uniformity ranged from 2 .1 to 83 (table 2) ,indicating the sandstone was generally poorly sorted .
Golden Valley FormationThe Golden Valley Formation crops out extensively in western Stark
County and in northwestern Hettinger County, (p1 . 1) and reaches a maximum
17

T140 N
T139 N
T138 N
T137N
FIGURE 4 .-- Aggregate sandstone thickness of the basa lsandstone member of the Sentinel Butte For-mation .
R93W
R92W
R9I W
R99W
R98W
R97W
R96W
R 95W
47°00 '
BELFIELD_
'NSON TAYLORRICHARDTO N
1J
G HB _t ' N
ON E
( Z
SCHEFIELD o EFOR
&lk103°00
T 136 N
T 135 N
T134 N
T133N
0
10 KILOMETRE S
EXPLANATIO N
AGGREGATE SANDSTONE THICKNESS, IN FEET (METRES )
GREATER THAN 100(30 )
7// /50-100(15-30)
LESS THAN 50(15 )
OUTCROP OF UNDERLYING ROCKS AND QUATERNARY DEPOSITS
46°50 '
46 0 40'
1 8
FIGURE 5 .-- Aggregate sandstone thickness in the uppe rpart of the Sentinel Butte Formation .
EXPLANATIO N
AGGREGATE SANDSTONE THICKNESS, IN FEET (METRES )
150-22 0
(46-67 )
100 -150(30-46 )
50-10 0(15 30 )
LESS THAN 50 (15 )
OUTCROP OF UNDERLYING ROCK S
19

known thickness of 200 feet (61 m) on some buttes northeast of Dickinson .Benson (1952, p . 70-72) described two members of the Golden Valley Forma-tion. The lower member typically has a basal bed of light-purplish-grayshale, a middle bed of tough white sandy claystone that in the upper par tis stained yellow or orange, and an upper bed of light-gray to purplish shale .Where exposed, the lower member is very conspicuous, and Benson referredto it as a "marker bed ." Benson's upper member of the Golden Valley Forma-tion is predominantly a tan micaceous crossbedded sandstone with olive-dra bclaystone and siltstone and a few thin lignite beds .
The contact between the Golden Valley and underlying Sentinel Butt eFormation in Hettinger and Stark Counties (pl . 1) was mapped by (1) tracingthe marker bed described by Benson (1952), (2) using the base of the steepe rslopes formed by the Golden Valley, (3) the presence of thicker and morenumerous lignite beds in the Sentinel Butte, and (4) the altitude .
Clay from the lower member is used for brickmaking at Hebron in Morto n
County, N . Dak., and was once used for that purpose at Dickinson (Holland ,1957, p . 8) . The Golden Valley supplies water to shallow wells in south -western Stark and northwestern Hettinger Counties .
White River Formation
The White River Formation underlies about 38 mi2 (98 km 2) of south-western Stark County and about 3 mi2 (8 km2) of south-central Stark andnorth-central Hettinger Counties . A small outlier of White River also occurs
in eastern Stark County (pl . 1). Its maximum thickness, in southwester n
Stark County, is 200 to 250 feet (61 to 76 m) .The lower part of the White River Formation, which lies unconformabl y
on the Golden Valley Formation, consists of conglomerate, arkose, tuffaceou ssandstone, siltstone, and fresh-water limestone . The upper part of the WhiteRiver in southwestern Stark County consists of pinkish-gray nodular clayston ewith thin interbeds of fluvial sandstone and conglomerate .
Except for small areas in southwestern Stark County, the White Rive rFormation is not used as a source of ground water .
Arikaree Formatio n
The Arikaree Formation is the youngest Tertiary formation in Hettinger
and Stark Counties . It caps several high buttes in southwestern Stark Count y
and in north-central Hettinger County (pl . 1) . In Hettinger County it con-sists of about 65 feet (20 m) of mostly medium- to coarse-grained crossbeddedtuffaceous sandstone, which becomes conglomeratic toward the base (K . S .
Soward, written commun., 1969) . In southwestern Stark County, the Arikaree
20

consists of about 8 feet (2 m) of tuffaceous sandstone (Denson and Gill ,1965, pl .3).
Because of its limited extent and topographic position, the rocks of th eArikaree Formation do not form a major aquifer .
Unconsolidated Deposits of Quaternary Age
Continental glaciers advanced into northeastern Stark County during th eQuaternary Period (fig . 1), and deposited a thin mantle of till over the up -lands. Clastic materials washed out of the glaciers as they melted and formedthick deposits of drift in the ice-marginal stream valleys in both Hettinge rand Stark Counties .
The till in the uplands consists of weathered unsorted silt, sand, an dgravel that rarely exceeds 10 feet (3 m) in thickness . For this reason it i snot shown on plate 1 . The till yields little or no water .
Undifferentiated drift and alluvium (pl . 1) underlie the valleys of theHeart, Green, and Knife Rivers . The glacial drift reaches a maximum thick-ness of 278 feet (85 m) in test hole 140-092-06DAA and is mapped as de -posits that are dominantly sand and gravel and those that are mainly cla yand silt . Some till also occurs below the stream valleys . Dissected sand andgravel deposits form discontinuous terraces above the present-day flood plains .
Quaternary deposits along the Cannonball River, Thirty-mile Creek,and Chanta Peta Creek are probably less than 50 feet (15 m) thick and con-sist of clay, silt, sand, and gravel deposited as alluvium . The maximum thick-ness penetrated in test holes was 24 feet (7 .3 m) in 134-093-32CDD.
AVAILABILITY AND QUALITY OF GROUND WATER
Nearly all of the ground water from aquifers in Hettinger and StarkCounties is derived from precipitation . After precipitation falls on the earth' ssurface, part is returned to the atmosphere by evaporation, part runs off intostreams, and the remainder infiltrates into the ground . Some of the wate rthat enters the soil is held by capillarity and replaces water previously evapo-rated or transpired by plants . The excess water, if any, will infiltrate down -ward to the zone of saturation where it becomes available to wells .
Ground water moves under the influence of gravity from areas of rechargeto areas of discharge . Ground-water movement is generally very slow ; it maybe only a few feet per year . The rate of movement is governed by the hy-draulic conductivity of the material through which the water moves and b ythe hydraulic gradient . Gravel, fine to coarse sand, and fractured lignitegenerally are highly conductive . Deposits of these materials commonly formaquifers . Fine-grained materials such as siltstone, claystone, and shale usuallyhave low conductivity . In many ground-water circulation systems, horizonta l
21
strata of high conductivity may be separated by clay layers of much lowe r
conductivity . Clay layers can act in a manner similar to that of semipermeabl emembranes to cause the concentration of dissolved ions (McKelvey and Milne ,1962) in overlying strata as the water moves downward through the claylayers .
The water level in an aquifer fluctuates in response to recharge to an ddischarge from the aquifer . Aquifers exposed at land surface are rechargedeach spring and early summer by direct infiltration of precipitation . At thepresent time, recharge to these aquifers normally is sufficient to replac elosses caused by natural processes and by pumping of wells, although long -term trends of several years may develop during which there are net gain sor losses in storage . Aquifers that are confined by thick deposits of fine -grained materials, such as claystone or siltstone, are recharged very slowly .The rate of recharge may increase as heads in the aquifers are reduced b ypumping. However, head declines may continue for several years befor esufficient recharge is induced to balance the rate of withdrawal. In som ecases this balance may never be achieved without a curtailment of with-drawals .
The ground water in Hettinger and Stark Counties contains dissolve dmineral matter in varying degree. Rainfall begins to dissolve mineral matteras it falls, a process that continues as the water infiltrates through the soil .The amount and kind of dissolved mineral matter in water depends uponthe solubility, the temperature, the types of rocks encountered, the amoun tof carbon dioxide and soil acids in the water, the length of time the wate ris in contact with the rocks, ion-exchange reactions, and bacterial processes .
In most natural fresh water, calcium and magnesium are the principa lcations (Hem, 1970, p . 131-150) but they are commonly exchanged for sodiu min the ground-water reservoir in many areas . Sulfate is generally derivedfrom bacterial processes and weathering of shale and lignite, and is a commo nconstituent in water from shallow wells . Chemical reduction of sulfate b ybacteria (Hem, 1970, p . 158-159) removes sulfate from ground water an dreleases carbon dioxide, which increases the bicarbonate content .
Further in this report numerous references are made to ground-wate rtypes, such as sodium bicarbonate type, calcium bicarbonate type, etc . Theseclassifications are based on the predominant cation (sodium, calcium, ormagnesium) and anion (bicarbonate, sulfate, or chloride) dissolved in water,expressed in milliequivalents per litre .
The suitability of water for various uses is determined largely by th ekind and amount of dissolved matter . The chemical constituents, physicalproperties, and indices most likely to be of concern are : iron, sulfate, nitrate ,fluoride, dissolved solids, hardness, temperature, odor, taste, specific conduc-tance, sodium-adsorption ratio, and percent sodium . The source of the majorchemical constituents, their usability, and the limits recommended by the
22

U.S. Public Health Service (1962) are given in table 3 . Additional informa-tion regarding drinking water standards may be found in "Drinking WaterStandards" published by the U .S. Public Health Service (1962) . Water -quality criteria for public supplies, farmsteads, industrial, and agriculturaluse were established by the Federal Water Pollution Control Administratio n(1972) . Irrigation classifications in this report were derived by use of figure 6 .
Aquifers in Deposits of Cretaceous and Tertiary Age
Fox Hills and Basal Hell Creek Aquifer Syste m
Location, thickness, and lithology . – The Fox Hills Formation and th elower part of the Hell Creek Formation form a major aquifer system tha tunderlies all of the study area and extends into the adjoining counties (pls . 2
and 3). The aquifer system includes all the Fox Hills Formation and bed sthat occur below the Bacon Creek(?) Member of the Hell Creek Formatio n(Frye, 1969) . The aquifer system consists of fine- to medium-grainedsandstone that is generally interbedded with siltstone and claystone . The topof the aquifer system is as much as 1,520 feet (463 m) deep in well 139-097 -2OBC (pl . 2) in the northern part of the area, but is 1,120 feet (341 m) dee pin well 134-096-24CC (pl . 3) in the southern part of the area . The aquifersystem is 410 to 530 feet (125 to 162 m) thick along the lines of sectionand is overlain and confined by nearly impermeable beds of siltstone andclaystone that probably represent the Bacon Creek Member of Frye (1969) .
Hydrologic characteristics . – A map of the potentiometric surface of theFox Hills and basal Hell Creek aquifer system (fig . 7) indicates that groundwater generally flows into the study area from counties to the southwes tand moves eastward, except northwest of Dickinson where the gradient is t othe north. They hydraulic gradient at Richardton is about 12 ft/mi (2 m/km) .
In addition, the aquifer system probably is recharged by percolation through
confining beds from overlying aquifers in Hettinger and eastern Stark Counties .The aquifer discharges by underflow to the counties to the northeast, and
upwards into overlying aquifers in western Stark County .In September 1968, a specific capacity test was made of well 135-097-
04DCA. The well was pumped with a small submergible pump for 22 3minutes at a rate that initially was 7 gal/min (0 .4 Us), but gradually decline d
to 4.8 gal/min (0 .3 Us) . Drawdown at the end of the test was 5 .1 feet (1 .6 m) .Assuming an average discharge of about 5 gal/min (0.3 1/s), the specificcapacity was 1 (gal/min)/ft [0 .21 (1/s)/m] of drawdown . Water-level recoverywas nearly complete 6 minutes after pumping ceased .
Figure 8 shows the transmissivity of the aquifer system in Hettinge r
and Stark Counties . The values range from 110 ft2/d (10 m 2/d) near Belfield
to 390 ft2/d (36 m 2/d) at Gladstone and Schefield . The map was constructed
23

TABLE 3 . — Major chemical constituents in water — their sources, effect supon usability, and recommended concentration limit s
(Concentrations are in milligrams per litre )
(Modified after Durfor and Becker, 1964, table 2)
U.S . Public Health U.S . Public HealthService recommended Service recommendedlimits for drinking limits for drinkin g
Constituents Major source Effects upon usability water' Constituents Major source Effects upon usability water '
Silica Feldspar, ferromagnesian In presence of calcium and magnesium, Sulfate Gypsum, anhydrite, and Combines with calcium to form scale .(SiOs) and clay minerals . silica forms a scale that retards heat (SO .) oxidation
of
sulfide More than 500 mg/I tastes bitter andtransfer
in
boilers
and
on
steam minerals . may be a laxative. 250turbines .
Chloride(Cl)
Halite and sylvite In excess of 250 mg/I may impart salt ytaste,
greatly in excess may caus eIron Natural sources : Amphi- If more than 0 .1 mg/l iron is present ,(Fe) boles .
ferromagnesian it will precipitate when exposed to air : physiological distress. Food processin gminerals,
ferrous
and causing turbidity,
staining plumbing industries usually require less thanferric sulfides.
oxides, fixtures, laundry and cooking uten- 250 mg/I . 250
carbonates,
and
clayminerals .
Manmadesils, and imparting tastes and colorsto food and drinks . More than 0.2 mg/I
Fluoride Amphiboles,
apatite, Optimum concentration in drinking Recommended limits
sources :
well
casings, is objectionable for most industrial(F) fluorite, and mica . water has a beneficial effect on the depend on average
pump parts, and storagetanks.
uses .0.3
structure and resistance to decay onchildren 's teeth .
Concentrations inof maximum dailytemperatures. Limits
Calcium Amphiboles, feldspars, Calcium and magnesium combine withexcess of optimum may cause mottlin gof children's teeth .
range from 0.6 mg/Iat 32°C to 1 .7 mg /l
(Ca) gypsum, pyroxenes, cal- bicarbonate,
carbonate,
sulfate,
and at 10°C .cite, aragonite, dolomite ,and clay minerals .
silica to form scale in heating equip -ment. Calcium and magnesium retard
Nitrat e(NOa)
Nitrogenous fertilizers ,animal excrement, leg-
More than 100 mg/l may cause a bitte rtaste and may cause physiological
Magnesiu m(Mg)
Amphiboles,
olivine ,pyroxenes,
dolomite,the suds-forming action of soap. Highconcentrations of magnesium have a
umes, and plant debris. distress .
Concentrations greatly i nexcess of 45 mg/1 have been
re -magnesite,
and
clay laxative effect.ported to cause methemoglobinemi a
minerals.in infants . 4 5
Sodium(Na)
Feldspars, clay minerals ,and evaporites.
More than 50 mg/I sodium and potassiu mwith suspended matter causes foam-
Boron Tourmaline, biotite, and Many plants are damaged by mncen-
Potassium Feldspars,
feldspathoids, ing, which accelerates scale formation(B) amphiboles . trations of 2 .0 mg/I.
(IC) some micas,
and clay and corrosion in boilers . Dissolved Anything that is soluble. More than 500 mg/I is not desir -minerals . solids able
if better
water
is
available .
Bicarbonate Upon heating of water to the boilingLess than 300 mg/1 is desirable for som e
(HCOs) point, bicarbonate is changed to steam,manufacturing processes .
Excessive
Carbonate Limestone and dolomite . carbonate, and carbon dioxide . Car -dissolved solids restrict the use o fwater for irrigation . 50 0
(COa) bonate combines with alkaline earths(principally calcium and magnesium) 'U .S. Public Health Service, 1962 .to form scale.

FIGURE 6.- Classification of irrigation water .
100
2
3
4 5 6 7 8 9 1000
2
3 4 5000
30I
-I
I
I
I
I 1
I
I
I I
I -
28- CI-S4 -
26 C2-S4 -
24 - C3-S4 -
22 - C4-S4
_
20-CI-S3
-
18 -a
zo
16-
C2-S3
-N ra
co 14 -o CI-S2 C3-S3
-
a
12 -
~ C2-S2 C4-S 3
10 -
8C3-S2
6 C4-S2
-
4
CI-S I
- C2-SI -
2 -
C3-SI
C4-S I
0 I I
I
I
I
l! 1
1
I I
I100
250
750
225 0
9sCON DU CTIV ITY-MICROM H OS/CM . (ECX10 6 )AT 25° C
I 2 3 4
LOW MEDIUM HIGH VERY HIGH
SALINITY HAZARD
25
FROM U.S. SALINIT YLABORATORY STAFF,1954
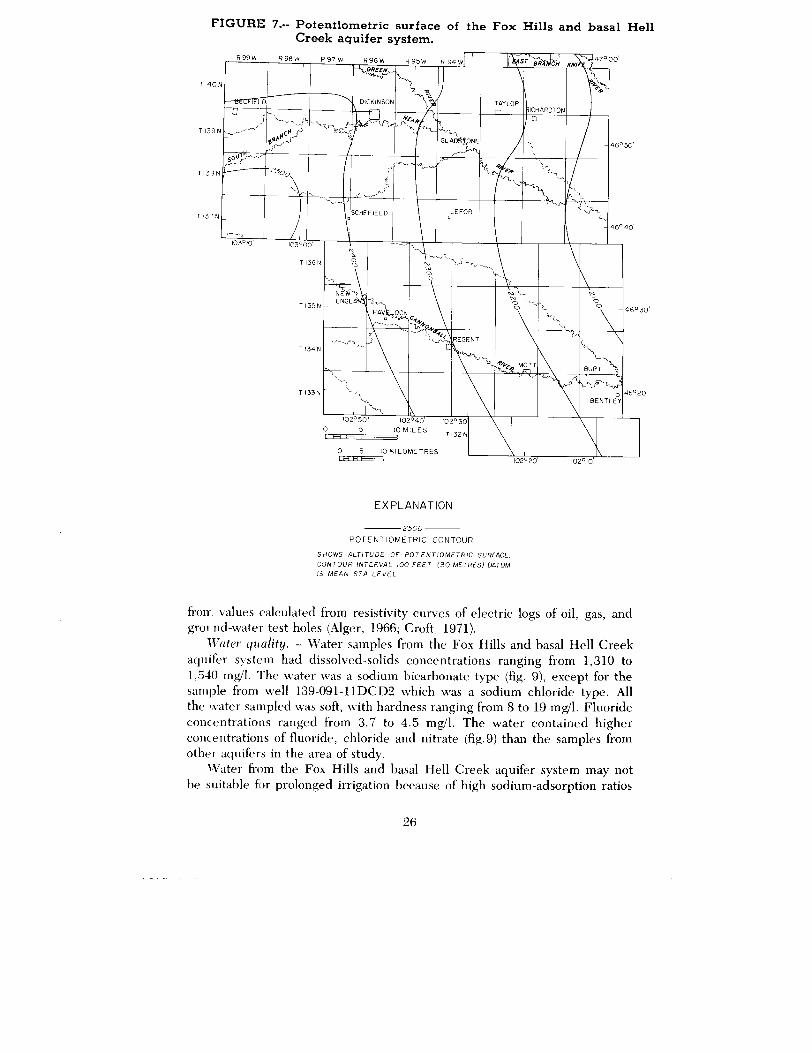
FIGURE 7.-- Potentiometric surface of the Fox Hills and basal Hel lCreek aquifer system .
R99W
R96W
R97W
R96W
47°00 '
~D
.
•
GREEN
DICKINSON TAYLOR
mm~
..n R
Imo,
wmr,711!Y
rig&
ICHARDTONO
46°50 '
S OU 'i-
T 25 po }'..
SCHEFIELD LEFOR
46°40 '
103°10'
103°0 0
T 136 N
N
ow
T 135N
NEW'ENGL . -
OCK
No46 °--,
REGEN TT134N
i-e
MOT T
T133N°-r~ 1IM BENTLEY4° 2
102°50
102°40
102 0 3 00
5
10 MILES
7132 N
0
5
10 KILOMETRES 1 ,102°20
102°1 0
EXPLANATIO N
2500POTENTIOMETRIC CONTOU R
SHOWS ALTITUDE OF POTENTIOMETRIC SURFACE.CONTOUR INTERVAL 100 FEET (30 METRES) DATUMIS MEAN SEA LEVE L
from values calculated from resistivity curves of electric logs of oil, gas, an dground-water test holes (Alger, 1966 ; Croft, 1971) .
Water quality . – Water samples from the Fox Hills and basal Hell Cree kaquifer system had dissolved-solids concentrations ranging from 1,310 t o1,540 mg/l . The water was a sodium bicarbonate type (fig . 9), except for thesample from well 139-091-11DCD2 which was a sodium chloride type . Al lthe water sampled was soft, with hardness ranging from 8 to 19 mg/1 . Fluorideconcentrations ranged from 3 .7 to 4.5 mg/l . The water contained higherconcentrations of fluoride, chloride and nitrate (fig .9) than the samples fromother aquifers in the area of study .
Water from the Fox Hills and basal Hell Creek aquifer system may no tbe suitable for prolonged irrigation because of high sodium-adsorption ratio s
T 14 0
T139 N
T1313 N
T137N
o.
0 '
2 6

FIGURE 8 .-- Transmissivity of the Fox Hills and basal Hell Creekaquifer system .
EAS TR99W R98W R 97 W R96W R95W R 94
R 93 R92np
H
R 9137° 00'
T139 N
T138 N
T137 N
T 140 N
—
BELFIELO
OREE~
DICKINSON
9T;'.. 1
AY LORRICHA' ITO N
NKNGLAr ONE _
S~
.
300
&I&i
G""'n
I
ry0 SCHEFIELD ~LEFOR1 T
~~
T136 N
T135 N
T134 N
T133 N
103°00
46°5 0
46°4 0
-46°30 ''O
0
BURT
0BENTLEY
46°2 0
0
102°5 05
102°4 010 MILES
102°30
T132 N
0
10 KILO METRES102°20
102°I C
EXPLANATION
20 0
LINE OF EQUAL TRANSMISSIVIT Y
DASHED WHERE INFERRED. INTERVAL 100ff 2 (9.2)
(fig . 6) and high residual sodium carbonate . Sodium-adsorption ratios rangedfrom 58 to 92, and therefore, the values were too large to plot in figure 6 .
Utilization and potential for future development . – Only two wells areknown to be withdrawing water from the Fox Hills and basal Hell Cree kaquifer system in the two-county area — both supply water for rest-sto pfacilities along Interstate Highway I-94 in Stark County . The aquifer systemhas not been used more extensively in Hettinger and Stark Counties becaus eof its depth and the general availability of satisfactory supplies from shallowe raquifers . However, the aquifer system is more widely developed in som eadjoining counties .
Small withdrawals from the aquifer system will cause large declines inhead. The yield, in gallons per minute, of an efficient, fully penetratin g
2 7
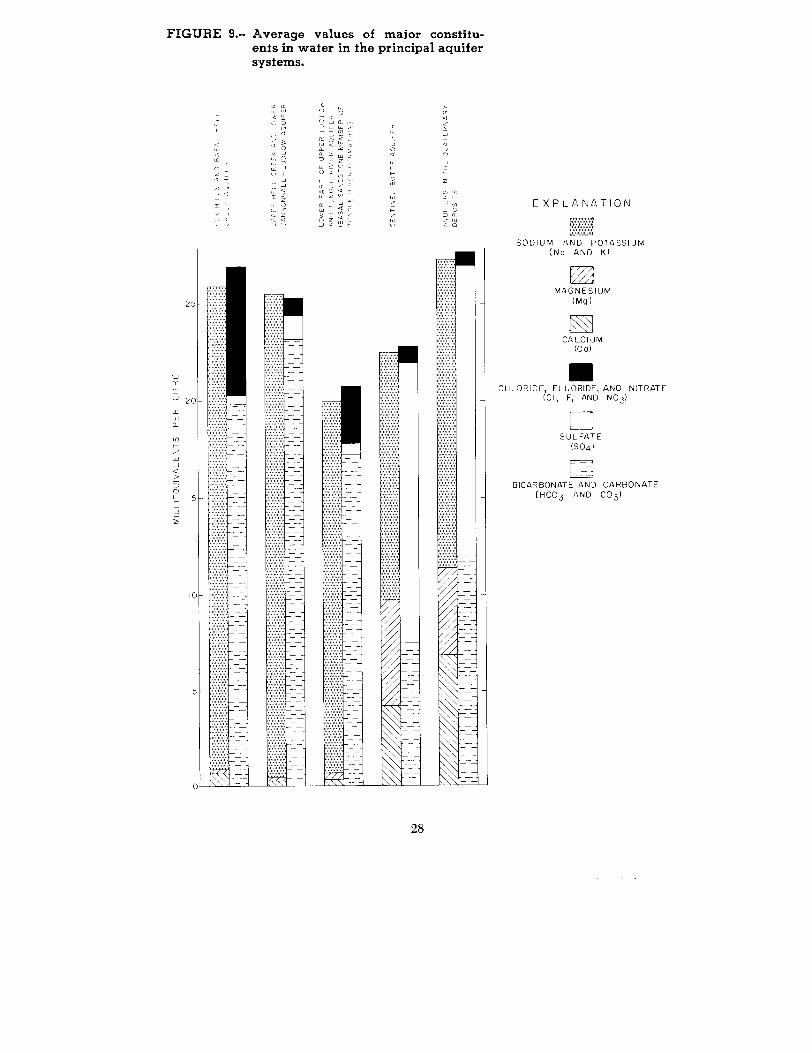
FIGURE 9 .-- Average values of major constitu-ents in water in the principal aquife rsystems.
EXPLANATIO N
SODIUM AND POTASSIU M(No AND K )
7
MAGNESIU M(Mg )
CALCIU M(Co )
IICHLORIDE, FLUORIDE, AND NITRAT E
(CI, F, AND NO3)
[SULFAT E
(304 )
BICARBONATE AND CARBONAT E(HCO3 AND CO3 )
28
well with 50 feet (15 m) of drawdown after 24 hours of pumping may b eapproximated at any given location on the transmissivity map (fig . 8) bydividing the transmissivity by 5 .3. Wells tapping thr aquifer system shoul dyield 25 to 75 gal/min (2 to 5 1/s) .
Upper Hell Creek and Lower Cannonball-Ludlow Aquifer System
Location, thickness, and lithology. – The upper Hell Creek and lowe rCannonball-Ludlow aquifer system underlies all of Hettinger and Stark Coun-ties . Nearly impermeable beds of siltstone and claystone, which probablyrepresent the Bacon Creek Member of the Hell Creek Formation (Frye ,1969), separate the aquifer system from the underlying Fox Hills and basalHell Creek aquifer system. At Regent (pl . 3) the top of the upper HellCreek and lower Cannonball-Ludlow aquifer system is about 710 feet (216 m )below land surface . It is 280 to 530 feet (85 to 162 m) thick (pl. 2). Theaquifer consists of beds of fine- to medium-grained sandstone in the uppe rpart of the Hell Creek Formation and beds of fine-grained sandstone an dlignite in the lower part of the Cannonball and Ludlow Formations . Thesandstone throughout the aquifer system is interbedded with siltstone andclaystone . Thick beds of nearly impermeable siltstone and claystone formin gthe middle and upper parts of the Cannonball Formation overlie and confinethe aquifer system .
Hydrologic characteristics . – Most of the recharge to the aquifer syste mis underflow from counties to the southwest and from seepage through th eCannonball Formation from overlying aquifer systems . A map of the potentio-metric surface of the aquifer system (fig . 10) was constructed for Hettinge rand Stark Counties . The contours indicate that ground water is moving fro mthe southwest to the northeast . The gradient is about 8 ft/mi (2 m/km). InHettinger and eastern Stark Counties the head in the upper Hell Creek an dlower Cannonball-Ludlow aquifer system is higher than the head in the Fo xHills and basal Hell Creek aquifer system (figs . 7 and 10) . At Regentthe head is about 100 feet (30 m) higher . There probably is percolation intothe underlying Fox Hills and basal Hell Creek aquifer system in this areabecause of the higher head. However, in western Stark County the potentio-metric maps indicate that the head is lower . The potentiometric map (fig .10) indicates the aquifer discharges by underflow to the counties to th enortheast .
The effective particle diameter of three cores from well 134-094-08DC C(table 2) ranged from 0.002 to 0 .09 mm. Charts compiled by Johnson (1963 ,figs . 21 and 22) suggest that the three core samples have hydraulic conduc-tivities of 1 to 19 ft/d (0.3 to 6 m/d) assuming a porosity of 35 percent . Draw-down data are available for two wells. Well 136-092-02CDA has a specific
29

FIGURE 10: - Potentiometric surface of the upper Hell Creekand lower Cannonball-Ludlow aquifer system .
R93W
R92W
R91 W
R99W
R98W
R 97 W
R96W
R9
4WI
EAST BR CN
IE 47°00 '
BELFIELD
GREEN
DICKINSON TAYLORRICHARDTON
<LLLL` +
fp
u
-
_
00'1
-GLAY" ON E
-5 0LJ `~
SCHEFIELD LEFOR
103°0 0
T140 N
T139 N
T138 N
7137N
46°50 '
46°4 0
T 136 N
T135 N
T134 N
T 133 N
5 10 KILOMETRE S
EXPLANATIO N
2500 -
POTENTIOMETRIC CONTOU R
SHOWS ALTITUDE OF POTENTIOMETRIC SURFACE.
DASHED WHERE INFERRED . CONTOUR INTERVAL 10 0FEET (30 METRES) . DATUM IS MEAN SEA LEVE L
capacity of 0 .2 (gal/min)/ft [0 .04 (1/s)/m] of drawdown, and well 137-091-13ACC 2has a specific capacity of 0 .33 (gallmin)/ft [0 .07 (lls)/m] .
Water quality. – Analyses of water samples from seven wells tapping th eaquifer system indicated (fig . 9) that the water was a sodium bicarbonat etype . In these samples sodium and potassium constituted about 98 percen tof the cations, and carbonate and bicarbonate constituted 92 percent of th eanions . Sulfate constituted about 5 percent of the anions . Sulfate conten twas low, possibly due to sulfate reduction by bacteria . Chloride, fluoride ,and nitrate constituted about 3 percent of the anions .
Dissolved solids ranged from 1,450 to 1,890 mg/1, and the median valu ewas 1,500 mg/l . The samples contained 4 .8 to 127 mg/1 sulfate and 0 .8 to5,8 mg/1 fluoride . The median value for fluoride was 2 .4 mg/1 . The water was
30

soft; most samples had a calcium carbonate hardness of less than 20 mg/l .Boroyi ranged from 0 .9 to 1 .9 mg/1 and iron ranged from 0 to 1 .3 mg/1 .Sodium-adsorption ratios ranged from 25 to 130, and the median was 76 .Because most of the sodium-adsorption ratios were high, the samples werenot classified for irrigation purposes in figure 6. Color values of four samplesranged from 20 to 270.
Utilization and potential for future development . – Several livestock anddomestic wells and a public supply well at Regent tap the aquifer syste mfor water supplies . In general the aquifer system is practically undeveloped .Wells tapping the aquifer system should yield as much as 100 gal/min (6 Us) .Flowing wells for livestock and domestic use have been drilled in the lowes tpart of the valley of the Green River southwest of Richardton. Well 137-091-13ACC2, which is 640 feet (195 m) deep, had a head of 46 feet (14 m )above land surface in 1968 . Other flowing wells could be drilled in low area salong the river .
Upper Ludlow and Tongue River Aquifer System
Location, thickness, and lithology. – The aquifer system includes beds i nthe upper part of the Ludlow Formation and all of the Tongue River Forma-tion. It underlies all of Hettinger and Stark Counties (pls . 2 and 3) . In thesouthern part of the area the aquifer system is unconfined . It consists of fine-to medium-grained sandstone, siltstone, and fractured lignite interbedde dwith claystone . The sandstone has a low hydraulic conductivity . The aquife rsystem is as much as 430 feet (131 m) thick (pl . 2). Included is the basalsandstone member of the Tongue River Formation, which is 199 feet (61 m )thick in well 137-091-13ACC2 .
Hydrologic characteristics. – The upper Ludlow and Tongue River aquife rsystem is recharged directly by precipitation and, where the aquifer syste mis exposed at the surface, by seepage from lakes, streams and reservoirs .A map of the potentiometric surface of the aquifer system (pl . 4A, in pocket)was constructed for Hettinger and Stark Counties using only wells tappin gthe lower part of the aquifer system . Many shallow wells tapping beds in th eupper part of the Tongue River Formation and wells in the overlying Sentine lButte aquifer system have higher heads than those shown on the potentio-metric map, indicating that water is moving downward through the rock sand recharging the aquifer system . The contours on the map indicate thatground water generally is moving from the southwest to the northeast. Thehead in the aquifer system is as much as 100 feet (30 m) higher than thehead in the underlying aquifer system in the southwestern part of the area(pl . 4A, and fig. 10) ; indicating that some water may be percolating down -ward to the upper Hell Creek and lower Cannonball-Ludlow aquifer system .
31

The contours show a depression caused by pumping at Belfield . In the north -eastern part of the area the heads in the two aquifer systems are approxi-mately equal .
The specific capacities, reported by drillers, of wells tapping the aquife rsystem in Hettinger and Stark Counties ranged from 0 .01 to 7.2 (gal/min)/ft [0 .002 to 1 .5 (l/s)/m] of drawdown and averaged about 0 .4 (gal/min)/ft[0 .08 (l/s)/m] of drawdown . The highest specific capacity is for well 133-091 -19BCD, which reportedly yielded 36 gal/min (2 1/s) with 5 feet (2 m) o fdrawdown from a 60-foot (18-m) sandstone bed in the upper part of th eTongue River Formation . Charts compiled by Johnson (1963, figs . 20 and 22)were used to estimate hydraulic conductivity of cores from wells 132-092 -21DDD2 and 134-096-25BBB2. The median particle size of the cores suggest sthat the hydraulic conductivity should range from 0 .1 to 27 ft/d (0 .03 to 8mid), while charts based on effective diameter (Johnson, 1963, figs . 21 and23) indicate a hydraulic conductivity range of about 1 to 4 ft/d (0 .3 to 1 m/d) .
The transmissivity values shown on plate 4B for the basal sandston emember of the Tongue River Formation were calculated from resistivit ycurves of electric logs of oil, gas, and ground-water test holes . Transmis-sivities (pl . 4B) range from 70 ft2/d (7 m2/d) southwest of Mott to 530 ft 2 /d(49 m2/d) at Belfield and south of Gladstone . The transmissivity lines of high-est value, which are aligned in an east-west direction through central an deastern Stark County, show the location of thick beds of permeable sand tha tmay have been deposited in an ancient stream channel . Well tapping theaquifer system should yield 1 to 100 gal/min (0 .1 to 6 .3 Us) .
Water quality . — Analyses of 13 water samples from wells tapping th ebasal sandstone member of the Tongue River Formation are plotted on atrilinear diagram (fig. 11) . Sodium and potassium constituted more than 8 1percent of the cations in all samples . In the wells greater than 300 feet (91 m )in depth, sodium and potassium constituted more than 98 percent of th ecations . Although the analyses were not plotted on the trilinear diagram ,water from shallow wells tapping the upper part of the aquifer system com-monly contained several hundred milligrams per liter calcium and sulfate .In the water samples obtained from the basal sandstone, most of the calciumand magnesium probably was removed by cation exchange as the waterpassed through beds of siltstone and claystone at shallow depth . Figure 9indicates that water in the basal sandstone member of the Tongue RiverFormation has fewer dissolved constituents than that in the overlying Sen-tinel Butte aquifer . This may be due to removal of ions as the water move sdownward through clay layers .
Bicarbonate and carbonate (fig . 11) ranged from 52 to 97 percent of th eanions, and sulfate ranged from less than 1 to 47 percent of the anions .Chloride constituted less than 5 percent of the anions in the samples . Water
32

Depth(fti below
Dissolved
Well
land
solidsNo .
number
surface)
(mg/1 )
AVAVAAVAVAV& ,
~
AVMAA---A----
A
o
AVAVAVAVAVAAVAWAVAT-TA
c&G
,6
2,5-13
II -
,?
ep CI
18,1
To convert feet to metres multiply th eCATIONS
PERCENTAGE REACTING VALUES
ANIONS
1
132-092-09AAA
225
101 0
2
133-092-05BAA2
310
1080
3
133-095-19DDD
214
121 0
4
133-097-09AAA2
221
704
5
134-091-06DDC2
474
1470
6
134-093-35DCD
378
1230
7
135-091-20ACB
420
131 0
8
137-094-04CBC
531
1380
9
138-092-32DDD
552
1360
10
138-093-24AAC
383
1150
11
139-094-08DBC2
650
1180
12
139-099-05ABC
680
1050
13
140-092-14ACC2
424
1200
feet by 0 .3048 .
FIGURE 11 .- Major constituents in water from the basal sandstone member of the Tongue River Formation.

changes in anionic composition as it moves through the sandstone, as indi-cated by chemical diagrams on plate 4A . The pattern of each chemical dia-gram is determined by the percentage of individual anions or group of anions .As the water moves downgradient, the concentration of sulfate generall ydecreases . The percentage of bicarbonate and carbonate in the water in -creases . In well 133-097-09AAA2, in southwestern Hettinger County, sulfat econstituted about 22 percent of the anions, bicarbonate and carbonate abou t76 percent of the anions, and chloride constituted 2 percent of the anions .The concentration of sulfate was 134 mg/1 . In Stark County most of thechemical diagrams have a different pattern . In well 137-094-04CBC, sulfat econstituted about 1 per cent of the anions, bicarbonate and carbonate abou t97 percent of the anions, and chloride about 2 percent of the anions . Theconcentration of sulfate was 9 .9 mg/1 . The decrease in sulfate and the increas ein carbonate may be due to sulfate reduction by bacteria (Hem, 1970, p .158-159 ; Kuznetsov and others, 1963) .
Dissolved solids for the samples plotted on the trilinear diagram (fig . 11 )ranged from 704 to 1,470 mg/1 . The median value for dissolved solids was1,080 mg/l . Water from well 132-092-09AAA contained 372 mg/1 sulfate ,and the water from well 139-094-08DBC2 contained 0 .4 mg/1 sulfate . Mostof the water sampled was soft ; calcium carbonate hardness ranged from 1 0to 56 mg/l . However, water from well 132-092-09AAA, which is in the south-east corner of Hettinger County, had a calcium carbonate hardness of 15 8mg/1 . Fluoride ranged from 0 .1 to 5 .8 mg/1, boron from 0 .48 to 1 .5 mg/1, an diron from 0 .07 to 2.3 mg/l . Sodium-adsorption ratios ranged from 10 to 69 ,had a median value of 55, and were generally too large to plot in figure 6 .Many water samples were colored . Color values ranged from 5 to 7,00 0units .
Utilization and potential for future development . – About 60 percent ofthe wells inventoried in Hettinger County and about 11 percent of thosein Stark County obtain water from the aquifer for livestock and domesti cuse. Two municipal wells at Belfield tap the basal sandstone member of theTongue River Formation . This member probably has the greatest potentialfor development of any aquifer above the Fox Hills and basal Hell Cree kaquifer system. Wells tapping the sandstone should yield as much as 10 0gal/min (6 1/s ; pl . 4B) .
Flowing wells constructed for livestock and domestic use tap the basa lsandstone member in the valleys of the Heart, Cannonball, and Little KnifeRivers and several of their tributaries in Hettinger County and eastern Star kCounty (pl . 4A). Also outlined are other areas where flowing wells coul dprobably be drilled . Allowing wells to flow indiscriminately wastes water an dreduces the head .
34

Sentinel Butte Aquifer System
Location, thickness, and lithology . – The Sentinel Butte aquifer syste munderlies most of Stark County and the northern and central parts of Het-tinger County (fig . 5). The aquifer system consists of fine to very fine graine dsandstone and fractured lignite . Water-bearing sandstone beds can be foun dat various horizons in the Sentinel Butte Formation, but the most persis-tent sandstone occurs at the base of the formation (fig. 4). The aquifersystem is as much as 245 feet (75 m) thick (pl . 2) .
Hydrologic characteristics. – The Sentinel Butte aquifer system is re -charged directly by precipitation and by seepage from lakes, streams, an dreservoirs . A hydrograph of well 140-095-08AAA (fig . 12) shows that thewater level rises in the spring during the thaw and following periods of pre-cipitation . The water level is lowest during the fall and winter months whe nprecipitation is light .
Lindvig (1964) described an aquifer test in the aquifer near Dickinson .The test well (140-096-31DBD) was drilled to a depth of 88 feet (27 m) andscreened in the lower 30 feet (9 m) . The producing zone consisted of 4 7feet (14 m) of medium-grained sandstone interbedded with clay. The wel l
17
5.2 1
_
r
-_ _
-
-
1 N D -T-J D J A
1968 1969 1970
25 4229 N203 w178 cc152 7 wg1 210 276 J51 22 50
DASHED LINE INDICATE SNO RECORD
140-095-08AAA5.5 2
6.14
W
5.83
6 .4 5
35

was pumped for 1,100 minutes at a maximum rate of 80 gal/min (5 1/s) . Draw-down was 40 feet (12 m). Values for transmissivity between 440 and 82 0ft2 /d (41 and 76 m2/d) and storage coefficient between 0 .0007 and 0 .008were calculated from the observation-well data .
Dickinson municipal wells tap the same sandstone beds . McLaughlinand Greenlee (1946, p . 19-23) described aquifer tests made on two well sin the city field, Dickinson 3 (139-096-03BBC2) and Dickinson 7 (139-096-04ACA). Well 3 was pumped for 49 hours at an average rate of 10 5gal/min (7 1/s) during the test . The transmissivity calculated from re-covery data of three observation wells was 1,130 ft2/d (105 m 2 /d), andthe storage coefficient was 0 .001 . Well 7 was pumped for 44.5 hours at130 gal/min (8 1/s) . The transmissivity calculated on the basis of thi stest was 600 ft2/d (56 m 2/d) and the storage coefficient was 0 .016 .
In November 1958, an unpublished aquifer test was made using amunicipal well at New England. New England 1 (135-097-04DBA1) wa spumped for about 37 hours . The pumping rate was about 50 gal/mi n(2 I/s) . The static water level in the pumped well was 37.6 feet (11 m) ,and the drawdown at the end of the test was 10 .24 feet (3 .1 m) .
The specific capacities of numerous wells tapping the Sentine lButte aquifer system were determined from yield and drawdown dat areported by drillers . The values ranged from 0 .01 to 9 .5 (gal/min)/ft[0 .002 to 1 .97 (1/s)/m] of drawdown. The average was 0.75 (gal/min)/ft[0 .16 (1/s)/m] . The values were not adjusted for well diameter, and th elength of pumping period varied considerably .
Wells in the Dickinson field have specific capacities as large as 9 . 5(gal/min)/ft [1 .97 (1/s)/m] of drawdown and wells in the New Englan dmunicipal system have specific capacities as large a 8 (gal/min)/ft [1 .66(1/s)/m] of drawdown . Considerable effort was made to obtain highl yefficient wells in these fields, and it is apparent that design and develop-ment was a major factor in obtaining the large specific capacities .
Water quality. – Forty-two water samples were collected from the Sen-tinel Butte aquifer system . Analyses of these samples indicated that thewater generally was a sodium sulfate type (fig . 9) . Sodium and potassiumconstituted about 57 percent of the cations in the average sample . The per-centage of calcium and magnesium in the average sample was higher than i nthe samples from the underlying aquifers . Sulfate was the major anion .
Thirteen representative analyses from the aquifer system are plotted ona trilinear diagram (fig . 13) to show the variable character of the water andthe change in cation concentration with depth . Sodium and potassium con-stituted more than 75 percent of the cations in wells greater than 150 fee t(46 m) in depth due to exchange of calcium and magnesium for sodium .Sulfate constituted 17 to 87 percent of the anions in the samples and theconcentration in many of the samples was higher in the shallower wells .Chloride constituted less than 10 percent of the anions in all but one sample .
36

I0
Depth(ft'below
Dissolved
Well
land
solids
No .
number
surface)
(mg/1 )
IVAAVAVA
AlFAVAVAATAVAVAVA
&TAVAVATAVAIFAVAVAVAVAVA
AVATAVAVAVAVAVAAYAVAWWWAYAYMMAYA
AVAVAVAVAVAVAVAVAVA
60
Sentinel Butte aquifer1 135-092-08CCD 80 522
15309751670373013501400
39058 5
15701890
2
135-094-28CBB2
603
135-097-04ADD1
1054
136-093-02CBC
202
5
136-093-22AAA2
1226
136-094-03DDD
224
7
137-094-22DAC3
21 8
8
137-094-328881
11 2
9
137-098-04BAC
12 0
10
140-098-01DCC3
21 0
11
140-098-19AAB3
150
20
Glacial-drift and alluvial aquifer s
12
139-096-12ABD
25
198013
139-097-14DAB
30
185014
140-092-06DAA
278
2000
15
140-092-01BAA
101
2130
ANIONSPERCENTAGE REACTING VALUESCATIONS
'To convert feet to metres multiply thefeet by 0 .3048 .
FIGURE 13 .-- Major constituents in water from the Sentinel Butte aquifer system and from aquifers in deposit s
of Quaternary age.

Dissolved solids for the samples ranged from 378 to 11,700 mg/1 and ha da median value of 1,050 mg/1. Sulfate ranged from 42 to 7,980 mg/1 and hada median value of 417 mg/1 . Calcium carbonate hardness ranged from 15 to6,000 mg/1 and had a median value of 225 mg/1 . Although fluoride rangedfrom 0.0 to 6.7 mg/l, most of the water from the aquifer did not containexcessive fluoride . The samples contained 0.0 to 2.1 mg/1 boron . Sodium -adsorption ratio ranged from 0 .2 to 67 . Much of the water was yellowto dark brown due to organic compounds . Color values ranged from 5 t o3,200.
Utilization and potential for future development . – About 38 percent ofthe wells inventoried in Hettinger County and about 79 percent of the well sinventoried in Stark County tap the Sentinel Butte aquifer system for live -stock and domestic supplies . Most of these wells probably yield less than 50gal/min (3 1/s) from beds of sandstone or fractured lignite . Municipal well sat New England and Dickinson developed in the aquifer system have yielde das much as 100 gal/min (6 1/s) . Part of the water supply for the city of Richard -ton is obtained from lignite beds in the Sentinel Butte aquifer system .
Golden Valley Aquifer System
Shallow wells penetrate the Golden Valley Formation in southwesternStark County, in the area west of Lefor in south-central Stark County, andin adjoining parts of northwestern Hettinger County . Logs of wells produc-ing water from the aquifer system are not available, but sandstone and thi nlignite beds in the lower part of the formation probably are the majo rsources of water . Well tapping the aquifer yield only small quantities of water .
Three partial analyses of water from the Golden Valley aquifer syste mare reported by Trapp (1971, table 5). The water from well 138-096-20AAD3had a specific conductance of 1,220 micromhos/cm at 25°C and was probabl ya calcium sulfate type. The water from well 138-096-20AAD4 had a specificconductance of 2,000 micromhos/cm at 25°C and was probably a sodiu msulfate type. The analysis of the water from well 139-097-34ACA2 showe dthat it was a bicarbonate type with a specific conductance of 824 micromhos/c mat 25°C. Sulfate constituted about 44 percent of the anions .
White River Aquifer System
The White River Formation forms the rimrock of scattered high butte sand underlies a relatively small area of southwestern Stark County . For thisreason, it is not a major aquifer system in the area . Only a few shallowwells in southwestern Stark County obtain water from the aquifer system ,which consists of a few thin beds of sandstone .
38

Denson and Gill (1965, table 9, p . 62) published a chemical analysis o fwaterfrom a well, probably 137-097-18ABA2, which evidently taps th eWhite River . The anion concentrations were not given, but various trac eelements were determined . It was a sodium type water and contained 320mg/1 dissolved solids and 13 ug/1 (micrograms per litre) dissolved uranium .The water also contained 7 ug/1 of dissolved arsenic and dissolved selenium .The source of the high uranium and other trace elements probably is bed sof volcanic ash .
Undifferentiated Lignite Aquifers in the Tongue River an dSentinel Butte Formation s
Many livestock and domestic wells in the rural areas tap fractures andjoins in undifferentiated beds of lignite for water supplies . The yield from
most of these wells is probably less than 10 gal/min (0.6 1/s), but is sufficientfor the intended use .
Water from lignite aquifers is highly variable in chemical quality ; con-ductivity measurements of 71 samples ranged from 210 to 6,200 micromhos /cm at 25°C . The median was 1,700 micromhos/cm at 25°C . Dissolved solid sranged from 522 to 1,900 mg/l and had a median value of 1,190 mg/l . Muchof the water was light to dark brown, due to organic compounds . Colorvalues ranged from 1 to 7,000 and had a median value of 190.
Aquifers in Deposits of Quaternary Age
Deposits of Quaternary age underlie the major streams in Hettinger and
Stark Counties (pl . 1) . Test holes drilled into these deposits penetrated onlythin beds of sand and gravel beneath the valleys of the Heart, Knife, an dGreen Rivers near Dickinson and the Cannonball River near Mott . Thesebeds of sand and gravel are adequate for small water supplies, such as
livestock and domestic needs .Test holes drilled into deposits of Quaternary age in northeastern Star k
County penetrated mainly till, clay, and silt, with the exception of three test
holes. Test hole 140-092-06DAA penetrated 174 feet (53 m) of medium san dand gravel between depths of 104 and 278 feet (32 and 85 m) . A nearbytest hole at 06DAD penetrated 50 feet (15 m) of clayey sand . Test hole 140 -092-01BAA penetrated a total of 64 feet (20 m) of water-saturated sand be-tween 43 and 124 feet (13 and 38 m). These sand and gravel beds are con -fined to glacial melt-water channels and their areal extent is unknown .
Water-level fluctuations in well 140-092-06DAA are shown in figure 14 .The water level rises in the spring during the thaw and during periods o fprecipitation and is lowest during the fall and winter months when precipita-tion is light.
39
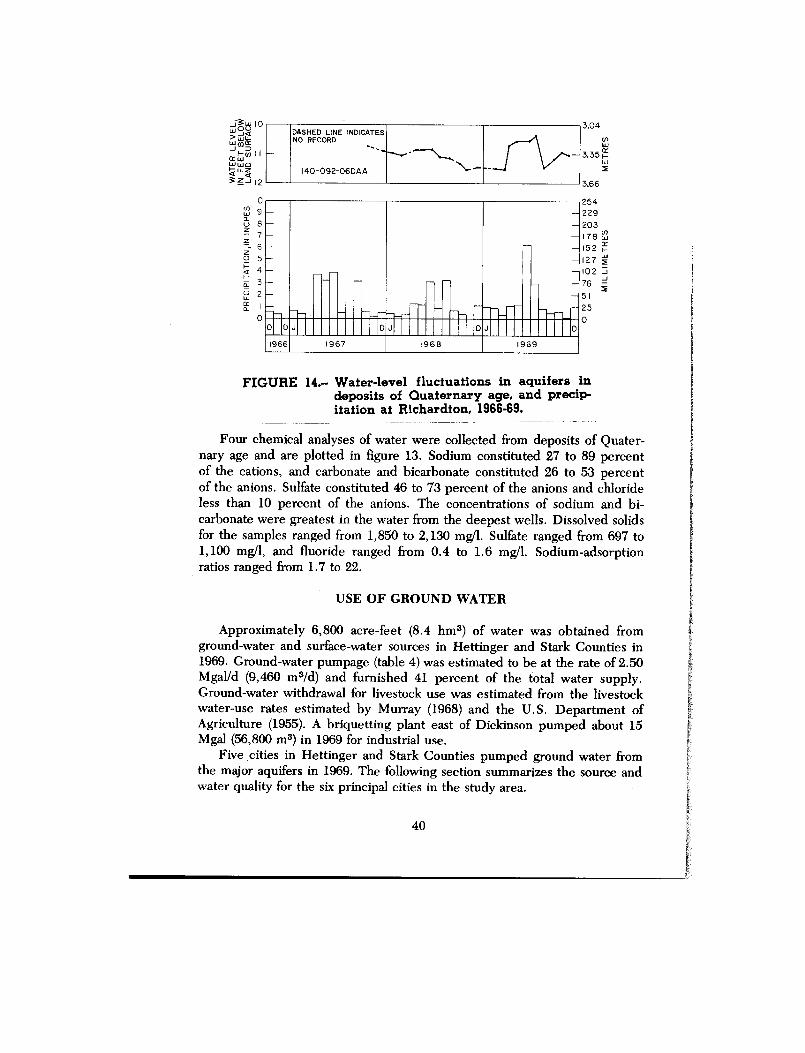
W o0 1 0
ww ~Jm 0¢w (n 1 1rw0
3z< l2
3.04
W3.351T
w2
3.6 6
DASHED LINE INDICATESNO RECORD
I40-092-06DA A
0 D
D
D J
25 4-229
- 20 3- 178 w- 152 H- 12 7
-102 =
- 76J_
- 5 1
- 2 5
0
1966
1967
1968
196 9
FIGURE 14 .- Water-level fluctuations in aquifers i ndeposits of Quaternary age, and precip-itation at Richardton, 1966-69 .
Four chemical analyses of water were collected from deposits of Quater-nary age and are plotted in figure 13 . Sodium constituted 27 to 89 percen tof the cations, and carbonate and bicarbonate constituted 26 to 53 percen tof the anions . Sulfate constituted 46 to 73 percent of the anions and chlorideless than 10 percent of the anions . The concentrations of sodium and bi-carbonate were greatest in the water from the deepest wells . Dissolved solidsfor the samples ranged from 1,850 to 2,130 mg/1 . Sulfate ranged from 697 to1,100 mgll, and fluoride ranged from 0.4 to 1 .6 mg/1 . Sodium-adsorptionratios ranged from 1 .7 to 22 .
USE OF GROUND WATE R
Approximately 6,800 acre-feet (8 .4 hm3) of water was obtained fromground-water and surface-water sources in Hettinger and Stark Counties i n1969 . Ground-water pumpage (table 4) was estimated to be at the rate of 2 .50Mgal/d (9,460 m3/d) and furnished 41 percent of the total water supply .Ground-water withdrawal for livestock use was estimated from the livestoc kwater-use rates estimated by Murray (1968) and the U.S. Department ofAgriculture (1955) . A briquetting plant east of Dickinson pumped about 1 5Mgal (56,800 m 3 ) in 1969 for industrial use .
Five ,cities in Hettinger and Stark Counties pumped ground water fro mthe major aquifers in 1969 . The following section summarizes the source an dwater quality for the six principal cities in the study area .
40

TABLE 4. — Estimated use of ground wate rin million gallons per day in 1969
Livestock 1 .25Rural, self supplied .40Uncontrolled flowing wells .35Belfield, city of .19Mott, city of .12New England, city of .10Industrial and commercial,
self supplied .04Richardton, city of .03Regent, city of .02
Total 2 .50
Belfield
The city of Belfield has two wells, 139-099-05ABC and 139-099-05ADC ,that obtain water from sandstone at the base of the Tongue River Formation .The city reported a total withdrawal of about 70,700,000 gallons (268,000 m3)in 1969, for an average of about 194,000 gal/d (734 m 3 /d). Per capita use isabout 170 ga]Ud (643 1/d) . The city sells water for use in adjoining oil fields ,which may account for the high per capita use rate .
An analysis of water from well 139-099-05ABC shows that the water i ssoft and a sodium bicarbonate type with 1,050 mg/l dissolved solids . Thewater contained 189 mg/1 sulfate and 4 .2 mg/1 fluoride .
Dickinson
From 1906 to 1945 the city of Dickinson derived its water supply fro mwells tapping the Sentinel Butte aquifer system . The wells, located in secs .3 and 4, T . :139 N., R. 96 W., ranged from 160 to 202 feet (49 to 62 m) i ndepth. The 'wells became uneconomical to pump in 1928, an-1 the wate rcontained fine sediment . Following an engineering firm's recommendations ,new larger diameter wells were drilled, and new pumping and storage facili-ties were installed.
Water consumption had increased in 1937 to approximately 112 Mgal/yr(424,000 m3/yr), and the water level in the aquifer system was 58 feet (18 m )below the 1919 level . Additional wells were drilled, extending the well fieldto the west, but by 1943 demand exceeded the capacity of the wells . About125 Mgal/yr (473,000 m 3/yr) was withdrawn from the well field in 1943 and1944 . McLaughlin and Greenlee (1946, p . 25-27) concluded that it was not
4 1

practicable to augment the supply by drilling additional wells in the existin gwell field . An engineering firm then recommended construction of a tem-porary plant to treat water from the Heart River . A small dam was alread yin existence . The city built the plant on an emergency basis, but the reser-voir was too small for the needs of the city and the shallow water promotedalgae growth . The plant's facilities were also inadequate to produce water ofthe desired quality. The plant was designed to operate only during th esummer to augment the ground-water sources .
City officials then concluded that an improved surface-water supply wa srequired to meet the needs of the city . The U .S . Bureau of Reclamationconstructed Dickinson Dam in 1950 . Edward Arthur Patterson Lake iscapable of storing 6,900 acre-feet (8 .5 hm 3) of water . Test holes drilled b ythe State Water Commission (Schmid, 1963, and Lindvig, 1964) did no tlocate an aquifer capable of supplying the city . Since 1967, the city haspumped essentially all its water from the lake and retains wells for emergenc yuse only .
The city withdrew 1,429 acre-feet (1 .8 hm3) of water from Edward Arthu rPatterson Lake in 1969 for an average daily consumption of 1 .28 Mgal (4,830m3) or about 103 gallons (394 litres) per day per person . Peak daily summerdemand exceeds 4 .6 Mgal (17,400 m 3) .
Mott
The city of Mott obtains water from three wells (133-093-02AAB, 134 -093-35DBD, and 134-093-35DCD) that tap the basal sandstone member o fthe Tongue River Formation . The wells yield 70 to 100 gal/min (4 to 6 1/s) .Average daily pumpage in 1969 ranged from 100,000 to 169,000 gallons (380to 640 m 3 ) . Per capita daily use is about 90 gallons (340 litres). Wate rfrom the Cannonball River is used for nondrinking purposes .
Water samples from the wells contained from 1,200 to 1,230 mg/l dis-solved solids and fluoride concentrations of 4 .9 to 5 .9 mg/1 . The water is soft .
New England
The city of New England has eight wells located in Tps . 135 and 136 N . ,R. 97 W., of which two wells are unused . The wells tap the Sentinel Butteaquifer system and range in depth from 84 to 105 feet (26 to 32 m) . Theyyield 8 to 130 gal/min (0 .5 to 31 1/s) . In 1969 daily pumpage ranged fro m61,200 to 180,000 gallons (231 to 681 m 3 ), and averaged about 100,000 gallon s(380 m 3) . Average daily per capita use was about 91 gallons (344 litres) .
Water from wells 135-097-04ADD1 and 136-097-33DCC contained 975 t o1,290 mg/I dissolved solids, 125 to 268 mg/l hardness, and 0 .6 to 1.1 mg/ 1fluoride . The water was light brown .
42

Regen t
The city of Regent has two wells (134-095-13ACD and 134-095-13CDB)that are reported to be 546 to 900 feet (166 to 275 m) deep . The wells pump35 and 22 gal/min (2 and 1 Us), respectively, from the upper Hell Cree kand lower Cannonball-Ludlow aquifer system . Average daily consumption i n1969 was estimated at 20,000 gallons (76 m 3 ), or about 60 gallons (200 litres )per person . Water is also obtained from the Cannonball River for nondrinkin gpurposes .
The analysis of a water sample from well 134-095-13ACD showed that th ewater was a sodium bicarbonate type . The sample contained about 1,33 0mg/1 dissolved solids and 2 .0 mg/1 fluoride. The water was light brown .
Richardton
The city of Richardton obtains most of its water from a 40-foot (12-m )dug well (139-092-05AAB) with collecting galleries extending laterally intoa lignite bed in the Sentinel Butte Formation, and from a spring (139-092 -04BCB) with multiple openings . When the supply from these sources is no tsufficient, water is obtained from a 640-foot (195-m) drilled well (139-092 -05DBB) . In 1969 the average daily pumpage was about 30,000 gallon s(110 m3) .
The water from well 139-092-05AAB had a dissolved-solids concentrationof 1,380 mg/1 and a hardness of 628 mg/l . Water from the spring contained1,590 mg/1 dissolved solids . The sample from well 139-092-05DBB was softand contained 1,170 mg/1 dissolved solids and 5 .8 mg/1 fluoride . The citytreats the water for iron .
SUMMAR Y
The stratigraphy, total thickness of the geologic formations, and water -yielding properties of the rocks in Hettinger and Stark Counties are sum-marized in the following table . Ground water is obtained from numerousundeveloped aquifer systems in the semiconsolidated rocks of Late Cretaceou sand Tertiary age . Rocks beneath the Fox Hills Formation contain saline wate rthat is unsuitable for most purposes .
The Fox Hills and basal Hell Creek aquifer systems and the lower partof the upper Ludlow and Tongue River aquifer system are important aquiferswithin the study area . They consist of fine- to medium-grained sandston einterbedded with siltstone and claystone and are relatively unused . Water inthese aquifer systems contains moderate amounts of dissolved solids and is asodium bicarbonate type .
43

The upper Hell Creek and lower Cannonball-Ludlow aquifer system isrelatively unused . The water contains moderate amounts of dissolved solid sand is of a sodium bicarbonate type .
Many livestock and domestic wells tap the Sentinel Butte aquifer syste mand derive water from beds of sandstone and fractured lignite . Municipalwells tapping the aquifer have yielded more than 100 gal/min (6 1/s) . Mostwater samples contain moderate amounts of dissolved solids and are a sodiu msulfate type .
The Golden Valley and White River aquifer systems and aquifers i ndeposits of Quaternary age are relatively minor sources of ground water . Nowater can be expected from wells tapping the Arikaree Formation .
44

Summary of geologic and hydrologic properties of major aquifers and chemical properties of ground water, Hettinger and Stark Counties
System FormationThickness(feet) Lithology Aquifer system Water-yielding properties General water q~
Quaternary 0-278 Till, clay, silt, sand, and gravel . Aquifers in Sand and gravel deposits gen- Water
type
i highly
variable .deposits ofQuaternaryage.
erally too thin to be of importance ,but locally may yield large quan -titles of water to wells .
Dissolved solids 1,850 to 2,130 mg/Ifrom four samples .
Arikaree 0-65 Crossbedded tufiaceous sandstone . Does not yield water to wells.FormationWhite 0-250 Conglomerate, siltstone, arkose, White River Yields several gallons per minute Sodium type water with low d4 -River tuffaceous sandstone, and fresh- of water to shallow wells . solved solids.Formation water limestone .Golden 0-200 Lower member consists of shale Golden Valley Yields several gallons per minute Calcium or sodium sulfate type
Tertiary Valley and sandy claystone; upper member of water to shallow wells . water with moderate dissolvedFormation of tan crossbedded sandstone, clay- solids .
stone, and thin lignite beds.Sentinel 0-450 Silty fine- to medium-grained sand- Sentinel Butte Yields as much as 100 gal/min Most water is a sodium sulfat eButte stone, carbonaceous and bentonitic to wells. type .
Dissolved solids 378 t oFormation claystone,
and
lignite.
Thick 11,700 mg/I and have a median valuesandstone beds at base . of 1,060.
Tongue 250-570 Sandstone interbedded with clay- Upper Basal sandstone should yield 1 to Water
from
basal
sandston eRiver stone, siltstone, carbonaceous shale, Ludlow and 100 gal/min to wells . Transmissiv- generally is a sodium bicarbonateFormation and lignite . Widespread sandstone Tongue River ity of basal sandstone ranges from type .
Dissolved solids 704 t obed at base. 70 Rs/d to 530 R s/d. 1,470 mg/l.
Ludlow and 310-850 Ludlow Formation; fine-grainedCannonball sandstone, siltstone, carbonaceousFormations claystone, and lignite of continenta l
Hell 220-510
origin.Cannonball Formation : gray clay -stone, siltstone, and fine-grainedsandstone of marine origin .These
formations
interfinge rbeneath the area.Fine- to medium-grained sandstone,
Upper HellCreek andlowe rCannonball-Ludlow
Yields as much as 100 gal/minto wells.
Sodium bicarbonate type water .Dissolved solids 1,450 to 1,890 mg/I .
Creek sikstone, carbonaceous and bento -Cretaceous Formation nitic claystone, and shale . Fox Hills and Yields 25 to 75 gal/min to wells . Sodium bicarbonate type water ._
Fox Hills 235-415 Fine- to medium-grained sandstone, basal Hell Transmissivity ranges from 110 Dissolved solids 1,310 to 1,540 mg/I .Formation siltstone, and claystone. Creek Rs/d to 390 Rs/d .
Cretaceous- 9,000-12,000 Shale, sandstone, limestone, and Data not available Saline .Cambrian evsporites .

SELECTED REFERENCE S
Alger, R. P., 1966, Interpretation of electric logs in fresh-water wells inunconsolidated formations : Society of Prof. Well Log Analysts Trans ., 7thAnn. Logging Symposium, sec . CC, p . 125 .
Abbott, G . A., and Voedisch, F. W., 1938, The municipal ground-wate rsupplies of North Dakota : North Dakota Geol . Survey Bull . 11, 99 p .
Alden, W. C., 1932, Physiography and glacial geology of eastern Montan aand adjacent areas : U.S . Geol . Survey Prof. Paper 174, 133 p .
Anderson, S . B., 1966, A look at the petroleum potential of southwesternNorth Dakota : North Dakota Geol . Survey Rept . Inv. no. 42 .
Benson, W. E., 1951, Geologic map of North Dakota southwest of MissouriRiver : U.S . Geol . Survey, 1951 .
- 1952, Structure contour map of the Knife River area, North Dakota ;U .S. Geol . Survey, 1951.
Brant, R. A., 1953, Lignite resources of North Dakota: U.S. Geol . SurveyCirc . 226, 78 p .
Brown, R. W., 1948, Correlation of the Sentinel Butte shale in westernNorth Dakota : Am. Assoc. Petroleum Geologists Bull., v. 32, no. 7, p .1265-1274.
- 1952, Tertiary strata in eastern Montana and western North and Sout hDakota, in Billings Geol . Soc . Guidebook, 3d Ann . Field Conf., Sept. ,1952, p . 89-92 .
Caldwell, J . W., 1954, Surface structure of western Stark County and adjacen tareas of North Dakota : North Dakota Geol. Survey Rept . Inv., no. 14, 1sheet.
Carlson, C. G ., 1973, The geology of Mercer and Oliver Counties NorthDakota: North Dakota Geol . Survey Bull . 56, pt. I, and North Dakot aState Water Comm . County Ground Water Studies 15, pt . I, 72 p .
Clapp, C . H., Babcock, E . J ., and Leonard, A. G., 1906, North Dakota clays :North Dakota Geol . Survey 4th Biennial Rept ., 324 p .
Colton, R . B., Lemke, R. W ., and Lindvall, R . M., 1963, Preliminaryglacial map of North Dakota : U.S . Geol . Survey Misc . Geol . Inv. Map1-331 .
Croft, M . G., 1970, Ground water basic data, Mercer and Oliver Counties ,North Dakota : North Dakota Geol . Survey Bull . 56, pt. II, and Nort hDakota State Water Comm. County Ground Water Studies 15, pt . II ,268 p .
- 1971, A method of calculating permeability from electric logs : U.S . Geol .Survey Prof. Paper 750-B, p . B265-B269 .
- 1973, Ground water resources, Mercer and Oliver Counties ; NorthDakota Geol . Survey Bull. 56, pt. III, and North Dakota State Wate rComm. County Ground Water Studies 15, pt . III, 81 p .
46

Croft, M . G, and Wesolowski, E . A., 1970, Transmissivity and storag ecoefficient of aquifers in the Fox Hills Sandstone and the Hell Cree kFormation, Mercer and Oliver Counties, North Dakota : U .S . Geol . SurveyProf. Paper 700-B, p . B190-B195 .
Denson, N . M., and Gill, J .R., 1965, Uranium-bearing lignite and carbona-ceous shale in the southwestern part of the Williston basin — a regiona lstudy: U.S . Geol . Survey Prof. Paper 463, 75 p .
Durfor, C . N., and Becker, Edith, 1964, Public water supplies of the 100largest cities in the United States, 1962 : U .S . Geol . Survey Water-SupplyPaper 1812, 364 p .
Federal Water Pollution Control Administration, 1972, Report of the commit-tee on water-quality criteria : Washington, U.S. Govt . Printing Office ,234 p .
Frye, C. I ., 1.969, Stratigraphy of the Hell Creek Formation in North Dakota :North Dakota Geol . Survey Bull . 54, 65 p .
Ground Water Subgroup of Water Work Group, Northern Great Plain sResource Program (1974), Ground water in selected areas in the FortUnion coal region : U.S. Geol . Survey open-file report 74-371 .
Hansen, Miller, 1953, Geologic report on limestone deposits in Stark Countyand Hettinger County, North Dakota: North Dakota Geol . Survey Rept .Inv., no. 8, 33 p .
Hem, J . D., 1970, Study and interpretation of the chemical characteristic sof natural water: U.S. Geol . Survey Water-Supply Paper 1473, 2nd ed . ,363 p .
Hennen, R. V., 1943, Tertiary geology and oil and gas prospects in Dakot aBasin of North Dakota: Am. Assoc . Petroleum Geologists Bull., v . 27, no .12, p . 1567-1594 .
Holland, F . D., Jr ., 1957, Guidebook for geologic field trip in the Dickinso narea, North Dakota : North Dakota Geol . Survey Misc . Ser . no. 5, 18 p .
Johnson, A. I ., 1963, Application of laboratory permeability data: U.S. Geol .Survey open-file report, 33 p .
Kuznetsov, S . I ., Ivanov, M . V., and Lyalikova, N. N ., 1963, Introductionto geological microbiology : New York, McGraw-Hill Book Company, Inc . ,252 p .
Leonard, A. G ., 1911, The Cretaceous and Tertiary Formations of westernNorth Dakota and eastern Montana : Jour . of Geology, v. 19, p . 507-547 .
Leonard, A . G., Babcock, E . J ., and Dove, L. P., 1925, The lignite deposit sof North Dakota: North Dakota Geol . Survey Bull . no. 4, 240 p .
Lindvig, M. O., 1964, City of Dickinson aquifer test . Supplement to NorthDakota Ground Water Studies no . 51: North Dakota State Water Comm .open-file report, 9 p.
Lloyd, E . R., 1914, The Cannonball River lignite field, Morton, Adams, an dHettinger Counties, North Dakota : U . S . Geol . Survey Bull . 541, p . 243-291 .
47

Lloyd, E . R., and Hares, C. J ., 1915, The Cannonball marine member of th eLance Formation of North and South Dakota and its bearing on the Lance -Laramie problem : Jour . Geology, v . XXIII, no . 6, p . 523-547 .
McKelvey, J . G., and Milne, I . H., 1962, The flow of salt solutions throughcompacted clays : Clays and Clay Minerals, New York, Pergamon Press ,p . 248-249 .
McLaughlin, T . G ., and Greenlee, A . L., 1946, Ground water at Dickinson ,North Dakota: North Dakota State Water Comm . Ground Water Studie sno. 3, 31 p .
Meyer, R . R., 1963, A chart relating well diameter, specific capacity, an dcoefficients of transmissibility and storage, in Bentall, Ray, and others ,Methods of determining permeability, transmissibility, and drawdown :U.S. Geol . Survey Water-Supply Paper 1536-I, p . 338-340 .
Murray, C. R., 1968, Estimated use of water in the United States, 1965 :U.S . Geol . Survey Circ . 556, 53 p .
North Dakota Geological Society, 1954, Stratigraphy of the Williston basin :70 p .
North Dakota State University, 1968, North Dakota crop and livestock sta-tistics, annual summary for 1967, revisions for 1966 . Ag. Statistics, no . 18,76 p .
Pollard, B . C ., Smith, J . B ., and Knox, C . C ., 1972, Strippable lignitereserves of North Dakota: U.S. Bur . Mines Circ . 8537, 37 p .
Powell, J . E ., and Paulson, Q. F., 1961, Geology and ground-water resource sof the Richardton area, Stark County North Dakota: North DakotaState Water Comm . Ground Water Studies no . 29, 40 p .
Royse, C . F., Jr., 1967, The Tongue River-Sentinel Butte contact : NorthDakota Geol . Survey Rept . Inv . no. 45, 53 p .
Sandoval, F . M., Bond, J . J ., Power, J . F., and Willis, W . O., 1973, Lignitemine spoils in the Northern Great Plains — Characteristics and potentia lfor reclamation, in Wali, M . K., ed ., Some environmental aspects of stripmining in North Dakota: North Dakota Geol . Survey Educ. Ser. 5, p .1-24 .
Schmid, R . W., 1963, Ground water in the vicinity of Dickinson, Star kCounty, North Dakota: North Dakota State Water Comm . Ground Wate rStudies no . 51, 34 p .
Simpson, H . E., 1929, Geology and ground-water resources of North Dakota ,with a discussion of the chemical character of the water by H . B. Riffen-burg: U.S. Geol . Survey Water-Supply Paper 598, 312 p .
Theis, C . V., Brown, R . H., and Meyer, R . R., 1963, Estimating the trans-missibility of aquifers from the specific capacities of wells, in Bentall ,Ray, and others, Methods of determining permeability, transmissibility ,and drawdown : U.S. Geol . Survey Water-Supply Paper 1536-I, p . 331-341 .
48

Trapp, Henry, Jr., 1971, Ground water basic data, Hettinger and StarkCounties, North Dakota : North Dakota State Water Comm . CountyGround Water Studies 15, pt . II, 455 p .
Tychsen, P. C ., 1950, Geology and ground-water hydrology of the HeartRiver irrigation project and the Dickinson area, North Dakota, with asection on the mineral quality of waters of the Heart River Project b yH. A. Swenson : U .S . Geol. Survey Circ . 34, 59 p .
U .S . Dept . of Agriculture, 1955, Water : The Yearbook of Agriculture, 751 p .U.S. Dept . of Agriculture, Soil Conservation Service, 1968, Soil survey of
Stark County, North Dakota.U.S. Public Health Service, 1962, Drinking water standards, 1962 : U.S .
Public Health Service Pub . 956, 61 p .U.S. Salinity Laboratory Staff, 1954, Diagnosis and improvement of salin e
and alkali soils : U .S . Dept . Agriculture Handb. no. 60, 160 p .
49

GLOSSARY OF SELECTED TERM S
Aquifer – a formation, group of formations, or part of a formation that con-tains sufficient saturated permeable material to yield significant quantitie sof water to wells and springs .
Aquifer system – a series of interconnected permeable water-bearing rocks .Area of influence – the area underlain by the cone of depression caused by a
discharging well .Artesian – artesian is synonymous with confined . Artesian water and
artesian water body are equivalent, respectively, to confined ground wate rand confined water body. An artesian well obtains its water from a nartesian or confined water body . The water level in an artesian well stand sabove the top of the artesian water body it taps . If pressure within theaquifer is sufficiently great, water may flow from the well at land surface .
Cone of depression – the conical low produced in a water table or potentio-metric surface by a discharging well .
Confined – as used in this report the term confined refers to an aquifer i nwhich the water is under artesian pressure . See artesian .
Drawdown – decline of the water level in a well or aquifer caused by pump-ing or artesian flow .
Ground water – water in the zone of saturation .Hydraulic conductivity – the capacity of a rock to transmit water — usuall y
described as the rate of flow in cubic feet per day through 1 square footof the aquifer under unit hydraulic gradient, at existing kinematic viscosity .
Hydraulic gradient – the change in head per unit of distance in a give ndirection .
Infiltration – the movement of water from the land surface into soil or rock .Inflow – movement of ground water into an area in response to the hydrauli c
gradient .Percolation – movement of water through the interstices of a rock or soil .Potentiometric surface – as related to an aquifer, it is defined by th e
levels to which water will rise in tightly cased wells . The potentiometricsurface is reported in feet above mean sea level .
Recharge – the addition of water to the zone of saturation .Sodium-adsorption ratio (SAR) – the sodium-adsorption ratio of water i s
defined as :
SAR = (Na+)/(Ca+2) + (Mg +2)
2
50

Ion concentrations are expressed in milliequivalents per liter . Experi-ments cited by the U .S . Department of Agriculture Salinity Laborator y(1954) show that SAR predicts reasonably well the degree to which irriga-tion water tends to enter into cation-exchange reactions in soil . Waterhaving a high SAR can damage soil structure of some soils .
Specific capacity – the rate of discharge of water from a well divided by thedrawdown of the water level within the well .
Specific conductance – electrical conductance, or conductivity, is the abilit yof a substance to conduct an electric current . The electrical conductivityof water is related to the concentration of ions in the water . Distilledwater normally will have a conductance of about 1 .0 micromhos percentimetre, whereas sea water may have a conductance of about 50,000micromhos per centimetre. Standard laboratory measurements report theconductivity of water in micromhos per centimetre at 25° Celsius .
Storage coefficient – the volume of water an aquifer releases or takes intostorage per unit surface area of the aquifer per unit change in head .
Surface runoff – that part of the runoff which travels over the soil surface .Transmissivity – the rate at which water of the prevailing kinematic vis-
cosity is transmitted through a unit width of the aquifer under a uni thydraulic gradient . It is equal to an integration of the hydraulic conduc-tivities across the saturated part of the aquifer perpendicular to the flo wpaths .
Unconfined -- as used in this report the term unconfined refers to an aquiferin which the water is under atmospheric pressure . See water table .
Underflow – the downstream movement of ground water through the per-meable deposits beneath a stream .
Water table – surface in an unconfined water body at which the pressure i satmospheric . Defined by the levels at which water stands in wells thatpenetrate the water body far enough to hold standing water .
Zone, saturated – that part of the water-bearing material in which all voids ,large and small, are ideally filled with water under pressure greater than
atmospheric .
51